Published: April 12, 2011 r2011 American Chemical Society 5204 dx.doi.org/10.1021/jf104930z | J. Agric. Food Chem. 2011, 59, 5204–5214 ARTICLE pubs.acs.org/JAFC GC-Based Analysis of Plant Stanyl Fatty Acid Esters in Enriched Foods Andreas Barnsteiner, † Tim Lubinus, † Angelica di Gianvito, † Wolfgang Schmid, ‡ and Karl-Heinz Engel* ,† † Lehrstuhl f€ ur Allgemeine Lebensmitteltechnologie, Technische Universit € at M€ unchen, Maximus-von-Imhof-Forum 2, D-85350 Freising-Weihenstephan, Germany ‡ Bayerisches Landesamt f€ ur Gesundheit und Lebensmittelsicherheit, Veterin€ arstrasse 2, D-85764 Oberschleissheim, Germany ABSTRACT: Approaches for the capillary gas chromatographic (GC) based analysis of intact plant stanyl esters in enriched foods were developed. Reference compounds were synthesized by enzyme-catalyzed transesterifications. Their identities were confirmed by means of mass spectrometry. Using a medium polar trifluoropropylmethyl polysiloxane stationary phase, long-chain plant stanyl esters could be separated according to their stanol moieties and their fatty acid chains. Thermal degradation during GC analysis was compensated by determining response factors; calibrations were performed for ten individual plant stanyl esters. For the analysis of low-fat products (skimmed milk drinking yogurts), the GC separation was combined with a “fast extraction” under acidic conditions. For fat-based foods (margarines), online coupled LCGC offered an elegant and efficient way to avoid time-consuming sample preparation steps. The robust and rapid methods allow conclusions on both, the stanol profiles and the fatty acid moieties, and thus provide a basis for the authentication of this type of functional food ingredients. KEYWORDS: online LCGC analysis, plant stanyl fatty acid ester, enriched food ’ INTRODUCTION Increased blood cholesterol level is a risk factor for coronary heart disease. Dietary intake of plant sterols and stanols is re- commended as a method to reduce low density lipoprotein (LDL) cholesterol. Owing to the inhibition of intestinal cholesterol absorption and other effects on hepatic/intestinal cholesterol metabolism, a reduction in plasma cholesterol concentrations of 1015% can be achieved by an intake of approximately 2 g of plant sterols/stanols per day. 1,2 Steryl and stanyl esters have also been shown to be effective in reducing total and LDL cholesterol. 3,4 Therefore, for technological reasons in many types of products the fatty acid esters rather than the free sterols/stanols are added. 4 The first foods placed on the EU market were yellow fat spreads with added phytosteryl esters. 4,5 In the meantime, many types of food categories enriched with plant steryl and stanyl esters have been approved. 6 The concentrations of plant sterols in enriched products vary from 0.3% in milk type products up to 8% in spreads. 6 Vegetable oils as well as tall oil are used as starting materials to obtain sterols and stanols; edible oils are also used as sources to provide the fatty acid moieties employed to produce the respective esters. 7 Accordingly, enriched products are speci- fied regarding their sterol/stanol profiles and the esterified fatty acids, respectively. 5,8,9 There is a need for quantitative and qualitative methods allowing the authentication of these foods. At present, there are official methods for the analysis of plant sterols/stanols 1012 but not for their intact esters in enriched foods. Approaches allowing the direct quantification of the intact esters are desirable; the chromatographic resolution of the esters should allow conclusions on both the sterol/stanol profile and the fatty acid source. This is of particular importance, as it has been reported that the rate of the intestinal ester hydrolysis, for example by pancreatic cholesterol esterase, depends on the structures of both the sterol and the fatty acid moieties, 13 and, therefore, the composition of the employed ester preparation may have an impact on the cholesterol-lowering effect. 14 To date, analytical approaches for the determination of plant sterols or fatty acid steryl esters in foods are based on the isolation, for example by thin layer or silica gel chromatography, and the subsequent application of gas chromatography (GC) or high- performance liquid chromatography (HPLC). Regarding sensi- tivity and precision, gas chromatography is considered as the method of choice for the determination of total sterol content. 1518 Therefore, steryl esters are commonly subjected to alkaline hydrolysis and the liberated sterols are analyzed by GC either in free or silylated form. However, in this way information regarding the fatty acid composition of the steryl esters is lost. The analysis of intact steryl esters in foods was achieved by means of GC or reversed-phase HPLC. The HPLC analysis required a mass spectrometry (MS) detector for the identifica- tion of incompletely separated as well as coeluted steryl esters and neutral lipids. 19 GC may be a considerably more sensitive analytical procedure for the investigation of intact steryl esters than HPLC, 20,21 but the GC-based analysis of individual steryl esters by GC is still a challenging problem. 22 For example, the degree of unsaturation of C18 fatty acid esters could not be distinguished with nonpolar stationary phases. 20,22,23 The use of a more polar stationary phase (50% phenyl50% methyl poly- siloxane) also resulted in insufficient resolution of a complex mixture of steryl esters regarding their degree of saturation. 21,24 In addition, the high boiling plant steryl esters may be subject to individually differing thermal degradation processes during the GC analysis. 2527 Another challenge encountered in particular with foods exhibit- ing higher fat contents is the need for extensive workup proce- dures in order to remove di- and triglycerides that may hamper the direct GC analysis of phytosteryl esters. The online coupling Received: December 23, 2010 Accepted: April 12, 2011 Revised: March 18, 2011
Transcript
Published: April 12, 2011
r 2011 American Chemical Society 5204 dx.doi.org/10.1021/jf104930z | J. Agric. Food Chem. 2011, 59, 5204–5214
ARTICLE
pubs.acs.org/JAFC
GC-Based Analysis of Plant Stanyl Fatty Acid Esters in Enriched FoodsAndreas Barnsteiner,† Tim Lubinus,† Angelica di Gianvito,† Wolfgang Schmid,‡ and Karl-Heinz Engel*,†
ABSTRACT: Approaches for the capillary gas chromatographic (GC) based analysis of intact plant stanyl esters in enriched foodswere developed. Reference compounds were synthesized by enzyme-catalyzed transesterifications. Their identities were confirmedby means of mass spectrometry. Using a medium polar trifluoropropylmethyl polysiloxane stationary phase, long-chain plant stanylesters could be separated according to their stanol moieties and their fatty acid chains. Thermal degradation during GC analysis wascompensated by determining response factors; calibrations were performed for ten individual plant stanyl esters. For the analysis oflow-fat products (skimmedmilk drinking yogurts), the GC separation was combined with a “fast extraction” under acidic conditions.For fat-based foods (margarines), online coupled LC�GC offered an elegant and efficient way to avoid time-consuming samplepreparation steps. The robust and rapid methods allow conclusions on both, the stanol profiles and the fatty acid moieties, and thusprovide a basis for the authentication of this type of functional food ingredients.
Increased blood cholesterol level is a risk factor for coronaryheart disease. Dietary intake of plant sterols and stanols is re-commended as a method to reduce low density lipoprotein (LDL)cholesterol. Owing to the inhibition of intestinal cholesterolabsorption and other effects on hepatic/intestinal cholesterolmetabolism, a reduction in plasma cholesterol concentrations of10�15% can be achieved by an intake of approximately 2 g ofplant sterols/stanols per day.1,2 Steryl and stanyl esters have alsobeen shown to be effective in reducing total and LDL cholesterol.3,4
Therefore, for technological reasons in many types of productsthe fatty acid esters rather than the free sterols/stanols are added.4
The first foods placed on the EU market were yellow fat spreadswith added phytosteryl esters.4,5 In the meantime, many types offood categories enriched with plant steryl and stanyl esters havebeen approved.6 The concentrations of plant sterols in enrichedproducts vary from 0.3% in milk type products up to 8% inspreads.6 Vegetable oils as well as tall oil are used as startingmaterials to obtain sterols and stanols; edible oils are also used assources to provide the fatty acid moieties employed to producethe respective esters.7 Accordingly, enriched products are speci-fied regarding their sterol/stanol profiles and the esterified fattyacids, respectively.5,8,9 There is a need for quantitative andqualitative methods allowing the authentication of these foods.At present, there are official methods for the analysis of plantsterols/stanols10�12 but not for their intact esters in enrichedfoods. Approaches allowing the direct quantification of the intactesters are desirable; the chromatographic resolution of the estersshould allow conclusions on both the sterol/stanol profile andthe fatty acid source. This is of particular importance, as it hasbeen reported that the rate of the intestinal ester hydrolysis, forexample by pancreatic cholesterol esterase, depends on thestructures of both the sterol and the fatty acid moieties,13 and,therefore, the composition of the employed ester preparationmay have an impact on the cholesterol-lowering effect.14
To date, analytical approaches for the determination of plantsterols or fatty acid steryl esters in foods are based on the isolation,for example by thin layer or silica gel chromatography, and thesubsequent application of gas chromatography (GC) or high-performance liquid chromatography (HPLC). Regarding sensi-tivity and precision, gas chromatography is considered as themethod of choice for the determination of total sterol content.15�18
Therefore, steryl esters are commonly subjected to alkalinehydrolysis and the liberated sterols are analyzed by GC either infree or silylated form. However, in this way information regardingthe fatty acid composition of the steryl esters is lost.
The analysis of intact steryl esters in foods was achieved bymeans of GC or reversed-phase HPLC. The HPLC analysisrequired a mass spectrometry (MS) detector for the identifica-tion of incompletely separated as well as coeluted steryl estersand neutral lipids.19 GC may be a considerably more sensitiveanalytical procedure for the investigation of intact steryl estersthan HPLC,20,21 but the GC-based analysis of individual sterylesters by GC is still a challenging problem.22 For example, thedegree of unsaturation of C18 fatty acid esters could not bedistinguished with nonpolar stationary phases.20,22,23 The use ofa more polar stationary phase (50% phenyl�50% methyl poly-siloxane) also resulted in insufficient resolution of a complexmixture of steryl esters regarding their degree of saturation.21,24
In addition, the high boiling plant steryl esters may be subject toindividually differing thermal degradation processes during theGC analysis.25�27
Another challenge encountered in particular with foods exhibit-ing higher fat contents is the need for extensive workup proce-dures in order to remove di- and triglycerides that may hamperthe direct GC analysis of phytosteryl esters. The online coupling
Received: December 23, 2010Accepted: April 12, 2011Revised: March 18, 2011
Journal of Agricultural and Food Chemistry ARTICLE
of LC and GC can offer an efficient alternative to the laboriousstandard approaches.23,28
The objective of the present study was the development ofGC-based methods allowing the rapid quantification of intactplant stanyl esters in enriched foods. Using skimmed milk drinkingyogurt as example for a low-fat food, a fast method for extractionand separation of phytosteryl esters should be elaborated. Margar-ines were chosen as examples to demonstrate the usefulness ofonline LC�GC as an efficient approach for the analysis of plantstanyl esters added to fat-based products.
’MATERIALS AND METHODS
Chemicals. Cholesteryl palmitate (g98%), fatty acid methyl esters(16:0, 16:1, 18:0, 18:1, 18:2, 18:3, 20:0, 22:0 and 22:1; analytical grades),pyridine (puriss), bis(trimethylsilyl)-trifluoroacetamide (BSTFA)þ tri-methylchlorosilane (TMCS), 99:1, Candida rugosa type VII lipase (L1754)and lipase B from Candida antarctica (L-4777) were obtained fromSigma-Aldrich (Taufkirchen, Germany). Calcium chloride anhydrousand hydrochloric acid (25%) were purchased from Riedel de Ha€en(Taufkirchen, Germany). Sodium sulfate anhydrous and sodiummethy-late (5.4M inmethanol) were obtained fromFluka (Taufkirchen,Germany).n-Hexane (SupraSolv) was purchased from VWR International (Darmstadt,Germany). tert-Butyl methyl ether (MTBE, DiveronS) was suppliedfrom Oxeno Olefinchemie (Marl, Germany) and was distilled prior to use.Materials. A mixture of plant stanyl fatty acid esters (plant stanol
ester, STAEST-115) was kindly provided by Raisio Group (Raisio,Finland). A mixture of plant stanols (Reducol stanol powder) was a giftfrom Cognis GmbH (Illertissen, Germany); it consisted of sitostanol(91.2%) and campestanol (8.2%).
Skimmed milk drinking yogurts enriched with plant stanyl esters(Emmi Benecol; produced by Emmi, Switzerland; distributed inGermany by Emmi Deutschland GmbH, Essen) were purchased in localsupermarkets (Freising, Germany). Two types of products were selected:taste “orange” (drinking yogurt 1) and “strawberry” (drinking yogurt 2).The labels indicated “added plant stanol esters”. In the list of ingredientsthe following information was included: “plant stanol 3.0 % and fat(without stanol) 2.1 %”. The fat (without stanol) was declared as “saturated(0.2%),monounsaturated (1.4%) andpolyunsaturated fatty acids (0.6%)”.
Margarines enriched in plant stanyl esters were obtained fromFinland andTheNetherlands. TheBenecolmargarines fromFinland (taste-type “Kevyt kasvirasvalevite 32%” (margarine 1), “Kevyt kasvirasvaleviteOliivi 32 %” (margarine 2), and “Laktoositon kasvirasvalevite 32 %”(margarine 3), were produced by Ravintoraisio Oy (Raisio, Finland).The plant stanol content was labeled as 8 wt %, total lipids as 32 wt %. Asemulsifier soy lecithin was declared. In the case of margarine 2, the oliveoil content was declared as 9% of total fat. The Benecol margarines fromThe Netherlands were produced by McNeill Nutritionals Ltd. (Bracknell,U.K.); the taste-type investigated was “MetOlijfolie” (margarine 4). Thelist of ingredients included the following information: plant stanol 0.8 g/12 g portion, according to 7 wt %, 55 wt % lipids. The olive oil contentwas declared as 14% of total fat content. As emulsifiers, soy lecithin andmono- and diglycerides were labeled.Lipase-Catalyzed Preparation of Stanyl Esters. For plant stanol
ester synthesis, fatty acid methyl esters (300 μmol) were transesterifiedwith the Reducol stanol powder (300 μmol) in the presence of 50 mg ofC. rugosa lipase (VII) and 500 μL of n-hexane by shaking a screw-cappedtube at 40 �C for 72 h. For the synthesis of the behenates and erucates,C. antarctica lipase B was used as biocatalyst.Capillary Gas Chromatography (GC/FID). Gas chromatographic
analysis of stanyl fatty acid esters was performed on anAgilentTechnologiesinstrument 6890N (B€oblingen, Germany) equippedwith a flame ionizationdetector (FID). Separations of 1 μL of the sample were carried out on a30 m � 0.25 mm i.d. fused-silica capillary coated with a film of 0.1 μm
trifluoropropylmethyl polysiloxane (Rtx-200MS, Restek, Bad Homburg,Germany). The temperature of the inlet was set to 280 �C, the detectortemperature to 360 �C. Hydrogen was used as carrier gas with theconstant flow rate 1.5 mL/min. Split flow was set to 11.2 mL/min,resulting in a split ratio of 1:7.5. Nitrogen was used as makeup gas with aflow of 25 mL/min. The temperature program was 100 �C (2 min),programmed with 15 �C/min up to 310 �C (2min), then 1.5 �C/min upto 340 �C (3 min). Data acquisition was performed by ChemStationsoftware.CapillaryGasChromatography�MassSpectrometry (GC/MS).
Identification of the stanyl esters was performed on a Finnigan TraceGCultra (Thermo Electron Corp., Austin, TX) equipped with a FinniganTrace DSQ mass spectrometer (Thermo Electron Corp., Austin, TX).Mass spectra were obtained by electron impact ionization (EI) at 70 eVin the full scan mode at unit resolution from 40 to 750 Da (scan time0.4 s). Helium was used with the constant flow rate 1 mL/min. Theinterface was heated to 320 �C, the source to 250 �C. The residualconditions were as described for GC/FID analysis of stanyl esters.Transesterification of the Stanyl Ester Mixture. The stanyl
ester mixture (STEAST-115; 0.5 mg), n-hexane (500 μL) and 20 μL of asodiummethylate solution in methanol (2M) were placed into a 1.5 mLvial. After 60 min at room temperature in the dark, calcium chlorideanhydrous was added. The dried n-hexane phase containing the fattyacid methyl esters (FAME) was analyzed by GC/FID, performed on aFocus GC (Thermo Electron Corp., Austin, TX) equipped with a flameionization detector (FID; 320 �C) using a DB-1, 60 m � 0.32 mm i.d.fused silica capillary coated with a 0.25 μm film of polydimethylsiloxane(J&W Scientific, Folsom, CA). Hydrogen was used as the carrier gas(flow = 1.8 mL/min). Split injection (split flow = 27 mL/min) wasperformed at 250 �C. The column temperature was programmed from100 to 320 �C (25 min hold) at 4 �C/min. Identification was performedby comparing the retention times to those of a reference FAMEmixture.Extraction of Drinking Yogurts According to Weibull�
Stoldt. About 20 g of the shaken yogurt drink sample was weighed intoa beaker with an accuracy of(1mg. After addition of 3 mL of an internalstandard solution [50 mg of cholesteryl palmitate/mL], hydrochloricacid (100 mL; 25%) and 80 mL of aqua dest. were added. The digestionwas performed by gentle boiling of the solution for 45 min. Hot distilledwater (200 mL) was added, and the solution was filtrated through amoistened folded filter. The filter was washed with hot distilled wateruntil the filtrate exhibited a neutral pH. After drying (2 h at 103( 2 �C),the filter was placed into an extraction thimble. The extraction wasperformed in a Soxhlet apparatus with MTBE (180 mL) for 3 h. Solventwas removed by rotary evaporation, and the residue was dried to constantmass at 103( 2 �C. Solutions of the lipid residue, 10 mg/mL in n-hexane/MTBE (3:2, v/v), were diluted 1:20 and subjected to GC analysis.Hydrolysis of Weibull�Stoldt Extracts. In an 11 mL screw
capped vial the lipid extracts (0.3 mg) were diluted in 300 μL ofn-hexane/MTBE (3:2, v/v) and 500 μL of sodium methylate solution (5.4M). The solutions were flushed with argon, sealed, heated until boilingand then cooled to room temperature. After 30 min at room tempera-ture, the solutions were heated again until boiling and cooled off. MTBE(0.5 mL) and 4mLof hydrochloric acid (0.7M)were added. After vigorousshaking, the organic phase was separated. The extraction with 0.5 mL ofMTBE was repeated twice. The combined extracts were dried withanhydrous sodium sulfate. The supernatant was transferred into anothervial and evaporated to dryness by a gentle stream of nitrogen. Theresidue was redissolved in 20 μL of dry pyridine and 100μL of BSTFAþ1%TMCS. The sealed vial was allowed to stand for 20min at 70 �C in anoil bath. n-Hexane/MTBE (3:2, v/v; 380 μL) was added. The solutionwas analyzed by GC/FID.“Fast Extraction Method”. The internal standard cholesteryl palmi-
tate (750 μg), the yogurt drink sample (100 mg, accuracy of (0.1 mg),hydrochloric acid (25%; 1000 μL) and bidistilled water (400 μL) were
Journal of Agricultural and Food Chemistry ARTICLE
placed into a reaction vial. After adding a magnetic stir bar, the sealedvials were sonicated until the internal standard was dispersed. The digestionwas performed at 130 �C for 45 min. After cooling to room temperature,1 mL of bidistilled water was added. The solution was filtrated through a5 mL syringe assembled with a 0.45 μmmembrane filter. The vials werewashed three times with 5mL of bidistilled water; the filters were washeduntil the solution reached a neutral pH value. The lipids were extractedthree times with 5 mL of n-hexane/MTBE (3:2, v/v); vial and filter werealso rinsed with the solvent. The combined extracts were dried withsodium sulfate (anhydrous) and subjected to GC analysis.GC/FID-Calibration for the Quantification of Stanyl Esters.
The five-point calibration functions were generated in the range 0.1�0.5μg of total stanyl ester per injection (1μL injection volume). To 150μL,300 μL, 450 μL, 600 μL and 750 μL, respectively, of each stock solution(10mg/mL in n-hexane/MTBE (3:2, v/v)) 300μLof the internal standard(IS) solution (cholesteryl palmitate [2.5 mg/mL] in n-hexane/MTBE(3:2, v/v)) was added. Solvents were evaporated by a gentle stream ofnitrogen; further workup was as described for the sample preparation ofyogurt drinks. Each calibration point was done in triplicate. Linear regres-sion analysis was performed in coordinate ratios of areas (individual stanylester/IS) and amounts (individual stanyl ester/IS).Quantification of Stanols after Hydrolysis byMeans of GC/
FID. Three-point calibration functions were generated with the plantstanols of the Reducol powder in the range 0.05�0.5 μg of total sterolsper 1 μL injection volume. Cholesteryl palmitate (0.1 mg) and 0.1, 0.5,and 1.0 mg of stanol powder were diluted in 300 μL of n-hexane/MTBE(3:2, v/v) and prepared as described for the hydrolysis of the Weibull�Stoldt extracts. Each calibration point was done in triplicate. Linearregression analysis was performed in coordinate ratios of areas (plantstanol/cholesterol) and amounts (plant stanol/cholesterol).Sample Preparation of Margarines.Margarine samples (20�40
mg, accuracy of(0.1 mg) were weighed into a vessel; internal standardsolution (300 μL, 2.5 mg/mL cholesteryl palmitate in n-hexane/MTBE(3:2, v/v)), 5 mL of n-hexane/MTBE (3:2, v/v) and sodium sulfate(anhydrous) were added and sonicated for 1 min. The solution was filteredthrough a 0.45 μmmembrane filter assembled with a 5 mL syringe. Thevessel and the filter were washed twice with 5 mL of hexane/MTBE(3:2, v/v). After dilution (1:40) of the combined extracts, the solutionwas used for online LC�GC analysis.Online LC�GC/FID. Online LC�GC analysis was performed on a
Dualchrom 3000 instrument (Carlo Erba Instruments, Rodano, Italy),equipped with a loop type interface (500 μL sample loop) and a fullyautomated interface valve system. The HPLC part included two 20 mLsyringe pumps (Phoenix 30CU). Onewas used asmaster pump for solventdelivery, the other as slave pump for backflushing the column system. LCdetection was performed by a variable wavelength detector (microUVIS20, Carlo Erba Instruments, Rodano, Italy) at 205 nm. The HPLC pre-separation was performed on a Eurospher-100 Si column (5 μm particlesize, 250� 2mm i.d.) fromKnauer (Berlin, Germany). The column wasthermostated to 20 �C using a column oven (Jetstream 2 Plus, AdvancedSeparation Technologies Inc., USA). n-Hexane/MTBE (96þ 4, vþ v)was used as eluent with a flow rate of 200 μL/min. Backflush of the columnwas performed directly after the transfer with 200 μL/min MTBE for7min. The transfer valvewas switched automatically 5.15min after injectionof 5 μL of sample solution. The transfer occurred by concurrent eluentevaporation at 140 �C. The GC separation was performed on a tri-fluoropropylmethyl polysiloxane column (Rtx-200MS, 27m� 0.25 mmi.d., 0.1 μm film thickness, Restek, Bad Homburg, Germany) connectedin series with an uncoated capillary deactivated with DPTMDS (3 m �0.53 mm i.d., BGB Analytics Vertrieb, Schlossb€ockelheim, Germany)and a coated precolumn (3 m� 0.25 mm i.d.) of the same coating as theanalytical column. Between the coated precolumn and the separationcolumn, an early solvent vapor exit (SVE) was installed, which wasopened during the transfer. The SVE was closed automatically 60 s after
a pressure reduction of 80 kPa. Hydrogen was used as the carrier gas witha constant flow rate of 1.7 mL/min and an inlet pressure behind theflow regulator of 250 kPa. After holding the transfer temperature of140 �C for 5 min, the temperature was programmed with 15 �C/minup to 310 �C (2 min), then 1.5 �C/min up to 340 �C (3 min). TheFID temperature was set to 360 �C. To enhance the FID signals,nitrogen was used as make up gas with a pressure of 120 kPa. Allcomponents were controlled by the Dualchrom software. TheChromcard software (C.E. Instruments) was used for data collectionand processing.Online LC�GC/MS. For online LC�GC/MS analysis, the Dual-
chrom 3000 was coupled with a TSQ 700 mass spectrometer (Finnigan-MAT, San Jose, CA). Carrier gas was switched to helium, and the end ofthe GC separation column was extended with a 1 m uncoated capillary,deactivated with DPTMDS (0.25 mm i.d.), for connection of the GCoven to theMS via a heated transfer line (320 �C). The residual LC�GCconditions were the same as described above. The source and the manifoldof the TSQwere heated to 250 and 70 �C, respectively. Emission currentwas set to 200 μA, the multiplier to 1500 V. The full scan analysis ofsteryl esters was carried out at unit resolution from 40 to 750 Da at 70 eVand a scan time of 0.4 s.Calibration of the Online LC�GC/FID. The online LC�GC
instrument was calibrated using the plant stanyl ester mixture STAEST-115. Three point calibration functions were generated with varying con-centrations of total esters (2.5; 7.5; 12.5 ng/μL) with regard to theinternal standard cholesteryl palmitate (1.25 ng/μL). Linear regressionanalysis was performed in coordinate ratios of areas (individual stanylester/IS) and amounts (individual stanyl ester/IS). The performance ofthe instrument was confirmed daily using the calibration solutions ascontrol samples.
’RESULTS AND DISCUSSION
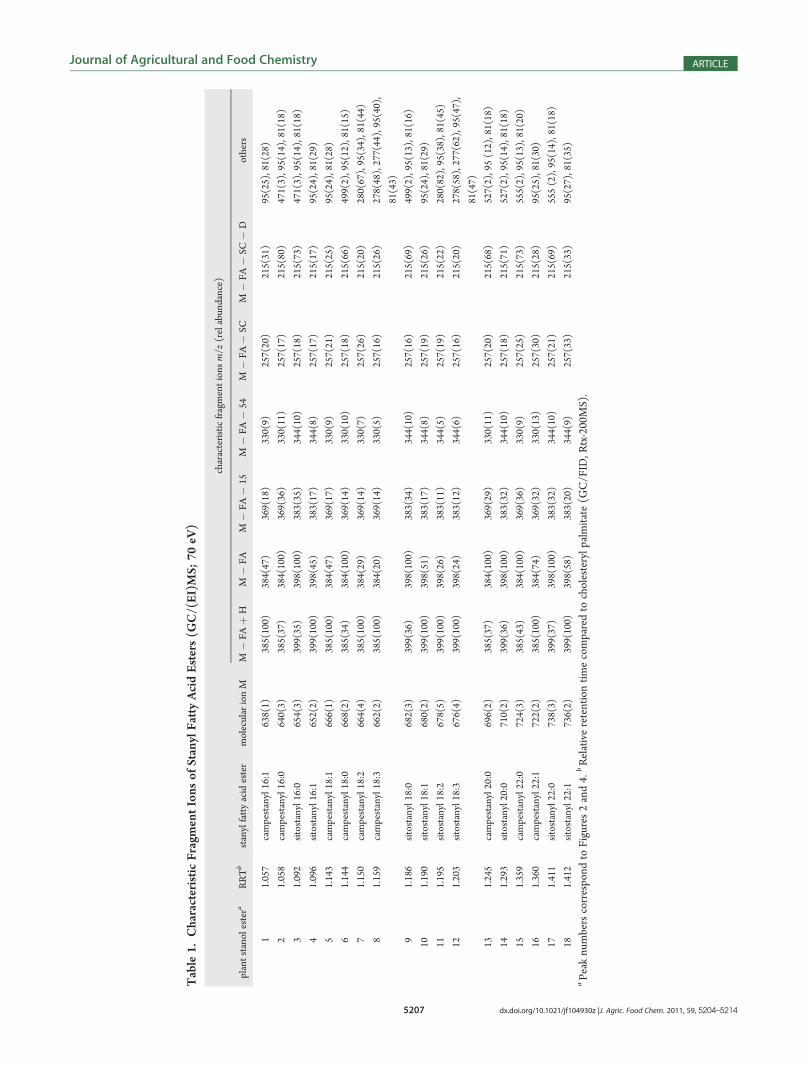
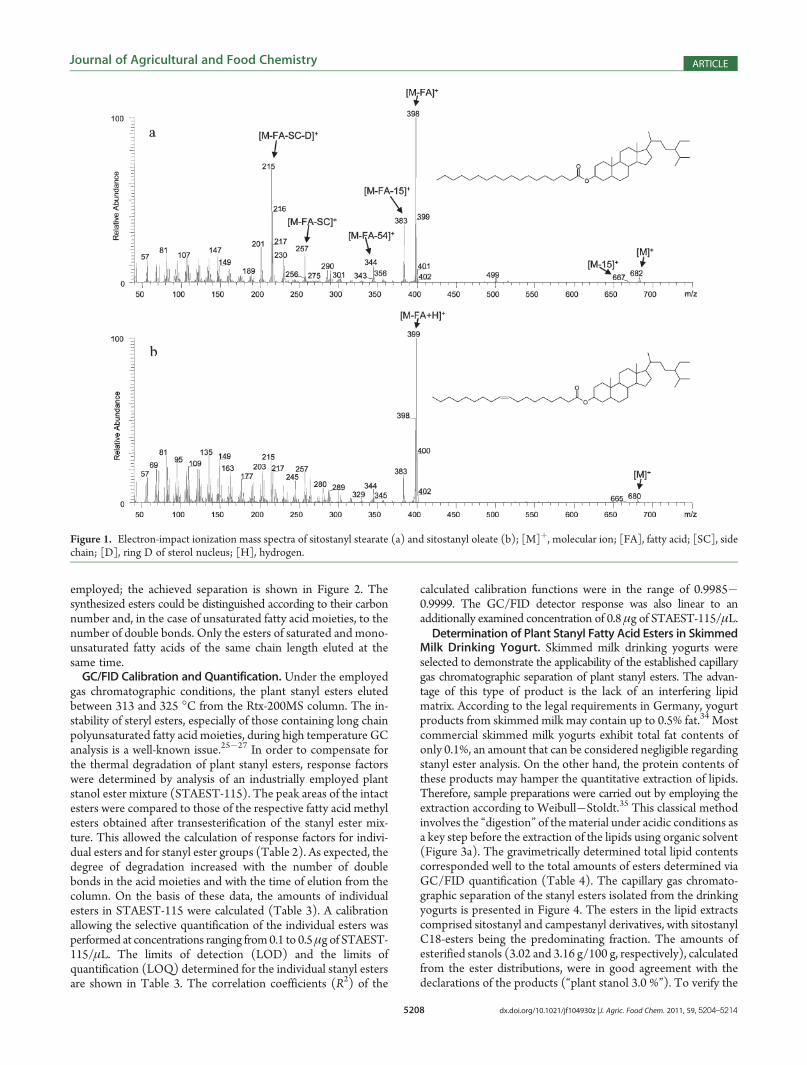
GC/MS Data.Campestanyl palmitate, sitostanyl palmitate andcampestanyl linoleate are the only plant stanyl long chain fattyacid esters for which electron impact (EI) mass spectra have beendescribed in the literature.29,30 In order to build up a referencelibrary, plant stanyl long chain fatty acid esters were prepared byenzyme-catalyzed transesterification of fatty acid methyl estersand stanols, using C. rugosa lipase as biocatalyst.31 Characteristicfragment ions of the enzymatically synthesized reference com-pounds are summarized in Table 1. As examples, themass spectraof sitostanyl stearate and sitostanyl oleate are shown in Figure 1.Molecular ions [M]þ of low intensities were obtained for allstanyl esters. The spectra of the saturated stanyl esters exhibited[M � FA]þ as base fragment, esters of unsaturated fatty acidmoieties [M � FA þ H]þ. The characteristic fragment ionsreported for stanyl acetates [M� FA]þ, [M� FA� 15]þ, [M�FA � SC]þ, and [M � FA � SC � D]þ 29,32,33 were present inall stanyl fatty acid ester spectra, independent of the fatty acylmoiety (Table 1).Capillary Gas Chromatographic Separation. The capillary
gas chromatographic investigation of plant steryl fatty acid estersusing nonpolar stationary phases, e.g. DB-522,23 or DB-1,20 ishampered by the missing resolution of the esters according to thedegree of saturation of the fatty acid moiety.22 The same phenom-enon was encountered in the present study when attempting toseparate stanyl esters using a DB-5ht as stationary phase (datanot shown). The use of the more polar stationary phase TAP(50% phenyl, 50% methyl polysiloxane) also resulted in insuffi-cient separation of a complexmixture of plant steryl esters regardingtheir degree of saturation.21 In the present study, the intermedi-ately polar trifluoropropylmethyl polysiloxane (Rtx-200MS) was
Journal of Agricultural and Food Chemistry ARTICLE
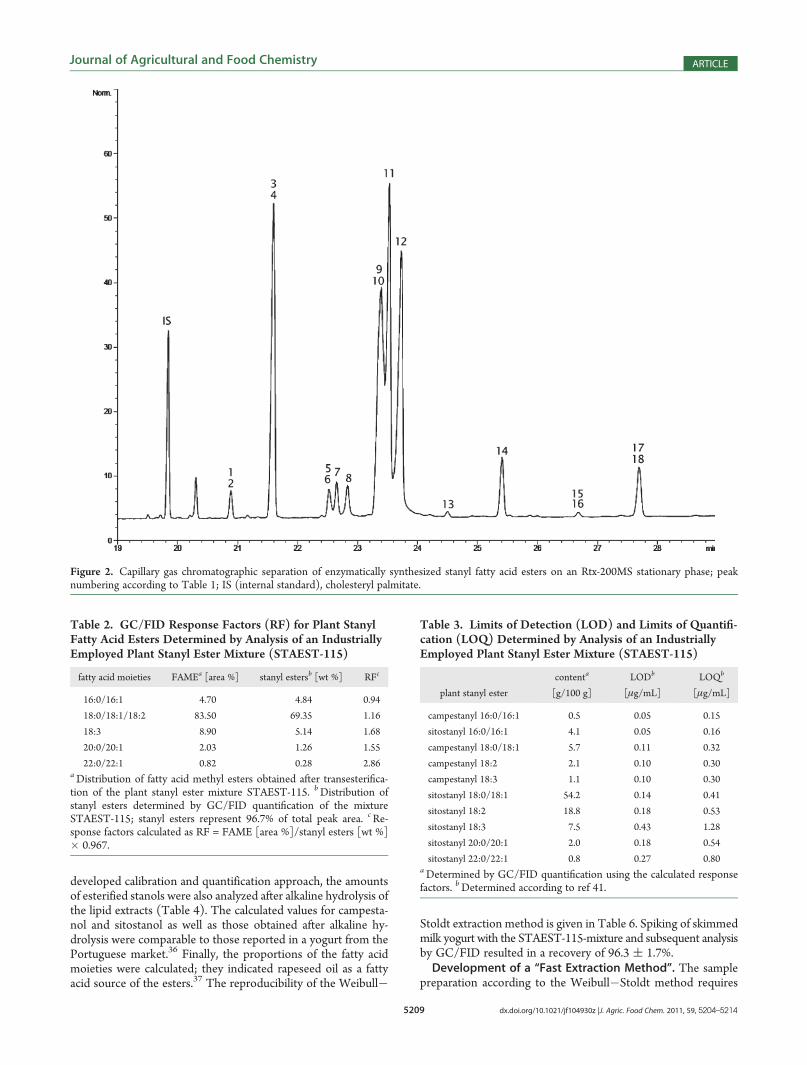
employed; the achieved separation is shown in Figure 2. Thesynthesized esters could be distinguished according to their carbonnumber and, in the case of unsaturated fatty acid moieties, to thenumber of double bonds. Only the esters of saturated and mono-unsaturated fatty acids of the same chain length eluted at thesame time.GC/FID Calibration and Quantification. Under the employed
gas chromatographic conditions, the plant stanyl esters elutedbetween 313 and 325 �C from the Rtx-200MS column. The in-stability of steryl esters, especially of those containing long chainpolyunsaturated fatty acid moieties, during high temperature GCanalysis is a well-known issue.25�27 In order to compensate forthe thermal degradation of plant stanyl esters, response factorswere determined by analysis of an industrially employed plantstanol ester mixture (STAEST-115). The peak areas of the intactesters were compared to those of the respective fatty acid methylesters obtained after transesterification of the stanyl ester mix-ture. This allowed the calculation of response factors for indivi-dual esters and for stanyl ester groups (Table 2). As expected, thedegree of degradation increased with the number of doublebonds in the acid moieties and with the time of elution from thecolumn. On the basis of these data, the amounts of individualesters in STAEST-115 were calculated (Table 3). A calibrationallowing the selective quantification of the individual esters wasperformed at concentrations ranging from0.1 to 0.5μg of STAEST-115/μL. The limits of detection (LOD) and the limits ofquantification (LOQ) determined for the individual stanyl estersare shown in Table 3. The correlation coefficients (R2) of the
calculated calibration functions were in the range of 0.9985�0.9999. The GC/FID detector response was also linear to anadditionally examined concentration of 0.8 μg of STAEST-115/μL.Determination of Plant Stanyl Fatty Acid Esters in Skimmed
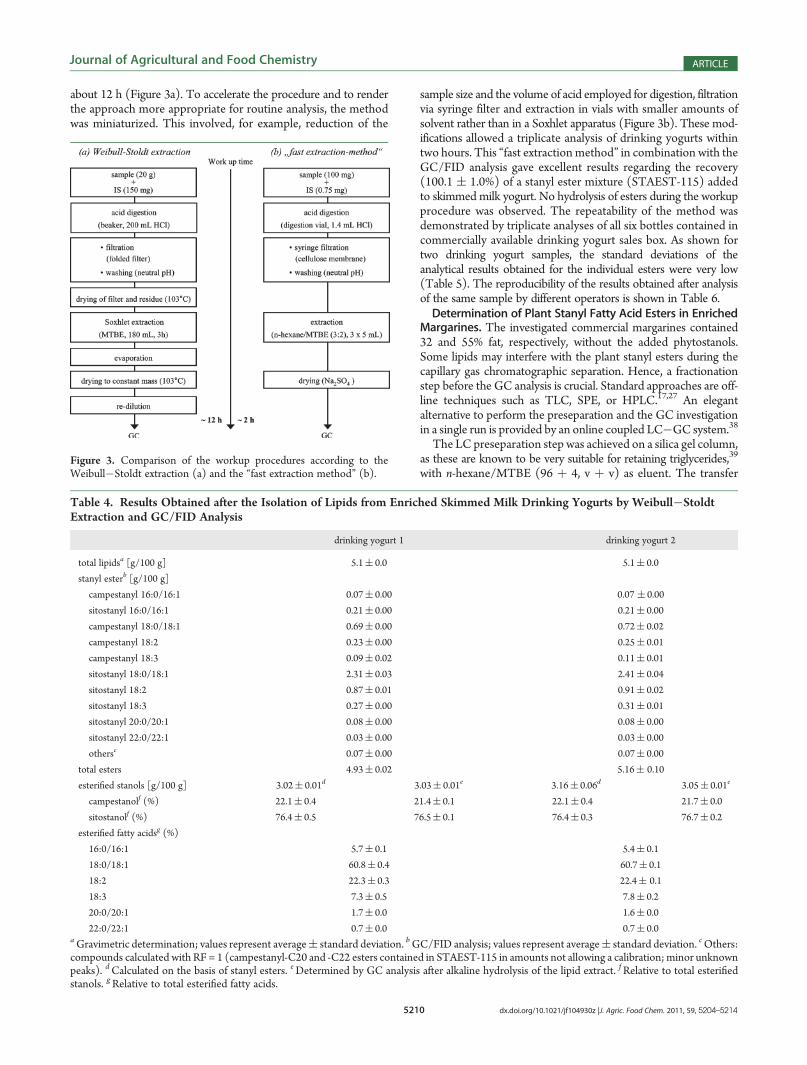
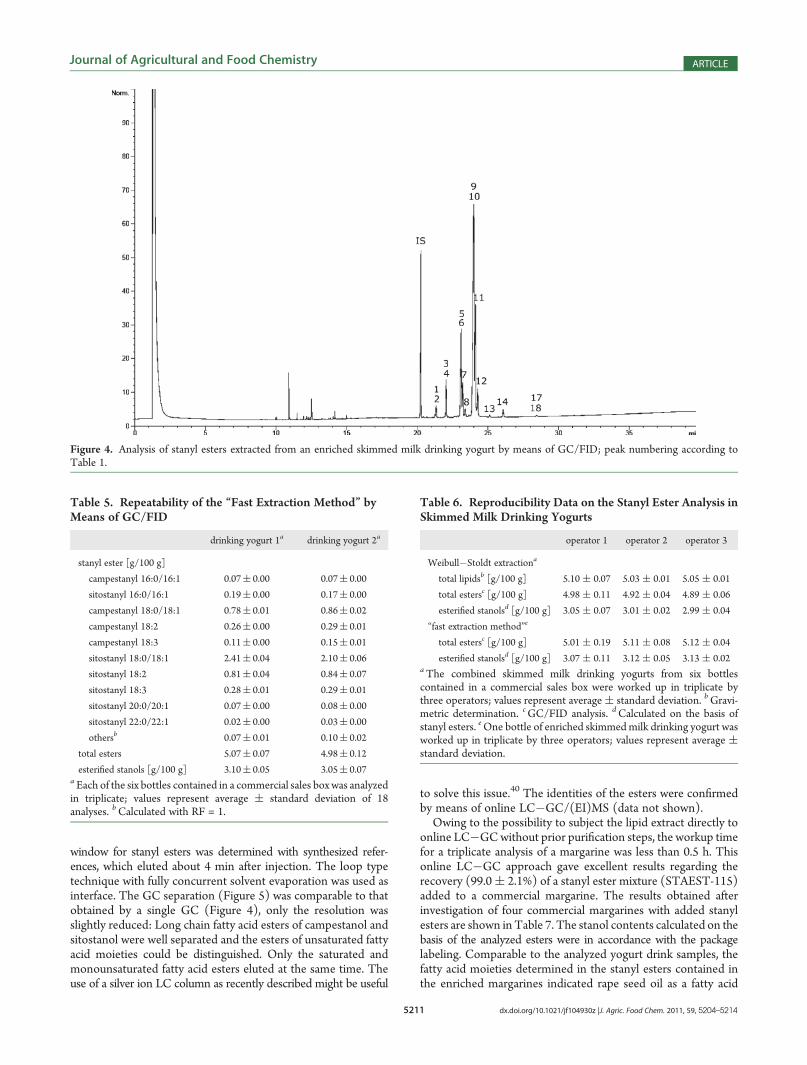
Milk Drinking Yogurt. Skimmed milk drinking yogurts wereselected to demonstrate the applicability of the established capillarygas chromatographic separation of plant stanyl esters. The advan-tage of this type of product is the lack of an interfering lipidmatrix. According to the legal requirements in Germany, yogurtproducts from skimmed milk may contain up to 0.5% fat.34 Mostcommercial skimmed milk yogurts exhibit total fat contents ofonly 0.1%, an amount that can be considered negligible regardingstanyl ester analysis. On the other hand, the protein contents ofthese products may hamper the quantitative extraction of lipids.Therefore, sample preparations were carried out by employing theextraction according to Weibull�Stoldt.35 This classical methodinvolves the “digestion” of the material under acidic conditions asa key step before the extraction of the lipids using organic solvent(Figure 3a). The gravimetrically determined total lipid contentscorresponded well to the total amounts of esters determined viaGC/FID quantification (Table 4). The capillary gas chromato-graphic separation of the stanyl esters isolated from the drinkingyogurts is presented in Figure 4. The esters in the lipid extractscomprised sitostanyl and campestanyl derivatives, with sitostanylC18-esters being the predominating fraction. The amounts ofesterified stanols (3.02 and 3.16 g/100 g, respectively), calculatedfrom the ester distributions, were in good agreement with thedeclarations of the products (“plant stanol 3.0 %”). To verify the
Figure 1. Electron-impact ionization mass spectra of sitostanyl stearate (a) and sitostanyl oleate (b); [M]þ, molecular ion; [FA], fatty acid; [SC], sidechain; [D], ring D of sterol nucleus; [H], hydrogen.
Journal of Agricultural and Food Chemistry ARTICLE
developed calibration and quantification approach, the amountsof esterified stanols were also analyzed after alkaline hydrolysis ofthe lipid extracts (Table 4). The calculated values for campesta-nol and sitostanol as well as those obtained after alkaline hy-drolysis were comparable to those reported in a yogurt from thePortuguese market.36 Finally, the proportions of the fatty acidmoieties were calculated; they indicated rapeseed oil as a fattyacid source of the esters.37 The reproducibility of the Weibull�
Stoldt extraction method is given in Table 6. Spiking of skimmedmilk yogurt with the STAEST-115-mixture and subsequent analysisby GC/FID resulted in a recovery of 96.3 ( 1.7%.Development of a “Fast Extraction Method”. The sample
preparation according to the Weibull�Stoldt method requires
Figure 2. Capillary gas chromatographic separation of enzymatically synthesized stanyl fatty acid esters on an Rtx-200MS stationary phase; peaknumbering according to Table 1; IS (internal standard), cholesteryl palmitate.
Table 2. GC/FID Response Factors (RF) for Plant StanylFatty Acid Esters Determined by Analysis of an IndustriallyEmployed Plant Stanyl Ester Mixture (STAEST-115)
22:0/22:1 0.82 0.28 2.86aDistribution of fatty acid methyl esters obtained after transesterifica-tion of the plant stanyl ester mixture STAEST-115. bDistribution ofstanyl esters determined by GC/FID quantification of the mixtureSTAEST-115; stanyl esters represent 96.7% of total peak area. cRe-sponse factors calculated as RF = FAME [area %]/stanyl esters [wt %]� 0.967.
Table 3. Limits of Detection (LOD) and Limits of Quantifi-cation (LOQ) Determined by Analysis of an IndustriallyEmployed Plant Stanyl Ester Mixture (STAEST-115)
plant stanyl ester
contenta
[g/100 g]
LODb
[μg/mL]
LOQb
[μg/mL]
campestanyl 16:0/16:1 0.5 0.05 0.15
sitostanyl 16:0/16:1 4.1 0.05 0.16
campestanyl 18:0/18:1 5.7 0.11 0.32
campestanyl 18:2 2.1 0.10 0.30
campestanyl 18:3 1.1 0.10 0.30
sitostanyl 18:0/18:1 54.2 0.14 0.41
sitostanyl 18:2 18.8 0.18 0.53
sitostanyl 18:3 7.5 0.43 1.28
sitostanyl 20:0/20:1 2.0 0.18 0.54
sitostanyl 22:0/22:1 0.8 0.27 0.80aDetermined by GC/FID quantification using the calculated responsefactors. bDetermined according to ref 41.
Journal of Agricultural and Food Chemistry ARTICLE
about 12 h (Figure 3a). To accelerate the procedure and to renderthe approach more appropriate for routine analysis, the methodwas miniaturized. This involved, for example, reduction of the
sample size and the volume of acid employed for digestion, filtrationvia syringe filter and extraction in vials with smaller amounts ofsolvent rather than in a Soxhlet apparatus (Figure 3b). These mod-ifications allowed a triplicate analysis of drinking yogurts withintwo hours. This “fast extractionmethod” in combination with theGC/FID analysis gave excellent results regarding the recovery(100.1 ( 1.0%) of a stanyl ester mixture (STAEST-115) addedto skimmed milk yogurt. No hydrolysis of esters during the workupprocedure was observed. The repeatability of the method wasdemonstrated by triplicate analyses of all six bottles contained incommercially available drinking yogurt sales box. As shown fortwo drinking yogurt samples, the standard deviations of theanalytical results obtained for the individual esters were very low(Table 5). The reproducibility of the results obtained after analysisof the same sample by different operators is shown in Table 6.Determination of Plant Stanyl Fatty Acid Esters in Enriched
Margarines. The investigated commercial margarines contained32 and 55% fat, respectively, without the added phytostanols.Some lipids may interfere with the plant stanyl esters during thecapillary gas chromatographic separation. Hence, a fractionationstep before the GC analysis is crucial. Standard approaches are off-line techniques such as TLC, SPE, or HPLC.17,27 An elegantalternative to perform the preseparation and the GC investigationin a single run is provided by an online coupled LC�GC system.38
The LC preseparation step was achieved on a silica gel column,as these are known to be very suitable for retaining triglycerides,39
with n-hexane/MTBE (96 þ 4, v þ v) as eluent. The transferFigure 3. Comparison of the workup procedures according to theWeibull�Stoldt extraction (a) and the “fast extraction method” (b).
Table 4. Results Obtained after the Isolation of Lipids from Enriched Skimmed Milk Drinking Yogurts by Weibull�StoldtExtraction and GC/FID Analysis
22:0/22:1 0.7( 0.0 0.7( 0.0aGravimetric determination; values represent average( standard deviation. bGC/FID analysis; values represent average( standard deviation. cOthers:compounds calculated with RF = 1 (campestanyl-C20 and -C22 esters contained in STAEST-115 in amounts not allowing a calibration; minor unknownpeaks). dCalculated on the basis of stanyl esters. eDetermined by GC analysis after alkaline hydrolysis of the lipid extract. fRelative to total esterifiedstanols. gRelative to total esterified fatty acids.
Journal of Agricultural and Food Chemistry ARTICLE
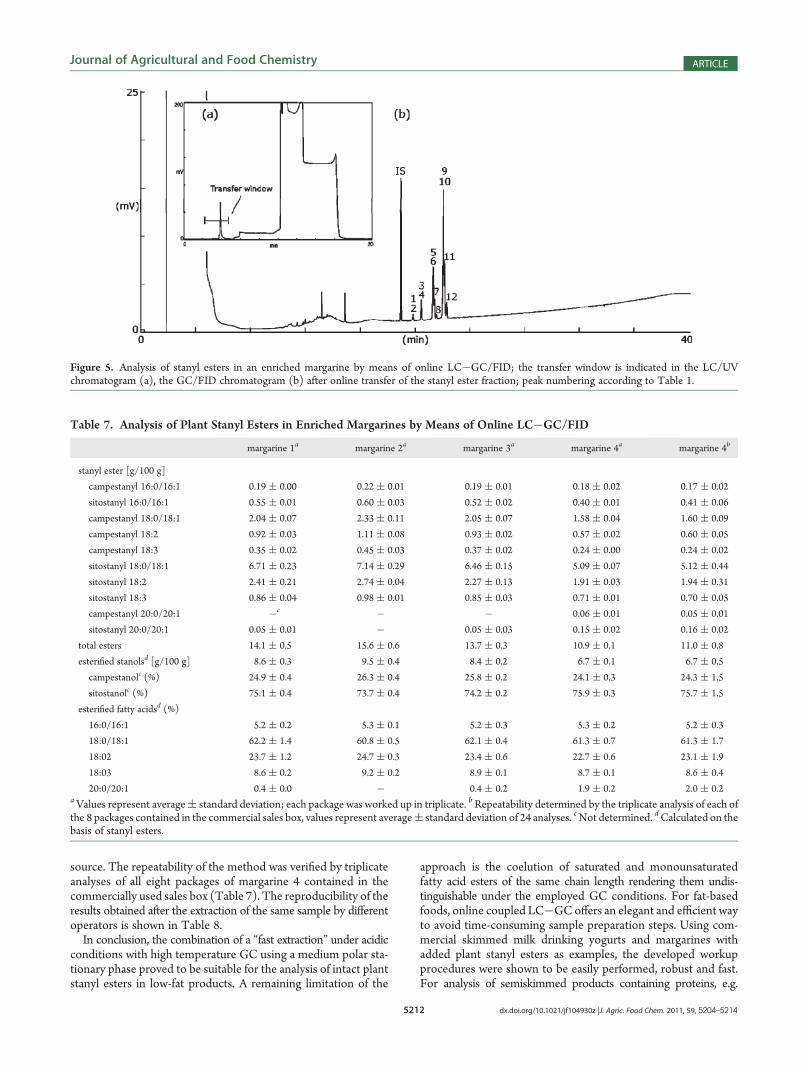
window for stanyl esters was determined with synthesized refer-ences, which eluted about 4 min after injection. The loop typetechnique with fully concurrent solvent evaporation was used asinterface. The GC separation (Figure 5) was comparable to thatobtained by a single GC (Figure 4), only the resolution wasslightly reduced: Long chain fatty acid esters of campestanol andsitostanol were well separated and the esters of unsaturated fattyacid moieties could be distinguished. Only the saturated andmonounsaturated fatty acid esters eluted at the same time. Theuse of a silver ion LC column as recently described might be useful
to solve this issue.40 The identities of the esters were confirmedby means of online LC�GC/(EI)MS (data not shown).Owing to the possibility to subject the lipid extract directly to
online LC�GCwithout prior purification steps, the workup timefor a triplicate analysis of a margarine was less than 0.5 h. Thisonline LC�GC approach gave excellent results regarding therecovery (99.0( 2.1%) of a stanyl ester mixture (STAEST-115)added to a commercial margarine. The results obtained afterinvestigation of four commercial margarines with added stanylesters are shown in Table 7. The stanol contents calculated on thebasis of the analyzed esters were in accordance with the packagelabeling. Comparable to the analyzed yogurt drink samples, thefatty acid moieties determined in the stanyl esters contained inthe enriched margarines indicated rape seed oil as a fatty acid
Figure 4. Analysis of stanyl esters extracted from an enriched skimmed milk drinking yogurt by means of GC/FID; peak numbering according toTable 1.
Table 5. Repeatability of the “Fast Extraction Method” byMeans of GC/FID
drinking yogurt 1a drinking yogurt 2a
stanyl ester [g/100 g]
campestanyl 16:0/16:1 0.07( 0.00 0.07( 0.00
sitostanyl 16:0/16:1 0.19( 0.00 0.17( 0.00
campestanyl 18:0/18:1 0.78( 0.01 0.86( 0.02
campestanyl 18:2 0.26( 0.00 0.29( 0.01
campestanyl 18:3 0.11( 0.00 0.15( 0.01
sitostanyl 18:0/18:1 2.41( 0.04 2.10( 0.06
sitostanyl 18:2 0.81( 0.04 0.84( 0.07
sitostanyl 18:3 0.28( 0.01 0.29( 0.01
sitostanyl 20:0/20:1 0.07( 0.00 0.08( 0.00
sitostanyl 22:0/22:1 0.02( 0.00 0.03( 0.00
othersb 0.07( 0.01 0.10( 0.02
total esters 5.07( 0.07 4.98( 0.12
esterified stanols [g/100 g] 3.10( 0.05 3.05( 0.07a Each of the six bottles contained in a commercial sales box was analyzedin triplicate; values represent average ( standard deviation of 18analyses. bCalculated with RF = 1.
Table 6. Reproducibility Data on the Stanyl Ester Analysis inSkimmed Milk Drinking Yogurts
esterified stanolsd [g/100 g] 3.07 ( 0.11 3.12 ( 0.05 3.13 ( 0.02aThe combined skimmed milk drinking yogurts from six bottlescontained in a commercial sales box were worked up in triplicate bythree operators; values represent average( standard deviation. bGravi-metric determination. cGC/FID analysis. dCalculated on the basis ofstanyl esters. eOne bottle of enriched skimmedmilk drinking yogurt wasworked up in triplicate by three operators; values represent average (standard deviation.
Journal of Agricultural and Food Chemistry ARTICLE
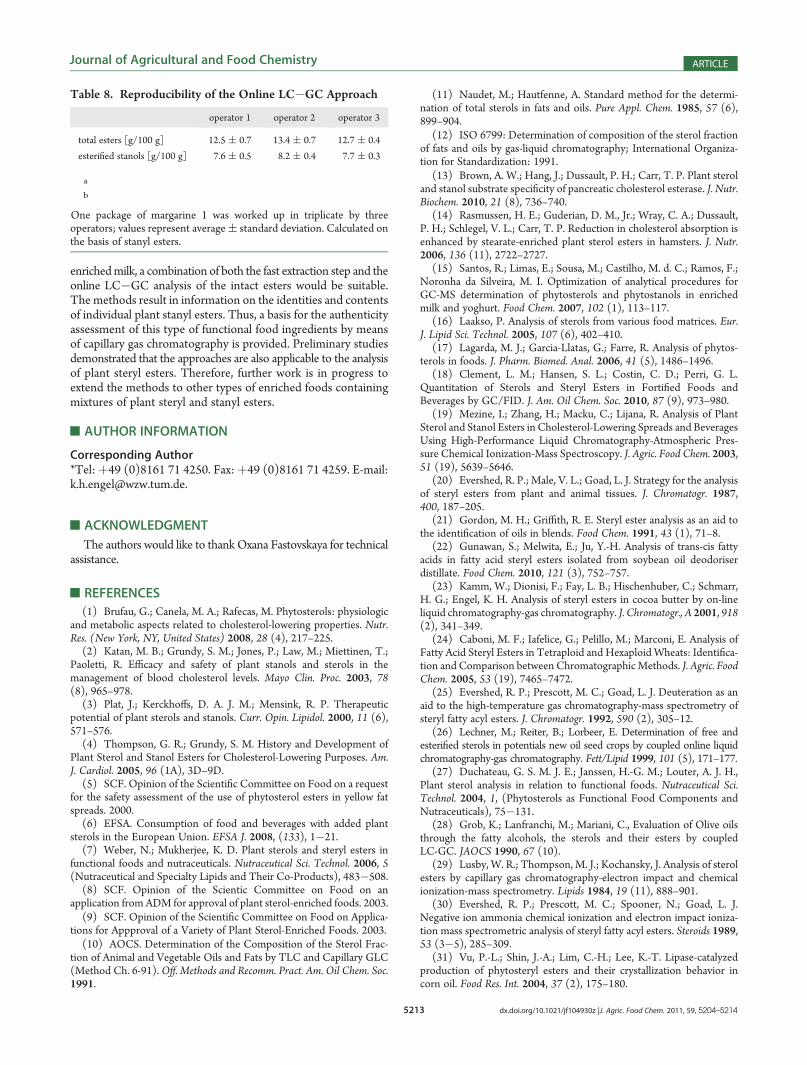
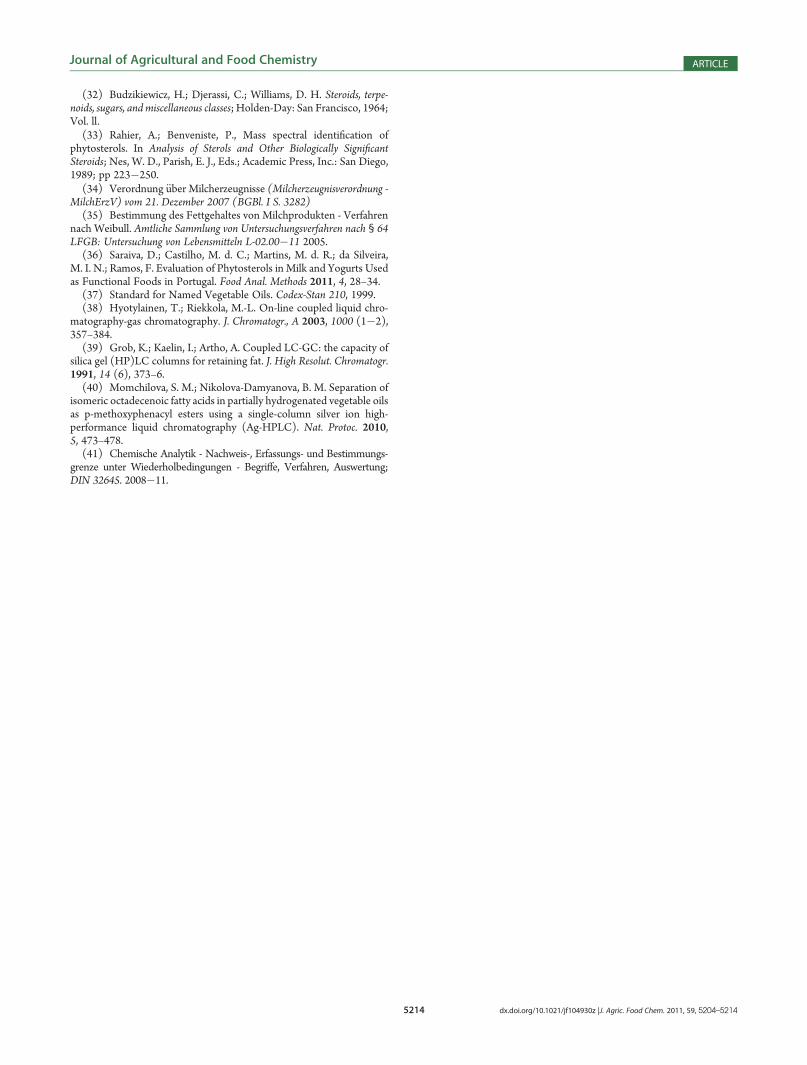
source. The repeatability of the method was verified by triplicateanalyses of all eight packages of margarine 4 contained in thecommercially used sales box (Table 7). The reproducibility of theresults obtained after the extraction of the same sample by differentoperators is shown in Table 8.In conclusion, the combination of a “fast extraction” under acidic
conditions with high temperature GC using a medium polar sta-tionary phase proved to be suitable for the analysis of intact plantstanyl esters in low-fat products. A remaining limitation of the
approach is the coelution of saturated and monounsaturatedfatty acid esters of the same chain length rendering them undis-tinguishable under the employed GC conditions. For fat-basedfoods, online coupled LC�GCoffers an elegant and efficient wayto avoid time-consuming sample preparation steps. Using com-mercial skimmed milk drinking yogurts and margarines withadded plant stanyl esters as examples, the developed workupprocedures were shown to be easily performed, robust and fast.For analysis of semiskimmed products containing proteins, e.g.
Table 7. Analysis of Plant Stanyl Esters in Enriched Margarines by Means of Online LC�GC/FID
20:0/20:1 0.4 ( 0.0 � 0.4 ( 0.2 1.9 ( 0.2 2.0 ( 0.2aValues represent average( standard deviation; each package was worked up in triplicate. bRepeatability determined by the triplicate analysis of each ofthe 8 packages contained in the commercial sales box, values represent average( standard deviation of 24 analyses. cNot determined. dCalculated on thebasis of stanyl esters.
Figure 5. Analysis of stanyl esters in an enriched margarine by means of online LC�GC/FID; the transfer window is indicated in the LC/UVchromatogram (a), the GC/FID chromatogram (b) after online transfer of the stanyl ester fraction; peak numbering according to Table 1.
Journal of Agricultural and Food Chemistry ARTICLE
enrichedmilk, a combination of both the fast extraction step and theonline LC�GC analysis of the intact esters would be suitable.The methods result in information on the identities and contentsof individual plant stanyl esters. Thus, a basis for the authenticityassessment of this type of functional food ingredients by meansof capillary gas chromatography is provided. Preliminary studiesdemonstrated that the approaches are also applicable to the analysisof plant steryl esters. Therefore, further work is in progress toextend the methods to other types of enriched foods containingmixtures of plant steryl and stanyl esters.
The authors would like to thank Oxana Fastovskaya for technicalassistance.
’REFERENCES
(1) Brufau, G.; Canela, M. A.; Rafecas, M. Phytosterols: physiologicand metabolic aspects related to cholesterol-lowering properties. Nutr.Res. (New York, NY, United States) 2008, 28 (4), 217–225.(2) Katan, M. B.; Grundy, S. M.; Jones, P.; Law, M.; Miettinen, T.;
Paoletti, R. Efficacy and safety of plant stanols and sterols in themanagement of blood cholesterol levels. Mayo Clin. Proc. 2003, 78(8), 965–978.(3) Plat, J.; Kerckhoffs, D. A. J. M.; Mensink, R. P. Therapeutic
potential of plant sterols and stanols. Curr. Opin. Lipidol. 2000, 11 (6),571–576.(4) Thompson, G. R.; Grundy, S. M. History and Development of
Plant Sterol and Stanol Esters for Cholesterol-Lowering Purposes. Am.J. Cardiol. 2005, 96 (1A), 3D–9D.(5) SCF. Opinion of the Scientific Committee on Food on a request
for the safety assessment of the use of phytosterol esters in yellow fatspreads. 2000.(6) EFSA. Consumption of food and beverages with added plant
sterols in the European Union. EFSA J. 2008, (133), 1�21.(7) Weber, N.; Mukherjee, K. D. Plant sterols and steryl esters in
functional foods and nutraceuticals. Nutraceutical Sci. Technol. 2006, 5(Nutraceutical and Specialty Lipids and Their Co-Products), 483�508.(8) SCF. Opinion of the Scientic Committee on Food on an
application fromADM for approval of plant sterol-enriched foods. 2003.(9) SCF. Opinion of the Scientific Committee on Food on Applica-
tions for Appproval of a Variety of Plant Sterol-Enriched Foods. 2003.(10) AOCS. Determination of the Composition of the Sterol Frac-
tion of Animal and Vegetable Oils and Fats by TLC and Capillary GLC(Method Ch. 6-91). Off. Methods and Recomm. Pract. Am. Oil Chem. Soc.1991.
(11) Naudet, M.; Hautfenne, A. Standard method for the determi-nation of total sterols in fats and oils. Pure Appl. Chem. 1985, 57 (6),899–904.
(12) ISO 6799: Determination of composition of the sterol fractionof fats and oils by gas-liquid chromatography; International Organiza-tion for Standardization: 1991.
(13) Brown, A. W.; Hang, J.; Dussault, P. H.; Carr, T. P. Plant steroland stanol substrate specificity of pancreatic cholesterol esterase. J. Nutr.Biochem. 2010, 21 (8), 736–740.
(14) Rasmussen, H. E.; Guderian, D. M., Jr.; Wray, C. A.; Dussault,P. H.; Schlegel, V. L.; Carr, T. P. Reduction in cholesterol absorption isenhanced by stearate-enriched plant sterol esters in hamsters. J. Nutr.2006, 136 (11), 2722–2727.
(15) Santos, R.; Limas, E.; Sousa, M.; Castilho, M. d. C.; Ramos, F.;Noronha da Silveira, M. I. Optimization of analytical procedures forGC-MS determination of phytosterols and phytostanols in enrichedmilk and yoghurt. Food Chem. 2007, 102 (1), 113–117.
(16) Laakso, P. Analysis of sterols from various food matrices. Eur.J. Lipid Sci. Technol. 2005, 107 (6), 402–410.
(17) Lagarda, M. J.; Garcia-Llatas, G.; Farre, R. Analysis of phytos-terols in foods. J. Pharm. Biomed. Anal. 2006, 41 (5), 1486–1496.
(18) Clement, L. M.; Hansen, S. L.; Costin, C. D.; Perri, G. L.Quantitation of Sterols and Steryl Esters in Fortified Foods andBeverages by GC/FID. J. Am. Oil Chem. Soc. 2010, 87 (9), 973–980.
(19) Mezine, I.; Zhang, H.; Macku, C.; Lijana, R. Analysis of PlantSterol and Stanol Esters in Cholesterol-Lowering Spreads and BeveragesUsing High-Performance Liquid Chromatography-Atmospheric Pres-sure Chemical Ionization-Mass Spectroscopy. J. Agric. Food Chem. 2003,51 (19), 5639–5646.
(20) Evershed, R. P.; Male, V. L.; Goad, L. J. Strategy for the analysisof steryl esters from plant and animal tissues. J. Chromatogr. 1987,400, 187–205.
(21) Gordon, M. H.; Griffith, R. E. Steryl ester analysis as an aid tothe identification of oils in blends. Food Chem. 1991, 43 (1), 71–8.
(22) Gunawan, S.; Melwita, E.; Ju, Y.-H. Analysis of trans-cis fattyacids in fatty acid steryl esters isolated from soybean oil deodoriserdistillate. Food Chem. 2010, 121 (3), 752–757.
(23) Kamm, W.; Dionisi, F.; Fay, L. B.; Hischenhuber, C.; Schmarr,H. G.; Engel, K. H. Analysis of steryl esters in cocoa butter by on-lineliquid chromatography-gas chromatography. J. Chromatogr., A 2001, 918(2), 341–349.
(24) Caboni, M. F.; Iafelice, G.; Pelillo, M.; Marconi, E. Analysis ofFatty Acid Steryl Esters in Tetraploid and Hexaploid Wheats: Identifica-tion and Comparison between ChromatographicMethods. J. Agric. FoodChem. 2005, 53 (19), 7465–7472.
(25) Evershed, R. P.; Prescott, M. C.; Goad, L. J. Deuteration as anaid to the high-temperature gas chromatography-mass spectrometry ofsteryl fatty acyl esters. J. Chromatogr. 1992, 590 (2), 305–12.
(26) Lechner, M.; Reiter, B.; Lorbeer, E. Determination of free andesterified sterols in potentials new oil seed crops by coupled online liquidchromatography-gas chromatography. Fett/Lipid 1999, 101 (5), 171–177.
(27) Duchateau, G. S. M. J. E.; Janssen, H.-G. M.; Louter, A. J. H.,Plant sterol analysis in relation to functional foods. Nutraceutical Sci.Technol. 2004, 1, (Phytosterols as Functional Food Components andNutraceuticals), 75�131.
(28) Grob, K.; Lanfranchi, M.; Mariani, C., Evaluation of Olive oilsthrough the fatty alcohols, the sterols and their esters by coupledLC-GC. JAOCS 1990, 67 (10).
(29) Lusby, W. R.; Thompson, M. J.; Kochansky, J. Analysis of sterolesters by capillary gas chromatography-electron impact and chemicalionization-mass spectrometry. Lipids 1984, 19 (11), 888–901.
(30) Evershed, R. P.; Prescott, M. C.; Spooner, N.; Goad, L. J.Negative ion ammonia chemical ionization and electron impact ioniza-tion mass spectrometric analysis of steryl fatty acyl esters. Steroids 1989,53 (3�5), 285–309.
(31) Vu, P.-L.; Shin, J.-A.; Lim, C.-H.; Lee, K.-T. Lipase-catalyzedproduction of phytosteryl esters and their crystallization behavior incorn oil. Food Res. Int. 2004, 37 (2), 175–180.
Table 8. Reproducibility of the Online LC�GC Approach
One package of margarine 1 was worked up in triplicate by threeoperators; values represent average( standard deviation. Calculated onthe basis of stanyl esters.
Journal of Agricultural and Food Chemistry ARTICLE
(32) Budzikiewicz, H.; Djerassi, C.; Williams, D. H. Steroids, terpe-noids, sugars, and miscellaneous classes; Holden-Day: San Francisco, 1964;Vol. ll.(33) Rahier, A.; Benveniste, P., Mass spectral identification of
phytosterols. In Analysis of Sterols and Other Biologically SignificantSteroids; Nes, W. D., Parish, E. J., Eds.; Academic Press, Inc.: San Diego,1989; pp 223�250.(34) Verordnung €uber Milcherzeugnisse (Milcherzeugnisverordnung -
MilchErzV) vom 21. Dezember 2007 (BGBl. I S. 3282)(35) Bestimmung des Fettgehaltes von Milchprodukten - Verfahren
nach Weibull. Amtliche Sammlung von Untersuchungsverfahren nach § 64LFGB: Untersuchung von Lebensmitteln L-02.00�11 2005.(36) Saraiva, D.; Castilho, M. d. C.; Martins, M. d. R.; da Silveira,
M. I. N.; Ramos, F. Evaluation of Phytosterols in Milk and Yogurts Usedas Functional Foods in Portugal. Food Anal. Methods 2011, 4, 28–34.(37) Standard for Named Vegetable Oils. Codex-Stan 210, 1999.(38) Hyotylainen, T.; Riekkola, M.-L. On-line coupled liquid chro-
matography-gas chromatography. J. Chromatogr., A 2003, 1000 (1�2),357–384.(39) Grob, K.; Kaelin, I.; Artho, A. Coupled LC-GC: the capacity of
silica gel (HP)LC columns for retaining fat. J. High Resolut. Chromatogr.1991, 14 (6), 373–6.(40) Momchilova, S. M.; Nikolova-Damyanova, B. M. Separation of
isomeric octadecenoic fatty acids in partially hydrogenated vegetable oilsas p-methoxyphenacyl esters using a single-column silver ion high-performance liquid chromatography (Ag-HPLC). Nat. Protoc. 2010,5, 473–478.(41) Chemische Analytik - Nachweis-, Erfassungs- und Bestimmungs-
grenze unter Wiederholbedingungen - Begriffe, Verfahren, Auswertung;DIN 32645. 2008�11.