

[ ]42
A Be t t e r Wor l d
The SuSanA platform and the Shit Flow Diagram – tools to achieve more sustainable sanitation for all
Arne Panesar, Dirk Walther, Thomas Kauter-Eby, Susanne Bieker, Deutsche Gesellschaft fuer Internationale Zusammenarbeit (GIZ) GmbH; Suresh Rohilla, Centre for Science and Environment (CSE); Regina Dube, Ministry of
Environment and Energy of the City of Hamburg; Kim Augustin, HamburgWasser; Roland Schertenleib, formerly Swiss Federal Institute of Aquatic Science and Technology (EAWAG)
Daniela Krahl of the German Federal Ministry for Economic Development and Cooperation (BMZ) has said that: “The water strategy of our Ministry is seen
as a model because it addresses the spirit of the SDGs in a holistic manner, thus going beyond SDG 6. That is what we need today and that is why I like the excreta flow diagram. It brings people from different spheres together to understand a challenge that they can only solve together. A platform – the Sustainable Sanitation Alliance (SuSanA) – has been formed to allow for discussion on sanitation at all levels, particularly with an inter-sectoral outlook, and with the aim to find equi-table and sustainable solutions. That is why the Ministry is supporting cooperation in German development expertise on this platform, and is proud to see its positive impact.”
Human excreta can pollute water and settlements, spread-ing deadly pathogens and emitting methane that contributes to global warming. They can also provide a safe fertiliser to
help build a world without hunger, and create energy for a circular economy. Solving the sanitation crisis is therefore a challenge and opportunity in need of cross-sectoral commu-nication, and facilitating such communication requires a new language and new communication tools.
The SuSanA is a platform built for developing and enabling communication for this purpose.1,2 One of the tools used to inform stakeholders from a range of backgrounds on city-wide sanitation conditions is known colloquially as the Shit Flow Diagram (SFD), which often forms a crucial basis for discussion among a wide range of urban agencies on future steps towards better urban sanitation for all.
There are three key concepts that link sanitation to the Sustainable Development Goals as a whole – the systems approach to sanitation; viewing sanitation as part of a circu-lar economy; and the use of SFDs. These crucial elements are brought together on the SuSanA platform with the aim of addressing the SDGs holistically.
A Shit Flow Diagram (SFD) is an advocacy and decision support tool that summarises and presents in a concise report what happens to excreta in urban areas. When Bill Gates met India’s prime minister, Narendra Modi in 2016, he used an SFD graphic to begin an exchange on the urban sanitation crisis and where efforts might be focused to address it efficiently
Fig 1: A typical Shit Flow Diagram
Offsite sanitation
Onsite sanitation
Local area Neighbourhood City
Safely managed Unsafely managed WW: Wastewater FS: Faecal sludge SN: Supernatant
WW contained54%
WW contained delivered to treatment 40%
WW not contained 6%
WW not contained delivered to treatment 5%
SN not contained16%
FS not contained16%
FS not contained – emptied15%
EmptyingContainment Transport Treatment
14%
40%
60%
1%
45%
Source: SFD Promotion Initiative
Open defecation
Open defecation 5%
FS not delivered to
treatment 2%
FS not contained 2%
FS contained not emptied
FS treated
SN not delivered to treatment 16%
FS delivered to treatment 14%
WW treated
WW not delivered to treatment 15%
Imag
e: A
rne
Pan
esar
Imag
e: P
ress
Tru
st o
f In
dia
(PTI
)
3509

[ ]43
acc e s s to wat e r a n d sa ni tat ion for a l l
The power of iconography to reach SDG 6 and moreWhen Bill Gates met India’s prime minister Narendra Modi in 2016, he used a graphic to begin discussions on the nature of the sanitation crisis and where efforts should be focused to overcome it. The graphic was an SFD depicting the sanita-tion conditions of the Indian city of Trichy, and allowed for a highly structured discussion by visually emphasising the challenges and possible action fields for improving sanita-tion management on a city-wide level. It also underlined the importance of safe faecal sludge management in cities.
It became apparent that the power of SFD graphics lay in the idea that they:• Present both central and decentral systems in one image,
overcoming a breakdown in discourse on how to solve the urban sanitation crisis that has existed for too long.
• Are inclusive, as they show the journey of the excreta of all humans in a city.
• Use a systems approach to sanitation (see below), as they follow the journey of excreta along the sanitation chain, from containment, via transport to treatment and beyond.
• Establish a direct link to the viewer, especially if that person lives in the city depicted in the graphic and is curious as to the safety of excreta management.
• Establish a direct link to the viewer’s work, even if that person does not work in the field of sanitation. SFDs are helpful to a range of sectors in a city, for instance to the health sector where the SFD shows to what extent misman-aged or missing sanitation systems become a health concern; to the environmental sector where it shows to what extent unsafely managed excreta reach the environment; to reuse concepts where it shows which sanitation system compo-nents produce what kind of excreta flows (information useful for biogas or fertiliser production, if safely managed).
• Can be linked to infrastructure considerations, and indicate where to prioritise investment into urban sanitation.
The SFD as a prompt for expert discussion and actionThe graphic itself does not solve, but discussion prompted by the graphic among experts from various sectors has the poten-tial to do so. When Prof. Barbara Evans, one of the first to visualise excreta management in cities and towns, presented an SFD graphic of Dhaka to the city’s mayor, he was alarmed. It showed that, while open defecation was at only 1%, around 98% of the city’s excreta were unsafely managed.4 This made it immediately clear that further discussion with a broader group of stakeholders was required to improve management.
Fig 1: A typical Shit Flow Diagram
The graphic from the SFD report on Tiruchirappalli (Trichy), India,3 shows that 60% of the population is dependent on offsite sanitation systems and 35% is connected to a sewer line. Finally, 5% of the population practices open defecation. It can be concluded that the excreta of 60% of the population is managed safely and 40% of excreta is discharged into the environment untreated. The potential of SFDs as a tool to communicate sanitation gaps is widely recognised in the sector
Offsite sanitation
Onsite sanitation
Local area Neighbourhood City
Safely managed Unsafely managed WW: Wastewater FS: Faecal sludge SN: Supernatant
WW contained54%
WW contained delivered to treatment 40%
WW not contained 6%
WW not contained delivered to treatment 5%
SN not contained16%
FS not contained16%
FS not contained – emptied15%
EmptyingContainment Transport Treatment
14%
40%
60%
1%
45%
Source: SFD Promotion Initiative
Open defecation
Open defecation 5%
FS not delivered to
treatment 2%
FS not contained 2%
FS contained not emptied
FS treated
SN not delivered to treatment 16%
FS delivered to treatment 14%
WW treated
WW not delivered to treatment 15%
3509
[ ]44
A Be t t e r Wor l d
SFD reports contribute to better diagnostics and more targeted intervention at city level. For the report to be of most value, it must comprise the graphic together with a detailed set of critical information on the sanitation service delivery context of a city and a transparent reference to all data sources used, otherwise sustainable solutions cannot be achieved. For example, there are cities that have received funds for more than one large wastewater treatment plant which became dysfunctional after a few months. Investment in a large plant is a bad idea if skilled personal are not in place to run and maintain it, or if the appropriate policy environment to finance the operational and maintenance costs is missing.
Presenting an SFD graphic to a key decision maker often sets the appropriate tone for productive discourse, initiating it by providing a clear and common ground. There are various backgrounds against which such discussion can take place. For instance, in Moshi, Tanzania, four key stakeholders of urban sanitation used the city’s SFD5 as a starting point to help develop a joint understanding of the status quo and to inform discussion on possible futures for the city. In India, the SFD has been integrated in the ministry’s toolkit for implementing the already effective National Urban Sanitation Policy, strengthening communication among experts as well as providing information for the public.
In summary, an SFD not only presents relevant informa-tion visually to more than one sector but, by doing so, brings together the various sectors and their respective agendas. Thus, various stakeholders are linked in communication that otherwise would have remained within their own field of discourse. The SFD is therefore responsible for shaping a new, more encompassing conversation on sanitation.
Two other strong visual concepts required for SFDsWhile the idea of the graphic quickly emerged in discussions between experts, the underlying thinking was predicated on two main pillars6,7 that also evolved around iconography.
One is the systems approach to sanitation that defines the components forming a typical system and produces a set of examples. The other is the idea of sanitation as part of a circu-lar economy. It is possible close the loop on sanitation, linking excreta management with broader resource efficiency and sustainability discussions and hence with a range of SDGs.8 Both approaches connect sanitation with matter flow analysis and are discussed below.
C Con
veya
nce
Inpu
t/O
utpu
tPr
oduc
ts
Faec
al S
ludg
e
C.7
S.2
ngle
Pit
S.3
Sing
le P
it VI
P
C.8
Sew
er
Em pt
y ing
&
Tran
spor
t
C.3
Mot
orize
d Em
pty -
Excr
eta
U User Interface SCollection and Storage/Treatment
C Conveyance T(Semi-)CentralizedTreatment
D Use and/orDisposal
Input/OutputProducts
InputProducts
Input/OutputProducts
Input/OutputProducts
Faeces
Anal CleansingWater
Stormwater
EffluentGreywater Treatment
D.1 Fill and Cover
D.5 Irrigation
D.8 Aquaculture
D.9 Macrophyte
D.10 Disposal/
Recharge
D.5 Irrigation
D.6 Soak Pit
D.10 Disposal/
Recharge
D.10 Disposal/
Recharge
Faecal Sludge
Urine
D.11 Land Application
D.12 Surface Disposal
Stormwater Drains
Dry CleansingMaterial
U.1 Dry Toilet
C.7 Transfer Station
S.2 Single Pit
S.3 Single Pit VIP
T.3 WSP
T.4 Aerated Pond
T.5 FWS CW
T.6 HSF CW
T.7 VF CW
T.8 Trickling Filter
T.9 UASB
T.10 Activated Sludge
T.11 Sedimentation/
Thickening
T.12 Unplanted drying
beds
T.13 Planted drying beds
T.14 Co-Composting
T.15 Biogas Reactor
Treated Sludge
C.8 Sewer Discharge
Station
Effluent
Flushwater
Greywater
C.2 Human Powered
Em pty ing &
Transport
C.3 Motorized Em pty -
ing & Transport
Excreta
BlackwaterU.4 Pour Flush Toilet
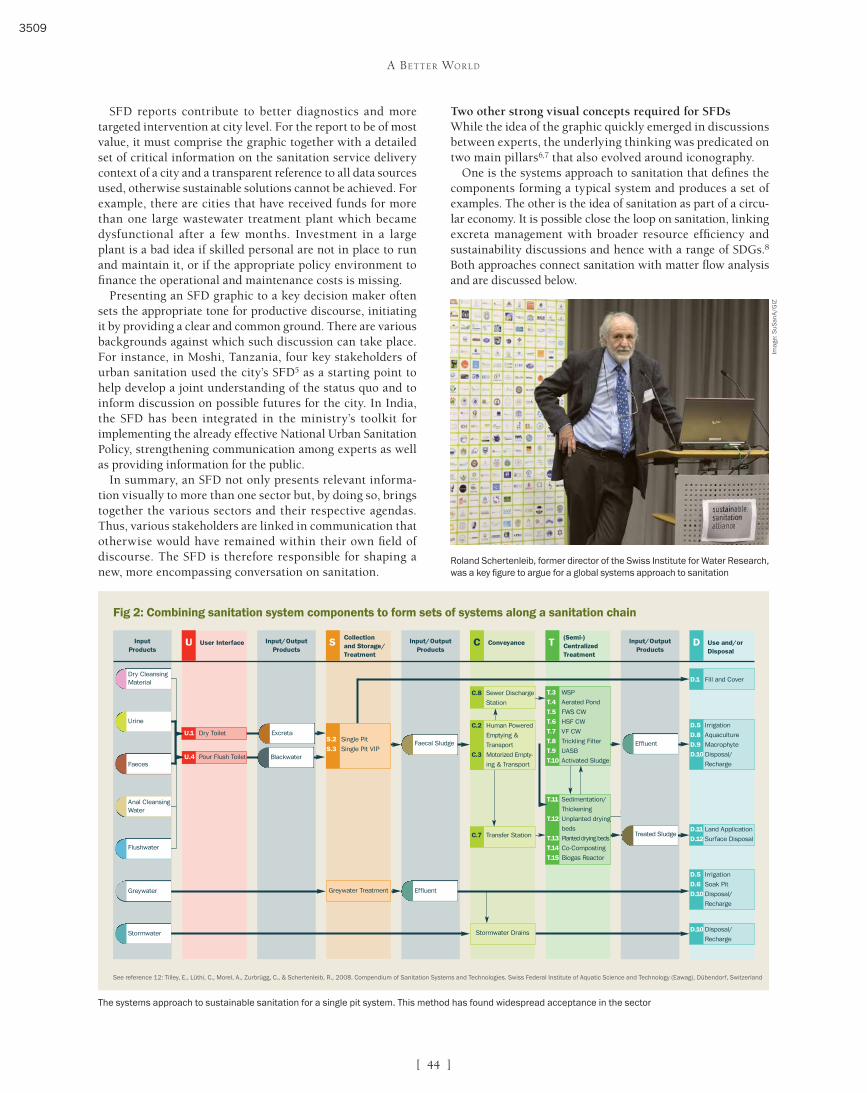
The systems approach to sustainable sanitation for a single pit system. This method has found widespread acceptance in the sector
See reference 12: Tilley, E., Lüthi, C., Morel, A., Zurbrügg, C., & Schertenleib, R., 2008. Compendium of Sanitation Systems and Technologies. Swiss Federal Institute of Aquatic Science and Technology (Eawag), Dübendorf, Switzerland
Roland Schertenleib, former director of the Swiss Institute for Water Research, was a key figure to argue for a global systems approach to sanitation
Fig 2: Combining sanitation system components to form sets of systems along a sanitation chain
Imag
e: S
uSan
A/G
IZ
3509
[ ]45
acc e s s to wat e r a n d sa ni tat ion for a l l
The SuSanA-network – moving to a systems approach Sunita Narain, director of Centre for Science and Environment, New Delhi, India, reports that: “The biggest ever sanitation programme, the Clean India Campaign (Swachh Bharat), instigated by Indian prime minister Narendra Modi, has broadened its focus from ODF (open defecation-free) to ODF++ (including waste water, septage, greywater and faecal sludge management).”9,10,11 The mission of the Indian govern-ment and an engaged community of experts had originally begun with the slogan “Toilets before Temples,” yet this was the first step in an extended mission. Now, with ODF++, the focus has moved beyond the toilet to include various other elements of the sanitation chain and particularly an approach to sanitation from a systems perspective.
For many years, sanitation improvement was often focused on the construction of latrines without considering aspects of operation, maintenance and services. However, there has been increasing awareness globally that building latrines alone and neglecting the entire sanitation service chain does not improve public health conditions, and could even be a cause of environmental deterioration.
This increased awareness was one of the main reasons for creating the Sustainable Sanitation Alliance, just before the International Year of Sanitation in 2008,12 experts having been concerned that the Year would be oriented towards infra-structure, thereby potentially worsening the situation. The alliance was, among other activities, actively involved in the development of a key publication, spearheaded by the Swiss Water Research Institute EAWAG, entitled The Compendium of Sanitation Systems and Technologies.13 A crucial ingredient of the publication was its provision of iconography to depict sanitation chains and the ways in which elements could be linked to the chain using a number of exemplary systems.
Sanitation in the circular economy – closing the loopThe global endorsement of the SDGs calls for a radical re-thinking of the conventional, accepted approaches to urban infrastructure in general, and to sanitation in particular.
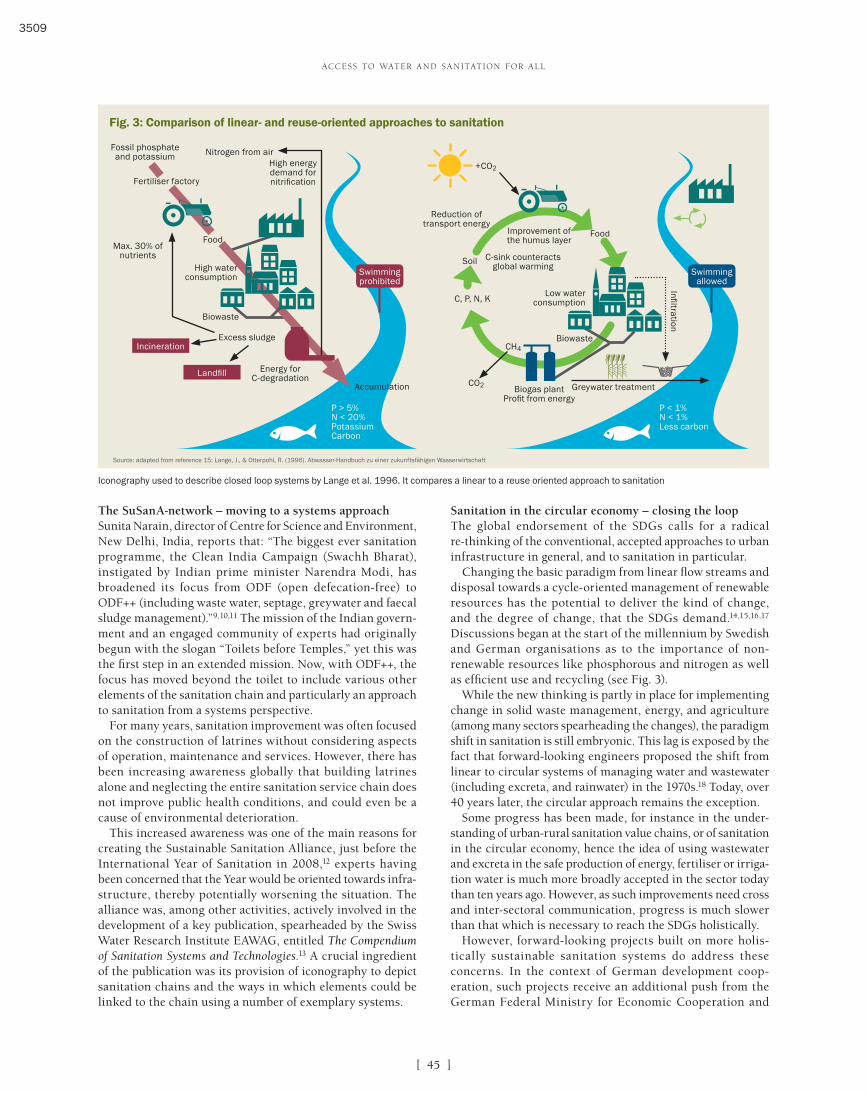
Changing the basic paradigm from linear flow streams and disposal towards a cycle-oriented management of renewable resources has the potential to deliver the kind of change, and the degree of change, that the SDGs demand.14,15,16,17 Discussions began at the start of the millennium by Swedish and German organisations as to the importance of non-renewable resources like phosphorous and nitrogen as well as efficient use and recycling (see Fig. 3).
While the new thinking is partly in place for implementing change in solid waste management, energy, and agriculture (among many sectors spearheading the changes), the paradigm shift in sanitation is still embryonic. This lag is exposed by the fact that forward-looking engineers proposed the shift from linear to circular systems of managing water and wastewater (including excreta, and rainwater) in the 1970s.18 Today, over 40 years later, the circular approach remains the exception.
Some progress has been made, for instance in the under-standing of urban-rural sanitation value chains, or of sanitation in the circular economy, hence the idea of using wastewater and excreta in the safe production of energy, fertiliser or irriga-tion water is much more broadly accepted in the sector today than ten years ago. However, as such improvements need cross and inter-sectoral communication, progress is much slower than that which is necessary to reach the SDGs holistically.
However, forward-looking projects built on more holis-tically sustainable sanitation systems do address these concerns. In the context of German development coop-eration, such projects receive an additional push from the German Federal Ministry for Economic Cooperation and
Fig. 3: Comparison of linear- and reuse-oriented approaches to sanitation
Source: adapted from reference 15: Lange, J., & Otterpohl, R. (1996). Abwasser-Handbuch zu einer zukunftsfähigen Wasserwirtschaft
Iconography used to describe closed loop systems by Lange et al. 1996. It compares a linear to a reuse oriented approach to sanitation
Swimming prohibited
Swimming allowed
Reduction of transport energy
C-sink counteracts global warming
Low water consumption
Biowaste
Biogas plant Profit from energy
Improvement of the humus layer
Food
Infiltration
Food
Fertiliser factory
Fossil phosphate and potassium
Max. 30% of nutrients
High water consumption
Biowaste
Incineration
Landfill
Excess sludge
Energy for C-degradation
Nitrogen from airHigh energy demand for nitrification
Soil
Greywater treatmentAccumulation
CH4
P < 1%N < 1%Less carbon
P > 5%N < 20%PotassiumCarbon
CO2
+CO2
C, P, N, K
3509
[ ]46
A Be t t e r Wor l d
Development (BMZ)’s water strategy, endorsed in 2017. The strategy places water sector activities in the context of the BMZ’s overall contribution to implementing the 2030 Agenda, the Paris Agreement and other global agreements such as those on human rights. Beyond calling for holistic manage-ment of water and related resources, key interfaces and areas of activity involving adjacent sectors are, or will be described in separate strategy documents. These links between sectors typically occur in the following SDG constellations: • Water education, health, and food and nutrition• Water, sustainable economic development• Employment and vocational training• Water, agriculture and energy• Water, environment and climate change• Water, good governance, urban development• Water, population growth and migration.19
Case history 1: Nashik, IndiaThe city of Nashik is outstanding in its endeavour to become an exemplar of sustainability through liquid and solid waste management over a range of projects. Nashik ranked 42nd out of 423 Indian cities when evaluated in a sanita-
tion ranking exercise carried out under the mandate of the National Urban Sanitation Policy, through the Ministry of Urban Development, government of India.
As a further development, one of the innovative projects undertaken by Nashik is the Waste to Energy programme, implemented with the support of Deutsche Gesellschaft fuer Internationale Zusammenarbeit (GIZ) as an activity under German development cooperation. The project involves combining the waste streams of organic kitchen waste and septage from public and community toilets and converting it into electrical energy through co-fermentation. The sources of waste are ring-fenced, owing to a bylaw which dictates that the city takes ownership of the waste from hotel kitchens. A two barrier system of septage pasteurisation and biom-ethanisation enables the operator to use the residue for soil enhancement at agricultural sites. Field trials are currently ongoing in the Dhule district to the South of Nashik. With this approach, complete reuse of input waste is maintained, and nutrients as well as organic carbon are recirculated. The operation is completely financed through the business model, with an estimated 15–30% of the capital investment to be refinanced.20
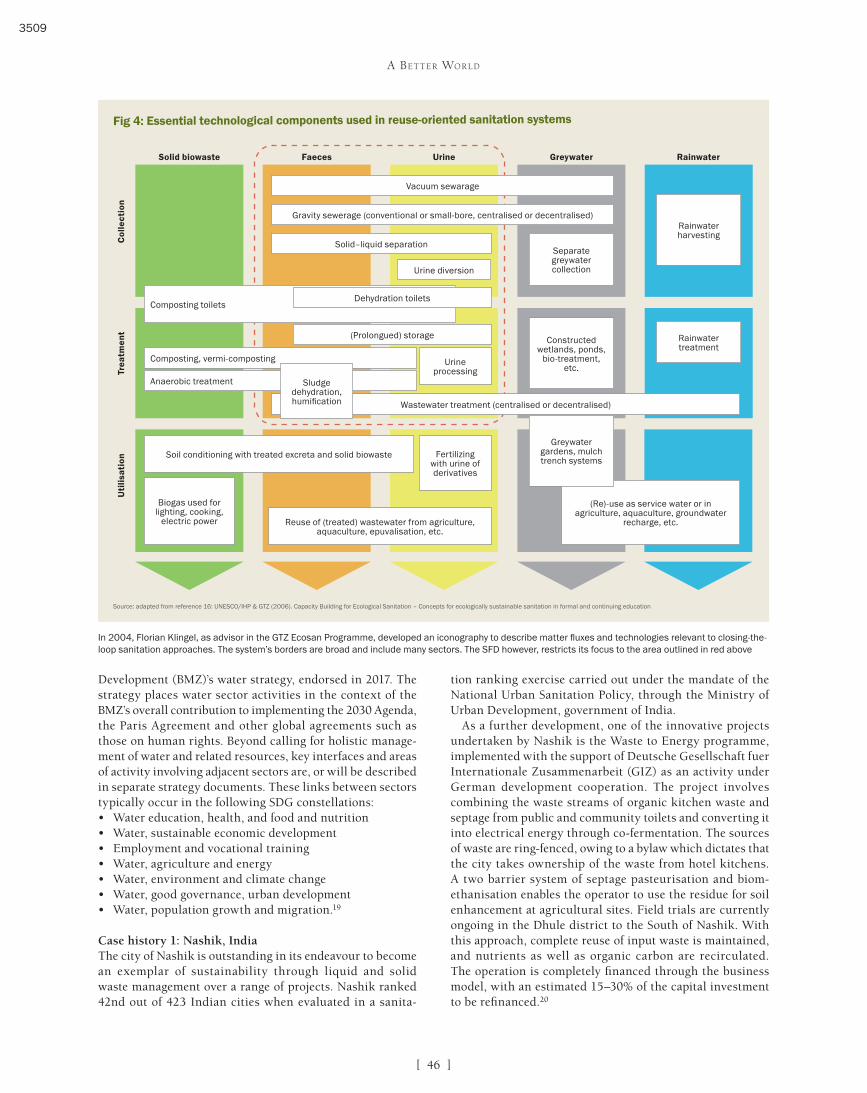
In 2004, Florian Klingel, as advisor in the GTZ Ecosan Programme, developed an iconography to describe matter fluxes and technologies relevant to closing-the-loop sanitation approaches. The system’s borders are broad and include many sectors. The SFD however, restricts its focus to the area outlined in red above
Source: adapted from reference 16: UNESCO/IHP & GTZ (2006). Capacity Building for Ecological Sanitation – Concepts for ecologically sustainable sanitation in formal and continuing education
Fig 4: Essential technological components used in reuse-oriented sanitation systems
Solid biowaste
Uti
lisa
tion
Trea
tmen
tC
olle
ctio
n
Faeces Urine Greywater Rainwater
Biogas used for lighting, cooking,
electric power Reuse of (treated) wastewater from agriculture, aquaculture, epuvalisation, etc.
Soil conditioning with treated excreta and solid biowaste Fertilizing with urine of derivatives
Anaerobic treatment
Wastewater treatment (centralised or decentralised)
Composting toilets
Composting, vermi-composting Urine processing
Urine diversion
(Re)-use as service water or in agriculture, aquaculture, groundwater
recharge, etc.
Greywater gardens, mulch trench systems
Separate greywater collection
Rainwater harvesting
Rainwater treatment
Constructed wetlands, ponds,
bio-treatment, etc.
Sludge dehydration, humification
(Prolongued) storage
Dehydration toilets
Solid–liquid separation
Vacuum sewarage
Gravity sewerage (conventional or small-bore, centralised or decentralised)
3509
[ ]47
acc e s s to wat e r a n d sa ni tat ion for a l l
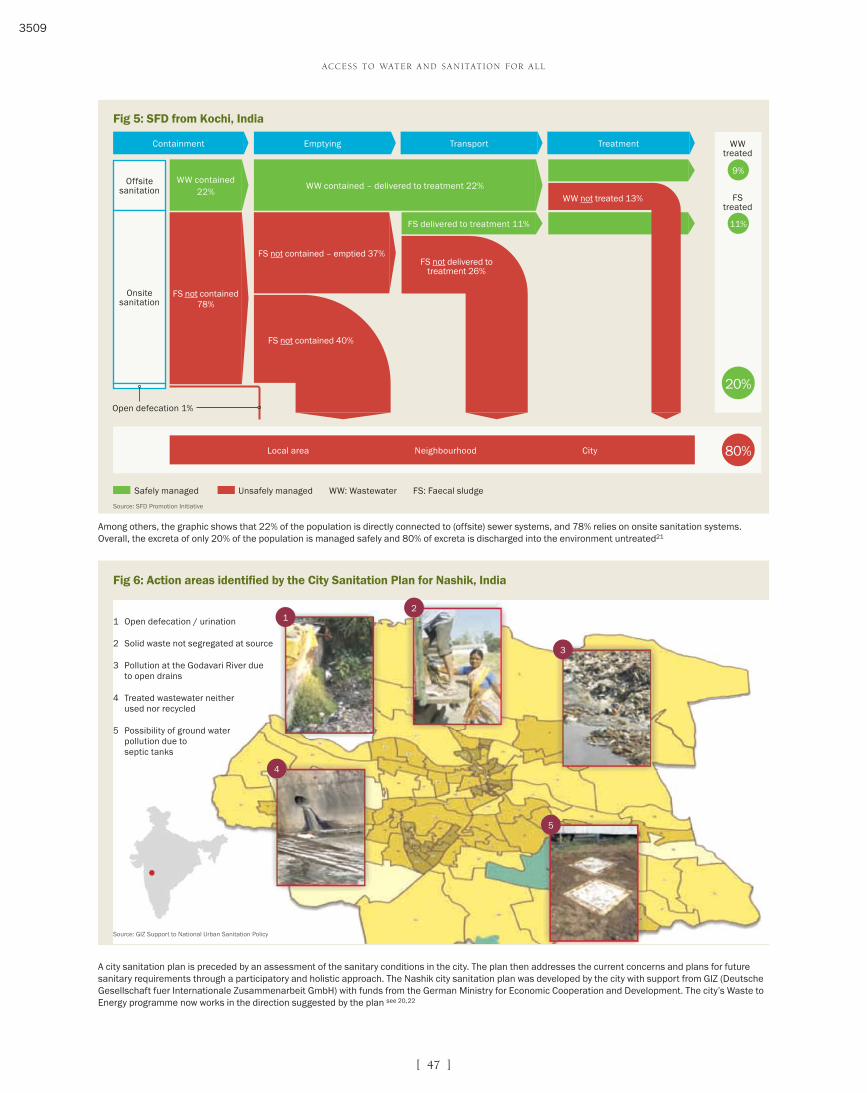
Among others, the graphic shows that 22% of the population is directly connected to (offsite) sewer systems, and 78% relies on onsite sanitation systems. Overall, the excreta of only 20% of the population is managed safely and 80% of excreta is discharged into the environment untreated21
A city sanitation plan is preceded by an assessment of the sanitary conditions in the city. The plan then addresses the current concerns and plans for future sanitary requirements through a participatory and holistic approach. The Nashik city sanitation plan was developed by the city with support from GIZ (Deutsche Gesellschaft fuer Internationale Zusammenarbeit GmbH) with funds from the German Ministry for Economic Cooperation and Development. The city’s Waste to Energy programme now works in the direction suggested by the plan see 20,22
1 Open defecation / urination
2 Solid waste not segregated at source
3 Pollution at the Godavari River due to open drains
4 Treated wastewater neither used nor recycled
5 Possibility of ground water pollution due to septic tanks
Fig 6: Action areas identified by the City Sanitation Plan for Nashik, India
Source: GIZ Support to National Urban Sanitation Policy
5
4
3
21
Fig 5: SFD from Kochi, India
Safely managed Unsafely managed WW: Wastewater FS: Faecal sludge
Source: SFD Promotion Initiative
EmptyingContainment Transport Treatment
9%
11%
WW treated
FS treated
Offsite sanitation
Onsite sanitation
Open defecation 1%
Local area Neighbourhood City 80%
20%
WW contained22%
WW contained – delivered to treatment 22%
FS delivered to treatment 11%
FS not contained 78%
FS not contained – emptied 37%
FS not contained 40%
FS not delivered to treatment 26%
WW not treated 13%
3509
[ ]48
A Be t t e r Wor l d
Water from vacuum toilets is treated together with organic waste, for instance organic oil from restaurants, to produce biogas and fertiliser. Greywater is treated separately and used for urban greening and to improve the quality of recreational areas. A range of urban agencies need to cooperate to make this innovation possible, including the urban utility for wastewater, the city’s stakeholder responsible for organic waste, urban planners and the urban department of the environment
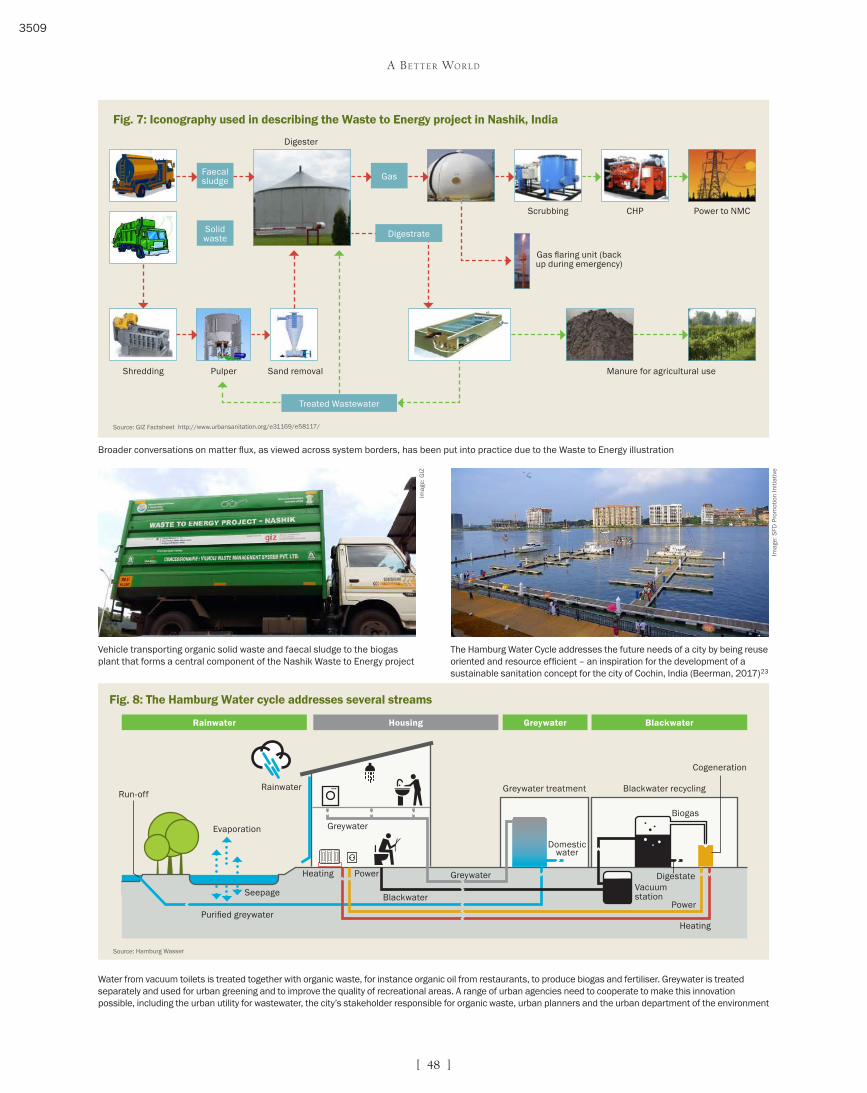
Broader conversations on matter flux, as viewed across system borders, has been put into practice due to the Waste to Energy illustration
Vehicle transporting organic solid waste and faecal sludge to the biogas plant that forms a central component of the Nashik Waste to Energy project
The Hamburg Water Cycle addresses the future needs of a city by being reuse oriented and resource efficient – an inspiration for the development of a sustainable sanitation concept for the city of Cochin, India (Beerman, 2017)23
Fig. 7: Iconography used in describing the Waste to Energy project in Nashik, India
Fig. 8: The Hamburg Water cycle addresses several streams
Source: GIZ Factsheet http://www.urbansanitation.org/e31169/e58117/
Imag
e: S
FD P
rom
otio
n In
itiat
ive
Imag
e: G
IZ
Rainwater Housing Greywater Blackwater
Digester
Gas flaring unit (back up during emergency)
Scrubbing CHP Power to NMC
Manure for agricultural useSand removalShredding Pulper
Treated Wastewater
Faecal sludge
Solid waste
Gas
Digestrate
Run-off
Evaporation
Seepage
Purified greywater
Rainwater
Heating
Heating
Power
Power
Greywater
Greywater
Greywater treatment
Digestate Vacuum station
Biogas
Domestic water
Blackwater recycling
Cogeneration
Blackwater
Source: Hamburg Wasser
3509
[ ]49
acc e s s to wat e r a n d sa ni tat ion for a l l
Case history 2: The Hamburg Water CycleThe innovative Hamburg Water Cycle® is an example of closed-loop wastewater management, demonstrating how wastewater can be handled in an economically and environ-mentally responsible way by unlocking synergies between sustainable sanitation, energy and resource efficiency. The key elements are the separate handling of household water flows and utilising their energy content locally. Europe’s largest project showcasing the benefits of closed loop waste water manage-ment is the newly designed Jenfelder Au quarter, a residential area in Hamburg which has provided homes for approximately 800 families. In its use of toilets as the starting point for renew-
able energy, the project is seen by the local government as a forward looking form of sanitation, that addresses the future needs of the city by being reuse oriented and resource efficient.
While still in its implementation phase in Hamburg, the Hamburg Water Cycle24 has already positively influenced other cities.23 For example Cochin, India, where a concept is being discussed that would follow the same principles. Here, septic tanks would collect only toilet water which would be transported to specific stations for the management of organic material from different streams, while greywater would be kept separate and treated in decentral facilities with options for local reuse, for instance in improving the urban environment.
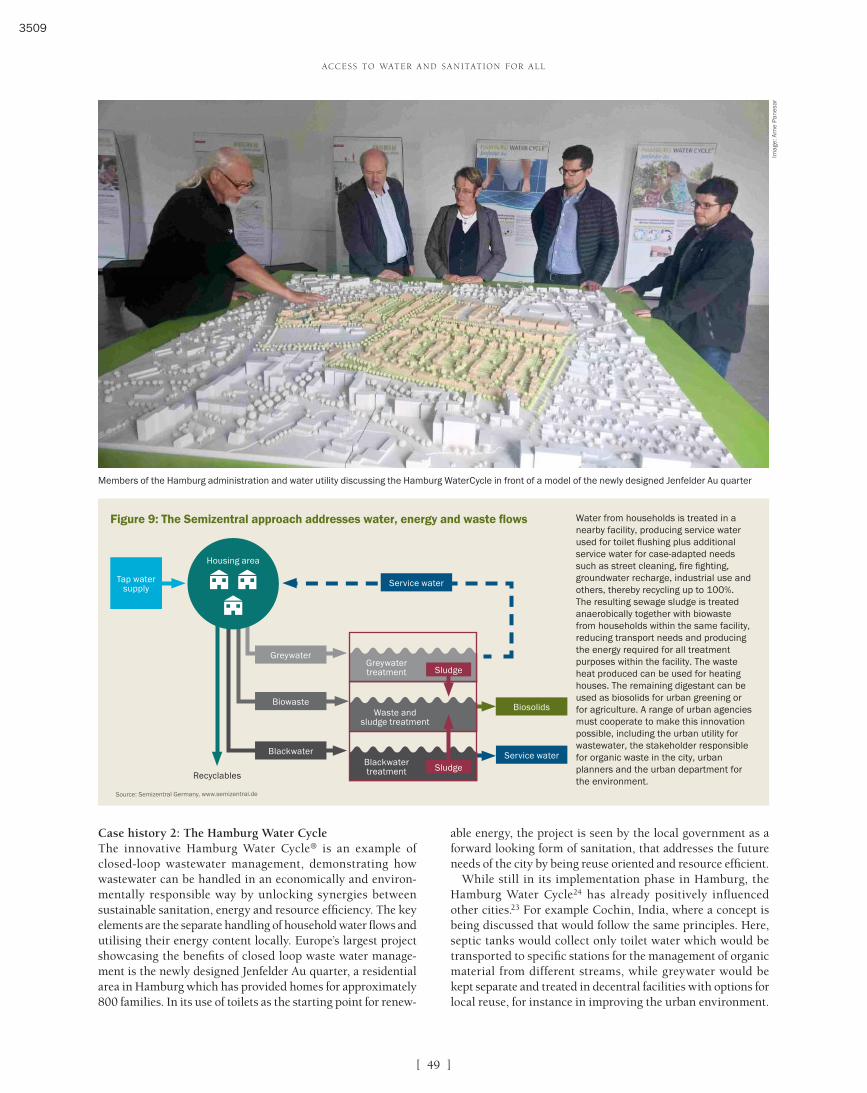
Members of the Hamburg administration and water utility discussing the Hamburg WaterCycle in front of a model of the newly designed Jenfelder Au quarter
Water from households is treated in a nearby facility, producing service water used for toilet flushing plus additional service water for case-adapted needs such as street cleaning, fire fighting, groundwater recharge, industrial use and others, thereby recycling up to 100%. The resulting sewage sludge is treated anaerobically together with biowaste from households within the same facility, reducing transport needs and producing the energy required for all treatment purposes within the facility. The waste heat produced can be used for heating houses. The remaining digestant can be used as biosolids for urban greening or for agriculture. A range of urban agencies must cooperate to make this innovation possible, including the urban utility for wastewater, the stakeholder responsible for organic waste in the city, urban planners and the urban department for the environment.
Figure 9: The Semizentral approach addresses water, energy and waste flows
Source: Semizentral Germany, www.semizentral.de
Imag
e: A
rne
Pan
esar
Service water
Biosolids
Housing area
Tap water supply
Greywater treatment
Waste and sludge treatment
Blackwater treatment
Greywater
Biowaste
Recyclables
Blackwater
Service water
Sludge
Sludge
3509
[ ]50
A Be t t e r Wor l d
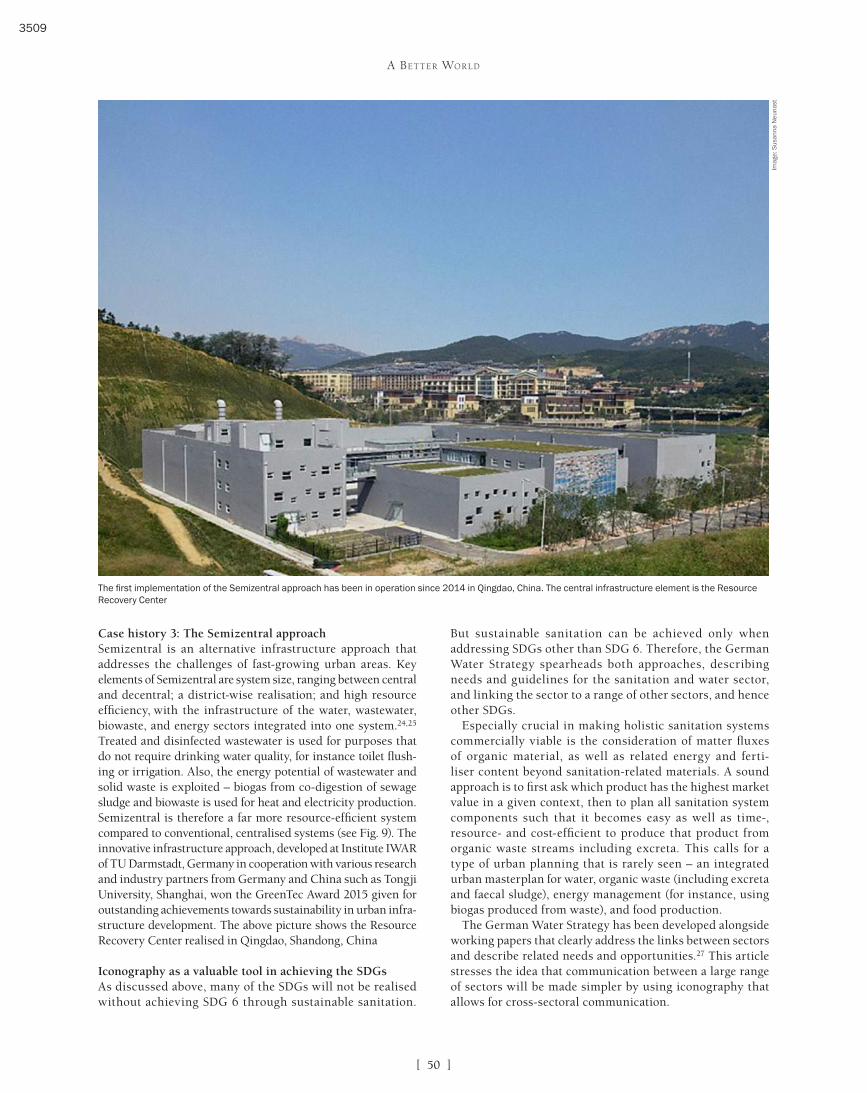
Case history 3: The Semizentral approachSemizentral is an alternative infrastructure approach that addresses the challenges of fast-growing urban areas. Key elements of Semizentral are system size, ranging between central and decentral; a district-wise realisation; and high resource efficiency, with the infrastructure of the water, wastewater, biowaste, and energy sectors integrated into one system.24,25 Treated and disinfected wastewater is used for purposes that do not require drinking water quality, for instance toilet flush-ing or irrigation. Also, the energy potential of wastewater and solid waste is exploited – biogas from co-digestion of sewage sludge and biowaste is used for heat and electricity production. Semizentral is therefore a far more resource-efficient system compared to conventional, centralised systems (see Fig. 9). The innovative infrastructure approach, developed at Institute IWAR of TU Darmstadt, Germany in cooperation with various research and industry partners from Germany and China such as Tongji University, Shanghai, won the GreenTec Award 2015 given for outstanding achievements towards sustainability in urban infra-structure development. The above picture shows the Resource Recovery Center realised in Qingdao, Shandong, China
Iconography as a valuable tool in achieving the SDGsAs discussed above, many of the SDGs will not be realised without achieving SDG 6 through sustainable sanitation.
But sustainable sanitation can be achieved only when addressing SDGs other than SDG 6. Therefore, the German Water Strategy spearheads both approaches, describing needs and guidelines for the sanitation and water sector, and linking the sector to a range of other sectors, and hence other SDGs.
Especially crucial in making holistic sanitation systems commercially viable is the consideration of matter fluxes of organic material, as well as related energy and ferti-liser content beyond sanitation-related materials. A sound approach is to first ask which product has the highest market value in a given context, then to plan all sanitation system components such that it becomes easy as well as time-, resource- and cost-efficient to produce that product from organic waste streams including excreta. This calls for a type of urban planning that is rarely seen – an integrated urban masterplan for water, organic waste (including excreta and faecal sludge), energy management (for instance, using biogas produced from waste), and food production.
The German Water Strategy has been developed alongside working papers that clearly address the links between sectors and describe related needs and opportunities.27 This article stresses the idea that communication between a large range of sectors will be made simpler by using iconography that allows for cross-sectoral communication.
The first implementation of the Semizentral approach has been in operation since 2014 in Qingdao, China. The central infrastructure element is the Resource Recovery Center
Imag
e: S
usan
na N
euna
st
3509

[ ]51
acc e s s to wat e r a n d sa ni tat ion for a l l
Endnotes
1 SuSanA (2017). Contribution of sustainable sanitation to the Agenda 2030 for sustainable development - SuSanA Vision Document 2017. Sustainable Sanitation Alliance (SuSanA) secretariat, Eschborn, Germany.
2 SuSanA (2017). Sustainable sanitation and the SDGs: Interlinkages and opportunities. Sustainable Sanitation Alliance (SuSanA) secretariat, Eschborn, Germany.
3 Rohilla, S. K., Luthra, B., Varma, R. S., Padhi S. K. (2016). SFD Report - Tiruchirappalli, India - SFD Promotion Initiative. Centre for Science and Environment (CSE), New Delhi, India.
4 Furlong, C. (2016). SFD Report - Dhaka, Bangladesh - SFD Promotion Initiative. Water, Engineering and Development Centre (WEDC), Leicestershire, UK.
5 Hassib, Y., Roeder, L. (2015). SFD Report - Moshi, Tanzania - SFD Promotion Initiative. Deutsche Gesellschaft für Internationale Zusammenarbeit (GIZ) GmbH, Eschborn, Germany.
6 Scott, P., Cotton, A., & Sohail, M. (2015). Using tenure to build a “sanitation cityscape”: Narrowing decisions for targeted sanitation interventions. Environment and Urbanization, 27(2), pp.389-406.
7 Peal, A., Evans, B. E., Blackett, I., Hawkins, P., & Heymans, C. (2014). Fecal sludge management (FSM): Analytical tools for assessing FSM in cities. Journal of Water, Sanitation and Hygiene for Development, 4(3), 371-383. doi:10.2166/washdev.2014.139
8 Peal, A., Evans, B. E., Blackett, I., Hawkins, P., & Heymans, C. (2014). Fecal sludge management: A comparative assessment of 12 cities. Journal of Water, Sanitation and Hygiene for Development, 4(4), 563-575. doi:10.2166/washdev.2014.026
9 Down to Earth Magazine (2016). Pipe Dream. Down to Earth Magazine, December 16, New Delhi, India.
10 Down to Earth Magazine (2016). Dirty Tricks. Down to Earth Magazine, April 15, New Delhi, India.
11 MoUD (2016). Primer on faecal sludge & septage management. Ministry of Urban Development, New Delhi, Government of India.
12 Ohler, S. (2017). SuSanA 10th Anniversary Report. Sustainable Sanitation Alliance (SuSanA) secretariat, Eschborn, Germany.
13 Tilley, E., Lüthi, C., Morel, A., Zurbrügg, C., & Schertenleib, R. (2008). Compendium of Sanitation Systems and Technologies. Swiss Federal Institute of Aquatic Science and Technology (Eawag), Dübendorf, Switzerland.
14 Esrey, S.A., Andersson, I., Hillers, A., & Sawyer, R. (2001). Closing the loop. Ecological sanitation for food security. SIDA, Stockholm, Sweden.
15 GTZ & IWA (2003). Ecosan - closing the loop - Proceedings of the 2nd international symposium, 7th –11th April 2003, Lübeck, Germany. Deutsche Gesellschaft für Technische Zusammenarbeit (GTZ) GmbH and International Water Association (IWA).
16 Lange, J., & Otterpohl, R. (1996). Abwasser-Handbuch zu einer zukunftsfähigen Wasserwirtschaft. First edition, Mallbeton Verlag, Donaueschingen, Germany.
17 UNESCO/IHP & GTZ (2006). Capacity Building for Ecological Sanitation - Concepts for ecologically sustainable sanitation in formal and continuing educa-tion. International Hydrological Programme (IHP) of the United Nations and Deutsche Gesellschaft für Technische Zusammenarbeit (GTZ) GmbH, Eschborn, Germany.
18 Shaeffer, J.R., & Stevens, L.A. (1983). Future Water. William Morrow and Co., New York, USA.
19 BMZ (2017). BMZ Water Strategy. A key contribu-tion to implementing the 2030 Agenda and the Paris Agreement. Federal Ministry for Economic Cooperation and Development (BMZ), Bonn, Germany.
20 Walther D., & Yadav, J. (2014). Waste to energy project co-fermentation of organic waste and septage for energy production in Nashik - factsheet. Deutsche Gesellschaft für Internationale Zusammenarbeit (GIZ) GmbH. Accessible online: http://www.urbansanitation.org/e31169/e58117/
21 Roeder, L. (2016). SFD Report - Kochi, India - SFD Promotion Initiative. Deutsche Gesellschaft für Internationale Zusammenarbeit (GIZ) GmbH.
22 GIZ (2011). City Sanitation Plan for Nashik. Deutsche Gesellschaft für Internationale Zusammenarbeit (GIZ) GmbH India, Support to the Urban National Sanitation (SNUSP) II Program.
23 Beermann, J. (2017). Urban Cooperation and Climate Governance: How German and Indian Cities Join Forces to Tackle Climate Change, p. 164, Springer.
24 Augustin, K., Skambraks, A.K., Li, Z., Giese, T., Rakelmann, U., Schonlau, H., & Günner, C. (2011). Hamburg water cycle in the settlement Jenfelder Au – integrating the infrastructure services of water and energy. IWA Conference cities of the future: Sustainable urban planning and water management, Stockholm, Sweden.
25 Tolksdorf, J., & Cornel, P. (2017). Semicentralized grey-water and blackwater treatment for fast growing cities: How uncertain influent characteristics might affect the treatment processes, Water Science and Technology, 75(7), 1722-1731. doi: 10.2166/wst.2017.047
26 Tolksdorf, J., Bieker, S., & Cornel, P. (2016). Implementation of SEMIZENTRAL: An Integrated Infrastructure Approach for Fast-Growing Cities. Dresden Nexus Conference Working Paper Series DNC2015/02, edited by Hiroshan Hettiarachchi. Dresden, Germany: United Nations University Institute for Integrated Management of Material Fluxes and of Resources (UNU-FLORES).
27 Lüthi, C., Panesar, A., Schütze, T., Norström, A., McConville, J., Parkinson, J., Saywell, D., & Ingle, R. (2011). Sustainable sanitation in cities: A framework for action. Sustainable Sanitation Alliance (SuSanA), International Forum on Urbanism (IFoU), Papiroz Publishing House, The Hague, The Netherlands.
3509


