
Technische Universität Wien
A-1040 Wien ▪ Karlsplatz 13 ▪ Tel. +43-1-58801-0 ▪ www.tuwien.ac.at
Self-organizing Knowledge & Skill Management with an Enterprise Social Network
DIPLOMARBEIT
zur Erlangung des akademischen Grades
Magister rerum socialium oeconomicarumque
im Rahmen des Studiums
Informatikmanagement
eingereicht von
Markus Paulhart BSC. Matrikelnummer 0325357
an der Fakultät für Informatik der Technischen Universität Wien Betreuung Betreuer/in: Ass.Prof. Dr. Monika Di Angelo Wien, TT.MM.JJJJ (Unterschrift Verfasser/in) (Unterschrift Betreuer/in)
Die approbierte Originalversion dieser Diplom-/ Masterarbeit ist in der Hauptbibliothek der Tech-nischen Universität Wien aufgestellt und zugänglich.
http://www.ub.tuwien.ac.at
The approved original version of this diploma or master thesis is available at the main library of the Vienna University of Technology.
http://www.ub.tuwien.ac.at/eng

Technische Universität Wien
A-1040 Wien ▪ Karlsplatz 13 ▪ Tel. +43-1-58801-0 ▪ www.tuwien.ac.at
Self-organizing Knowledge & Skill Management with an Enterprise Social Network
MASTER THESIS
for the acquisition of the academic degree
Magister rerum socialium oeconomicarumque
within the scope of the studies
Computer Science Management
submitted by
Markus Paulhart BSC. Matriculation number 0325357
on the Faculty of Informatics at the Vienna University of Technology Supervision Supervisor: Ass.Prof. Dr. Monika Di Angelo Vienna, TT.MM.JJJJ (Signature Author) (Signature Supervisor)

Author: Markus Paulhart Page I
Erklärung zur Verfassung der Arbeit
Markus Paulhart BSC., Palffygasse 3/8 1170 Wien
„Hiermit erkläre ich, dass ich diese Arbeit selbständig verfasst habe, dass ich die
verwendeten Quellen und Hilfsmittel vollständig angegeben habe und dass ich die Stellen
der Arbeit einschließlich Tabellen, Karten und Abbildungen, die anderen Werken oder dem
Internet im Wortlaut oder dem Sinn nach entnommen sind, auf jeden Fall unter Angabe der
Quelle als Entlehnung kenntlich gemacht habe.“
______________________
Ort, Datum, Unterschrift

Self-organizing Knowledge & Skill Management with an Enterprise Social Network
Author: Markus Paulhart Page III
Danksagung
Ich möchte hier die Gelegenheit nutzen mich bei meinen Eltern und Großeltern zu
bedanken, die an mich geglaubt haben und durch die mein Studium überhaupt erst
möglich wurde.
Mein herzlicher Dank gebührt auch meiner Freundin Anna Katharina, die sich bereit
erklärt hat meine Diplomarbeit gegenzulesen, sich nicht gescheut hat Kritik zu üben
und Verbesserungsvorschläge vorzubringen und mir auch moralisch immer zu Seite
gestanden hat.
Außerdem bedanke ich mich auch bei meiner Betreuerin Ass.Prof. Dr. Monika Di
Angelo für die tatkräftige Unterstützung bei der Erstellung dieser Arbeit und auch M.
P. Koch für die Möglichkeit diese Arbeit überhaupt durchzuführen.

Self-organizing Knowledge & Skill Management with an Enterprise Social Network
Author: Markus Paulhart Page V
Abstract
Social network is a well-known term for a communication form in private
environments. Since several years this technology is used increasingly in the
business sector in order to support the employees by enhancing communication with
colleagues, supporting the user to find, learn and organize knowledge and also to
show personal skills in a more transparent way.
The purpose of this master thesis is to evaluate how promising and successful an
implementation of such a technology in a business environment can be. Also part of
this work was the question about what kind of forecast for adapting social networks as
an internal business communication tool can be derived is.
As a representative business social networking tool My Site, as part of the Enterprise
Content Management (ECM) SharePoint, was chosen. The evaluation itself was
carried out with the people of the YPP group by answering six surveys using the
survey feature in SharePoint. For a proper analysis of the data a suitable tool had to
be evaluated. Eventually the analysis was performed with the QlikView application
SPSurvey Dashboard.
The content of the surveys is about the use of SharePoint, their opinions on business
social networks as well as the functionality and usability of the My Site software.
The data analysis shows that the benefits of business embedded social networks
were clearly recognized by the participants. Therefore social networks are a promising
communication tool to be implemented in a company and may very well succeed in
business environments.


Self-organizing Knowledge & Skill Management with an Enterprise Social Network
Author: Markus Paulhart Page VII
Kurzfassung
Das Soziale Netzwerk ist ein bekannter Begriff für Kommunikationsformen im privaten
Umfeld. Seit einigen Jahren wird diese Technologie auch im Geschäftsbereich
verwendet um die ArbeitnehmerInnen zu unterstützen. Dies erfolgt dadurch indem die
Kommunikation unter den MitarbeiterInnen verbessert wird, die BenutzerInnen dabei
unterstützt werden Wissen zu finden, zu lernen und zu organisieren sowie ihre
eigenen Fähigkeiten transparenter darzustellen.
Das Ziel der Diplomarbeit ist es zu evaluieren, wie vielversprechend und erfolgreich
die Implementierung einer solchen Technologie im Geschäftsumfeld sein kann.
Weiters ist auch eine vorrauschauende Aussage über die Integration von sozialen
Netzwerken als internes Kommunikationsmedium Teil dieser Arbeit.
Als repräsentatives soziales Firmen-Netzwerk wurde My Site als Teil des
Unternehmenscontentverwaltungsprogramm SharePoint ausgewählt. Die Evaluierung
selbst ist mit Personen aus der YPP Gruppe durchgeführt worden. Dabei wurden
sechs Fragebögen evaluiert welche mittels der Fragebogen Funktion von SharePoint
erstellt wurden. Ebenso musste ein passendes Tool zur Analyse der Daten gefunden
werden. Schlussendlich wurde die Analyse mit der QlikView Applikation SPSurvey
Dashboard durchgeführt.
Der Inhalt der Umfragen dreht sich um die Verwendung von SharePoint, die
Meinungen der Teilnehmer zu sozialen Firmen-Netzwerken sowie auch über die
Funktionalität und Handhabung von My Site.
Die Analyse der Daten hat gezeigt, dass die Benutzer durchaus die Vorteile eines
sozialen Firmen-Netzwerks erkennen. Daraus lässt sich schließen, dass soziale
Netzwerke vielversprechende Kommunikationswerkzeuge sein können, die sich auch
für die Verwendung in einer Firma eignen. Dadurch haben sie ebenfalls gute Chancen
in einem Firmenumfeld erfolgreich zu sein.

Self-organizing Knowledge & Skill Management with an Enterprise Social Network
Author: Markus Paulhart Page 1 | 111
Table of Contents
1 INTRODUCTION ............................................................................................................. 5
1.1 PROBLEM STATEMENT .................................................................................................... 5
1.2 EXPECTED RESULT ......................................................................................................... 6
1.3 STRUCTURE OF THE MASTER THESIS................................................................................ 6
2 STATE OF THE ART ....................................................................................................... 9
2.1 ENTERPRISE 2.0 ........................................................................................................... 10
2.2 STRONG AND WEAK TIES IN ENTERPRISE SOCIAL NETWORKS ........................................... 11
2.3 ENTERPRISE SOCIAL NETWORKS ................................................................................... 12
2.4 EVALUATION OF EXPERIENCE ........................................................................................ 13
2.4.1 Quantitative method for collecting data ................................................................. 14
2.4.2 Qualitative method for collecting data ................................................................... 14
3 METHODOLOGICAL APPROACH ............................................................................... 15
3.1 CREATE A CONCEPT FOR THE CONTENT OF THE SURVEYS ............................................... 15
3.2 EVALUATING A PLATFORM FOR CREATING THE SURVEYS ................................................. 15
3.3 EVALUATE AN APPROPRIATE TOOL FOR THE SURVEY ANALYSIS ........................................ 16
3.4 CREATE LEARNING MATERIALS ...................................................................................... 16
3.5 IMPLEMENT AND ROLL OUT THE SURVEYS ....................................................................... 16
3.6 EVALUATE THE DATA ..................................................................................................... 17
4 PREPARATION ............................................................................................................. 19
4.1 THE DATA..................................................................................................................... 19
4.1.1 Social Network in a business environment ........................................................... 20
4.1.2 My Site in SharePoint 2010 .................................................................................. 21
4.1.3 Surveys ................................................................................................................ 22
4.1.3.1 0 - Getting Started .......................................................................................................................... 23
4.1.3.2 Part 1 - Overview ............................................................................................................................ 24
4.1.3.3 Part 2 - My Profile ........................................................................................................................... 25
4.1.3.4 Part 3 - Tags, Notes and Bookmarks .............................................................................................. 26
4.1.3.5 Part 4 - Colleagues, Membership and Organization ....................................................................... 27
4.1.3.6 Part X – Conclude ........................................................................................................................... 28
Self-organizing Knowledge & Skill Management with an Enterprise Social Network
Author: Markus Paulhart Page 2 | 111
4.2 SELECTION OF AN APPROPRIATE TOOL ........................................................................... 29
4.2.1 SharePoint ........................................................................................................... 29
4.2.1.1 Analysis of surveys with SharePoint ............................................................................................... 29
4.2.2 QlikView Application SPSurvey Dashboard .......................................................... 30
4.2.2.1 Analysis of surveys with QlikView ................................................................................................... 31
4.2.3 Conclusion ........................................................................................................... 32
4.3 ANALYTIC TOOL ............................................................................................................ 33
4.3.1 Application architecture ........................................................................................ 33
4.3.2 Software-Architecture ........................................................................................... 34
4.3.3 Data model ........................................................................................................... 36
5 ANALYSIS..................................................................................................................... 37
5.1 ALL SURVEYS COMBINED .............................................................................................. 37
5.2 SURVEY 1: GETTING STARTED ...................................................................................... 39
5.2.1 Question 1 - Experience in SharePoint ................................................................. 42
5.2.2 Question 2 - Usage of SharePoint ........................................................................ 43
5.2.3 Question 3 - Intention of using SharePoint ........................................................... 44
5.2.4 Question 4 - Acceptance of SharePoint around colleagues .................................. 45
5.2.5 Question 5 - Use of social networking products .................................................... 46
5.2.6 Question 6 - My Site experience ........................................................................... 47
5.2.7 Question 7 - My Site use ...................................................................................... 48
5.2.8 Question 8 - Used My Site parts ........................................................................... 49
5.2.9 Question 9 - Intention to use My Site .................................................................... 50
5.2.10 Question 10 - Acceptance among colleagues of My Site ................................... 51
5.2.11 Question 11 – Strong / Weak spots of social networking in SharePoint ............. 52
5.2.12 Question 12 – Success of social networks in a company .................................. 53
5.2.13 Question 13 – A social network forecast ........................................................... 54
5.3 SURVEY 2: PART 1 - OVERVIEW ..................................................................................... 55
5.3.1 Question 1 – First impression ............................................................................... 58
5.3.2 Question 2 – User-friendly .................................................................................... 59
5.3.3 Question 3 – Meaningful function ......................................................................... 60
5.4 SURVEY 3: PART 2 – MY PROFILE ................................................................................. 61
5.4.1 Question 1 – Profile configuration ......................................................................... 63
5.4.2 Question 2 – Editable profile fields ....................................................................... 64
Self-organizing Knowledge & Skill Management with an Enterprise Social Network
Author: Markus Paulhart Page 3 | 111
5.4.3 Question 3 – Privacy options ................................................................................ 65
5.4.4 Question 4 – Meaning of additional profile information ......................................... 66
5.5 SURVEY 4: PART 3 – TAGS, NOTES & BOOKMARKS ........................................................ 67
5.5.1 Question 1 – Previous experiences with tagging .................................................. 69
5.5.2 Question 2 – Usefulness of tagging ...................................................................... 70
5.5.3 Question 3 – Believe in tagging ............................................................................ 71
5.5.4 Question 4 – Keep track of pages and content ..................................................... 72
5.5.5 Question 5 – Access tags, notes and My Links .................................................... 73
5.5.6 Question 6 – Process of tagging and writing notes ............................................... 74
5.5.7 Question 7 – Notes as an addition to e-mail ......................................................... 75
5.5.8 Question 8 – Usefulness of My Link ..................................................................... 76
5.6 SURVEY 5: PART 4 - COLLEAGUES, MEMBERSHIP AND ORGANIZATION ............................. 76
5.6.1 Question 1 – Managing colleagues ...................................................................... 79
5.6.2 Question 2 – Usefulness of membership web part................................................ 80
5.6.3 Question 3 – Usefulness of the organization chart................................................ 81
5.7 SURVEY 6: CONCLUDE .................................................................................................. 82
5.7.1 Question 1 – Useful My Site parts ........................................................................ 85
5.7.2 Question 2 – Suitable business embedded social networking features ................. 86
5.7.3 Question 3 – My Site in comparison ..................................................................... 87
5.7.4 Question 4 – My Site design ................................................................................. 88
5.7.5 Question 5 – Intention to use My Site ................................................................... 90
5.7.6 Question 6 – Success of social networks ............................................................. 91
6 SUMMARY & RESULTS ............................................................................................... 93
6.1 PARTICIPANTS .............................................................................................................. 93
6.2 FIRST STEPS ................................................................................................................ 94
6.3 SOCIAL NETWORKS ON THE BASIS OF MY SITE ................................................................ 95
6.3.1 Summary .............................................................................................................. 96
6.4 ARE BUSINESS EMBEDDED SOCIAL NETWORKS PROMISING? ............................................ 96
7 OUTLOOK ..................................................................................................................... 99
7.1 WHAT KIND OF FORECAST CAN BE DERIVED FROM THE EVALUATION ................................. 99
7.2 NEXT STEPS ............................................................................................................... 100
8 BIBLIOGRAPHY ......................................................................................................... 101

Self-organizing Knowledge & Skill Management with an Enterprise Social Network
Author: Markus Paulhart Page 4 | 111
9 TABLE OF FIGURES .................................................................................................. 105
10 LIST OF TABLES ..................................................................................................... 109
11 LIST OF ABBREVIATIONS...................................................................................... 111
1 Introduction
Author: Markus Paulhart Page 5 | 111
1 Introduction
1.1 Problem statement
Social networks were introduced at the beginning of the ‘80s with CBBS (Computer
Bulletin Board System), which was a simple online meeting place. However, starting
with the website Friendster in 2002 and followed up by his successor Facebook in
2004, Social Networks became a well-known term in the WEB. (Goble 2012)
Social Networks focus on collaboration, knowledge sharing and present user
information via profile on the web. (Boyd and Ellison 2007) Therefore they influence
our way of life and the way we communicate. Not surprisingly Social Networks are a
very large and successful business. For example Facebook has more than 1.1 Billions
of monthly active users and the revenue in 2012 was over $5 Billion. (Statistic Brain
2013)
Companies are trying to implement this concept to raise “their effectiveness, market
value, and sales revenue.” (Fidelman 2013) Therefore they have to change their
business into a so called Social Business. In order to be a social business it is not
only important to be represented via social media to the customer, for example by
using Facebook as a platform for business purposes, but also to use social networks
for internal purposes of the company. This means to use social networking tools and
concepts to support the communication and knowledge transfer between employees
in the company. The last task is hard to accomplish as it means to also change and
transform the way companies are leading their employees.
This leads to the following scientific questions:
Is the employees’ approval of the pilot social network platform sufficiently promising to consider implementing this technology into the business processes? Furthermore, what kind of forecast can be derived for adapting this concept of social communication, self-organizing knowledge and skill management in an intranet business environment?
1 Introduction
Author: Markus Paulhart Page 6 | 111
1.2 Expected result
The aim of the master thesis is to evaluate the applicability and advantages of social
networks in a business environment. The final goal is to understand the benefits for
the employees in using such tools for knowledge transfer, business communication
and for finding people with the right skills in a company environment.
The evaluation is done by means of a quantitative questioning method, called
surveys. It should identify the acceptance of Social Networks in a business
environment by using a suitable tool of an ECM (Enterprise Content Management
System). Therefore the surveys also take the business context of the participants into
account to determine whether their background has any influence on their opinion or
experience.
With these surveys additional information is collected on how this technology
enhances the way users gather, distribute and become aware of knowledge. By the
following analysis, this new way of transferring knowledge throughout the company
will be evaluated. In general it means to evaluate how employees can enhance the
way they learn and benefit from each other by using Social Networks in a business
environment.
1.3 Structure of the master thesis
This work is divided into seven chapters. Chapter 2 describes the state-of-the-art in
communication in a business environment, Enterprise 2.0, emerged collaboration as
well as Enterprise Social Networks. This is followed by the methodological approach
of this thesis in Chapter 3.
Chapter 4 and 5 are dealing with the practical part of the master thesis:
Preparation – Explains the six surveys and where the data is coming from.
Additionally the process to choose the right tool for the analysis of the surveys
is also shown here.

1 Introduction
Author: Markus Paulhart Page 7 | 111
Analysis – Evaluation of the surveys with the QlikView SPSurvey Dashboard
solution.
After the survey data is analyzed the results are summarized in chapter 6 Summary &
Results. Additionally a conclusion focusing on answering the scientific question is
given in this chapter. Finally the last chapter 7 Outlook provides a prospect of the
future of social networks in a business environment as well as possible next steps.

2 State of the Art
Author: Markus Paulhart Page 9 | 111
2 State of the Art
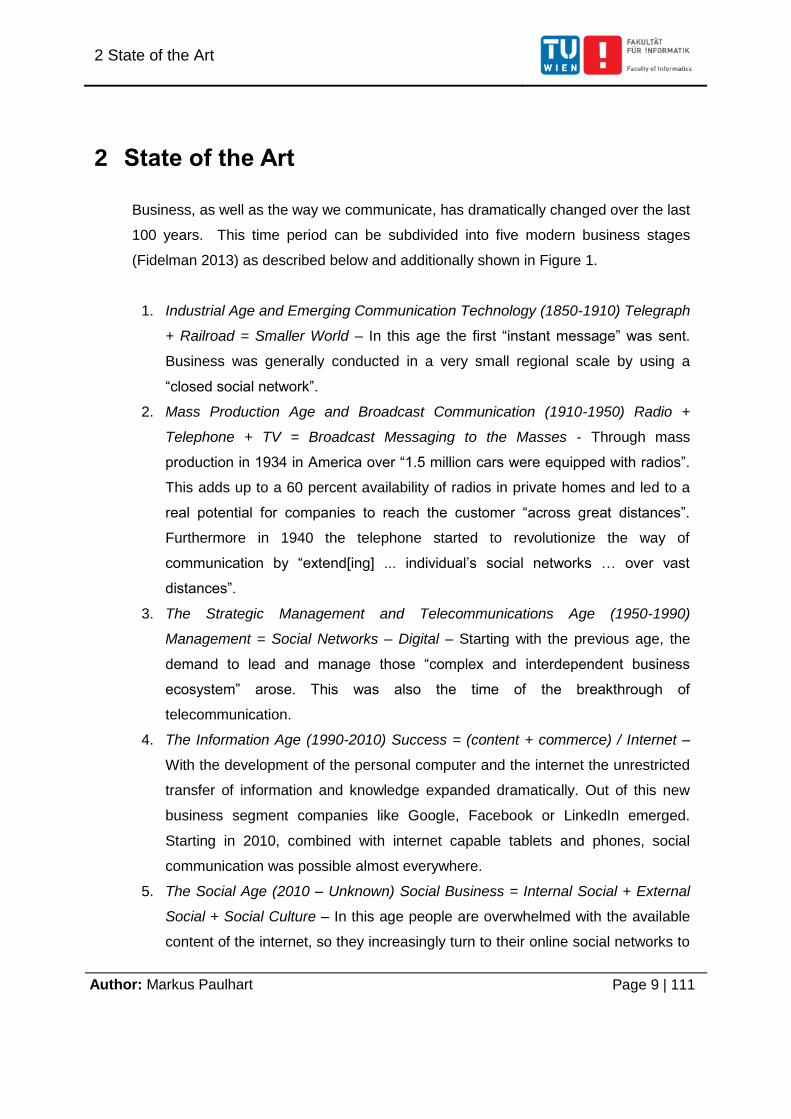
Business, as well as the way we communicate, has dramatically changed over the last
100 years. This time period can be subdivided into five modern business stages
(Fidelman 2013) as described below and additionally shown in Figure 1.
1. Industrial Age and Emerging Communication Technology (1850-1910) Telegraph
+ Railroad = Smaller World – In this age the first “instant message” was sent.
Business was generally conducted in a very small regional scale by using a
“closed social network”.
2. Mass Production Age and Broadcast Communication (1910-1950) Radio +
Telephone + TV = Broadcast Messaging to the Masses - Through mass
production in 1934 in America over “1.5 million cars were equipped with radios”.
This adds up to a 60 percent availability of radios in private homes and led to a
real potential for companies to reach the customer “across great distances”.
Furthermore in 1940 the telephone started to revolutionize the way of
communication by “extend[ing] ... individual’s social networks … over vast
distances”.
3. The Strategic Management and Telecommunications Age (1950-1990)
Management = Social Networks – Digital – Starting with the previous age, the
demand to lead and manage those “complex and interdependent business
ecosystem” arose. This was also the time of the breakthrough of
telecommunication.
4. The Information Age (1990-2010) Success = (content + commerce) / Internet –
With the development of the personal computer and the internet the unrestricted
transfer of information and knowledge expanded dramatically. Out of this new
business segment companies like Google, Facebook or LinkedIn emerged.
Starting in 2010, combined with internet capable tablets and phones, social
communication was possible almost everywhere.
5. The Social Age (2010 – Unknown) Social Business = Internal Social + External
Social + Social Culture – In this age people are overwhelmed with the available
content of the internet, so they increasingly turn to their online social networks to
2 State of the Art
Author: Markus Paulhart Page 10 | 111
control the information flood. Business had to adapt and integrate Social
Networks to reach the customer again. But it doesn’t stop there; also “… the
same social network concepts could be applied within their organizations to
increase employee productivity”.
Figure 1: Summarizing the business ages (Fidelman 2013)
2.1 Enterprise 2.0
In modern companies there is an overwhelming flow of information. “The intranet is
mostly helpful, but sometimes it is too helpful”, because it stores useful and “wrong,
obsolete or irrelevant” information. (Morgan 2012) In order to assist the user in his
search for knowledge many so-called social software platforms promise help. Some of
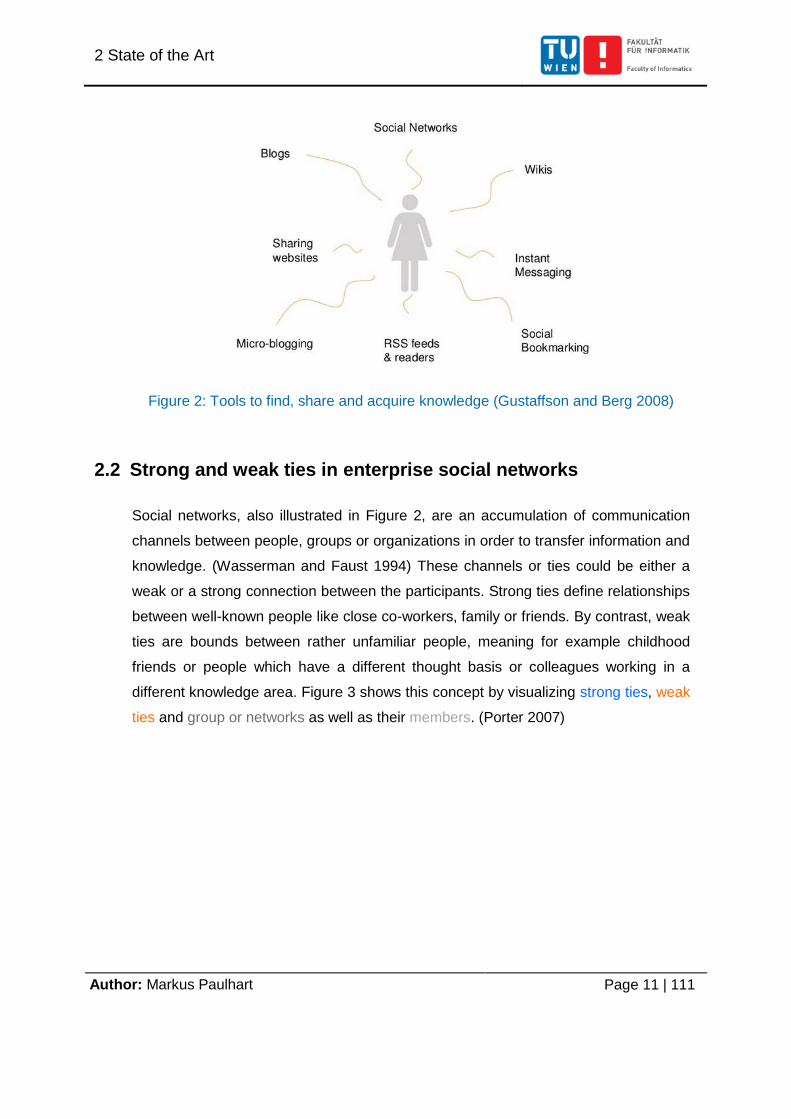
them are listed in Figure 2. This attempt to aid the user is consolidated in the term
Enterprise 2.0. One common definition states: “Enterprise 2.0 is the use of emergent
social software platforms within companies, or between companies and their partners
or customers”. (McAfee 2006) There are also other terms used to describe a social
enterprise, like emergent collaboration which means “new ways of working with
people to create things and solve problems”. (Morgan 2012) Eventually they all try to
describe a more social-orientated and controlled business environment where the
users can store, find, share and acquire knowledge with modern collaborating tools.
2 State of the Art
Author: Markus Paulhart Page 11 | 111
Figure 2: Tools to find, share and acquire knowledge (Gustaffson and Berg 2008)
2.2 Strong and weak ties in enterprise social networks
Social networks, also illustrated in Figure 2, are an accumulation of communication
channels between people, groups or organizations in order to transfer information and
knowledge. (Wasserman and Faust 1994) These channels or ties could be either a
weak or a strong connection between the participants. Strong ties define relationships
between well-known people like close co-workers, family or friends. By contrast, weak
ties are bounds between rather unfamiliar people, meaning for example childhood
friends or people which have a different thought basis or colleagues working in a
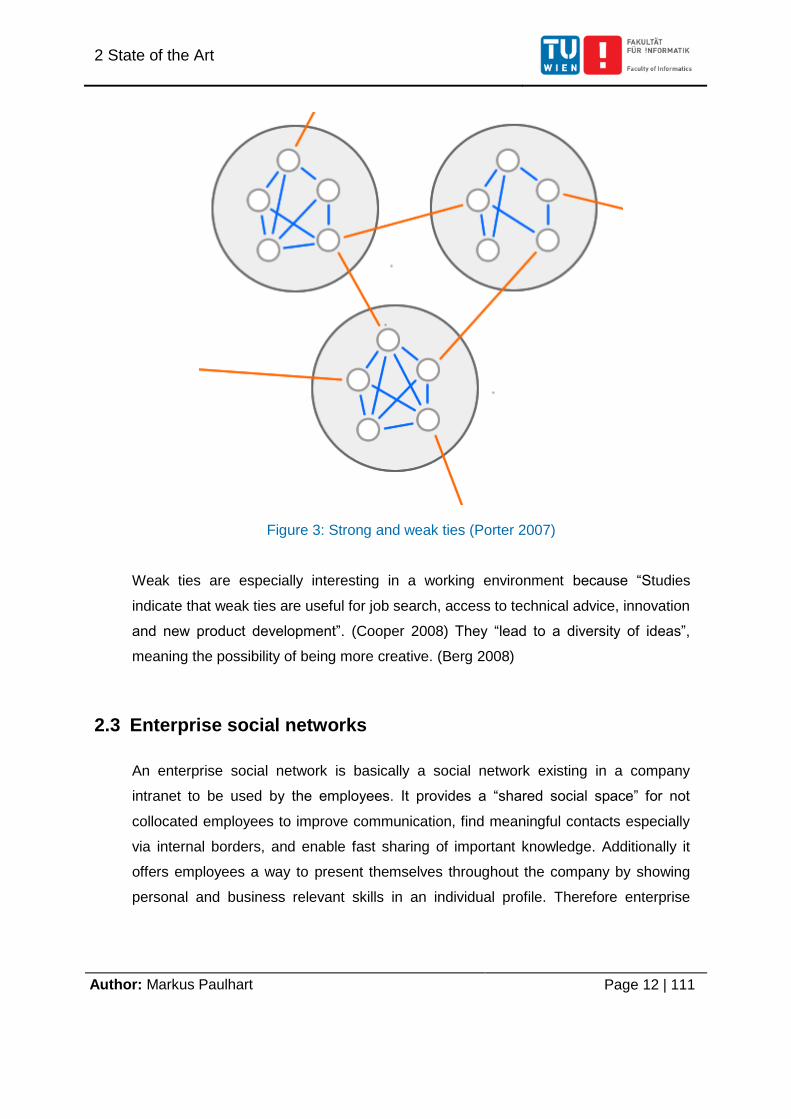
different knowledge area. Figure 3 shows this concept by visualizing strong ties, weak
ties and group or networks as well as their members. (Porter 2007)
2 State of the Art
Author: Markus Paulhart Page 12 | 111
Figure 3: Strong and weak ties (Porter 2007)
Weak ties are especially interesting in a working environment because “Studies
indicate that weak ties are useful for job search, access to technical advice, innovation
and new product development”. (Cooper 2008) They “lead to a diversity of ideas”,
meaning the possibility of being more creative. (Berg 2008)
2.3 Enterprise social networks
An enterprise social network is basically a social network existing in a company
intranet to be used by the employees. It provides a “shared social space” for not
collocated employees to improve communication, find meaningful contacts especially
via internal borders, and enable fast sharing of important knowledge. Additionally it
offers employees a way to present themselves throughout the company by showing
personal and business relevant skills in an individual profile. Therefore enterprise
2 State of the Art
Author: Markus Paulhart Page 13 | 111
social network software can help significantly to detect weak ties, explained in the
previous section 2.2. (Gustaffson and Berg 2008)
2.4 Evaluation of experience
In order to evaluate the usefulness of such an enterprise social network an evaluation
method is required, based on the state-of-the art in empirical research. To provide a
summary the section is based on (Bortz and Döring 2003).
Empirical research searches for knowledge through systematic evaluation of
experience. The expression empirical is originally Greek and means based on
experience; therefore by gathering already available information or experiences new
knowledge can be generated. Another definition states that empirical research
basically collects relevant answers from a varying kind of group of participants by a
previously determined concept. (Mayer 2013)
Before doing an empirical research a scientific hypothesis has to be stated. The word
hypothesis also comes from the Greek language meaning assumption or speculation.
In general hypotheses are used to validate a question or statement, using an
empirical research to determine that answer.
There are several different research methods to evaluate a scientific hypothesis. None
of these methods are a priori good or bad. The quality of the question in the present
context is important. The idea is to search for a method that fits the setting of the
environment in question best, which is why the key of having meaningful answers is to
choose a suitable method to examine the hypothesis.
Empirical research offers two different data acquisitions types. The first one is the
quantitative method such as surveys and the second is the qualitative method for
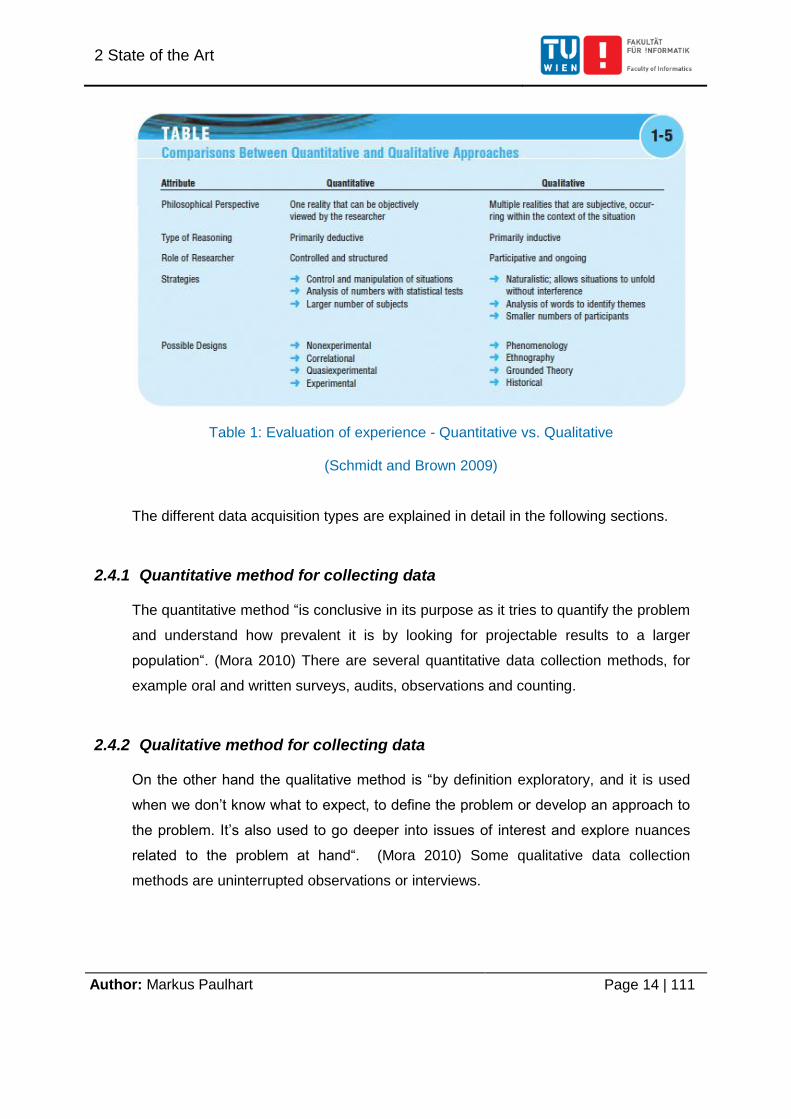
example guided interviews. (Mayer 2013) Table 1 shows a short summary of both
methods.
2 State of the Art
Author: Markus Paulhart Page 14 | 111
Table 1: Evaluation of experience - Quantitative vs. Qualitative
(Schmidt and Brown 2009)
The different data acquisition types are explained in detail in the following sections.
2.4.1 Quantitative method for collecting data
The quantitative method “is conclusive in its purpose as it tries to quantify the problem
and understand how prevalent it is by looking for projectable results to a larger
population“. (Mora 2010) There are several quantitative data collection methods, for
example oral and written surveys, audits, observations and counting.
2.4.2 Qualitative method for collecting data
On the other hand the qualitative method is “by definition exploratory, and it is used
when we don’t know what to expect, to define the problem or develop an approach to
the problem. It’s also used to go deeper into issues of interest and explore nuances
related to the problem at hand“. (Mora 2010) Some qualitative data collection
methods are uninterrupted observations or interviews.
3 Methodological approach
Author: Markus Paulhart Page 15 | 111
3 Methodological approach
A good knowledge basis on empirical research, Enterprise 2.0, emerged collaboration
and especially Enterprise Social Networks serves to create, implement and analyze
the surveys to answer the scientific questions stated in section 1.1. These surveys are
based on the evaluation of the social networking software My Site from the Microsoft
ECM tool SharePoint.
The methodological approach of the master thesis is described by the following
section
3.1 Create a concept for the content of the surveys
First step is to get a clear picture of the information the survey should acquire. Then a
concept for all questions and answers in the surveys is required accompanied by the
preparation of explanatory documents to ensure that the interviewee is able to provide
a suitable feedback.
3.2 Evaluating a platform for creating the surveys
After determining the concept of the surveys a suitable way for presenting the
questions, adapted to the participants, is needed. For this thesis the YPP (Young
Professional Potentials) group was chosen to answer the survey-questions.
YPP is a group of people from all parts of the cooperative company. The main
purpose of the group is to represent all different branches as well as people with
various skills in the company. The task of the group is to contribute and also to
validate the newly introduced intranet system, which is why this group is perfect for
this evaluation.
3 Methodological approach
Author: Markus Paulhart Page 16 | 111
Because the new intranet platform in the cooperative company is the Enterprise
Content Management System Microsoft SharePoint, this platform was also selected to
create surveys for evaluating the social networking component My Site.
3.3 Evaluate an appropriate tool for the survey analysis
A suitable analysis tool to visualize and present the answers given by the participants
needs to be evaluated. The evaluation focuses on the analysis capabilities of
SharePoint and the QlikView application SPSurvey Dashboard. These two solutions
are presented in the master thesis Analysis of Surveys from an Enterprise Content
Management System, on the subject of SharePoint survey data analysis (Paulhart
2014).
3.4 Create learning materials
In addition to the surveys, supplementary material to properly introduce the social
networking feature of the chosen ECM is required. These documents should provide a
basic introduction to certain topics and also work as training material for the
participants before the survey takes place. This way it can be ensured that everyone
can answer the questions properly.
3.5 Implement and roll out the surveys
The next step is to implement the surveys in the chosen ECM and arranging a
suitable timetable for deployment of the training material and the surveys. According
to the predefined timetable, the surveys and the supplementary material will be rolled
out for the participants.

3 Methodological approach
Author: Markus Paulhart Page 17 | 111
3.6 Evaluate the data
Finally the data has to be analyzed with the selected analysis tool to find an answer
on the scientific questions of the master thesis.

4 Preparation
Author: Markus Paulhart Page 19 | 111
4 Preparation
Six surveys were created to capture the opinion regarding social network in a
business environment. In order to collect this information SharePoint 2010 was used
to present the questions and also to gather the answers from the surveys.
Section 4.1 describes data acquisition. Additionally the purpose of the surveys as well
as their content is explained. Section 4.2 presents the process of selecting the
adequate tool for data anlysis as well as the conclusion. The last section 4.3
describes the chosen analysis tool, its structure and how the data will be analyzed.
4.1 The data
The data used in this thesis is provided by the SharePoint 2010 Collaboration Room
YPP (Young Professional Potentials). Collaboration room is a virtual room for
interacting with colleagues, exchanging ideas and storing data. (Paulhart 2014) The
main purpose of this Collaboration Room is to gather people across the company. The
participants are from various departments, which should reflect the different business
backgrounds, their prior knowledge and varying demands. These people were asked
to contribute to the tasks offered through the collaboration room in order to evaluate
SharePoint 2010 as a valid intranet platform.
For better analysis results the participants were divided into seven different groups,
representing the working area of the participants:
Business – People in the business with less knowledge of IT systems
Core Team – Intranet team members. These people administrate Knowledge
management systems
GPMO (Group Project Management Office) – People working on project
management activities
Human Resources – Colleagues from the human resource department
IT - People developing or operating IT software
4 Preparation
Author: Markus Paulhart Page 20 | 111
Marketing – People from the marketing department
Staff Council – People working directly for the staff council
During August 2011 and Mai 2012, while the YPP Collaboration Room was actively
used, six surveys have been carried out by the author of this thesis. These surveys
are required to evaluate two different topics:
Social Network in a business environment
My Site feature in SharePoint 2010
Before going any further, the My Site software requires introduction. It is explained as
“…a personal site that gives you a central location to manage and store your
documents, content, links, and contacts. My Site serves as a point of contact for other
users in your organization to find information about you and your skills and interests.
Content providers can use My Site as a method of customizing the information they
present to users.” (Microsoft, Introduction to My Site)
All questions of the surveys are about the My Site or are built around it like the topic
social network in a business environment. Therefore the data set extracted from these
surveys is called the My Site data or My Site data set. The term data in the remaining
document is always referring to the My Site data.
4.1.1 Social Network in a business environment
The first survey topic is the participants’ opinion on a social network in a business
environment. This should capture the current state of mind on how people feel using a
social networking in a company environment. Additionally it should provide a view on
how this could have an impact on communicating and sharing information in future.
The following questions, asked in the surveys, should especially contribute to an
understanding of this topic:
How intensively are you using other social networking products like Facebook,
Twitter or Xing?
Overall, how do you rate the acceptance among your colleagues of My Site?
4 Preparation
Author: Markus Paulhart Page 21 | 111
What do you consider as strong or weak spots of social networking in
SharePoint?
Do you think that social networks like My Site will succeed in a business
environment?
Do you think it pays off to fill your personal profile with additional data?
How long do you think will it take until at least 80 % of the people in the
company will consistently use a provided social network?
Which My Site parts would you consider as useful in a business embedded
social network like My Site?
Which social networking functions do you rate suitable for a business
environment?
How well are these features covered in My Site? Especially in a business
environment compared to Xing, Facebook, LinkedIn, etc.?
After the training, do you expect the social networking features like My Site to
succeed in a business environment?
4.1.2 My Site in SharePoint 2010
The second topic is the social networking feature My Site in SharePoint 2010 itself. It
deals with the usability and the meaningfulness of these features. Therefore the
participants have been asked about the most important sections and functionalities of
My Site to allow differentiation between the strong and the weak parts of the software.
Therefore the questions focus on features, which should be preserved in future
versions and also which ones could be left out.
The following list represents the different areas of My Site considered in the
questionnaire:
General impression of My Site
Start Page – Is described as a “central location for you to view and manage all
your documents, tasks, links, calendar, colleagues, and other personal
information”. (Microsoft, Introduction to My Site)
My Profile - It shows information on the user, for example the name, personal
picture or telephone number. Furthermore it also contains company based
4 Preparation
Author: Markus Paulhart Page 22 | 111
information like the employees membership to a division or team. (Microsoft,
Edit profile)
Tags, Notes & Bookmarks – Notes are a fast way of spreading short
information instead of using an e-mail, while Tags are categorized links which
also improve the search for knowledge. (Microsoft, Tags and Notes )
My Site Links – This “page allows you to keep track of your favorite Web sites
and access them from any computer on your network”. (Microsoft, Introduction
to My Site)
Colleagues – In My Site users can add or remove colleagues. When adding a
colleague the user can “follow the activities of colleagues” in order to see when
“they tag an interesting article, post a note to someone’s Note Board, or
change job titles “. (Microsoft, Mangae profile)
Memberships – This site “contains a list of all of the distribution lists and sites
you belong to [.] … By using privacy groups, you can restrict who can see your
memberships when they visit your My Site”. (Microsoft, Manage memberships)
Organization Charts – This feature in My Site “display[s] org chart style
information”. It visualizes the “hierarchy of people” in a browsable way directly
accessible in the My Site. This means a user presented on MySite can
additionally be looked up via the organizational chart. (Wright 2012)
4.1.3 Surveys
As mentioned above the two major topics regarding My Site are addressed in six
different surveys. There are several reasons for splitting the surveys. First of all, the
participants where free to participate in the surveys, therefore the focus was to keep
the surveys short. Second, it gives the survey creator the possibility to adapt future
surveys by getting feedback after each one. The last but most important reason was
to give the participants enough time to do the training before working on the survey.
Each survey, except for the first and the last one, are combined with related training
material. The participants were asked to read the training manual first, if they were not
familiar with the topic. These documents introduce some functions of My Site. Having
read the document the participants had the opportunity to try them out. Subsequently
4 Preparation
Author: Markus Paulhart Page 23 | 111
the related survey could be filled out afterwards. This procedure ensures that the
participants are able to provide qualified answers in the surveys. Furthermore the
documents trained them along the way, which opened room for feedback on the
training material itself. Creating proper training material was equally important to
support other colleagues in gaining a better understanding of My Site in SharePoint.
That is why feedback questions are also included in the surveys. As a result not all
questions will be analyzed in this master thesis, but only the ones providing useful
knowledge for answering the scientific questions.
4.1.3.1 0 - Getting Started
This is the first survey presented to the participants of the YPP Collaboration Room.
The name of the survey is My Site - Getting Started and it consists of 17 questions.
The intention was to get a basic understanding on the perception of social networking
and also on how experienced the users are yet with such software.
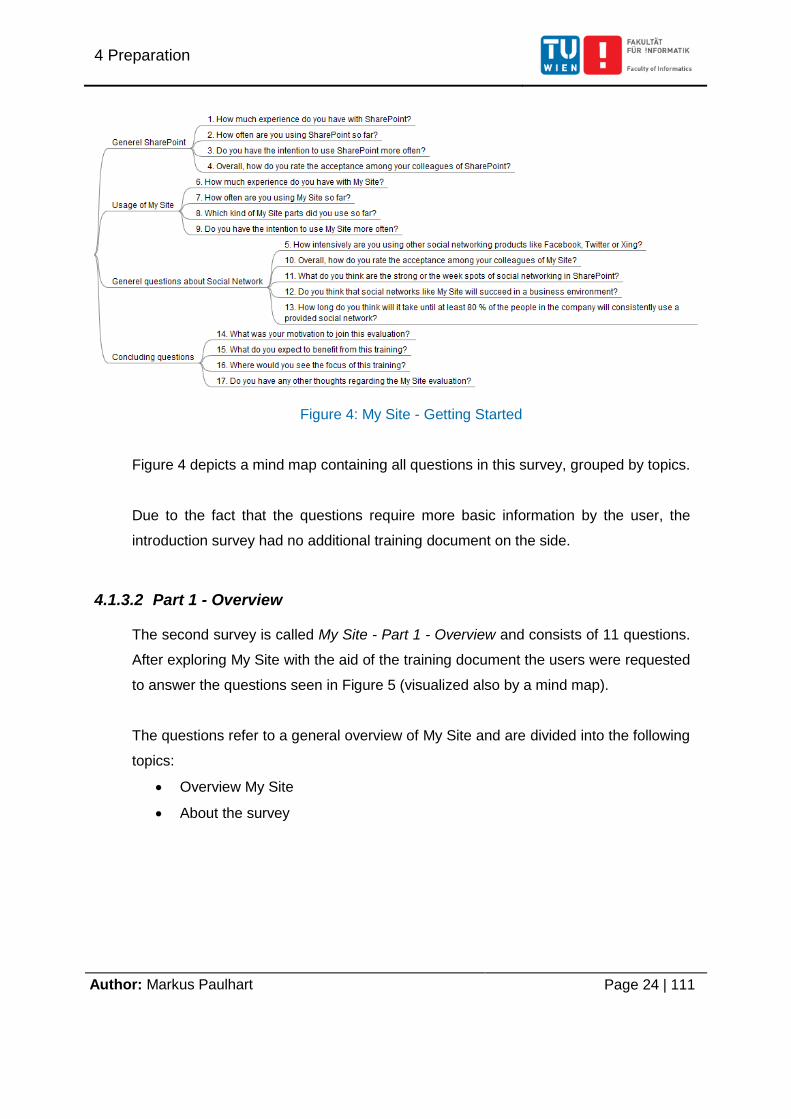
In detail, the survey tries to clarify the following topics which are also visible in Figure
4:
General SharePoint
Use of My Site
General questions about Social Network
Concluding questions
4 Preparation
Author: Markus Paulhart Page 24 | 111
Figure 4: My Site - Getting Started
Figure 4 depicts a mind map containing all questions in this survey, grouped by topics.
Due to the fact that the questions require more basic information by the user, the
introduction survey had no additional training document on the side.
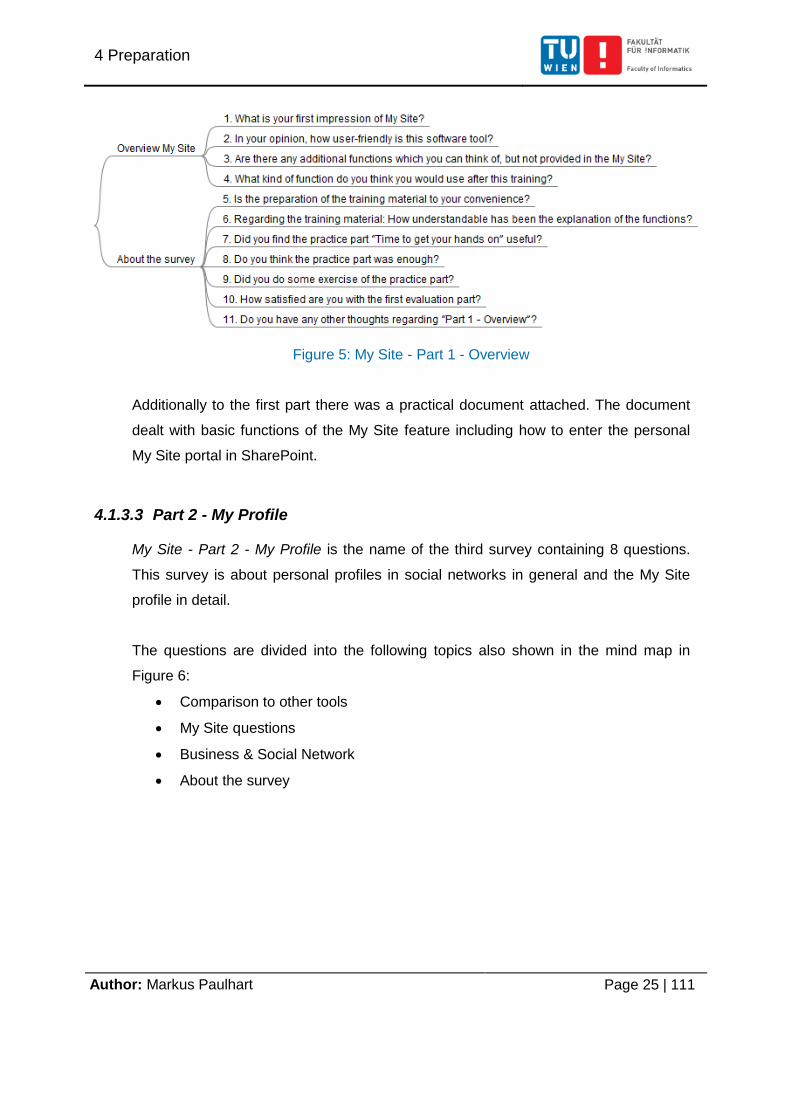
4.1.3.2 Part 1 - Overview
The second survey is called My Site - Part 1 - Overview and consists of 11 questions.
After exploring My Site with the aid of the training document the users were requested
to answer the questions seen in Figure 5 (visualized also by a mind map).
The questions refer to a general overview of My Site and are divided into the following
topics:
Overview My Site
About the survey
4 Preparation
Author: Markus Paulhart Page 25 | 111
Figure 5: My Site - Part 1 - Overview
Additionally to the first part there was a practical document attached. The document
dealt with basic functions of the My Site feature including how to enter the personal
My Site portal in SharePoint.
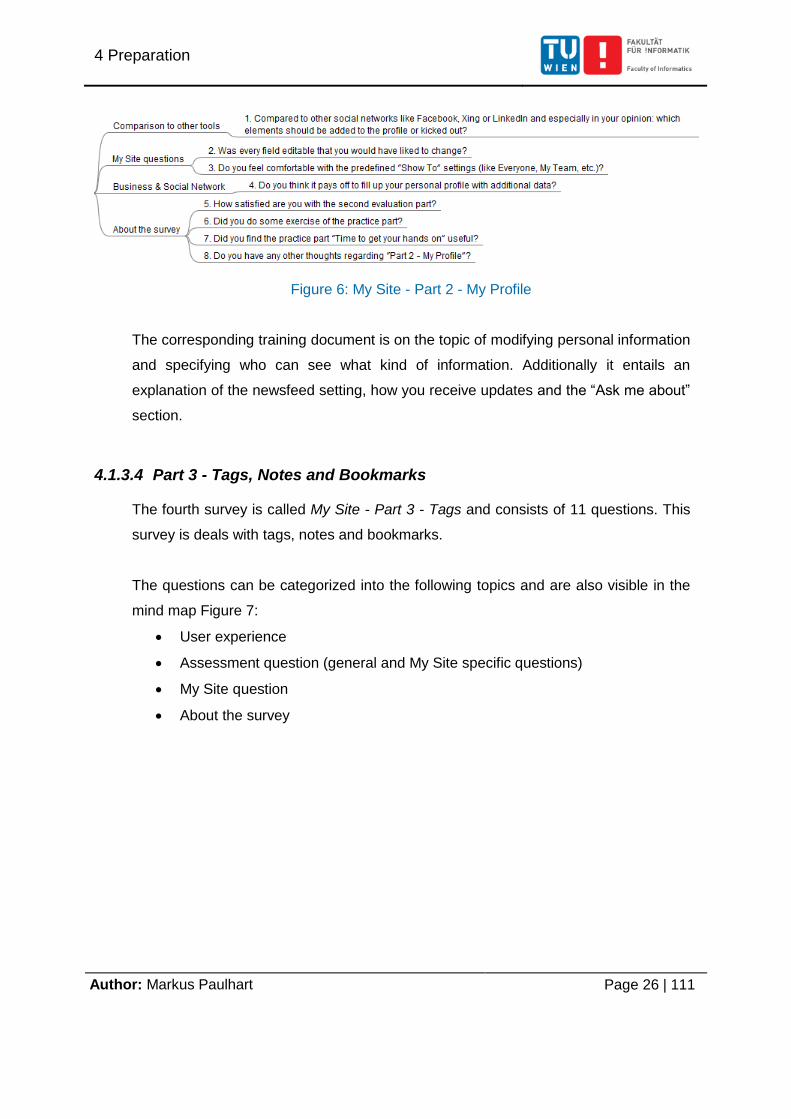
4.1.3.3 Part 2 - My Profile
My Site - Part 2 - My Profile is the name of the third survey containing 8 questions.
This survey is about personal profiles in social networks in general and the My Site
profile in detail.
The questions are divided into the following topics also shown in the mind map in
Figure 6:
Comparison to other tools
My Site questions
Business & Social Network
About the survey
4 Preparation
Author: Markus Paulhart Page 26 | 111
Figure 6: My Site - Part 2 - My Profile
The corresponding training document is on the topic of modifying personal information
and specifying who can see what kind of information. Additionally it entails an
explanation of the newsfeed setting, how you receive updates and the “Ask me about”
section.
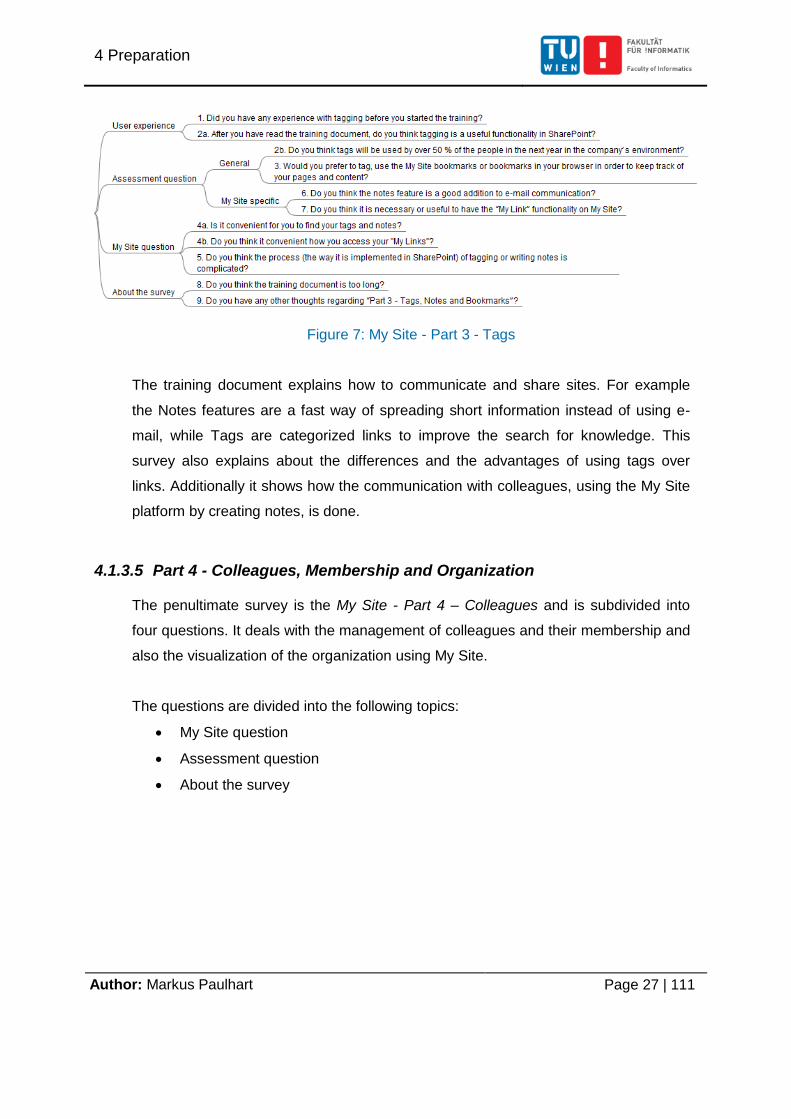
4.1.3.4 Part 3 - Tags, Notes and Bookmarks
The fourth survey is called My Site - Part 3 - Tags and consists of 11 questions. This
survey is deals with tags, notes and bookmarks.
The questions can be categorized into the following topics and are also visible in the
mind map Figure 7:
User experience
Assessment question (general and My Site specific questions)
My Site question
About the survey
4 Preparation
Author: Markus Paulhart Page 27 | 111
Figure 7: My Site - Part 3 - Tags
The training document explains how to communicate and share sites. For example
the Notes features are a fast way of spreading short information instead of using e-
mail, while Tags are categorized links to improve the search for knowledge. This
survey also explains about the differences and the advantages of using tags over
links. Additionally it shows how the communication with colleagues, using the My Site
platform by creating notes, is done.
4.1.3.5 Part 4 - Colleagues, Membership and Organization
The penultimate survey is the My Site - Part 4 – Colleagues and is subdivided into
four questions. It deals with the management of colleagues and their membership and
also the visualization of the organization using My Site.
The questions are divided into the following topics:
My Site question
Assessment question
About the survey
4 Preparation
Author: Markus Paulhart Page 28 | 111
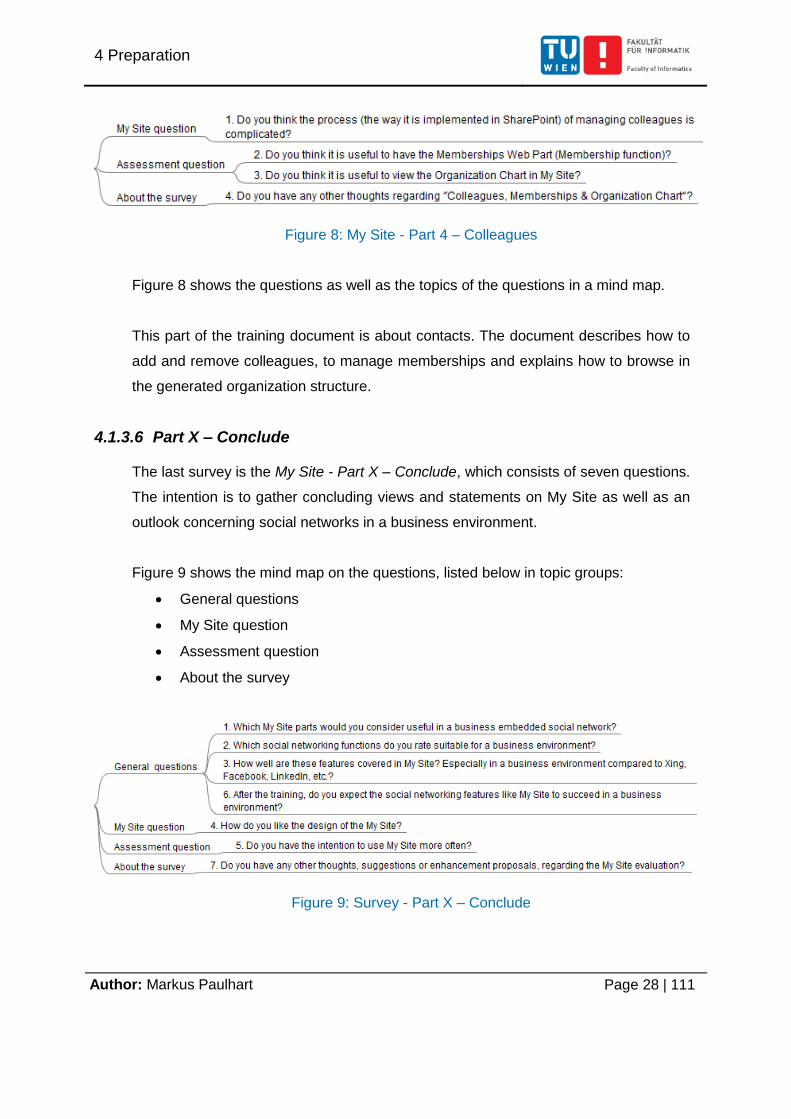
Figure 8: My Site - Part 4 – Colleagues
Figure 8 shows the questions as well as the topics of the questions in a mind map.
This part of the training document is about contacts. The document describes how to
add and remove colleagues, to manage memberships and explains how to browse in
the generated organization structure.
4.1.3.6 Part X – Conclude
The last survey is the My Site - Part X – Conclude, which consists of seven questions.
The intention is to gather concluding views and statements on My Site as well as an
outlook concerning social networks in a business environment.
Figure 9 shows the mind map on the questions, listed below in topic groups:
General questions
My Site question
Assessment question
About the survey
Figure 9: Survey - Part X – Conclude
4 Preparation
Author: Markus Paulhart Page 29 | 111
Like the first survey, also the last one has no training document attached.
4.2 Selection of an appropriate tool
Before evaluating the collected data a suitable analysis tool is required to reduce the
time effort spent on evaluating the data and to maximize the knowledge output. This
topic has already been covered in the master thesis Analyze SharePoint Surveys in
QlikView (Paulhart 2014), where two solutions for analyzing surveys in SharePoint are
presented:
Analyze with SharePoint itself
Use the QlikView application SPSurvey Dashboard
4.2.1 SharePoint
Since Share Point provides the opportunity to generate surveys as well as to collect
and store the acquired data in the same collaboration system, it also entails the option
to analyze the data. (Paulhart 2014)
This option is further described in the next sub section, which is based on (Paulhart
2014).
4.2.1.1 Analysis of surveys with SharePoint
SharePoint offers three ways of looking into data.
1. All Responses
2. Graphical Summery
3. Export to Spreadsheet
The first one represents all answers acquired in the survey from one selected
participant in detail. It offers no graphical overview and reveals no information on
opinions of other participants. Furthermore the name of the participant is not hidden.
4 Preparation
Author: Markus Paulhart Page 30 | 111
The second one is a graphical view comparing all provided answers grouped by
questions. Additionally it shows a percentage value for each answer in relation to the
total sum and also the total sum of answers as well. This view is anonymous and
serves as a good comparison for all answers on one particular question. Unfortunately
this view does not always make sense; there are question types that are not properly
visualized at all, especially questions answered by almost every participant in a
different way. (Paulhart 2014)
The third option represents a data export option from SharePoint. It allows the user to
export the collected data. The result is a spreadsheet with all information provided by
the user. Unfortunately no meta-data is stored in this file.
In summary, SharePoint offers a basic set of analysis aids and is especially suitable
for looking into single or multiple choice questions data, but offers no options for
grouping the people in specific group to increase the meaning of the survey. The fact
that users are not hidden is an additional negative characteristic.
4.2.2 QlikView Application SPSurvey Dashboard
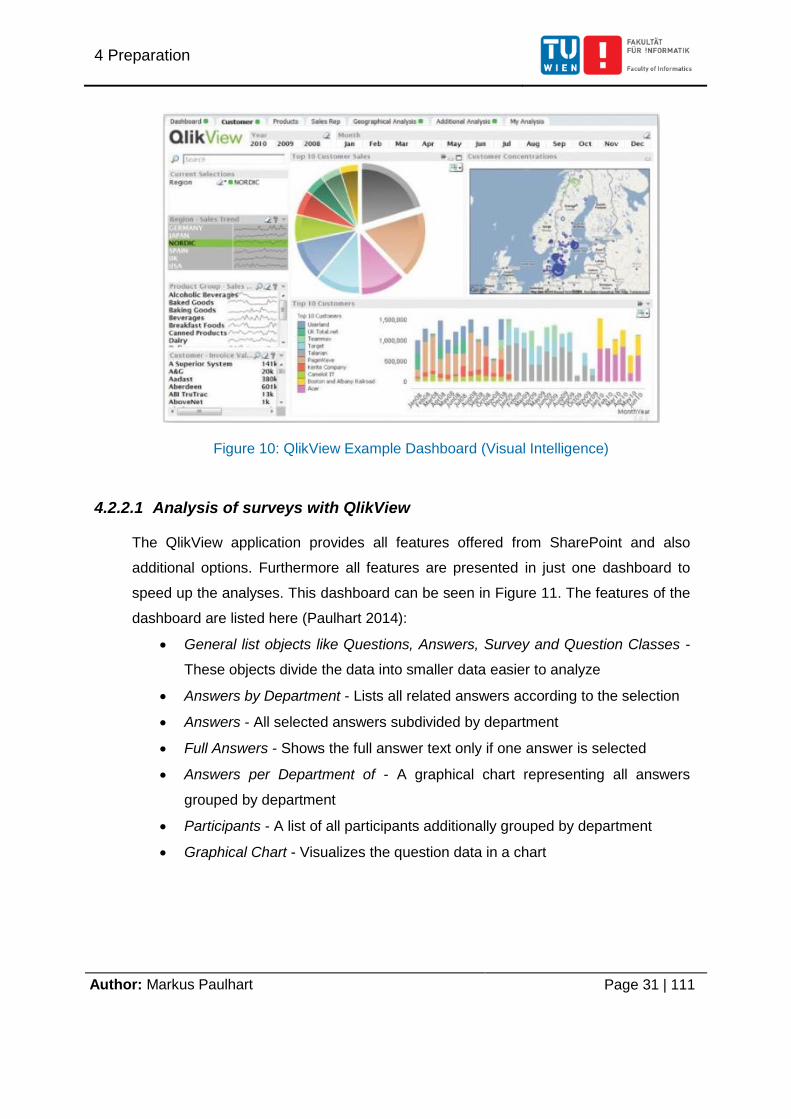
QlikView is a user-friendly, fast and flexible Business Intelligence platform. The core
strength is that all data needed for analysis is loaded into the memory, which enables
real-time presentation of the data for the user. This leads further to an associative
experience presented in form of a graphical dashboard with charts, lists or tables
(illustrated in Figure 10). (Visual Intelligence)
4 Preparation
Author: Markus Paulhart Page 31 | 111
Figure 10: QlikView Example Dashboard (Visual Intelligence)
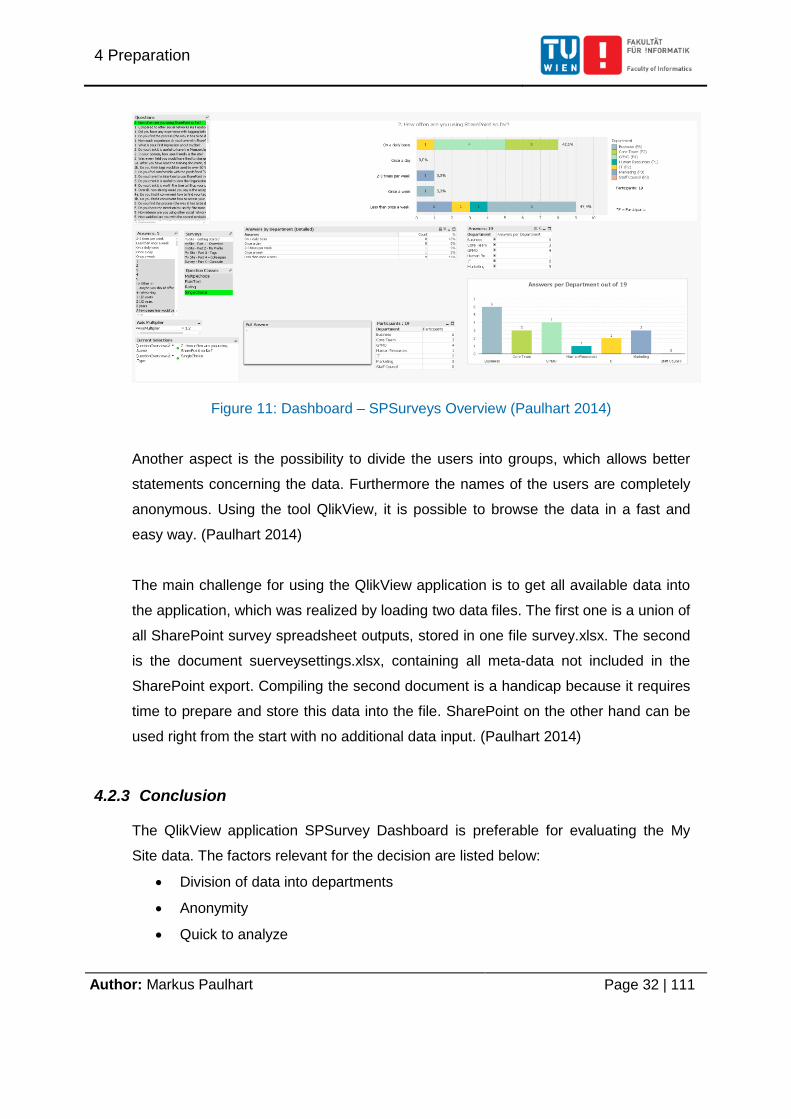
4.2.2.1 Analysis of surveys with QlikView
The QlikView application provides all features offered from SharePoint and also
additional options. Furthermore all features are presented in just one dashboard to
speed up the analyses. This dashboard can be seen in Figure 11. The features of the
dashboard are listed here (Paulhart 2014):
General list objects like Questions, Answers, Survey and Question Classes -
These objects divide the data into smaller data easier to analyze
Answers by Department - Lists all related answers according to the selection
Answers - All selected answers subdivided by department
Full Answers - Shows the full answer text only if one answer is selected
Answers per Department of - A graphical chart representing all answers
grouped by department
Participants - A list of all participants additionally grouped by department
Graphical Chart - Visualizes the question data in a chart
4 Preparation
Author: Markus Paulhart Page 32 | 111
Figure 11: Dashboard – SPSurveys Overview (Paulhart 2014)
Another aspect is the possibility to divide the users into groups, which allows better
statements concerning the data. Furthermore the names of the users are completely
anonymous. Using the tool QlikView, it is possible to browse the data in a fast and
easy way. (Paulhart 2014)
The main challenge for using the QlikView application is to get all available data into
the application, which was realized by loading two data files. The first one is a union of
all SharePoint survey spreadsheet outputs, stored in one file survey.xlsx. The second
is the document suerveysettings.xlsx, containing all meta-data not included in the
SharePoint export. Compiling the second document is a handicap because it requires
time to prepare and store this data into the file. SharePoint on the other hand can be
used right from the start with no additional data input. (Paulhart 2014)
4.2.3 Conclusion
The QlikView application SPSurvey Dashboard is preferable for evaluating the My
Site data. The factors relevant for the decision are listed below:
Division of data into departments
Anonymity
Quick to analyze
4 Preparation
Author: Markus Paulhart Page 33 | 111
Comprehensive analysis of all assembled survey data
All these criteria are met by the QlikView application.
Moreover, surveys with 22 participants are almost too much for SharePoint to handle
properly. (Paulhart 2014) The fact that there was enough preparation time to complete
the suerveysettings.xlsx with the necessary meta-data removed the only benefit to go
with SharePoint as an analyzing tool.
All these factors left the QlikView application as an analyzing tool for the survey data
as the only appropriate choice.
4.3 Analytic tool
This section describes the QlikView application and software architecture as well as
its data model of the in accordance with the My Site data set.
4.3.1 Application architecture
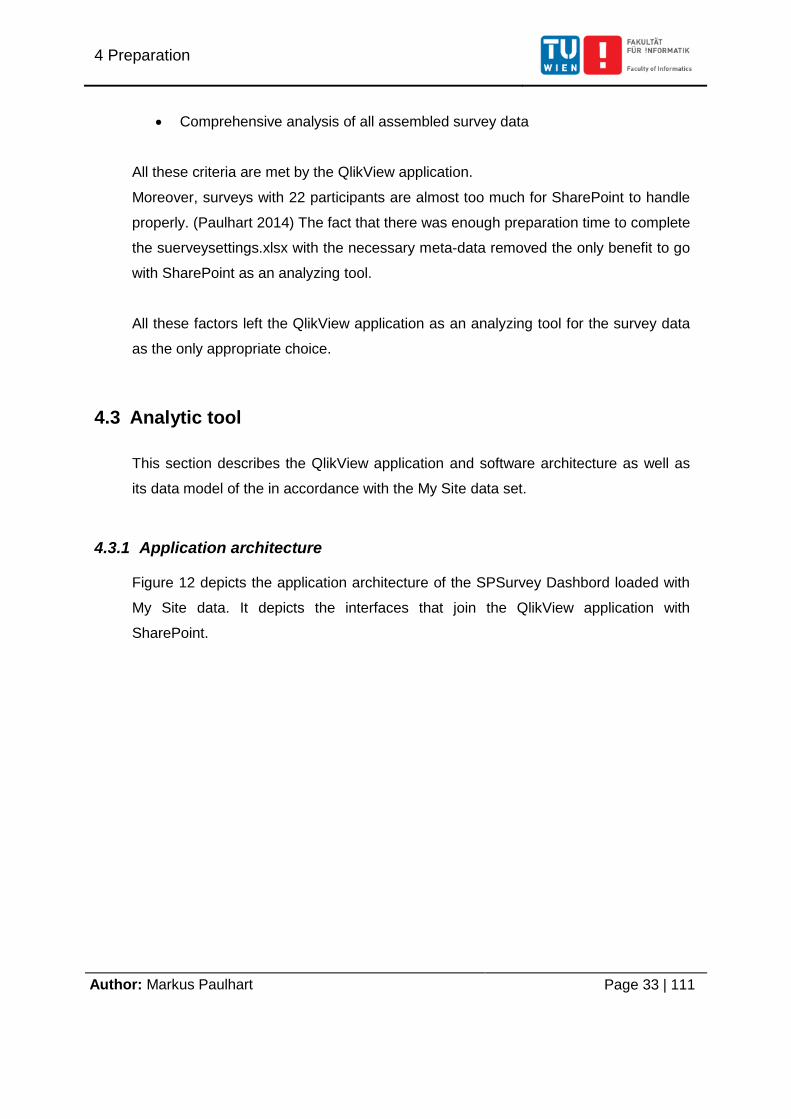
Figure 12 depicts the application architecture of the SPSurvey Dashbord loaded with
My Site data. It depicts the interfaces that join the QlikView application with
SharePoint.
4 Preparation
Author: Markus Paulhart Page 34 | 111
Figure 12: Application architecture - SPSurvey Dashboard with My Site data
The data context of the application is the YPP Collaboration Room. The uppermost
object <<SharePoint 2010>> represents all the surveys of the YPP Collaboration
Room. Additionally a manikin represents the manual input of creating the required
surveysettings.xlsx file containing the meta-data. The data is divided logically and
visualized by yellow circles. These circles are called interfaces and represent survey
data as well as meta-data. The surveys and the corresponding interfaces have the
same name. The meta-data is provided by the surveysettings interface.
Finally the data linked by the interfaces are gathered in the QlikView Application
SPSurvey Dashboard.
4.3.2 Software-Architecture
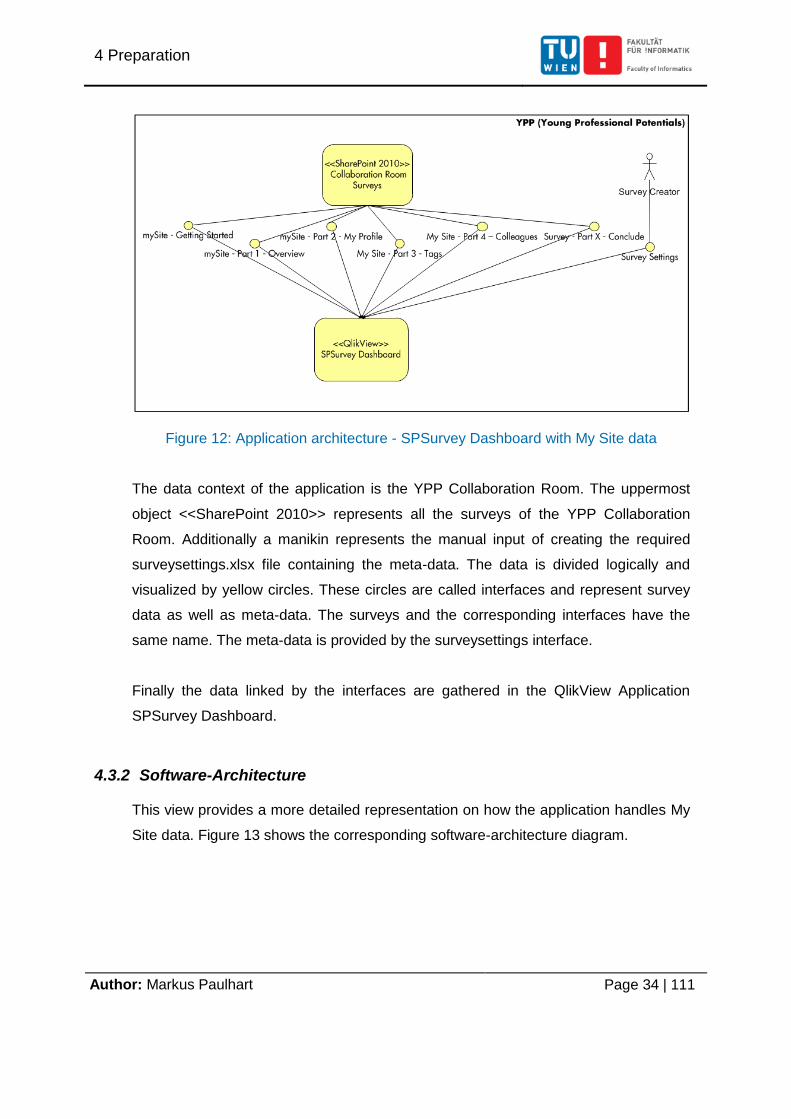
This view provides a more detailed representation on how the application handles My
Site data. Figure 13 shows the corresponding software-architecture diagram.
4 Preparation
Author: Markus Paulhart Page 35 | 111
Figure 13: Software architecture - SPSurvey Dashboard
The following surveys were exported from the YPP Collaboration Room using the
SharePoint spreadsheet function:
My Site - Getting Started
My Site - Part 1 – Overview
My Site - Part 2 - My Profile
My Site - Part 3 – Tags
My Site - Part 4 – Colleagues
Survey - Part X – Conclude
Survey Settings
All these surveys were merged into one Excel file named surveys.xlsx. All meta-data
was exported manually by the Survey Creator into the surveysettings.xlsx File. These
two files are then loaded into the QlikView application.
Since the application is built very flexible there is no need to adapt the core of the
application or change the structure of the spreadsheet files. A deeper understanding
4 Preparation
Author: Markus Paulhart Page 36 | 111
of the functionality is provided the master thesis Analyze SharePoint Surveys
(Paulhart 2014). The description of the following objects can be found in the document
mentioned above:
Survey
SurveySettings
SPSurvey Dashboard
4.3.3 Data model
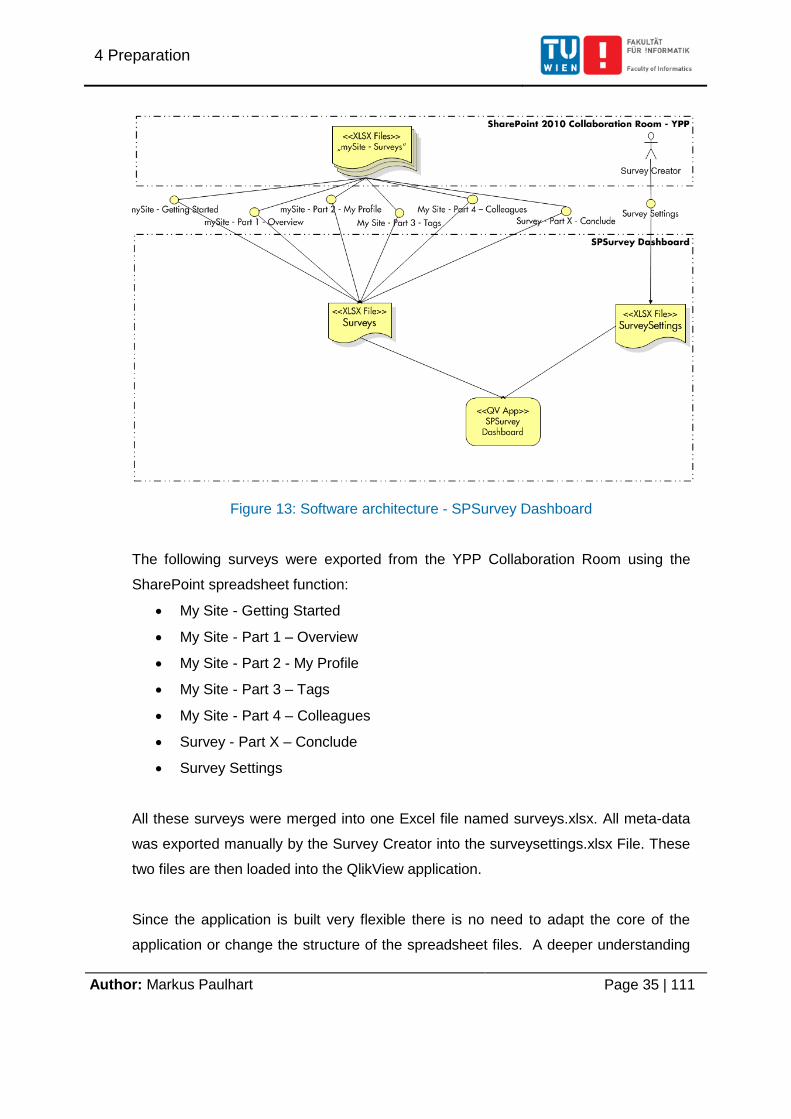
Figure 14 shows the QlikView data model for the application. The data model needs
no adaptation regarding the loaded data, therefore it stays the same.
Figure 14: QlikView data model - SPSurvey Dashboard (Paulhart 2014)
A detailed description of the data model is provided in the master thesis Analyze
SharePoint Surveys. (Paulhart 2014)
5 Analysis
Author: Markus Paulhart Page 37 | 111
5 Analysis
After gathering all user answers via the prepared SharePoint surveys, the next step is
to analyze the data in order to see what the outcome and the opinions of the users
are. The analysis was carried out with the QlikView application SPSurvey Dashboard.
This chapter starts with the analysis of all combined surveys. Then each survey will be
analyzed separately for a question enveloping perspective. Additionally the question
will be viewed separately in detail. Again, not all questions are used for the thesis but
only the relevant ones. For example, the about the survey type of question handles
the implementation of the survey and the training. They are therefore left out. Only
questions dealing with the two topics Social Network in a business environment and
My Site feature in SharePoint 2010 will be analyzed.
5.1 All Surveys combined
This is the most general representation. It takes into account all existing data collected
during the six surveys without setting any filter in the QlikView application. This allows
the determination of general information about the surveys and their participants.
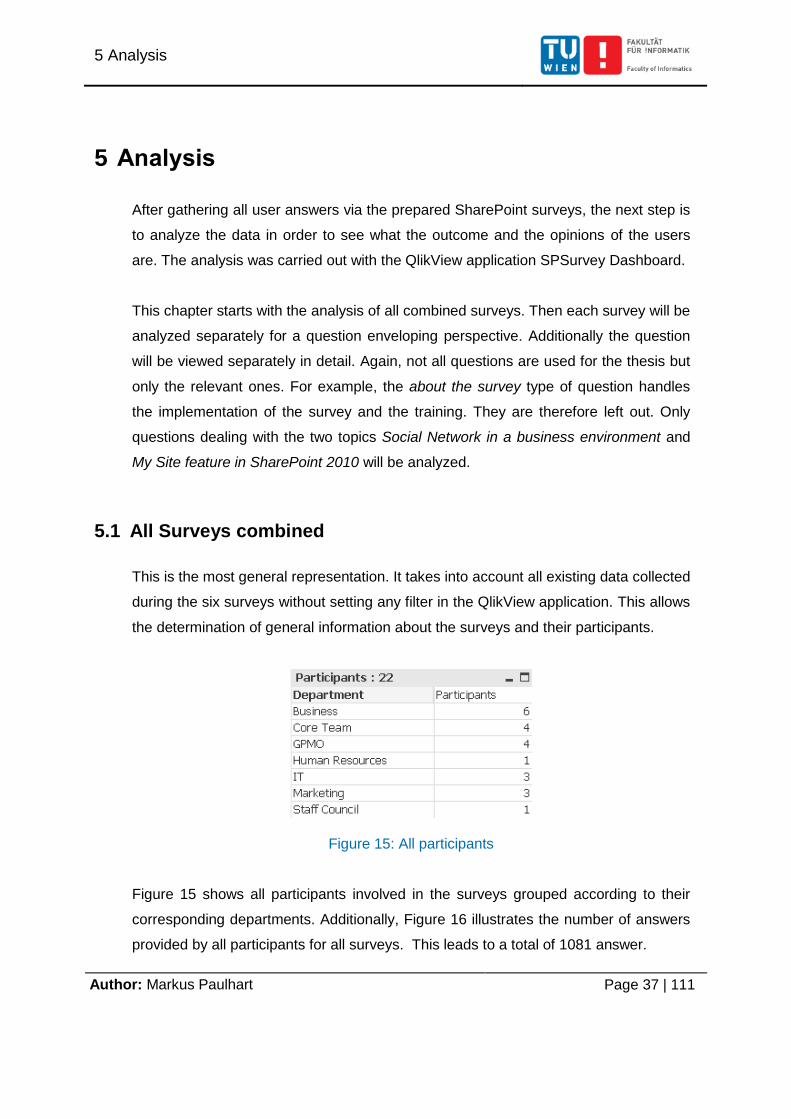
Figure 15: All participants
Figure 15 shows all participants involved in the surveys grouped according to their
corresponding departments. Additionally, Figure 16 illustrates the number of answers
provided by all participants for all surveys. This leads to a total of 1081 answer.
5 Analysis
Author: Markus Paulhart Page 38 | 111
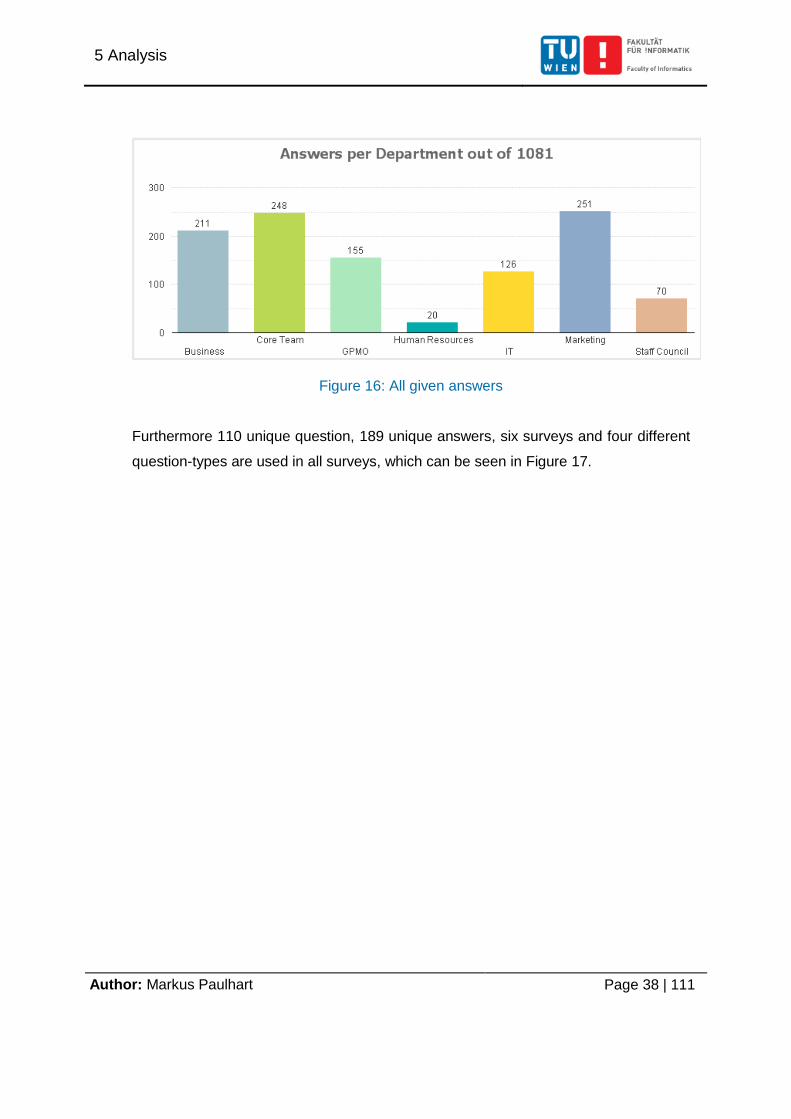
Figure 16: All given answers
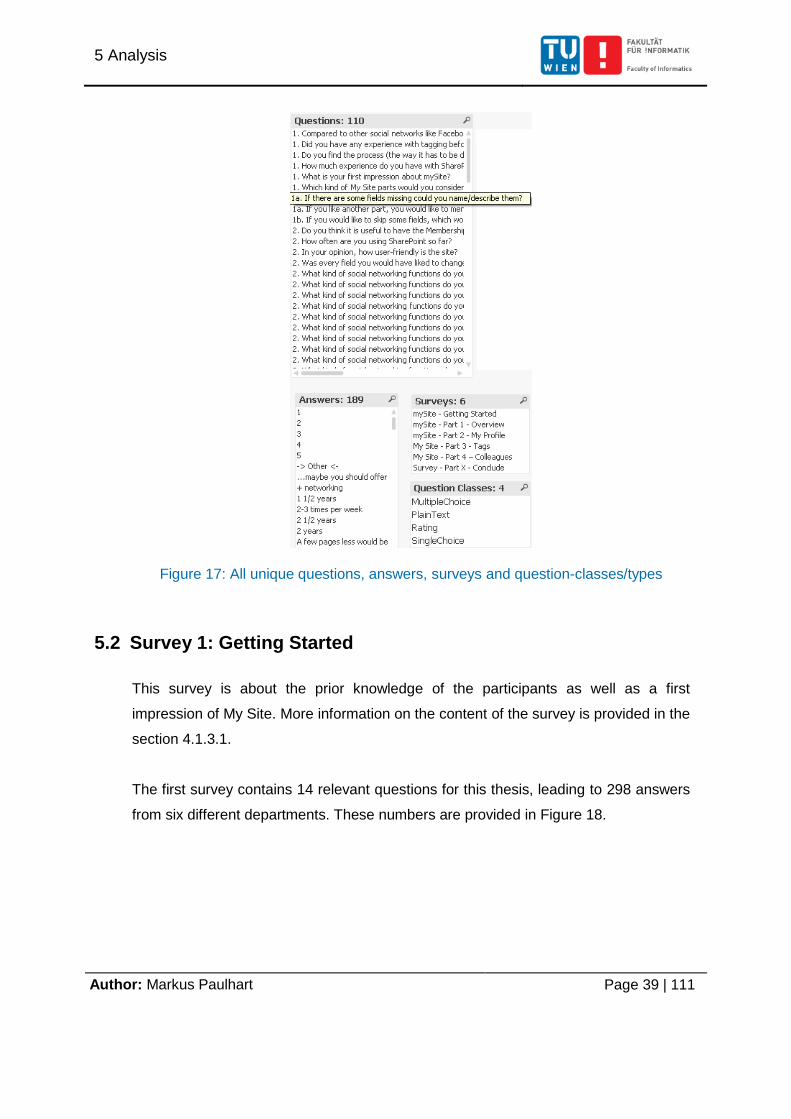
Furthermore 110 unique question, 189 unique answers, six surveys and four different
question-types are used in all surveys, which can be seen in Figure 17.
5 Analysis
Author: Markus Paulhart Page 39 | 111
Figure 17: All unique questions, answers, surveys and question-classes/types
5.2 Survey 1: Getting Started
This survey is about the prior knowledge of the participants as well as a first
impression of My Site. More information on the content of the survey is provided in the
section 4.1.3.1.
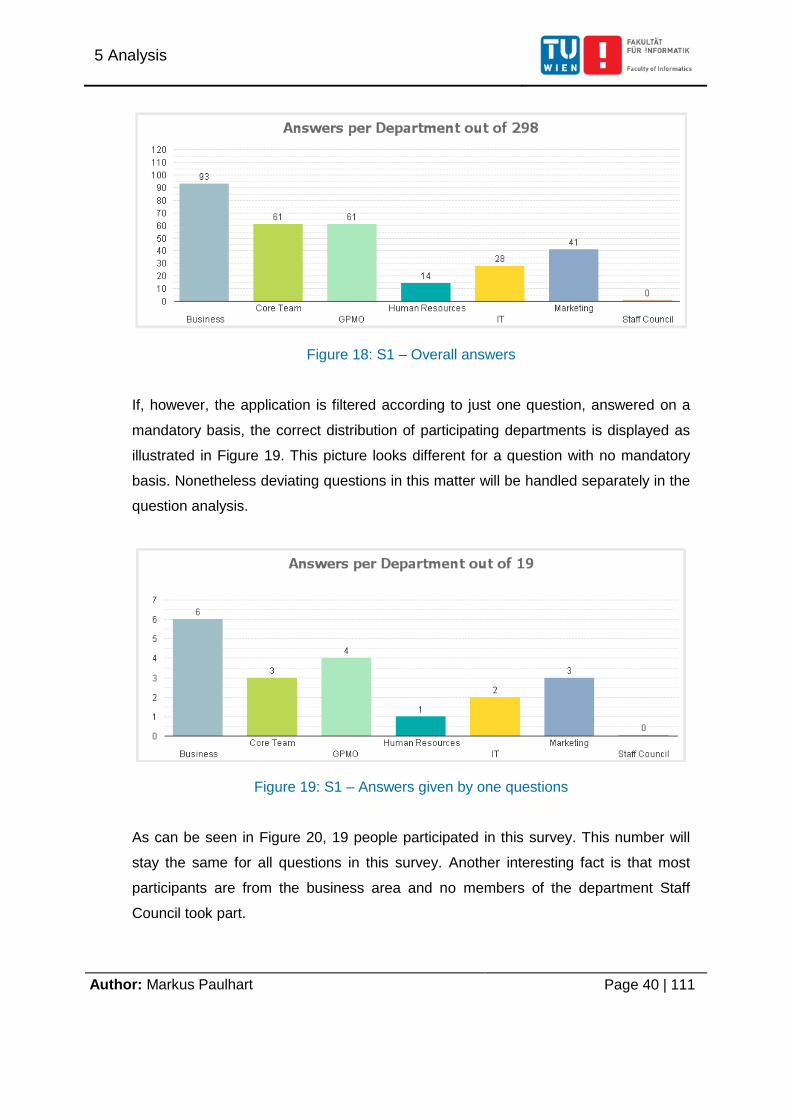
The first survey contains 14 relevant questions for this thesis, leading to 298 answers
from six different departments. These numbers are provided in Figure 18.
5 Analysis
Author: Markus Paulhart Page 40 | 111
Figure 18: S1 – Overall answers
If, however, the application is filtered according to just one question, answered on a
mandatory basis, the correct distribution of participating departments is displayed as
illustrated in Figure 19. This picture looks different for a question with no mandatory
basis. Nonetheless deviating questions in this matter will be handled separately in the
question analysis.
Figure 19: S1 – Answers given by one questions
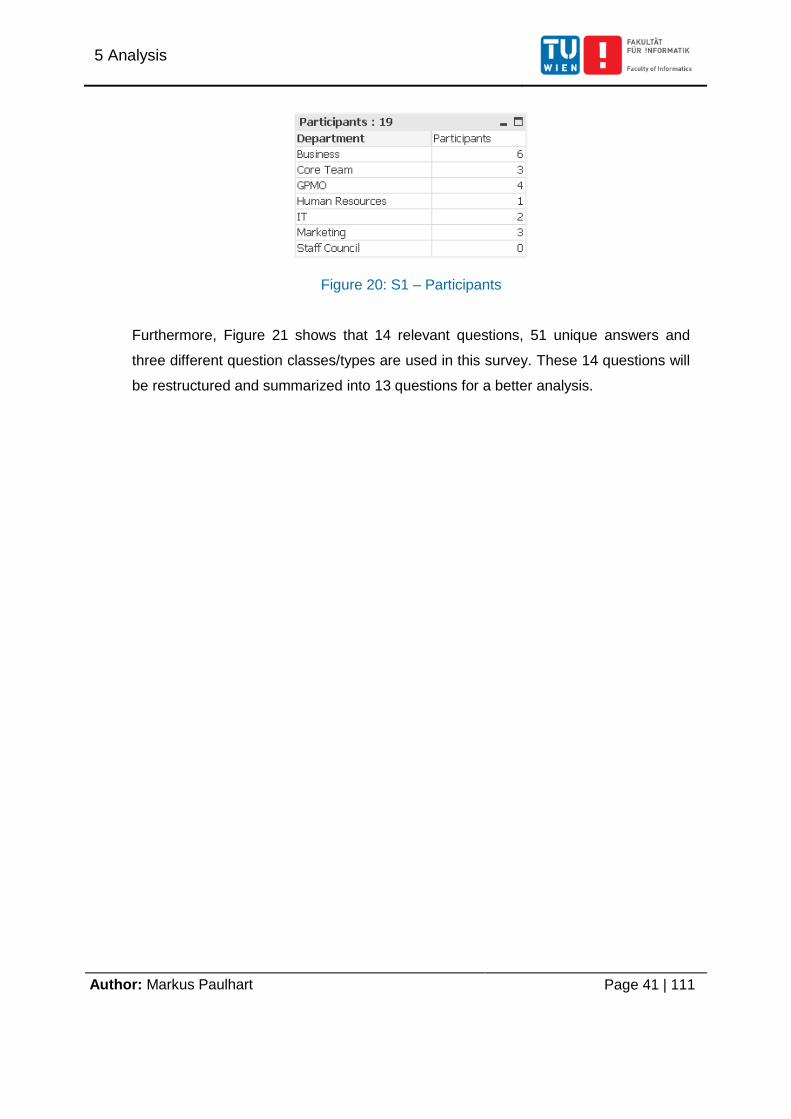
As can be seen in Figure 20, 19 people participated in this survey. This number will
stay the same for all questions in this survey. Another interesting fact is that most
participants are from the business area and no members of the department Staff
Council took part.
5 Analysis
Author: Markus Paulhart Page 41 | 111
Figure 20: S1 – Participants
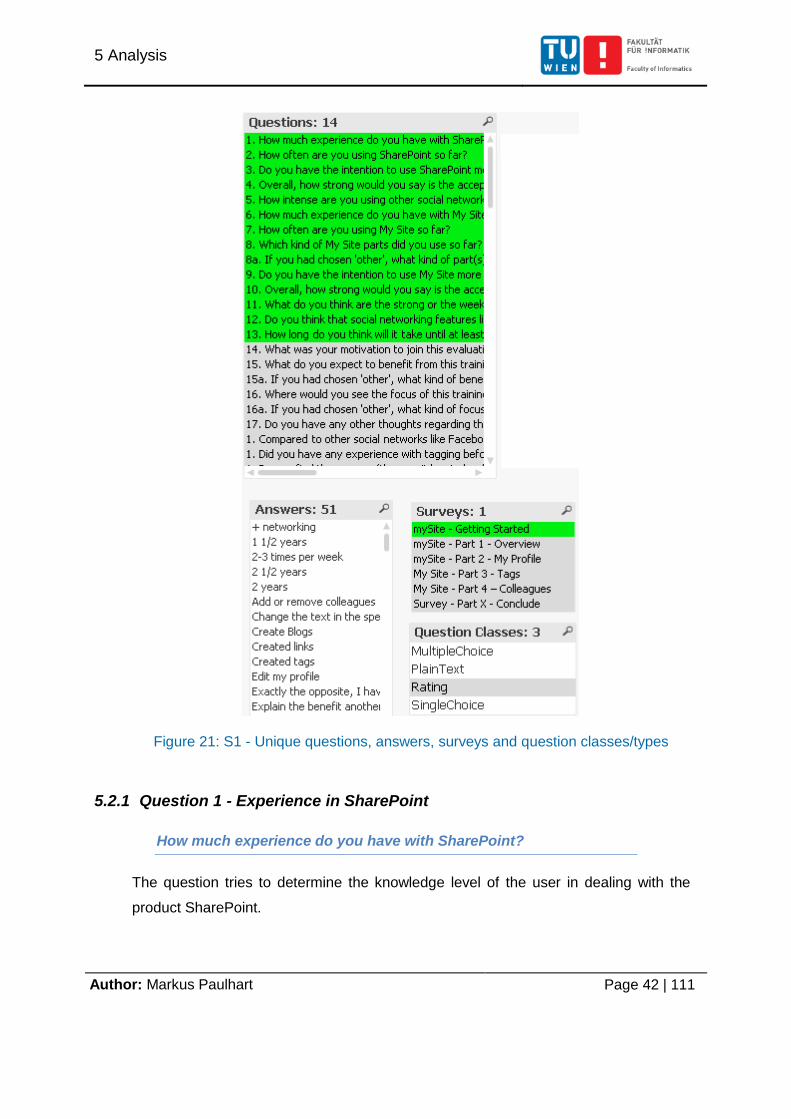
Furthermore, Figure 21 shows that 14 relevant questions, 51 unique answers and
three different question classes/types are used in this survey. These 14 questions will
be restructured and summarized into 13 questions for a better analysis.
5 Analysis
Author: Markus Paulhart Page 42 | 111
Figure 21: S1 - Unique questions, answers, surveys and question classes/types
5.2.1 Question 1 - Experience in SharePoint
How much experience do you have with SharePoint?
The question tries to determine the knowledge level of the user in dealing with the
product SharePoint.
5 Analysis
Author: Markus Paulhart Page 43 | 111
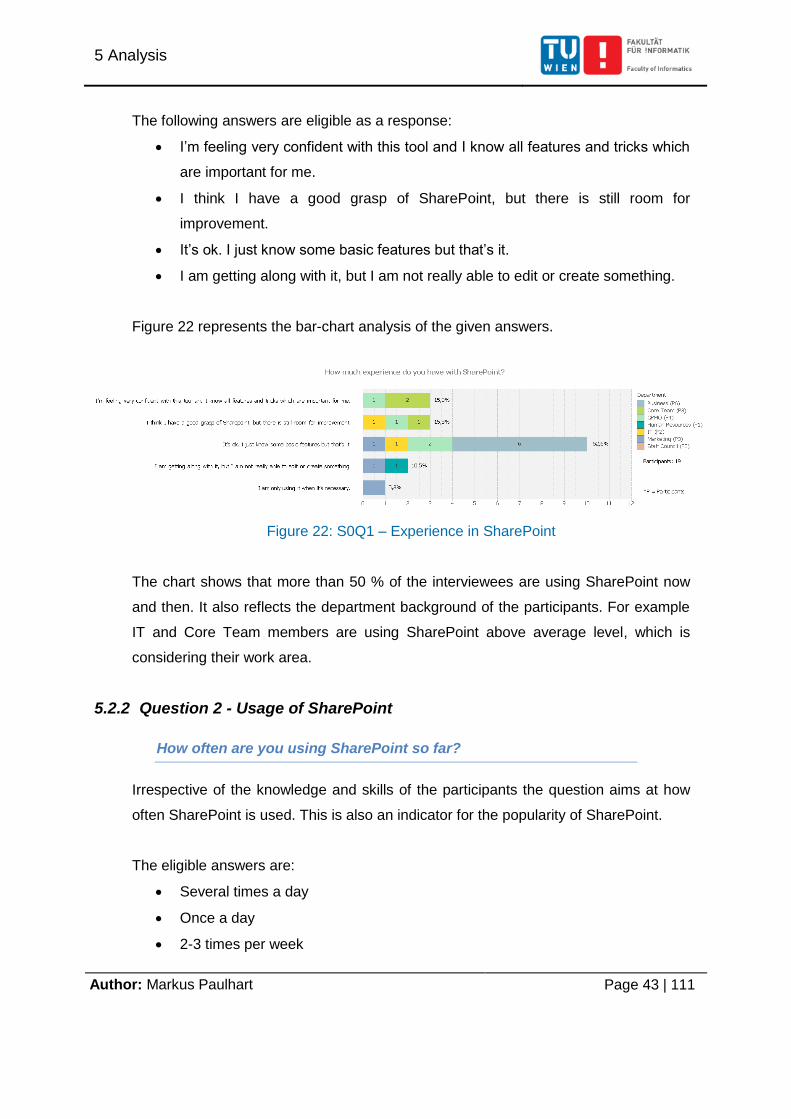
The following answers are eligible as a response:
I’m feeling very confident with this tool and I know all features and tricks which
are important for me.
I think I have a good grasp of SharePoint, but there is still room for
improvement.
It’s ok. I just know some basic features but that’s it.
I am getting along with it, but I am not really able to edit or create something.
Figure 22 represents the bar-chart analysis of the given answers.
Figure 22: S0Q1 – Experience in SharePoint
The chart shows that more than 50 % of the interviewees are using SharePoint now
and then. It also reflects the department background of the participants. For example
IT and Core Team members are using SharePoint above average level, which is
considering their work area.
5.2.2 Question 2 - Usage of SharePoint
How often are you using SharePoint so far?
Irrespective of the knowledge and skills of the participants the question aims at how
often SharePoint is used. This is also an indicator for the popularity of SharePoint.
The eligible answers are:
Several times a day
Once a day
2-3 times per week
5 Analysis
Author: Markus Paulhart Page 44 | 111
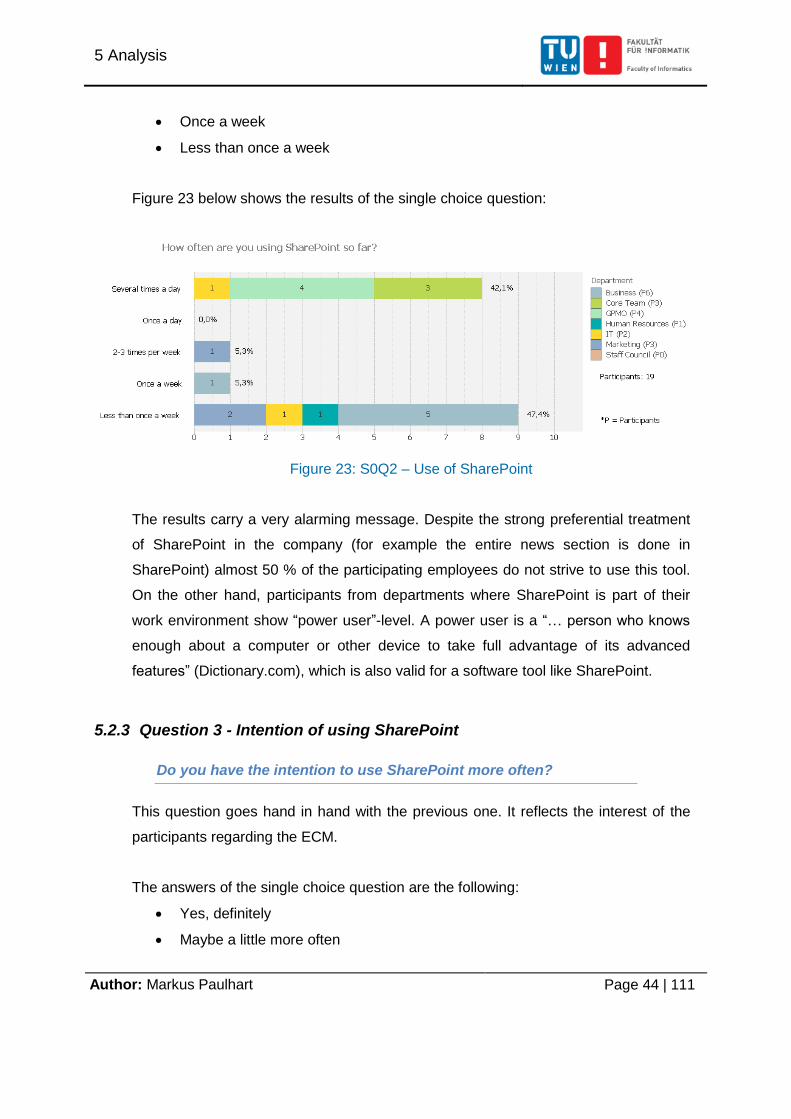
Once a week
Less than once a week
Figure 23 below shows the results of the single choice question:
Figure 23: S0Q2 – Use of SharePoint
The results carry a very alarming message. Despite the strong preferential treatment
of SharePoint in the company (for example the entire news section is done in
SharePoint) almost 50 % of the participating employees do not strive to use this tool.
On the other hand, participants from departments where SharePoint is part of their
work environment show “power user”-level. A power user is a “… person who knows
enough about a computer or other device to take full advantage of its advanced
features” (Dictionary.com), which is also valid for a software tool like SharePoint.
5.2.3 Question 3 - Intention of using SharePoint
Do you have the intention to use SharePoint more often?
This question goes hand in hand with the previous one. It reflects the interest of the
participants regarding the ECM.
The answers of the single choice question are the following:
Yes, definitely
Maybe a little more often
5 Analysis
Author: Markus Paulhart Page 45 | 111
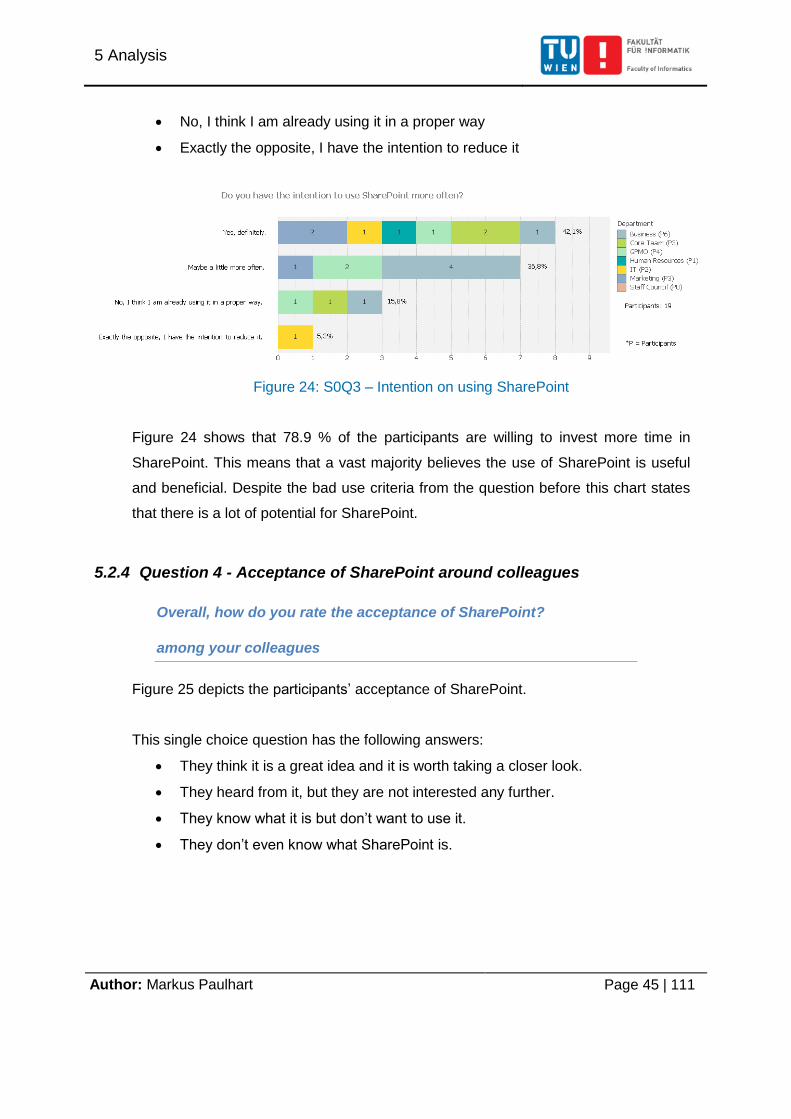
No, I think I am already using it in a proper way
Exactly the opposite, I have the intention to reduce it
Figure 24: S0Q3 – Intention on using SharePoint
Figure 24 shows that 78.9 % of the participants are willing to invest more time in
SharePoint. This means that a vast majority believes the use of SharePoint is useful
and beneficial. Despite the bad use criteria from the question before this chart states
that there is a lot of potential for SharePoint.
5.2.4 Question 4 - Acceptance of SharePoint around colleagues
Overall, how do you rate the acceptance of SharePoint?
among your colleagues
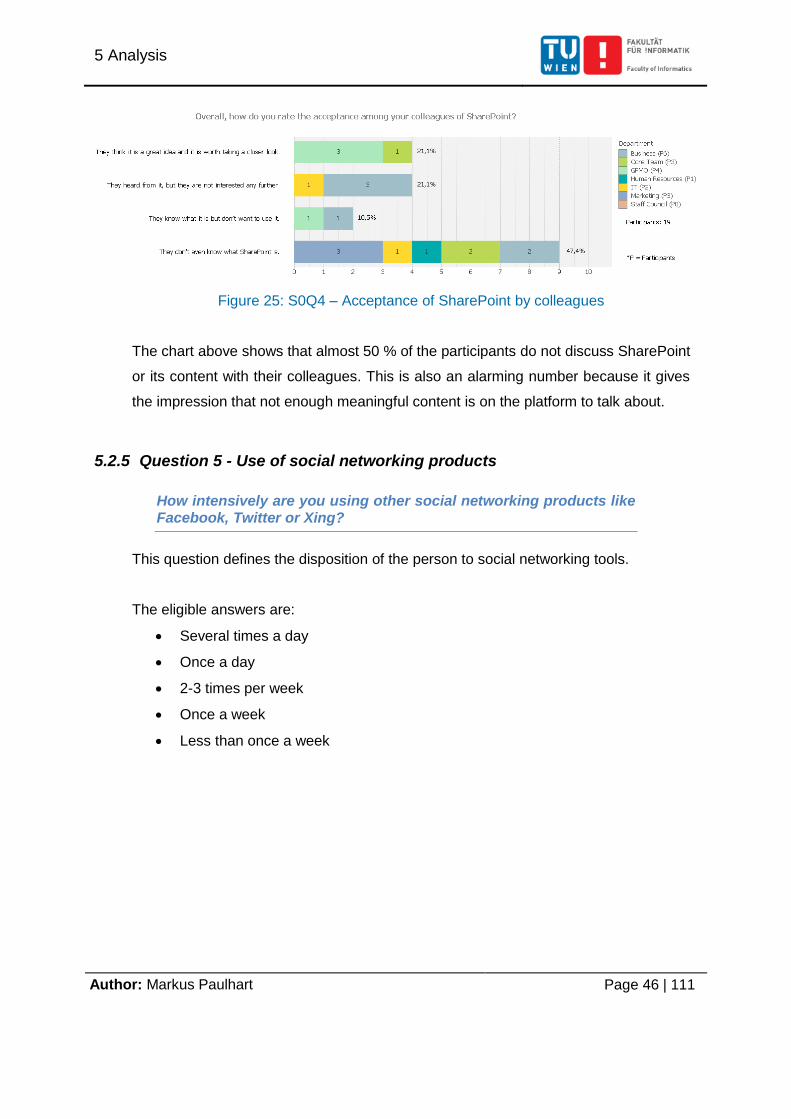
Figure 25 depicts the participants’ acceptance of SharePoint.
This single choice question has the following answers:
They think it is a great idea and it is worth taking a closer look.
They heard from it, but they are not interested any further.
They know what it is but don’t want to use it.
They don’t even know what SharePoint is.
5 Analysis
Author: Markus Paulhart Page 46 | 111
Figure 25: S0Q4 – Acceptance of SharePoint by colleagues
The chart above shows that almost 50 % of the participants do not discuss SharePoint
or its content with their colleagues. This is also an alarming number because it gives
the impression that not enough meaningful content is on the platform to talk about.
5.2.5 Question 5 - Use of social networking products
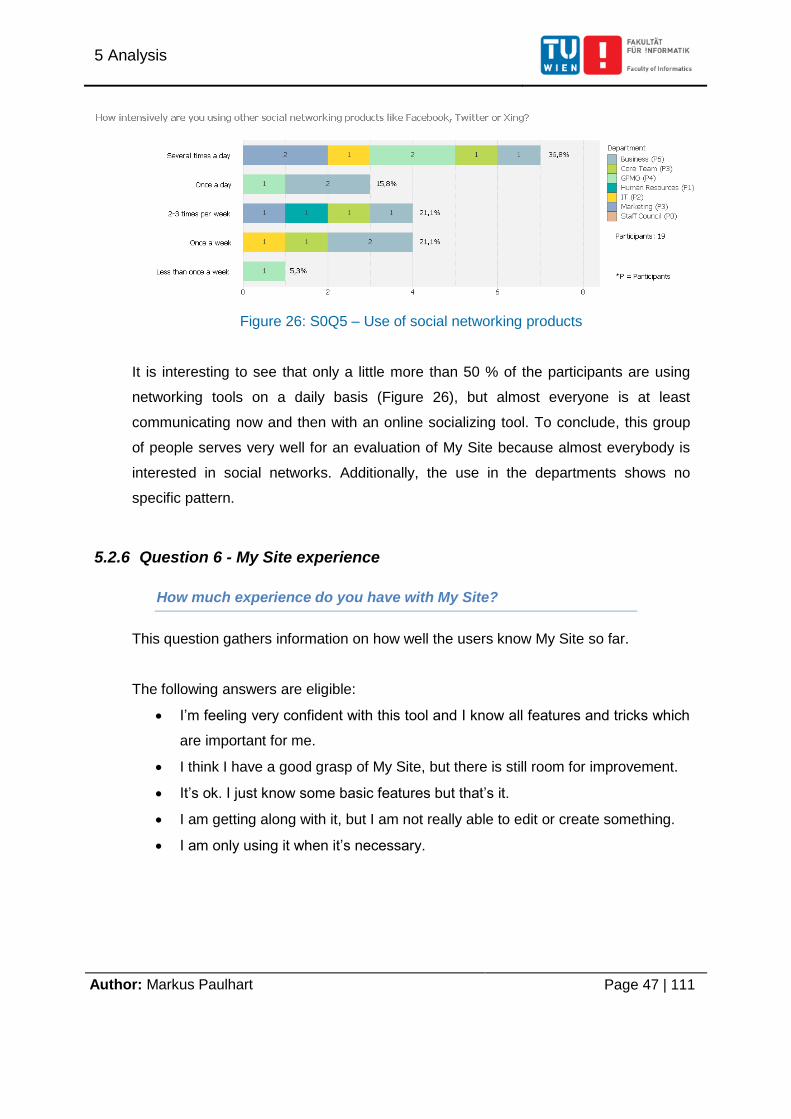
How intensively are you using other social networking products like Facebook, Twitter or Xing?
This question defines the disposition of the person to social networking tools.
The eligible answers are:
Several times a day
Once a day
2-3 times per week
Once a week
Less than once a week
5 Analysis
Author: Markus Paulhart Page 47 | 111
Figure 26: S0Q5 – Use of social networking products
It is interesting to see that only a little more than 50 % of the participants are using
networking tools on a daily basis (Figure 26), but almost everyone is at least
communicating now and then with an online socializing tool. To conclude, this group
of people serves very well for an evaluation of My Site because almost everybody is
interested in social networks. Additionally, the use in the departments shows no
specific pattern.
5.2.6 Question 6 - My Site experience
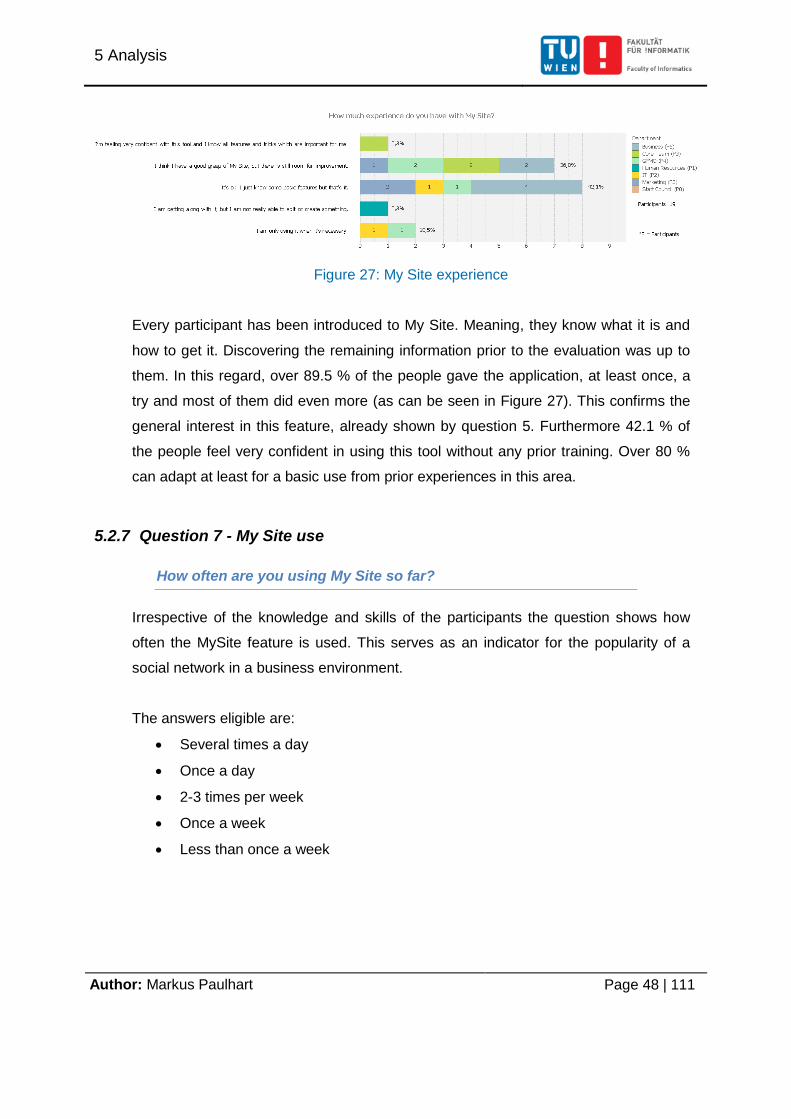
How much experience do you have with My Site?
This question gathers information on how well the users know My Site so far.
The following answers are eligible:
I’m feeling very confident with this tool and I know all features and tricks which
are important for me.
I think I have a good grasp of My Site, but there is still room for improvement.
It’s ok. I just know some basic features but that’s it.
I am getting along with it, but I am not really able to edit or create something.
I am only using it when it’s necessary.
5 Analysis
Author: Markus Paulhart Page 48 | 111
Figure 27: My Site experience
Every participant has been introduced to My Site. Meaning, they know what it is and
how to get it. Discovering the remaining information prior to the evaluation was up to
them. In this regard, over 89.5 % of the people gave the application, at least once, a
try and most of them did even more (as can be seen in Figure 27). This confirms the
general interest in this feature, already shown by question 5. Furthermore 42.1 % of
the people feel very confident in using this tool without any prior training. Over 80 %
can adapt at least for a basic use from prior experiences in this area.
5.2.7 Question 7 - My Site use
How often are you using My Site so far?
Irrespective of the knowledge and skills of the participants the question shows how
often the MySite feature is used. This serves as an indicator for the popularity of a
social network in a business environment.
The answers eligible are:
Several times a day
Once a day
2-3 times per week
Once a week
Less than once a week
5 Analysis
Author: Markus Paulhart Page 49 | 111
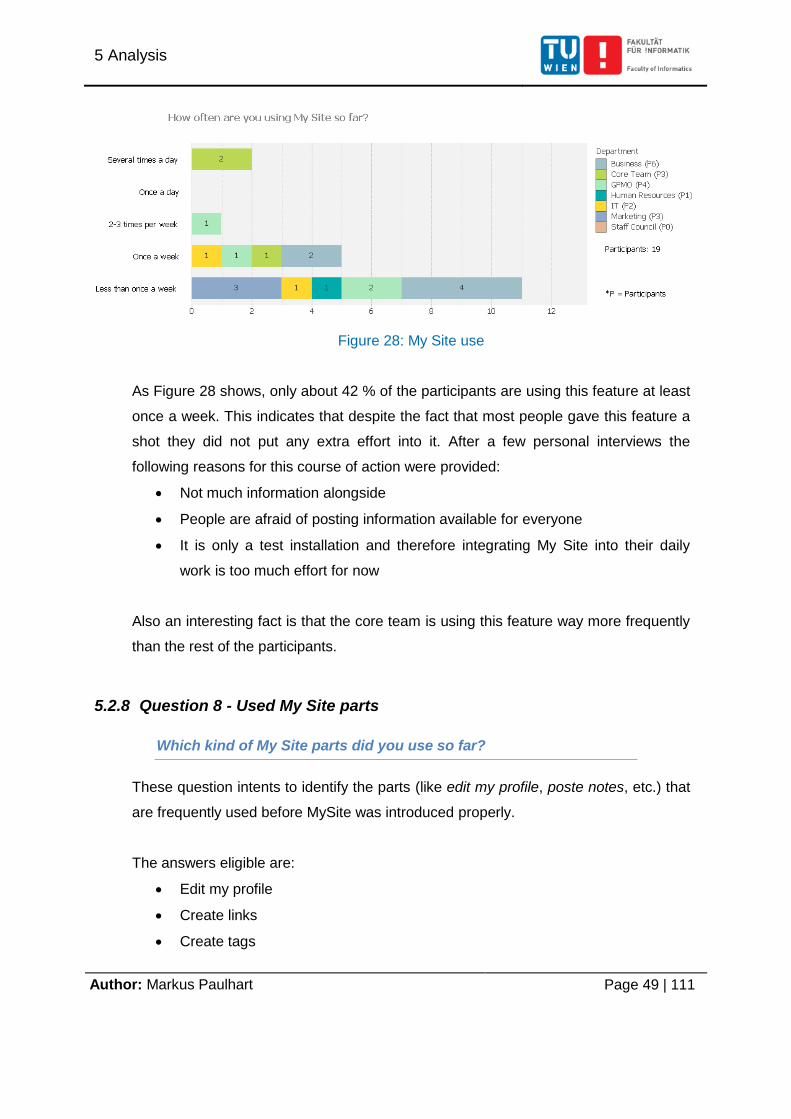
Figure 28: My Site use
As Figure 28 shows, only about 42 % of the participants are using this feature at least
once a week. This indicates that despite the fact that most people gave this feature a
shot they did not put any extra effort into it. After a few personal interviews the
following reasons for this course of action were provided:
Not much information alongside
People are afraid of posting information available for everyone
It is only a test installation and therefore integrating My Site into their daily
work is too much effort for now
Also an interesting fact is that the core team is using this feature way more frequently
than the rest of the participants.
5.2.8 Question 8 - Used My Site parts
Which kind of My Site parts did you use so far?
These question intents to identify the parts (like edit my profile, poste notes, etc.) that
are frequently used before MySite was introduced properly.
The answers eligible are:
Edit my profile
Create links
Create tags
5 Analysis
Author: Markus Paulhart Page 50 | 111
Post notes
Read notes
Change the text in the speech balloon.
Add or remove colleagues
Manage Documents
Use function “view my profile”
Create Blogs
Other
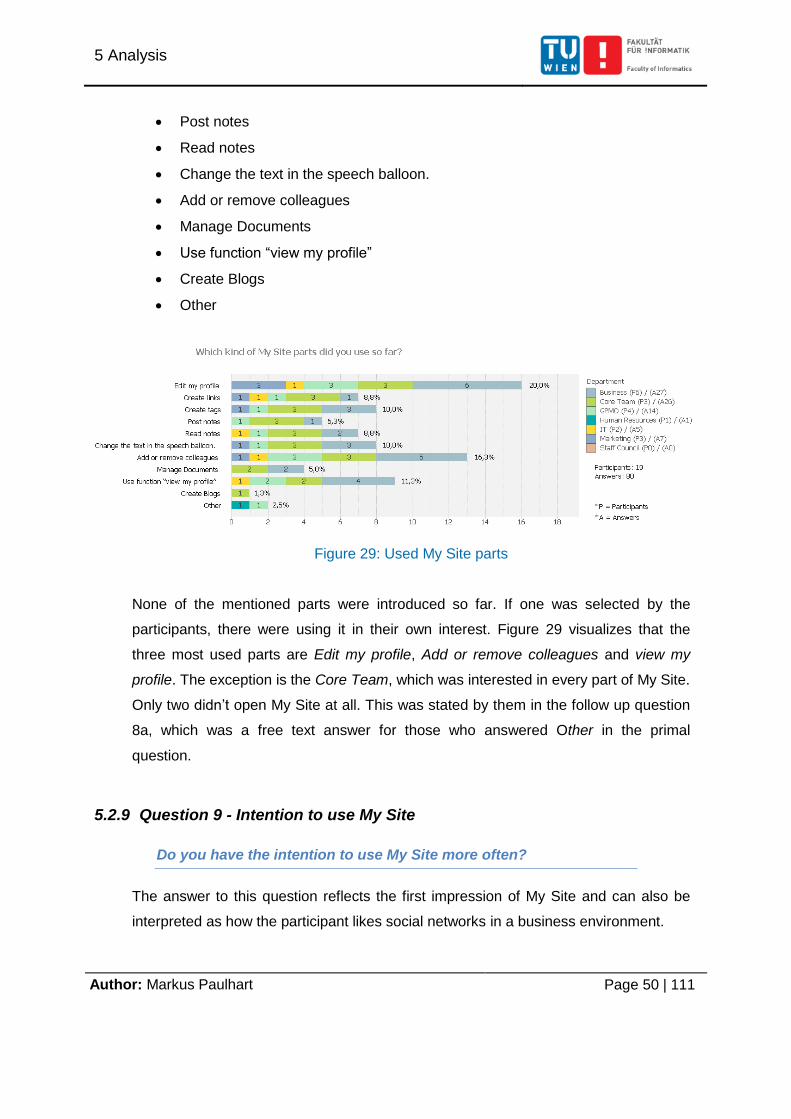
Figure 29: Used My Site parts
None of the mentioned parts were introduced so far. If one was selected by the
participants, there were using it in their own interest. Figure 29 visualizes that the
three most used parts are Edit my profile, Add or remove colleagues and view my
profile. The exception is the Core Team, which was interested in every part of My Site.
Only two didn’t open My Site at all. This was stated by them in the follow up question
8a, which was a free text answer for those who answered Other in the primal
question.
5.2.9 Question 9 - Intention to use My Site
Do you have the intention to use My Site more often?
The answer to this question reflects the first impression of My Site and can also be
interpreted as how the participant likes social networks in a business environment.
5 Analysis
Author: Markus Paulhart Page 51 | 111
The eligible answers are:
Yes, definitely.
Maybe a little bit more often.
No, I think I am already using it in a proper way.
Exactly the opposite, I have the intention to reduce it.
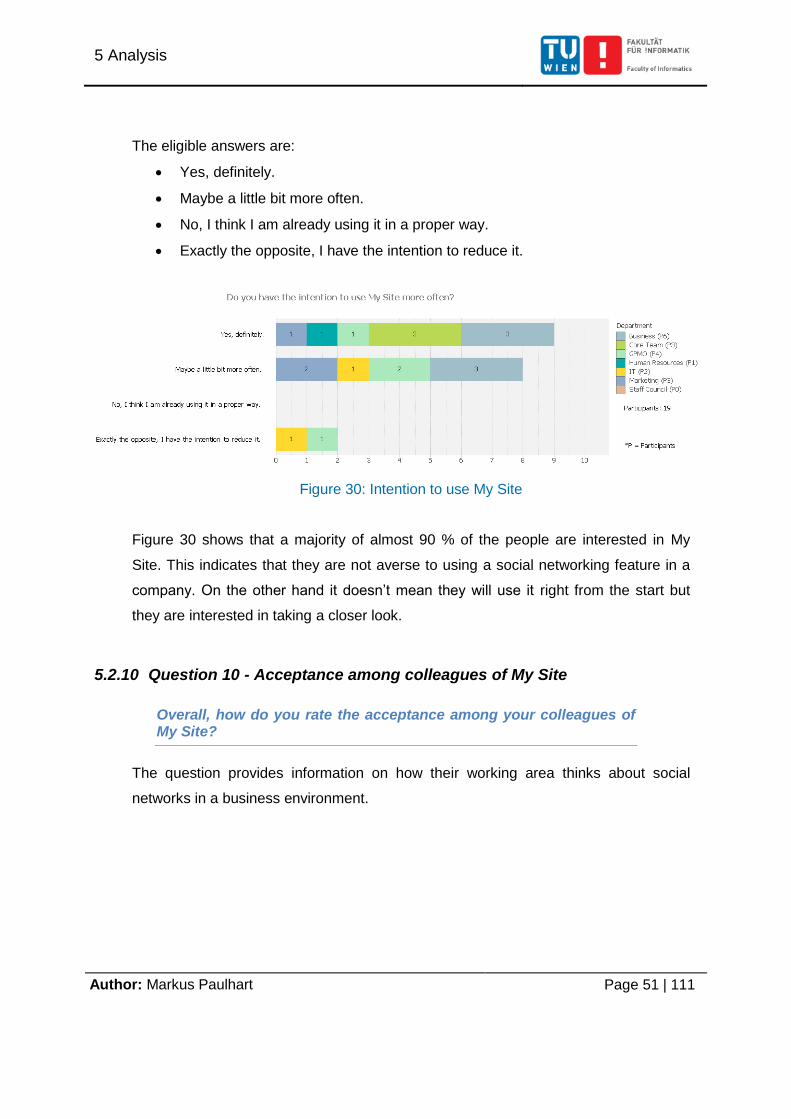
Figure 30: Intention to use My Site
Figure 30 shows that a majority of almost 90 % of the people are interested in My
Site. This indicates that they are not averse to using a social networking feature in a
company. On the other hand it doesn’t mean they will use it right from the start but
they are interested in taking a closer look.
5.2.10 Question 10 - Acceptance among colleagues of My Site
Overall, how do you rate the acceptance among your colleagues of My Site?
The question provides information on how their working area thinks about social
networks in a business environment.
5 Analysis
Author: Markus Paulhart Page 52 | 111
The eligible answers are:
They think it is a great idea and it is worth taking a closer look.
They heard from it, but they are not interested any further.
They know what it is but don’t want to use it.
They don’t even know what My Site is.
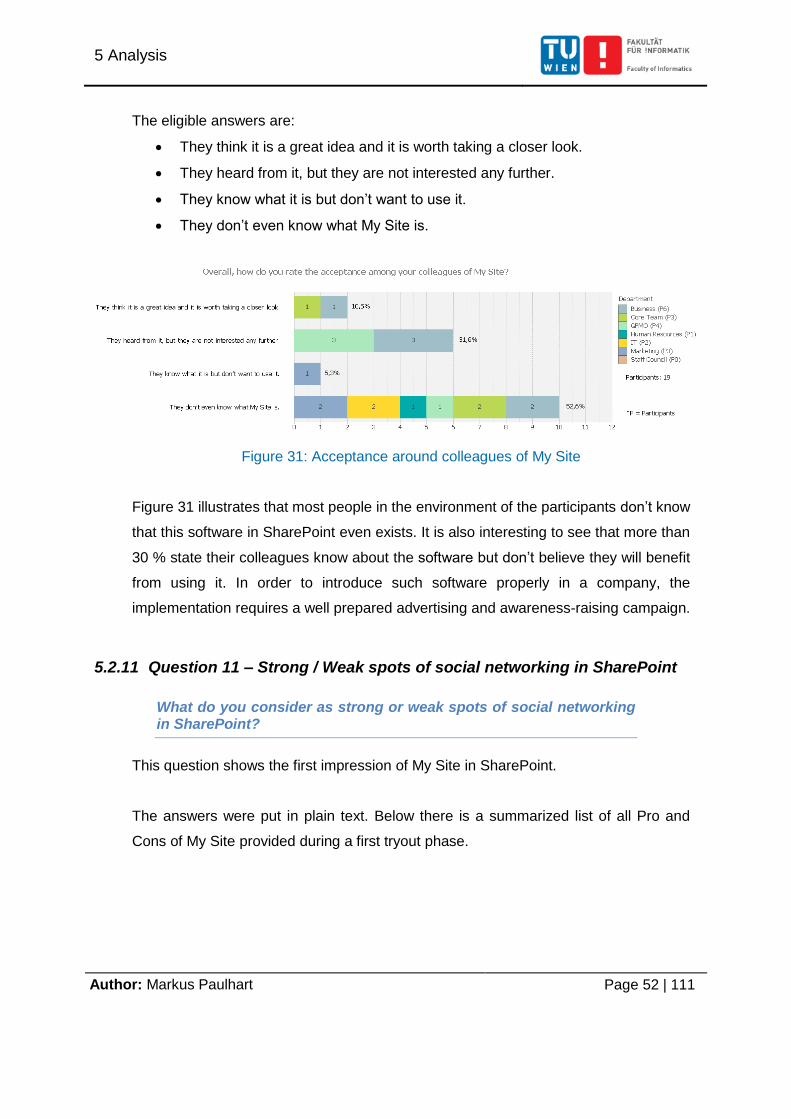
Figure 31: Acceptance around colleagues of My Site
Figure 31 illustrates that most people in the environment of the participants don’t know
that this software in SharePoint even exists. It is also interesting to see that more than
30 % state their colleagues know about the software but don’t believe they will benefit
from using it. In order to introduce such software properly in a company, the
implementation requires a well prepared advertising and awareness-raising campaign.
5.2.11 Question 11 – Strong / Weak spots of social networking in SharePoint
What do you consider as strong or weak spots of social networking in SharePoint?
This question shows the first impression of My Site in SharePoint.
The answers were put in plain text. Below there is a summarized list of all Pro and
Cons of My Site provided during a first tryout phase.
5 Analysis
Author: Markus Paulhart Page 53 | 111
Pro:
The ability to do networking
Fast exchange of information & knowledge
Integrated in the Content Management System
Present yourself through this site
Con:
Usability is slow and not clear to the end user
Low user activity
Some of the participants see the potential in connecting colleagues and also the
strong part of My Site in sharing knowledge and information especially in context with
the ECM SharePoint. On the other hand the usability and the slow interface were
criticized by almost everyone. This indicates that the software does not meet the high
standards set by other social networking software like XING, Facebook or LinkedIn,
which is a potential risk. It will be hard to convince someone to use something that is
perceived as complicated and hampering.
5.2.12 Question 12 – Success of social networks in a company
Do you think that social networks like My Site will succeed in a business environment?
This question provides a forecast on how strong the participants believe in this
technology in a business environment.
The eligible answers are:
Yes, I think so.
Maybe, but I don’t know.
No, I don’t think so.
5 Analysis
Author: Markus Paulhart Page 54 | 111
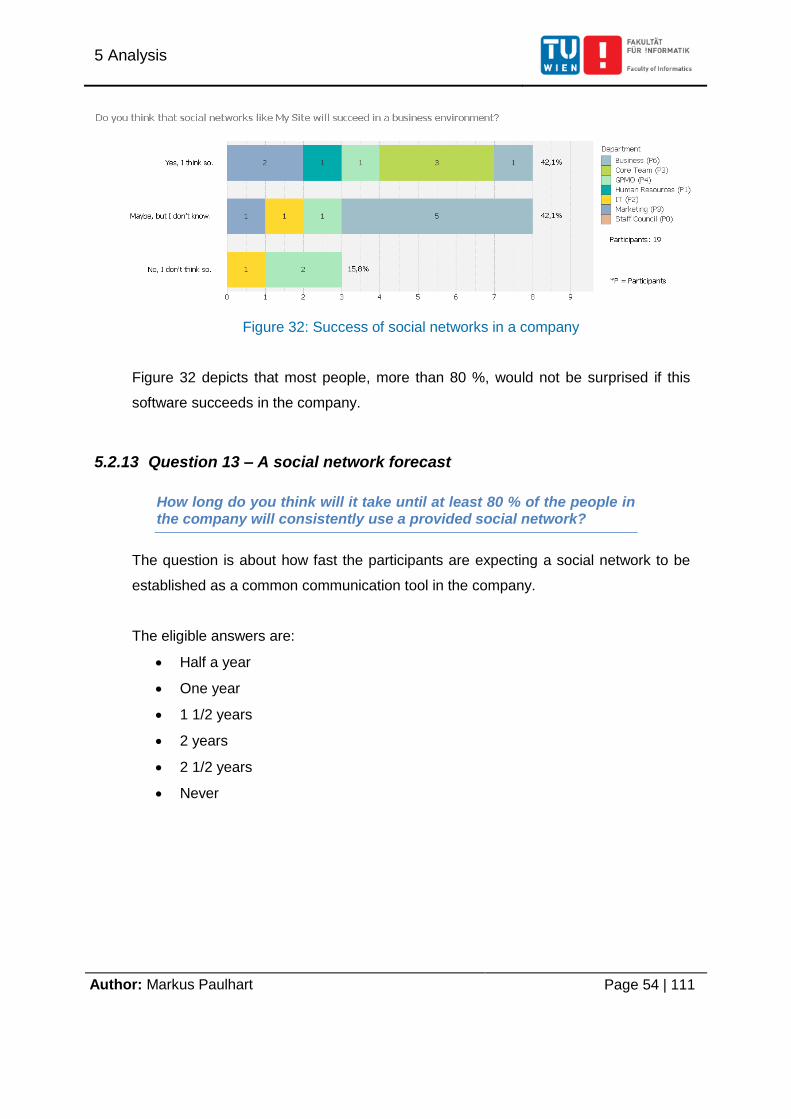
Figure 32: Success of social networks in a company
Figure 32 depicts that most people, more than 80 %, would not be surprised if this
software succeeds in the company.
5.2.13 Question 13 – A social network forecast
How long do you think will it take until at least 80 % of the people in the company will consistently use a provided social network?
The question is about how fast the participants are expecting a social network to be
established as a common communication tool in the company.
The eligible answers are:
Half a year
One year
1 1/2 years
2 years
2 1/2 years
Never
5 Analysis
Author: Markus Paulhart Page 55 | 111
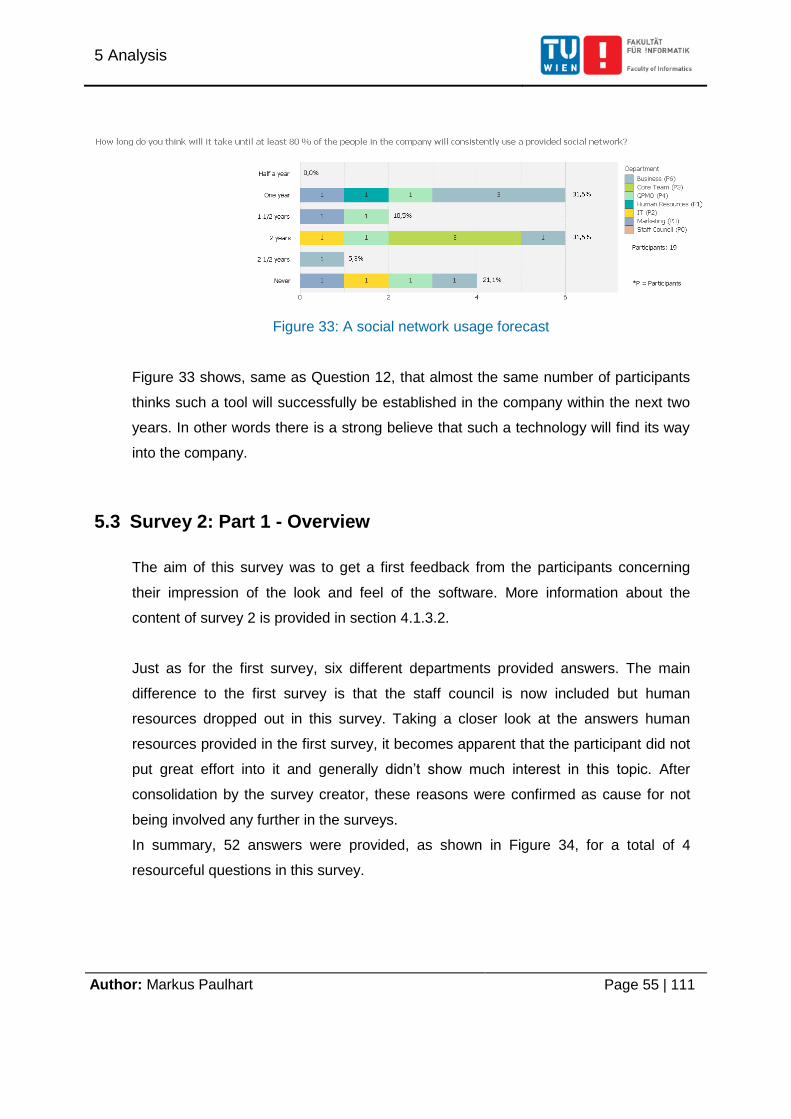
Figure 33: A social network usage forecast
Figure 33 shows, same as Question 12, that almost the same number of participants
thinks such a tool will successfully be established in the company within the next two
years. In other words there is a strong believe that such a technology will find its way
into the company.
5.3 Survey 2: Part 1 - Overview
The aim of this survey was to get a first feedback from the participants concerning
their impression of the look and feel of the software. More information about the
content of survey 2 is provided in section 4.1.3.2.
Just as for the first survey, six different departments provided answers. The main
difference to the first survey is that the staff council is now included but human
resources dropped out in this survey. Taking a closer look at the answers human
resources provided in the first survey, it becomes apparent that the participant did not
put great effort into it and generally didn’t show much interest in this topic. After
consolidation by the survey creator, these reasons were confirmed as cause for not
being involved any further in the surveys.
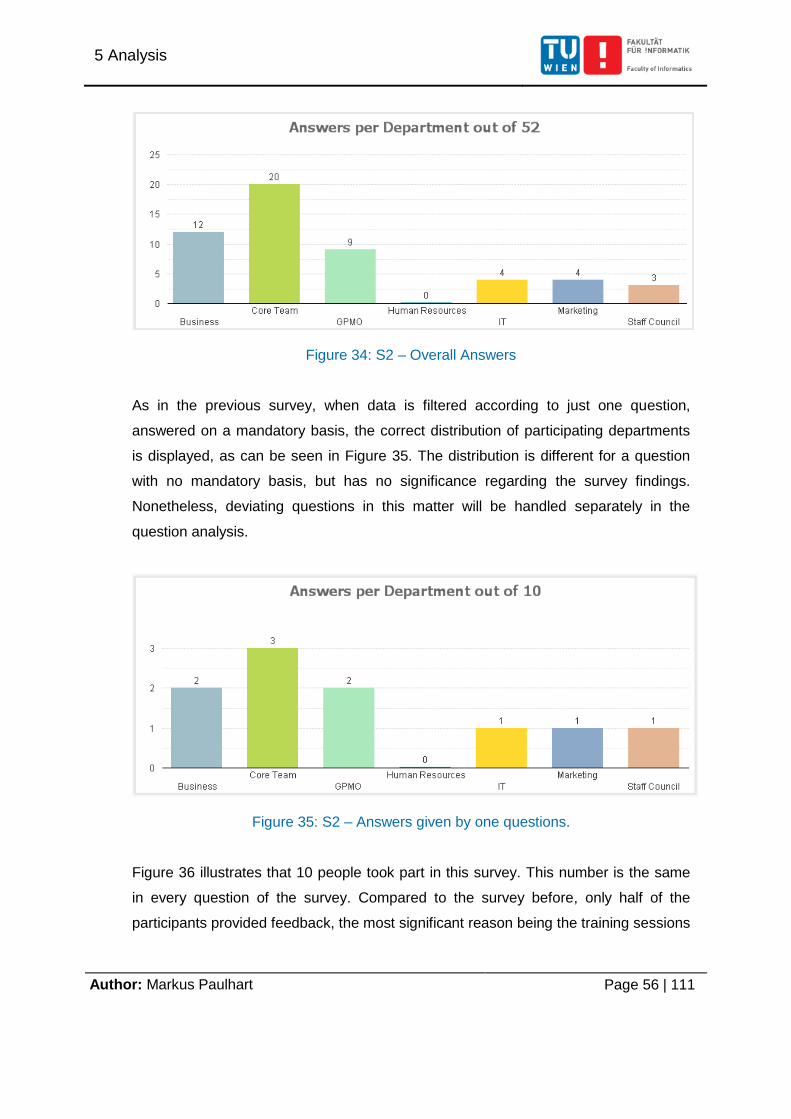
In summary, 52 answers were provided, as shown in Figure 34, for a total of 4
resourceful questions in this survey.
5 Analysis
Author: Markus Paulhart Page 56 | 111
Figure 34: S2 – Overall Answers
As in the previous survey, when data is filtered according to just one question,
answered on a mandatory basis, the correct distribution of participating departments
is displayed, as can be seen in Figure 35. The distribution is different for a question
with no mandatory basis, but has no significance regarding the survey findings.
Nonetheless, deviating questions in this matter will be handled separately in the
question analysis.
Figure 35: S2 – Answers given by one questions.
Figure 36 illustrates that 10 people took part in this survey. This number is the same
in every question of the survey. Compared to the survey before, only half of the
participants provided feedback, the most significant reason being the training sessions
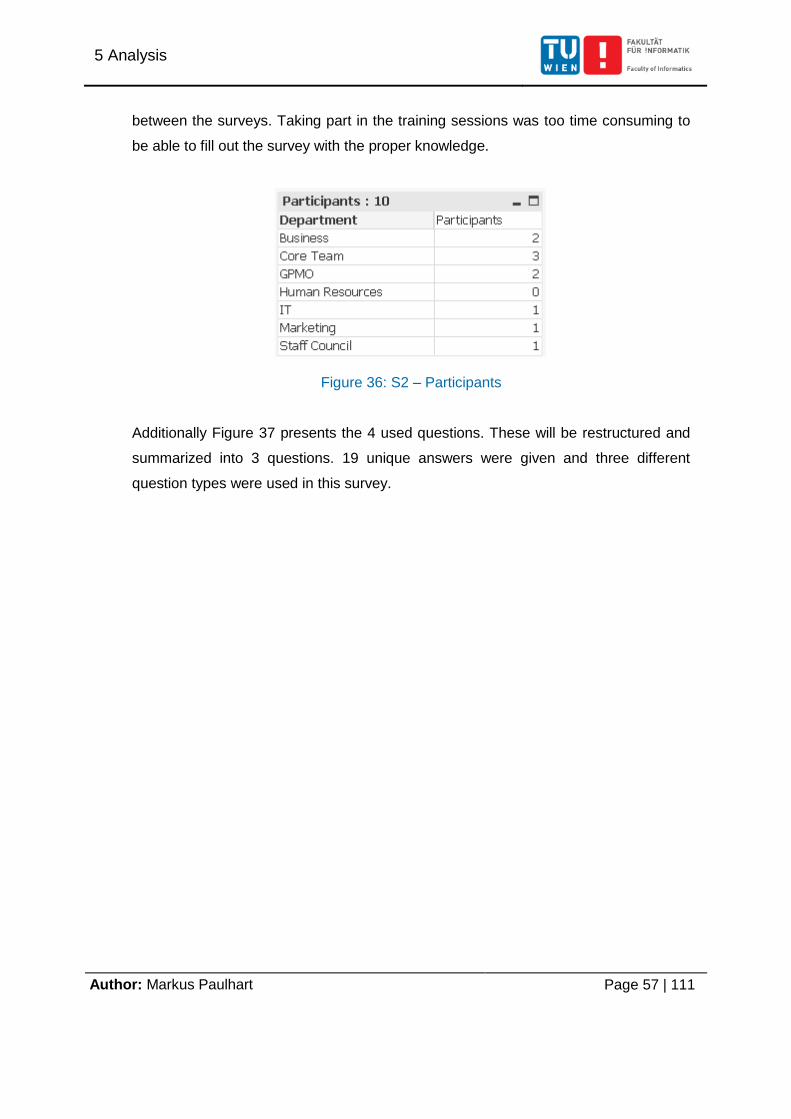
5 Analysis
Author: Markus Paulhart Page 57 | 111
between the surveys. Taking part in the training sessions was too time consuming to
be able to fill out the survey with the proper knowledge.
Figure 36: S2 – Participants
Additionally Figure 37 presents the 4 used questions. These will be restructured and
summarized into 3 questions. 19 unique answers were given and three different
question types were used in this survey.
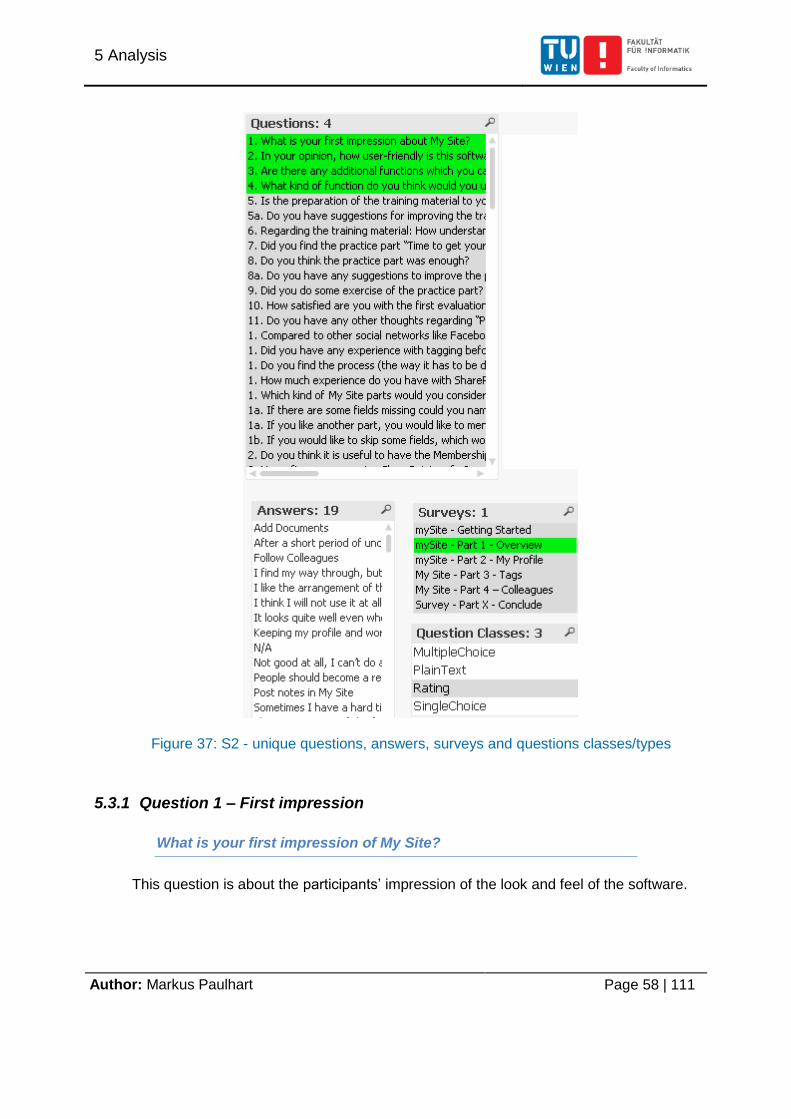
5 Analysis
Author: Markus Paulhart Page 58 | 111
Figure 37: S2 - unique questions, answers, surveys and questions classes/types
5.3.1 Question 1 – First impression
What is your first impression of My Site?
This question is about the participants’ impression of the look and feel of the software.
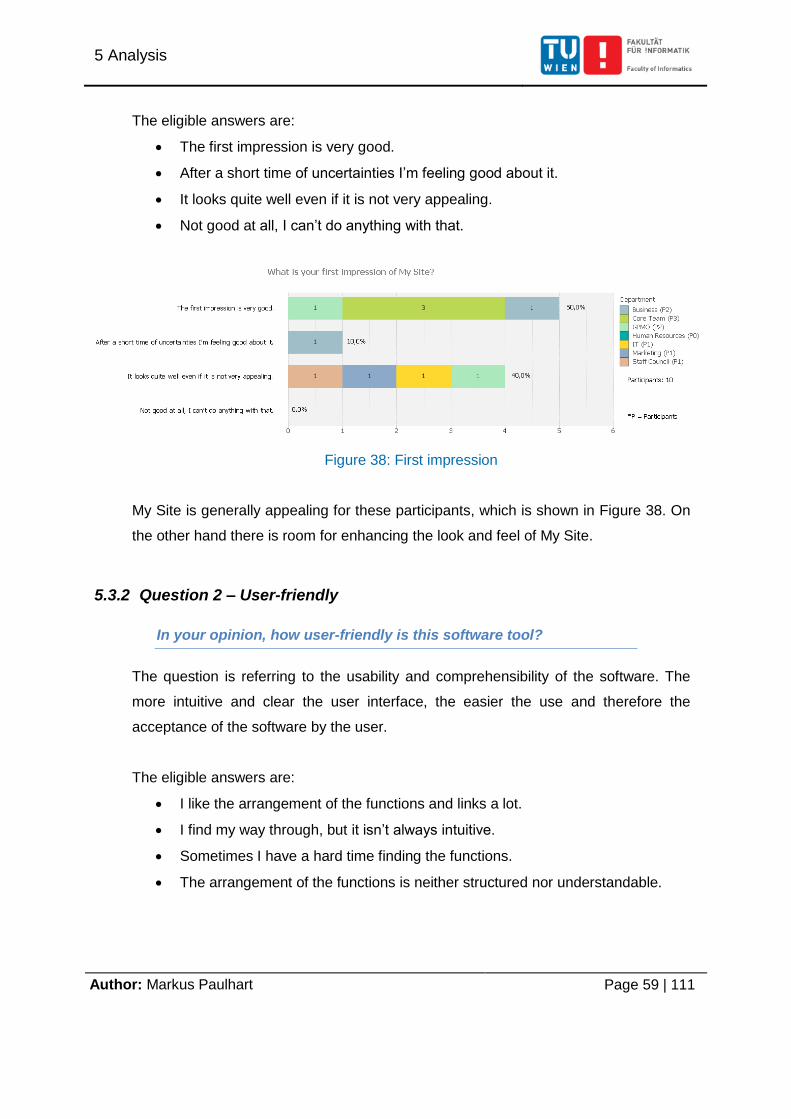
5 Analysis
Author: Markus Paulhart Page 59 | 111
The eligible answers are:
The first impression is very good.
After a short time of uncertainties I’m feeling good about it.
It looks quite well even if it is not very appealing.
Not good at all, I can’t do anything with that.
Figure 38: First impression
My Site is generally appealing for these participants, which is shown in Figure 38. On
the other hand there is room for enhancing the look and feel of My Site.
5.3.2 Question 2 – User-friendly
In your opinion, how user-friendly is this software tool?
The question is referring to the usability and comprehensibility of the software. The
more intuitive and clear the user interface, the easier the use and therefore the
acceptance of the software by the user.
The eligible answers are:
I like the arrangement of the functions and links a lot.
I find my way through, but it isn’t always intuitive.
Sometimes I have a hard time finding the functions.
The arrangement of the functions is neither structured nor understandable.
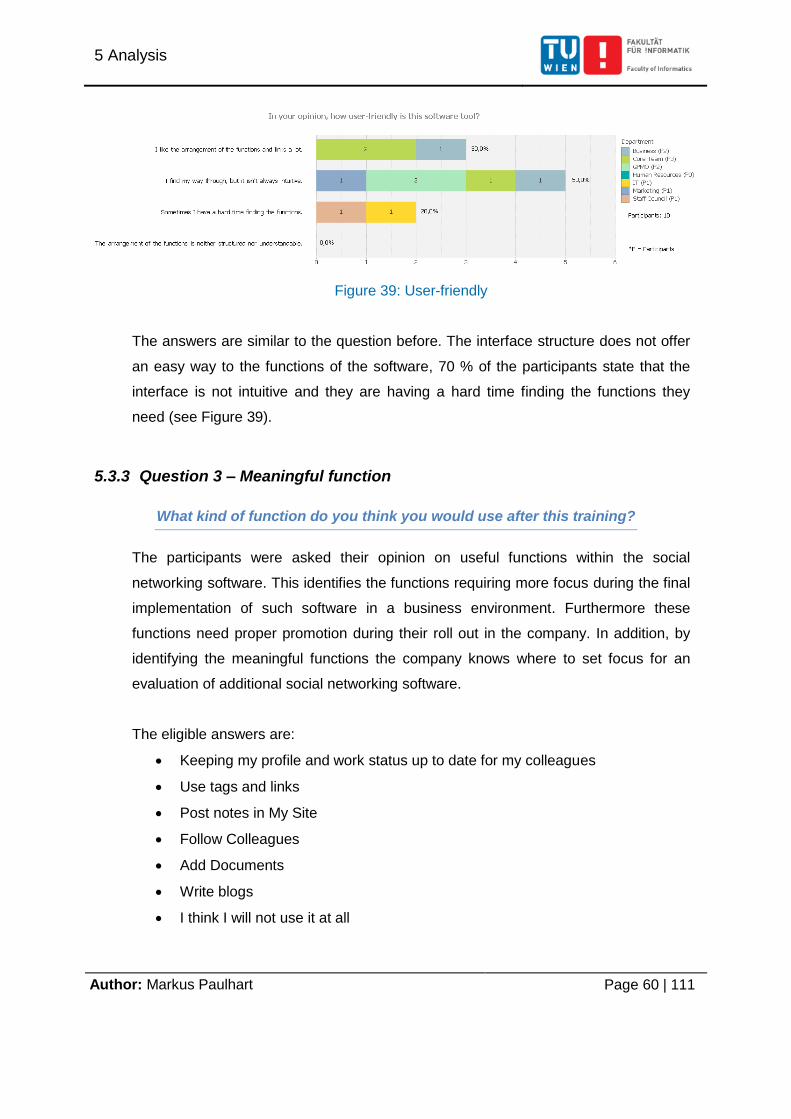
5 Analysis
Author: Markus Paulhart Page 60 | 111
Figure 39: User-friendly
The answers are similar to the question before. The interface structure does not offer
an easy way to the functions of the software, 70 % of the participants state that the
interface is not intuitive and they are having a hard time finding the functions they
need (see Figure 39).
5.3.3 Question 3 – Meaningful function
What kind of function do you think you would use after this training?
The participants were asked their opinion on useful functions within the social
networking software. This identifies the functions requiring more focus during the final
implementation of such software in a business environment. Furthermore these
functions need proper promotion during their roll out in the company. In addition, by
identifying the meaningful functions the company knows where to set focus for an
evaluation of additional social networking software.
The eligible answers are:
Keeping my profile and work status up to date for my colleagues
Use tags and links
Post notes in My Site
Follow Colleagues
Add Documents
Write blogs
I think I will not use it at all
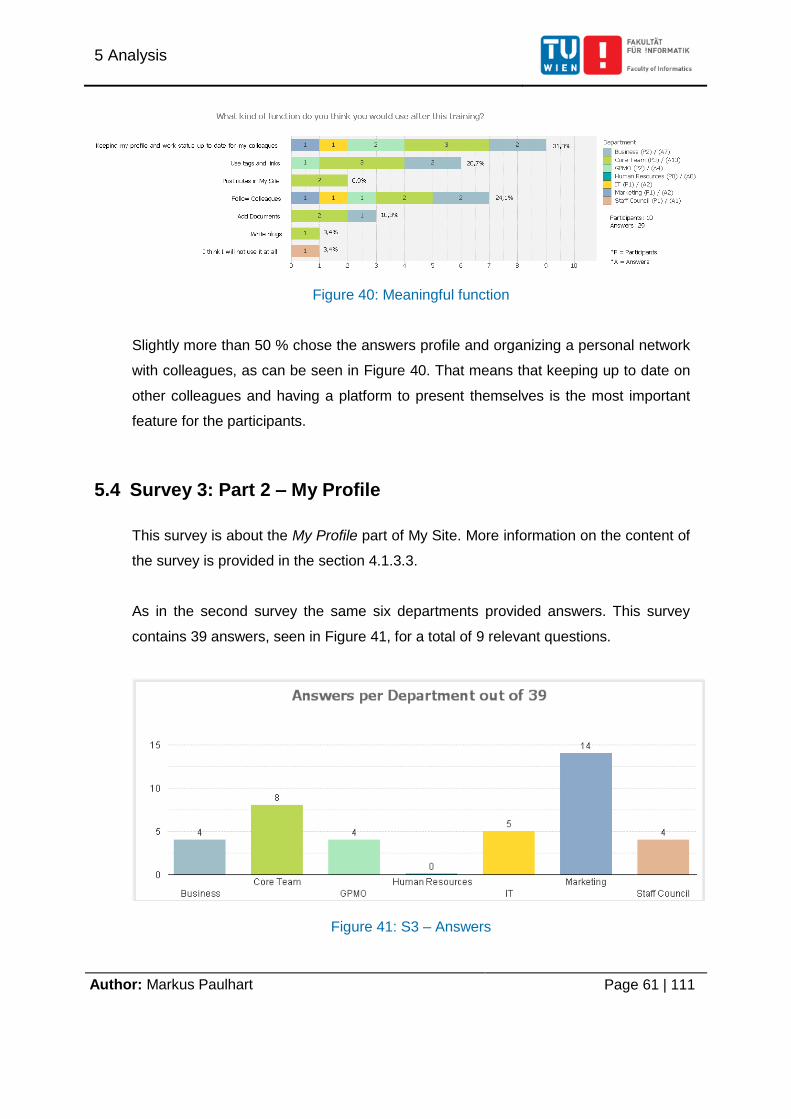
5 Analysis
Author: Markus Paulhart Page 61 | 111
Figure 40: Meaningful function
Slightly more than 50 % chose the answers profile and organizing a personal network
with colleagues, as can be seen in Figure 40. That means that keeping up to date on
other colleagues and having a platform to present themselves is the most important
feature for the participants.
5.4 Survey 3: Part 2 – My Profile
This survey is about the My Profile part of My Site. More information on the content of
the survey is provided in the section 4.1.3.3.
As in the second survey the same six departments provided answers. This survey
contains 39 answers, seen in Figure 41, for a total of 9 relevant questions.
Figure 41: S3 – Answers
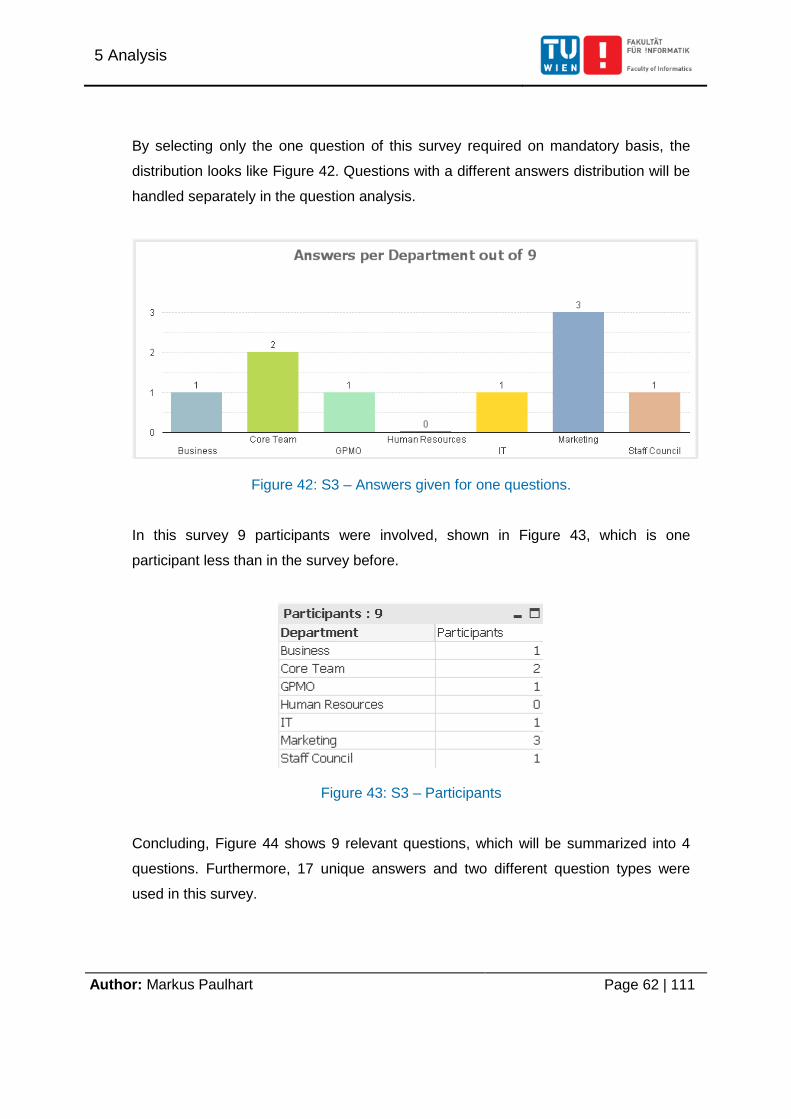
5 Analysis
Author: Markus Paulhart Page 62 | 111
By selecting only the one question of this survey required on mandatory basis, the
distribution looks like Figure 42. Questions with a different answers distribution will be
handled separately in the question analysis.
Figure 42: S3 – Answers given for one questions.
In this survey 9 participants were involved, shown in Figure 43, which is one
participant less than in the survey before.
Figure 43: S3 – Participants
Concluding, Figure 44 shows 9 relevant questions, which will be summarized into 4
questions. Furthermore, 17 unique answers and two different question types were
used in this survey.
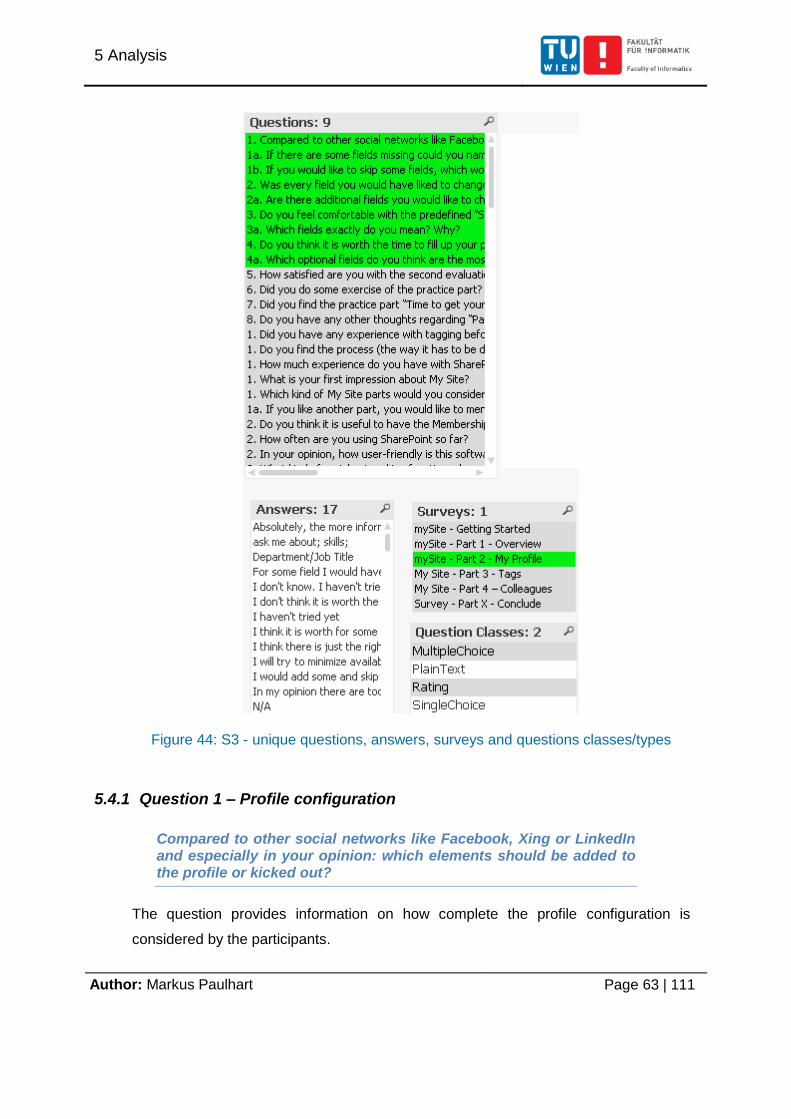
5 Analysis
Author: Markus Paulhart Page 63 | 111
Figure 44: S3 - unique questions, answers, surveys and questions classes/types
5.4.1 Question 1 – Profile configuration
Compared to other social networks like Facebook, Xing or LinkedIn and especially in your opinion: which elements should be added to the profile or kicked out?
The question provides information on how complete the profile configuration is
considered by the participants.
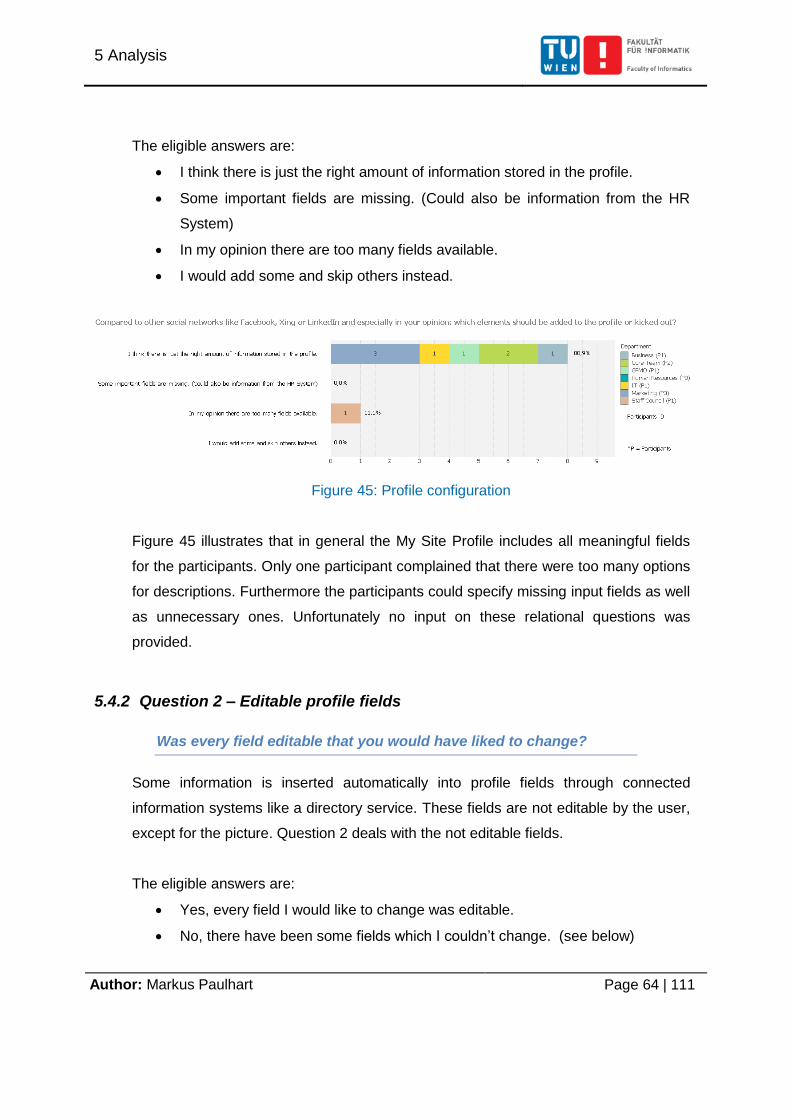
5 Analysis
Author: Markus Paulhart Page 64 | 111
The eligible answers are:
I think there is just the right amount of information stored in the profile.
Some important fields are missing. (Could also be information from the HR
System)
In my opinion there are too many fields available.
I would add some and skip others instead.
Figure 45: Profile configuration
Figure 45 illustrates that in general the My Site Profile includes all meaningful fields
for the participants. Only one participant complained that there were too many options
for descriptions. Furthermore the participants could specify missing input fields as well
as unnecessary ones. Unfortunately no input on these relational questions was
provided.
5.4.2 Question 2 – Editable profile fields
Was every field editable that you would have liked to change?
Some information is inserted automatically into profile fields through connected
information systems like a directory service. These fields are not editable by the user,
except for the picture. Question 2 deals with the not editable fields.
The eligible answers are:
Yes, every field I would like to change was editable.
No, there have been some fields which I couldn’t change. (see below)
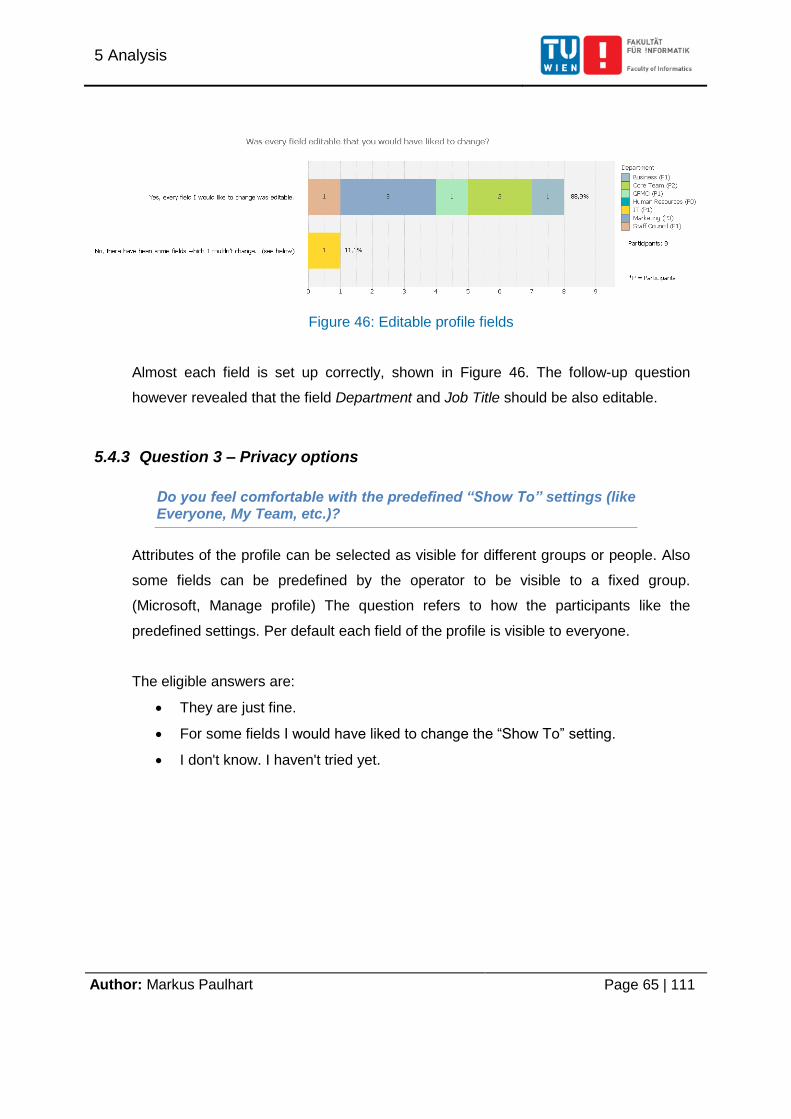
5 Analysis
Author: Markus Paulhart Page 65 | 111
Figure 46: Editable profile fields
Almost each field is set up correctly, shown in Figure 46. The follow-up question
however revealed that the field Department and Job Title should be also editable.
5.4.3 Question 3 – Privacy options
Do you feel comfortable with the predefined “Show To” settings (like Everyone, My Team, etc.)?
Attributes of the profile can be selected as visible for different groups or people. Also
some fields can be predefined by the operator to be visible to a fixed group.
(Microsoft, Manage profile) The question refers to how the participants like the
predefined settings. Per default each field of the profile is visible to everyone.
The eligible answers are:
They are just fine.
For some fields I would have liked to change the “Show To” setting.
I don't know. I haven't tried yet.
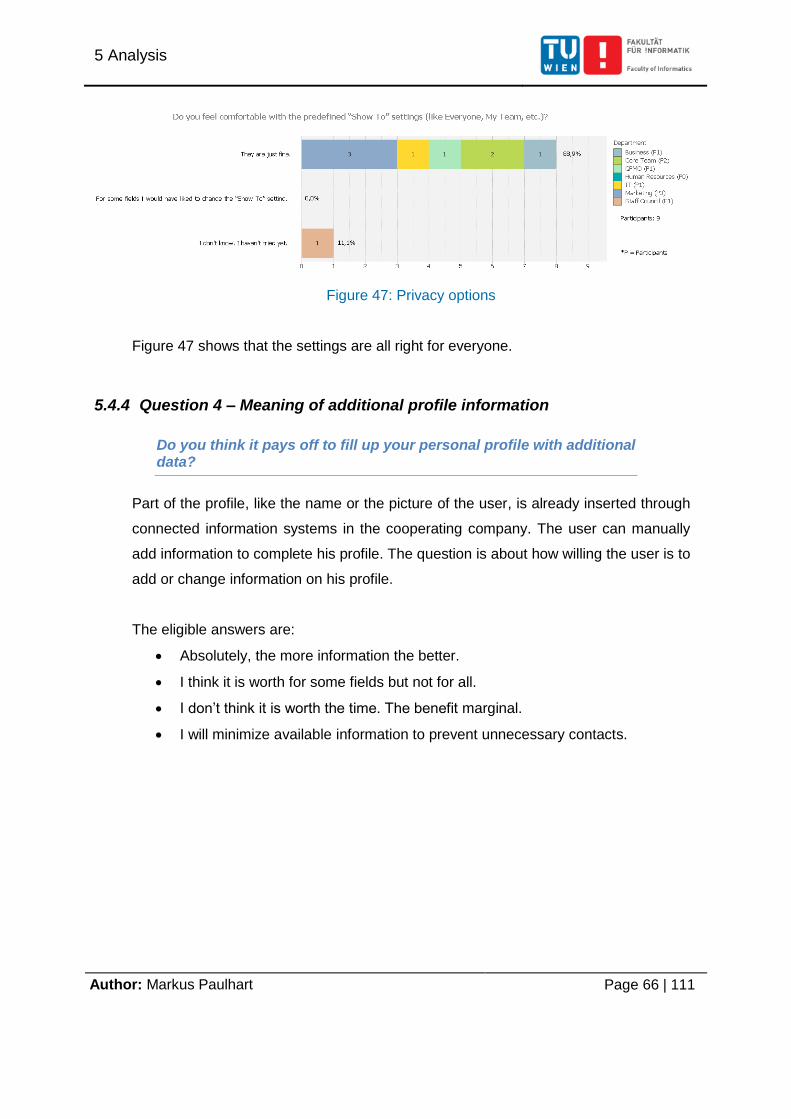
5 Analysis
Author: Markus Paulhart Page 66 | 111
Figure 47: Privacy options
Figure 47 shows that the settings are all right for everyone.
5.4.4 Question 4 – Meaning of additional profile information
Do you think it pays off to fill up your personal profile with additional data?
Part of the profile, like the name or the picture of the user, is already inserted through
connected information systems in the cooperating company. The user can manually
add information to complete his profile. The question is about how willing the user is to
add or change information on his profile.
The eligible answers are:
Absolutely, the more information the better.
I think it is worth for some fields but not for all.
I don’t think it is worth the time. The benefit marginal.
I will minimize available information to prevent unnecessary contacts.
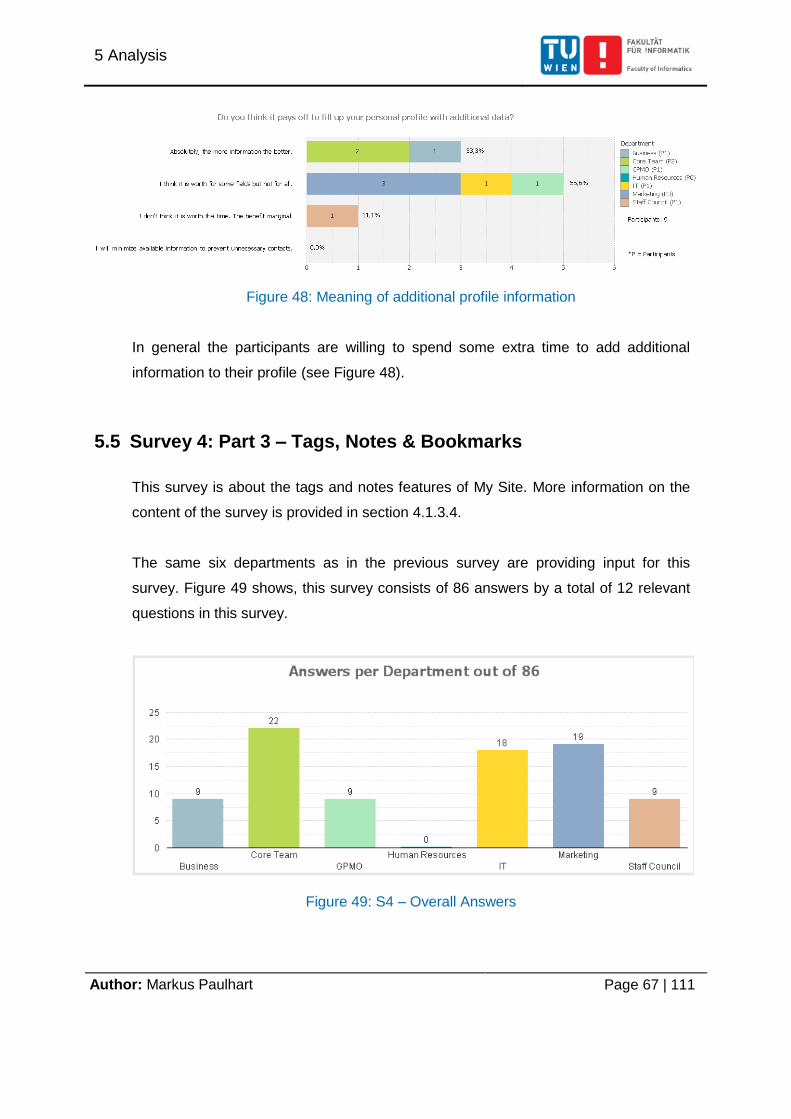
5 Analysis
Author: Markus Paulhart Page 67 | 111
Figure 48: Meaning of additional profile information
In general the participants are willing to spend some extra time to add additional
information to their profile (see Figure 48).
5.5 Survey 4: Part 3 – Tags, Notes & Bookmarks
This survey is about the tags and notes features of My Site. More information on the
content of the survey is provided in section 4.1.3.4.
The same six departments as in the previous survey are providing input for this
survey. Figure 49 shows, this survey consists of 86 answers by a total of 12 relevant
questions in this survey.
Figure 49: S4 – Overall Answers
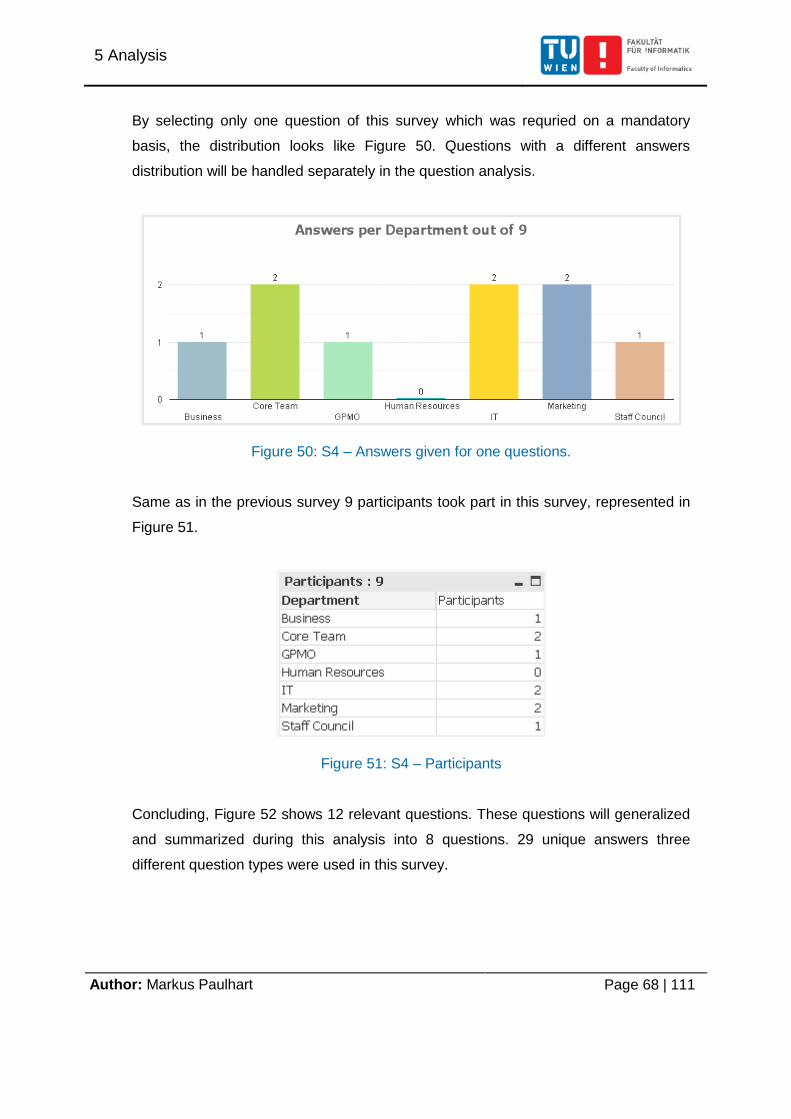
5 Analysis
Author: Markus Paulhart Page 68 | 111
By selecting only one question of this survey which was requried on a mandatory
basis, the distribution looks like Figure 50. Questions with a different answers
distribution will be handled separately in the question analysis.
Figure 50: S4 – Answers given for one questions.
Same as in the previous survey 9 participants took part in this survey, represented in
Figure 51.
Figure 51: S4 – Participants
Concluding, Figure 52 shows 12 relevant questions. These questions will generalized
and summarized during this analysis into 8 questions. 29 unique answers three
different question types were used in this survey.
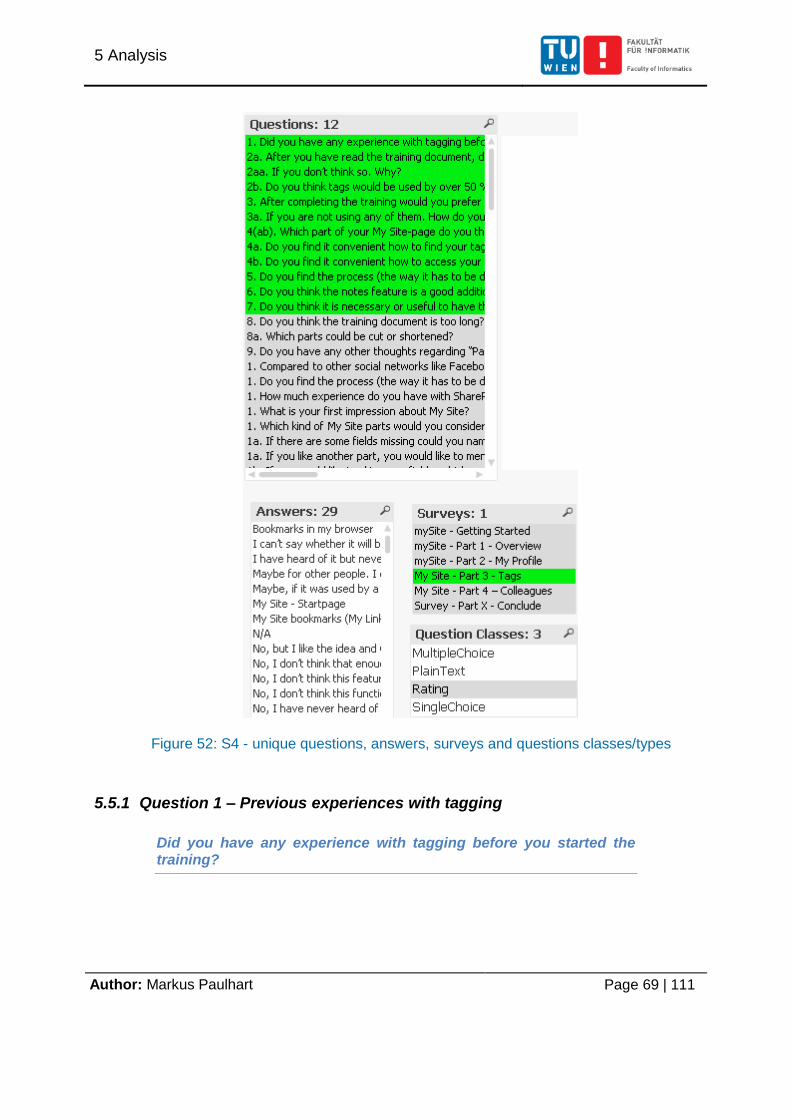
5 Analysis
Author: Markus Paulhart Page 69 | 111
Figure 52: S4 - unique questions, answers, surveys and questions classes/types
5.5.1 Question 1 – Previous experiences with tagging
Did you have any experience with tagging before you started the training?
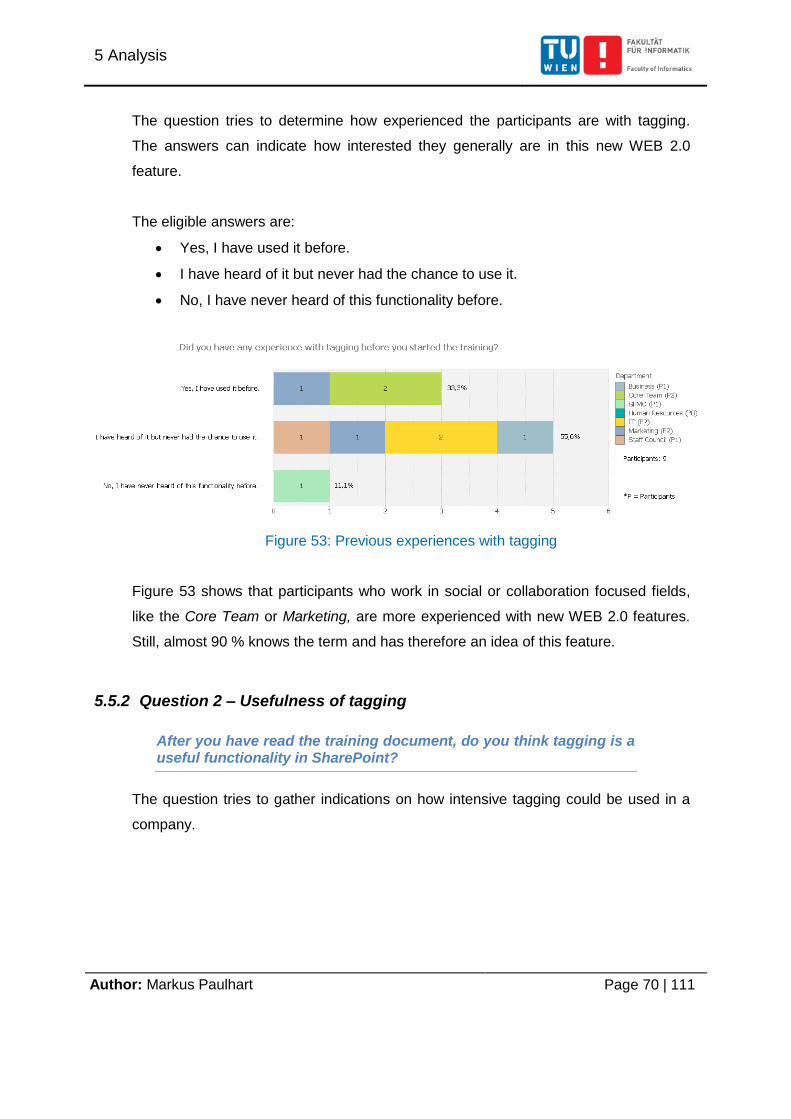
5 Analysis
Author: Markus Paulhart Page 70 | 111
The question tries to determine how experienced the participants are with tagging.
The answers can indicate how interested they generally are in this new WEB 2.0
feature.
The eligible answers are:
Yes, I have used it before.
I have heard of it but never had the chance to use it.
No, I have never heard of this functionality before.
Figure 53: Previous experiences with tagging
Figure 53 shows that participants who work in social or collaboration focused fields,
like the Core Team or Marketing, are more experienced with new WEB 2.0 features.
Still, almost 90 % knows the term and has therefore an idea of this feature.
5.5.2 Question 2 – Usefulness of tagging
After you have read the training document, do you think tagging is a useful functionality in SharePoint?
The question tries to gather indications on how intensive tagging could be used in a
company.
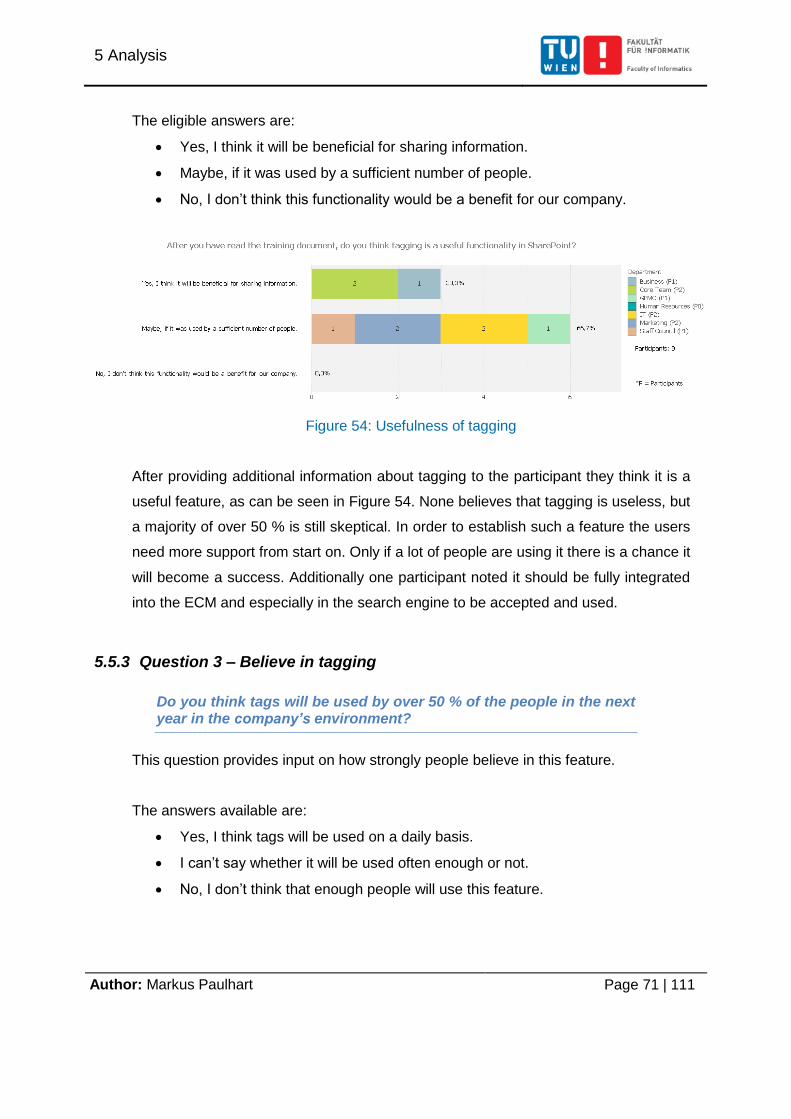
5 Analysis
Author: Markus Paulhart Page 71 | 111
The eligible answers are:
Yes, I think it will be beneficial for sharing information.
Maybe, if it was used by a sufficient number of people.
No, I don’t think this functionality would be a benefit for our company.
Figure 54: Usefulness of tagging
After providing additional information about tagging to the participant they think it is a
useful feature, as can be seen in Figure 54. None believes that tagging is useless, but
a majority of over 50 % is still skeptical. In order to establish such a feature the users
need more support from start on. Only if a lot of people are using it there is a chance it
will become a success. Additionally one participant noted it should be fully integrated
into the ECM and especially in the search engine to be accepted and used.
5.5.3 Question 3 – Believe in tagging
Do you think tags will be used by over 50 % of the people in the next year in the company’s environment?
This question provides input on how strongly people believe in this feature.
The answers available are:
Yes, I think tags will be used on a daily basis.
I can’t say whether it will be used often enough or not.
No, I don’t think that enough people will use this feature.
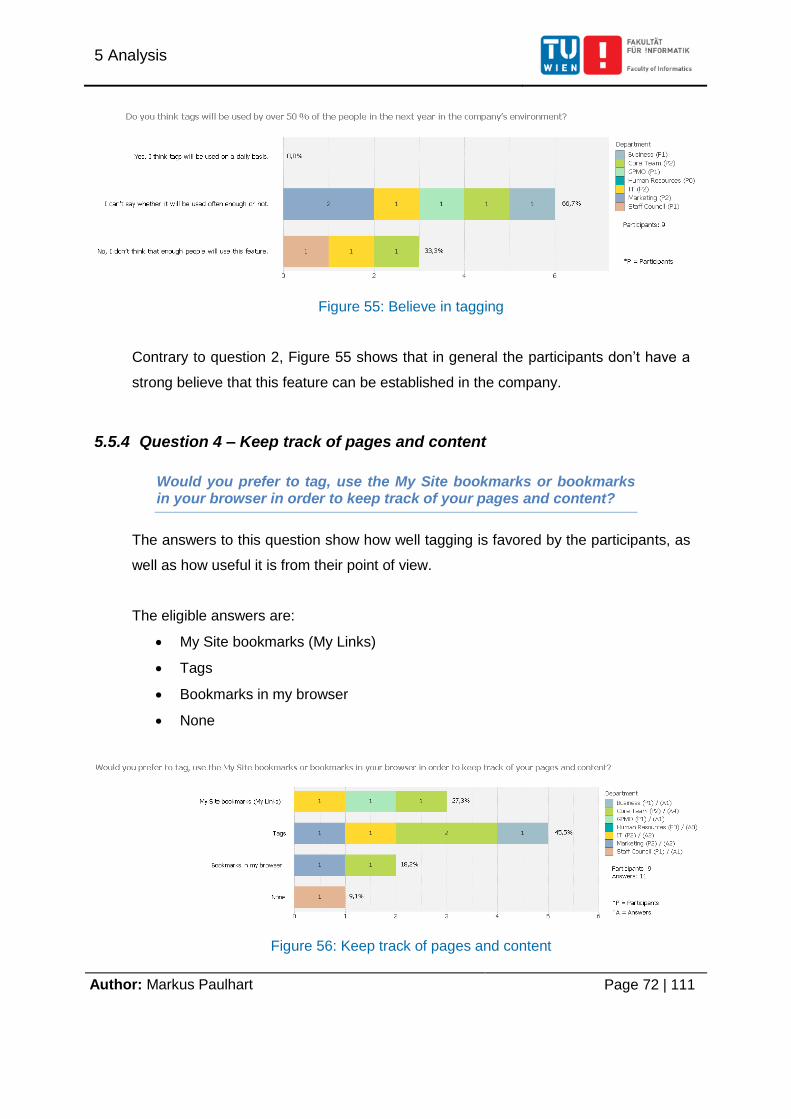
5 Analysis
Author: Markus Paulhart Page 72 | 111
Figure 55: Believe in tagging
Contrary to question 2, Figure 55 shows that in general the participants don’t have a
strong believe that this feature can be established in the company.
5.5.4 Question 4 – Keep track of pages and content
Would you prefer to tag, use the My Site bookmarks or bookmarks in your browser in order to keep track of your pages and content?
The answers to this question show how well tagging is favored by the participants, as
well as how useful it is from their point of view.
The eligible answers are:
My Site bookmarks (My Links)
Tags
Bookmarks in my browser
None
Figure 56: Keep track of pages and content
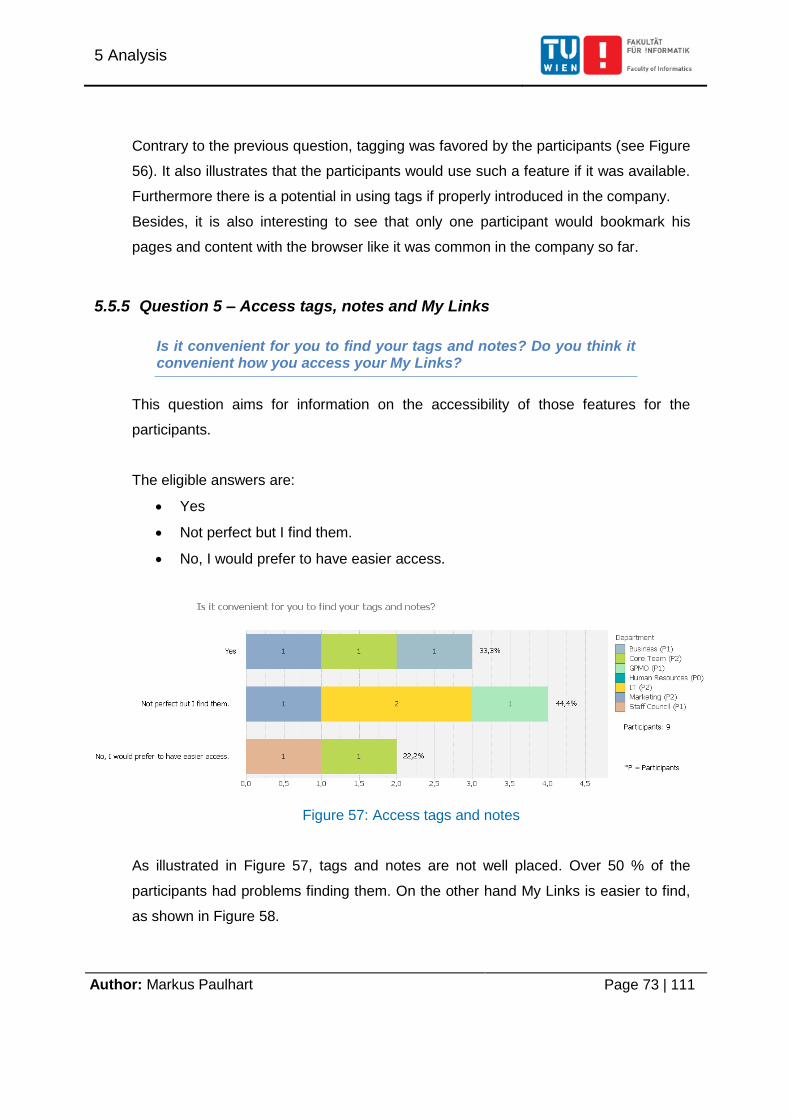
5 Analysis
Author: Markus Paulhart Page 73 | 111
Contrary to the previous question, tagging was favored by the participants (see Figure
56). It also illustrates that the participants would use such a feature if it was available.
Furthermore there is a potential in using tags if properly introduced in the company.
Besides, it is also interesting to see that only one participant would bookmark his
pages and content with the browser like it was common in the company so far.
5.5.5 Question 5 – Access tags, notes and My Links
Is it convenient for you to find your tags and notes? Do you think it convenient how you access your My Links?
This question aims for information on the accessibility of those features for the
participants.
The eligible answers are:
Yes
Not perfect but I find them.
No, I would prefer to have easier access.
Figure 57: Access tags and notes
As illustrated in Figure 57, tags and notes are not well placed. Over 50 % of the
participants had problems finding them. On the other hand My Links is easier to find,
as shown in Figure 58.
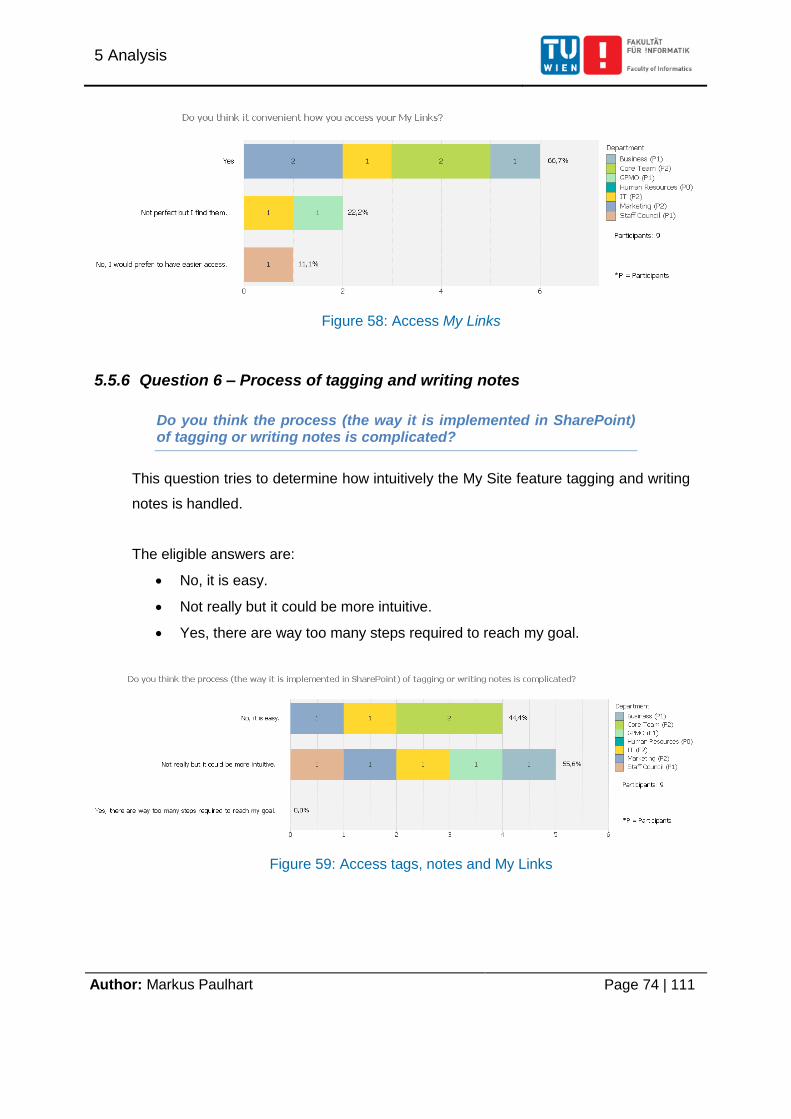
5 Analysis
Author: Markus Paulhart Page 74 | 111
Figure 58: Access My Links
5.5.6 Question 6 – Process of tagging and writing notes
Do you think the process (the way it is implemented in SharePoint) of tagging or writing notes is complicated?
This question tries to determine how intuitively the My Site feature tagging and writing
notes is handled.
The eligible answers are:
No, it is easy.
Not really but it could be more intuitive.
Yes, there are way too many steps required to reach my goal.
Figure 59: Access tags, notes and My Links
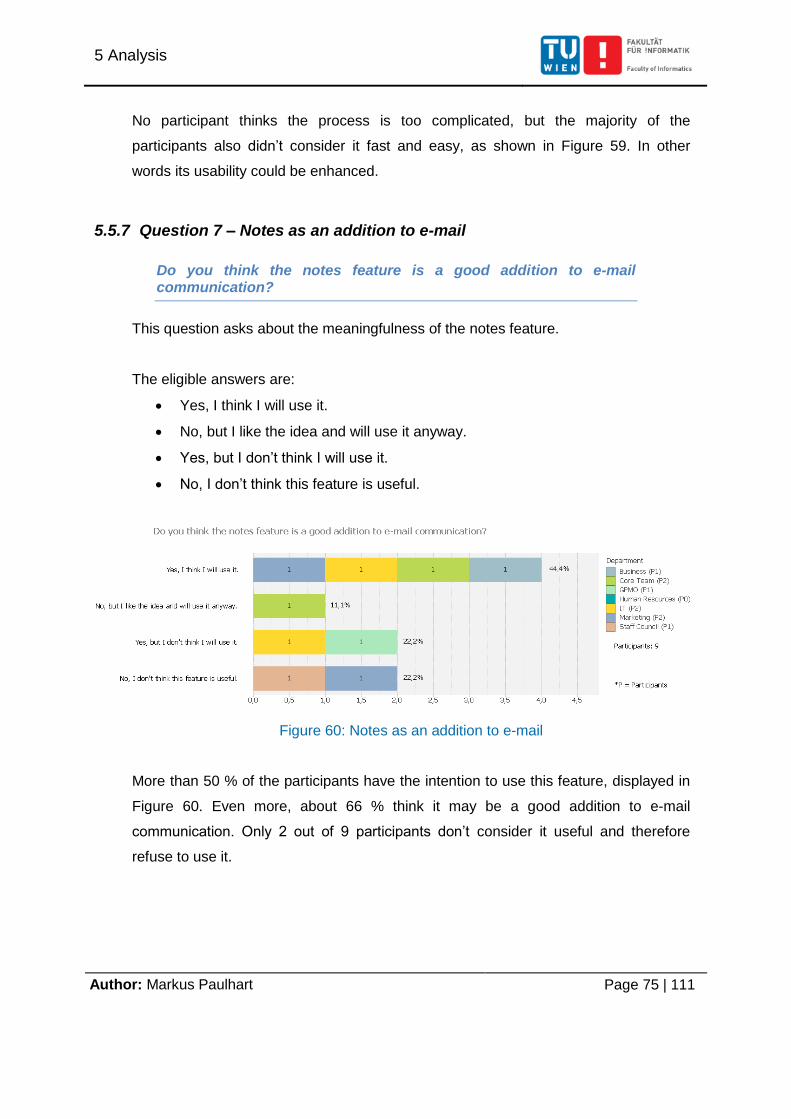
5 Analysis
Author: Markus Paulhart Page 75 | 111
No participant thinks the process is too complicated, but the majority of the
participants also didn’t consider it fast and easy, as shown in Figure 59. In other
words its usability could be enhanced.
5.5.7 Question 7 – Notes as an addition to e-mail
Do you think the notes feature is a good addition to e-mail communication?
This question asks about the meaningfulness of the notes feature.
The eligible answers are:
Yes, I think I will use it.
No, but I like the idea and will use it anyway.
Yes, but I don’t think I will use it.
No, I don’t think this feature is useful.
Figure 60: Notes as an addition to e-mail
More than 50 % of the participants have the intention to use this feature, displayed in
Figure 60. Even more, about 66 % think it may be a good addition to e-mail
communication. Only 2 out of 9 participants don’t consider it useful and therefore
refuse to use it.
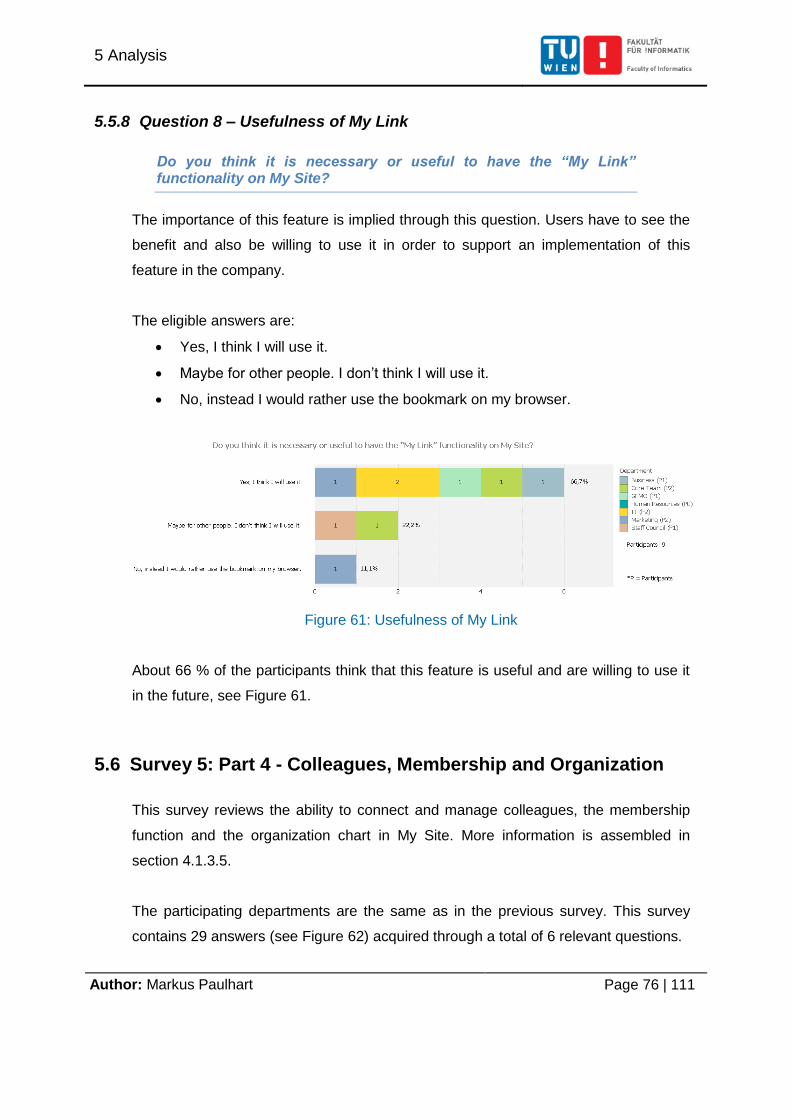
5 Analysis
Author: Markus Paulhart Page 76 | 111
5.5.8 Question 8 – Usefulness of My Link
Do you think it is necessary or useful to have the “My Link” functionality on My Site?
The importance of this feature is implied through this question. Users have to see the
benefit and also be willing to use it in order to support an implementation of this
feature in the company.
The eligible answers are:
Yes, I think I will use it.
Maybe for other people. I don’t think I will use it.
No, instead I would rather use the bookmark on my browser.
Figure 61: Usefulness of My Link
About 66 % of the participants think that this feature is useful and are willing to use it
in the future, see Figure 61.
5.6 Survey 5: Part 4 - Colleagues, Membership and Organization
This survey reviews the ability to connect and manage colleagues, the membership
function and the organization chart in My Site. More information is assembled in
section 4.1.3.5.
The participating departments are the same as in the previous survey. This survey
contains 29 answers (see Figure 62) acquired through a total of 6 relevant questions.
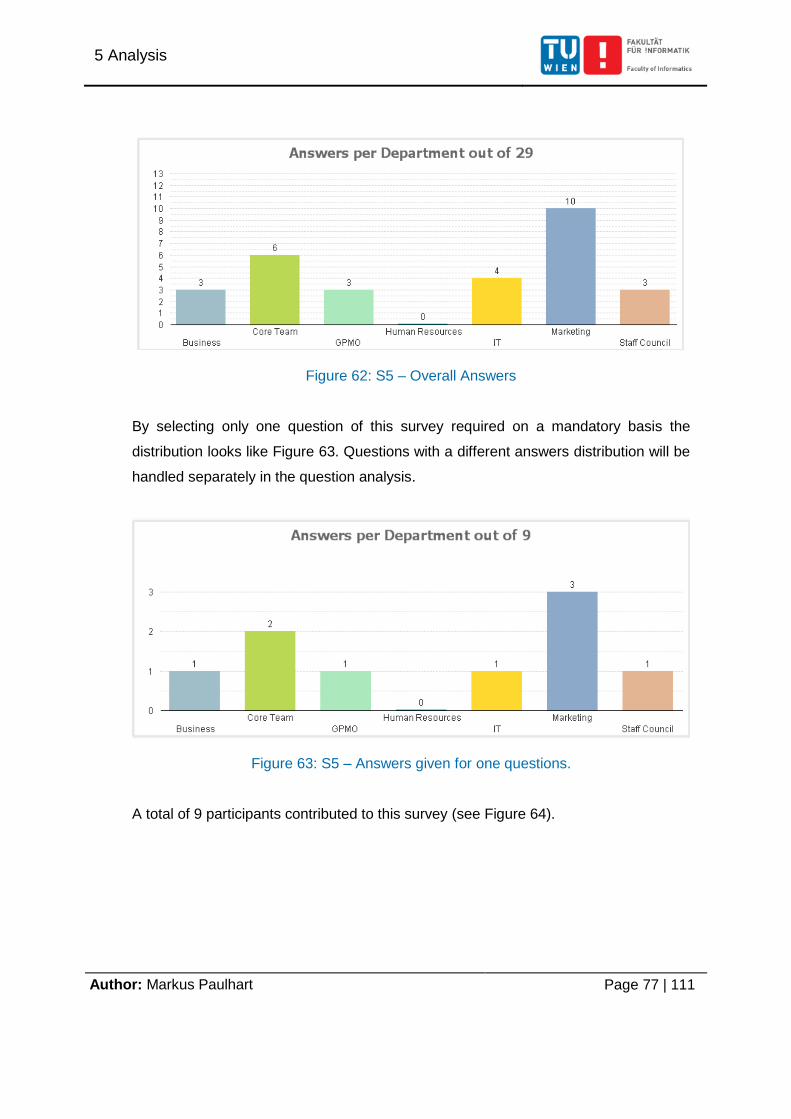
5 Analysis
Author: Markus Paulhart Page 77 | 111
Figure 62: S5 – Overall Answers
By selecting only one question of this survey required on a mandatory basis the
distribution looks like Figure 63. Questions with a different answers distribution will be
handled separately in the question analysis.
Figure 63: S5 – Answers given for one questions.
A total of 9 participants contributed to this survey (see Figure 64).
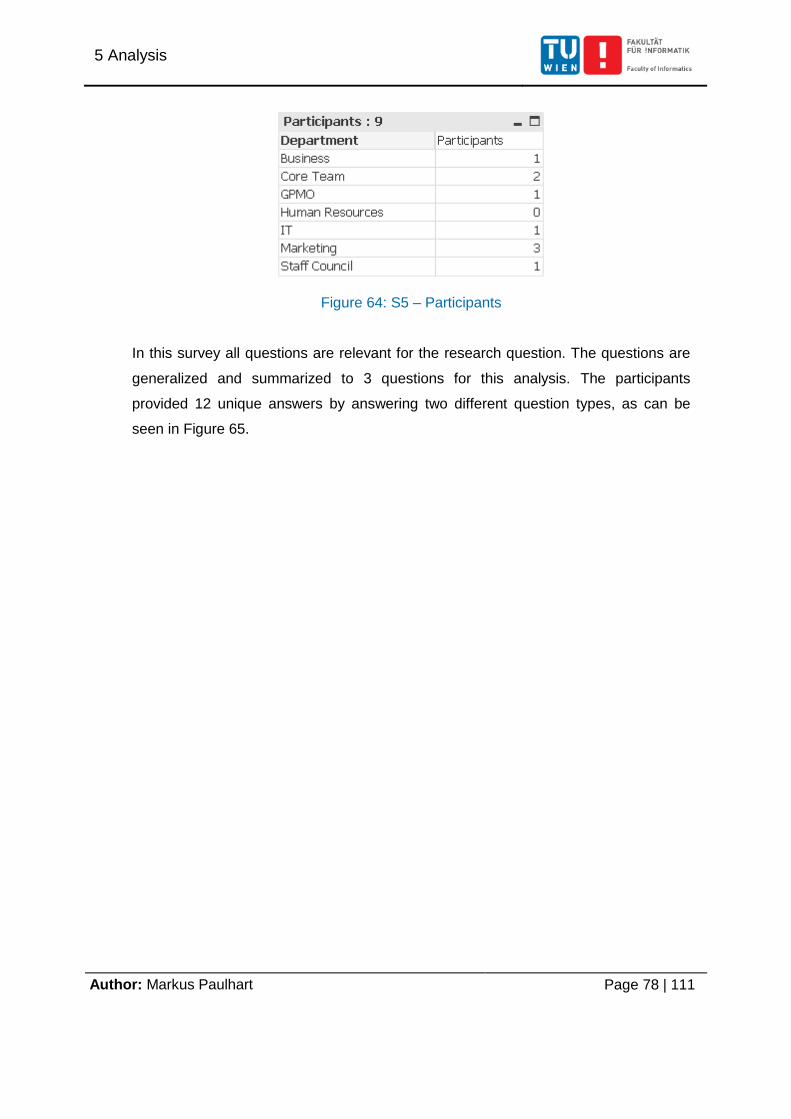
5 Analysis
Author: Markus Paulhart Page 78 | 111
Figure 64: S5 – Participants
In this survey all questions are relevant for the research question. The questions are
generalized and summarized to 3 questions for this analysis. The participants
provided 12 unique answers by answering two different question types, as can be
seen in Figure 65.
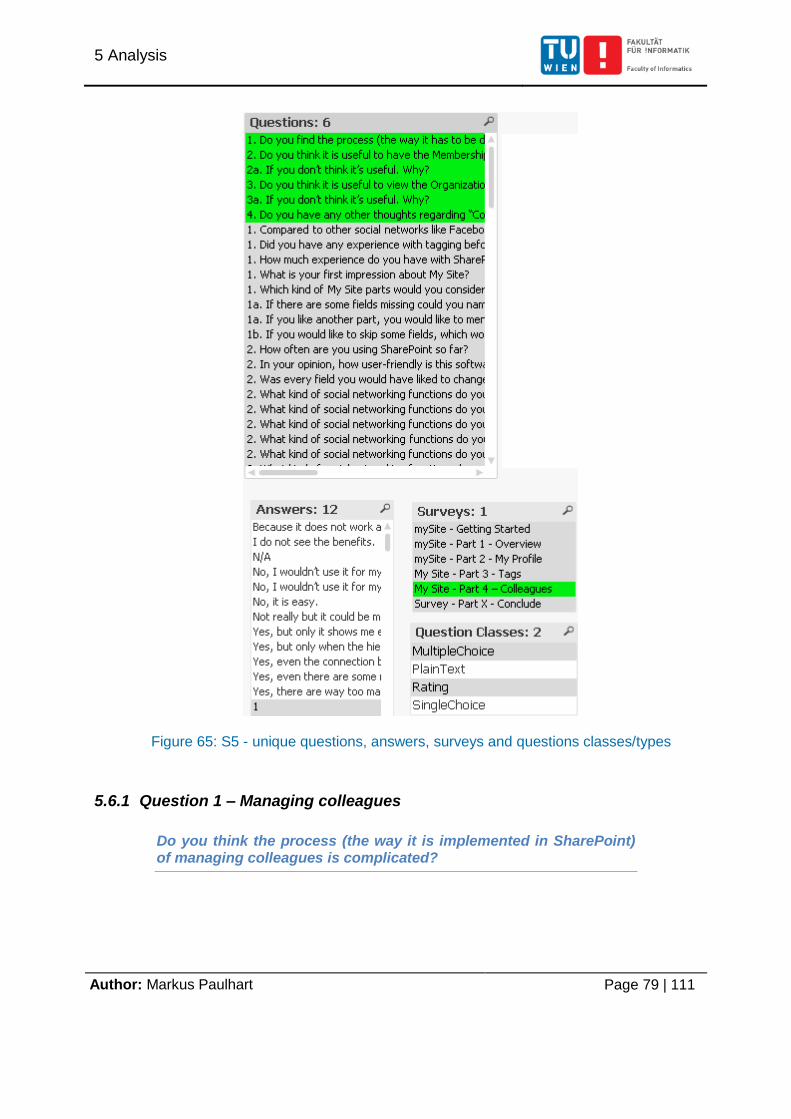
5 Analysis
Author: Markus Paulhart Page 79 | 111
Figure 65: S5 - unique questions, answers, surveys and questions classes/types
5.6.1 Question 1 – Managing colleagues
Do you think the process (the way it is implemented in SharePoint) of managing colleagues is complicated?
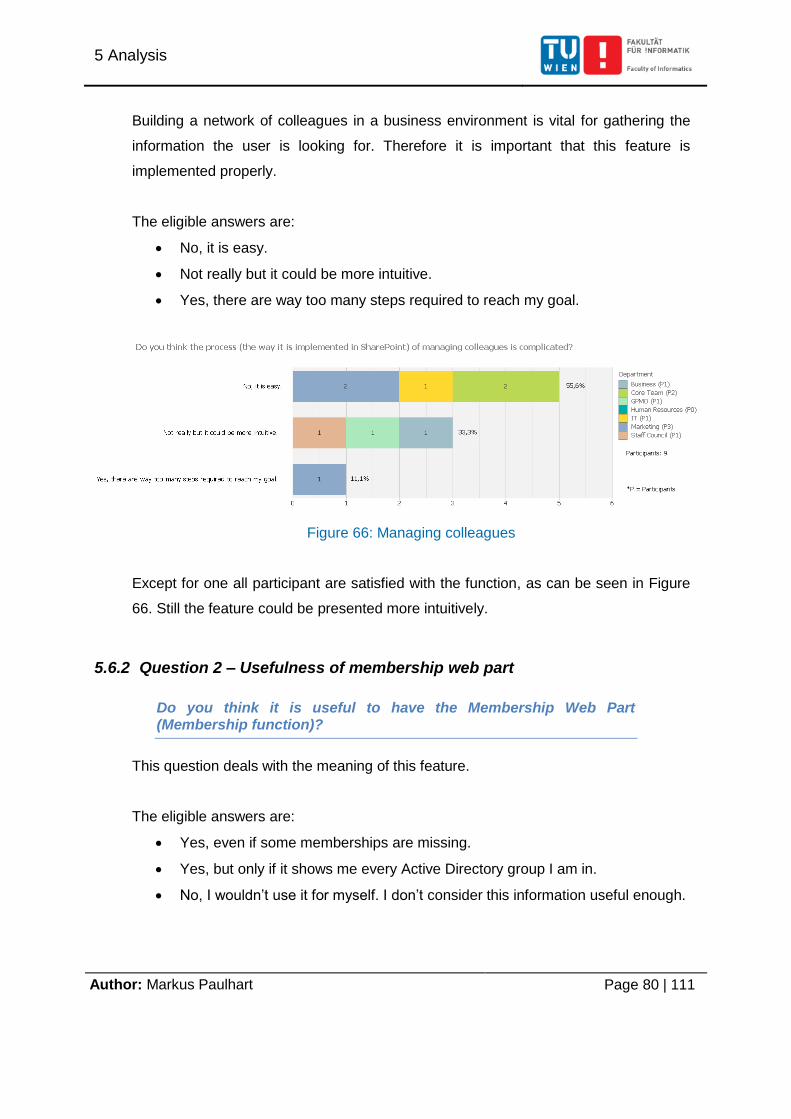
5 Analysis
Author: Markus Paulhart Page 80 | 111
Building a network of colleagues in a business environment is vital for gathering the
information the user is looking for. Therefore it is important that this feature is
implemented properly.
The eligible answers are:
No, it is easy.
Not really but it could be more intuitive.
Yes, there are way too many steps required to reach my goal.
Figure 66: Managing colleagues
Except for one all participant are satisfied with the function, as can be seen in Figure
66. Still the feature could be presented more intuitively.
5.6.2 Question 2 – Usefulness of membership web part
Do you think it is useful to have the Membership Web Part (Membership function)?
This question deals with the meaning of this feature.
The eligible answers are:
Yes, even if some memberships are missing.
Yes, but only if it shows me every Active Directory group I am in.
No, I wouldn’t use it for myself. I don’t consider this information useful enough.
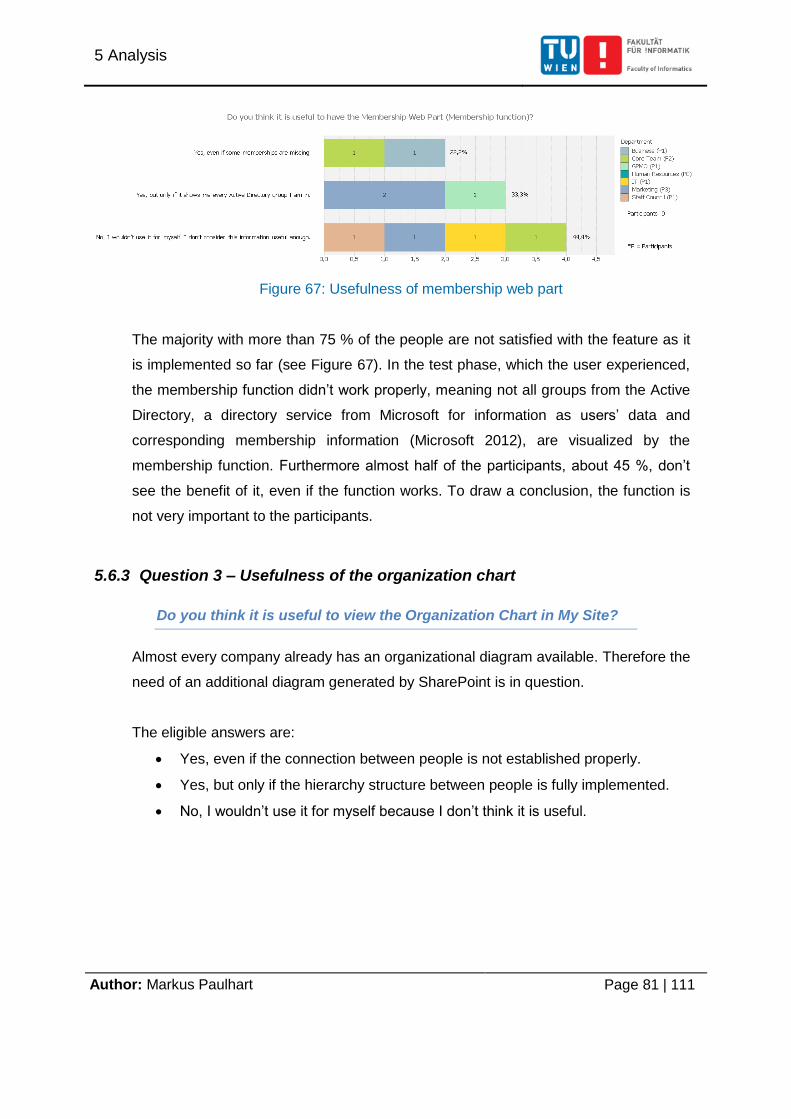
5 Analysis
Author: Markus Paulhart Page 81 | 111
Figure 67: Usefulness of membership web part
The majority with more than 75 % of the people are not satisfied with the feature as it
is implemented so far (see Figure 67). In the test phase, which the user experienced,
the membership function didn’t work properly, meaning not all groups from the Active
Directory, a directory service from Microsoft for information as users’ data and
corresponding membership information (Microsoft 2012), are visualized by the
membership function. Furthermore almost half of the participants, about 45 %, don’t
see the benefit of it, even if the function works. To draw a conclusion, the function is
not very important to the participants.
5.6.3 Question 3 – Usefulness of the organization chart
Do you think it is useful to view the Organization Chart in My Site?
Almost every company already has an organizational diagram available. Therefore the
need of an additional diagram generated by SharePoint is in question.
The eligible answers are:
Yes, even if the connection between people is not established properly.
Yes, but only if the hierarchy structure between people is fully implemented.
No, I wouldn’t use it for myself because I don’t think it is useful.
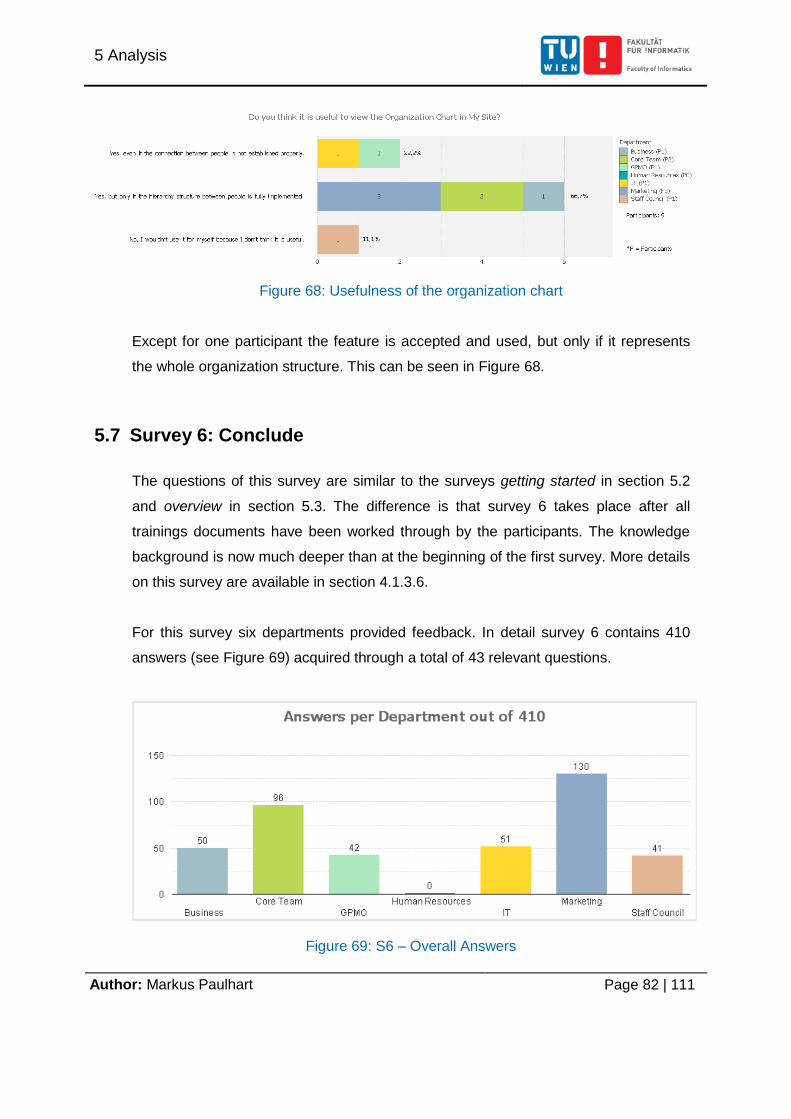
5 Analysis
Author: Markus Paulhart Page 82 | 111
Figure 68: Usefulness of the organization chart
Except for one participant the feature is accepted and used, but only if it represents
the whole organization structure. This can be seen in Figure 68.
5.7 Survey 6: Conclude
The questions of this survey are similar to the surveys getting started in section 5.2
and overview in section 5.3. The difference is that survey 6 takes place after all
trainings documents have been worked through by the participants. The knowledge
background is now much deeper than at the beginning of the first survey. More details
on this survey are available in section 4.1.3.6.
For this survey six departments provided feedback. In detail survey 6 contains 410
answers (see Figure 69) acquired through a total of 43 relevant questions.
Figure 69: S6 – Overall Answers
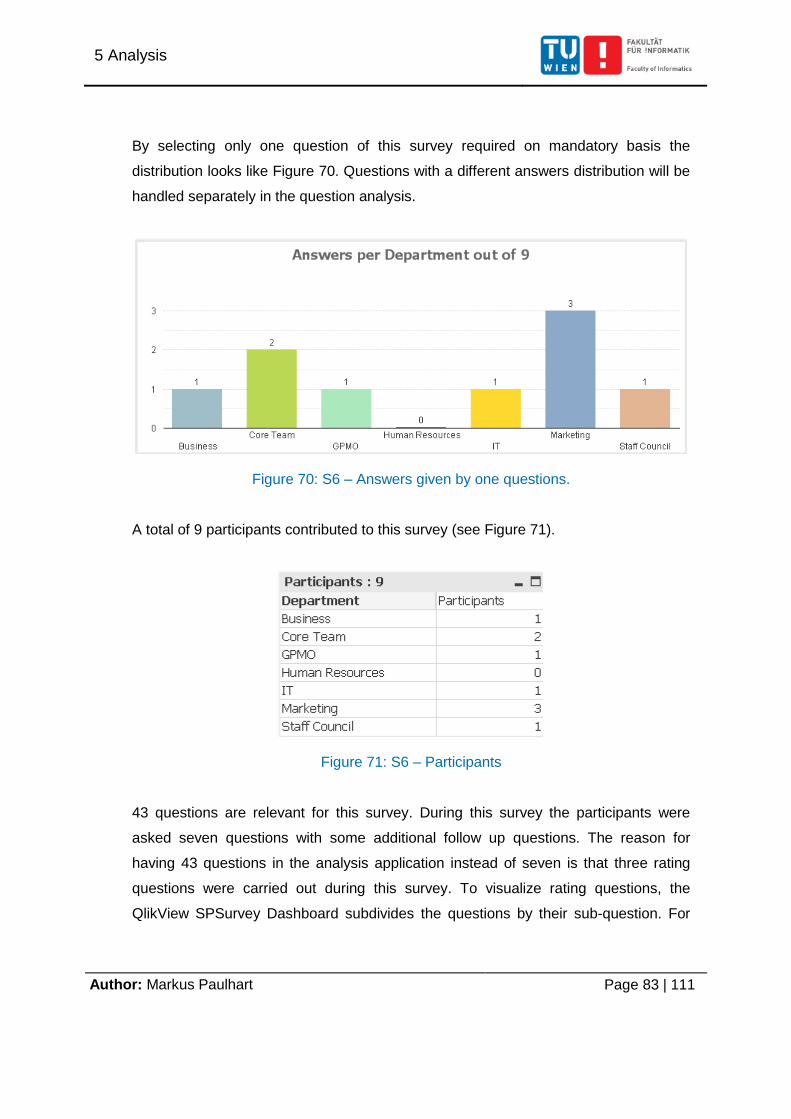
5 Analysis
Author: Markus Paulhart Page 83 | 111
By selecting only one question of this survey required on mandatory basis the
distribution looks like Figure 70. Questions with a different answers distribution will be
handled separately in the question analysis.
Figure 70: S6 – Answers given by one questions.
A total of 9 participants contributed to this survey (see Figure 71).
Figure 71: S6 – Participants
43 questions are relevant for this survey. During this survey the participants were
asked seven questions with some additional follow up questions. The reason for
having 43 questions in the analysis application instead of seven is that three rating
questions were carried out during this survey. To visualize rating questions, the
QlikView SPSurvey Dashboard subdivides the questions by their sub-question. For
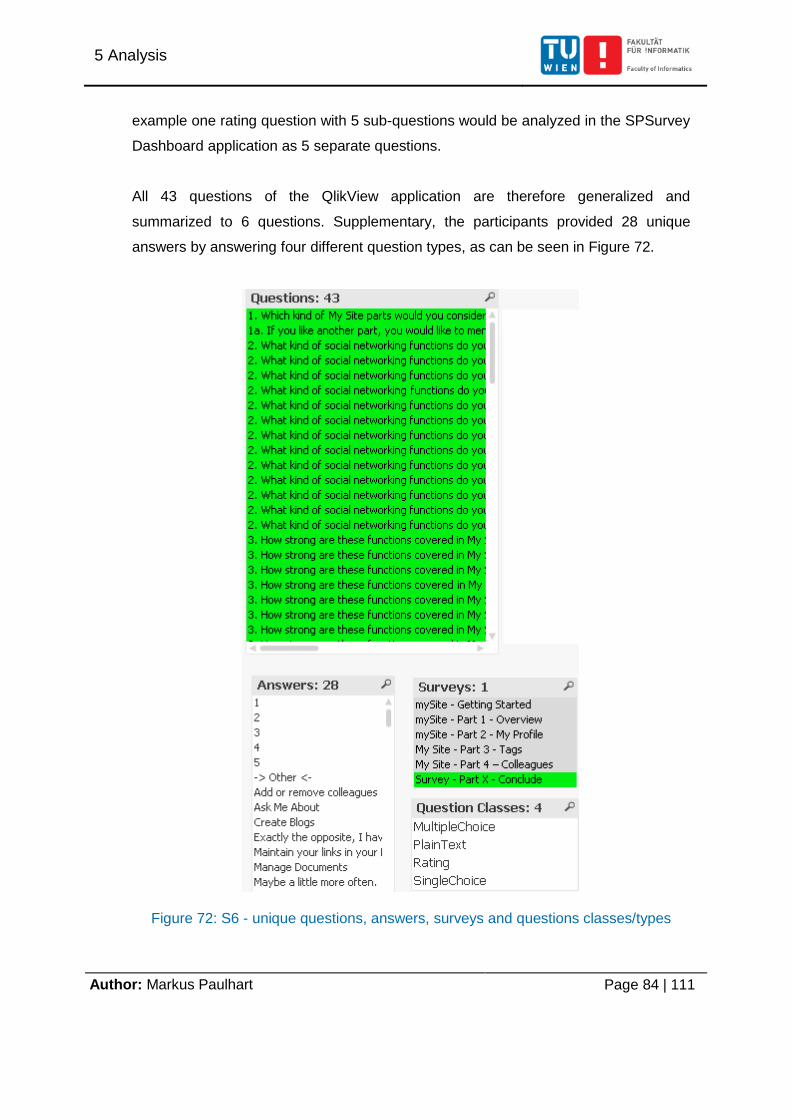
5 Analysis
Author: Markus Paulhart Page 84 | 111
example one rating question with 5 sub-questions would be analyzed in the SPSurvey
Dashboard application as 5 separate questions.
All 43 questions of the QlikView application are therefore generalized and
summarized to 6 questions. Supplementary, the participants provided 28 unique
answers by answering four different question types, as can be seen in Figure 72.
Figure 72: S6 - unique questions, answers, surveys and questions classes/types
5 Analysis
Author: Markus Paulhart Page 85 | 111
5.7.1 Question 1 – Useful My Site parts
Which My Site parts would you consider useful in a business embedded social network?
This question is equivalent to the question in section 5.3.3 form the survey Part 1 -
Overview. The focus is on the usefulness of the functions and the way they are
implemented.
The goal is to determine the change of perspective of the participants after using My
Site more often.
The eligible answers are:
Start page
View the profile of colleagues
Speech balloon
Read notes
Add or remove colleagues
Manage Documents
View your profile
Create Blogs
Ask Me About
Note Board
Tagging
Maintain your links in your My Site
Memberships
Organization Chart
-> Other <-
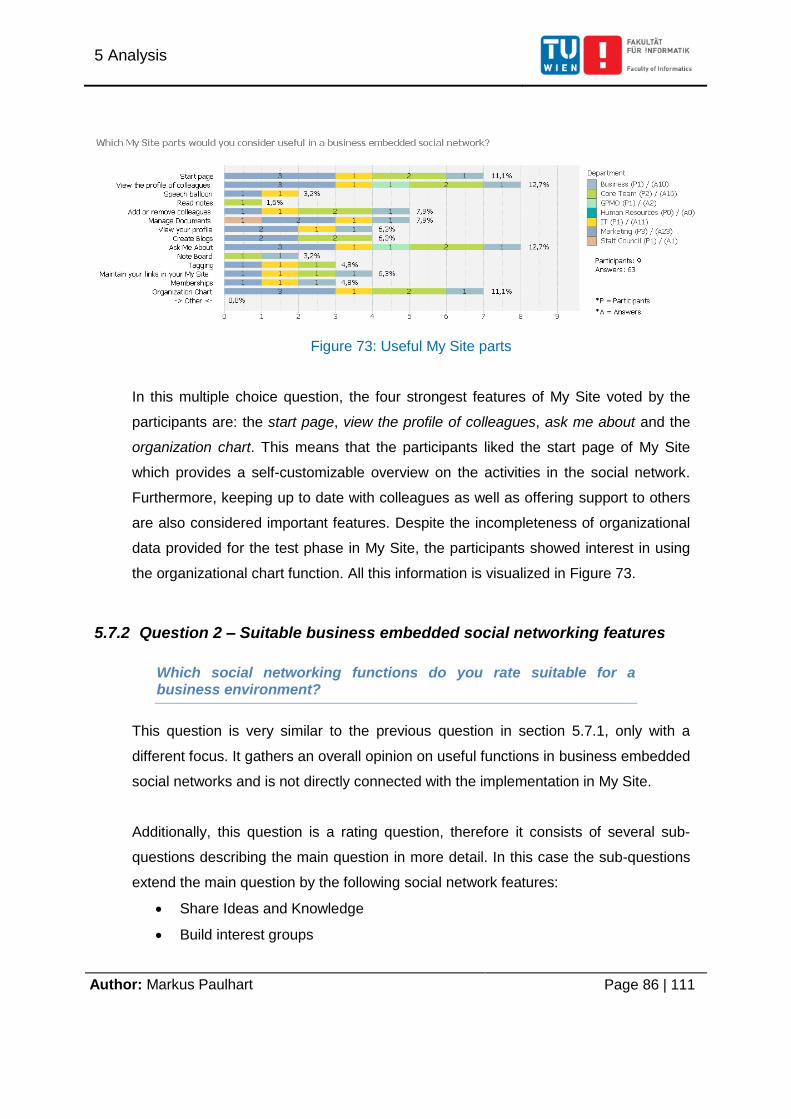
5 Analysis
Author: Markus Paulhart Page 86 | 111
Figure 73: Useful My Site parts
In this multiple choice question, the four strongest features of My Site voted by the
participants are: the start page, view the profile of colleagues, ask me about and the
organization chart. This means that the participants liked the start page of My Site
which provides a self-customizable overview on the activities in the social network.
Furthermore, keeping up to date with colleagues as well as offering support to others
are also considered important features. Despite the incompleteness of organizational
data provided for the test phase in My Site, the participants showed interest in using
the organizational chart function. All this information is visualized in Figure 73.
5.7.2 Question 2 – Suitable business embedded social networking features
Which social networking functions do you rate suitable for a business environment?
This question is very similar to the previous question in section 5.7.1, only with a
different focus. It gathers an overall opinion on useful functions in business embedded
social networks and is not directly connected with the implementation in My Site.
Additionally, this question is a rating question, therefore it consists of several sub-
questions describing the main question in more detail. In this case the sub-questions
extend the main question by the following social network features:
Share Ideas and Knowledge
Build interest groups
5 Analysis
Author: Markus Paulhart Page 87 | 111
Chat / Message
Organize Events
Find people with the same interest
Find someone you could work with
Share and store documents or media
Present yourself
Get the latest news
What other people do
Stay informed about your interests
Keep up with friends (relationship)
Show your Skills
As can be derived from the answers, the most important part for the participants is to
find people with the same interest to develop a successful working relationship. This
also includes self-presentation on the platform. On the other side using such a
business tool to stay in contact with friends within the company has been voted down
to the most unwanted feature. Therefore such a tool will only be taken seriously if the
focus stays on the business side, no attempt to use it for private purpose should be
made during the roll out or promotion of such a tool.
Additionally, getting the latest company or colleague’s business news on the social
networking platform is also one of the most important features.
5.7.3 Question 3 – My Site in comparison
How well are these features covered in My Site? Especially in a business environment compared to Xing, Facebook, LinkedIn, etc.?
This question is about how good Microsoft has built the software My Site compared to
other common social networking tools, based on the features also discussed in the
previous question of section 5.7.2.
This question is a rating question, it consists of several sub-questions describing the
main question in more detail. In this case the sub-questions extend the main question
5 Analysis
Author: Markus Paulhart Page 88 | 111
by the social network features presented in the previous question and adds some
more. A complete list of the questioned features is shown below:
Share Ideas and Knowledge
Build interest groups
Chat / Message
Organize Events
Find people with the same interest
Find someone you could work with
Share and store documents or media
Present yourself
Get the latest news
What other people do
Stay informed about your interests
Keep up with friends (relationship)
Show your Skills
As can be derived from the answers of this rating question, My Site does a very good
job connecting people with the same interests to establish a productive working
relationship. It also presents the latest news in a very practical way. The user profile is
also one of the strongest parts in My Site.
On the Contrary, it is not useful for maintaining personal friendships.
5.7.4 Question 4 – My Site design
How do you like the design of the My Site?
This question is about the look and feel of My Site.
This question is also a rating question, therefor it consists of several sub-questions
describing the main question more in detail. In this case the sub-questions are My Site
styles in general as well as My Site parts. These are listed below:
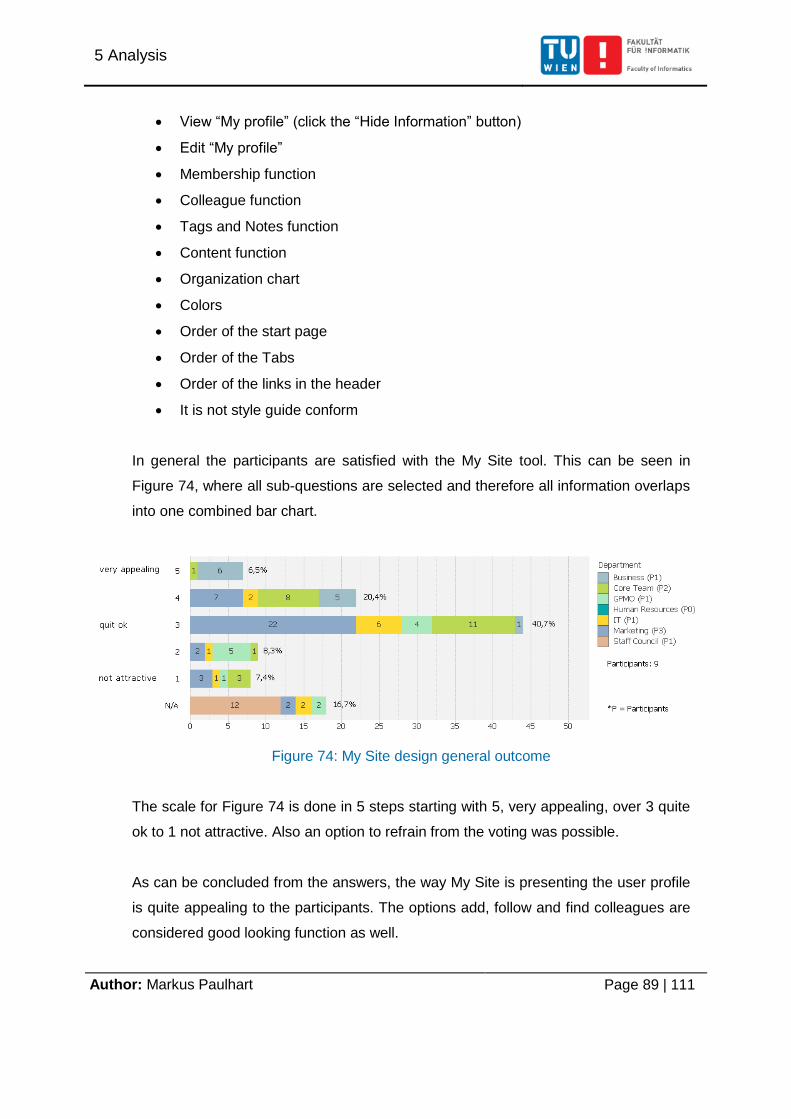
5 Analysis
Author: Markus Paulhart Page 89 | 111
View “My profile” (click the “Hide Information” button)
Edit “My profile”
Membership function
Colleague function
Tags and Notes function
Content function
Organization chart
Colors
Order of the start page
Order of the Tabs
Order of the links in the header
It is not style guide conform
In general the participants are satisfied with the My Site tool. This can be seen in
Figure 74, where all sub-questions are selected and therefore all information overlaps
into one combined bar chart.
Figure 74: My Site design general outcome
The scale for Figure 74 is done in 5 steps starting with 5, very appealing, over 3 quite
ok to 1 not attractive. Also an option to refrain from the voting was possible.
As can be concluded from the answers, the way My Site is presenting the user profile
is quite appealing to the participants. The options add, follow and find colleagues are
considered good looking function as well.
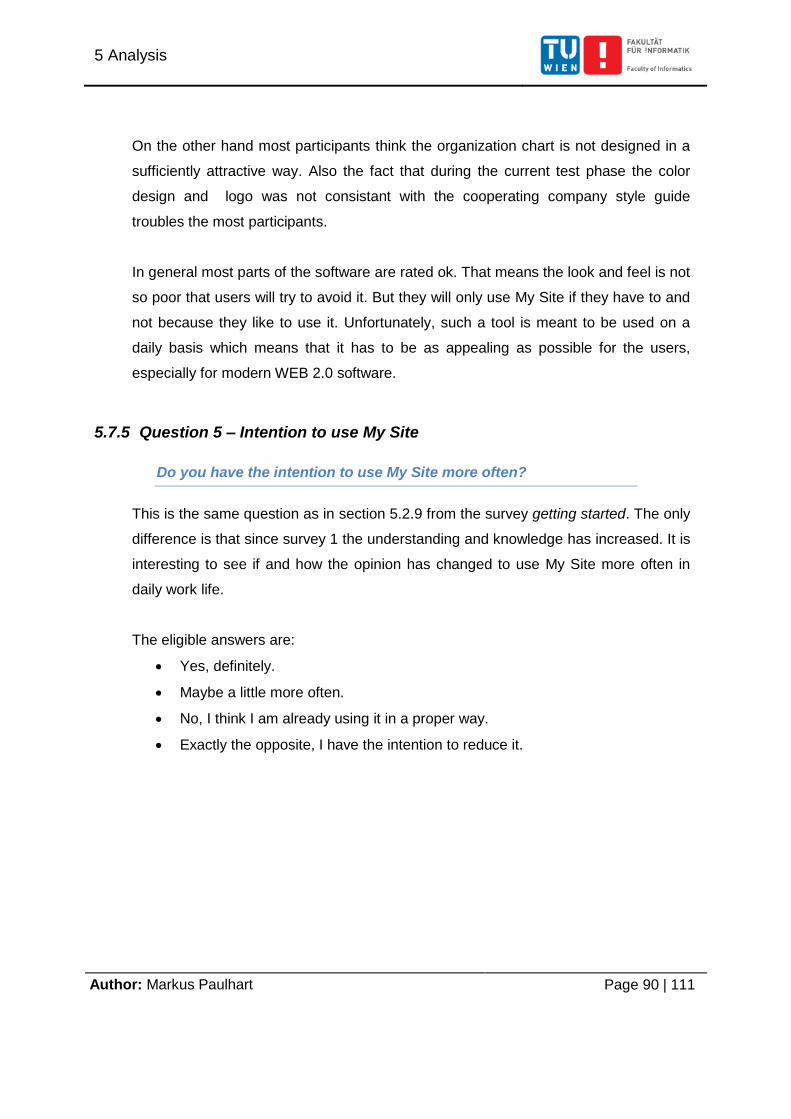
5 Analysis
Author: Markus Paulhart Page 90 | 111
On the other hand most participants think the organization chart is not designed in a
sufficiently attractive way. Also the fact that during the current test phase the color
design and logo was not consistant with the cooperating company style guide
troubles the most participants.
In general most parts of the software are rated ok. That means the look and feel is not
so poor that users will try to avoid it. But they will only use My Site if they have to and
not because they like to use it. Unfortunately, such a tool is meant to be used on a
daily basis which means that it has to be as appealing as possible for the users,
especially for modern WEB 2.0 software.
5.7.5 Question 5 – Intention to use My Site
Do you have the intention to use My Site more often?
This is the same question as in section 5.2.9 from the survey getting started. The only
difference is that since survey 1 the understanding and knowledge has increased. It is
interesting to see if and how the opinion has changed to use My Site more often in
daily work life.
The eligible answers are:
Yes, definitely.
Maybe a little more often.
No, I think I am already using it in a proper way.
Exactly the opposite, I have the intention to reduce it.
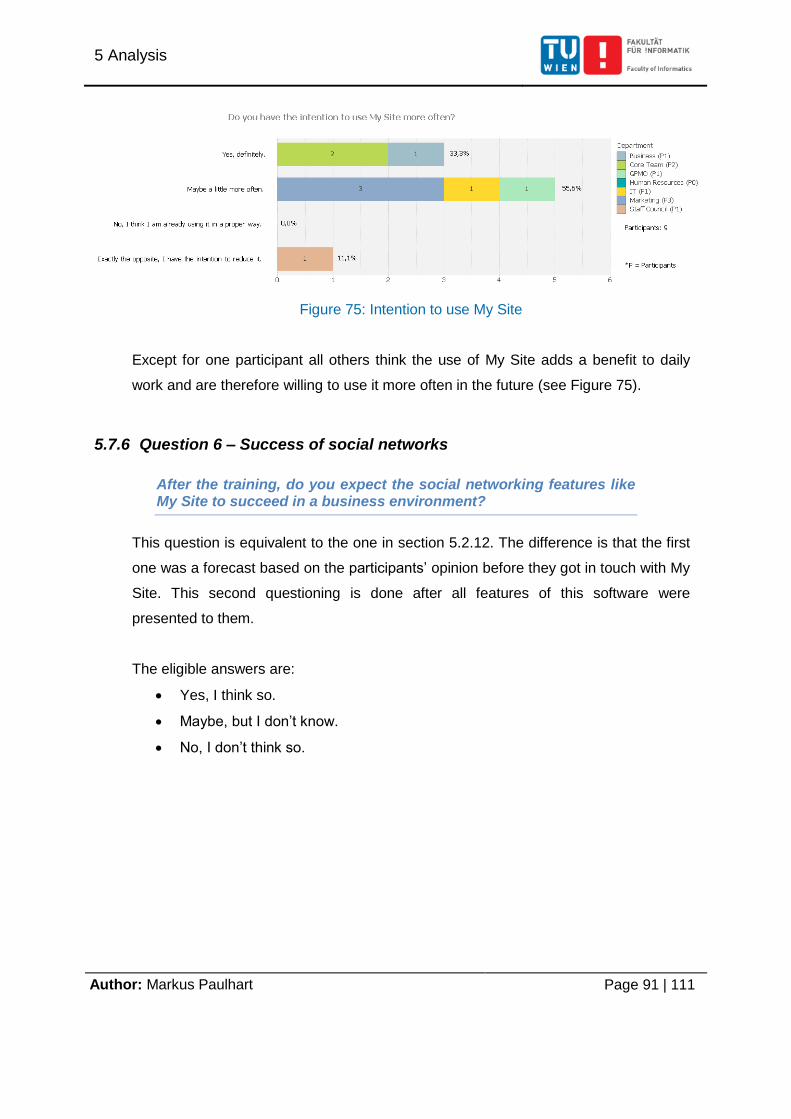
5 Analysis
Author: Markus Paulhart Page 91 | 111
Figure 75: Intention to use My Site
Except for one participant all others think the use of My Site adds a benefit to daily
work and are therefore willing to use it more often in the future (see Figure 75).
5.7.6 Question 6 – Success of social networks
After the training, do you expect the social networking features like My Site to succeed in a business environment?
This question is equivalent to the one in section 5.2.12. The difference is that the first
one was a forecast based on the participants’ opinion before they got in touch with My
Site. This second questioning is done after all features of this software were
presented to them.
The eligible answers are:
Yes, I think so.
Maybe, but I don’t know.
No, I don’t think so.
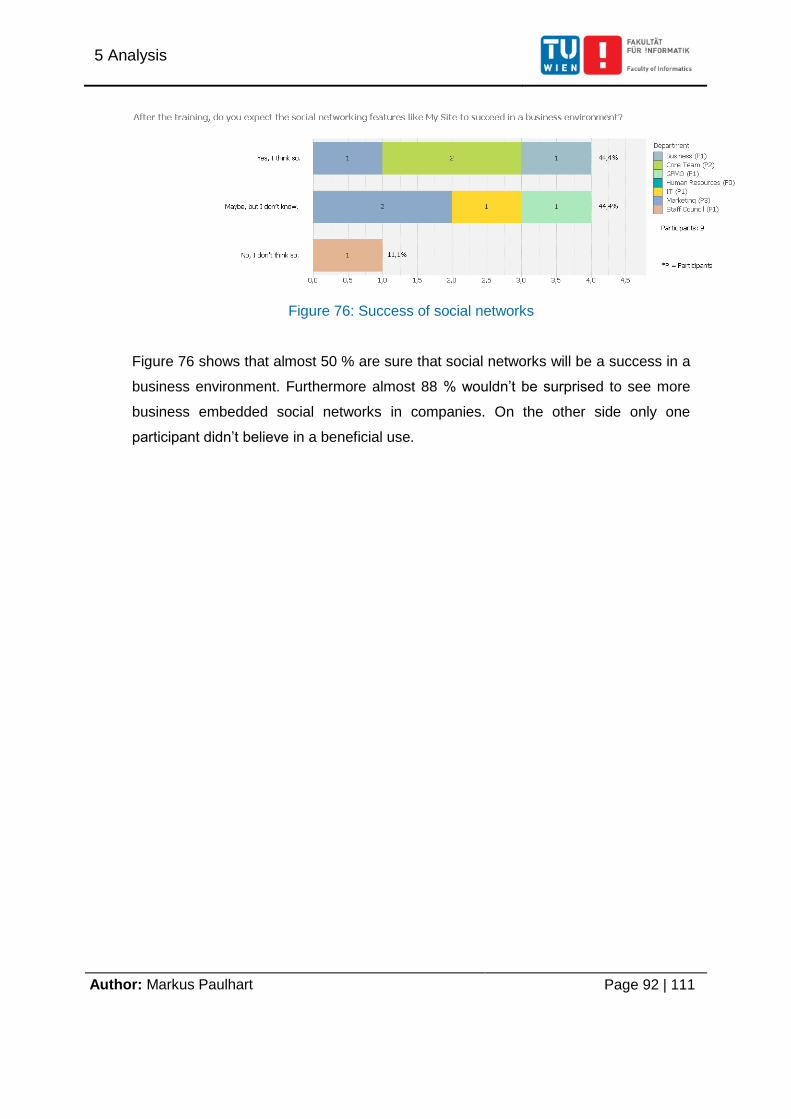
5 Analysis
Author: Markus Paulhart Page 92 | 111
Figure 76: Success of social networks
Figure 76 shows that almost 50 % are sure that social networks will be a success in a
business environment. Furthermore almost 88 % wouldn’t be surprised to see more
business embedded social networks in companies. On the other side only one
participant didn’t believe in a beneficial use.
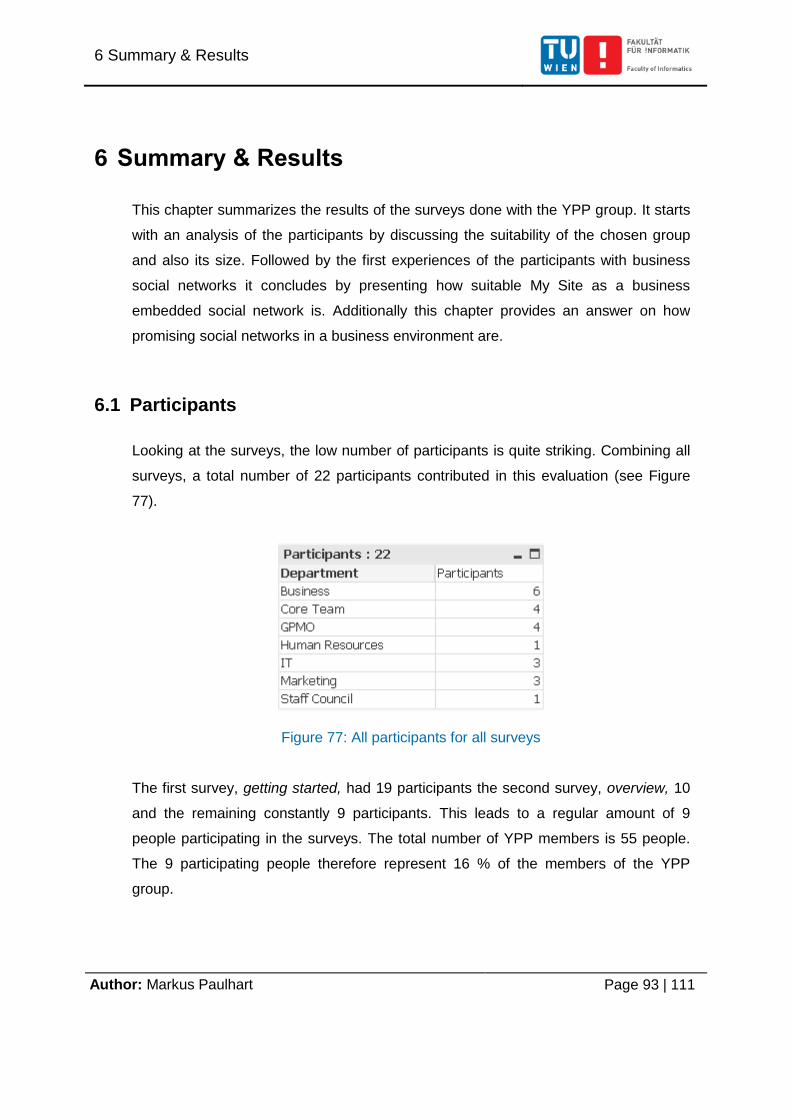
6 Summary & Results
Author: Markus Paulhart Page 93 | 111
6 Summary & Results
This chapter summarizes the results of the surveys done with the YPP group. It starts
with an analysis of the participants by discussing the suitability of the chosen group
and also its size. Followed by the first experiences of the participants with business
social networks it concludes by presenting how suitable My Site as a business
embedded social network is. Additionally this chapter provides an answer on how
promising social networks in a business environment are.
6.1 Participants
Looking at the surveys, the low number of participants is quite striking. Combining all
surveys, a total number of 22 participants contributed in this evaluation (see Figure
77).
Figure 77: All participants for all surveys
The first survey, getting started, had 19 participants the second survey, overview, 10
and the remaining constantly 9 participants. This leads to a regular amount of 9
people participating in the surveys. The total number of YPP members is 55 people.
The 9 participating people therefore represent 16 % of the members of the YPP
group.
6 Summary & Results
Author: Markus Paulhart Page 94 | 111
The first survey had a considerable amount of participants, but numbers dropped
down to 50 % in the second survey. The most frequently stated reason for participants
dropping out was the combination of survey and training. To participate in a survey
training material had to be read and also some short exercises, around 15 to 30
minutes, were required. Unfortunately this was too time-consuming for most of the
members of the YPP group. Further investigation showed that the time issue was one
of the main reasons for not participating in the surveys at all.
On the other side the YPP group is a well-mixed group of people from different
departments in the company. Additionally, the usage frequency of social networking
products in this group is also mixed. Only a little more than 50 % of the people is
using social networks on a daily basis but almost everyone has at least acquired
some experiences with such a technology, stated in section 5.2.5.
Concluding, this group is suited very well for questioning about the implementation of
a social network in a business environment.
6.2 First steps
SharePoint serves as basis software for entering the social networking platform My
Site. The acceptance and the use of this platform are therefore important for the
ensuing success of the My Site software. It also means that not using SharePoint is
directly related to not using My Site because it is a part of the ECM. The first survey in
section 5.2 indicates that SharePoint is not frequently used so far. Almost 50 % of the
people are using SharePoint less than once a week. Therefore they just know how to
enter it and also how to use some basic features. Ironically, on the other hand 78.9 %
are willing to use SharePoint more often. The participants are seeing the potential in
SharePoint but didn’t see a reason to actually use it so far.
When starting the My Site pilot, the participants where given the link to try the
software out without any obligation. Thereupon 89.5 % entered the software to take a
look. These participants also stated that they have intention to use this tool more often
in the future. It can be concluded that the interest is high. But only 42.1 % of the
participants feel sufficiently enough to use this tool without any training. Taking into
6 Summary & Results
Author: Markus Paulhart Page 95 | 111
account almost everyone had prior experiences with social networks, this number is
quite low. It is also interesting to see that exactly these 42.1 % are still using this tool
at least once a week.
Consequently, more than 80 % of the participants think social software will succeed in
a business environment. Almost 74 % think this change will be done within two years.
6.3 Social networks on the basis of My Site
The social networking tool My Site gives a relatively ordinary visual impression. Most
of the participants consider it ok, but 40 % of the people think it is not very appealing.
This opinion also holds for the user interface. About 70 % of the participant’s stated
that it is difficult to find the functions they need without any proper training.
The three most important features of My Site emphasized by the participants during
the first survey were Edit my profile, Add or remove colleagues and view my profile.
Regarding the participants, managing the profile is the best implemented feature in
My Site. There are almost no complaints about the set up. Furthermore almost every
participant believes that editing the profile by himself is worth the extra time effort.
Another feature is tagging. More than 90 % of the participants at least heard about
this topic. No participant would think of it as a useless feature after the training. But
the majority, over 50 %, is indecisive whether it will ever be a success. This is mostly
because too few people used this features in the pilot phase. Still, tagging in
comparison to bookmarks in browsers and the My Link feature in My Site was voted to
be the most preferable one to keep track of pages and content. Apart from tagging, 66
% of the participants consider notes a good addition to e-mail. The My Links feature
was generally deemed useful.
However, the usability problem with My Site is a real issue. More than 50 % of the
participants had problems finding the features tags, notes and My Link. In other words
the usability in My Site affects the experience negatively.
6 Summary & Results
Author: Markus Paulhart Page 96 | 111
The same applies to the managing colleagues features. The participants are satisfied
with the features but dislike the look and feel of it. Also the organization chart is voted
to be useful by almost every participant. Unfortunately, the lack of completeness in the
pilot set up as well as the unattractive presentation was disliked by the participants.
On the contrary, more than 75 % of people are not ok with the membership function
as it is. In fact, about 45 % don’t see any benefit in using this feature. It is therefore
one of the most unimportant features.
6.3.1 Summary
In conclusion, My Site does a good job connecting people to establish a good working
relationship. Furthermore, it provides a personalized feed to get the latest news in the
company, whether they are official work news or created by colleagues.
Also the focus of the product is right. My Site is not very suitable to manage personal
friendships and this feature is one of the most unwanted for a business embedded
social network. After all, the My Site profile is one of the strongest parts in this
software.
Nevertheless, it has some serious issues with user interface. More than 70 % of the
people are having problems using the software without any proper training.
Additionally the usability of the software was criticized as too slow.
6.4 Are business embedded social networks promising?
Looking at the results of the surveys, it is indeed a promising way. Most of the
participants believe in the idea of a business embedded social network in the
company. Especially users, who know how to use the software appropriately are
willing to continue using it. To be exact, 8 out of 9 participants think that it enhances
the daily work. Almost 50 % are sure that social networks will be a success in the
business and even about 88 % of the participant wouldn’t be surprised to see this
technology successfully established.
6 Summary & Results
Author: Markus Paulhart Page 97 | 111
In order to establish a functioning social network the following three features are the
most important ones, supported by the social networking software:
Find, manage and connect people to build successful working relationships
Customized profile
Personalized feeds
Besides these features, the software has to be appealing and more importantly user-
friendly. The software should be as self-explanatory as possible and most importantly
fast to ensure the user will not be hampered during work. This motivates the user in
using the software further instead of stopping to use it. The answers of the survey
illustrate that users getting along with such a social networking tool without training
are using this software at least once a week. Therefore the goal is to get the users in
touch with the software. Once they get the hang of it, chances are that they will keep
using it. Furthermore, the social network should be designed as an entry point for the
employee in the intranet, to make it an information channel in the company, in addition
to the e-mail client.
To do so the promotion as well as the implementation needs careful planning. The
importance on how to implement such a tool could be observed during the pilot phase.
This technology was introduced only to a specific group of people. This leads in the
end to a point where users are losing the interest in using this technology because
they don’t reach everyone they need in the company. In other words this technology
only unfolds its power if a majority of the people in the company is using it.
Despite the negative feedback regarding My Site software, social networks are a
promising technology to be implemented in a company.

7 Outlook
Author: Markus Paulhart Page 99 | 111
7 Outlook
The idea of using social networks in a business environment to support the
employees in their daily work is just a few years old, and only few companies tried an
implementation so far. (Fidelman 2013) However, this chapter provides an outlook on
what can be done after this evaluation and also presents an assessment of on the
technology business embedded social networks.
7.1 What kind of forecast can be derived from the evaluation
In general a business embedded social network will only work with a focus entirely on
business. Every kind of attempt to use it for personal reasons will hinder its success
because the user wants to get the job done and be supported by such tools.
Whether such tools will be a success in the next years is hard to say. On the one
hand users are willing to use such software if it is introduced to them properly. To do
so the implementation in the company has to be combined with a well prepared
advertising and awareness campaign. On the other hand it also depends on the
support of the management in the company to make it a success. (Fidelman 2013)
Besides the enhanced user support, introducing such a tool could also tighten the
position of the existing intranet. If a social networking tool is successfully introduced,
the intranet platform will automatically benefit from the social network, especially when
it is coupled like SharePoint and My Site. For example tags, documents or news are
easily used in both platforms and are therefore more easily exchanged. This
beneficial connection was also noticed by the participants of the evaluation.
Still, users have to accept that social networks are not only useful in the private
sector. They also enrich daily work by enhancing communication with colleagues,
supporting the user to find, learn and organize knowledge and also to show personal
skills in a more transparent way.
7 Outlook
Author: Markus Paulhart Page 100 | 111
Conclusively, the benefit of business embedded social networks was noticeable for all
participants and would therefore be accepted as a communication tool in the
company. In summary, social networks in a business environment can succeed.
7.2 Next steps
Almost two years have passed after the last survey. In the meantime My Site was
introduced completely to the cooperating company. Therefore a possible approach
would be to evaluate how well the conclusions, derived from the answers of the
participants, have proven true. A follow-up evaluation could be done to measure how
successful the introduction of a social network really was and which factors influenced
the results. Unfortunately the management of the cooperating company has not
approved the conduction of such a survey so far.
8 Bibliography
Author: Markus Paulhart Page 101 | 111
8 Bibliography
Berg, Oscar. "Enterprise 2.0 and Innovation." December 07, 2008.
http://de.slideshare.net/marknadsstod/enterprise-20-and-innovation-presentation
(accessed December 31, 2013).
Bortz, Jürgen, and Nicola Döring. Forschungsmethoden und Evaluation - für Human- und
Sozialwissenschaftler. Berlin: Springer-Verlag, 2003.
Boyd, D. M., and N. B Ellison. "Social Network Sites: Definition, History, and Scholarship."
Journal of Computer-Mediated Communication, 2007.
Cooper, Lynne P. "The Value of Weak vs. Strong Ties between Individuals and Projects for
New Product Review." Hawaii International Conference on System Sciences,
Proceedings of the 41st Annual. Hawaii, 2008.
http://ieeexplore.ieee.org/stamp/stamp.jsp?tp=&arnumber=4439050&isnumber=443
8696.
Dictionary.com. power user. n.d. http://dictionary.reference.com/browse/power user
(accessed December 7, 2013).
Fidelman, Mark. Socialized! - How the Most Successful Business Harness the Power of
Social. Brookline, MA: Bibliomotion, 2013.
Goble, Gordon. The History of Social Networking. September 6, 2012.
http://www.digitaltrends.com/features/the-history-of-social-networking/ (accessed
December 21, 2013).
Gustaffson, Henrik, and Oscar Berg. Web 2.0 At Work - Simple And Social Collaboration
Between Coworkers. Sepember 22, 2008.
http://de.slideshare.net/marknadsstod/web-20-at-work-simple-and-social-
collaboration-between-coworkers-presentation (accessed December 31, 2013).
Mayer, Host Otta. Interview und schriftliche Befragung: Grundlagen und Methoden
empirische Sozialforschung. München: Oldenbourg Verlag, 2013.
McAfee, Andrew. Enterprise 2.0, version 2.0. May 27, 2006.
http://andrewmcafee.org/2006/05/enterprise_20_version_20/ (accessed December
31, 2013).
8 Bibliography
Author: Markus Paulhart Page 102 | 111
Microsoft. Edit personal details in your profile. n.d. http://office.microsoft.com/en-
us/sharepoint-server-help/edit-personal-details-in-your-profile-
HA101665470.aspx#_Toc286302153 (accessed January 14, 2014).
—. Introduction to My Site. n.d. http://office.microsoft.com/en-us/sharepoint-server-
help/introduction-to-my-site-HA010108748.aspx (accessed December 4, 2013).
—. Manage the information you share through your My Site and profile. n.d.
http://office.microsoft.com/en-us/sharepoint-server-help/manage-the-information-
you-share-through-your-my-site-and-profile-HA010378254.aspx (accessed January
14, 2014).
—. Manage the memberships on your My Site. n.d. http://office.microsoft.com/en-
us/sharepoint-server-help/manage-the-memberships-on-your-my-site-
HA010168640.aspx (accessed January 21, 2014).
—. So What Is Active Directory? October 26, 2012. http://msdn.microsoft.com/en-
us/library/windows/desktop/aa746492%28v=vs.85%29.aspx (accessed January 16,
2014).
—. Video: Use tags and notes to share information with colleagues. n.d.
http://office.microsoft.com/en-us/sharepoint-server-help/video-use-tags-and-notes-
to-share-information-with-colleagues-VA102465712.aspx (accessed January 15,
2014).
Mora, Michaela. Quantitative Vs. Qualitative Research – When to Use Which. March 16,
2010. http://www.surveygizmo.com/survey-blog/quantitative-qualitative-research/
(accessed Jannuary 08, 2014).
Morgan, Jacob. The Collaborative Organization. United Staes of Amerca: McGraw-Hill,
2012.
Paulhart, Markus. Analyze SharePoint Surveys in QlikView. Master Theasis, Faculty of
Informatics, Vienna University of Technology , Wien: Vienna University of
Technology , 2014.
Porter, Joshua. Weak Ties and Diversity in Social Networks. October 5, 2007.
http://bokardo.com/archives/weak-ties-and-diversity-in-social-networks/ (accessed
January 21, 2014).
Schmidt, Nola, and Janet Brown. Evidence-based practice for nurses. Sudbury, MA: Jones
and Bartlett, 2009.
8 Bibliography
Author: Markus Paulhart Page 103 | 111
Statistic Brain. Facebook Statistics. June 6, 2013. http://www.statisticbrain.com/facebook-
statistics/ (accessed December 21, 2013).
Visual Intelligence. QlikView Overview. n.d.
http://www.visualintelligence.co.nz/QlikView.php (accessed December 4, 2013).
Wasserman, Stanly, and Katherine Faust. Social Network Analysis in the Social and
Behavioral Sciences - Social Network Analysis: Methods and Applications.
Cambridge, UK: Cambridge University Press, 1994.
Wright, Chris. Use SharePoint to Build an Org Chart - The Options. May 14, 2012.
https://www.nothingbutsharepoint.com/sites/eusp/Pages/Use-SharePoint-to-Build-
an-Org-Chart-The-Options.aspx (accessed January 21, 2014).

9 Table of Figures
Author: Markus Paulhart Page 105 | 111
9 Table of Figures
Figure 1: Summarizing the business ages (Fidelman 2013) .................................................10
Figure 2: Tools to find, share and acquire knowledge (Gustaffson and Berg 2008) ..............11
Figure 3: Strong and weak ties (Porter 2007) .......................................................................12
Figure 4: My Site - Getting Started .......................................................................................24
Figure 5: My Site - Part 1 - Overview ....................................................................................25
Figure 6: My Site - Part 2 - My Profile ...................................................................................26
Figure 7: My Site - Part 3 - Tags ...........................................................................................27
Figure 8: My Site - Part 4 – Colleagues ................................................................................28
Figure 9: Survey - Part X – Conclude ...................................................................................28
Figure 10: QlikView Example Dashboard (Visual Intelligence) ..............................................31
Figure 11: Dashboard – SPSurveys Overview (Paulhart 2014) ............................................32
Figure 12: Application architecture - SPSurvey Dashboard with My Site data ......................34
Figure 13: Software architecture - SPSurvey Dashboard ......................................................35
Figure 14: QlikView data model - SPSurvey Dashboard (Paulhart 2014) .............................36
Figure 15: All participants .....................................................................................................37
Figure 16: All given answers ................................................................................................38
Figure 17: All unique questions, answers, surveys and question-classes/types ....................39
Figure 18: S1 – Overall answers ..........................................................................................40
Figure 19: S1 – Answers given by one questions .................................................................40
Figure 20: S1 – Participants .................................................................................................41
Figure 21: S1 - Unique questions, answers, surveys and question classes/types .................42
Figure 22: S0Q1 – Experience in SharePoint .......................................................................43
Figure 23: S0Q2 – Use of SharePoint ..................................................................................44
Figure 24: S0Q3 – Intention on using SharePoint .................................................................45
Figure 25: S0Q4 – Acceptance of SharePoint by colleagues ................................................46
Figure 26: S0Q5 – Use of social networking products ..........................................................47
Figure 27: My Site experience ..............................................................................................48
Figure 28: My Site use..........................................................................................................49
Figure 29: Used My Site parts ..............................................................................................50
9 Table of Figures
Author: Markus Paulhart Page 106 | 111
Figure 30: Intention to use My Site .......................................................................................51
Figure 31: Acceptance around colleagues of My Site ...........................................................52
Figure 32: Success of social networks in a company ............................................................54
Figure 33: A social network usage forecast ..........................................................................55
Figure 34: S2 – Overall Answers ..........................................................................................56
Figure 35: S2 – Answers given by one questions. ................................................................56
Figure 36: S2 – Participants .................................................................................................57
Figure 37: S2 - unique questions, answers, surveys and questions classes/types................58
Figure 38: First impression ...................................................................................................59
Figure 39: User-friendly ........................................................................................................60
Figure 40: Meaningful function .............................................................................................61
Figure 41: S3 – Answers ......................................................................................................61
Figure 42: S3 – Answers given for one questions. ................................................................62
Figure 43: S3 – Participants .................................................................................................62
Figure 44: S3 - unique questions, answers, surveys and questions classes/types................63
Figure 45: Profile configuration .............................................................................................64
Figure 46: Editable profile fields ...........................................................................................65
Figure 47: Privacy options ....................................................................................................66
Figure 48: Meaning of additional profile information .............................................................67
Figure 49: S4 – Overall Answers ..........................................................................................67
Figure 50: S4 – Answers given for one questions. ................................................................68
Figure 51: S4 – Participants .................................................................................................68
Figure 52: S4 - unique questions, answers, surveys and questions classes/types................69
Figure 53: Previous experiences with tagging ......................................................................70
Figure 54: Usefulness of tagging ..........................................................................................71
Figure 55: Believe in tagging ................................................................................................72
Figure 56: Keep track of pages and content .........................................................................72
Figure 57: Access tags and notes ........................................................................................73
Figure 58: Access My Links ..................................................................................................74
Figure 59: Access tags, notes and My Links .........................................................................74
Figure 60: Notes as an addition to e-mail .............................................................................75
Figure 61: Usefulness of My Link .........................................................................................76
Figure 62: S5 – Overall Answers ..........................................................................................77
9 Table of Figures
Author: Markus Paulhart Page 107 | 111
Figure 63: S5 – Answers given for one questions. ................................................................77
Figure 64: S5 – Participants .................................................................................................78
Figure 65: S5 - unique questions, answers, surveys and questions classes/types................79
Figure 66: Managing colleagues ...........................................................................................80
Figure 67: Usefulness of membership web part ....................................................................81
Figure 68: Usefulness of the organization chart ....................................................................82
Figure 69: S6 – Overall Answers ..........................................................................................82
Figure 70: S6 – Answers given by one questions. ................................................................83
Figure 71: S6 – Participants .................................................................................................83
Figure 72: S6 - unique questions, answers, surveys and questions classes/types................84
Figure 73: Useful My Site parts ............................................................................................86
Figure 74: My Site design general outcome ..........................................................................89
Figure 75: Intention to use My Site .......................................................................................91
Figure 76: Success of social networks ..................................................................................92
Figure 77: All participants for all surveys ..............................................................................93

10 List of Tables
Author: Markus Paulhart Page 109 | 111
10 List of Tables
Table 1: Evaluation of experience - Quantitative vs. Qualitative ...........................................14

11 List of Abbreviations
Author: Markus Paulhart Page 111 | 111
11 List of Abbreviations
ECM Enterprise Content Management ........................................................................................ V
GPMO Group Project Management Office ....................................................................................19
WEB World Wide Web ...............................................................................................................70
YPP Young Professional Potentials ...........................................................................................15
ENDTEXTMARKER


