
DIABETES, OBESTY AND TESTOSTERONE
ReferentProf. Thomas Hugh Jones
Transparenzinformation arztCME
Die Bundesärztekammer und die Landesärztekammer Hessen fordern zur Schaffung von mehr Transparenz beim Sponsoring in der ärztlichen Fortbildung auf. Fortbildungsveranstalter sind gehalten, potenzielle Teilnehmer von Fortbildungen bereits im Vorfeld der Veranstaltung uber Umfang und Bedingungen der Unterstutzung der Arzneimittelindustrie zu informieren. Dieser Verpflichtung kommen wir nach und werden Sie hier uber die Höhe des Sponsorings(*) der beteiligten Arzneimittelfirma sowie uber mögliche Interessenkonflikte der Autoren informieren.
Diese Fortbildung wurde fur den aktuellen Zertifizierungszeitraum von 12 Monaten mit 9.875,- EUR durch die Jenapharm GmbH & Co. KG unterstutzt.
Mögliche Interessenkonflikte – Prof. Thomas Hugh Jones erklärt:
Bei der Erstellung dieses Beitrags fur eine durch die Landesärztekammer Hessen anzuerkennende Fortbildung bestanden keine Interessenkonflikte im Sinne der Empfehlungen des International Committee of Medical Journal Editors (www.icmje.org).
Die Produktneutralität dieser Fortbildung wurde durch ein Review mit zwei Gutachtern gepruft.
Diese Fortbildung ist auf www.arztCME.de online verfugbar. Die Transparenzinformationen sind fur den Arzt dort einsehbar.
(*) Die Sponsoringbeiträge können je nach Art und Umfang der Fortbildung unterschiedlich sein.
DIABETES, OBESTY AND TESTOSTERONE
T. Hugh JonesCentre for Diabetes & Endocrinology, Barnsley Hospital
NHS Foundation Trust &
Academic Unit of Diabetes, Endocrinology & Metabolism, University of Sheffield
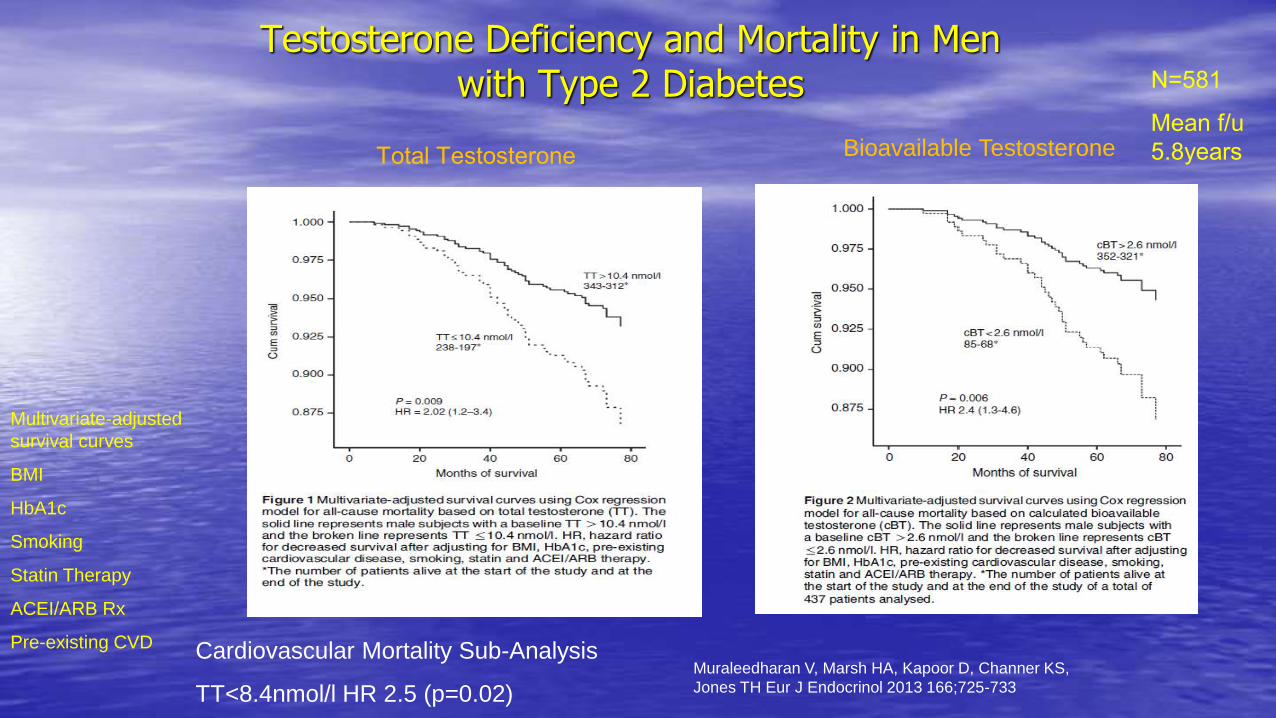
Testosterone Deficiency and Mortality in Men with Type 2 Diabetes
Cardiovascular Mortality Sub-Analysis
TT<8.4nmol/l HR 2.5 (p=0.02)
Muraleedharan V, Marsh HA, Kapoor D, Channer KS,
Jones TH Eur J Endocrinol 2013 166;725-733
Total Testosterone Bioavailable Testosterone
N=581
Mean f/u
5.8years
Multivariate-adjusted
survival curves
BMI
HbA1c
Smoking
Statin Therapy
ACEI/ARB Rx
Pre-existing CVD
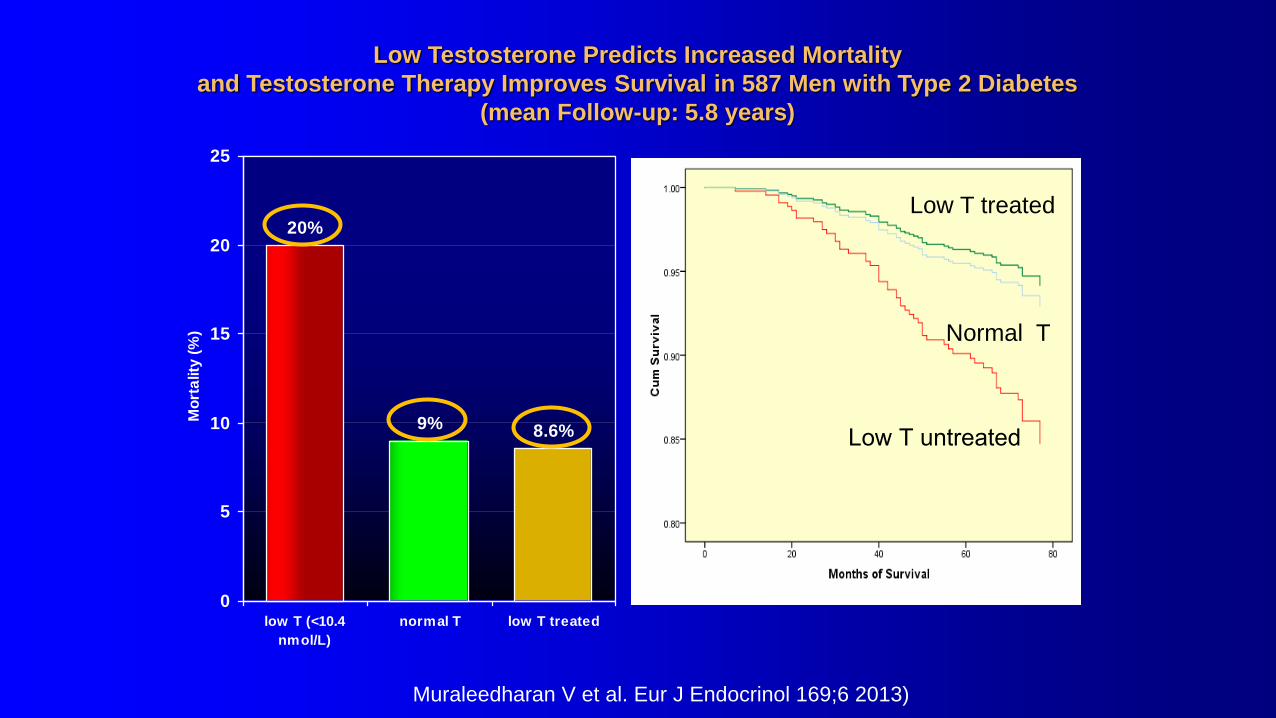
Muraleedharan V et al. Eur J Endocrinol 169;6 2013)
Low Testosterone Predicts Increased Mortality
and Testosterone Therapy Improves Survival in 587 Men with Type 2 Diabetes
(mean Follow-up: 5.8 years)
9%
20%
8.6%
0
5
10
15
20
25
low T (<10.4
nmol/L)
normal T low T treated
Mo
rta
lity
(%
)Low T treated
Normal T
Low T untreated
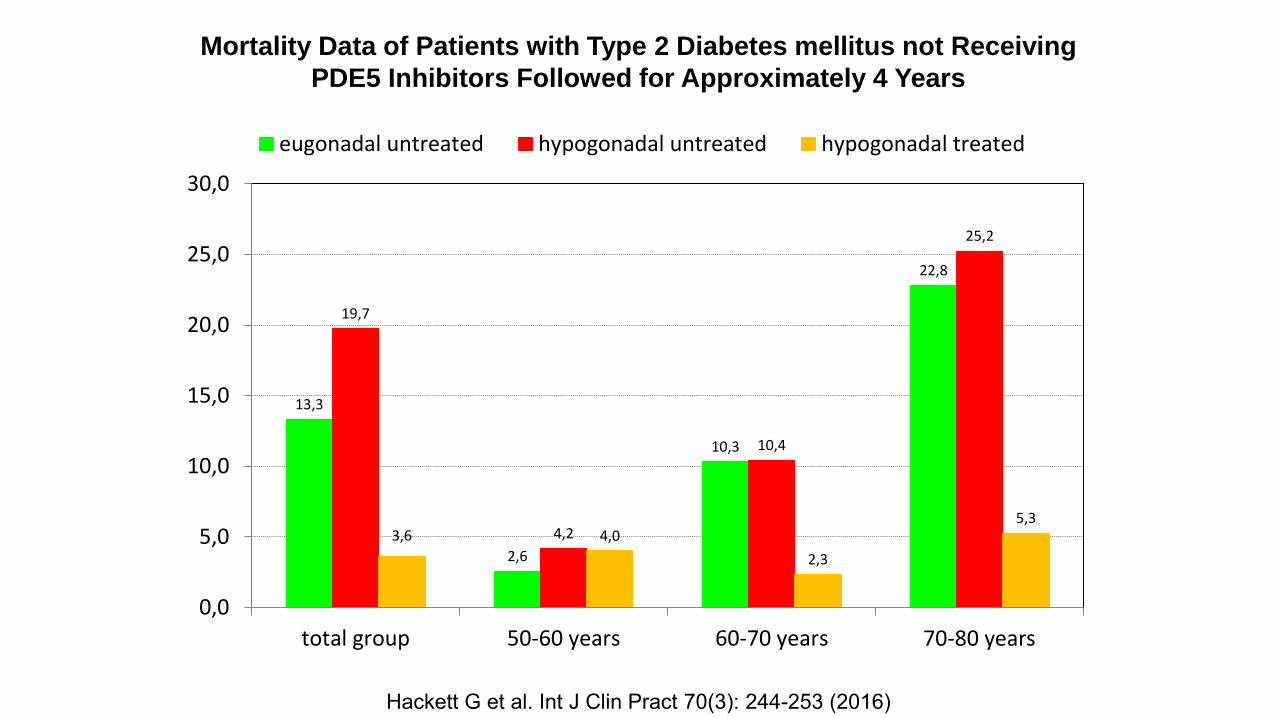
Mortality Data of Patients with Type 2 Diabetes mellitus not Receiving
PDE5 Inhibitors Followed for Approximately 4 Years
13,3
2,6
10,3
22,8
19,7
4,2
10,4
25,2
3,6 4,0
2,3
5,3
0,0
5,0
10,0
15,0
20,0
25,0
30,0
total group 50-60 years 60-70 years
eugonadal untreated hypogonadal untreated hypogonadal treated
70-80 years
Hackett G et al. Int J Clin Pract 70(3): 244-253 (2016)
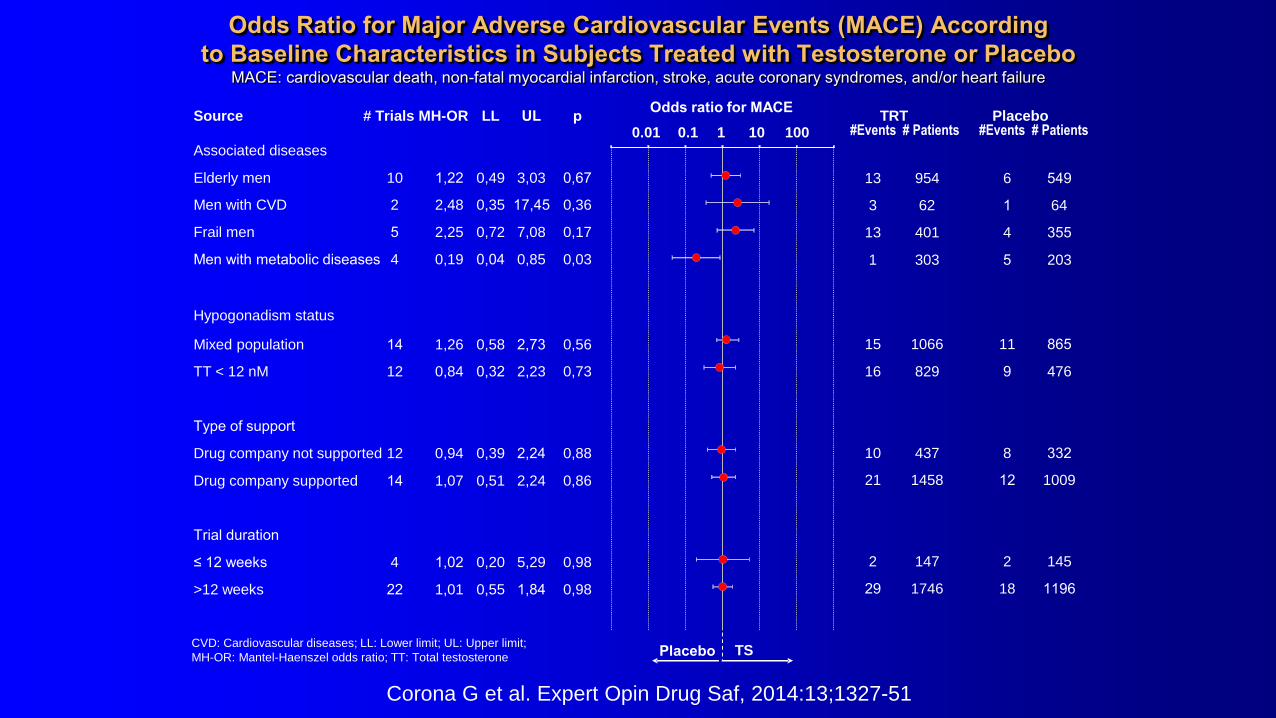
CVD: Cardiovascular diseases; LL: Lower limit; UL: Upper limit;
MH-OR: Mantel-Haenszel odds ratio; TT: Total testosterone
100
Odds ratio for MACESource # Trials MH-OR LL p TRT Placebo
#Events # Patients #Events # Patients
Placebo TS
Associated diseases
Elderly men 10 1,22 0,49 3,03 0,67
Men with CVD 2 2,48 0,35 17,45 0,36
Frail men 5 2,25 0,72 7,08 0,17
Men with metabolic diseases 4 0,19 0,04 0,85 0,03
Hypogonadism status
Mixed population 14 1,26 0,58 2,73 0,56
TT < 12 nM 12 0,84 0,32 2,23 0,73
Type of support
Drug company not supported 12 0,94 0,39 2,24 0,88
Drug company supported 14 1,07 0,51 2,24 0,86
Trial duration
≤ 12 weeks 4 1,02 0,20 5,29 0,98
>12 weeks 22 1,01 0,55 1,84 0,98
13 954 6 549
3 62 1 64
13 401 4 355
1 303 5 203
15 1066 11 865
16 829 9 476
10 437 8 332
21 1458 12
2 147 2 145
29 1746 18 1196
0.01 0.1 1 10 UL
1009
Corona G et al. Expert Opin Drug Saf, 2014:13;1327-51
Odds Ratio for Major Adverse Cardiovascular Events (MACE) According
to Baseline Characteristics in Subjects Treated with Testosterone or Placebo MACE: cardiovascular death, non-fatal myocardial infarction, stroke, acute coronary syndromes, and/or heart failure

Consequence or Cause?
• Is low testosterone just a biomarker of illness?
• Is it an adaptation to the clinical state?
• Does the low Testosterone state promote disease progression?
• Does Testosterone replacement ameliorate the disease process and improve clinical outcomes?
• Does testosterone replacement improve QOL as well?

Kapoor D et al. Diabetes Care 30: 911–917 (2007)
Total testosterone (TT) Bioavailable testosterone (BT) and calculated free testosterone (cFT)
0
10
20
30
40
50
60
70
80
<40 40-49 50-59 60-69 >69
Age (years)
Pe
rce
nta
ge
of
me
n w
ith
lo
w T
TTT < 8 nmol/l
TT < 12 nmol/l
0
10
20
30
40
50
60
70
80
<40 40-49 50-59 60-69 >69
Age (years)
Pe
rce
nta
ge
of
me
n w
ith
lo
w B
T,
cF
T
BT < 2.5 nmol/l
BT < 4 nmol/l
cFT < 0.255 nmol/l
Percentage of type 2 diabetic men with positive symptom score
with low testosterone by decades of age (ADAM questionnaire)
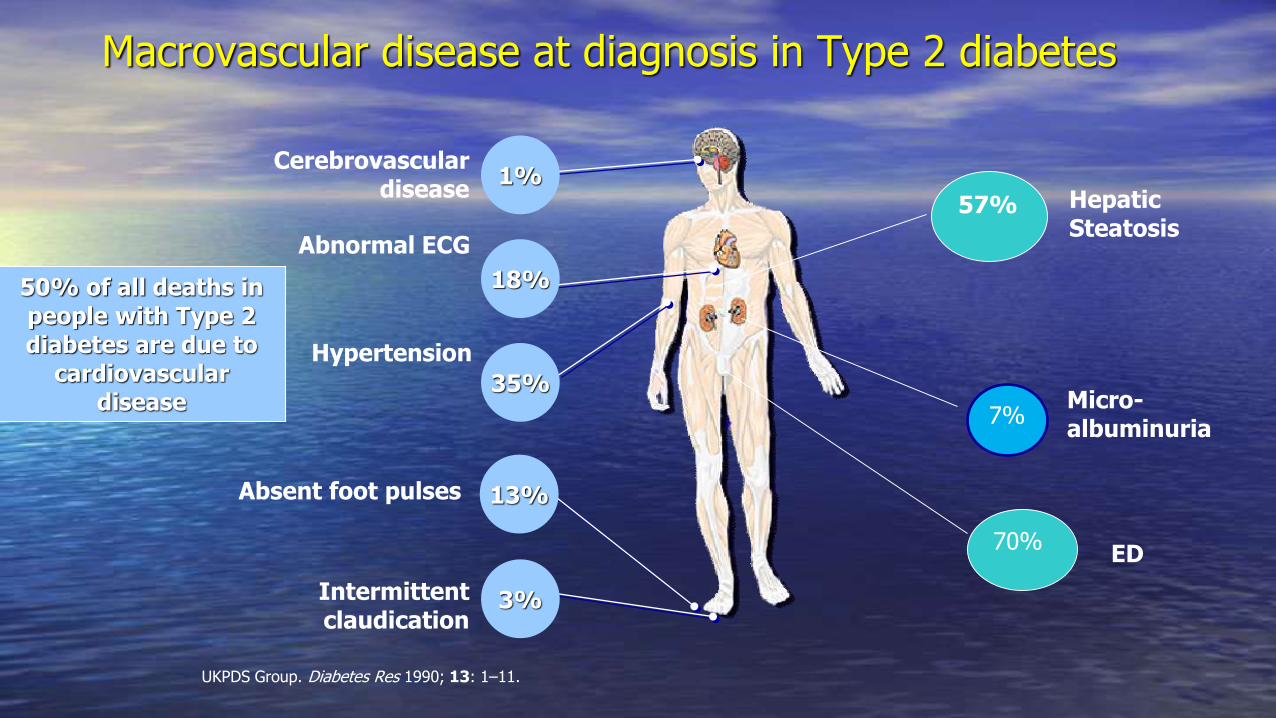
UKPDS Group. Diabetes Res 1990; 13: 1–11.
Macrovascular disease at diagnosis in Type 2 diabetes
1%
18%
35%
3%
Hypertension
Cerebrovascular disease
Abnormal ECG
Intermittent claudication
50% of all deaths in people with Type 2 diabetes are due to
cardiovascular disease
Absent foot pulses 13%
7%
70%
Micro-albuminuria
ED
57% Hepatic Steatosis
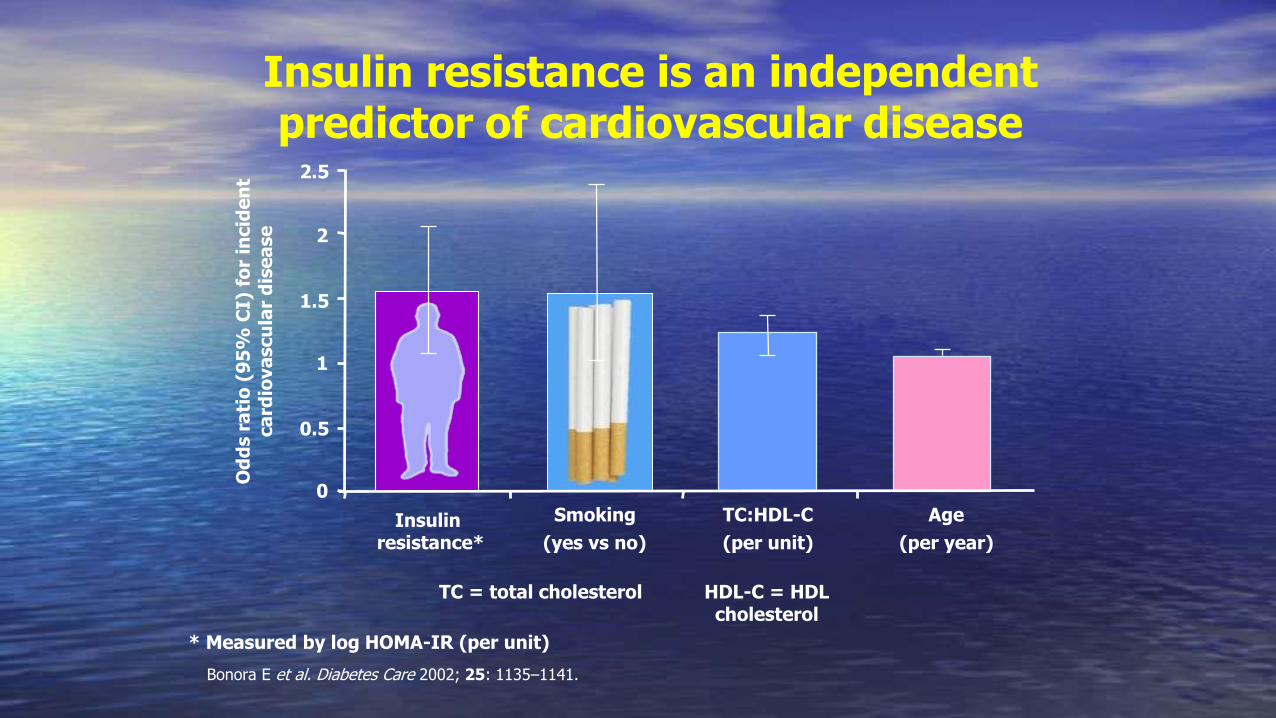
Insulin resistance is an independent predictor of cardiovascular disease
Bonora E et al. Diabetes Care 2002; 25: 1135–1141.
TC = total cholesterol
Od
ds r
ati
o (
95
% C
I) f
or
incid
en
t ca
rdio
va
scu
lar
dis
ea
se
0
0.5
1
1.5
2
2.5
Age
(per year)
Smoking
(yes vs no)
TC:HDL-C
(per unit)
* Measured by log HOMA-IR (per unit)
HDL-C = HDL cholesterol
Insulin resistance*
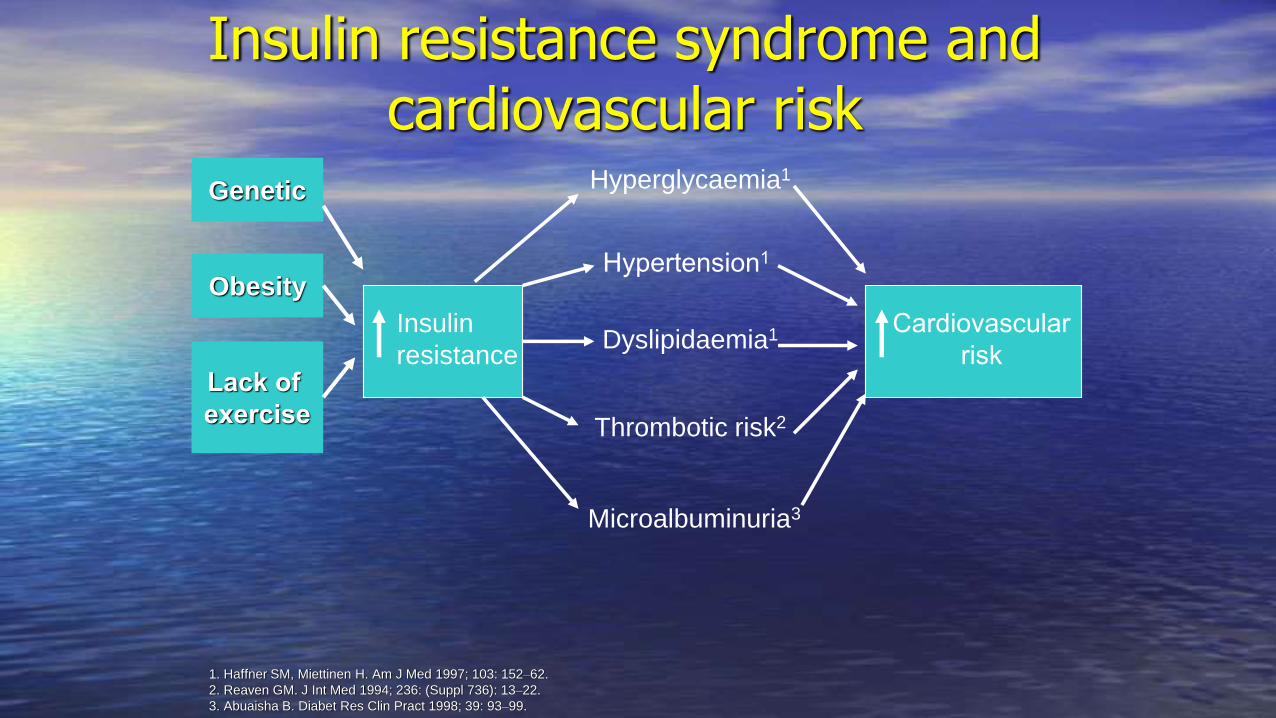
Insulin resistance syndrome and cardiovascular risk
1. Haffner SM, Miettinen H. Am J Med 1997; 103: 152–62.
2. Reaven GM. J Int Med 1994; 236: (Suppl 736): 13–22.
3. Abuaisha B. Diabet Res Clin Pract 1998; 39: 93–99.
Hyperglycaemia1
Hypertension1
Dyslipidaemia1
Thrombotic risk2
Microalbuminuria3
Insulin
resistance
Cardiovascular
risk
Obesity
Genetic
Lack of
exercise

0
1
2
3
4
5
6
Placebo Testosterone
p=0.02
HO
MA
IN
DE
X
6,8
7
7,2
7,4
7,6
7,8
Placebo Testosterone
p=0.03
Hb
A1c (
%)
n=14
n=24n=14
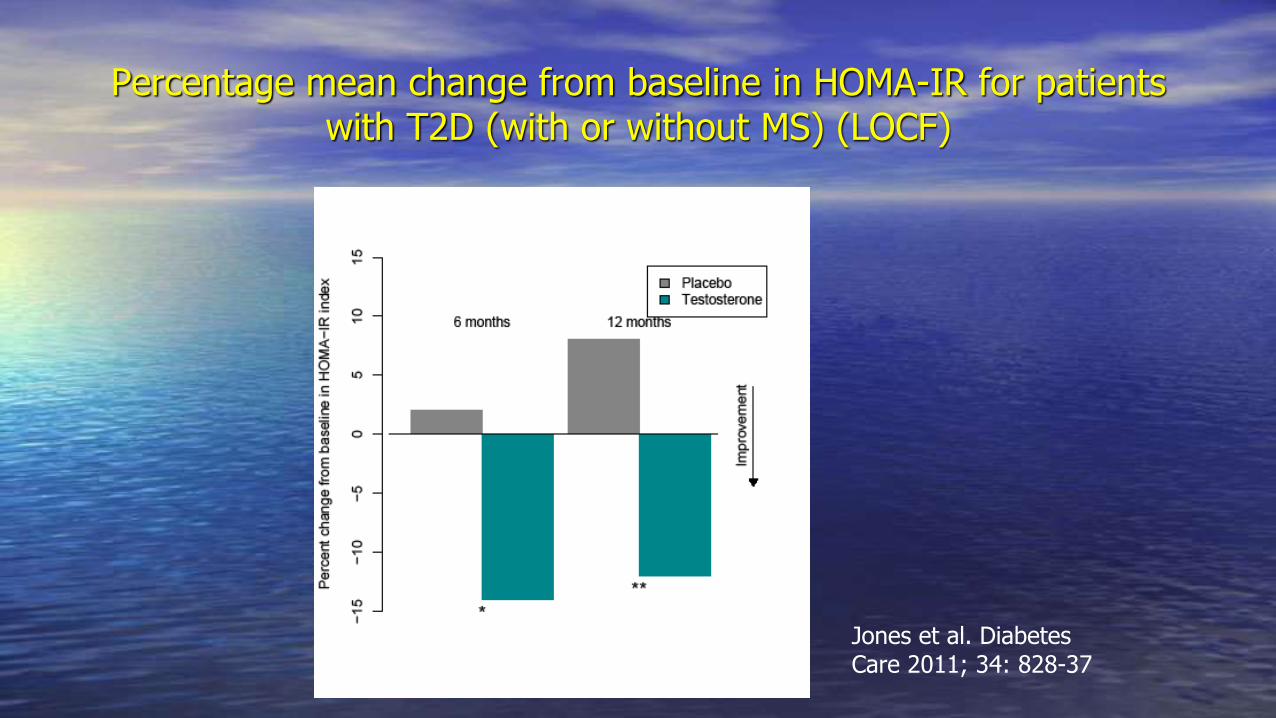
Percentage mean change from baseline in HOMA-IR for patients with T2D (with or without MS) (LOCF)
Jones et al. Diabetes Care 2011; 34: 828-37
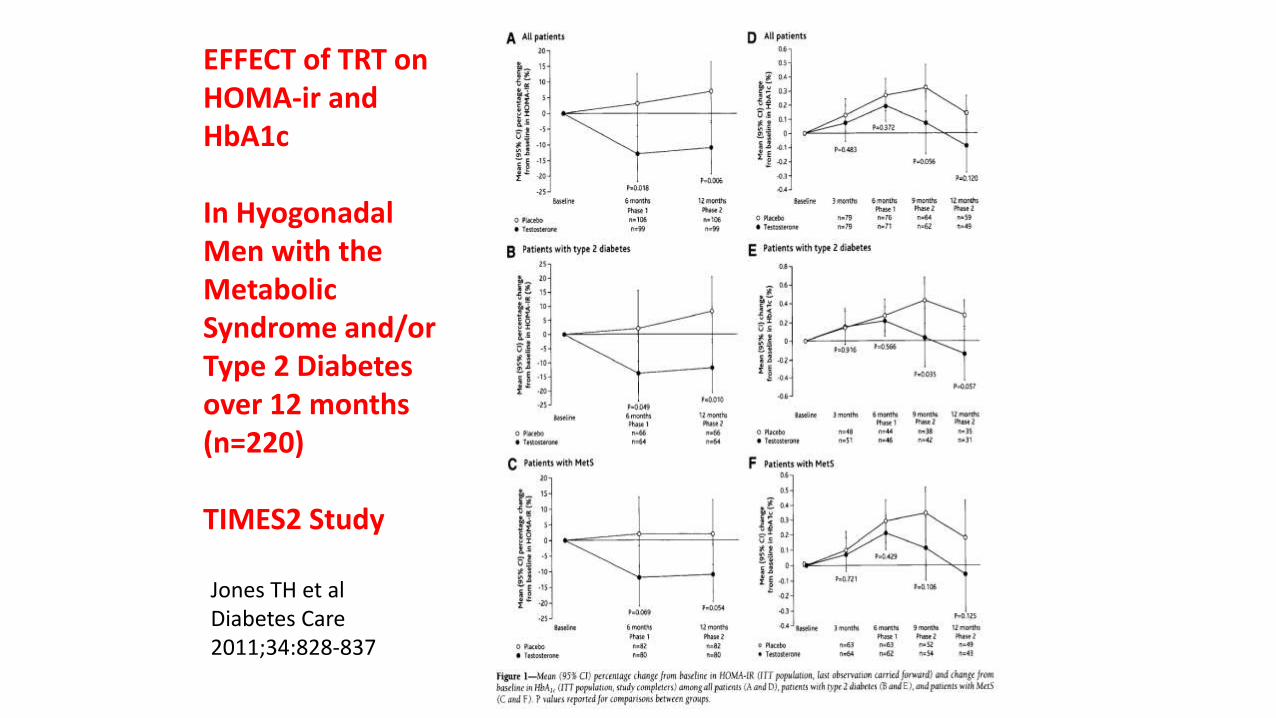
EFFECT of TRT on HOMA-ir and HbA1c
In Hyogonadal Men with the Metabolic Syndrome and/or Type 2 Diabetes over 12 months(n=220)
TIMES2 Study
Jones TH et al Diabetes Care 2011;34:828-837
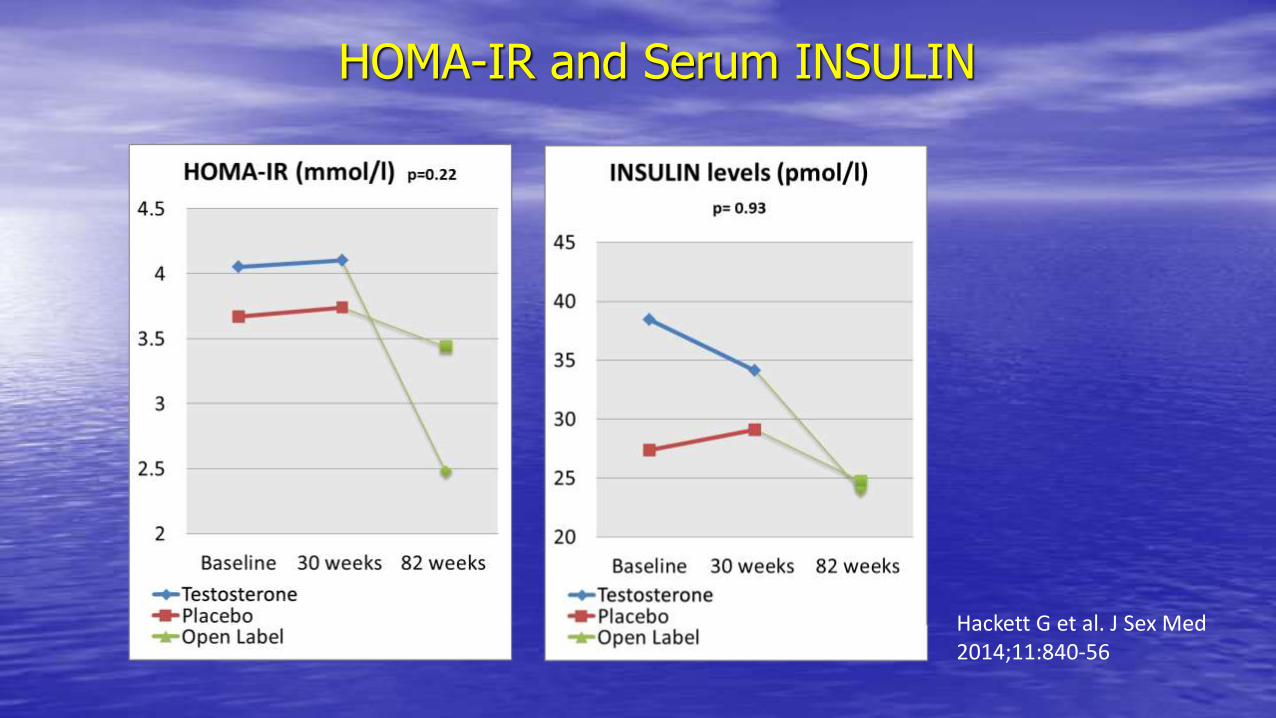
HOMA-IR and Serum INSULIN
Hackett G et al. J Sex Med 2014;11:840-56
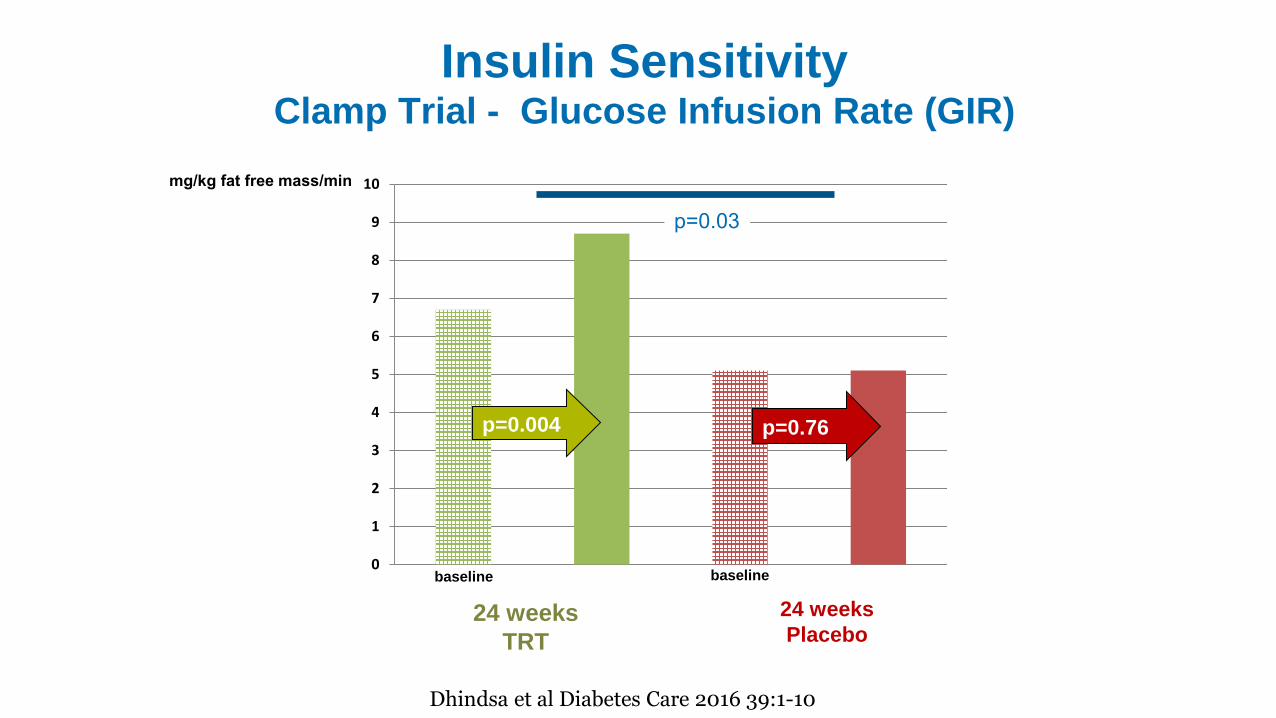
Insulin SensitivityClamp Trial - Glucose Infusion Rate (GIR)
0
1
2
3
4
5
6
7
8
9
10
24 weeks
TRT
24 weeks
Placebo
mg/kg fat free mass/min
p=0.004 p=0.76
p=0.03
Dhindsa et al Diabetes Care 2016 39:1-10
baseline baseline
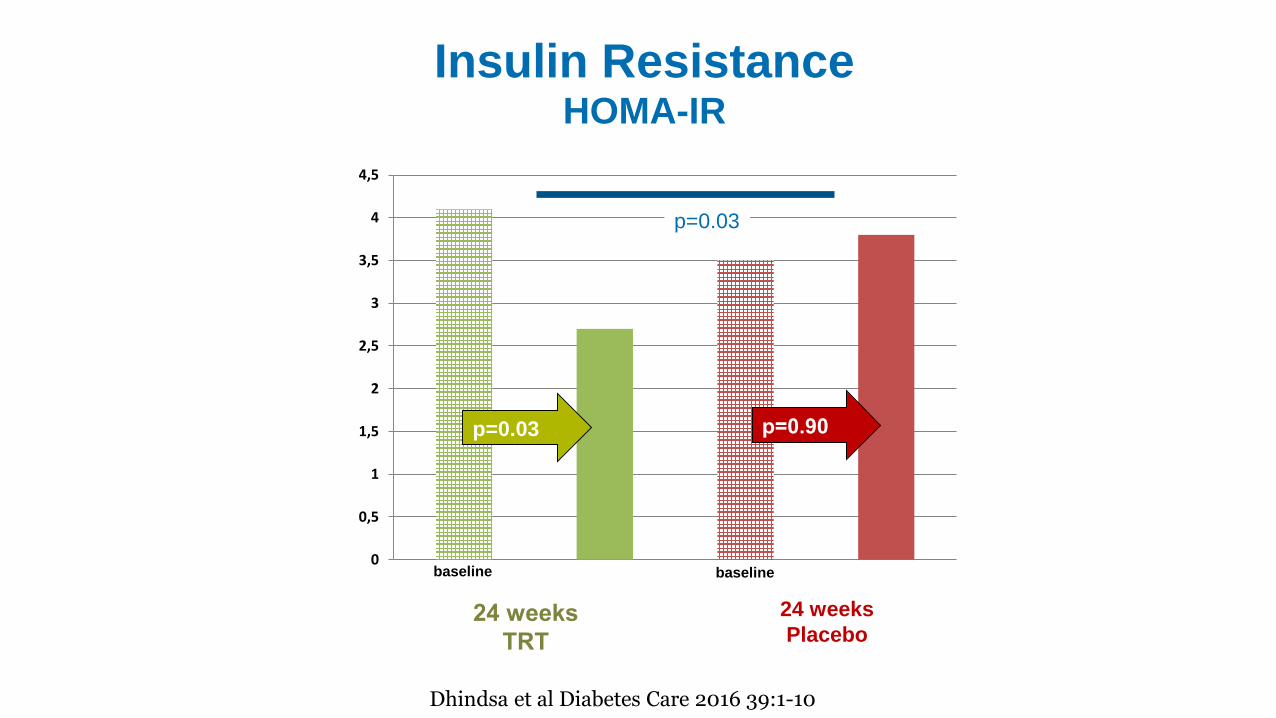
Insulin ResistanceHOMA-IR
0
0,5
1
1,5
2
2,5
3
3,5
4
4,5
24 weeks
TRT
24 weeks
Placebo
p=0.03 p=0.90
p=0.03
Dhindsa et al Diabetes Care 2016 39:1-10
baseline baseline
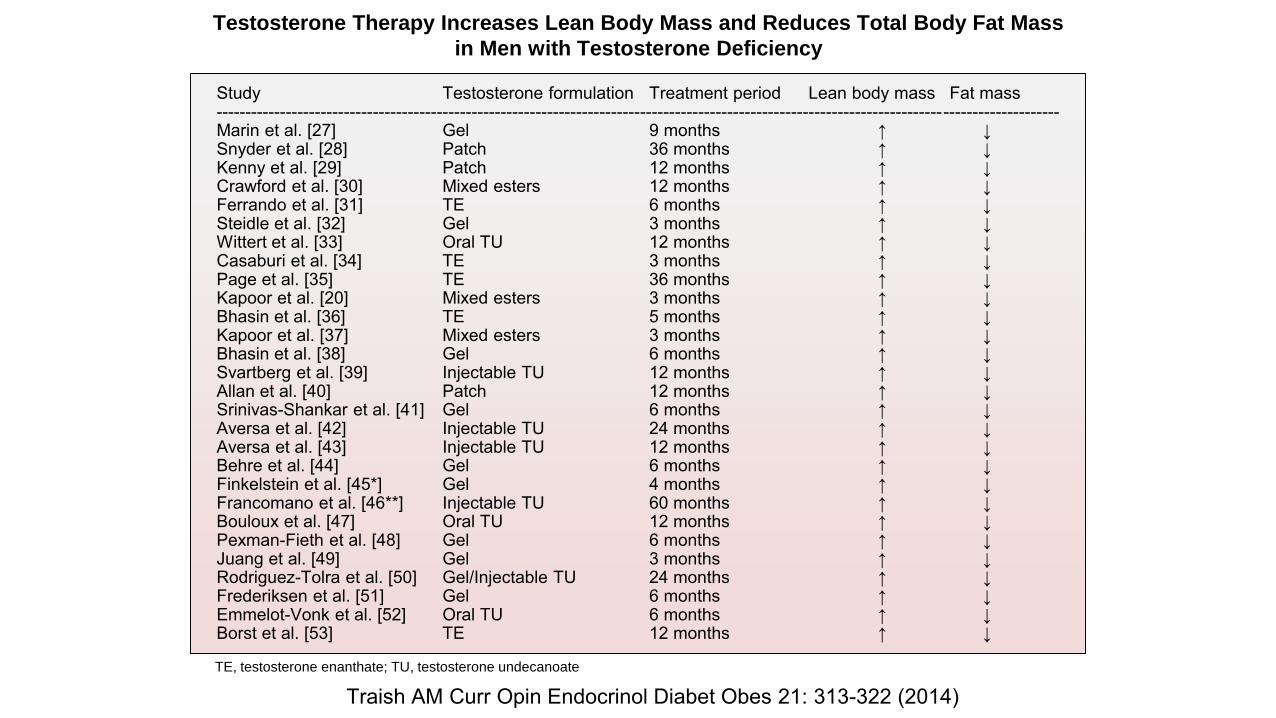
Study Testosterone formulation Treatment period Lean body mass Fat mass-------------------------------------------------------------------------------------------------------------------------------------------------Marin et al. [27] Gel 9 months ↑ ↓Snyder et al. [28] Patch 36 months ↑ ↓Kenny et al. [29] Patch 12 months ↑ ↓Crawford et al. [30] Mixed esters 12 months ↑ ↓Ferrando et al. [31] TE 6 months ↑ ↓Steidle et al. [32] Gel 3 months ↑ ↓Wittert et al. [33] Oral TU 12 months ↑ ↓Casaburi et al. [34] TE 3 months ↑ ↓Page et al. [35] TE 36 months ↑ ↓Kapoor et al. [20] Mixed esters 3 months ↑ ↓Bhasin et al. [36] TE 5 months ↑ ↓Kapoor et al. [37] Mixed esters 3 months ↑ ↓Bhasin et al. [38] Gel 6 months ↑ ↓Svartberg et al. [39] Injectable TU 12 months ↑ ↓Allan et al. [40] Patch 12 months ↑ ↓Srinivas-Shankar et al. [41] Gel 6 months ↑ ↓Aversa et al. [42] Injectable TU 24 months ↑ ↓Aversa et al. [43] Injectable TU 12 months ↑ ↓Behre et al. [44] Gel 6 months ↑ ↓Finkelstein et al. [45*] Gel 4 months ↑ ↓Francomano et al. [46**] Injectable TU 60 months ↑ ↓Bouloux et al. [47] Oral TU 12 months ↑ ↓Pexman-Fieth et al. [48] Gel 6 months ↑ ↓Juang et al. [49] Gel 3 months ↑ ↓Rodriguez-Tolra et al. [50] Gel/Injectable TU 24 months ↑ ↓Frederiksen et al. [51] Gel 6 months ↑ ↓Emmelot-Vonk et al. [52] Oral TU 6 months ↑ ↓Borst et al. [53] TE 12 months ↑ ↓
Testosterone Therapy Increases Lean Body Mass and Reduces Total Body Fat Mass
in Men with Testosterone Deficiency
TE, testosterone enanthate; TU, testosterone undecanoate
Traish AM Curr Opin Endocrinol Diabet Obes 21: 313-322 (2014)
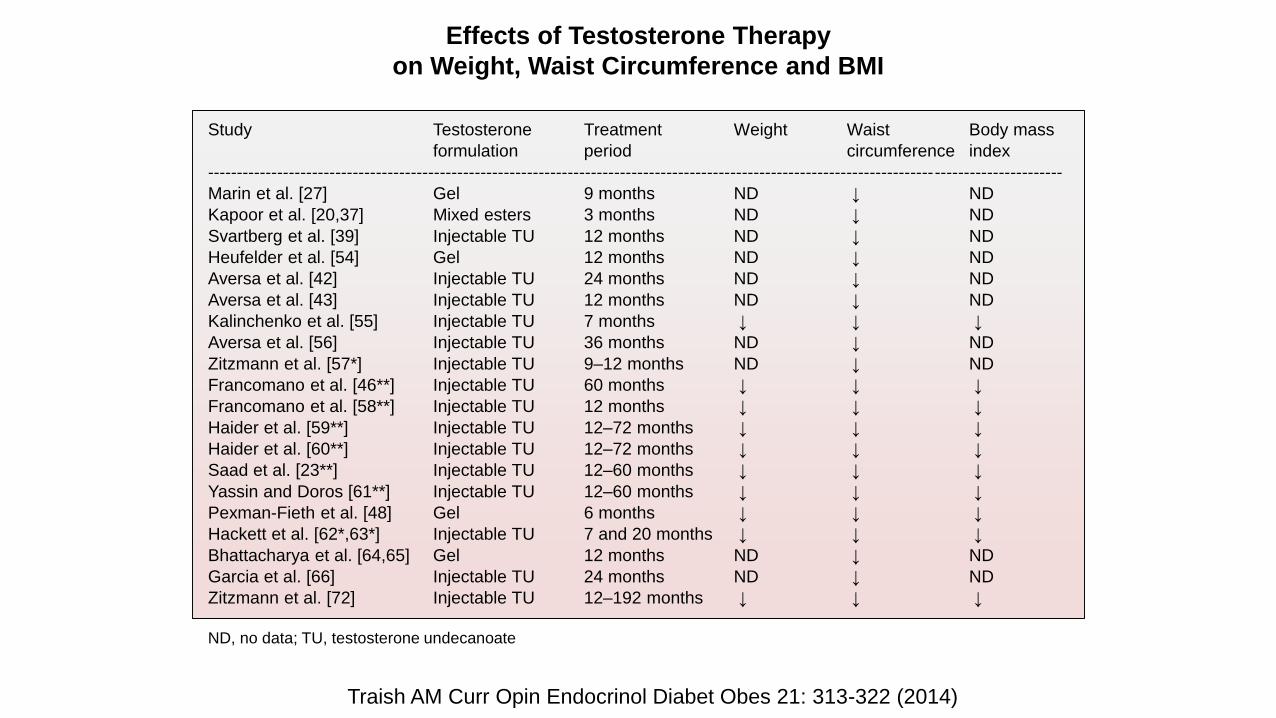
Study Testosterone Treatment Weight Waist Body mass
formulation period circumference index
---------------------------------------------------------------------------------------------------------------------------------------------------
Marin et al. [27] Gel 9 months ND ↓ ND
Kapoor et al. [20,37] Mixed esters 3 months ND ↓ ND
Svartberg et al. [39] Injectable TU 12 months ND ↓ ND
Heufelder et al. [54] Gel 12 months ND ↓ ND
Aversa et al. [42] Injectable TU 24 months ND ↓ ND
Aversa et al. [43] Injectable TU 12 months ND ↓ ND
Kalinchenko et al. [55] Injectable TU 7 months ↓ ↓ ↓
Aversa et al. [56] Injectable TU 36 months ND ↓ ND
Zitzmann et al. [57*] Injectable TU 9–12 months ND ↓ ND
Francomano et al. [46**] Injectable TU 60 months ↓ ↓ ↓
Francomano et al. [58**] Injectable TU 12 months ↓ ↓ ↓
Haider et al. [59**] Injectable TU 12–72 months ↓ ↓ ↓
Haider et al. [60**] Injectable TU 12–72 months ↓ ↓ ↓
Saad et al. [23**] Injectable TU 12–60 months ↓ ↓ ↓
Yassin and Doros [61**] Injectable TU 12–60 months ↓ ↓ ↓
Pexman-Fieth et al. [48] Gel 6 months ↓ ↓ ↓
Hackett et al. [62*,63*] Injectable TU 7 and 20 months ↓ ↓ ↓
Bhattacharya et al. [64,65] Gel 12 months ND ↓ ND
Garcia et al. [66] Injectable TU 24 months ND ↓ ND
Zitzmann et al. [72] Injectable TU 12–192 months ↓ ↓ ↓
ND, no data; TU, testosterone undecanoate
Effects of Testosterone Therapy
on Weight, Waist Circumference and BMI
Traish AM Curr Opin Endocrinol Diabet Obes 21: 313-322 (2014)
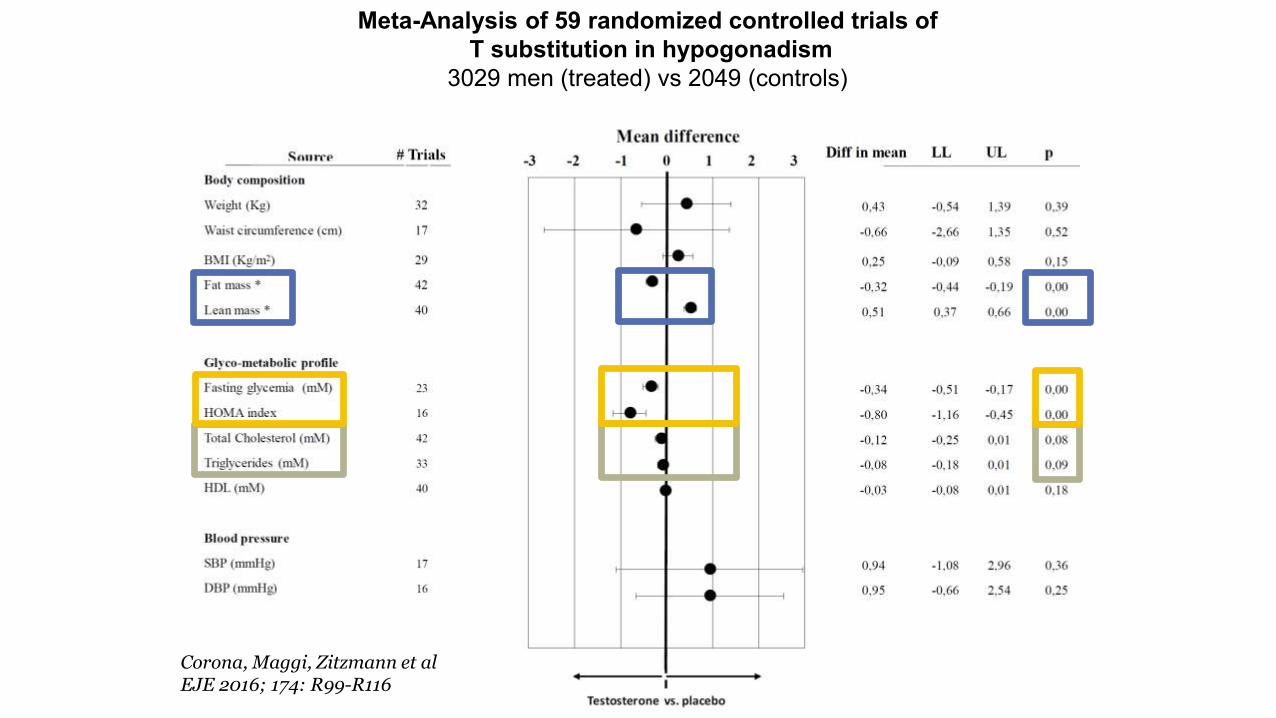
Meta-Analysis of 59 randomized controlled trials of
T substitution in hypogonadism
3029 men (treated) vs 2049 (controls)
Corona, Maggi, Zitzmann et al EJE 2016; 174: R99-R116
+ -
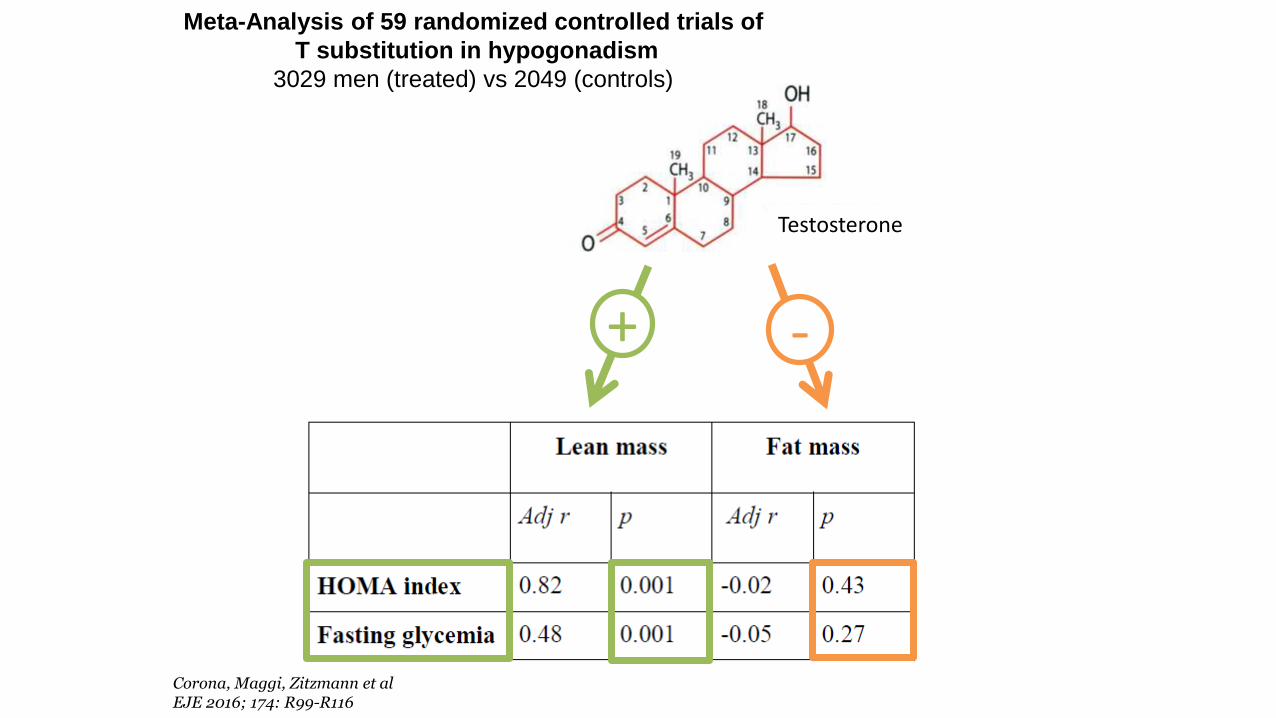
Meta-Analysis of 59 randomized controlled trials of
T substitution in hypogonadism
3029 men (treated) vs 2049 (controls)
Corona, Maggi, Zitzmann et al EJE 2016; 174: R99-R116
Testosterone
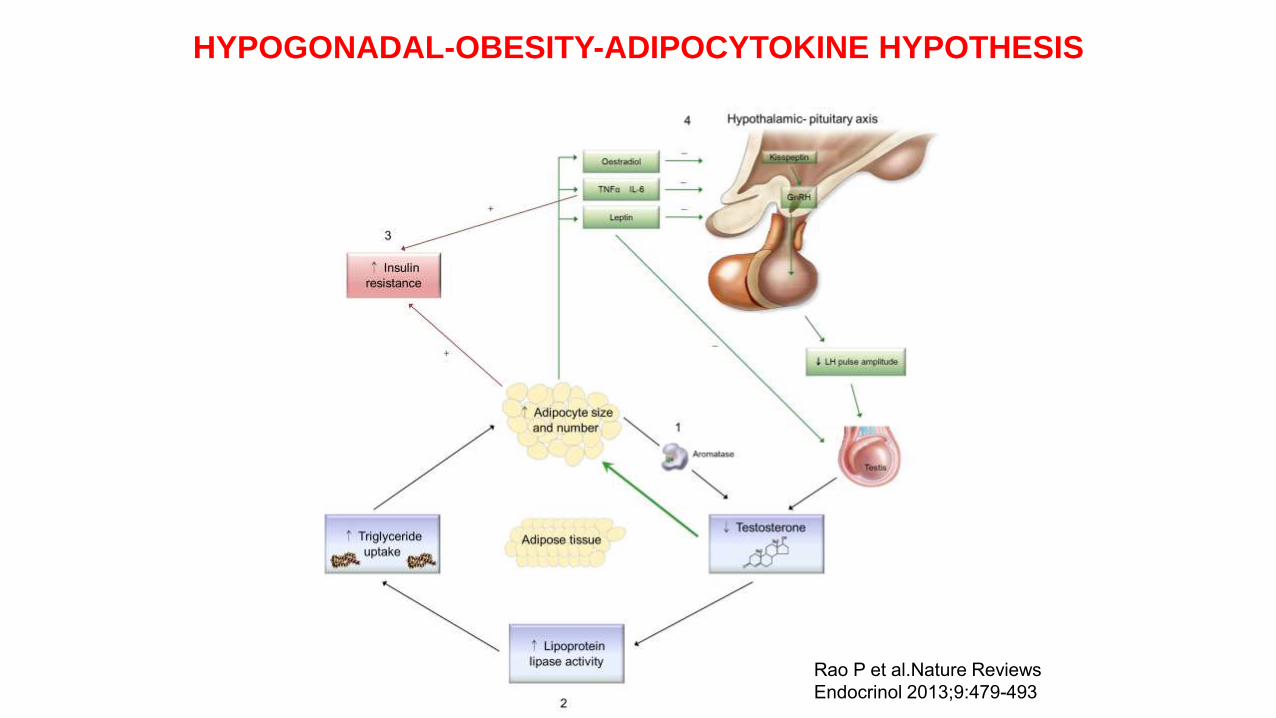
HYPOGONADAL-OBESITY-ADIPOCYTOKINE HYPOTHESIS
Rao P et al.Nature Reviews
Endocrinol 2013;9:479-493
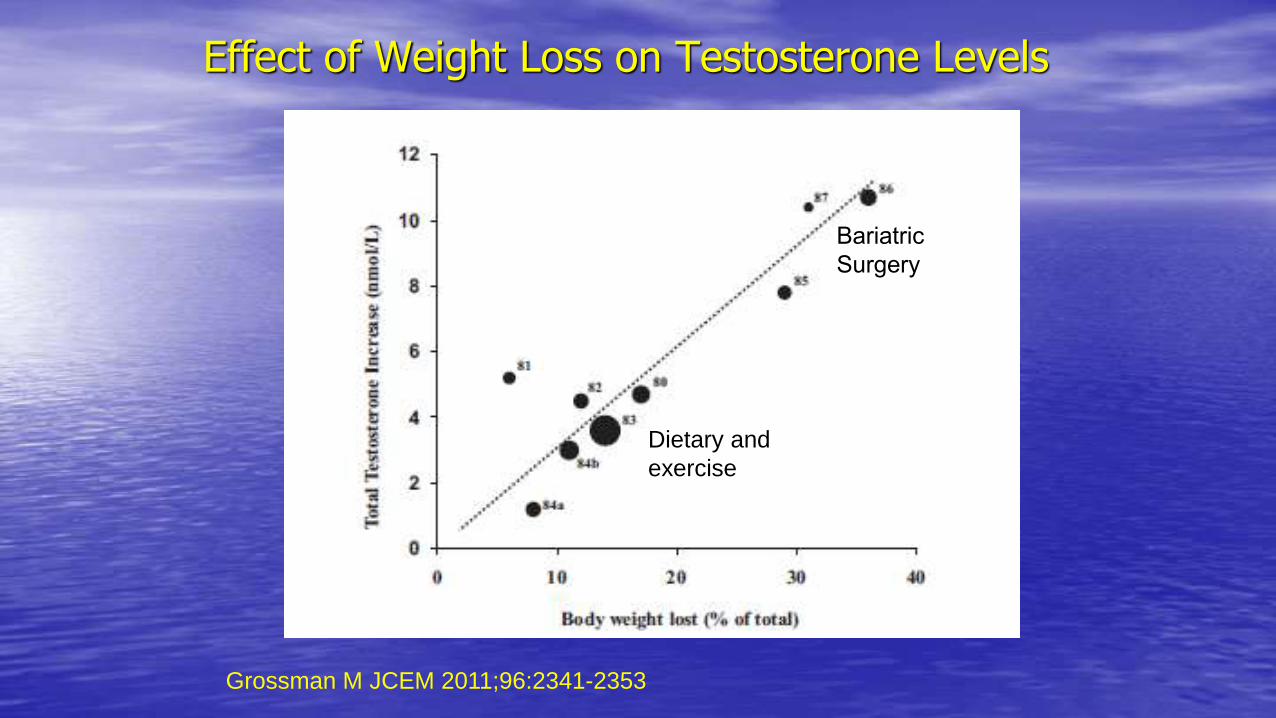
Effect of Weight Loss on Testosterone Levels
Grossman M JCEM 2011;96:2341-2353
Bariatric
Surgery
Dietary and
exercise
*
*
*
*
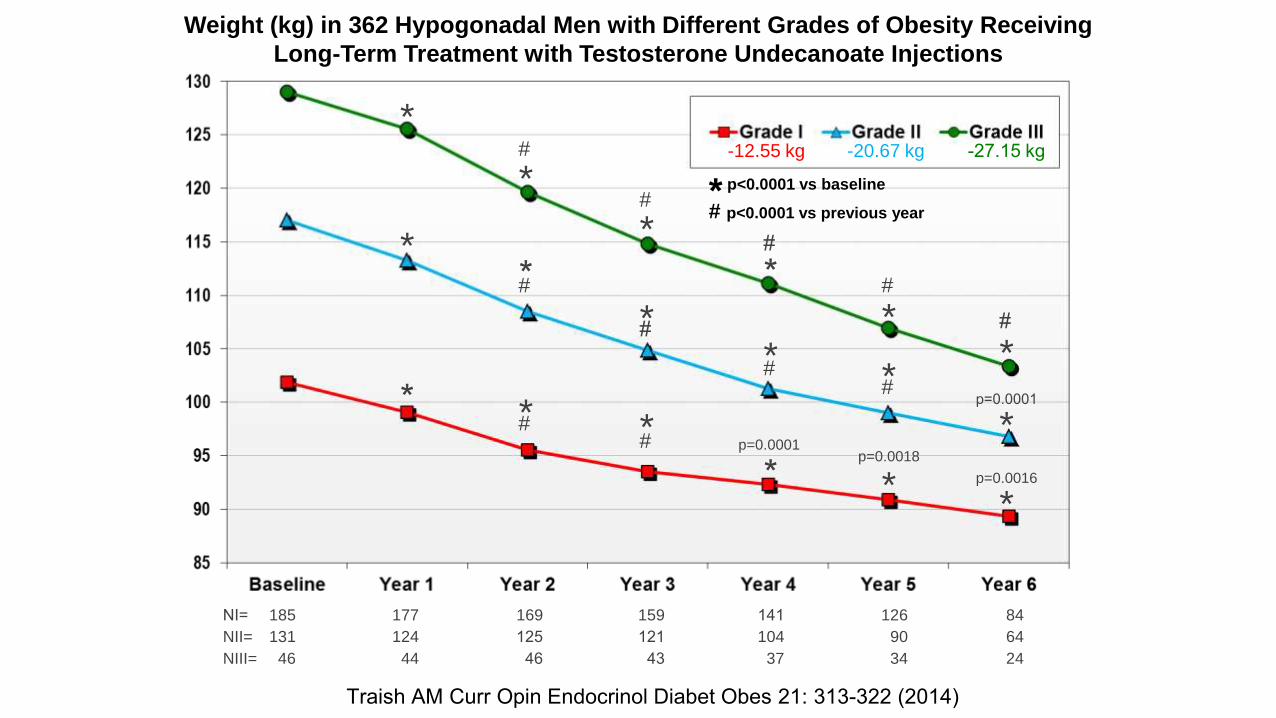
185 159 141 126 84177 169NI=
*
131 121 104 90 64124 125NII=
46 43 37 34 2444 46NIII=
**
**
*
** * *
* **
#
#
#
##
#
##
##
p=0.0001
p=0.0018
*#
p=0.0001
p=0.0016
-12.55 kg -20.67 kg -27.15 kg
* p<0.0001 vs baseline
# p<0.0001 vs previous year
Weight (kg) in 362 Hypogonadal Men with Different Grades of Obesity Receiving
Long-Term Treatment with Testosterone Undecanoate Injections
Traish AM Curr Opin Endocrinol Diabet Obes 21: 313-322 (2014)
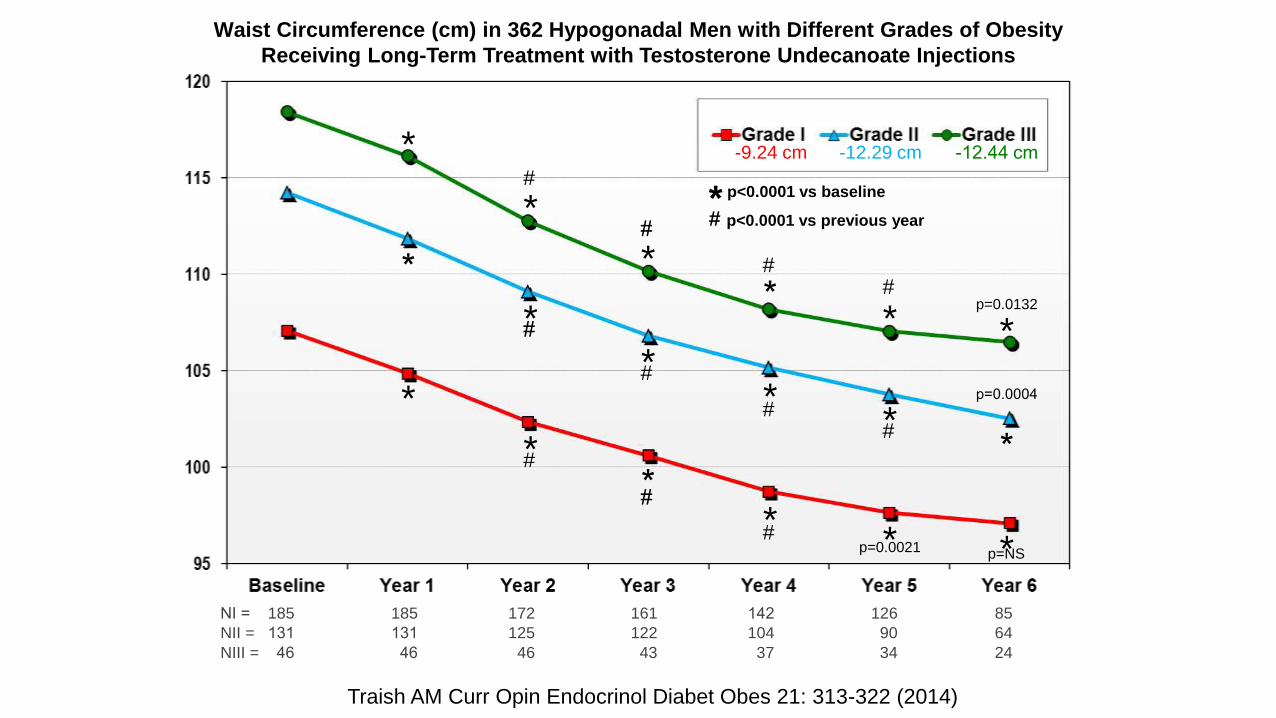
Waist Circumference (cm) in 362 Hypogonadal Men with Different Grades of Obesity
Receiving Long-Term Treatment with Testosterone Undecanoate Injections
*
*
**
185 161 142 126 85185 172NI =
* *
131 122 104 90 64131 125NII =
46 43 37 34 2446 46NIII =
*
**
**
*
*
**
** *
#
#
##
#
#
##
#
#
#
p=0.0132
p=0.0004
p=0.0021 p=NS
-9.24 cm -12.29 cm -12.44 cm
* p<0.0001 vs baseline
# p<0.0001 vs previous year
Traish AM Curr Opin Endocrinol Diabet Obes 21: 313-322 (2014)
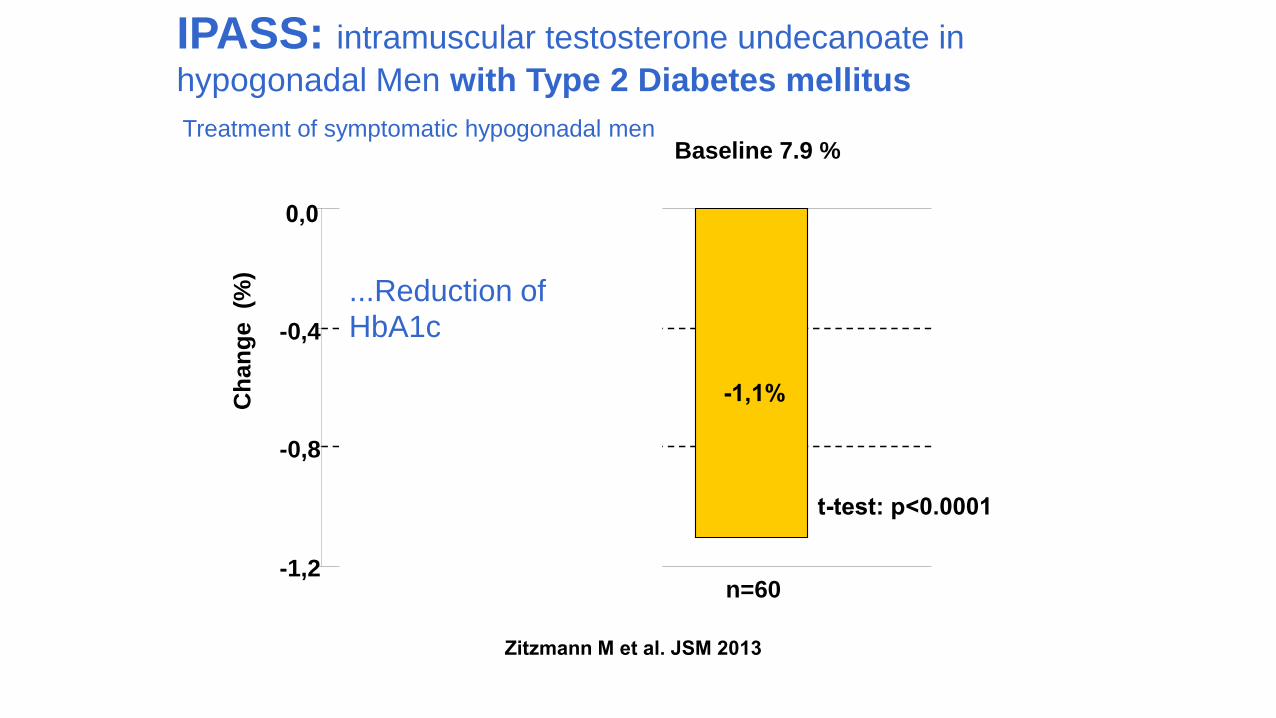
-1,1%
-0,3%
-1,2
-0,8
-0,4
0,0
Total population
Ch
an
ge (%
)
n=293 n=60
Baseline 6.2 %
Baseline 7.9 %
t-test: p=0.01
t-test: p<0.0001
...Reduction ofHbA1c
IPASS: intramuscular testosterone undecanoate in
hypogonadal Men with Type 2 Diabetes mellitus
Zitzmann M et al. JSM 2013
Treatment of symptomatic hypogonadal men
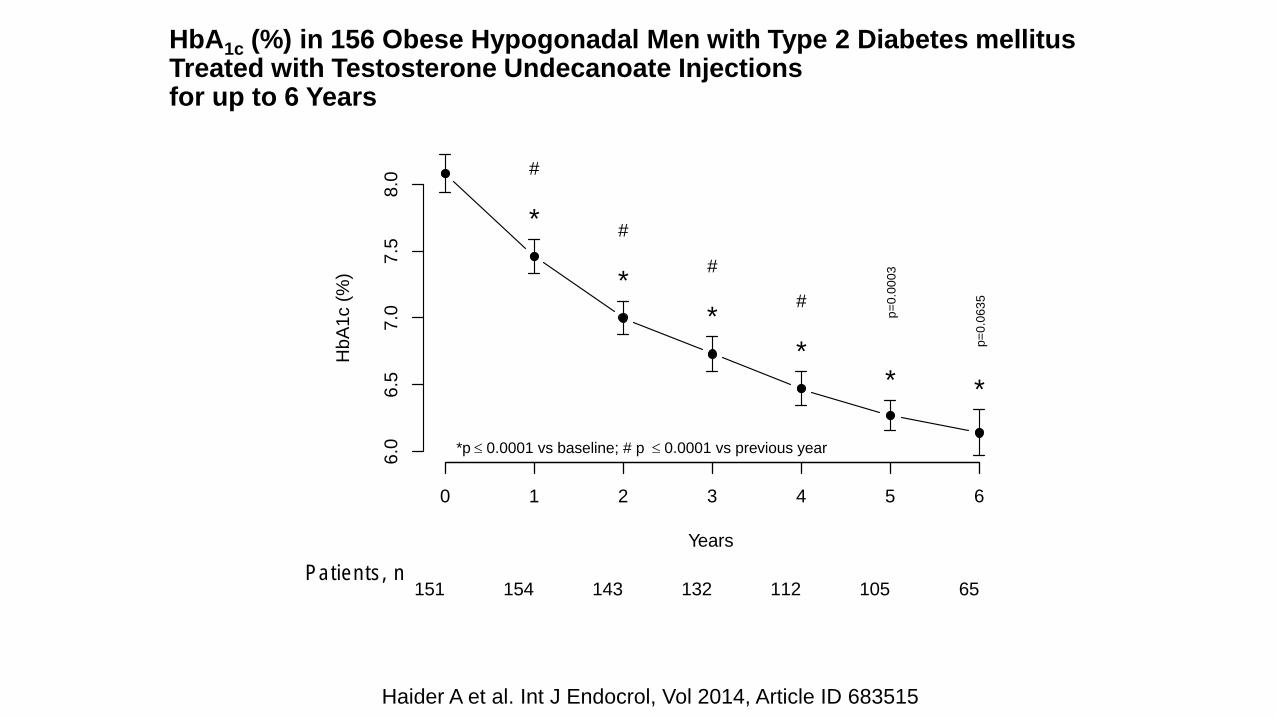
HbA1c (%) in 156 Obese Hypogonadal Men with Type 2 Diabetes mellitus Treated with Testosterone Undecanoate Injections for up to 6 Years
Haider A et al. Int J Endocrol, Vol 2014, Article ID 683515
Years
HbA
1c (
%)
*
*
*
** *
#
#
#
#
p=
0.0
63
5
p=
0.0
00
3
6.0
6.5
7.0
7.5
8.0
*p £ 0.0001 vs baseline; # p £ 0.0001 vs previous year
0 1 2 3 4 5 6
Patients, n151 154 143 132 112 105 65
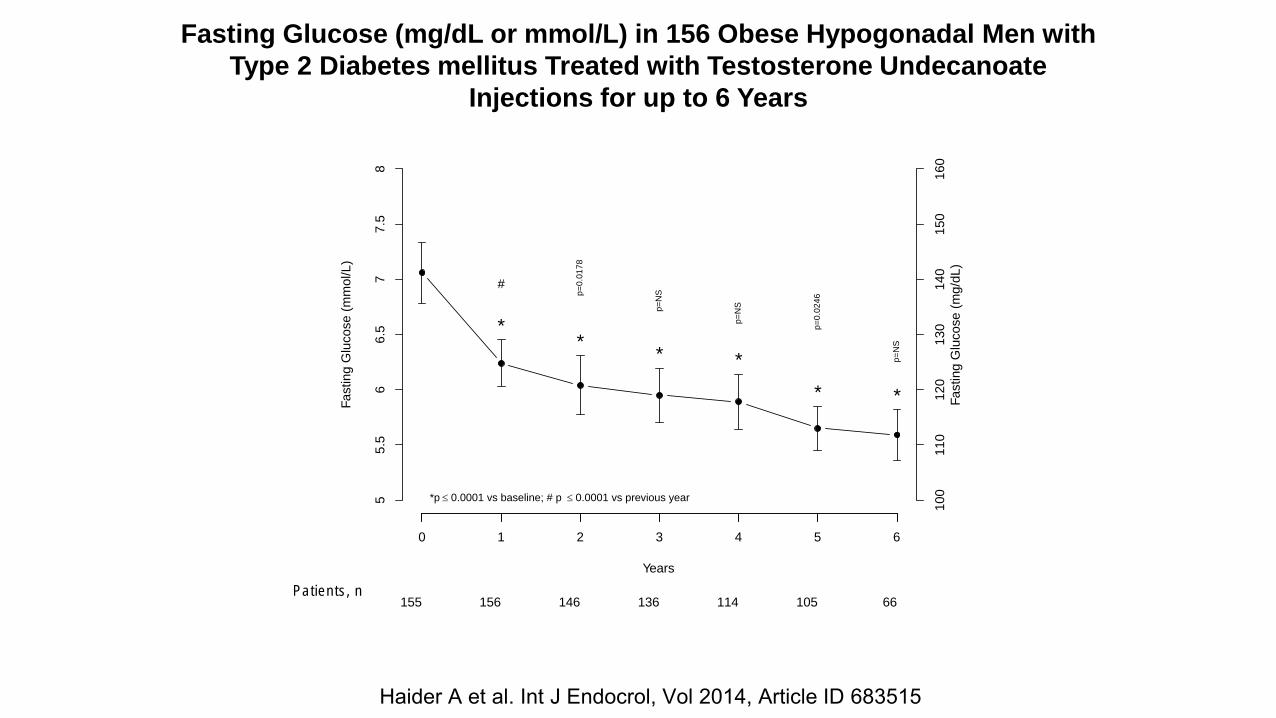
Fasting Glucose (mg/dL or mmol/L) in 156 Obese Hypogonadal Men with
Type 2 Diabetes mellitus Treated with Testosterone Undecanoate
Injections for up to 6 Years
Haider A et al. Int J Endocrol, Vol 2014, Article ID 683515
Years
Fa
sting G
lucose
(m
mol/L
)
**
* *
* *
#
p=
0.0
17
8
p=
NS
p=
NS
p=
NS
p=
0.0
24
6
55.5
66.5
77.5
8
100
11
0120
13
0140
15
0160
Fa
sting G
lucose (
mg
/dL)
*p £ 0.0001 vs baseline; # p £ 0.0001 vs previous year
0 1 2 3 4 5 6
Patients, n155 156 146 136 114 105 66
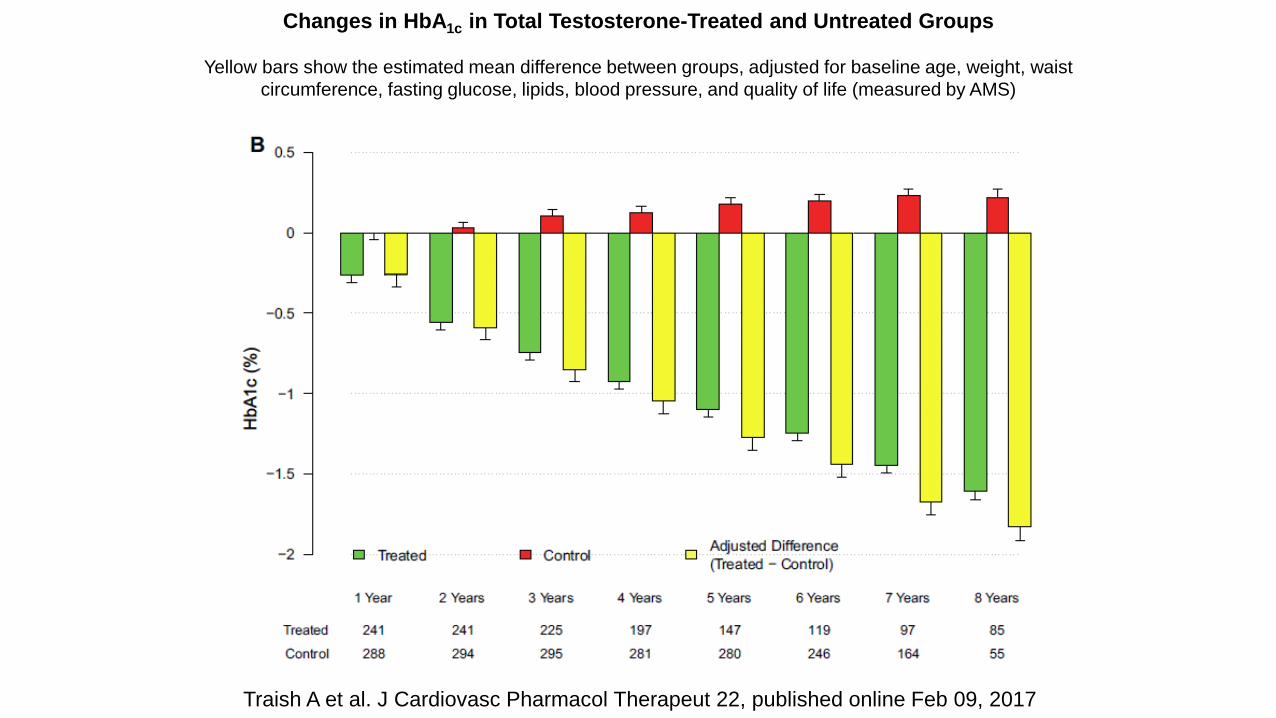
Traish A et al. J Cardiovasc Pharmacol Therapeut 22, published online Feb 09, 2017
Changes in HbA1c in Total Testosterone-Treated and Untreated Groups
Yellow bars show the estimated mean difference between groups, adjusted for baseline age, weight, waist
circumference, fasting glucose, lipids, blood pressure, and quality of life (measured by AMS)
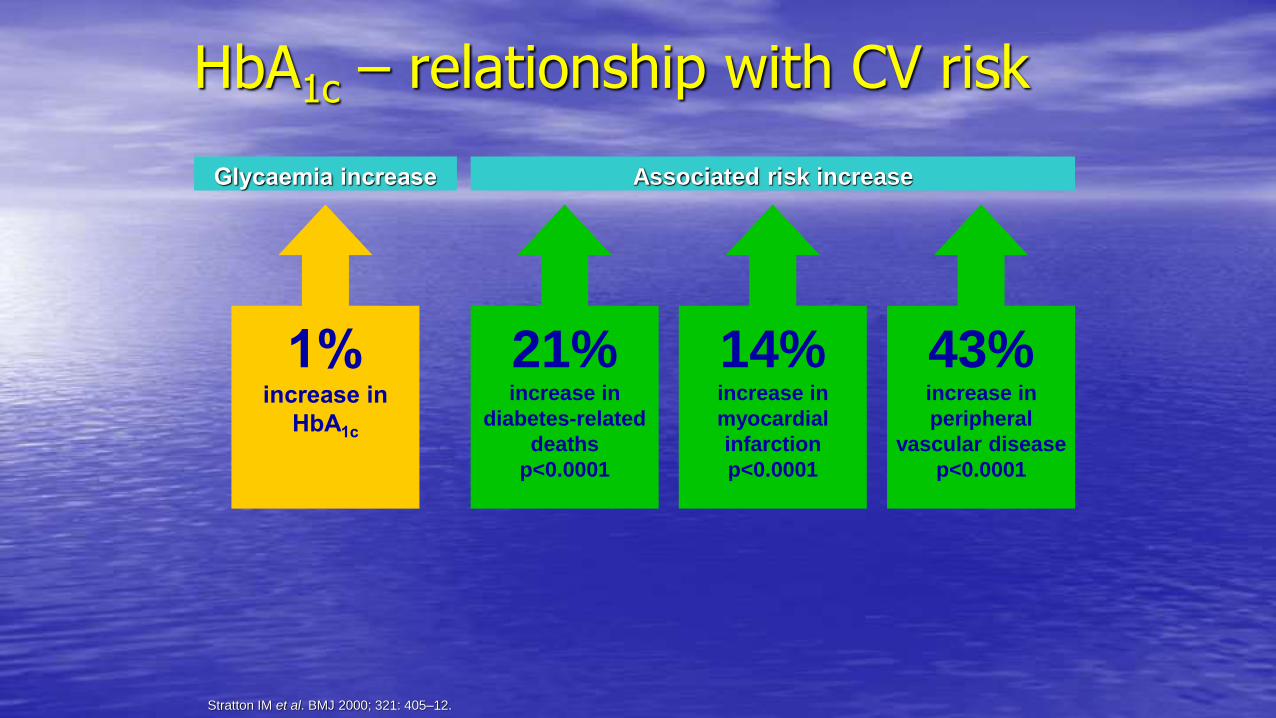
1%increase in
HbA1c
21%increase in
diabetes-related
deaths
p<0.0001
14%increase in
myocardial
infarction
p<0.0001
43%increase in
peripheral
vascular disease
p<0.0001
HbA1c – relationship with CV risk
Glycaemia increase Associated risk increase
Stratton IM et al. BMJ 2000; 321: 405–12.
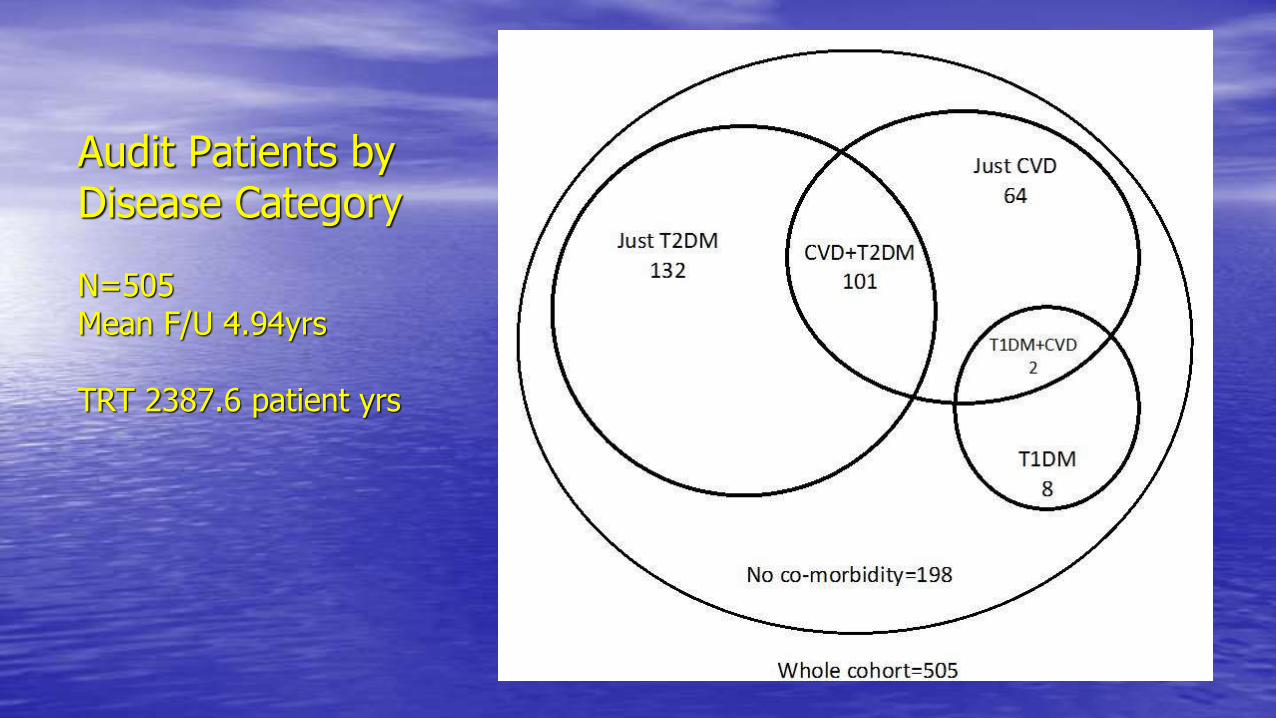
Audit Patients by Disease Category
N=505 Mean F/U 4.94yrs
TRT 2387.6 patient yrs
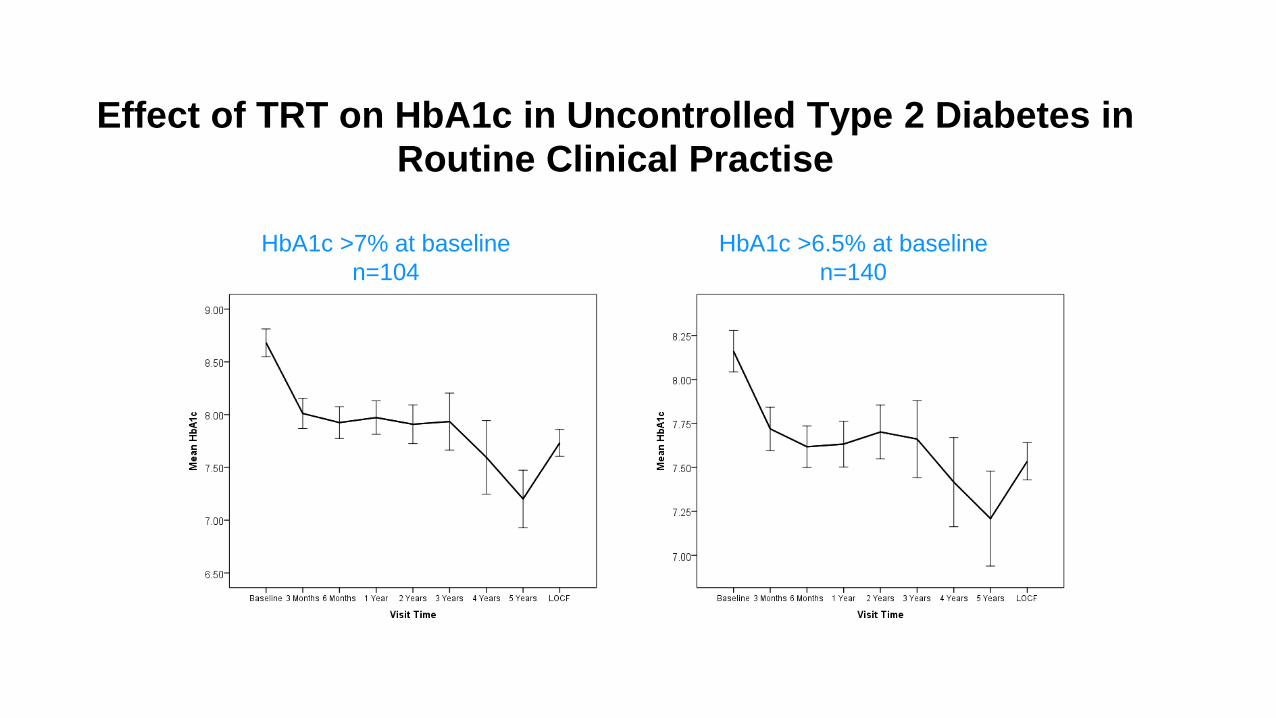
Effect of TRT on HbA1c in Uncontrolled Type 2 Diabetes in
Routine Clinical Practise
HbA1c >7% at baseline
n=104
HbA1c >6.5% at baseline
n=140
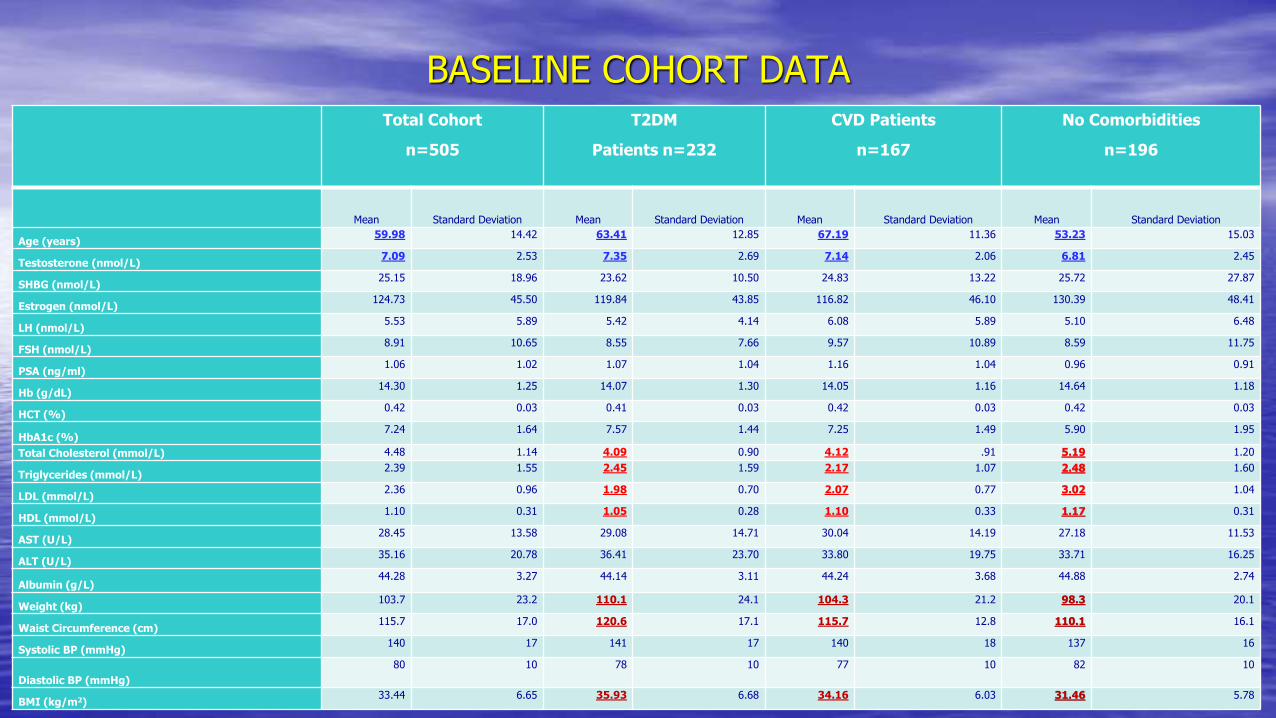
BASELINE COHORT DATATotal Cohort
n=505
T2DM
Patients n=232
CVD Patients
n=167
No Comorbidities
n=196
Mean Standard Deviation Mean Standard Deviation Mean Standard Deviation Mean Standard Deviation
Age (years)59.98 14.42 63.41 12.85 67.19 11.36 53.23 15.03
Testosterone (nmol/L)7.09 2.53 7.35 2.69 7.14 2.06 6.81 2.45
SHBG (nmol/L)25.15 18.96 23.62 10.50 24.83 13.22 25.72 27.87
Estrogen (nmol/L)124.73 45.50 119.84 43.85 116.82 46.10 130.39 48.41
LH (nmol/L)5.53 5.89 5.42 4.14 6.08 5.89 5.10 6.48
FSH (nmol/L)8.91 10.65 8.55 7.66 9.57 10.89 8.59 11.75
PSA (ng/ml)1.06 1.02 1.07 1.04 1.16 1.04 0.96 0.91
Hb (g/dL)14.30 1.25 14.07 1.30 14.05 1.16 14.64 1.18
HCT (%)0.42 0.03 0.41 0.03 0.42 0.03 0.42 0.03
HbA1c (%)7.24 1.64 7.57 1.44 7.25 1.49 5.90 1.95
Total Cholesterol (mmol/L) 4.48 1.14 4.09 0.90 4.12 .91 5.19 1.20
Triglycerides (mmol/L)2.39 1.55 2.45 1.59 2.17 1.07 2.48 1.60
LDL (mmol/L)2.36 0.96 1.98 0.70 2.07 0.77 3.02 1.04
HDL (mmol/L)1.10 0.31 1.05 0.28 1.10 0.33 1.17 0.31
AST (U/L)28.45 13.58 29.08 14.71 30.04 14.19 27.18 11.53
ALT (U/L)35.16 20.78 36.41 23.70 33.80 19.75 33.71 16.25
Albumin (g/L)44.28 3.27 44.14 3.11 44.24 3.68 44.88 2.74
Weight (kg)103.7 23.2 110.1 24.1 104.3 21.2 98.3 20.1
Waist Circumference (cm)115.7 17.0 120.6 17.1 115.7 12.8 110.1 16.1
Systolic BP (mmHg)140 17 141 17 140 18 137 16
Diastolic BP (mmHg)
80 10 78 10 77 10 82 10
BMI (kg/m2)33.44 6.65 35.93 6.68 34.16 6.03 31.46 5.78
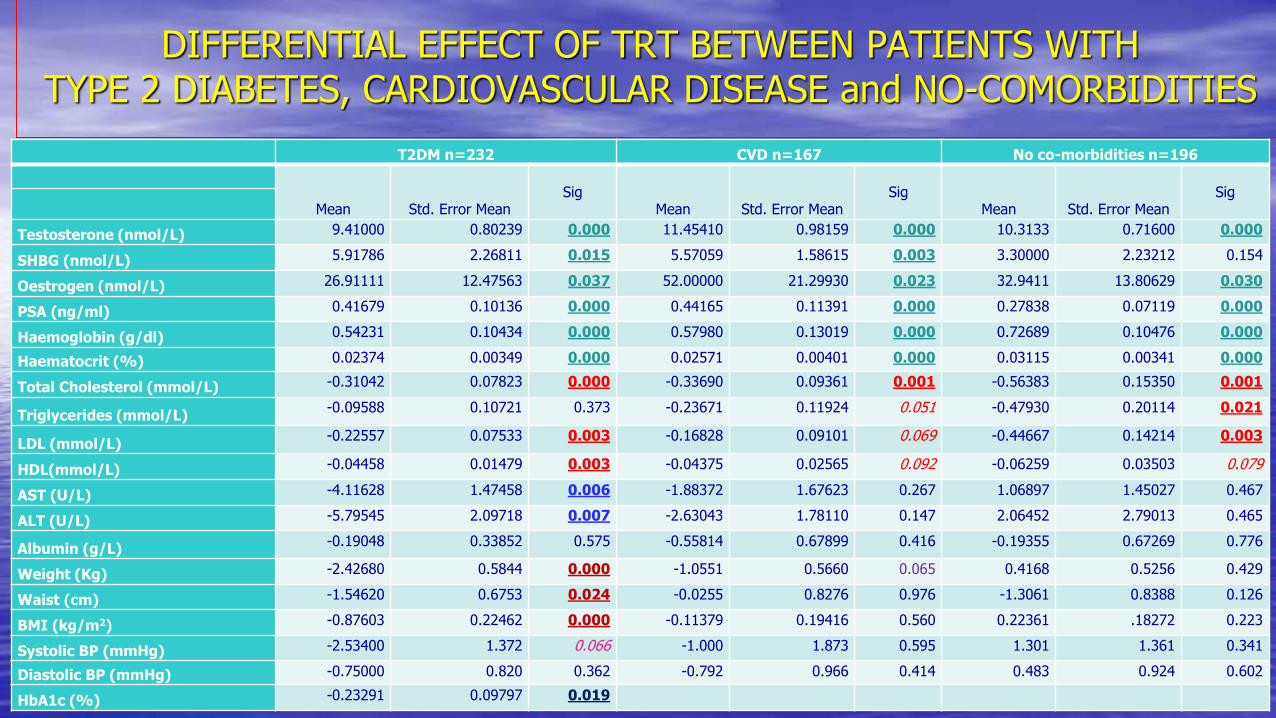
DIFFERENTIAL EFFECT OF TRT BETWEEN PATIENTS WITHTYPE 2 DIABETES, CARDIOVASCULAR DISEASE and NO-COMORBIDITIES
T2DM n=232 CVD n=167 No co-morbidities n=196
Mean Std. Error MeanSig
Mean Std. Error MeanSig
Mean Std. Error MeanSig
Testosterone (nmol/L) 9.41000 0.80239 0.000 11.45410 0.98159 0.000 10.3133 0.71600 0.000
SHBG (nmol/L) 5.91786 2.26811 0.015 5.57059 1.58615 0.003 3.30000 2.23212 0.154
Oestrogen (nmol/L) 26.91111 12.47563 0.037 52.00000 21.29930 0.023 32.9411 13.80629 0.030
PSA (ng/ml) 0.41679 0.10136 0.000 0.44165 0.11391 0.000 0.27838 0.07119 0.000
Haemoglobin (g/dl) 0.54231 0.10434 0.000 0.57980 0.13019 0.000 0.72689 0.10476 0.000
Haematocrit (%) 0.02374 0.00349 0.000 0.02571 0.00401 0.000 0.03115 0.00341 0.000
Total Cholesterol (mmol/L) -0.31042 0.07823 0.000 -0.33690 0.09361 0.001 -0.56383 0.15350 0.001
Triglycerides (mmol/L)-0.09588 0.10721 0.373 -0.23671 0.11924 0.051 -0.47930 0.20114 0.021
LDL (mmol/L)-0.22557 0.07533 0.003 -0.16828 0.09101 0.069 -0.44667 0.14214 0.003
HDL(mmol/L) -0.04458 0.01479 0.003 -0.04375 0.02565 0.092 -0.06259 0.03503 0.079
AST (U/L) -4.11628 1.47458 0.006 -1.88372 1.67623 0.267 1.06897 1.45027 0.467
ALT (U/L) -5.79545 2.09718 0.007 -2.63043 1.78110 0.147 2.06452 2.79013 0.465
Albumin (g/L)-0.19048 0.33852 0.575 -0.55814 0.67899 0.416 -0.19355 0.67269 0.776
Weight (Kg) -2.42680 0.5844 0.000 -1.0551 0.5660 0.065 0.4168 0.5256 0.429
Waist (cm) -1.54620 0.6753 0.024 -0.0255 0.8276 0.976 -1.3061 0.8388 0.126
BMI (kg/m2) -0.87603 0.22462 0.000 -0.11379 0.19416 0.560 0.22361 .18272 0.223
Systolic BP (mmHg) -2.53400 1.372 0.066 -1.000 1.873 0.595 1.301 1.361 0.341
Diastolic BP (mmHg) -0.75000 0.820 0.362 -0.792 0.966 0.414 0.483 0.924 0.602
HbA1c (%) -0.23291 0.09797 0.019
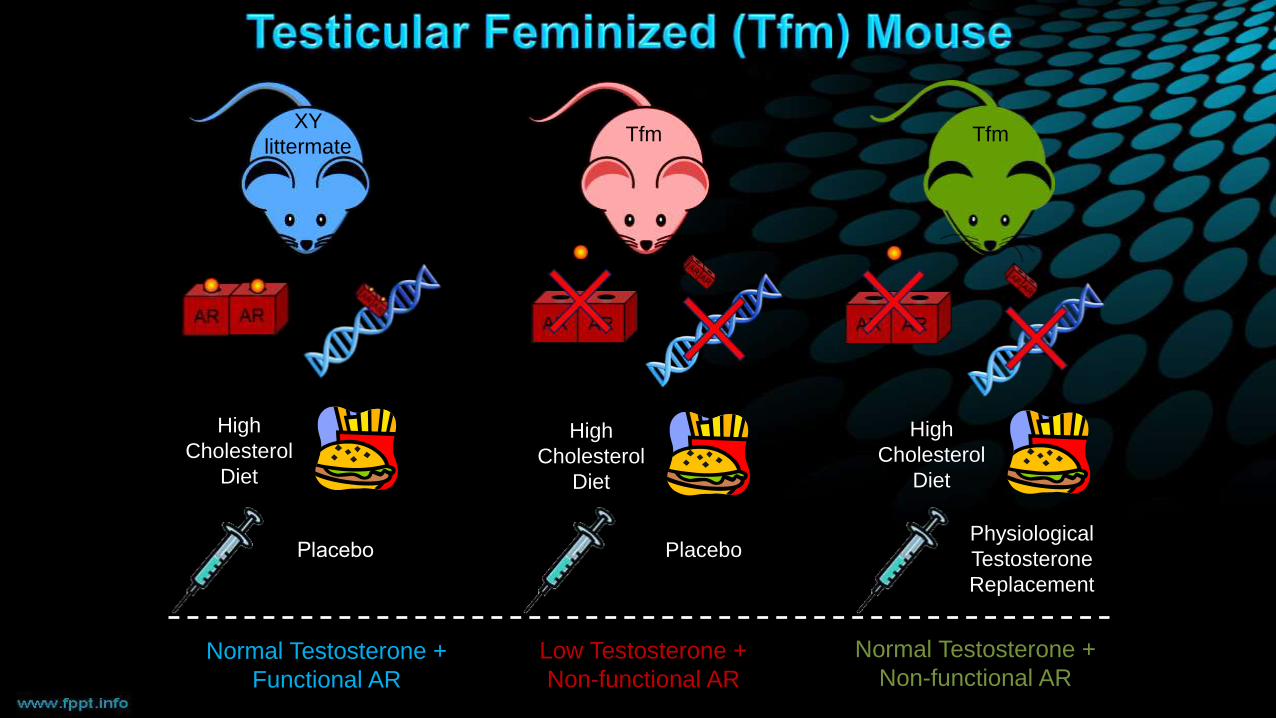
High
Cholesterol
Diet
High
Cholesterol
Diet
High
Cholesterol
Diet
Physiological
Testosterone
Replacement
Placebo Placebo
Normal Testosterone +
Functional AR
Low Testosterone +
Non-functional AR
Normal Testosterone +
Non-functional AR
Tfm TfmXY
littermate
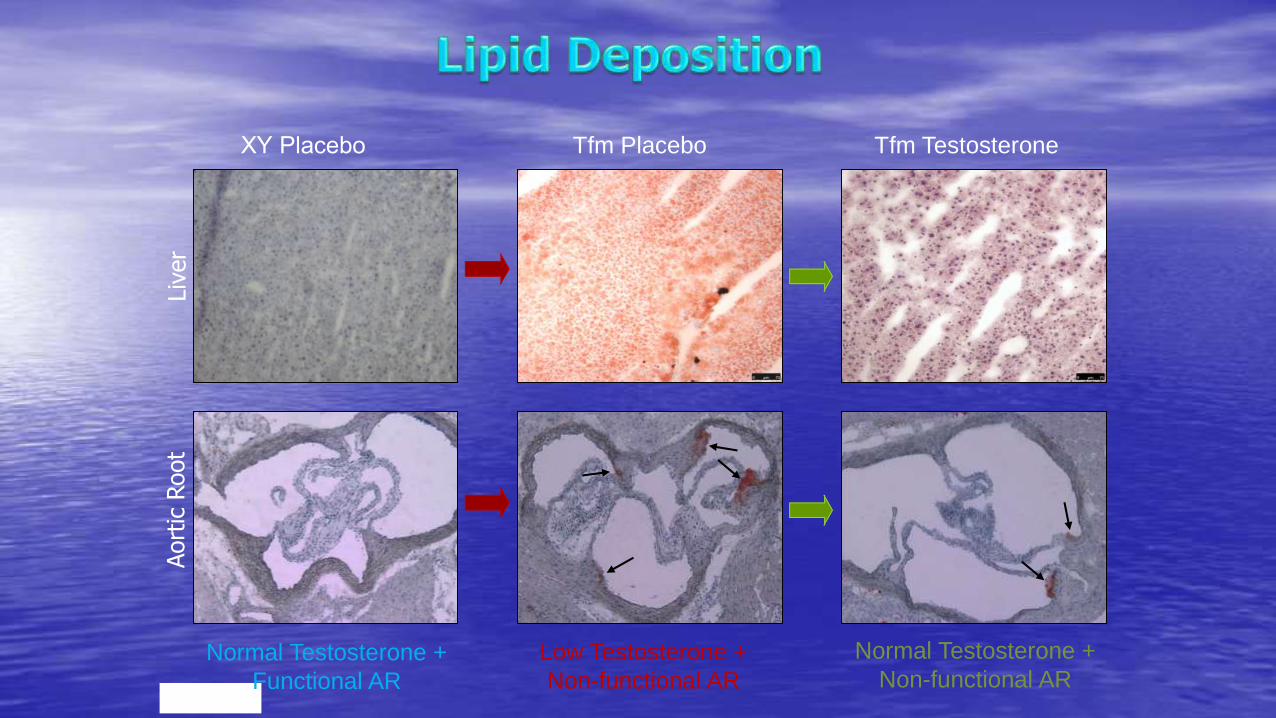
XY Placebo Tfm Placebo Tfm Testosterone
Liv
er
Aort
ic R
oot
Normal Testosterone +
Functional AR
Low Testosterone +
Non-functional AR
Normal Testosterone +
Non-functional AR

EFFECT OF TESTOSTERONE ON GLUCOSE UPTAKE IN HEPG2 INSULIN RESISTANT HUMAN LIVER CELLS
M=Metformin
F=Flutamide
Unpublished
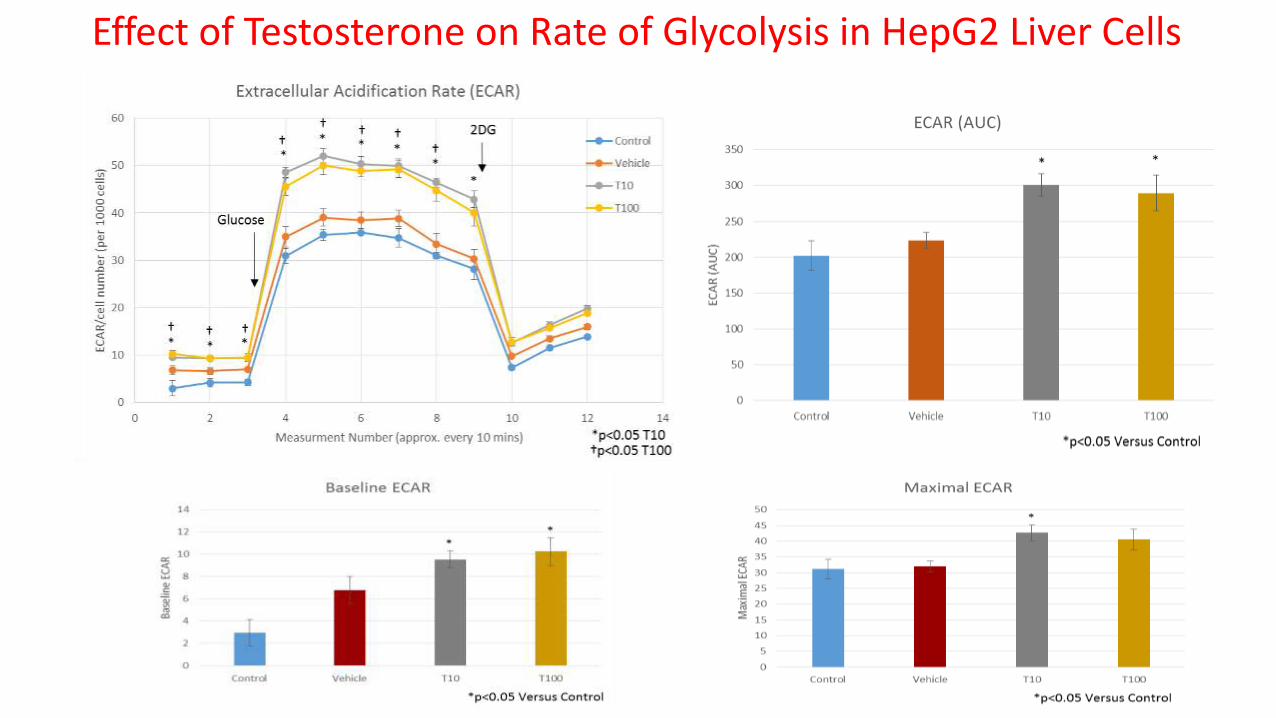
Effect of Testosterone on Rate of Glycolysis in HepG2 Liver Cells
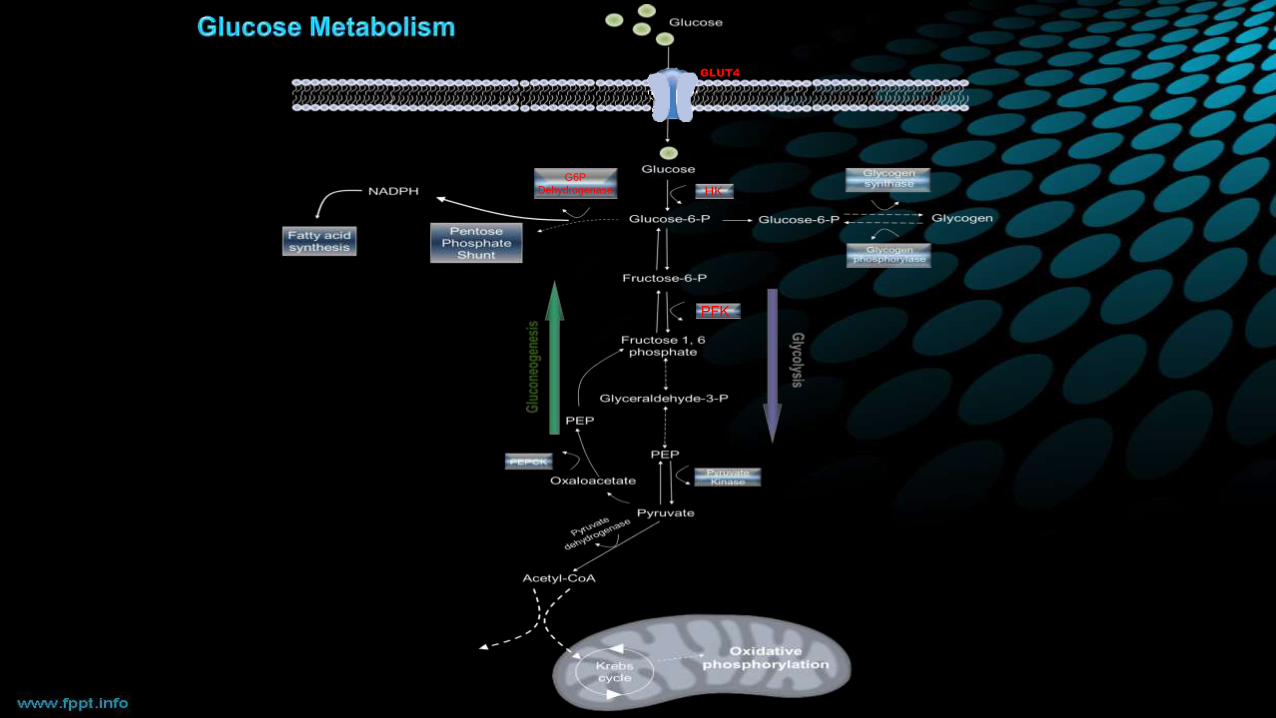
GLUT4
G6P
Dehydrogenase HK
PFK
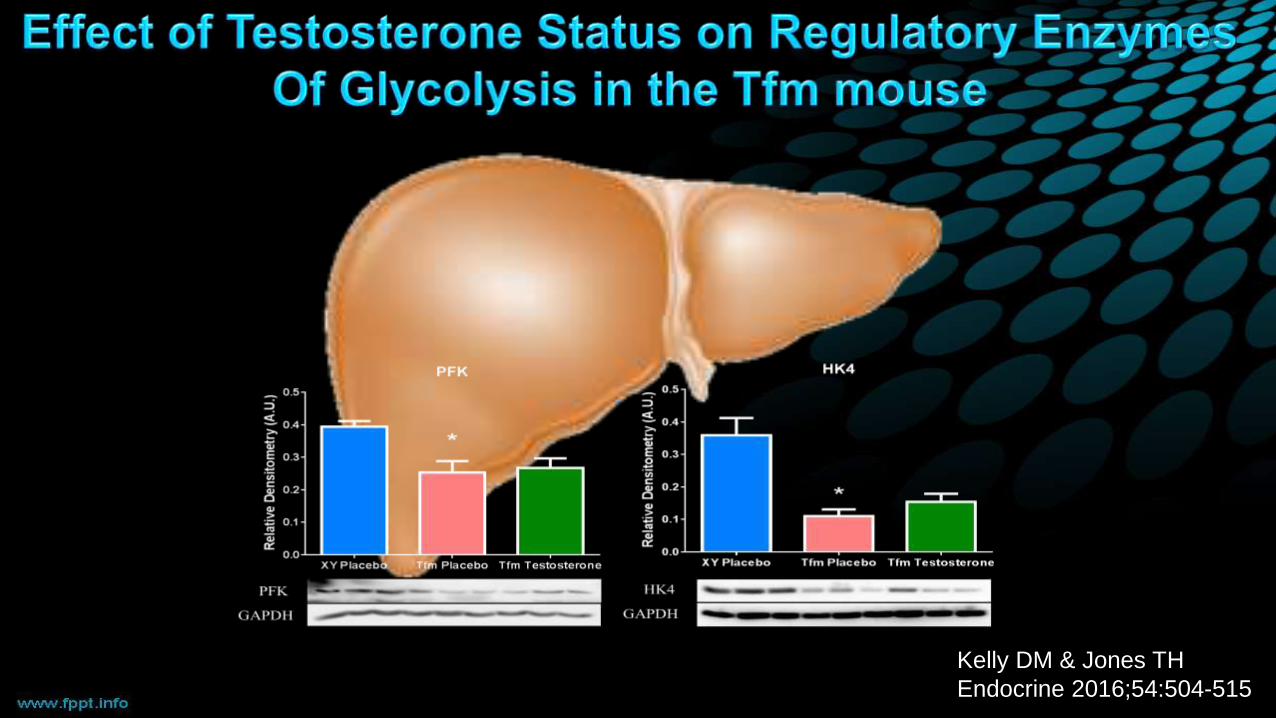
Kelly DM & Jones TH
Endocrine 2016;54:504-515
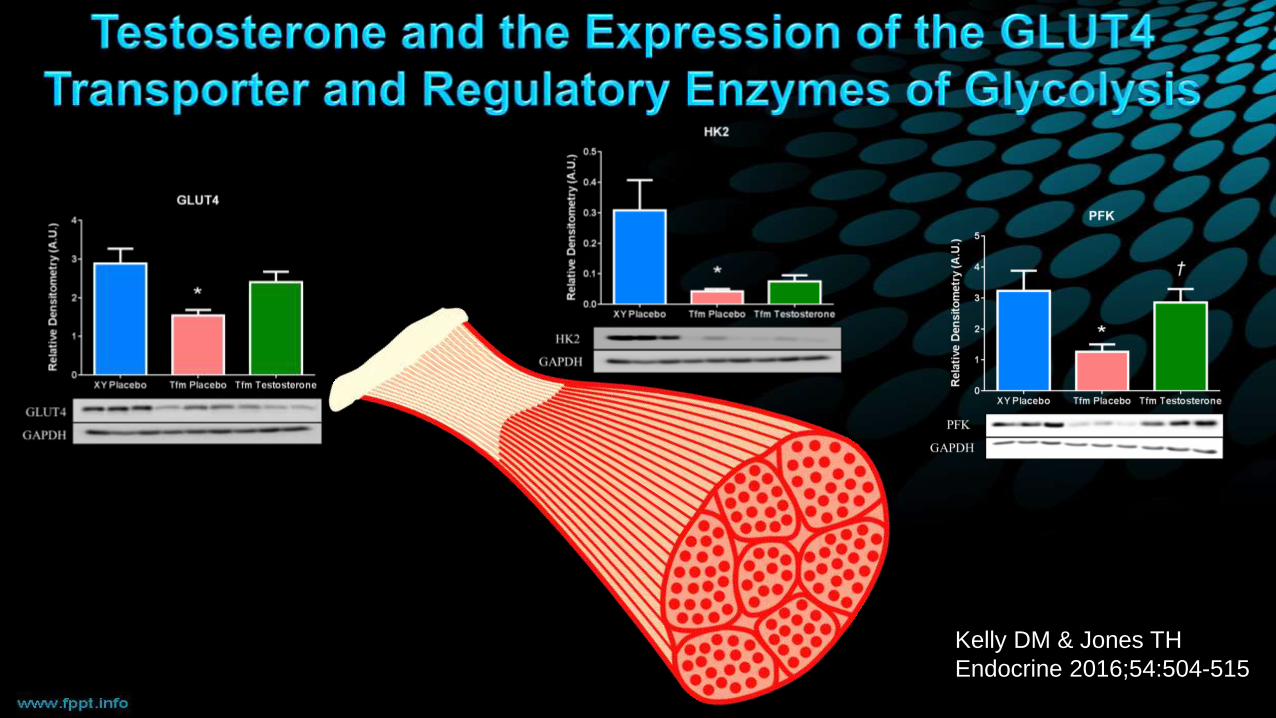
Kelly DM & Jones TH
Endocrine 2016;54:504-515
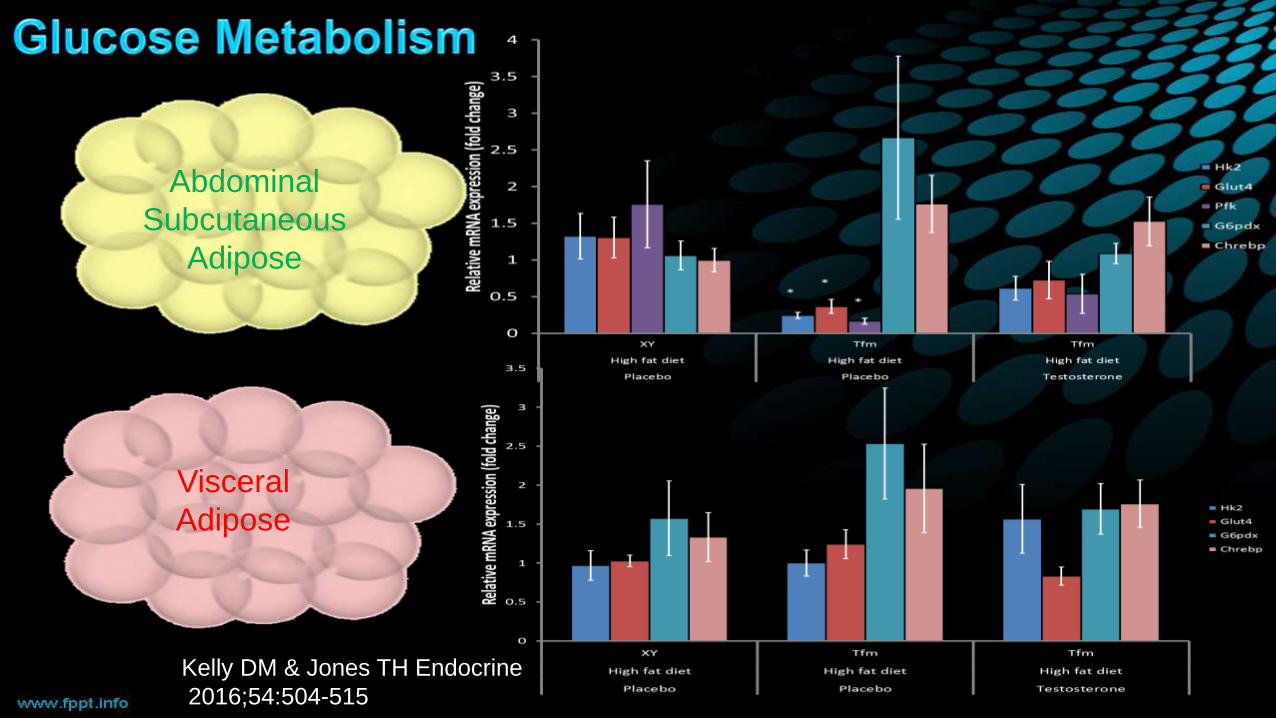
Abdominal
Subcutaneous
Adipose
Visceral
Adipose
Kelly DM & Jones TH Endocrine
2016;54:504-515
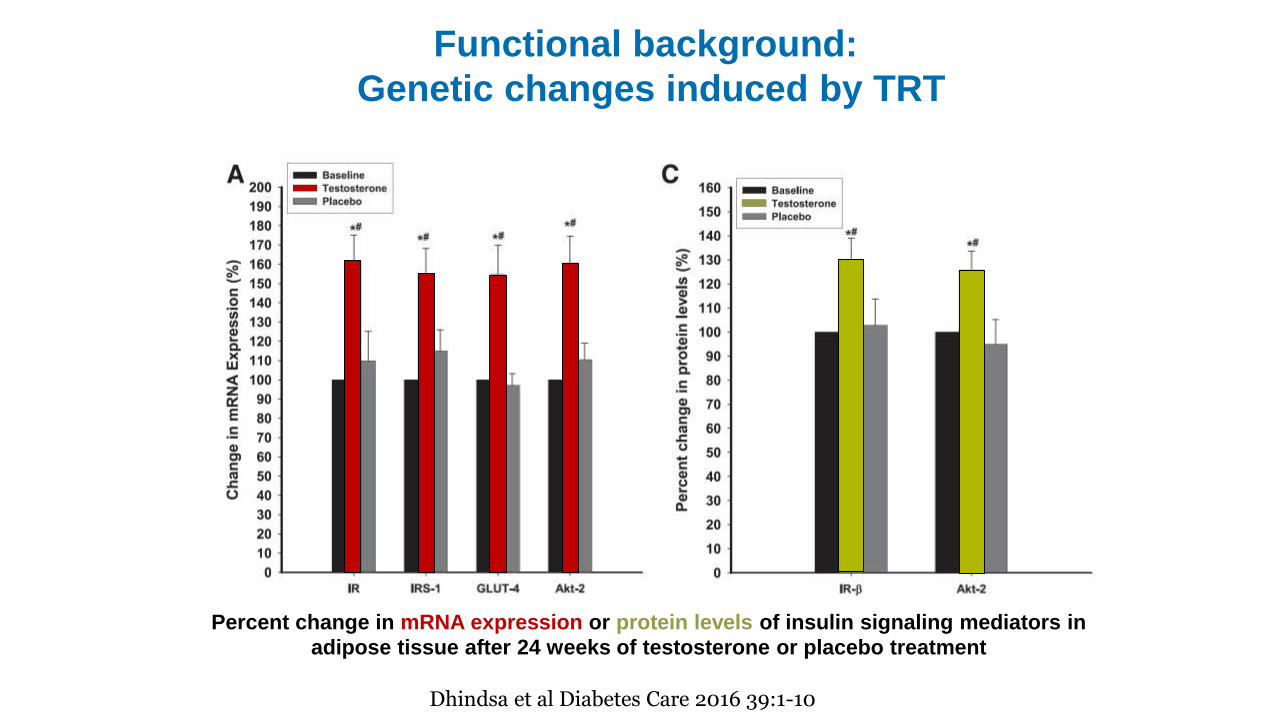
Percent change in mRNA expression or protein levels of insulin signaling mediators in
adipose tissue after 24 weeks of testosterone or placebo treatment
Functional background:
Genetic changes induced by TRT
Dhindsa et al Diabetes Care 2016 39:1-10
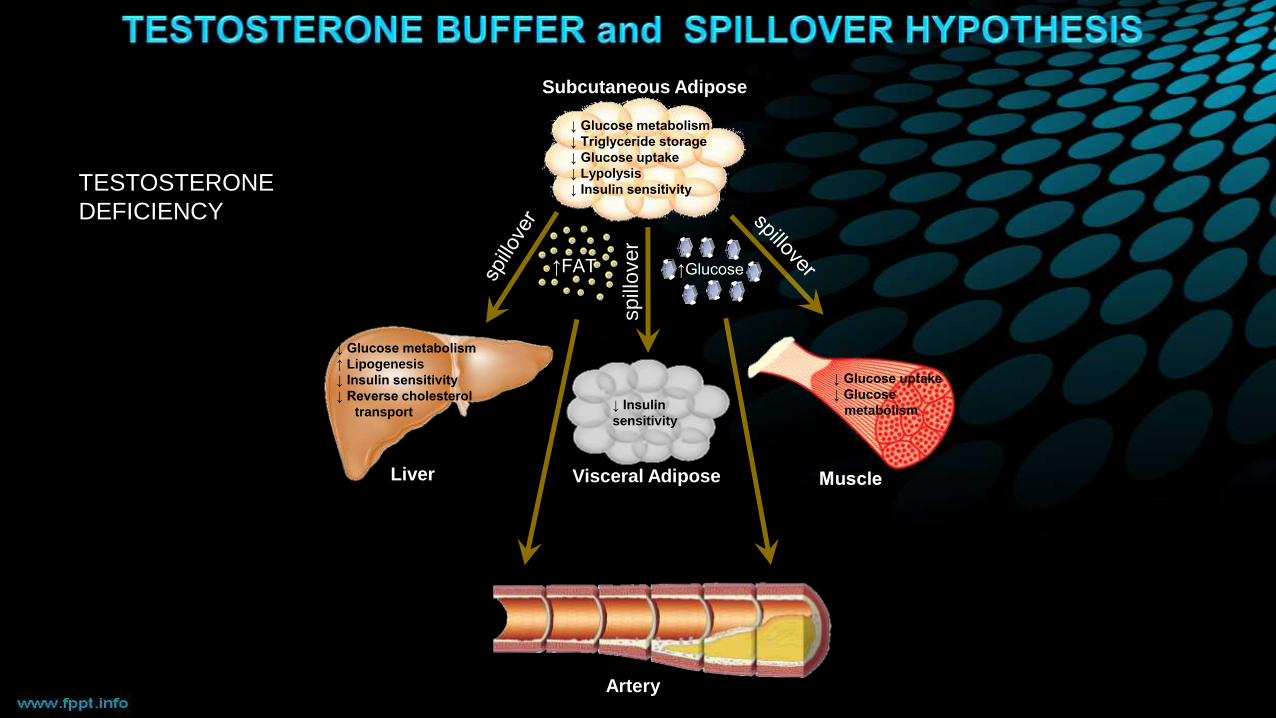
Liver
spill
over
↑FAT ↑Glucose
↓ Glucose metabolism
↑ Lipogenesis
↓ Insulin sensitivity
↓ Reverse cholesterol
transport
Subcutaneous Adipose
Visceral Adipose
↓ Insulin
sensitivity
↓ Glucose metabolism
↓ Triglyceride storage
↓ Glucose uptake
↓ Lypolysis
↓ Insulin sensitivity
Muscle
↓ Glucose uptake
↓ Glucose
metabolism
Artery
TESTOSTERONE
DEFICIENCY

• Testosterone may have tissue-specific
metabolic effects to improve glucose
utilisation and insulin sensitivity in liver,
subcutaneous adipose and muscle tissue.
• Testosterone may improve lipid metabolism
in liver and subcutaneous adipose tissue.
• Some of these effects are, at least in part,
androgen receptor independent.
• Testosterone may increase the buffering
capacity of subcutaneous adipose to protect
against energy imbalance and fat overspill
into liver and arterial vessels.
• This study adds mechanistic insight to
the observed cardiometabolic clinical
benefit of testosterone in men with T2D
and metabolic syndrome.
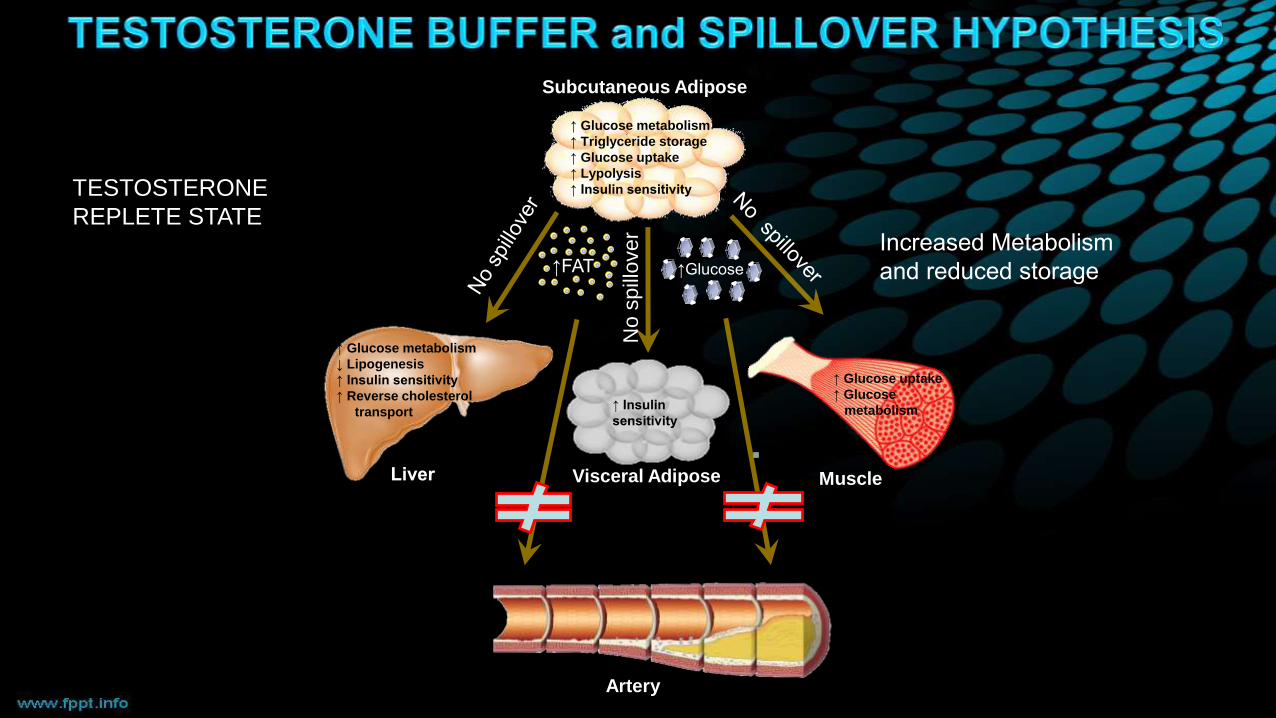
Liver
No s
pill
over
↑FAT ↑Glucose
↑ Glucose metabolism
↓ Lipogenesis
↑ Insulin sensitivity
↑ Reverse cholesterol
transport
Subcutaneous Adipose
Visceral Adipose
↑ Insulin
sensitivity
↑ Glucose metabolism
↑ Triglyceride storage
↑ Glucose uptake
↑ Lypolysis
↑ Insulin sensitivity
Muscle
↑ Glucose uptake
↑ Glucose
metabolism
Artery
TESTOSTERONE
REPLETE STATEIncreased Metabolism
and reduced storage
Summary
• Type 2 Diabetes is a terrible and serious disease associated with reduced QOL, major complications and premature death.
• High prevalence of Male Hypogonadism
• Low Testosterone is associated with an ↑ CV Risk Profile
• And all-cause and CV mortality and CV events
• TRT to the normal range reduces body fat, waist circumference, BMI and increases lean mass
• TRT ↑ Insulin Sensitivity, ↓ HbA1c, ↓ Total and LDL cholesterol, ↓ TNFα & may improve fatty liver
• TRT improves mortality and may reduce CV events


