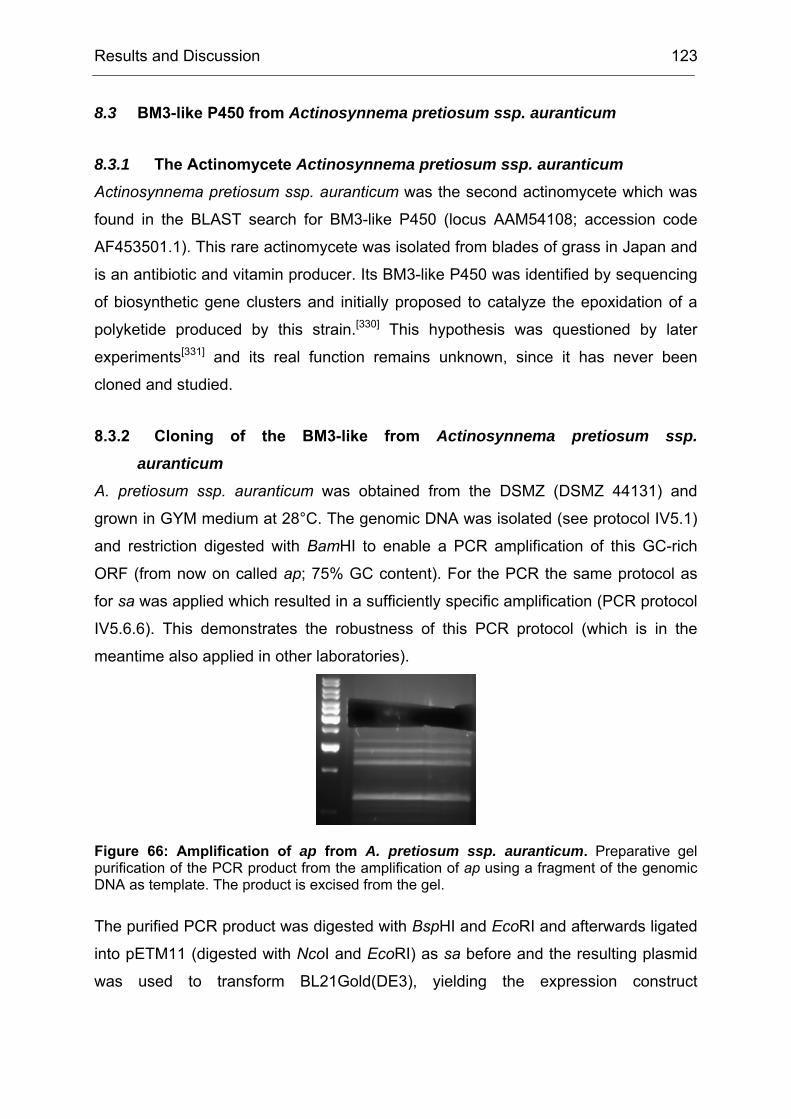
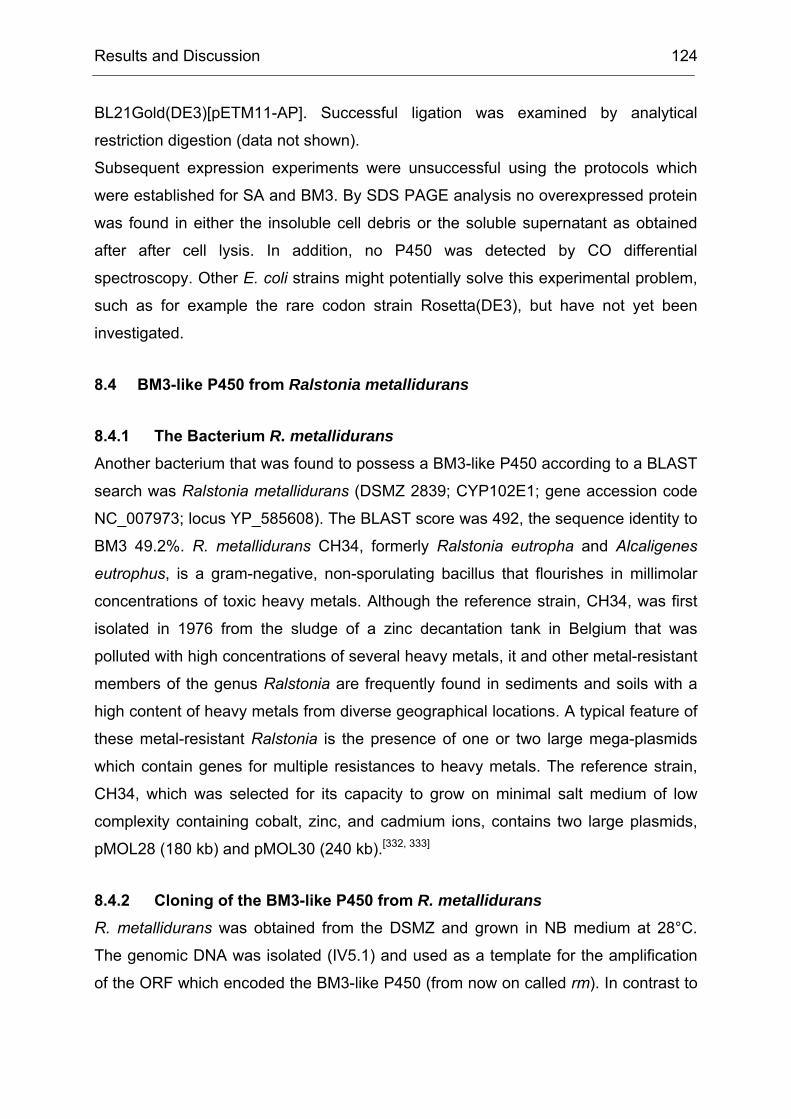
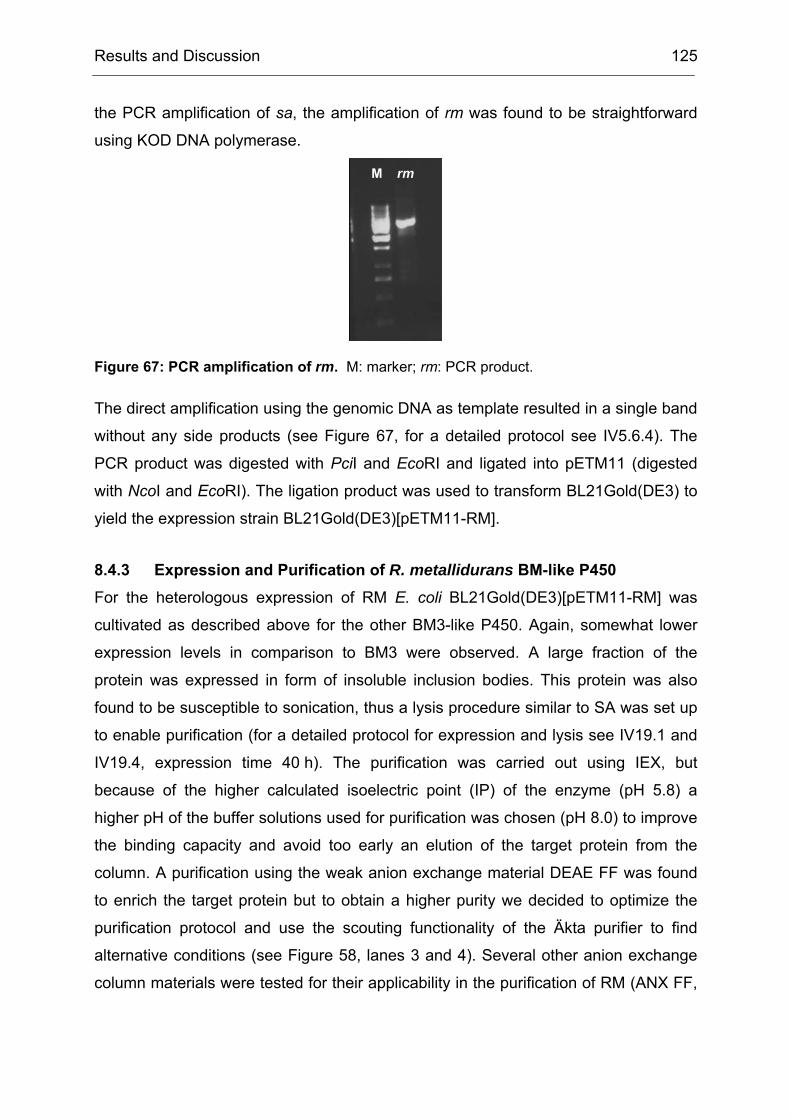
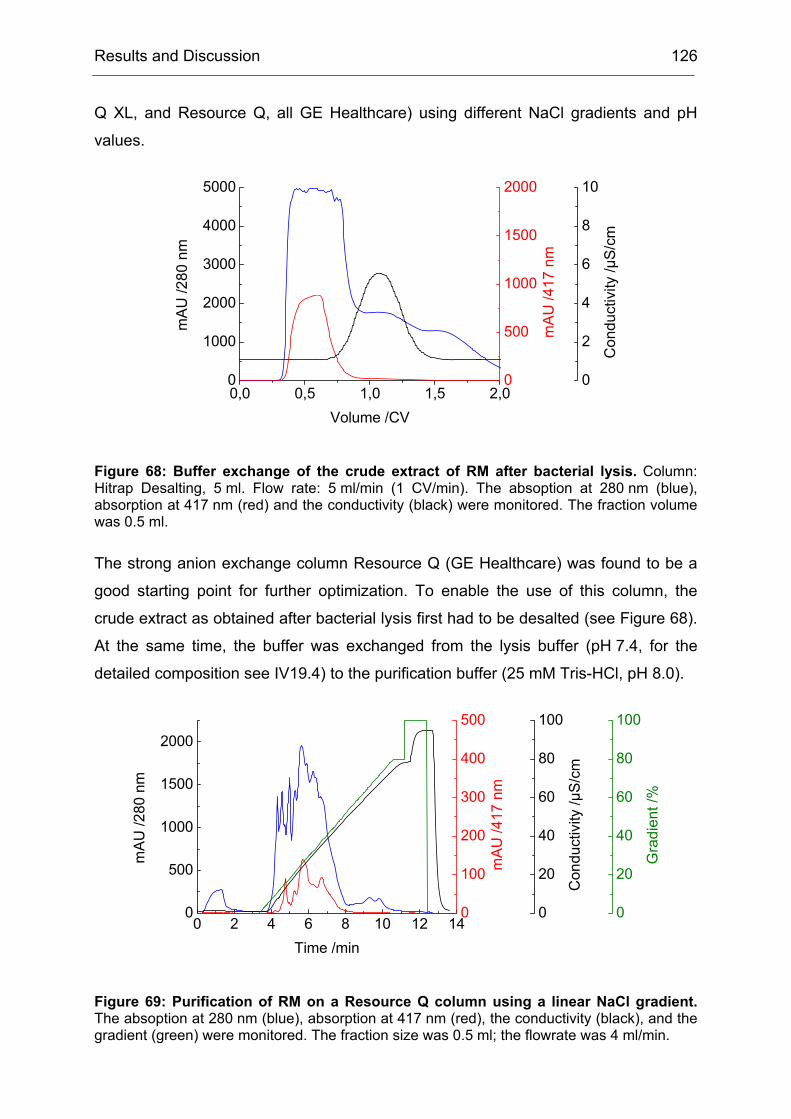
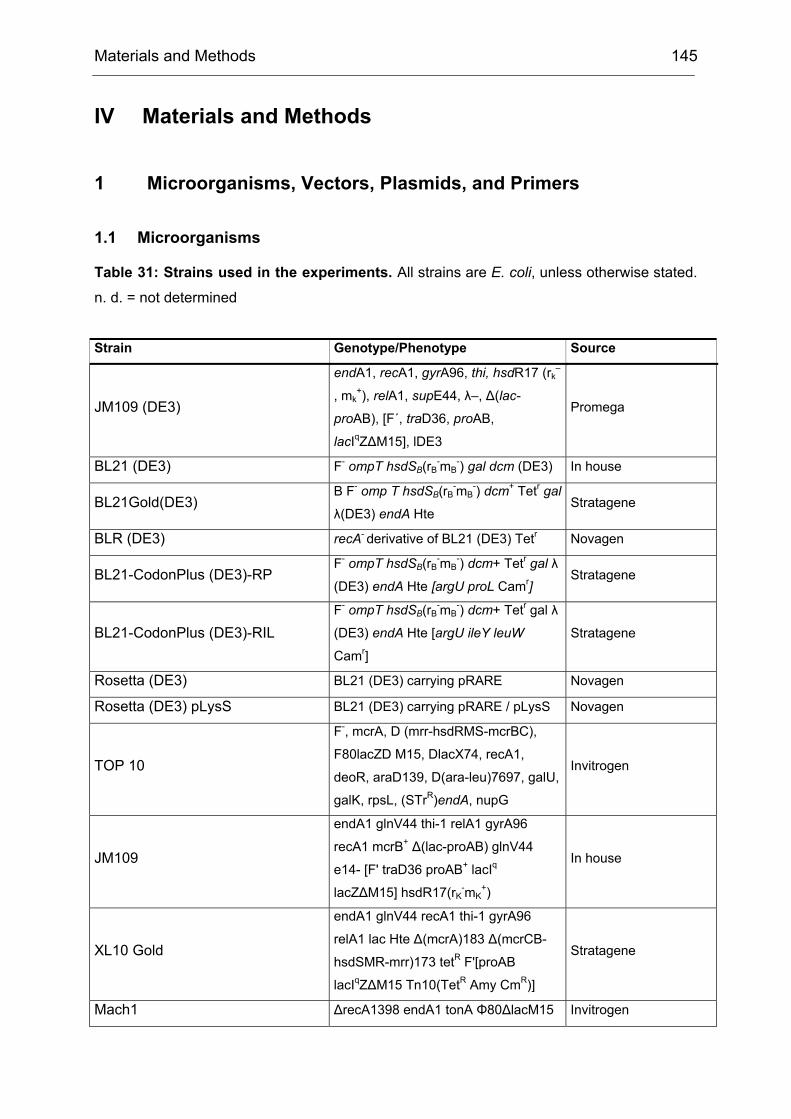
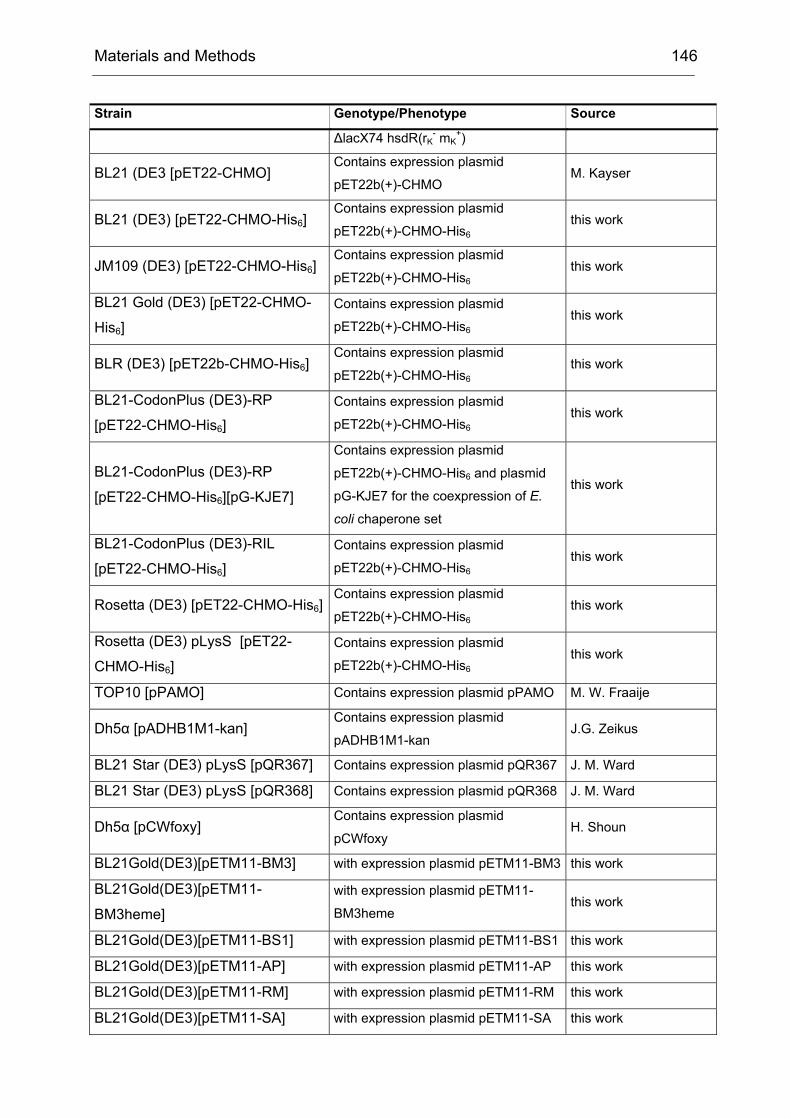
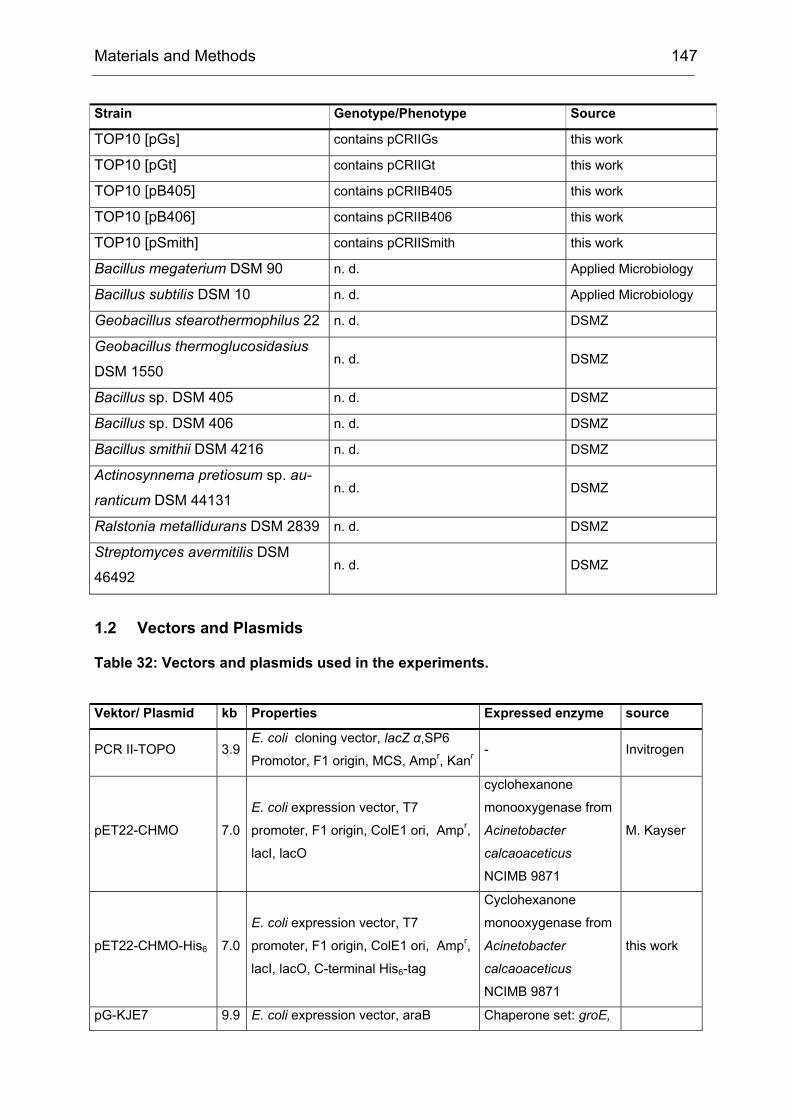
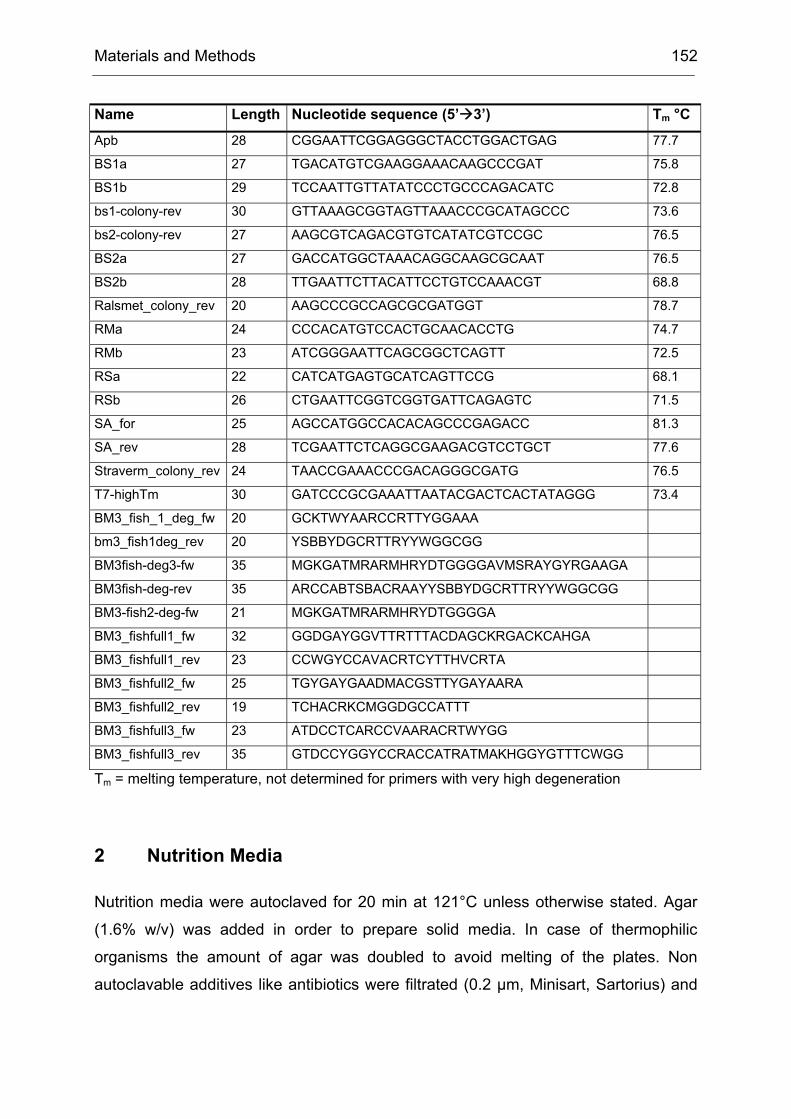
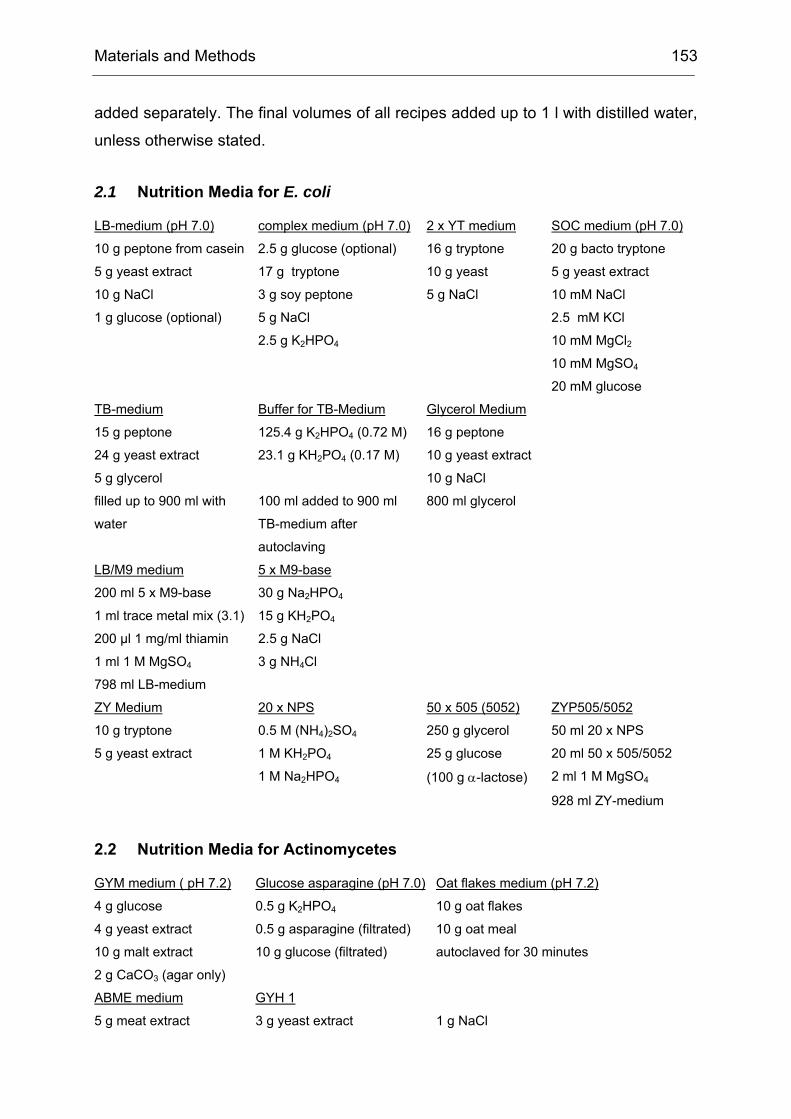
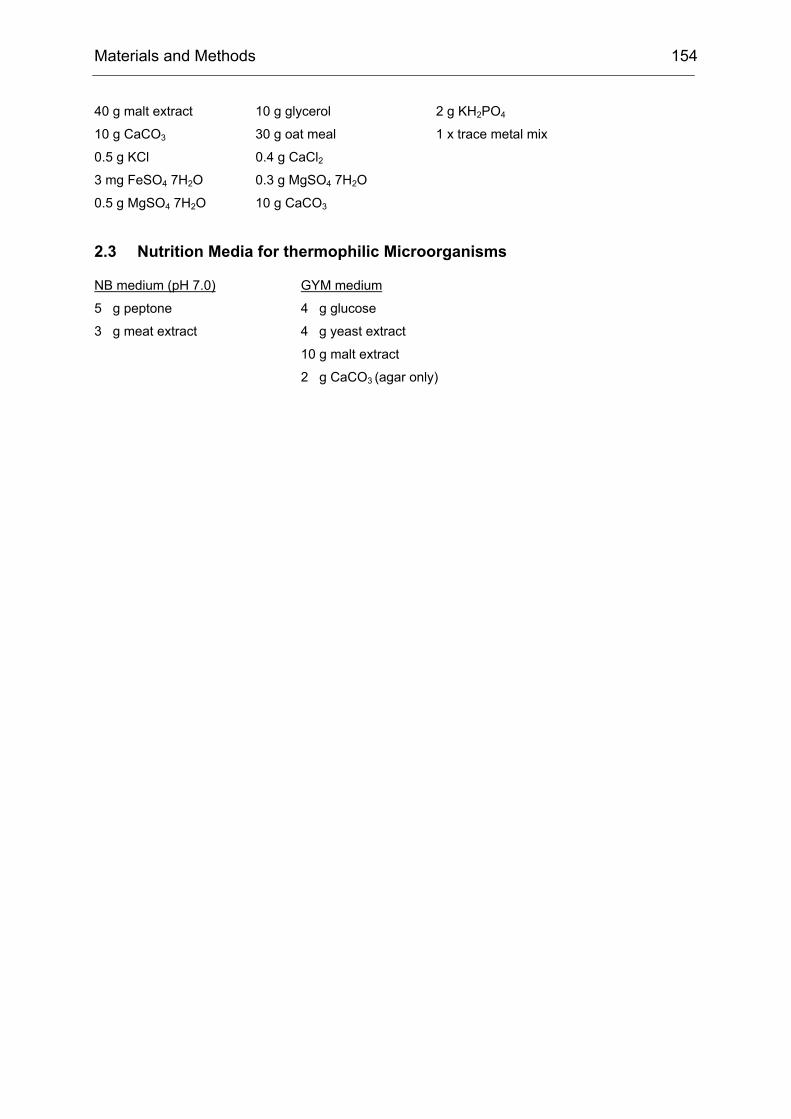
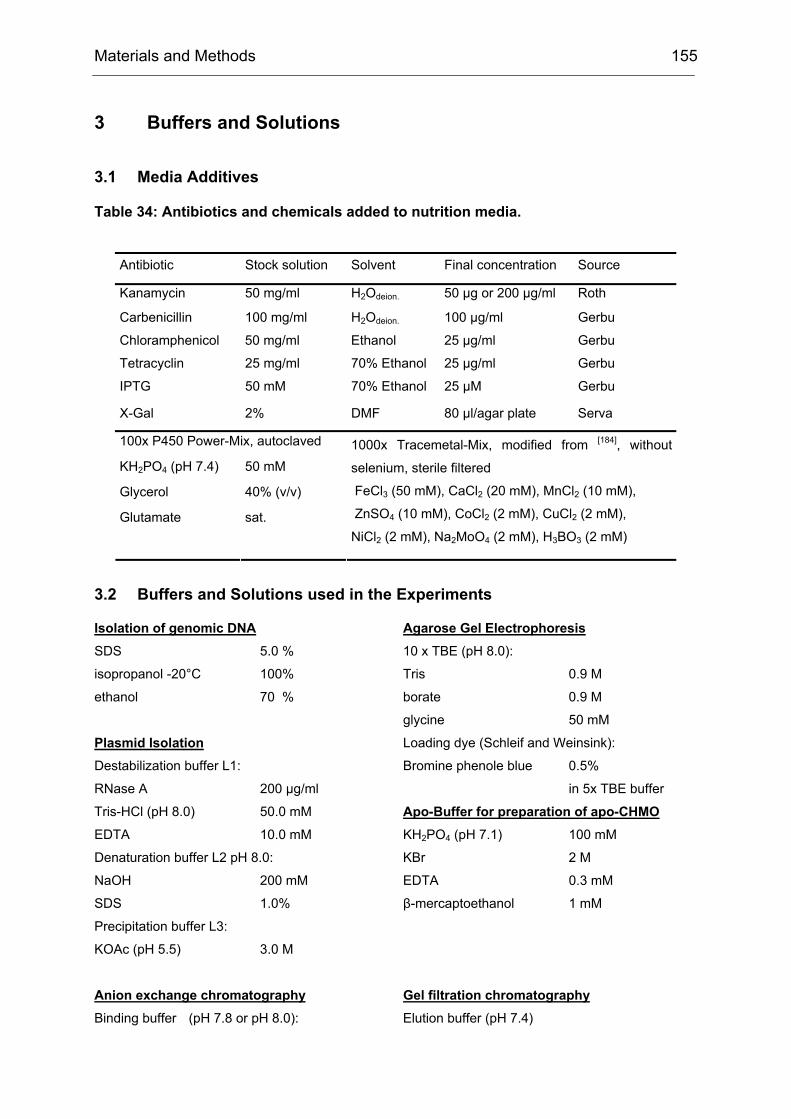
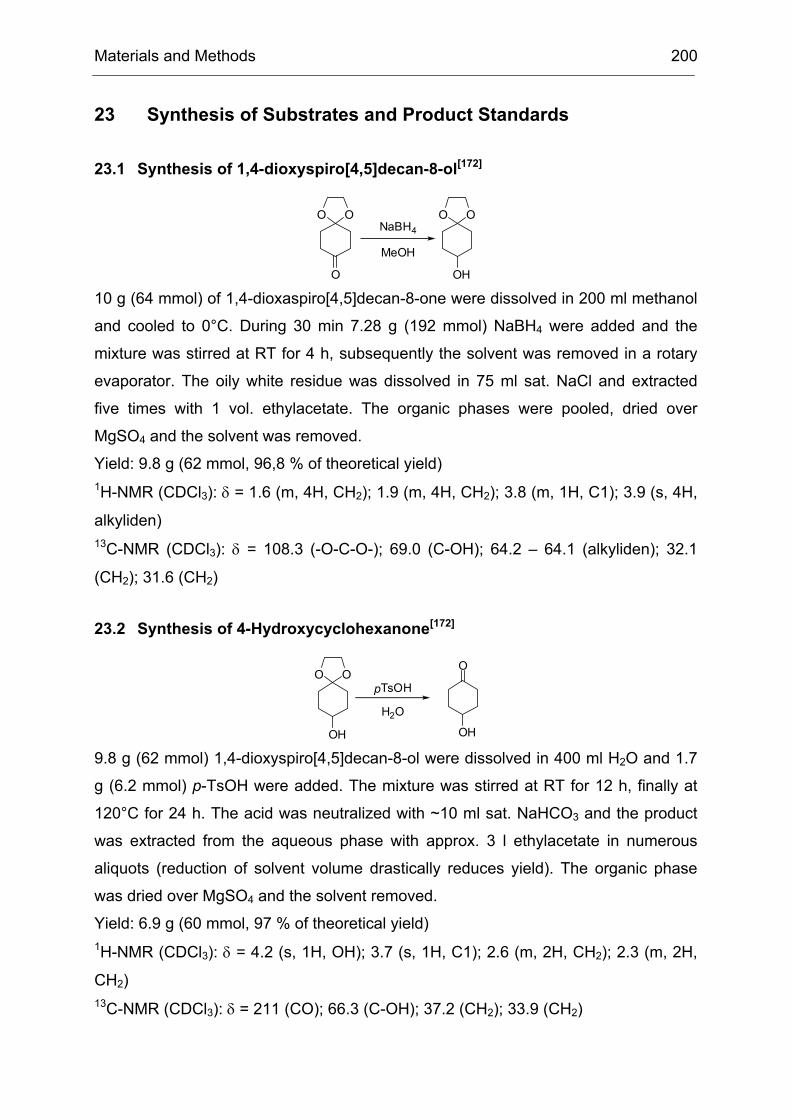
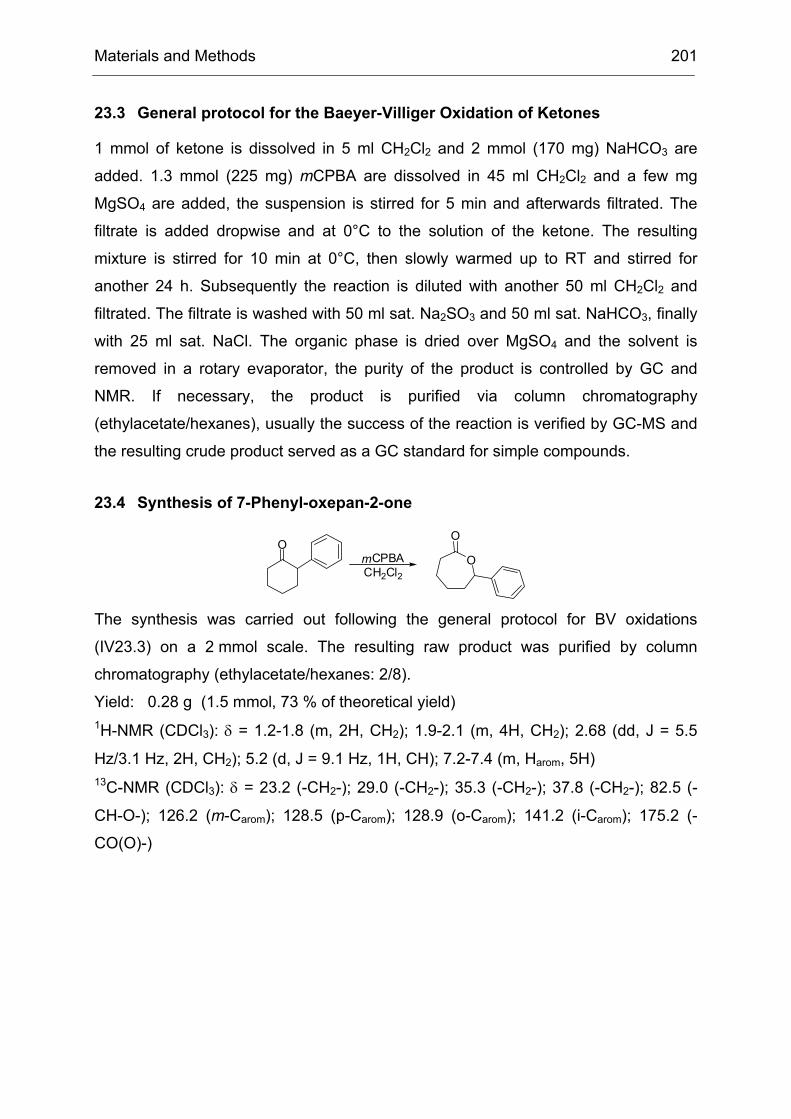
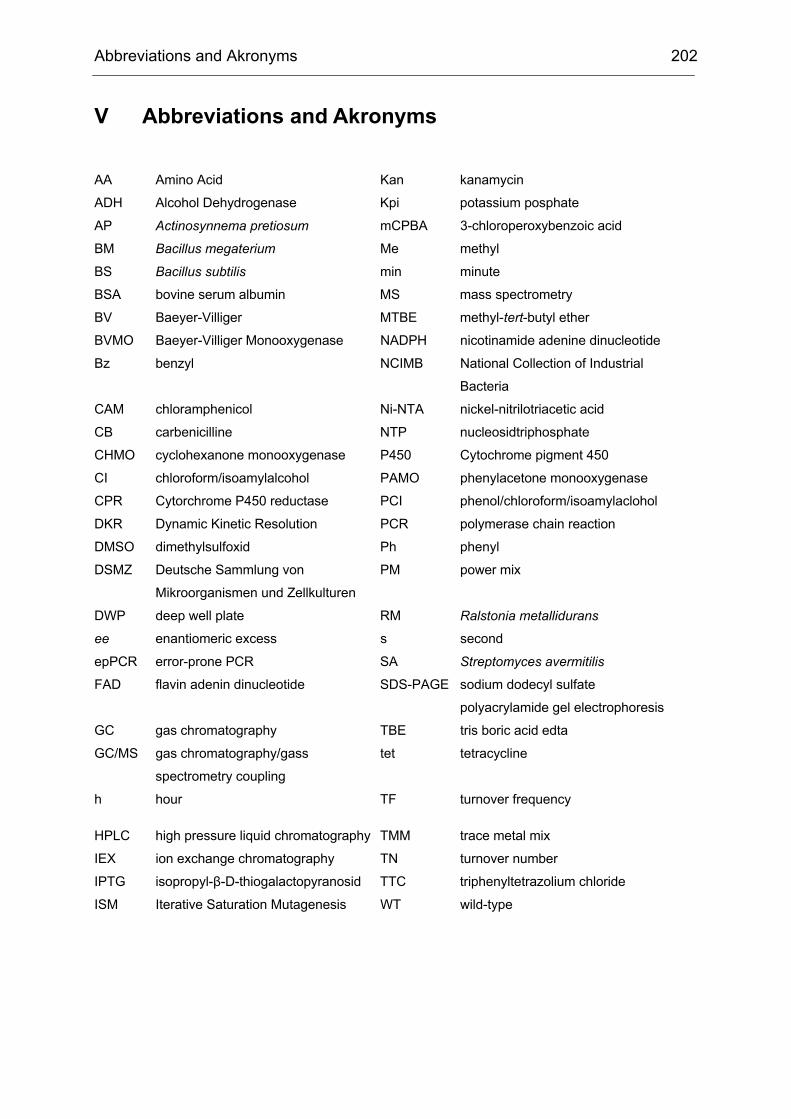
Monooxygenases Experiments to Turn a Class of Enzymes into a Toolbox for Biocatalysis Dissertation zur Erlangung des Grades eines Doktors der Naturwissenschaften der Fakultät für Chemie der Ruhr-Universität Bochum vorgelegt von Diplom-Chemiker Frank Schulz aus Oberhausen Mülheim an der Ruhr 2007
Transcript
Monooxygenases
Experiments to Turn a Class of Enzymes into a Toolbox for Biocatalysis
Dissertation zur Erlangung des Grades eines Doktors der Naturwissenschaften
der Fakultät für Chemie der Ruhr-Universität Bochum
vorgelegt von Diplom-Chemiker
Frank Schulz aus Oberhausen
Mülheim an der Ruhr
2007
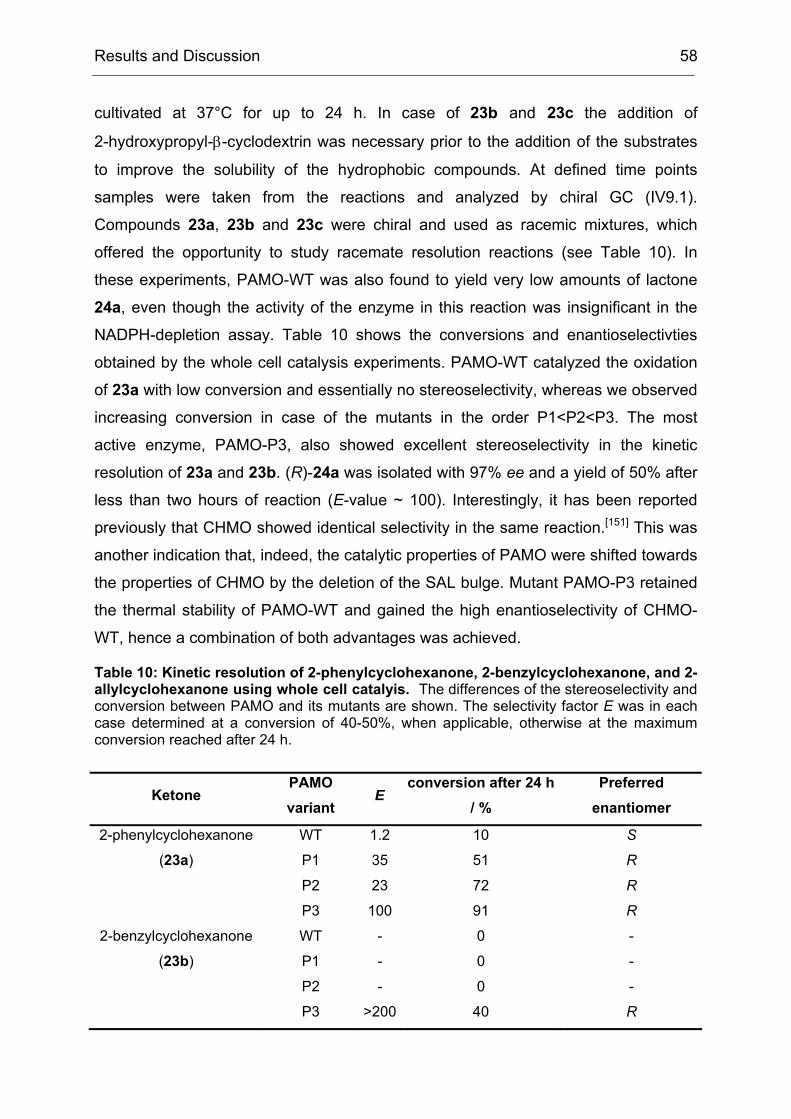
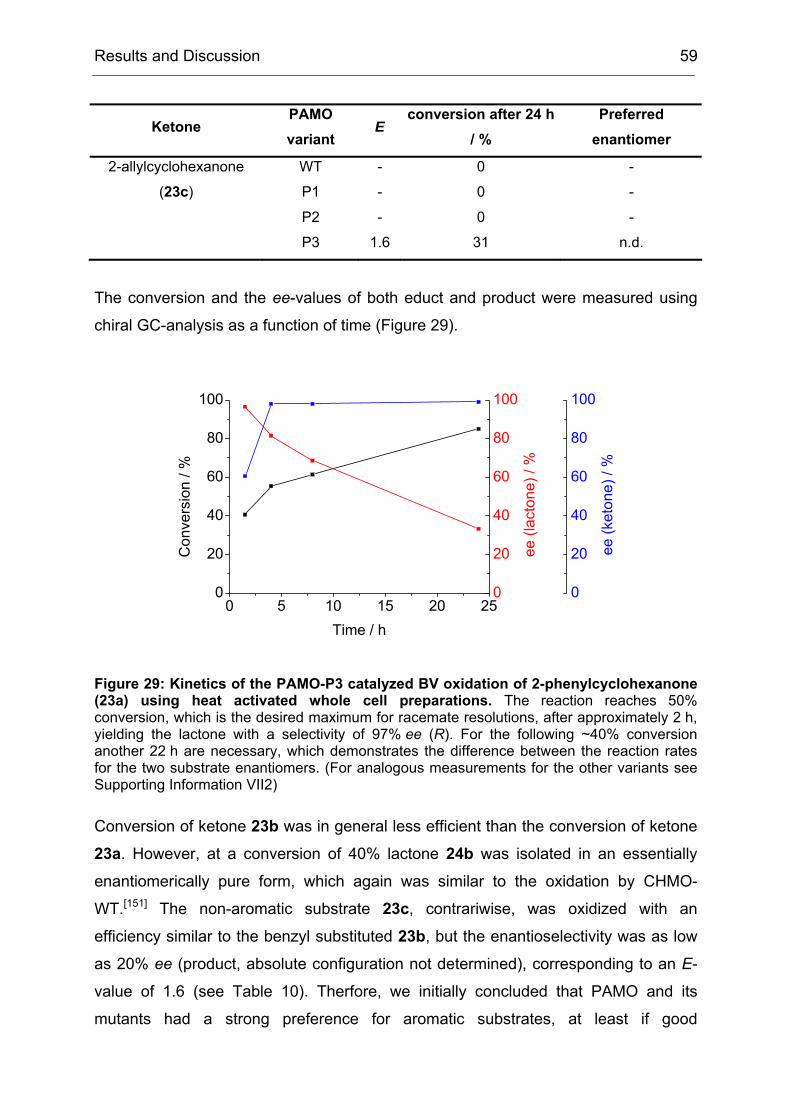
Referent: Professor Dr. M. T. Reetz
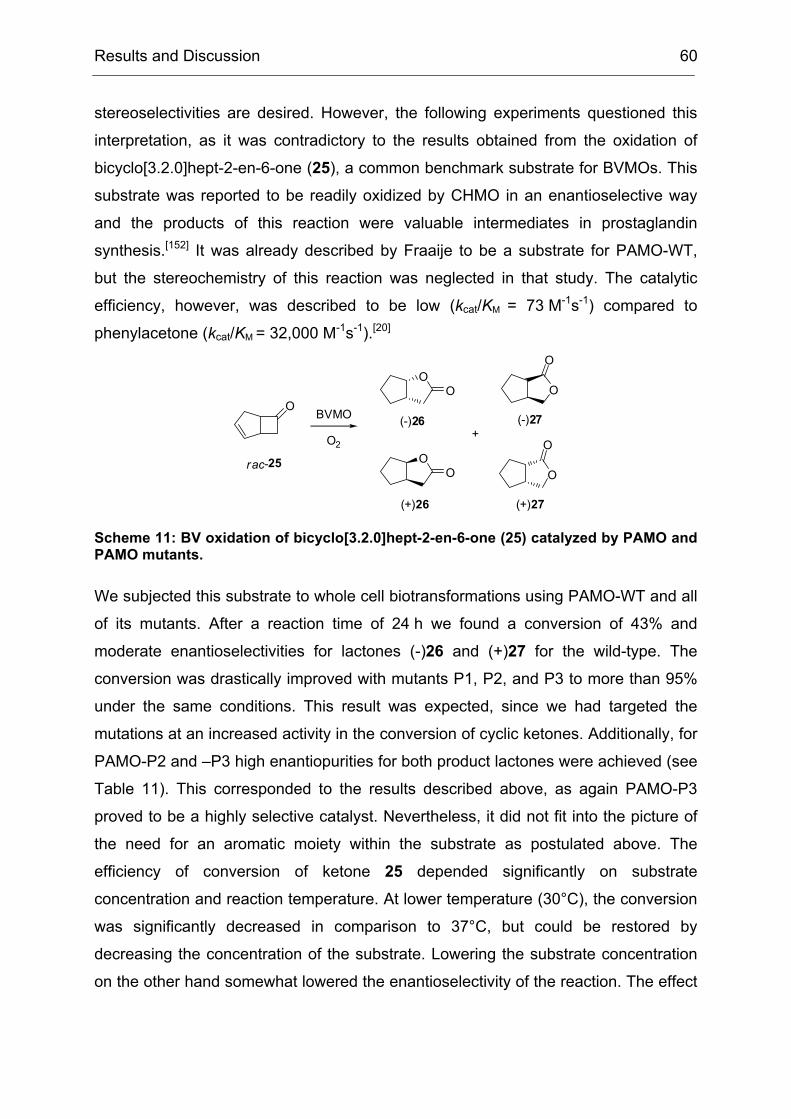
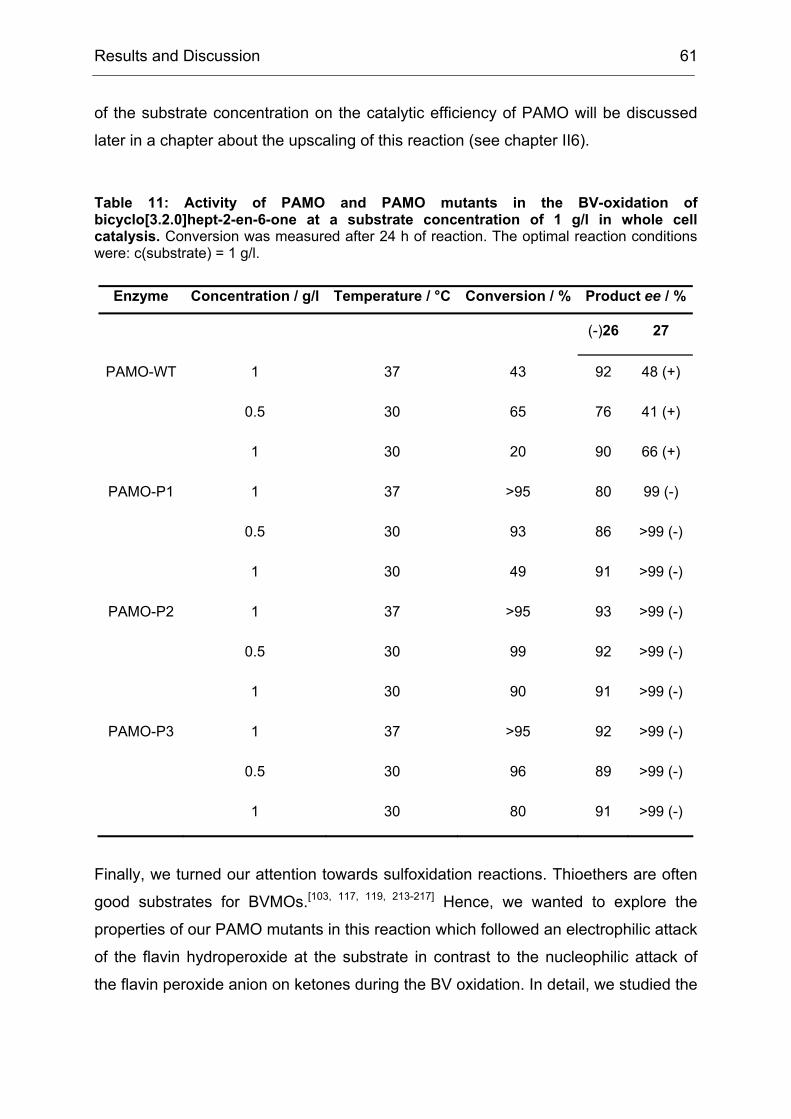
Korreferent: Professor Dr. M. Feigel
Tag der mündlichen Prüfung: 27.04.2007
Diese Arbeit wurde in der Zeit von Januar 2004 bis April 2007 unter der Leitung von
Professor Dr. M. T. Reetz am Max-Planck-Institut für Kohlenforschung in Mülheim an
der Ruhr angefertigt.
Meinem Doktorvater Herrn Professor Dr. M. T. Reetz danke ich sehr herzlich für die
interessante Aufgabenstellung und insbesondere für die gewährte Freiheit bei der
Bearbeitung der Themen. Darüber hinaus danke ich für die Gewährung jeder
erdenklichen Unterstützung bei fachlichen und darüber hinausgehenden Fragen.
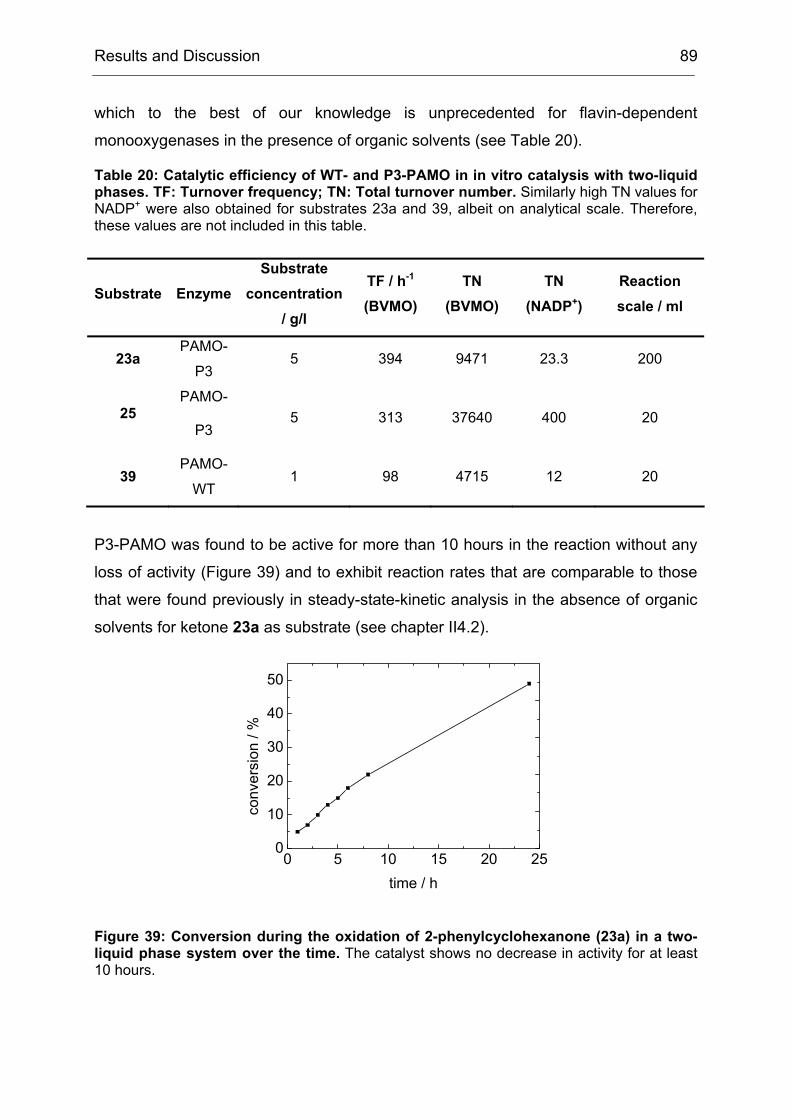
Für die Übernahme des Korreferats danke ich Herrn Professor Dr. M. Feigel sowie
Herrn Professor Dr. M. Muhler für die Abnahme der Nebenfachprüfung.
Ich danke Frau A. Rathofer und Frau E. Enk für ihre Hilfsbereitschaft in jedweder
Angelegenheit.
I want to thank all past and current members of the Reetz group for the creation of a
nice and stimulating atmosphere as well as for the coffee breaks with interesting
reviews about European politics and for having a beer or two in the evenings.
Especially, I want to thank a number of people without whom this thesis would not
have been possible.
I want to thank Toni Schneider and Birgit Brunner for the fruitful work on the CHMO
evolution project and for teaching me how directed evolution works in the laboratory.
I thank François Leca for contributing his chemical expertise to the PAMO projects
and in general for his excellent partnership.
Andreas Taglieber and Frank Hollmann were the optimal partners for the cofactor
regeneration project: Thanks a lot.
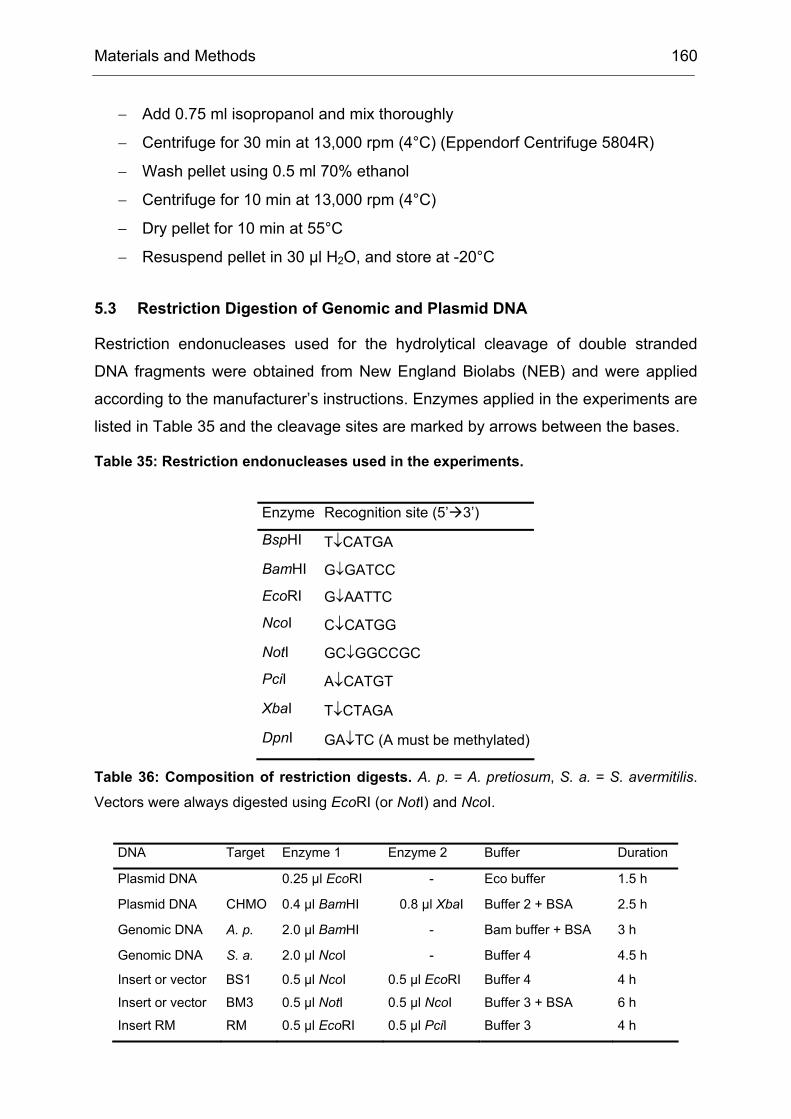
I want to thank Sabine Bastian for her outstanding teamwork in the P450 project.
I highly acknowledge the efforts of my “teachers” in the laboratory:
Andreas Vogel, the protein master
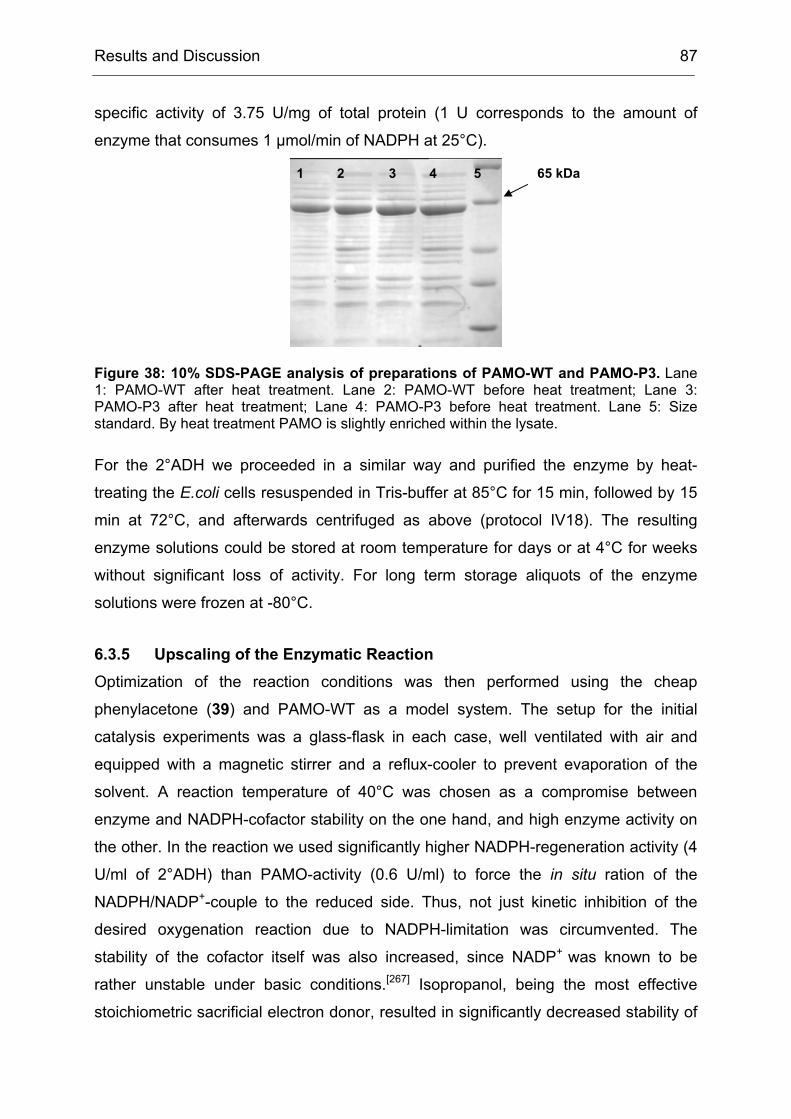
Frank Hollmann, the biocatalysis master
Sabine Bastian, the bacteria master
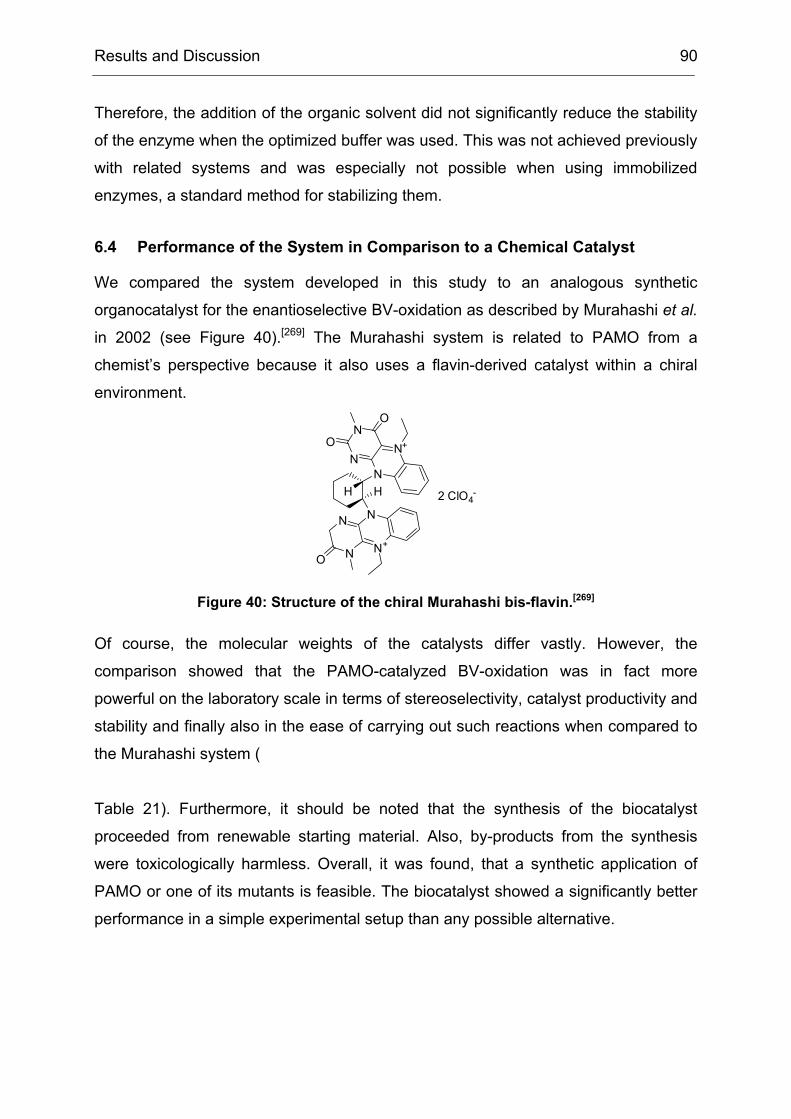
Ich möchte mich sehr herzlich bei den analytischen Abteilungen des Instituts für die
schnellen und akkuraten Messungen bedanken, insbesondere bei Sylvia Ruthe,
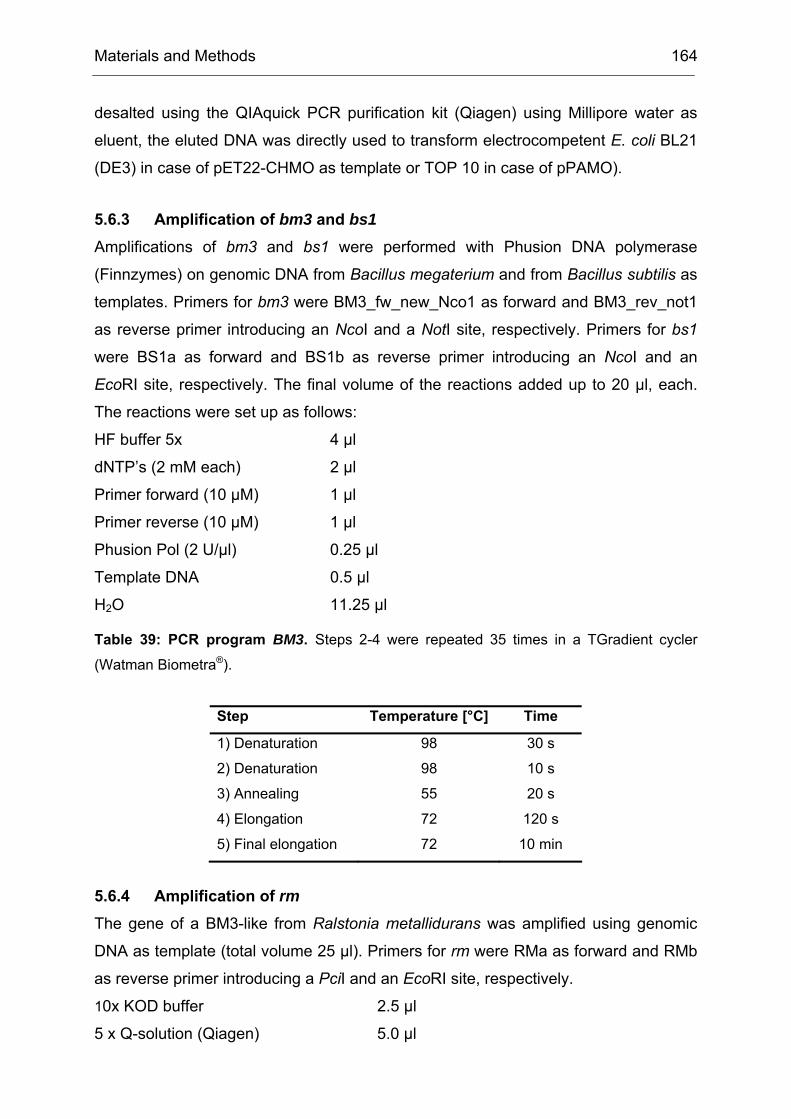
Frank Kohler, Heike Hinrichs und Alfed Deege.
Frau R. Barabasch und Herrn Dr. W. J. Richter danke ich für die Unterstützung bei
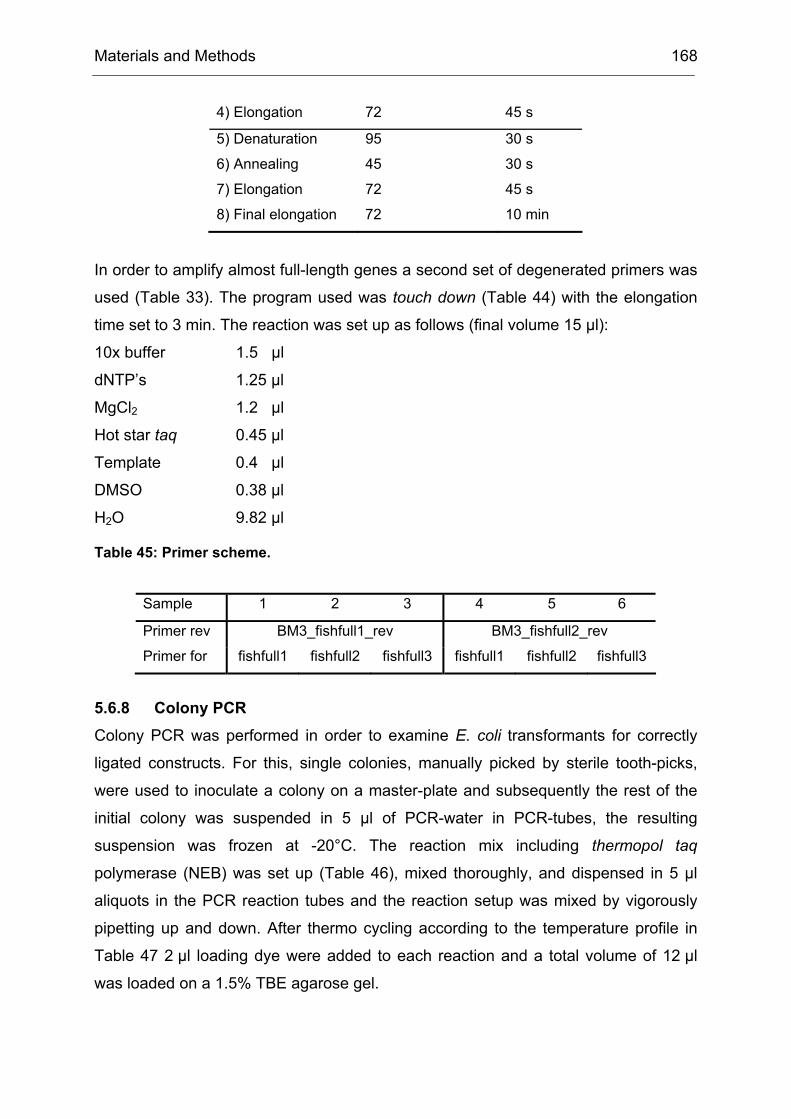
der Literaturbeschaffung.
For proofreading of this thesis I want to thank Sabine Bastian, Frank Hollmann,
Andreas Taglieber, Host Höbenreich, Jullien Drone, John Podtetenieff, and Felipe
Zilly.
Ein besonderer Dank gilt Katrin, der tollsten Frau von allen, sowie meinen Eltern und
meiner Großmutter, die mir mein Studium und damit auch diese Arbeit ermöglicht
haben.
MISPWOSO
Maximegalon Institute for Slowly and Painfully Working Out the Surprisingly Obvious
Douglas Adams
Teile der vorliegenden Arbeit wurden veröffentlicht:
M. T. Reetz, B. Brunner, T. Schneider, F. Schulz, C. M. Clouthier, M. M. Kayser,
Directed Evolution as a Method to Create Enantioselective Cyclohexanone
Monooxygenases for Catalysis in Baeyer-Villiger Reactions
Angew. Chem. Int. Ed. 2004, 43, 31, 4075-4078
M. Bocola, F. Schulz, F. Leca, A. Vogel, M. W. Fraaije, M. T. Reetz, Converting
Phenylacetone Monooxygenase into Phenylcyclohexanone Monooxygenase by
Rational Design: Towards Practical Baeyer-Villiger Monooxygenases
Adv. Synth. Catal. 2005, 347, 7-8, 979 –986
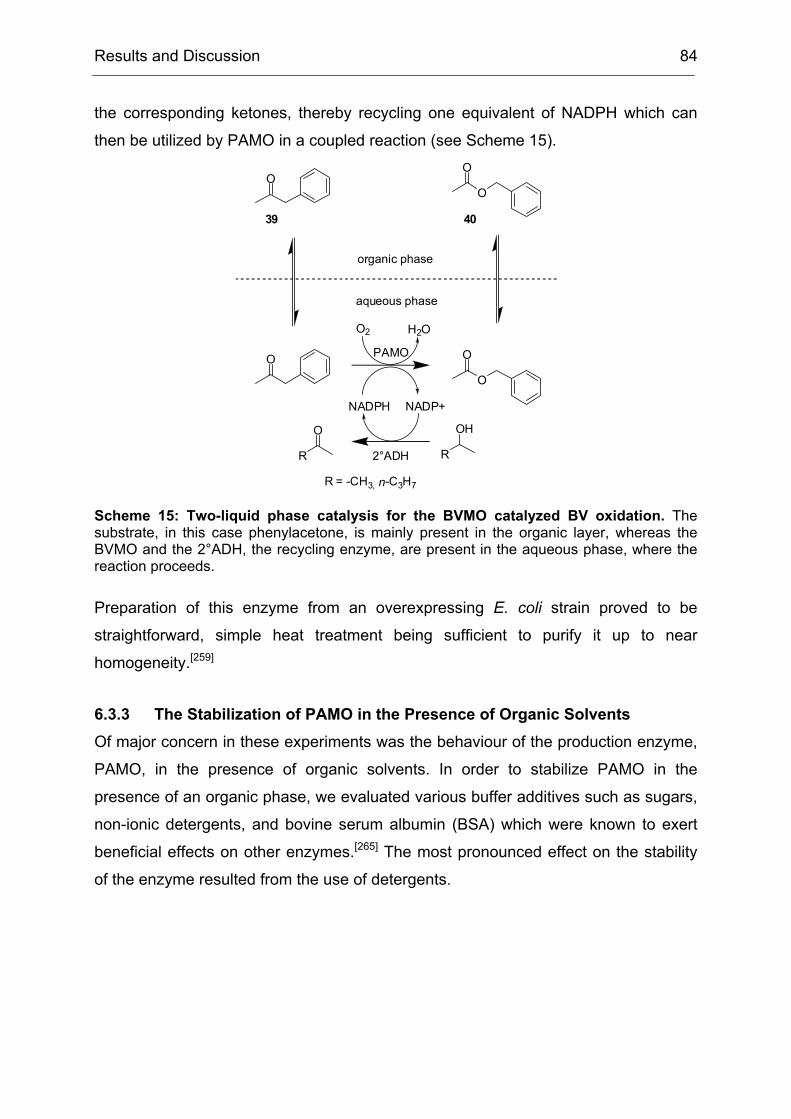
F. Schulz, F. Leca, F. Hollmann, M. T. Reetz, Towards practical Baeyer-Villiger-
Monooxygenases: Applying a thermostable enzyme in the gram-scale synthesis of
optically active lactones in a two-liquid-phase system
Beilstein J. Org. Chem., 2005, 1:10
M. D. Mihovilovic, F. Rudroff, A. Winninger, T. Schneider, F. Schulz, M. T. Reetz,
Microbial Baeyer-Villiger Oxidation: Stereopreference and Substrate Acceptance of
Cyclohexanone Monooxygenase Mutants Prepared by Directed Evolution
Org. Lett. 2006, 8, 6, 1221-1224
F. Hollmann, A. Taglieber, F. Schulz, M. T. Reetz, A Light-Driven Stereoselective
Biocatalytic Oxidation
Angew. Chem. Int. Ed. 2007, in press
Introduction 8
Table of Contents
I INTRODUCTION................................................................................................. 1
1 Biocatalysis - A Rich Portfolio of Synthetic Methods .................................... 1
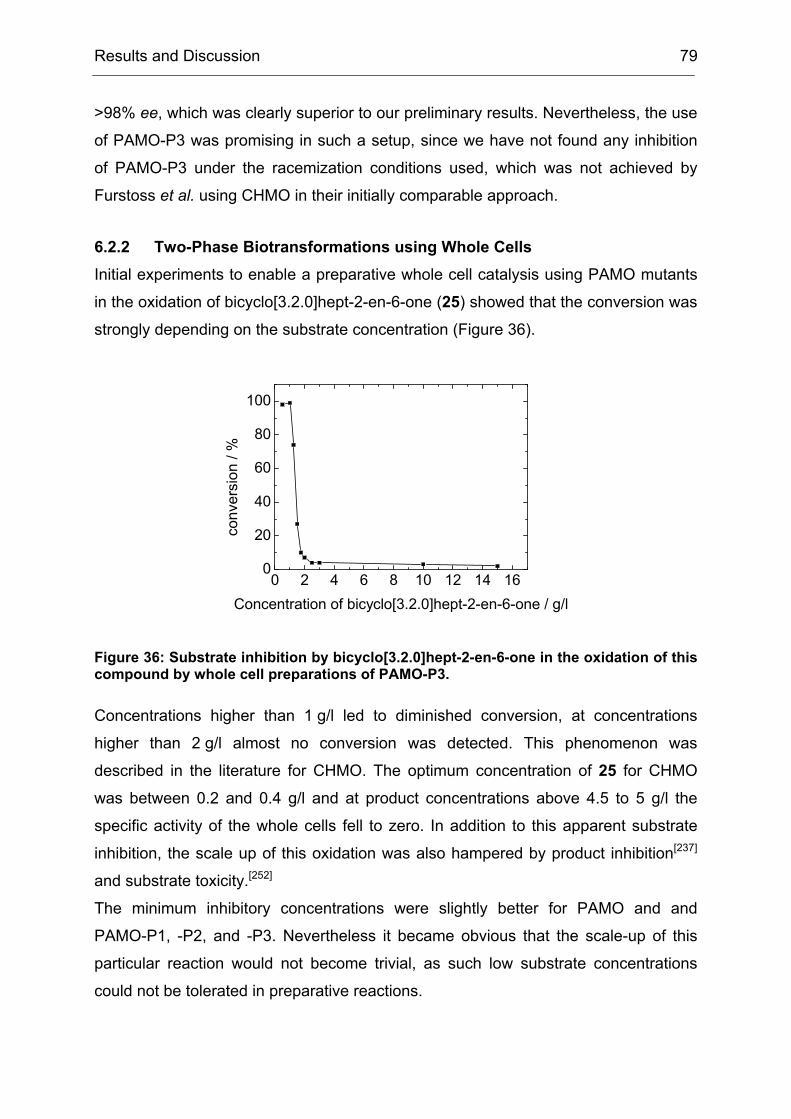
II RESULTS AND DISCUSSION.......................................................................... 20
1 Directed Evolution of Cyclohexanone Monooxygenase towards high Enantioselectivity ................................................................................................... 21
1.1 Introduction – CHMO as a Target Enzyme for Directed Evolution ............. 21
1.2 Generation and Screening of epPCR libraries ........................................... 23
1.3 Saturation Mutagenesis of selected Hot spots – How to Draw Conclusions
from Random Mutagenesis ................................................................................... 26
1.4 Limitations of Directed Evolution of CHMO ................................................ 28
1.5 Is “You Get What You Screen For” a general rule?.................................... 29
2 High-Level Expression and Purification of CHMO........................................ 34
2.1 High-Level Expression of CHMO................................................................ 35
2.2 Purification of CHMO.................................................................................. 40
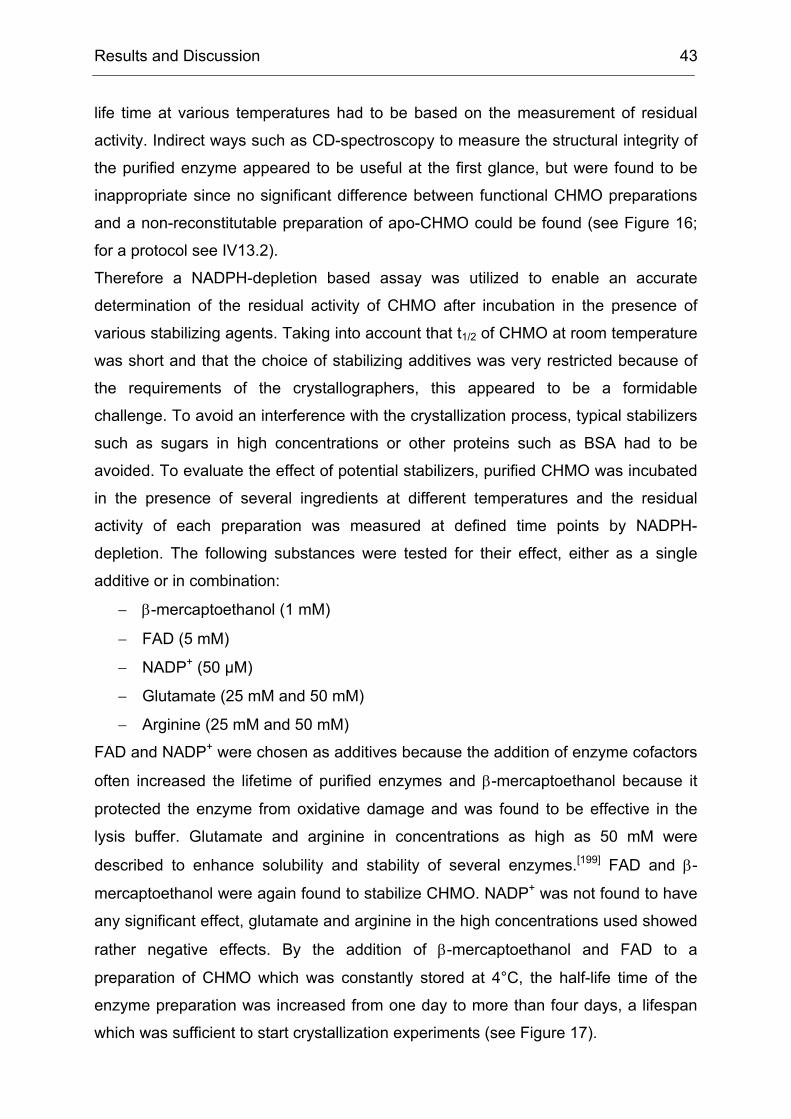
2.3 Stabilization of Purified CHMO to Enable Crystallization Experiments....... 42
Introduction 9
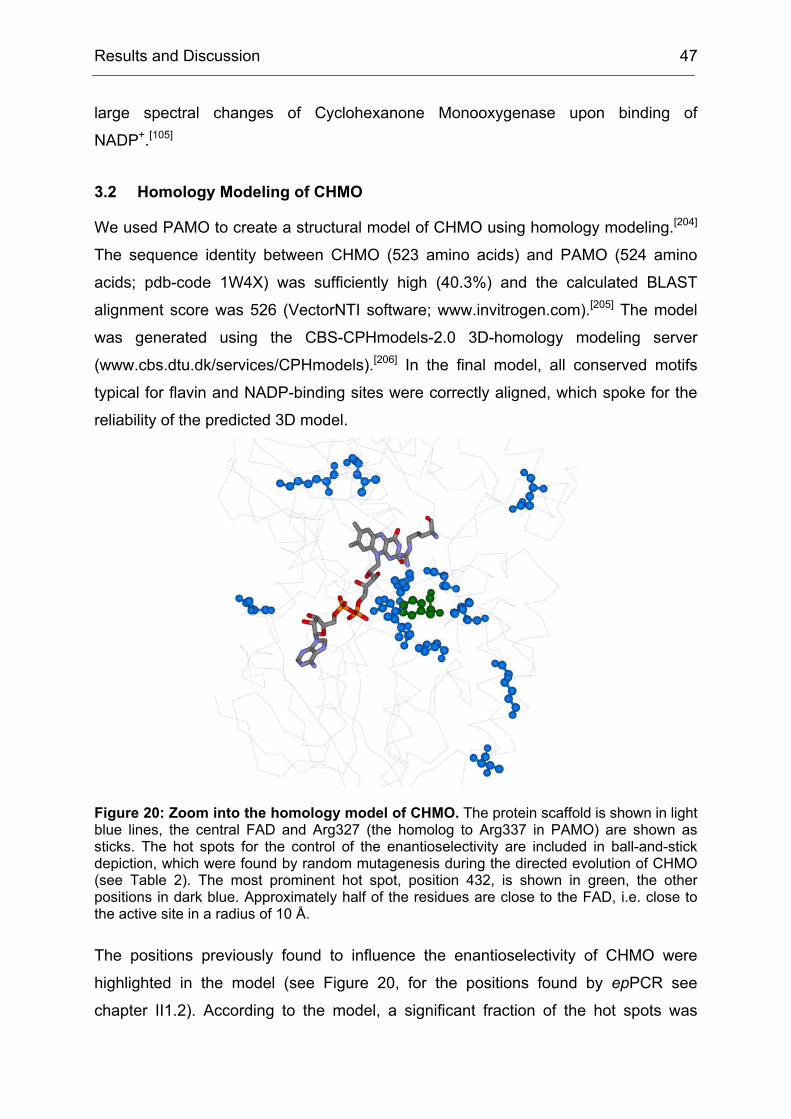
3 A Homology Model of CHMO.......................................................................... 44
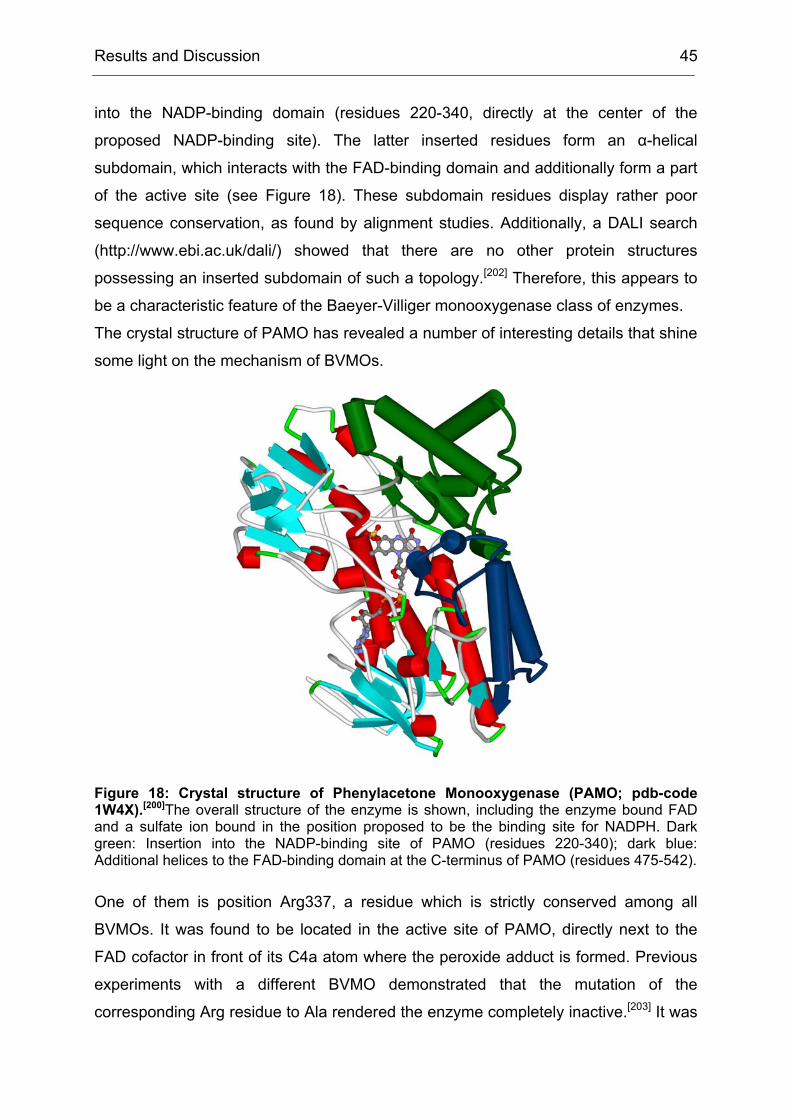
3.1 Phenylacetone Monooxygenase – The First Structure of a BVMO ............ 44
3.2 Homology Modeling of CHMO.................................................................... 47
4 Rational Design of Phenylacetone Monooxygenase towards a Broadened Substrate Scope ..................................................................................................... 49
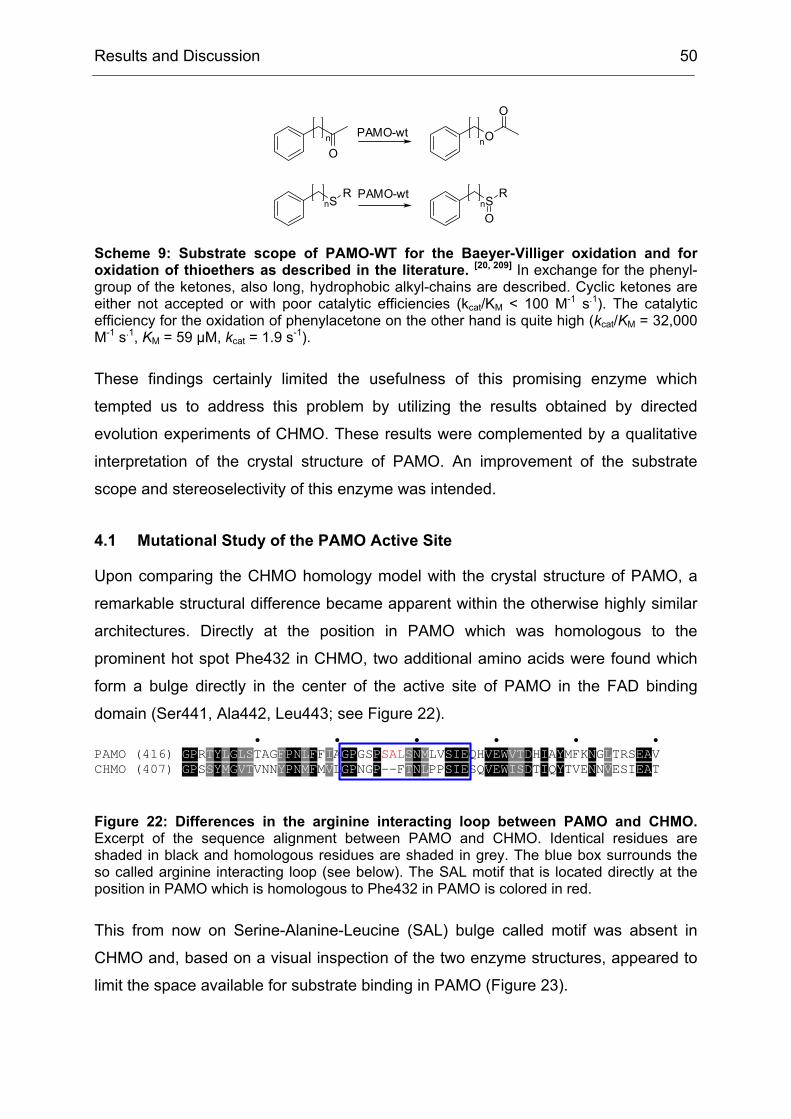
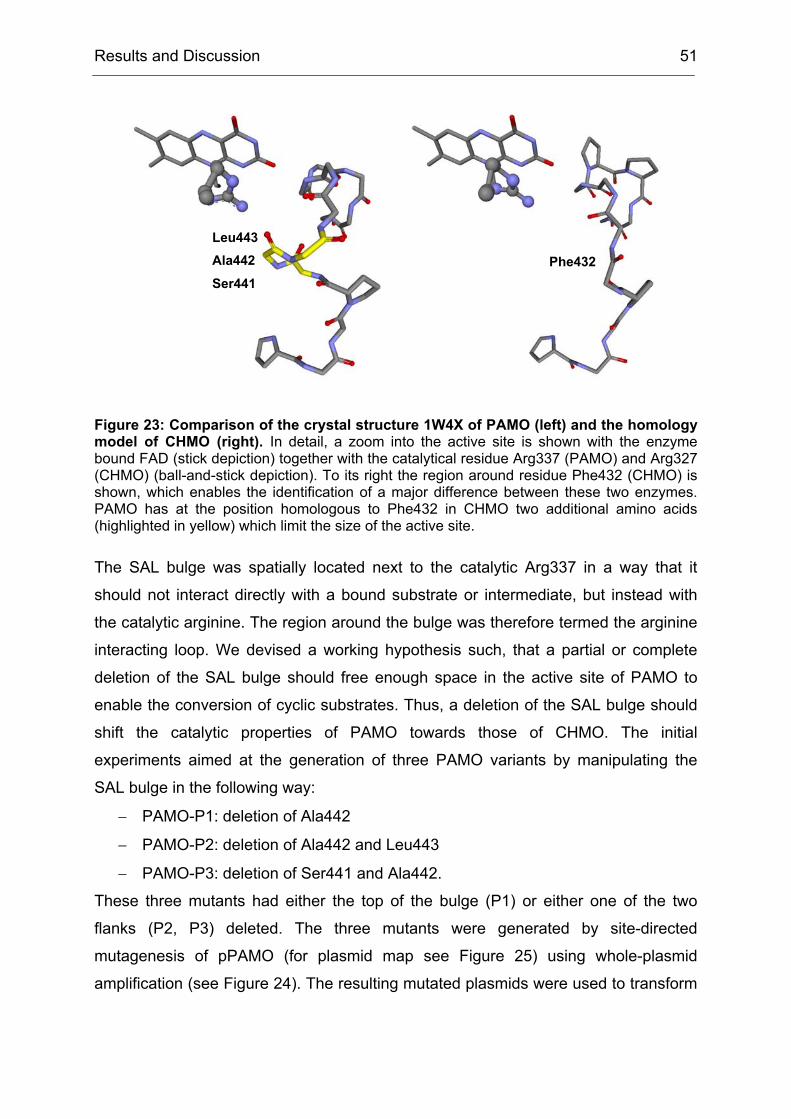
4.1 Mutational Study of the PAMO Active Site ................................................. 50
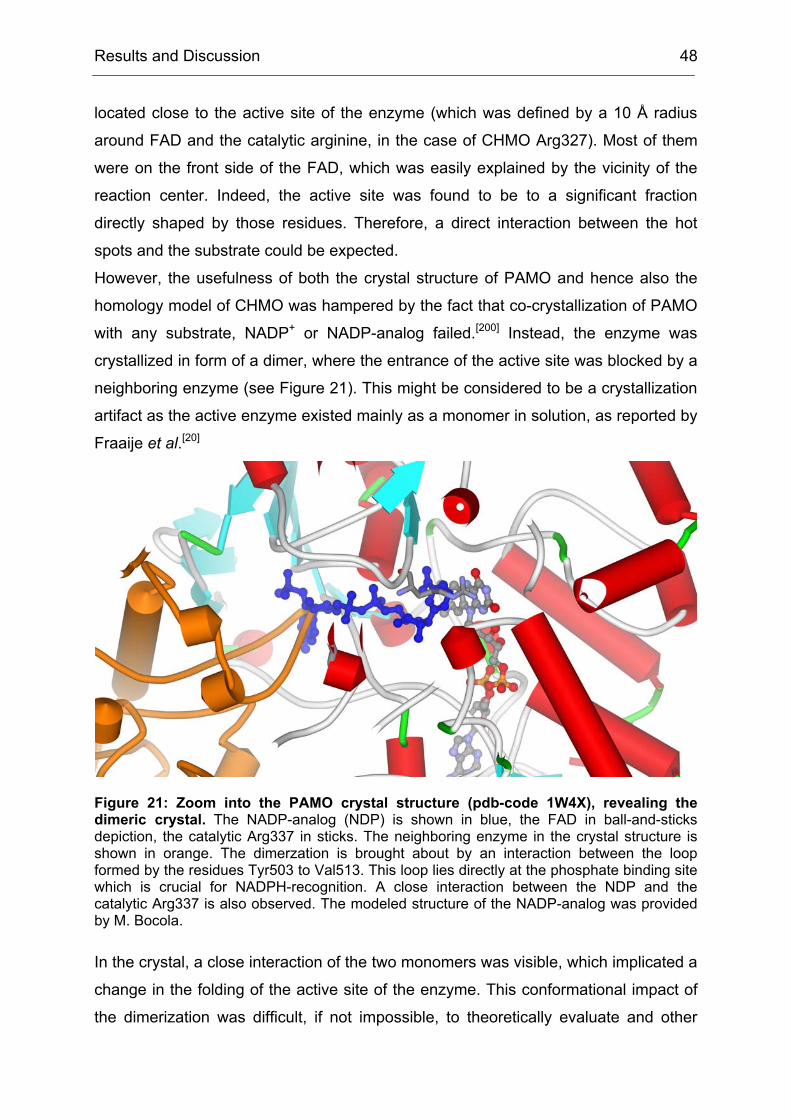
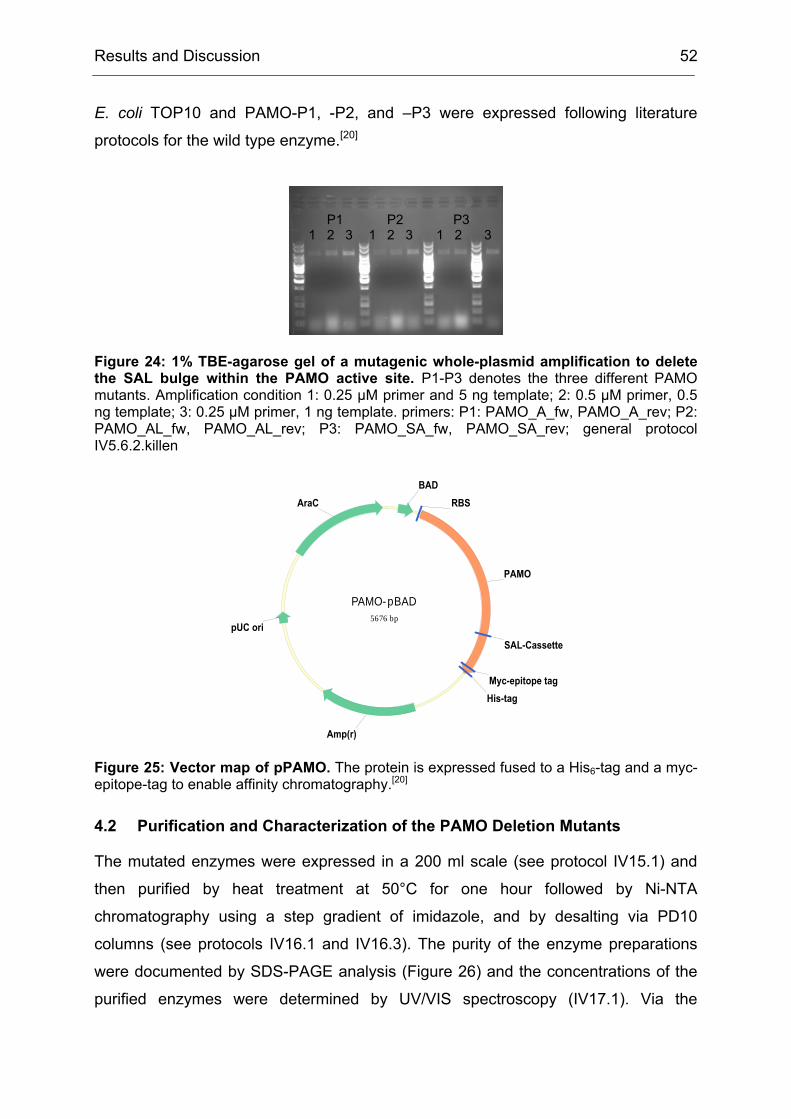
4.2 Purification and Characterization of the PAMO Deletion Mutants .............. 52
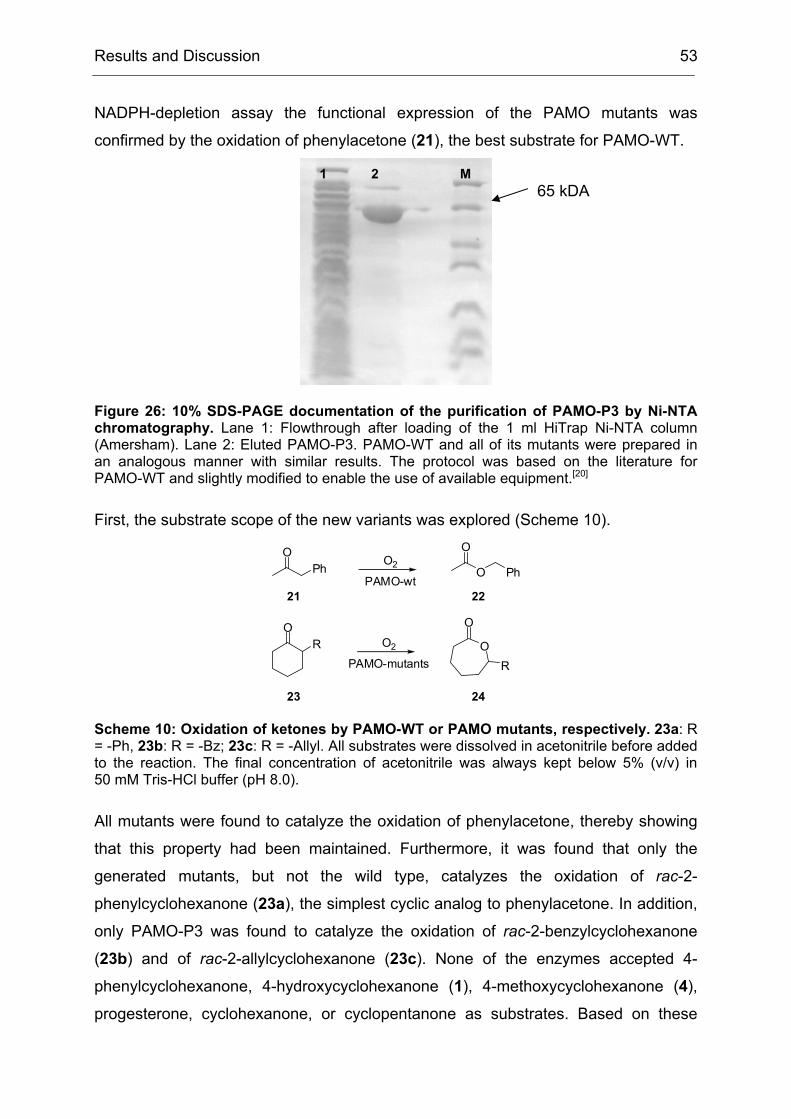
4.3 Whole Cell Biotransformations of Ketones and Thioethers using PAMO
Mutants on an Analytical Scale ............................................................................. 57
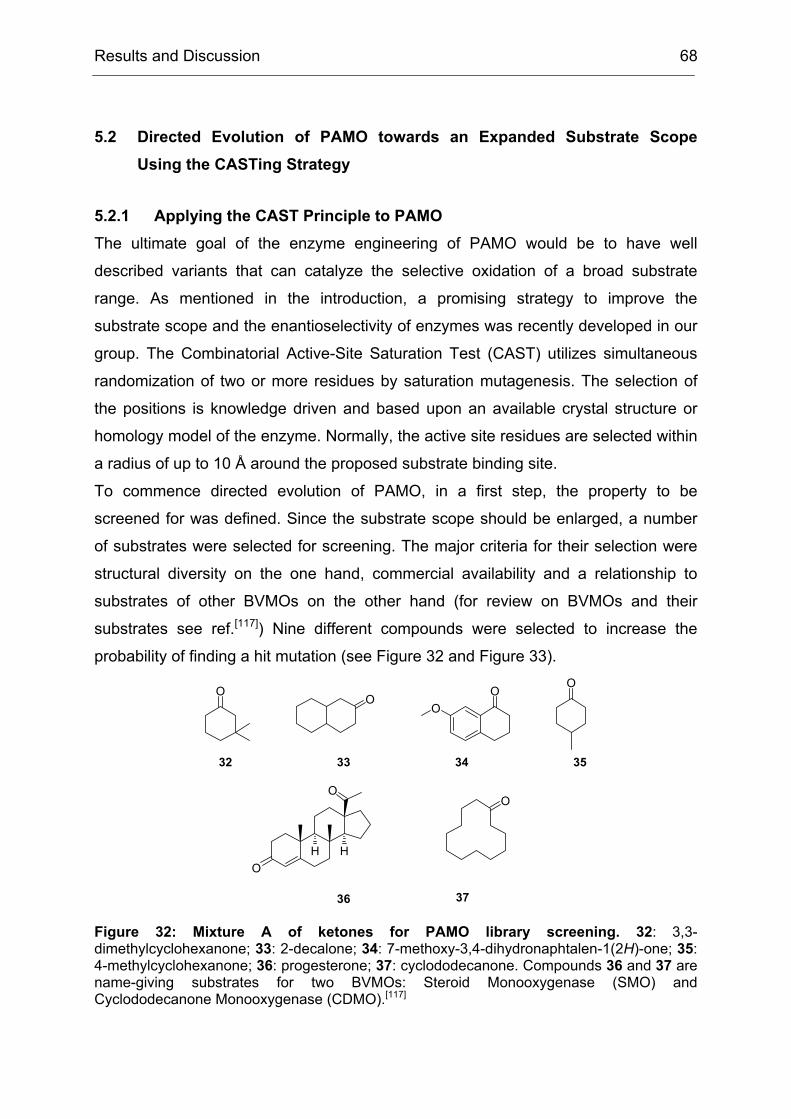
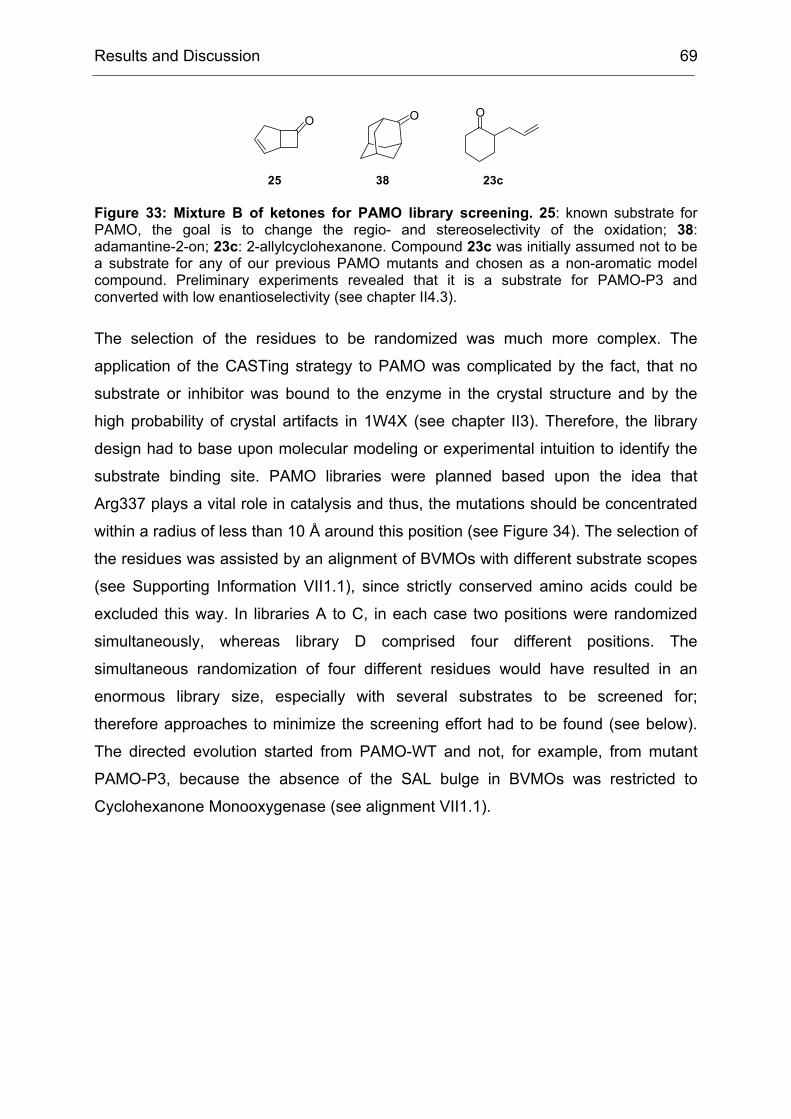
5 Experiments towards the Directed Evolution of PAMO ............................... 65
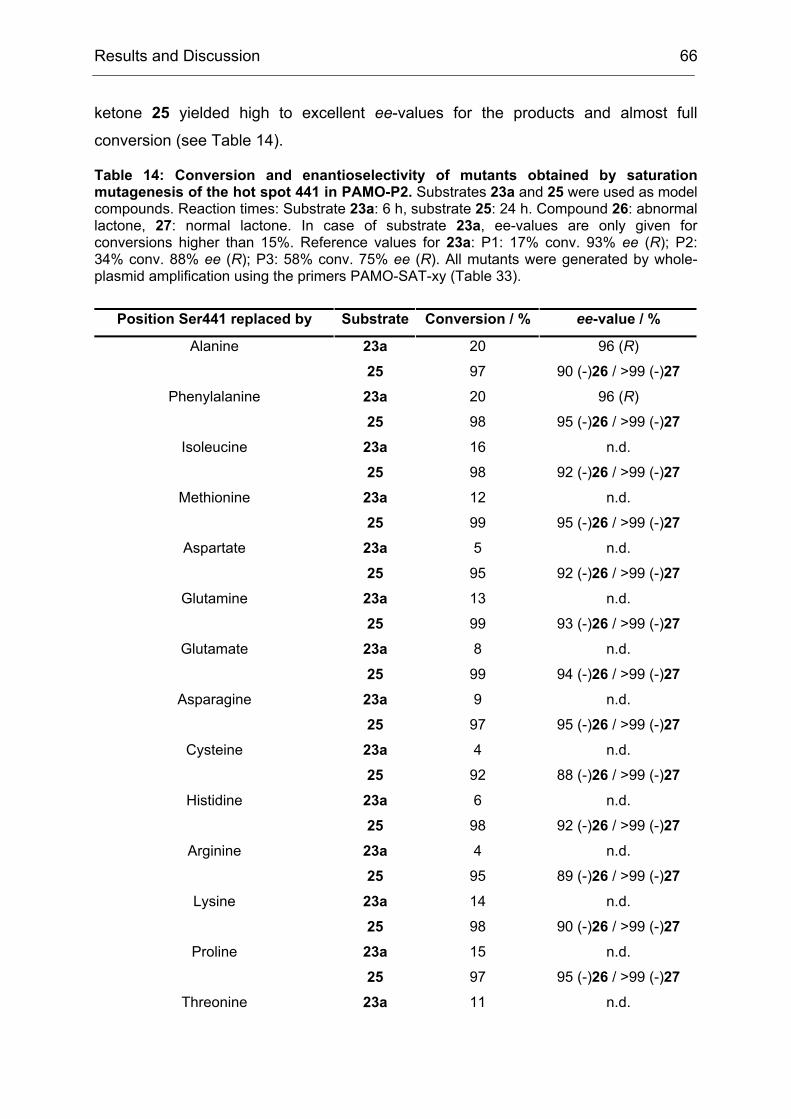
5.1 The Saturation Mutagenesis of a Known Hot Spot Yields Implications for
5.2 Directed Evolution of PAMO towards an Expanded Substrate Scope Using
the CASTing Strategy ........................................................................................... 68
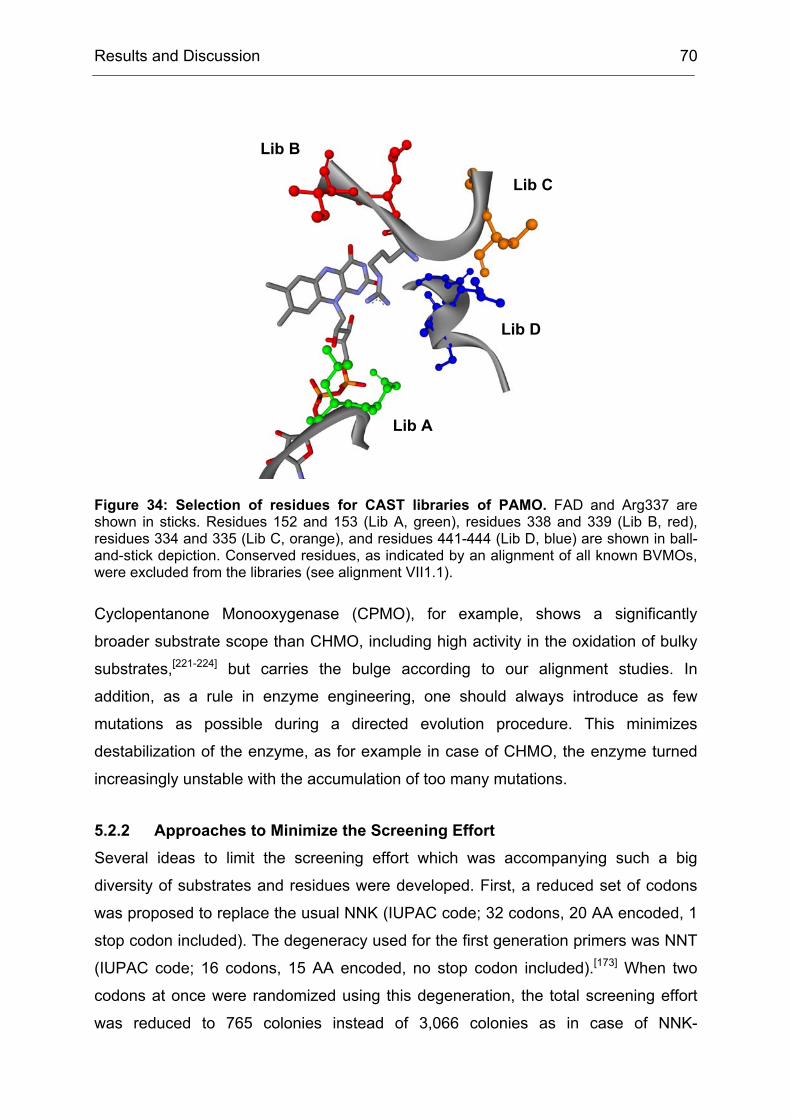
5.2.1 Applying the CAST Principle to PAMO................................................ 68
5.2.2 Approaches to Minimize the Screening Effort ..................................... 70
5.2.3 An Individual Degeneration for each Codon in a CASTing Library...... 73
5.2.4 Conclusions and Implications for Directed Evolution Experiments...... 74
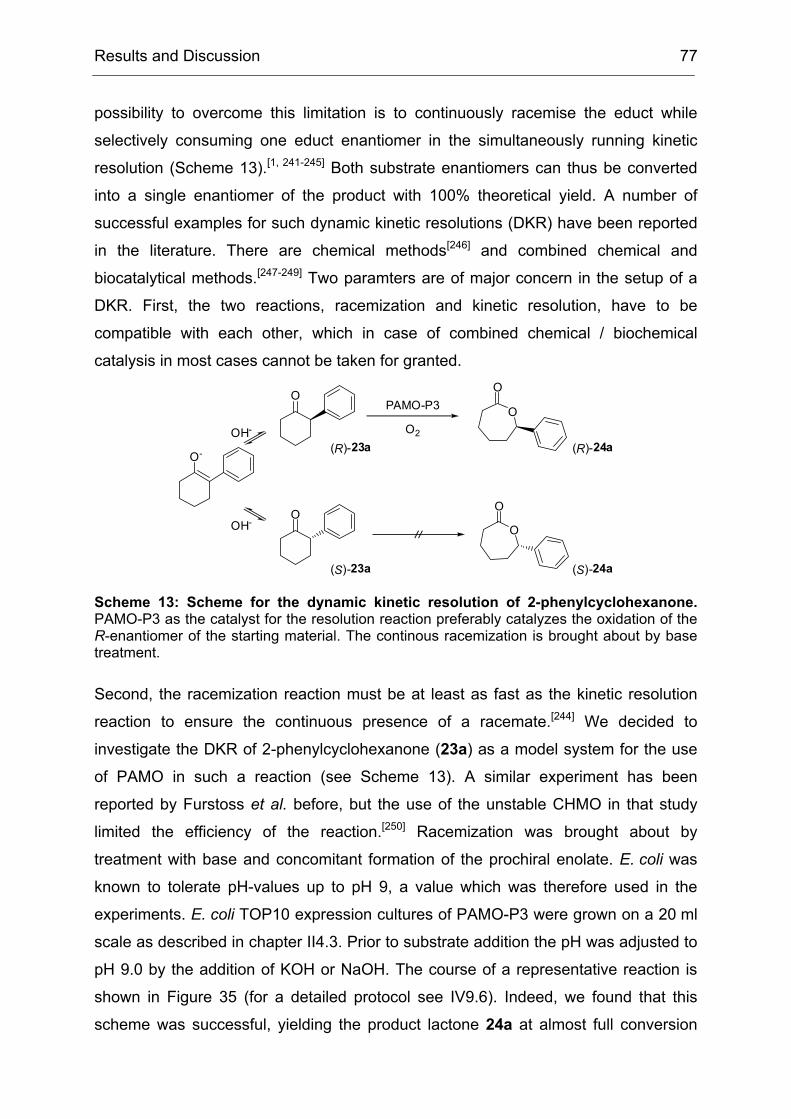
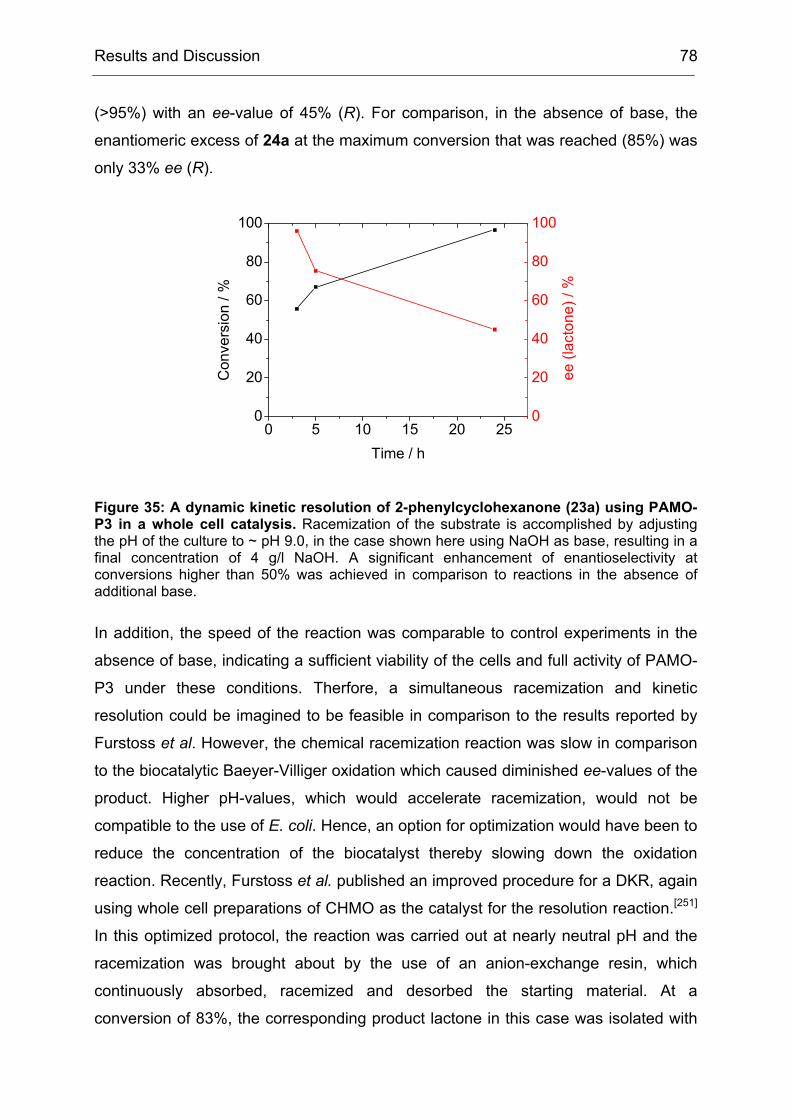
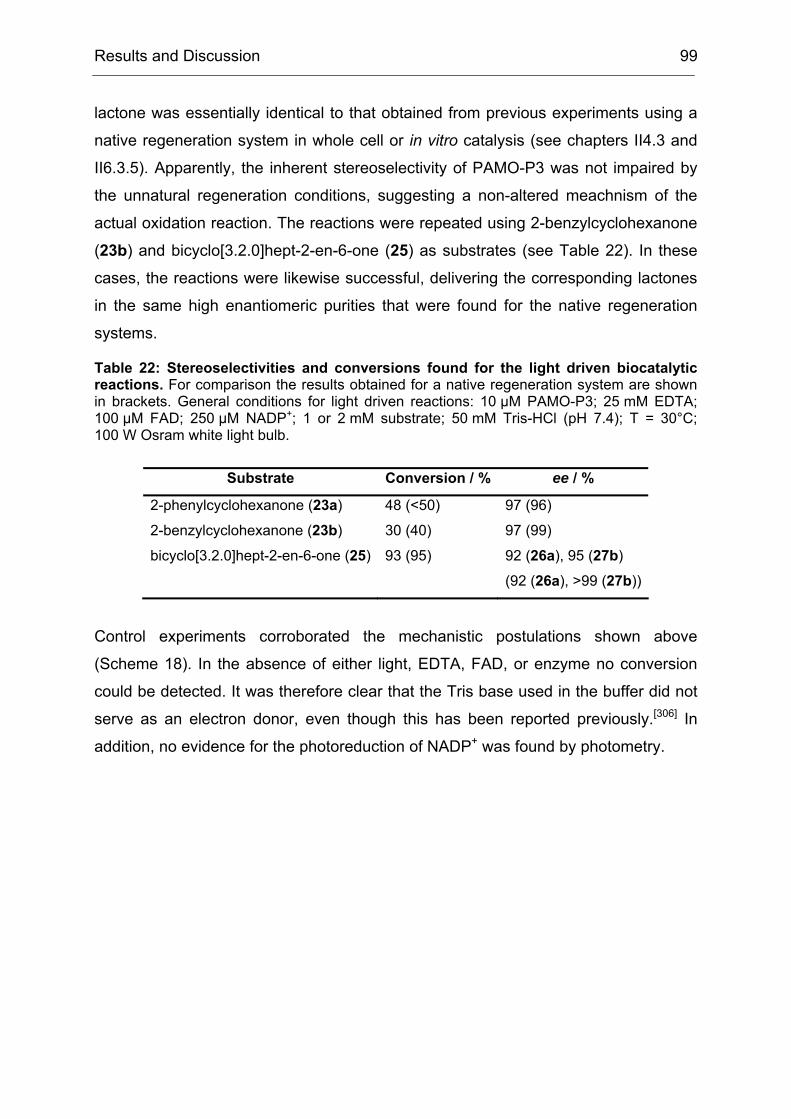
6 Stereoseletive Oxidations on a Preparative Laboratory Scale using a BVMO as Catalyst............................................................................................................... 75
6.1 Application of BVMOs – The Case of Whole Cell vs. in vitro Catalysis ...... 75
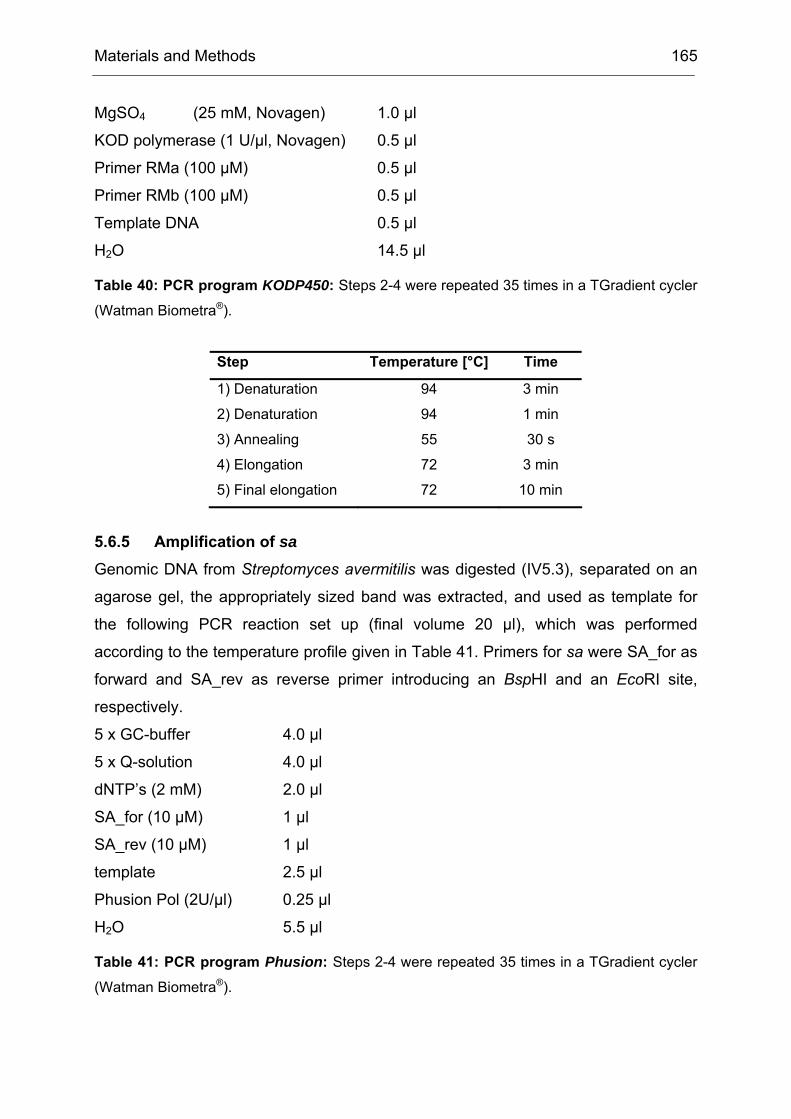
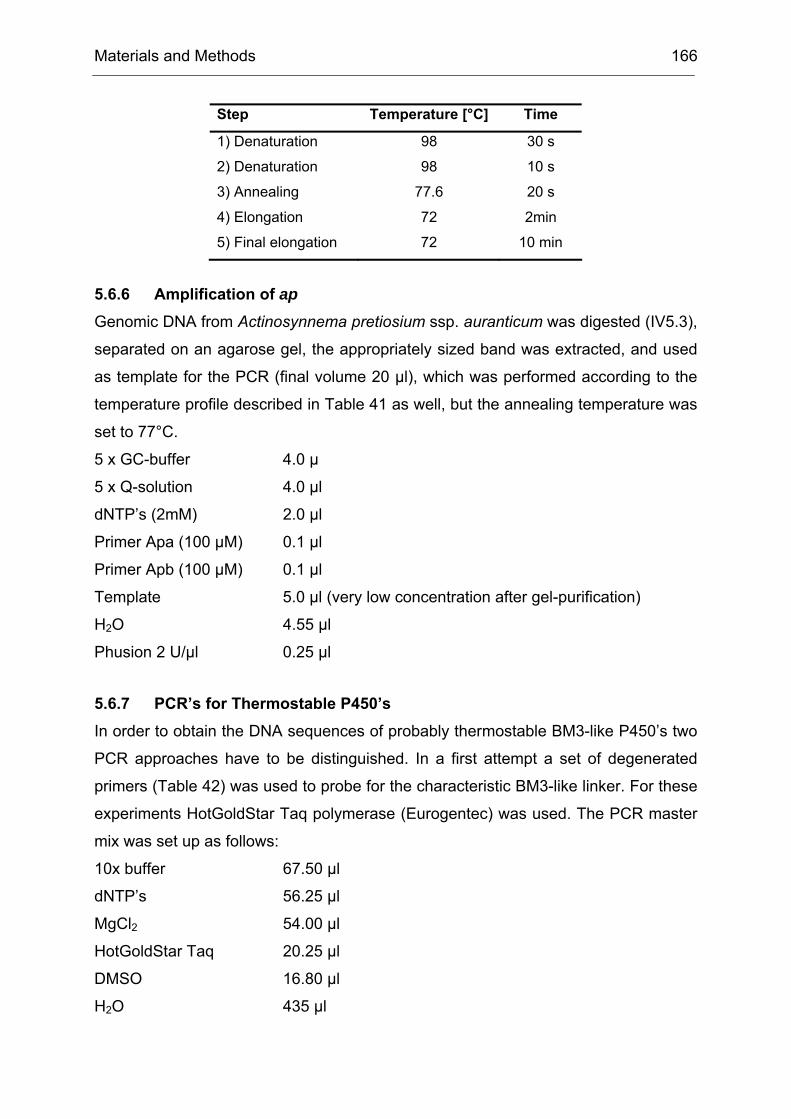
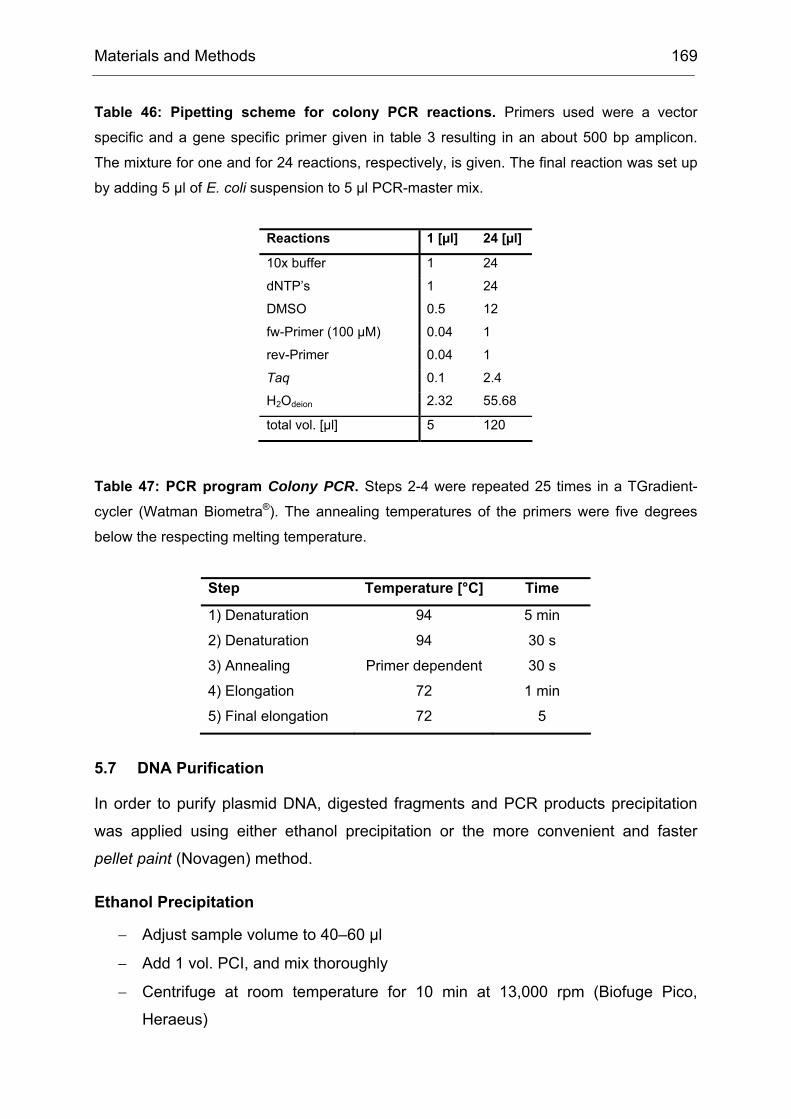
17.3 Determination of Thermostability.............................................................. 194
18 Heterologous Expression and Purification of Secondary Alcohol Dehydrogenase..................................................................................................... 194
18.1 Expression in E. coli Dh5α ....................................................................... 194
18.2 Cell disruption and Enzyme Purification ................................................... 195
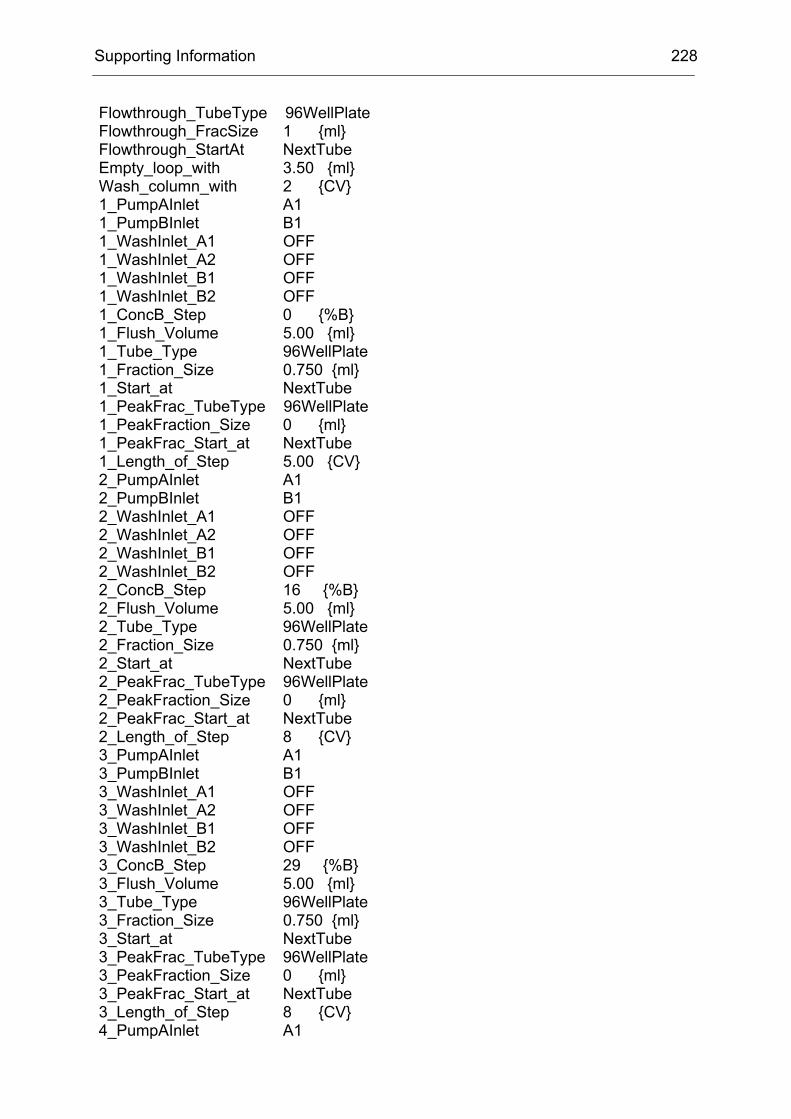
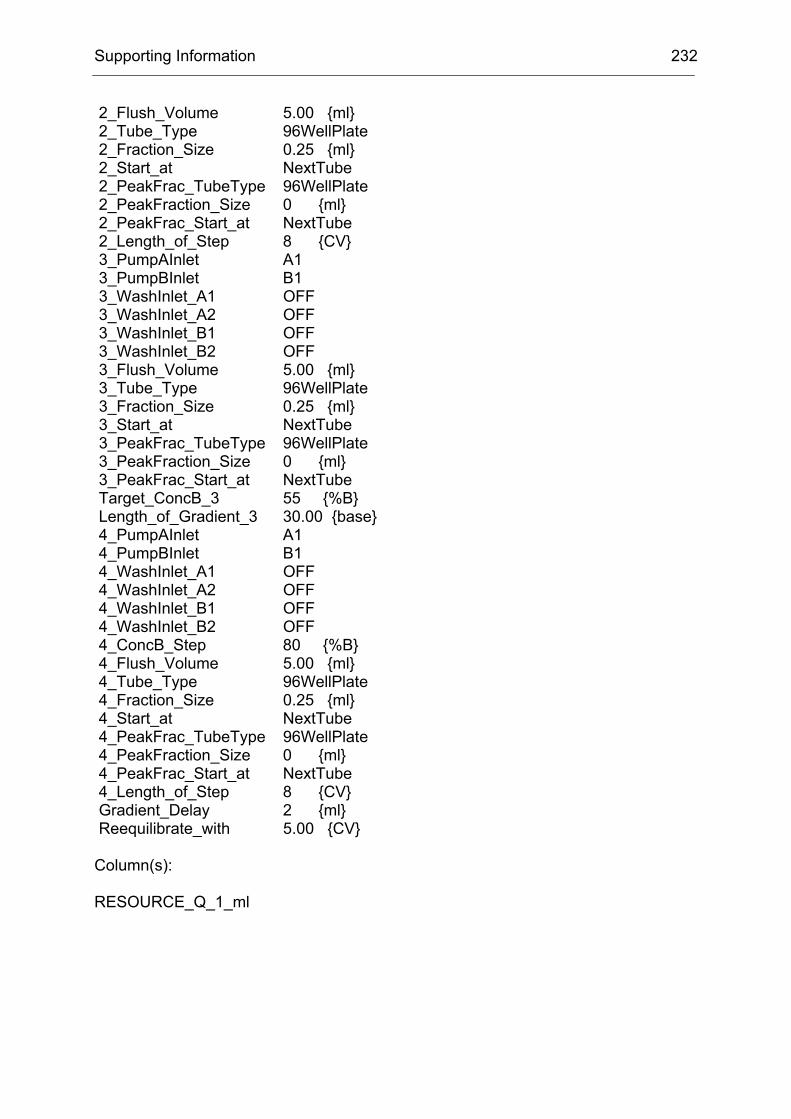
3.1 Method File for Purification of SA............................................................. 227
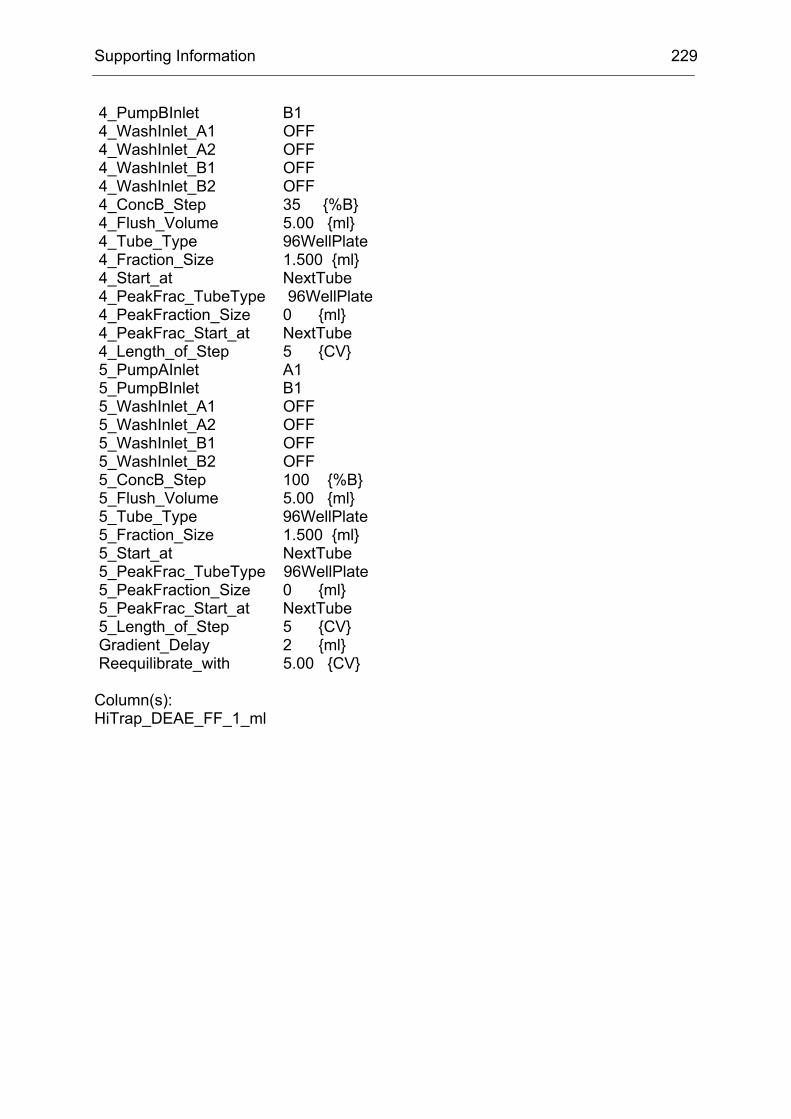
3.2 Method File for Desalting of RM............................................................... 230
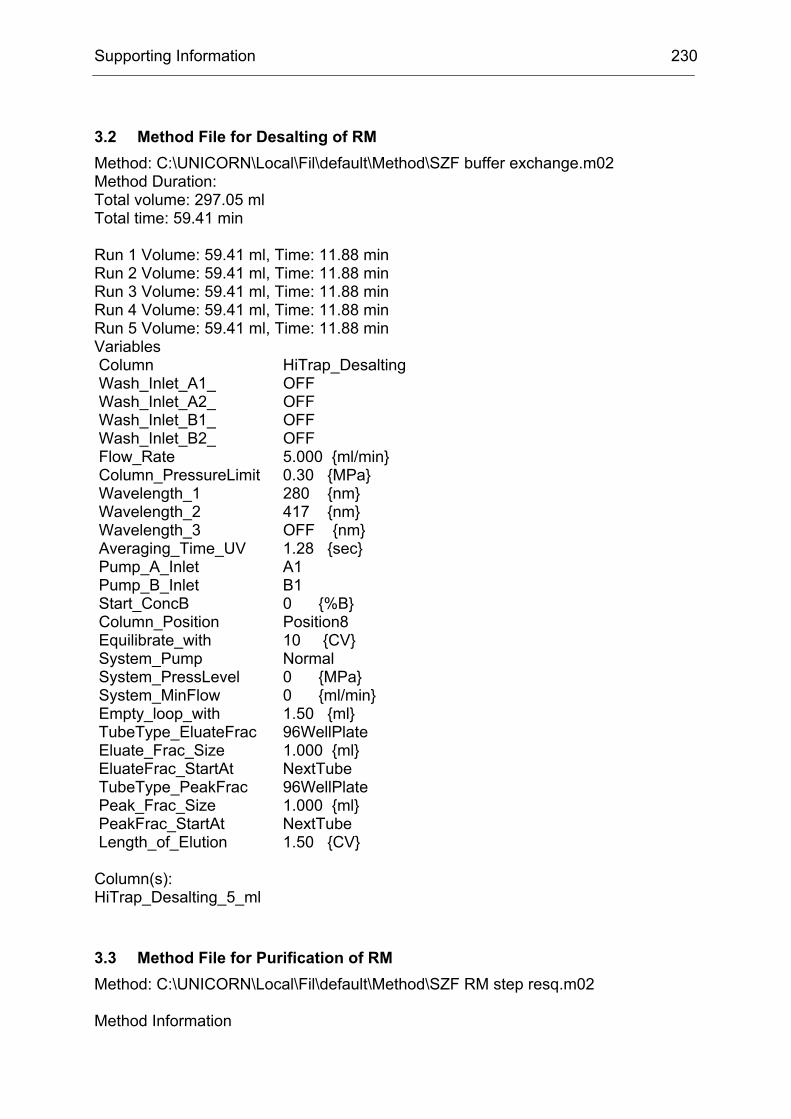
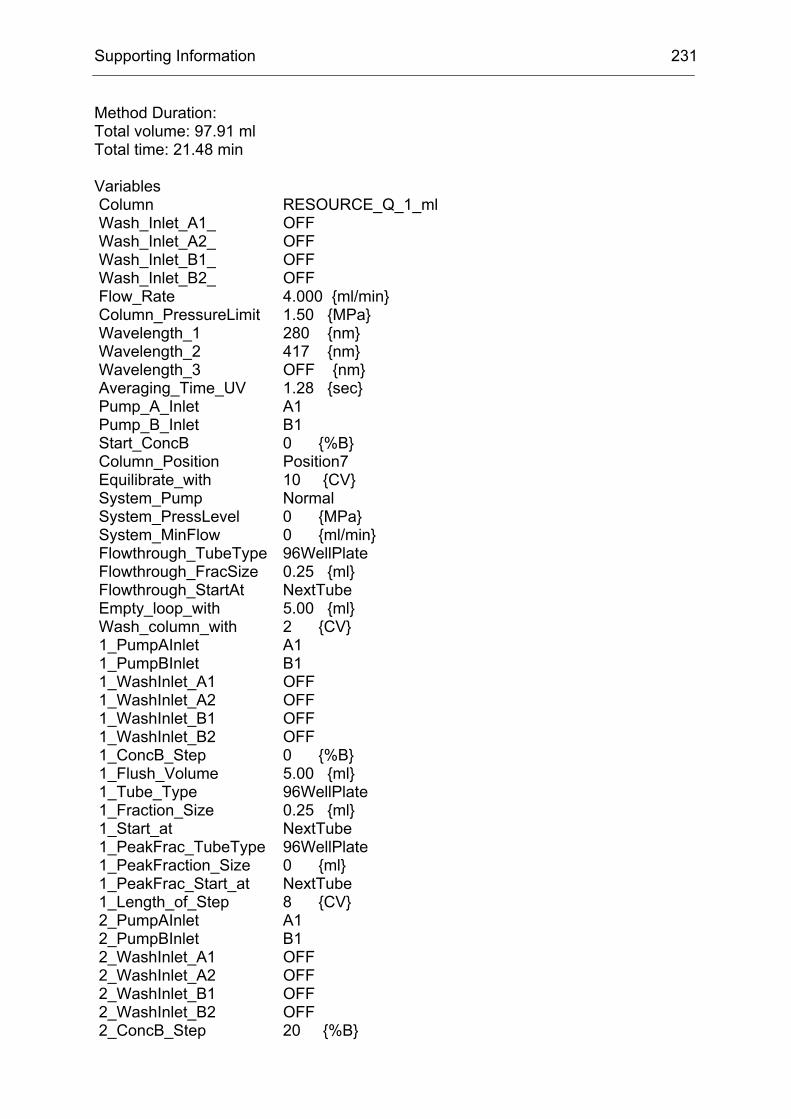
3.3 Method File for Purification of RM ............................................................ 230
Introduction 1
I Introduction
1 Biocatalysis - A Rich Portfolio of Synthetic Methods
Biocatalysis, the use of natural catalysts – enzymes – for the transformation of
synthetic compounds is not new. It has been used for more than one hundred years,
either in form of whole cells or isolated enzymes.[1] However, it was as recent as in
the 1980s that the enormous potential of this field for organic synthesis was
recognized and that biocatalysts were increasingly often applied. Meanwhile, a
search for the term “Biocatal*” in SciFinder yields more than 15,000 citations, which
reflects the intensive research efforts in this field. This effort has shown a great
impact not only in academia but also in industry, with a focus on stereoselective
synthesis.[2-9] The application of biocatalysis on a large scale is part of the white
biotechnology sector and shows an increasingly high impact on the chemical and
pharmaceutical industries. Economical studies have shown a market size for white
biotechnology of 30 billion US$ in 2001 which is expected to grow to values as high
as 310 billion US$ in 2010. The majority of biocatalytical processes is used in the
production of fine chemicals. A McKinsey study shows the greatest impact of white
biotechnology to be in this segement, where up to 60% of all products in 2010 may
be produced involving biotechnological means.
This interest is caused by a number of beneficial properties of biocatalysts. First,
enzymes are very efficient catalysts. Typically, the rates of enzyme mediated
reactions are accelerated by a factor of 108 to 1010 compared to the non-catalyzed
reaction. The acceleration may even exceed 1012, which is far above the values that
chemical catalysts can achieve.[10] Thus, the catalyst loading in a biocatalytic reaction
(counted in mole percentage) is almost negligible in comparison to the values which
are normally applied in chemical catalysis. This seeming superiority is somewhat
attenuated by the huge molecular weights of enzymes, which exceeds the weight of
chemical catalysts by several orders of magnitude. Another important factor, which
makes enzymes interesting for synthesis is their often high stereoselectivity. This is a
logical trait of biocatalysts as chiral molecules are involved in the majority of
biochemical events. The stereoselectivity is in most cases accompanied by high
chemo- and regioselectivities. Hence, biocatalysts have the potential to complement
partial weaknesses that still exist in the portfolio of chemical catalysts.
Introduction 2
Powerful as they are, biocatalysts pose a number of challenges to the synthetic
chemist (or biologist). Enzymes are naturally evolved to convert a specific or a
specific range of substrates and are not necessarily well adapted to non-natural
substrates. This leads in many cases to the finding that a given substrate is either not
converted or if it is accepted by the enzyme, the inherent selectivity of the enzyme
does not apply. In addition, enzymes often show a low operational stability. The
obvious advantage of working under mild reaction conditions can sometimes turn into
a drawback. Elevated temperatures, extreme pH-values or high salt conditions often
lead to an inactivation of the biocatalyst, as do high substrate concentrations. This
leads over to a major problem in the application of biocatalysts: Enzymes display
their highest catalytic activity in aqueous solutions, which is often not compatible with
organic synthesis.[11-13] Besides these chemical challenges, the use of enzymes as
catalysts is also complicated by biochemical regulation mechanisms. Many
enzymatic reactions are prone to substrate and/or product inhibition. Whereas
substrate inhibition might be overcome by a continous addition of the substrate while
maintaining low active concentrations, the continuous removal of the product is
usually more complex.[1]
2 Enzyme Engineering
Three different strategies to overcome the above mentioned limitations of
biocatalysis are used. First, many problems can be solved by reaction engineering,
for example a sophisticated reactor design or optimization of the reaction medium.[9,
14-18] However, many challenges such as substrate acceptance or low
enantioselectivity often cannot be met by these straightforward approaches and are
therefore left to the optimization of the biocatalyst. For example this can be achieved
by the discovery of naturally evolved enzymes by either phenotypic or genetic
screening of microorganisms[19-21] or by screening of metagenomic libraries.[22, 23] An
alternative is the engineering of already known enzymes. Using this strategy, a
researcher starts from a properly chosen enzyme and improves it by modifications on
the genetic level in terms of the desired trait. Two complementary strategies of
enzyme engineering have evolved over the last two decades, rational protein design
(mainly by site directed mutagenesis) and directed evolution.
Introduction 3
2.1 Rational Protein Design
The rational design of enzymes is based on knowledge about the enzyme’s structure
and mechanism and combines methods from theoretical chemistry and physics with
bioinformatics to predict the effects of mutations on a given enzyme. The enabling
experimental technology, site directed mutagenesis, goes back to nobel laureate
Smith in the mid 1980s.[24] Impressive successes of rational design were reported.
Properties such as thermostability were improved or even totally new catalytic
functions were introduced into otherwise non-catalytic proteins.[25-30] However, as
powerful as it is, the methodology is intrinsically restricted to cases, where besides
the structure the mode of action of an enzyme is known in detail. Otherwise the
rational design of enzymes depends on serendipity. In optimal cases, rational design
can be very fast and can help in shortening the usually long development times in
biocatalyst optimization. However, rational design is not a routine procedure due to
the complexity of enzymes.
2.2 Directed Evolution of Enzymes
In contrast to rational design the directed evolution approach does not necessarily
require knowledge about the enzyme’s structure and mechanism. In most cases it
relies on random mutagenesis to generate a library of different enzymes starting from
a parent and subsequent identification of an improved enzyme variant. The
corresponding mutant gene is then used as a template for starting another round of
mutagenesis and screening.
The first demonstration of a directed evolution experiment dates back to 1967, even
though at that time no proteins could be evolved.[31] Spiegelman et al. incubated the
replicase of the Qβ phage together with the RNA genome of the phage and
nucleoside triphosphates (NTPs) which led to a population of RNA strands. In a
procedure called serial transfer an aliquot of such a reaction was used to inoculate a
fresh mixture of replicase and NTPs. Over 75 cycles of this serial transfer with
decreasing incubation times a new and shortened class of RNA molecules was
isolated, basically a minimal phage genome, which replicated faster than the original
population.
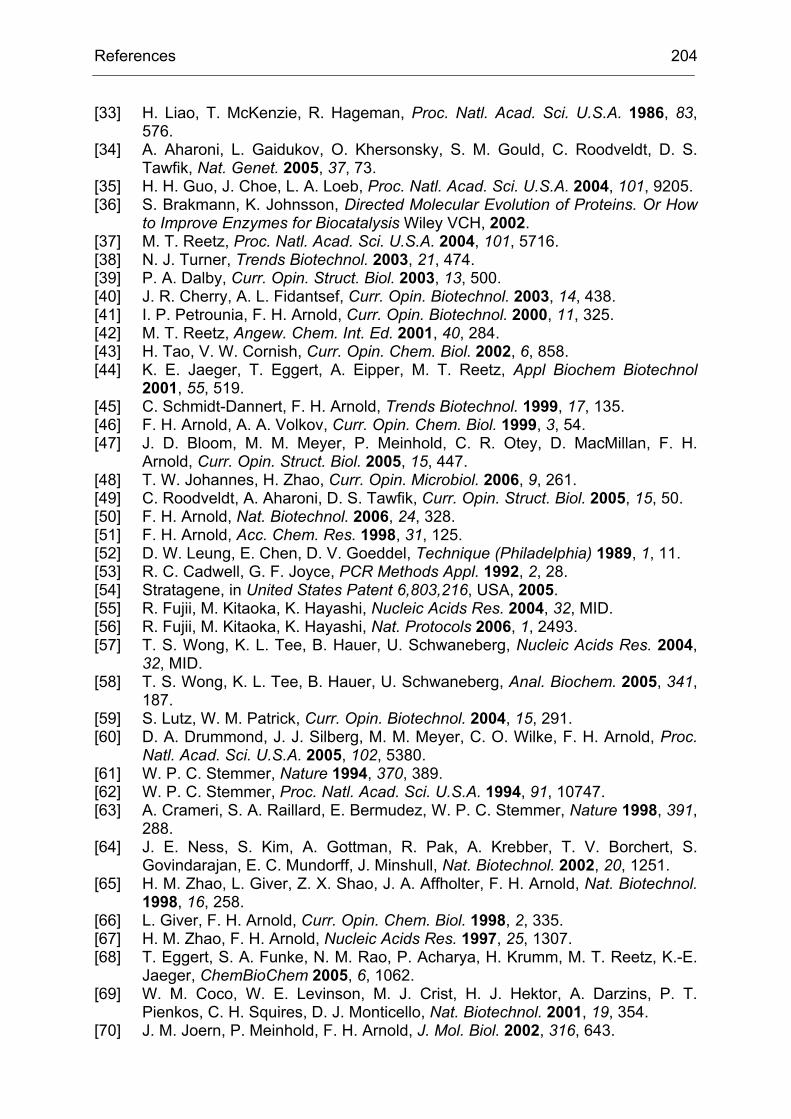
Later, still as early as 1984, the directed evolution of proteins was proposed by Eigen
et al. (see Figure 1).[32]
Introduction 4
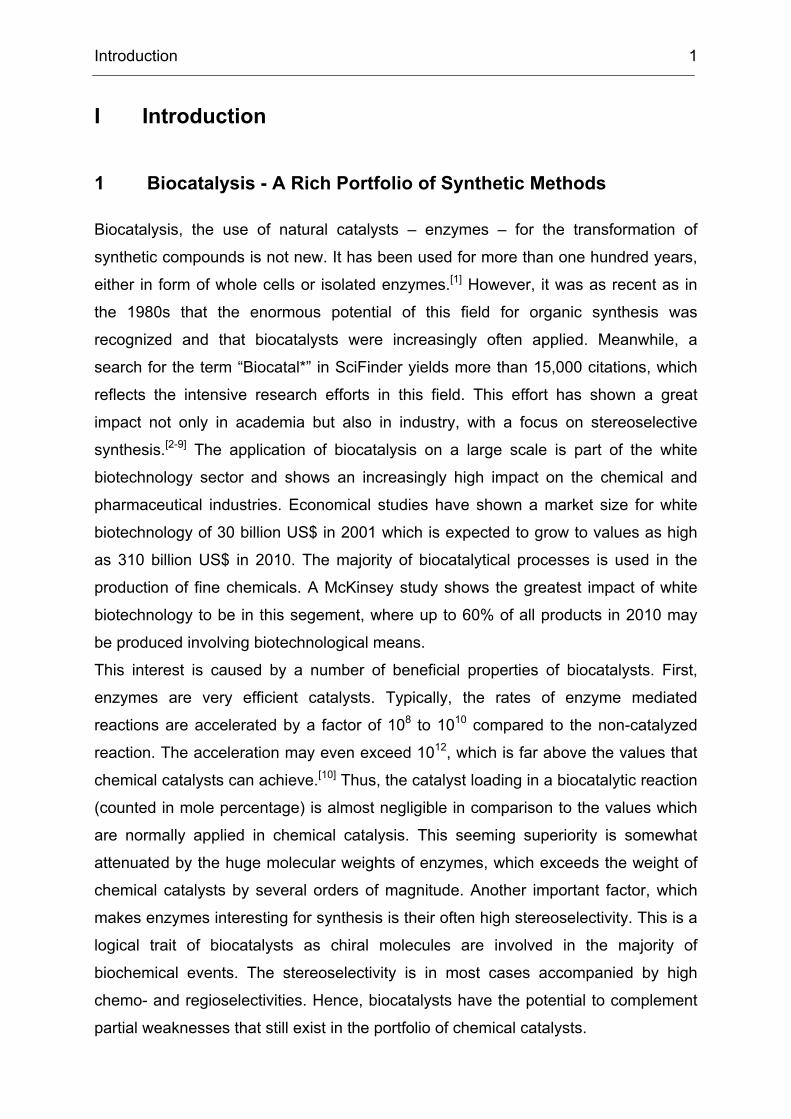
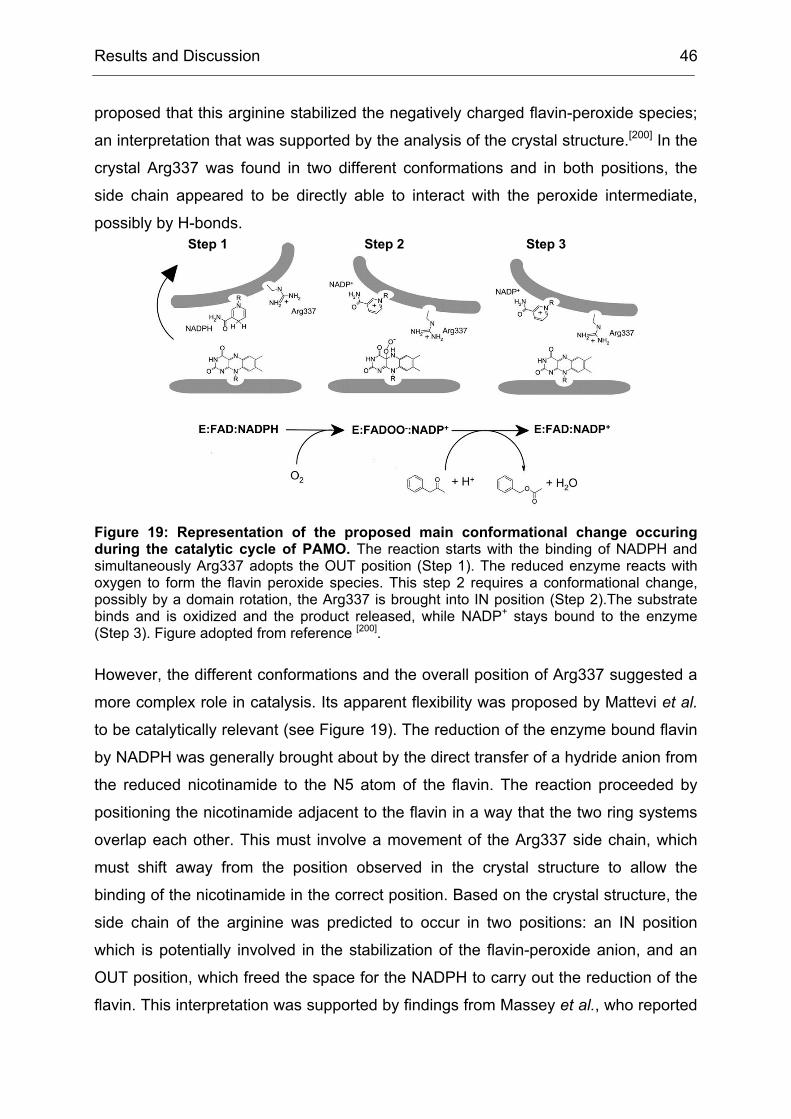
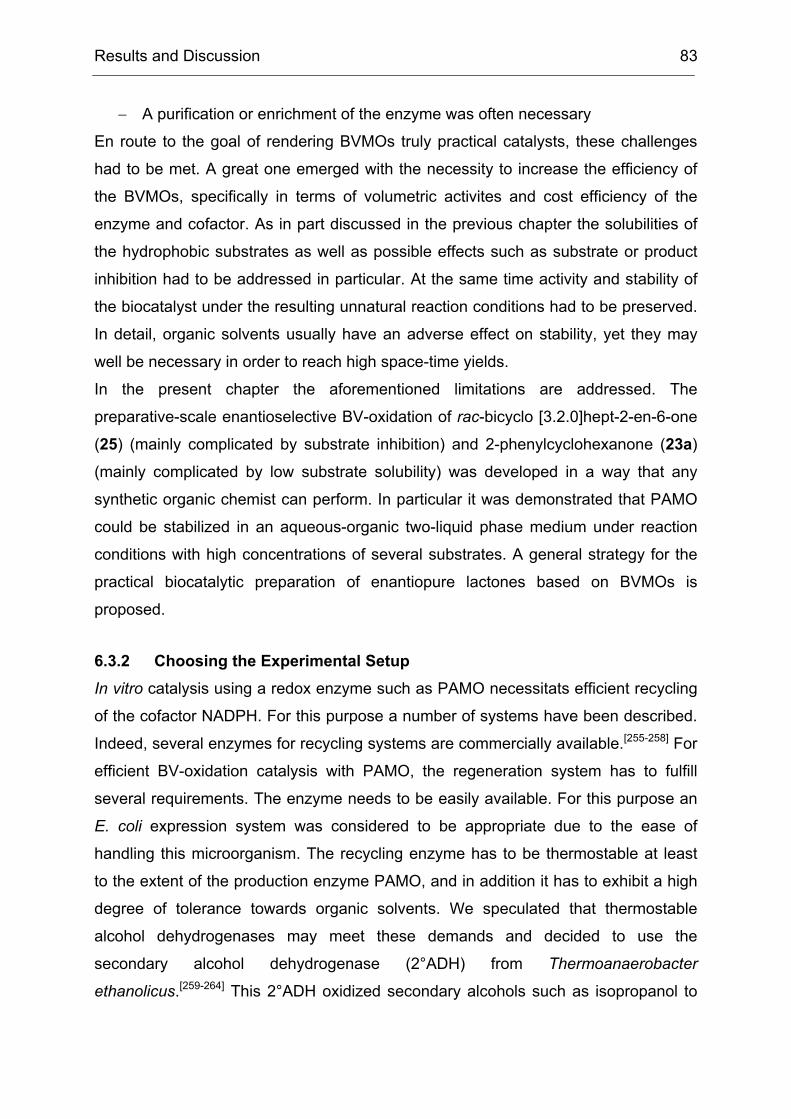
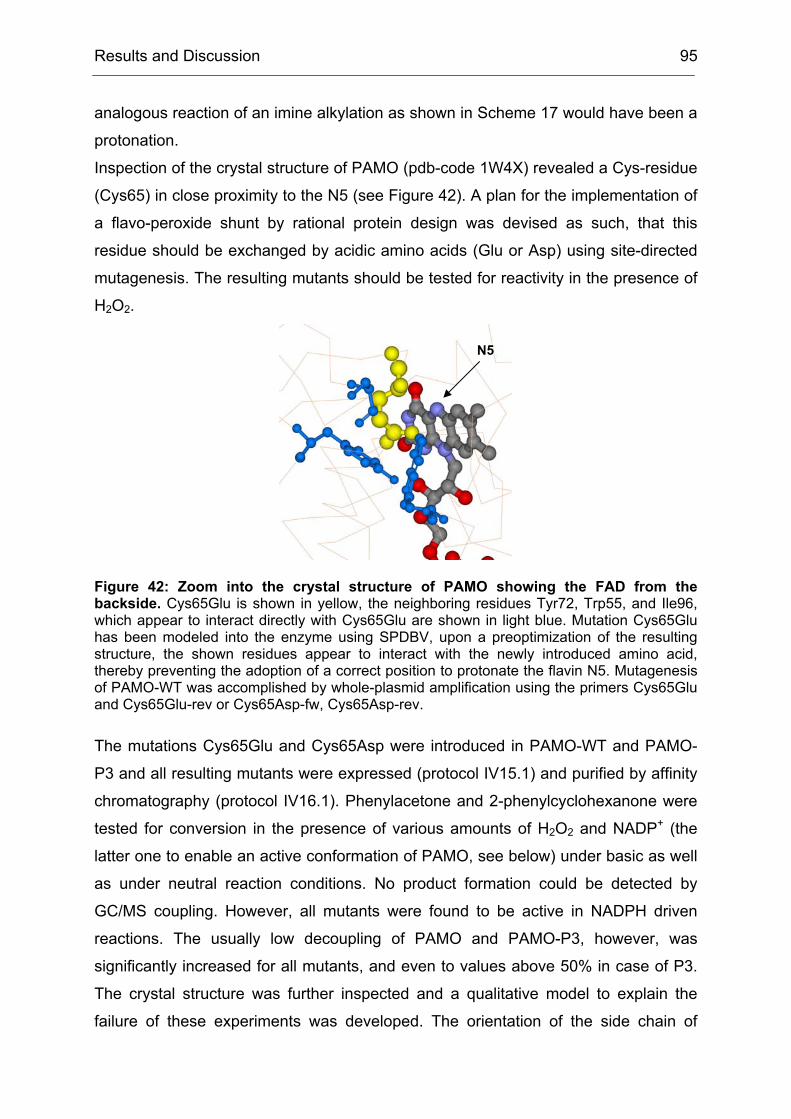
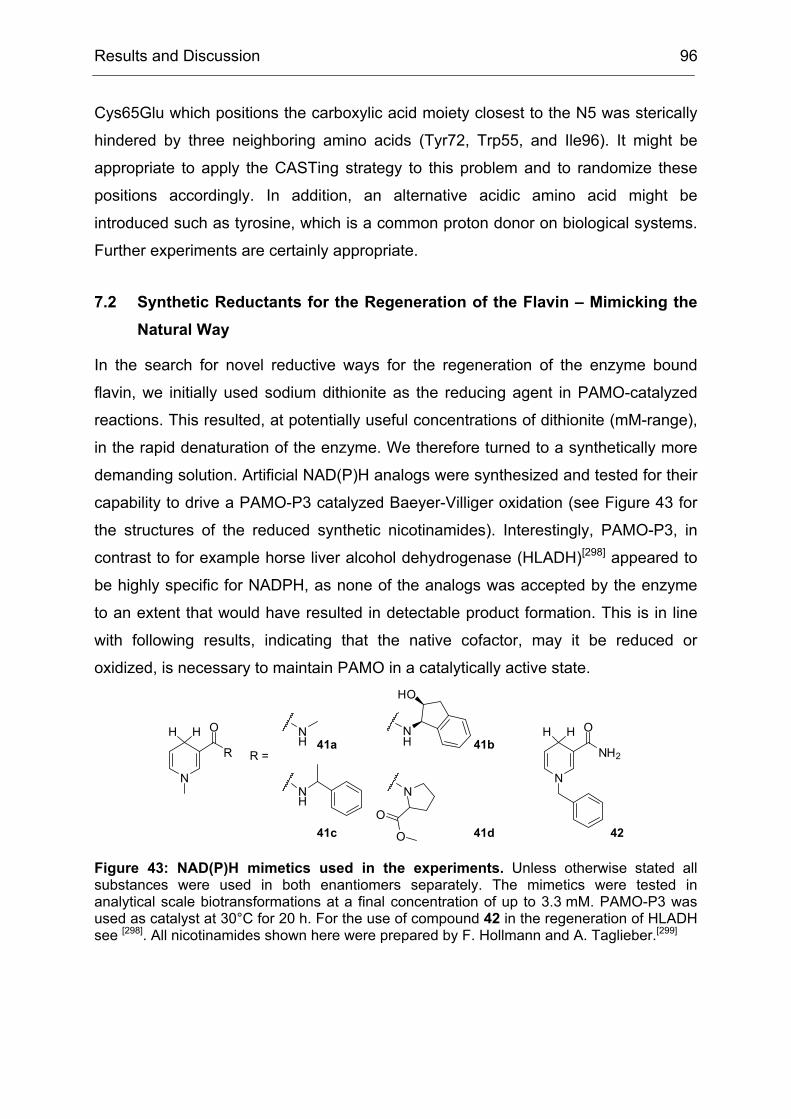
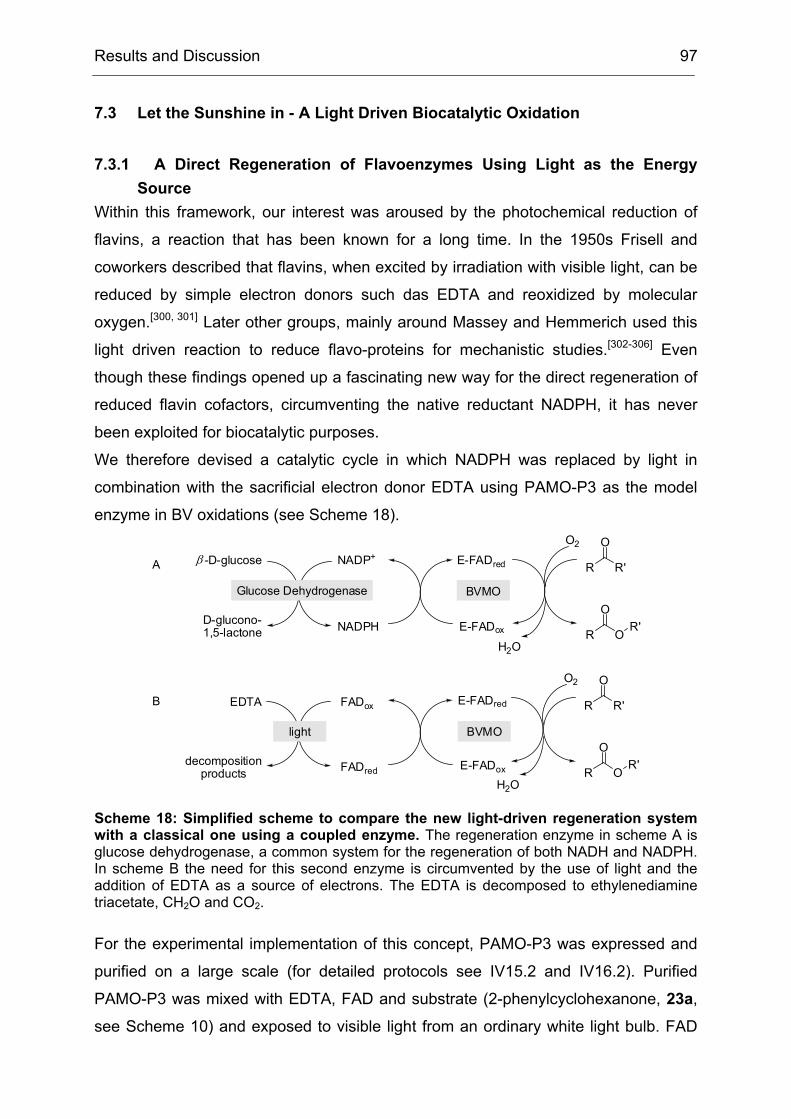
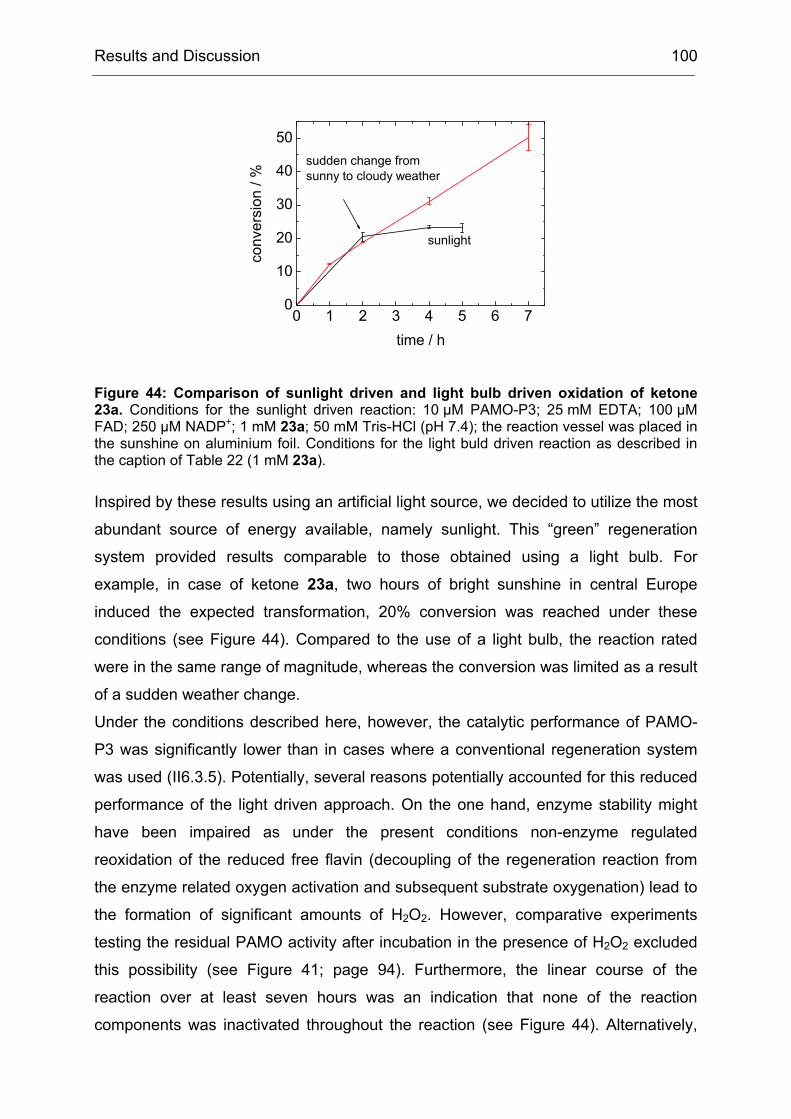
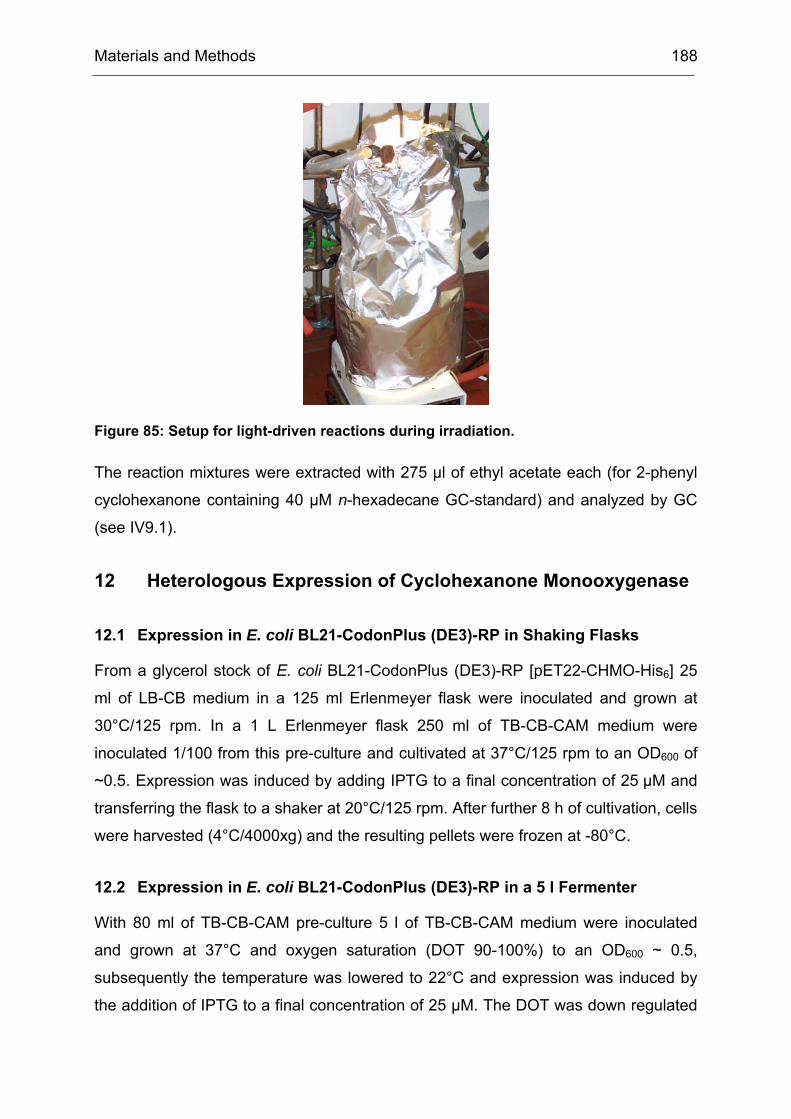
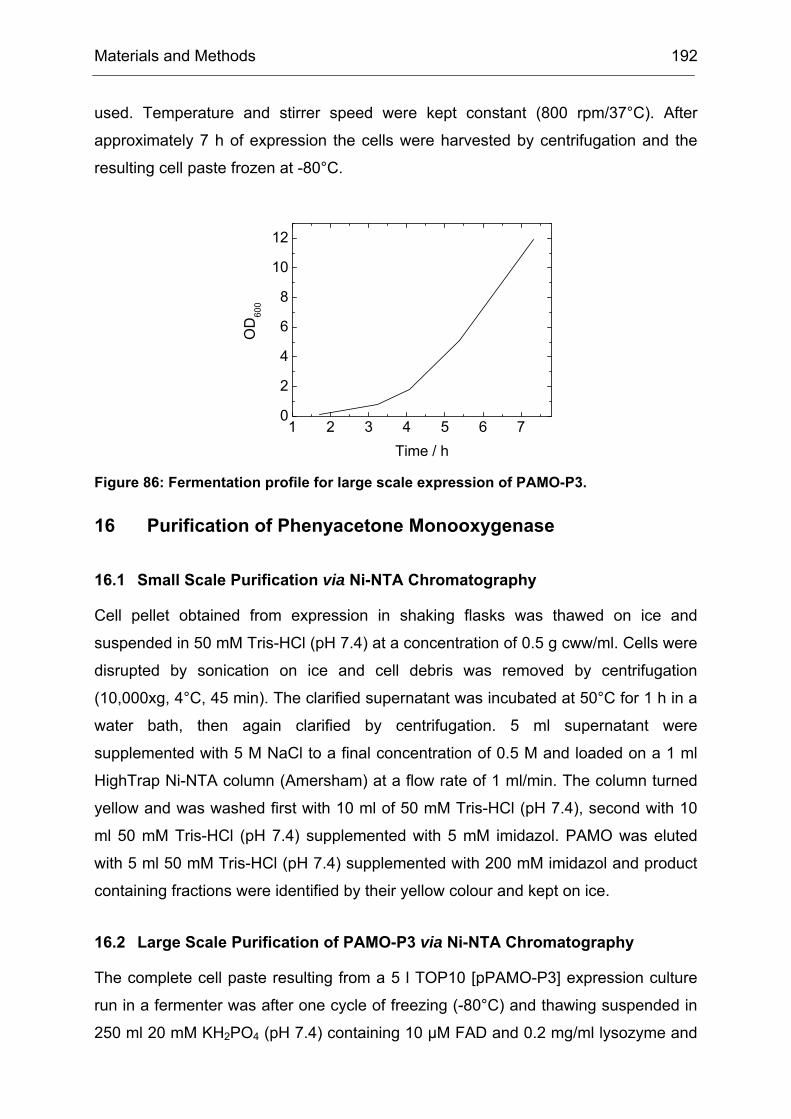
Figure 1: Procedure for a directed evolution experiment as proposed by Eigen in 1984.[32] This procedure is still the basis for a directed evolution experiment, even though most of today’s enzyme engineers would not describe it in form of an algorithm. This figure is adopted from the original publication from 1984.
At that time the enabling technologies from molecular biology were still missing and
therefore the idea was not yet put into practice. The first successful example of a
directed evolution of a protein was reported in 1986 by Hageman et al. (even though
the authors themselves did not call it directed evolution).[33] Hageman et al. achieved
an improvement of the thermostability of an enzyme over several cycles of
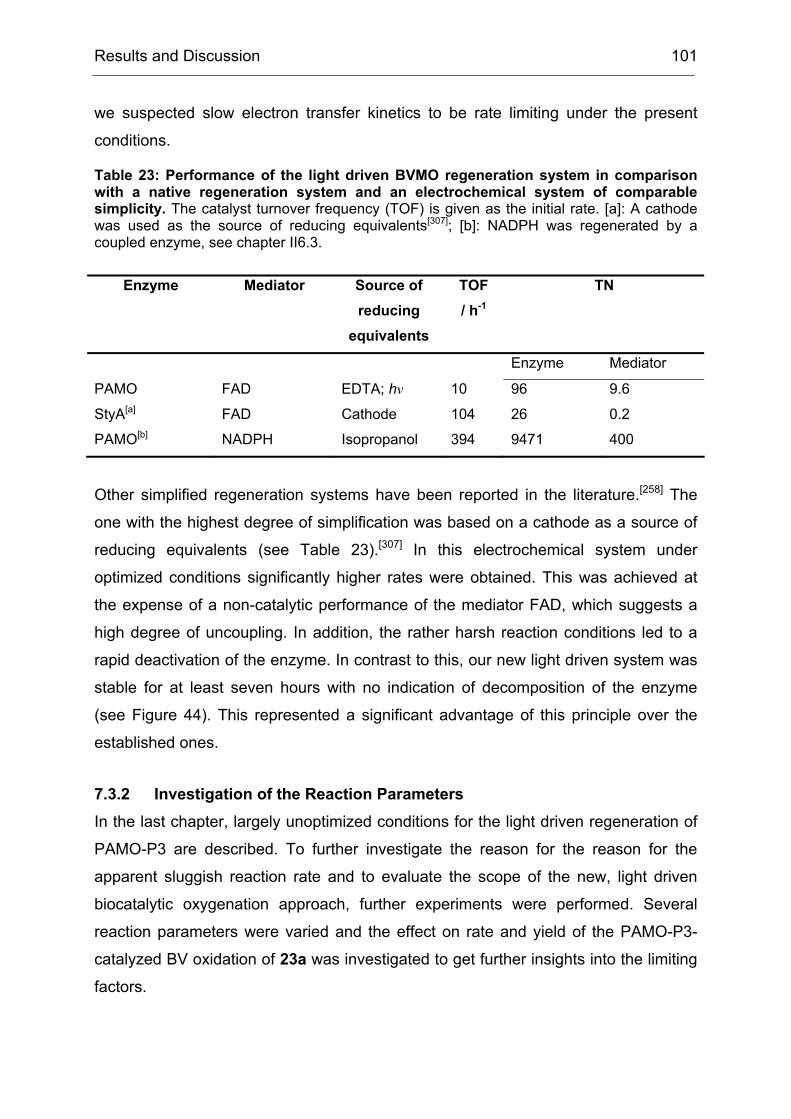
mutagenesis and selection, in part using a chemostat with a slowly increasing
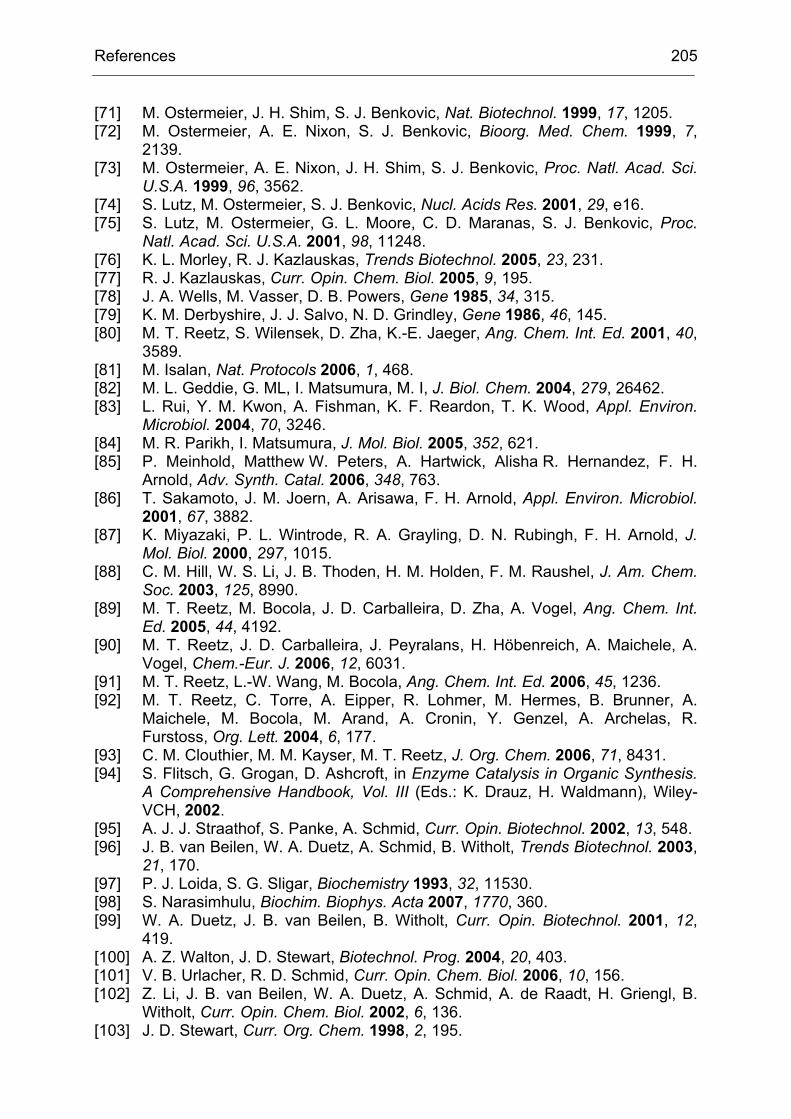
cultivation temperature.The directed evolution of proteins as it is used today does not
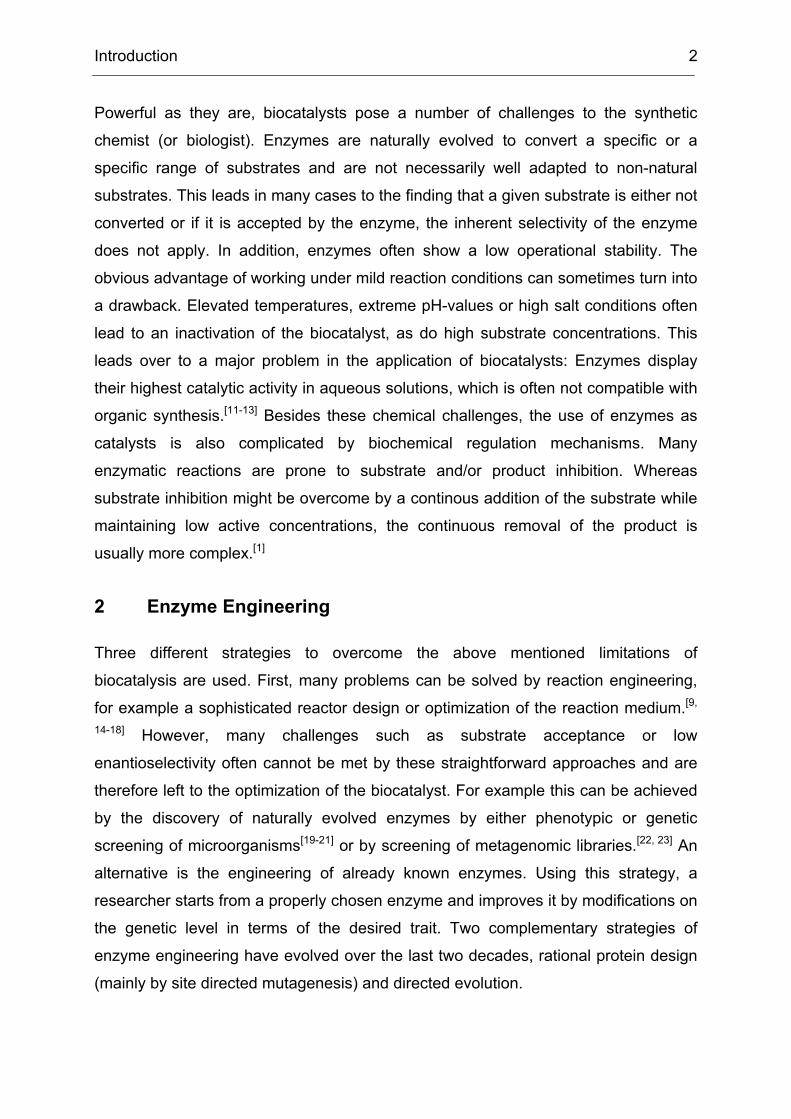
differ significantly from the scheme proposed already by Eigen (see Figure 2).
Figure 2: Scheme of a directed enzyme evolution process. The gene encoding the enzyme of interest is used as a template for mutagenesis. The resulting mutated genes are transferred to a suitable host for expression of the corresponding mutated proteins. These are subsequently screened for the desired trait, for example an increased thermostability. Enzyme variants which show an improvement are used as template for the next round of mutagenesis and screening, thus evolutionary pressure is applied.
Parent Evolved
enzyme enzyme
Mutagenesis Expression Screening/Selection
Repetition
Desired
Trait?
Yes No
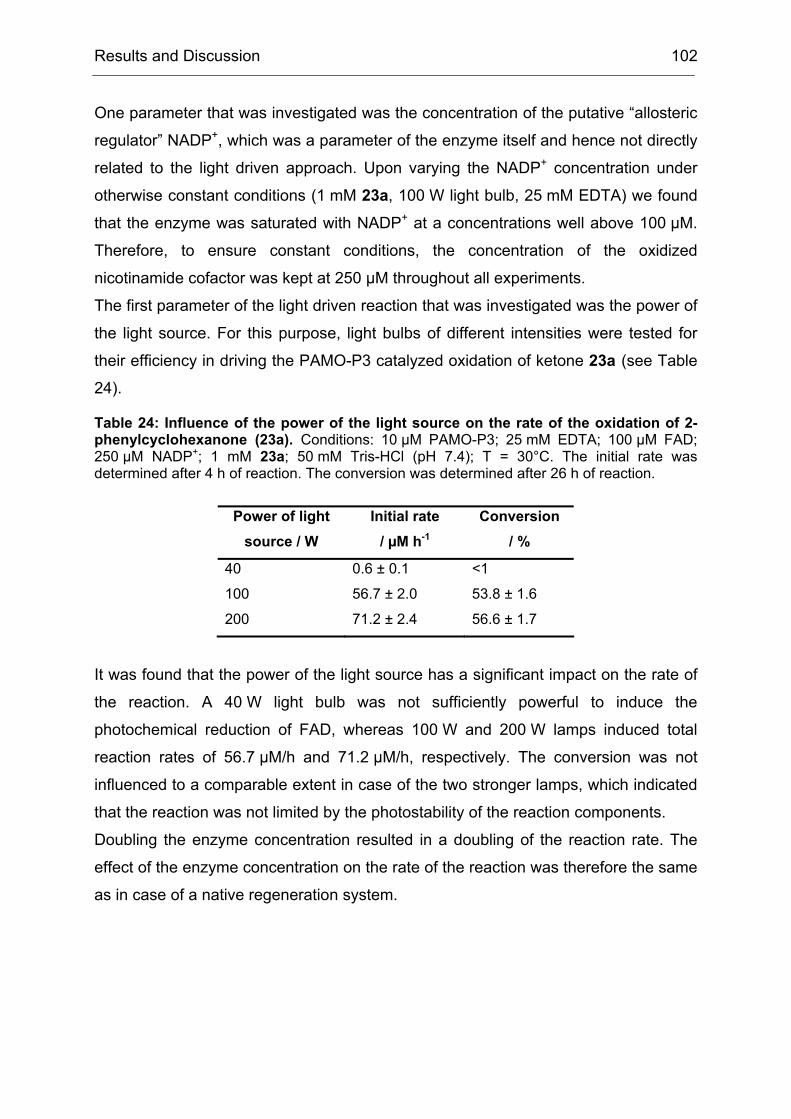
Introduction 5
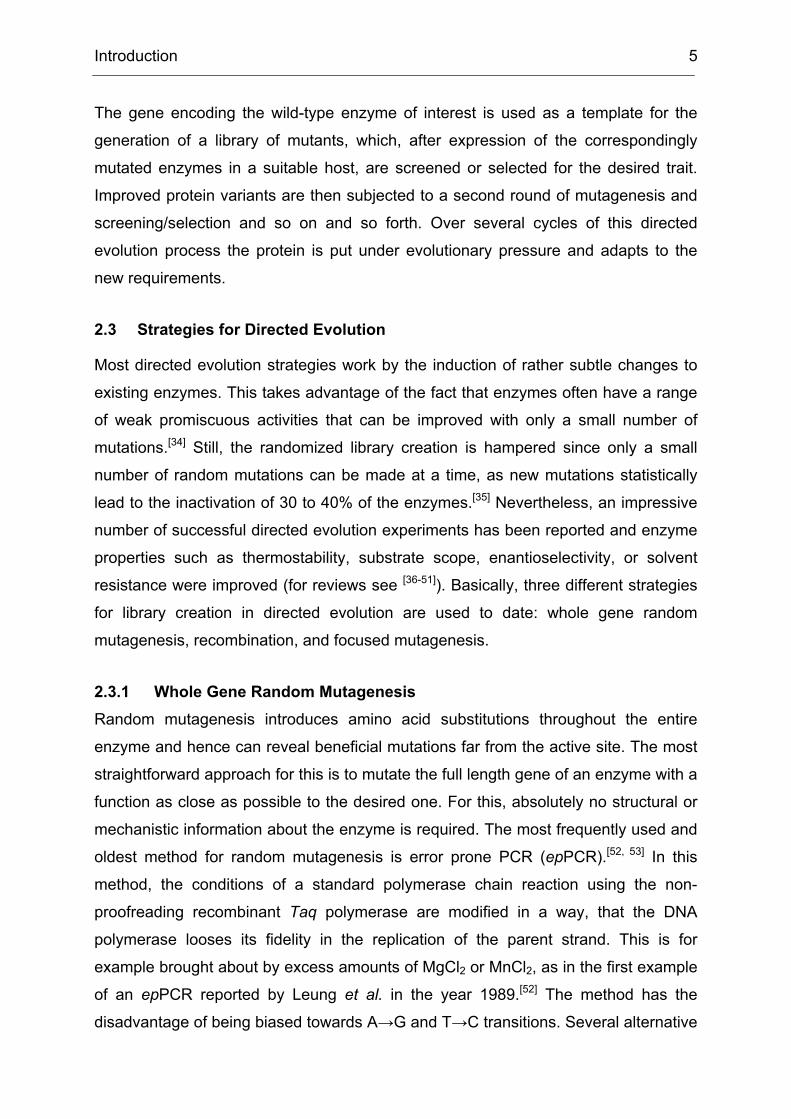
The gene encoding the wild-type enzyme of interest is used as a template for the
generation of a library of mutants, which, after expression of the correspondingly
mutated enzymes in a suitable host, are screened or selected for the desired trait.
Improved protein variants are then subjected to a second round of mutagenesis and
screening/selection and so on and so forth. Over several cycles of this directed
evolution process the protein is put under evolutionary pressure and adapts to the
new requirements.
2.3 Strategies for Directed Evolution
Most directed evolution strategies work by the induction of rather subtle changes to
existing enzymes. This takes advantage of the fact that enzymes often have a range
of weak promiscuous activities that can be improved with only a small number of
mutations.[34] Still, the randomized library creation is hampered since only a small
number of random mutations can be made at a time, as new mutations statistically
lead to the inactivation of 30 to 40% of the enzymes.[35] Nevertheless, an impressive
number of successful directed evolution experiments has been reported and enzyme
properties such as thermostability, substrate scope, enantioselectivity, or solvent
resistance were improved (for reviews see [36-51]). Basically, three different strategies
for library creation in directed evolution are used to date: whole gene random
mutagenesis, recombination, and focused mutagenesis.
2.3.1 Whole Gene Random Mutagenesis Random mutagenesis introduces amino acid substitutions throughout the entire
enzyme and hence can reveal beneficial mutations far from the active site. The most
straightforward approach for this is to mutate the full length gene of an enzyme with a
function as close as possible to the desired one. For this, absolutely no structural or
mechanistic information about the enzyme is required. The most frequently used and
oldest method for random mutagenesis is error prone PCR (epPCR).[52, 53] In this
method, the conditions of a standard polymerase chain reaction using the non-
proofreading recombinant Taq polymerase are modified in a way, that the DNA
polymerase looses its fidelity in the replication of the parent strand. This is for
example brought about by excess amounts of MgCl2 or MnCl2, as in the first example
of an epPCR reported by Leung et al. in the year 1989.[52] The method has the
disadvantage of being biased towards A→G and T→C transitions. Several alternative
Introduction 6
methods have been reported to overcome this bias including improved versions of
the classical epPCR itself, although most of them lack the technical simplicity of the
original protocol.[54-58]
2.3.2 Recombination Methods
Homology-dependent Recombination
A number of the so far most dramatic results in the field of directed evolution are
united in their utilization of in vitro recombination.[59] This is probably linked to the fact
that the recombination of structurally similar proteins can access larger degrees of
sequence space than sequential random mutagenesis by epPCR.[60]
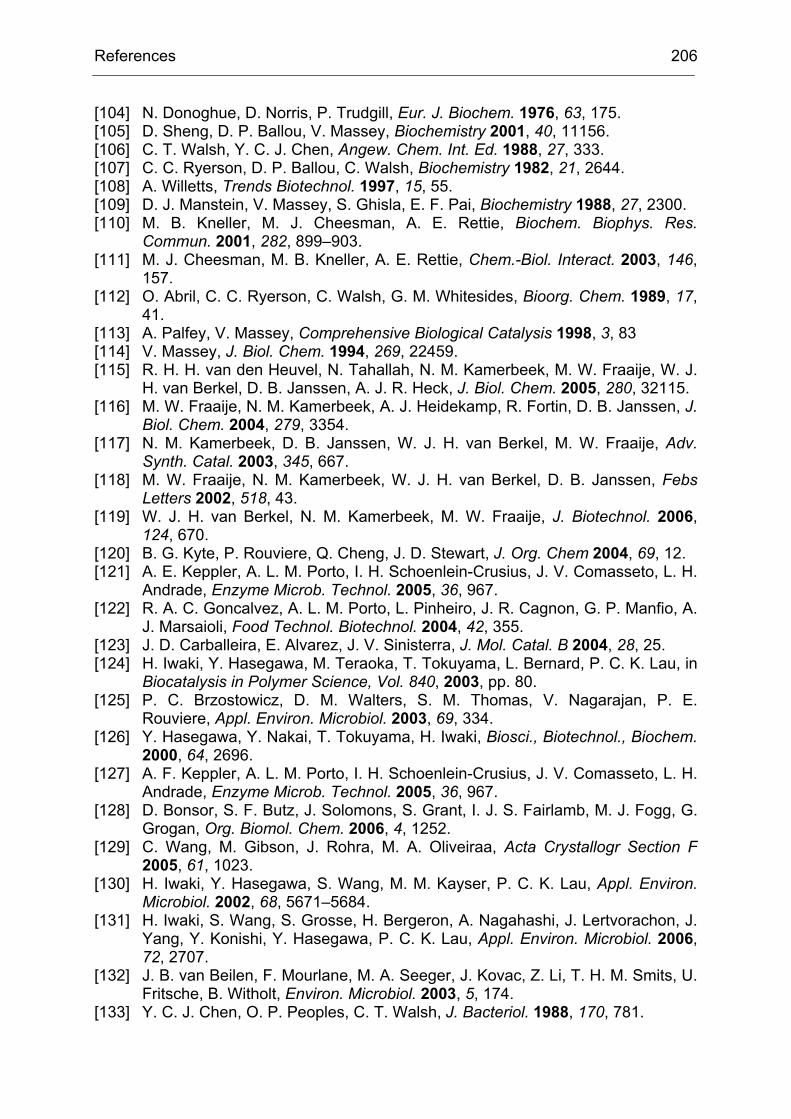
DNase I
Assembly
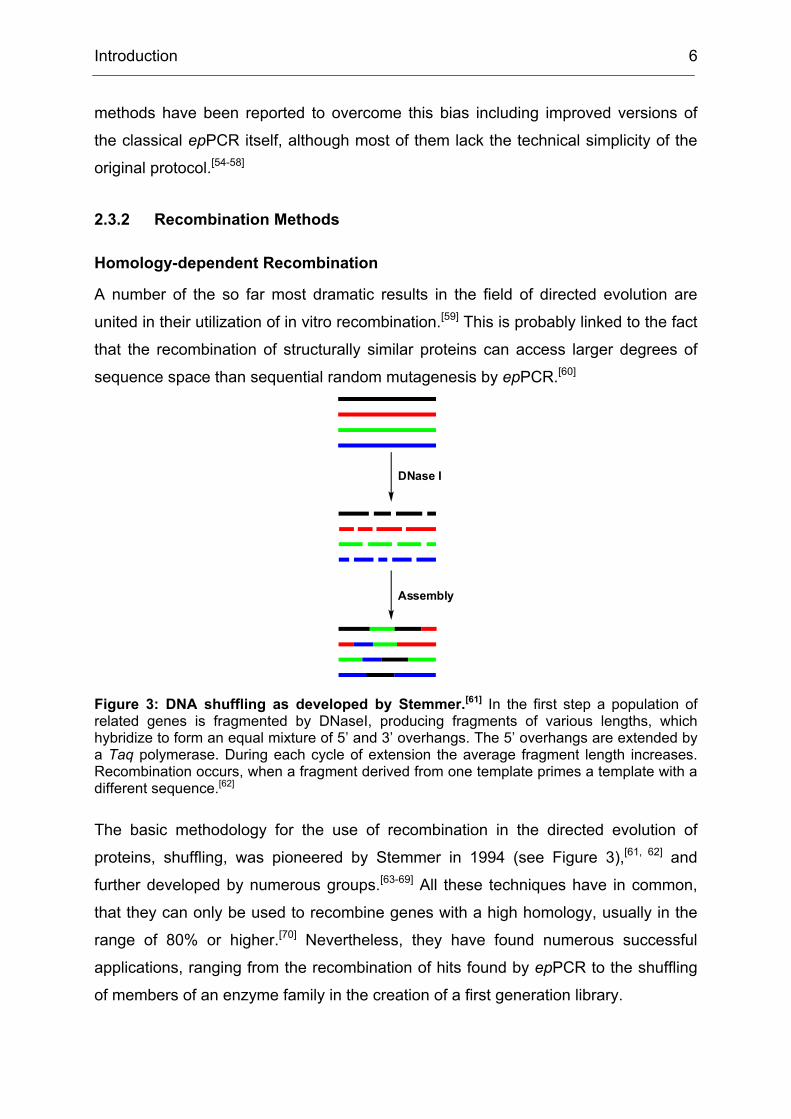
Figure 3: DNA shuffling as developed by Stemmer.[61] In the first step a population of related genes is fragmented by DNaseI, producing fragments of various lengths, which hybridize to form an equal mixture of 5’ and 3’ overhangs. The 5’ overhangs are extended by a Taq polymerase. During each cycle of extension the average fragment length increases. Recombination occurs, when a fragment derived from one template primes a template with a different sequence.[62]
The basic methodology for the use of recombination in the directed evolution of
proteins, shuffling, was pioneered by Stemmer in 1994 (see Figure 3),[61, 62] and
further developed by numerous groups.[63-69] All these techniques have in common,
that they can only be used to recombine genes with a high homology, usually in the
range of 80% or higher.[70] Nevertheless, they have found numerous successful
applications, ranging from the recombination of hits found by epPCR to the shuffling
of members of an enzyme family in the creation of a first generation library.
Introduction 7
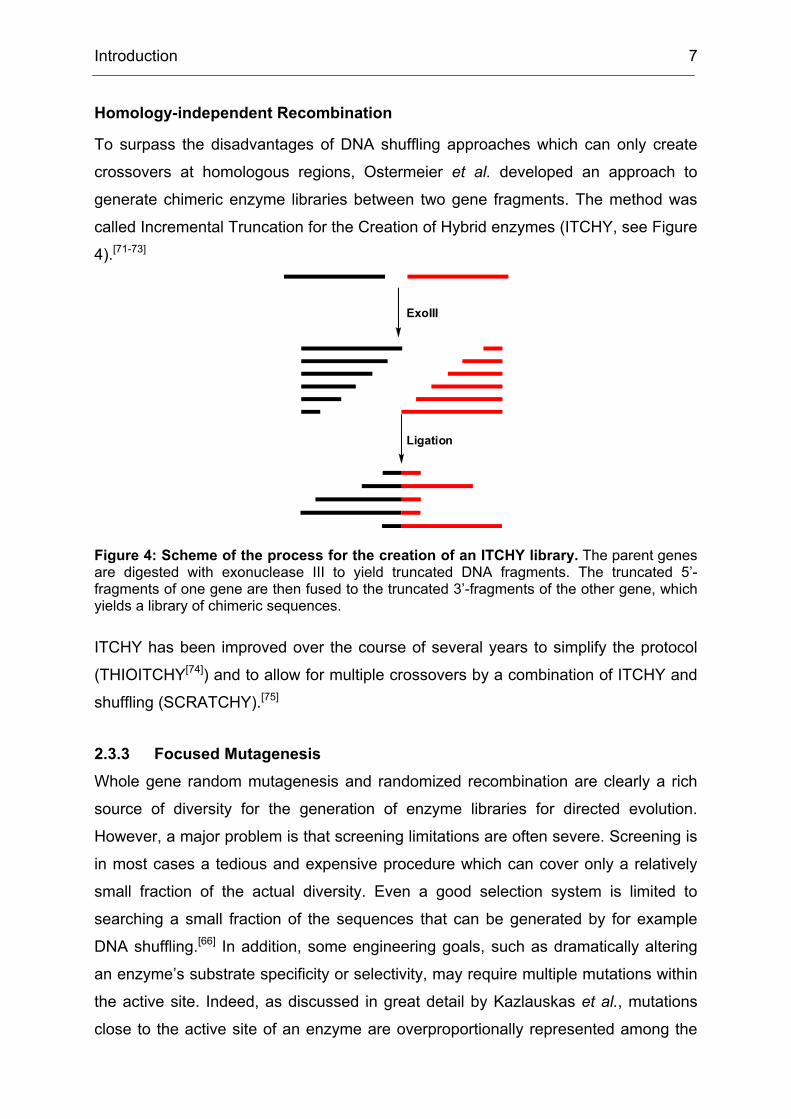
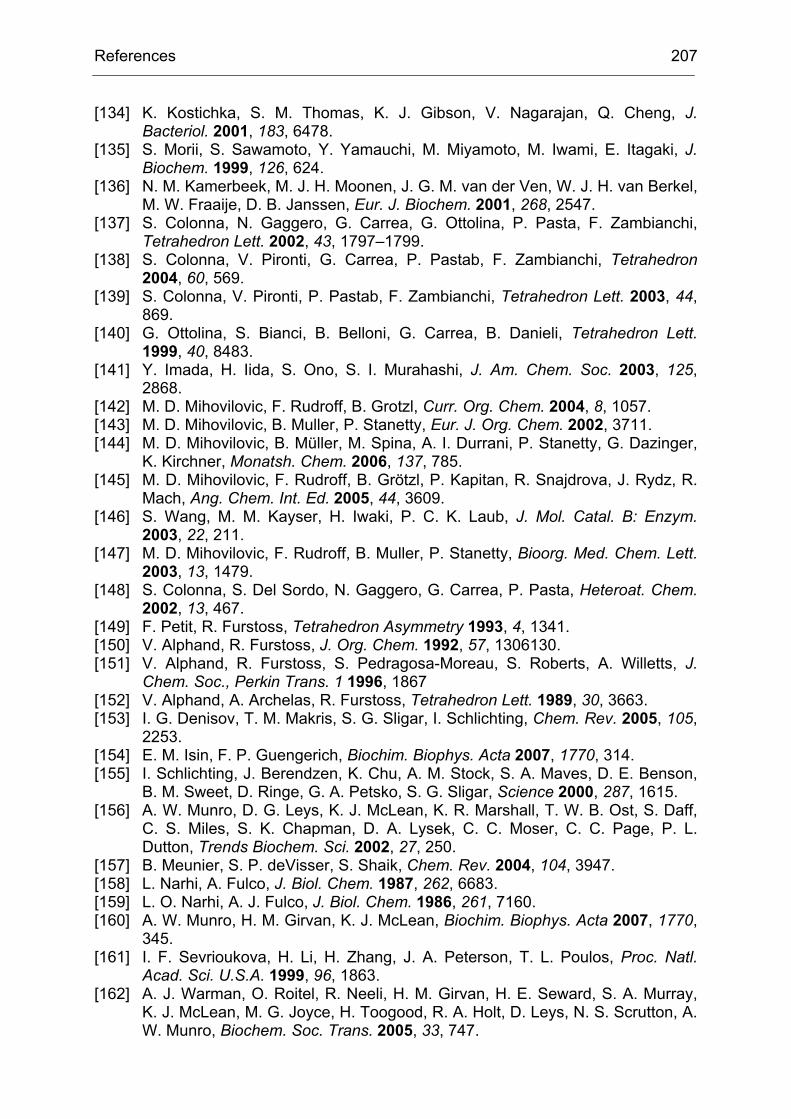
Homology-independent Recombination
To surpass the disadvantages of DNA shuffling approaches which can only create
crossovers at homologous regions, Ostermeier et al. developed an approach to
generate chimeric enzyme libraries between two gene fragments. The method was
called Incremental Truncation for the Creation of Hybrid enzymes (ITCHY, see Figure
4).[71-73]
ExoIII
Ligation
Figure 4: Scheme of the process for the creation of an ITCHY library. The parent genes are digested with exonuclease III to yield truncated DNA fragments. The truncated 5’-fragments of one gene are then fused to the truncated 3’-fragments of the other gene, which yields a library of chimeric sequences.
ITCHY has been improved over the course of several years to simplify the protocol
(THIOITCHY[74]) and to allow for multiple crossovers by a combination of ITCHY and
shuffling (SCRATCHY).[75]
2.3.3 Focused Mutagenesis Whole gene random mutagenesis and randomized recombination are clearly a rich
source of diversity for the generation of enzyme libraries for directed evolution.
However, a major problem is that screening limitations are often severe. Screening is
in most cases a tedious and expensive procedure which can cover only a relatively
small fraction of the actual diversity. Even a good selection system is limited to
searching a small fraction of the sequences that can be generated by for example
DNA shuffling.[66] In addition, some engineering goals, such as dramatically altering
an enzyme’s substrate specificity or selectivity, may require multiple mutations within
the active site. Indeed, as discussed in great detail by Kazlauskas et al., mutations
close to the active site of an enzyme are overproportionally represented among the
Introduction 8
improved enzymes obtained after a directed evolution experiment, but statistically
underrepresented in the enzyme libraries obtained by random mutagenesis (“closer
are better”). Accordingly, the importance of remote mutations is overestimated in the
literature, as these mutations are often uncovered simply because they are
overpropotionally represented in the library.[76, 77] These arguments all together speak
for a privileged consideration of active site residues of an enzyme in the creation of
libraries. Combinations of active site mutations are difficult to obtain by entirely
random mutagenesis, because libraries with small numbers of mutations contain
multiple active site mutations with a low frequency, whereas libraries with high
mutation frequencies will contain a high fraction of inactive enzymes. Additionally,
single nucleotide exchanges in a given codon typically access only approximately six
out of the nineteen possible amino acid exchanges. Hence, methods such as epPCR
are clearly not suitable. The enabling methods for targeted mutagenesis were
already developed before the advent of directed evolution. In the mid 1980’s, the
closely related techniques cassette mutagenesis and saturation mutagenesis were
invented using degenerate oligonucleotides to introduce random mutations at one or
more defined sites.[78, 79] These techniques enabled the focused mutagenesis of an
enzyme and had a considerable impact on enzyme engineering ever since (for a
small number of examples see references [80-87]). This strategy requires structural or
biochemical data in order to choose just a small subset of positions, as the number of
possible sequences increases exponentially with the number of residues that are
being mutated simultaneously. Thus, in focused mutagenesis, rational design and
directed evolution are merged, combining each other’s strengths.
The best mutants discovered by focused mutagenesis often contain multiple
mutations. These mutations are often beneficial also as single mutants, but evidence
has been reported that at least some of them are beneficial only in combination.[88] A
possible reason for these synergistic effects is that multiple active site mutations can
cause significant structural changes within the active site, which cannot be brought
about by one mutation alone. A strategy to systematically investigate synergistic
effects of active site mutations has been reported in 2005.[89, 90] This strategy is called
Combinatorial Active Site Saturation Test (CAST) and employs simultaneous
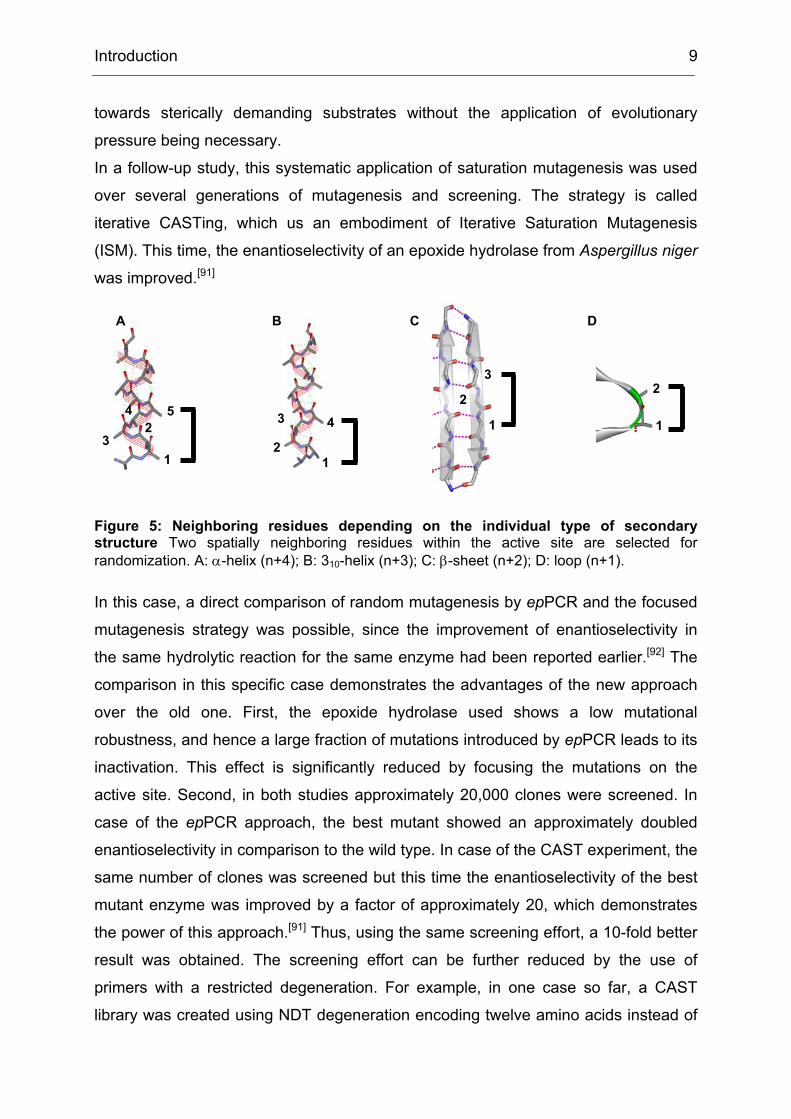
saturation mutagenesis of at least two spatially neighboring residues (see Figure 5).
By targeting residues in a radius smaller than 10 Å around the substrate binding site
the substrate scope of a lipase from Pseudomonas aeruginosa was expanded
Introduction 9
towards sterically demanding substrates without the application of evolutionary
pressure being necessary.
In a follow-up study, this systematic application of saturation mutagenesis was used
over several generations of mutagenesis and screening. The strategy is called
iterative CASTing, which us an embodiment of Iterative Saturation Mutagenesis
(ISM). This time, the enantioselectivity of an epoxide hydrolase from Aspergillus niger
was improved.[91]
1
23
1
2
4
12
3
1
254
31
23
1
2
4
12
3
1
254
3
Figure 5: Neighboring residues depending on the individual type of secondary structure Two spatially neighboring residues within the active site are selected for randomization. A: α-helix (n+4); B: 310-helix (n+3); C: β-sheet (n+2); D: loop (n+1).
In this case, a direct comparison of random mutagenesis by epPCR and the focused
mutagenesis strategy was possible, since the improvement of enantioselectivity in
the same hydrolytic reaction for the same enzyme had been reported earlier.[92] The
comparison in this specific case demonstrates the advantages of the new approach
over the old one. First, the epoxide hydrolase used shows a low mutational
robustness, and hence a large fraction of mutations introduced by epPCR leads to its
inactivation. This effect is significantly reduced by focusing the mutations on the
active site. Second, in both studies approximately 20,000 clones were screened. In
case of the epPCR approach, the best mutant showed an approximately doubled
enantioselectivity in comparison to the wild type. In case of the CAST experiment, the
same number of clones was screened but this time the enantioselectivity of the best
mutant enzyme was improved by a factor of approximately 20, which demonstrates
the power of this approach.[91] Thus, using the same screening effort, a 10-fold better
result was obtained. The screening effort can be further reduced by the use of
primers with a restricted degeneration. For example, in one case so far, a CAST
library was created using NDT degeneration encoding twelve amino acids instead of
A B C D
Introduction 10
the full set of codons encoding all possible amino acids.[93] This experiment was
likewise successful, indicating that at least for a first generation the diversity included
in a library can be restricted. In a recent work, the concept is expanded to improve
the thermostability of an enzyme, a property which is not linked to the active site. The
thermostability of the Bacillus subtilis lipase A was increased using Iterative
Saturation Mutagenesis at sites which were chosen based on their high B-factor
values in the crystal structure of the enzyme, which indicates a high mobility of the
given residue. Over several cycles of mutagenesis and screening the mesophilic
lipase was rendered hyperthermostable without loss of activity at room
temperature.[93]
Overall, the field of directed evolution is rapidly developing while the search for more
efficient strategies for library creation and screening continues. Currently, the
demands are to push the limitations of the methodology further ahead and to reduce
the effort needed to evolve a “standard” property such as the thermostability of an
enzyme.
Introduction 11
3 Monooxygenases – A Promising Class of Enzymes
Reactions catalyzed by oxygenase enzymes (mono- or dioxygenases) are interesting
for synthetic chemistry. There are numerous examples of such reactions in biological
systems, and there are few chemical reagents or catalysts that can compete with
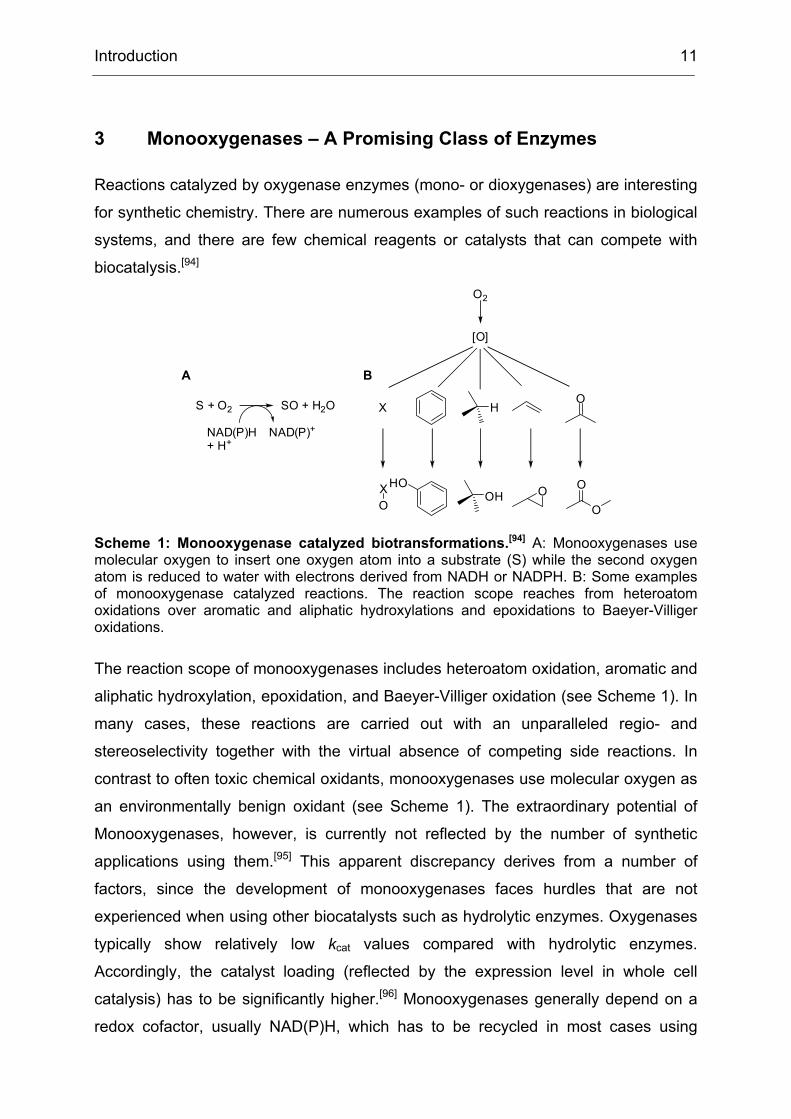
biocatalysis.[94] O2
[O]
X HO
X OHO
OOHO
O
S + O2
NAD(P)H+ H+
NAD(P)+
SO + H2O
A B
Scheme 1: Monooxygenase catalyzed biotransformations.[94] A: Monooxygenases use molecular oxygen to insert one oxygen atom into a substrate (S) while the second oxygen atom is reduced to water with electrons derived from NADH or NADPH. B: Some examples of monooxygenase catalyzed reactions. The reaction scope reaches from heteroatom oxidations over aromatic and aliphatic hydroxylations and epoxidations to Baeyer-Villiger oxidations.
The reaction scope of monooxygenases includes heteroatom oxidation, aromatic and
aliphatic hydroxylation, epoxidation, and Baeyer-Villiger oxidation (see Scheme 1). In
many cases, these reactions are carried out with an unparalleled regio- and
stereoselectivity together with the virtual absence of competing side reactions. In
contrast to often toxic chemical oxidants, monooxygenases use molecular oxygen as
an environmentally benign oxidant (see Scheme 1). The extraordinary potential of
Monooxygenases, however, is currently not reflected by the number of synthetic
applications using them.[95] This apparent discrepancy derives from a number of
factors, since the development of monooxygenases faces hurdles that are not
experienced when using other biocatalysts such as hydrolytic enzymes. Oxygenases
typically show relatively low kcat values compared with hydrolytic enzymes.
Accordingly, the catalyst loading (reflected by the expression level in whole cell
catalysis) has to be significantly higher.[96] Monooxygenases generally depend on a
redox cofactor, usually NAD(P)H, which has to be recycled in most cases using
Introduction 12
whole cells. At the beginning of a catalytic cycle, monooxygenases carry out the
reduction of molecular oxygen (see Scheme 1). Often, this process is partially
uncoupled from the oxidation of a substrate, which leads to the release of
hydrogenperoxide and waste of the redox cofactor.[97, 98] Another important factor is
the usually rather low stability of monooxygenases, which limits the turnover numbers
of the biocatalysts using whole cells or isolated enzymes.[99, 100] Heterologous
expression of monooxygenases can be difficult, in part because many of them are
multicomponent enzymes and in part because they might show toxic effects on the
expression host.[96] Numerous groups have developed oxidative biotransformations
using monooxygenases (for reviews see references [2, 6, 96, 99, 101, 102]), but the
technology for this promising class of enzymes can still be considered to be in its
infancy.
4 Baeyer-Villiger Monooxygenases
Baeyer-Villiger monooxygenases (BVMOs) are a familiy of flavin dependent
monooxygenases that is found in a variety of bacterial and fungal species.[103]
Bacterial BVMOs are part of the hydrocarbon or alcohol degrading pathways that
allow the cells to use these compounds as source of carbon and energy (see
Scheme 2).
OH NAD+ NADH ONADPHO2
NADP+
H2O
O
O
HOOH
OH2O
HOOH
O
OSCoA
O
BVMO
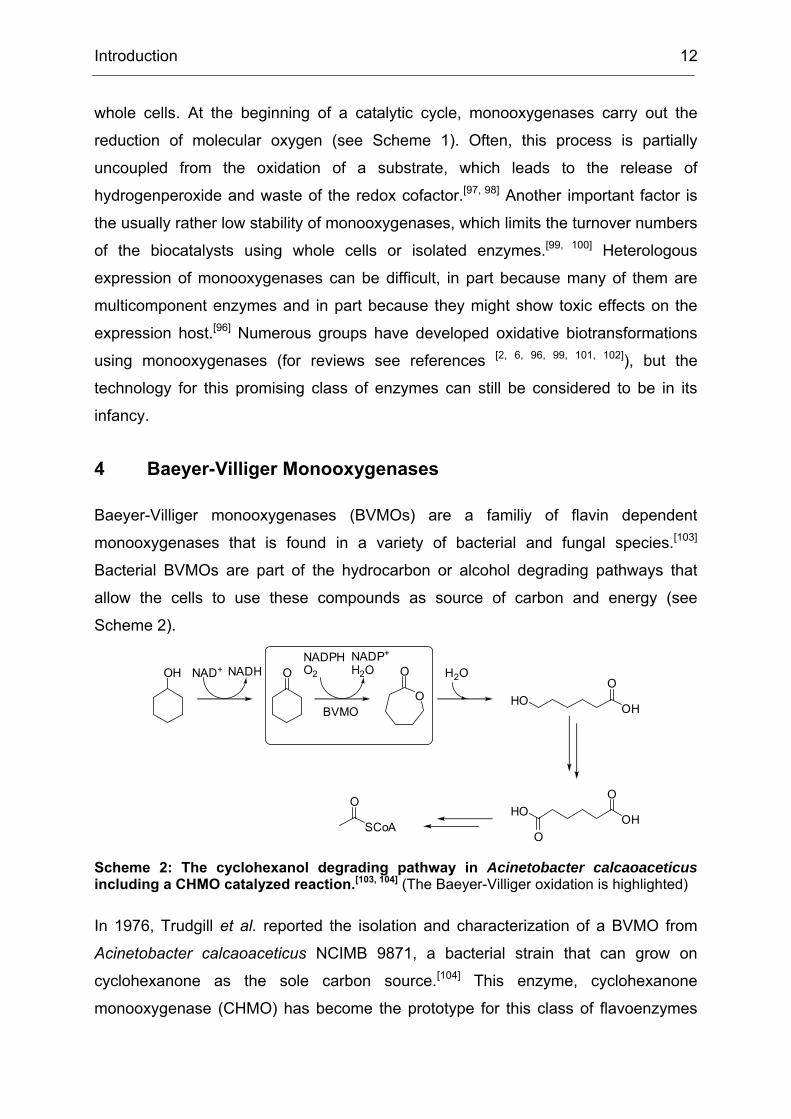
Scheme 2: The cyclohexanol degrading pathway in Acinetobacter calcaoaceticus including a CHMO catalyzed reaction.[103, 104] (The Baeyer-Villiger oxidation is highlighted)
In 1976, Trudgill et al. reported the isolation and characterization of a BVMO from
Acinetobacter calcaoaceticus NCIMB 9871, a bacterial strain that can grow on
cyclohexanone as the sole carbon source.[104] This enzyme, cyclohexanone
monooxygenase (CHMO) has become the prototype for this class of flavoenzymes
Introduction 13
and its mechanism and biochemical properties have been explored to some extent,
albeit the research was limited since no x-ray or NMR structures from this enzyme
familiy were available.[105-112]
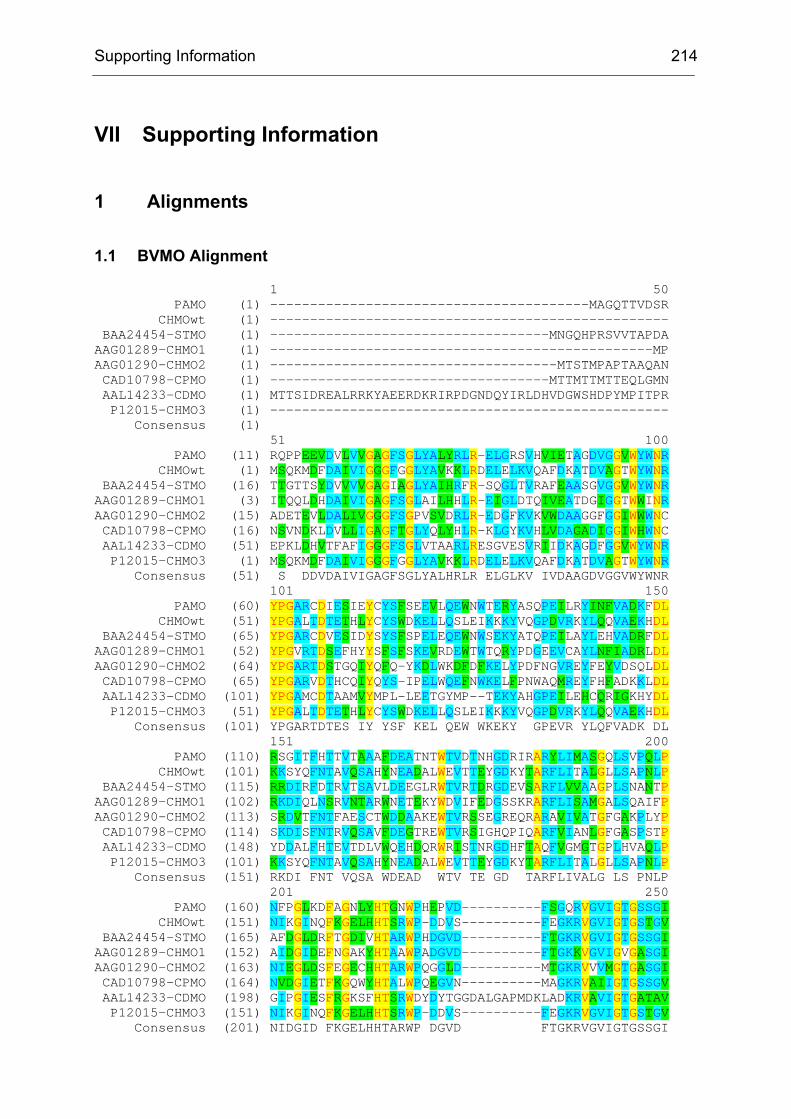
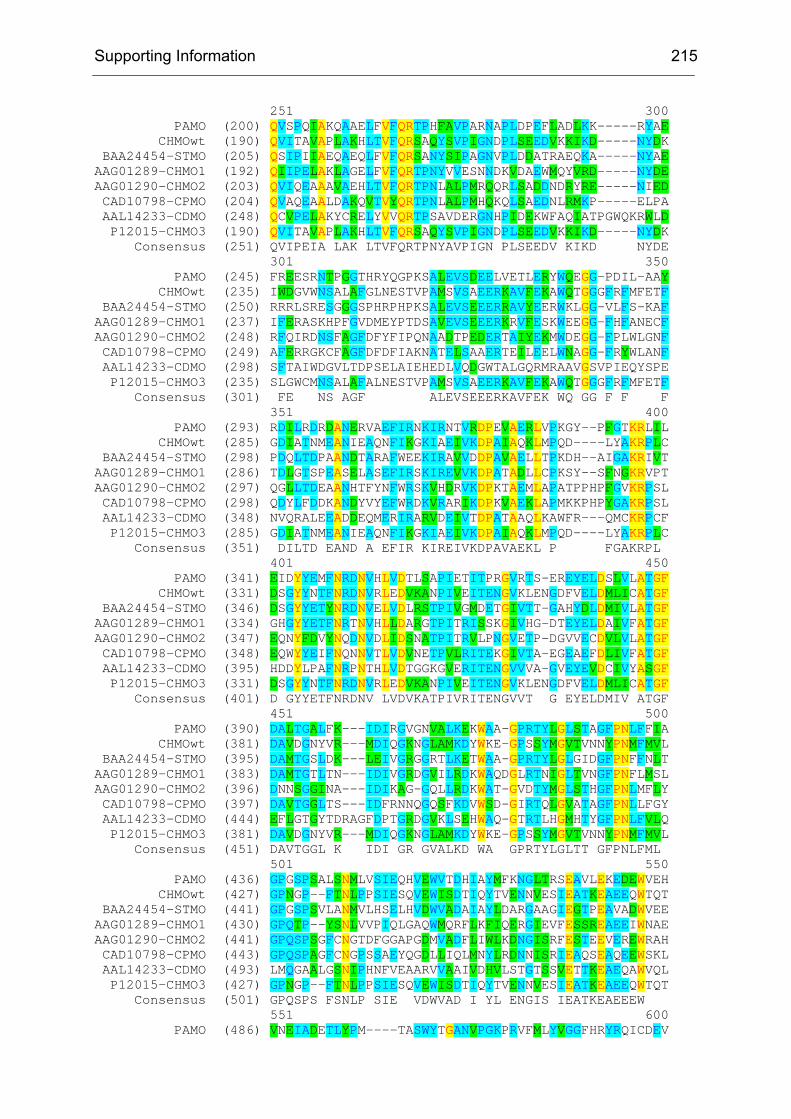
Since then, many different BVMOs were found and in some cases characterized.[20,
113-132] A number of them has been cloned and expressed, mainly in E. coli (see
Table 1).
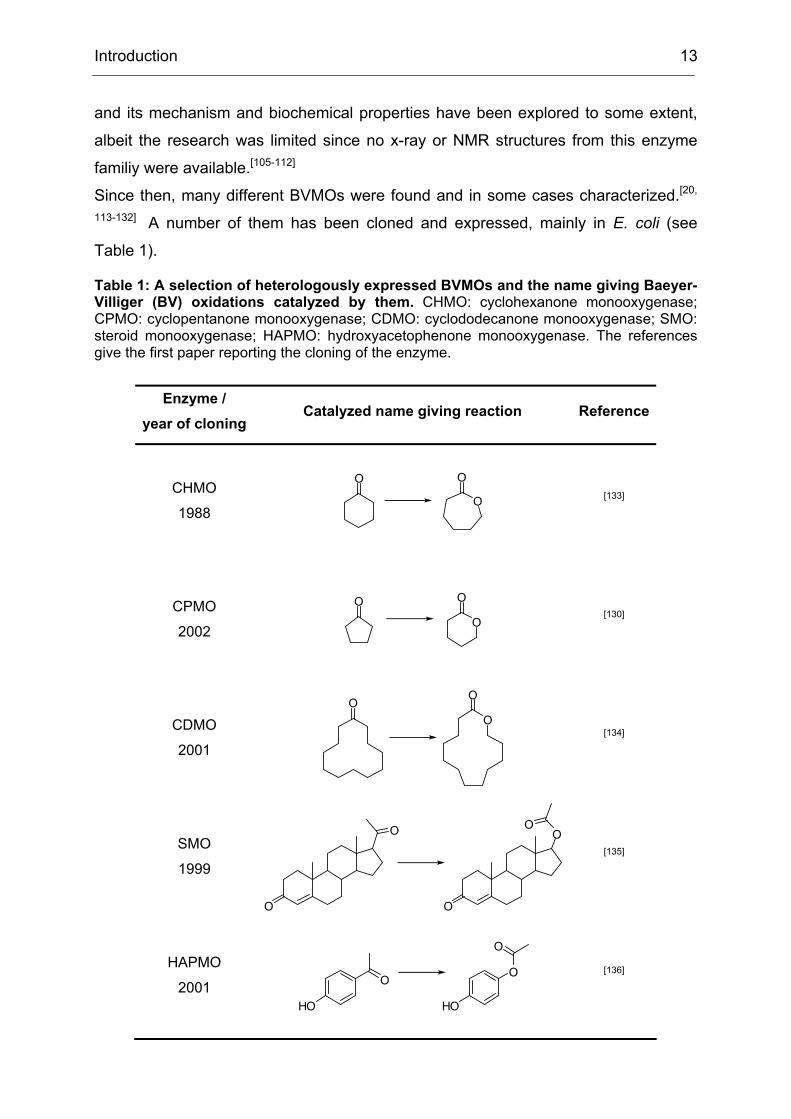
Table 1: A selection of heterologously expressed BVMOs and the name giving Baeyer-Villiger (BV) oxidations catalyzed by them. CHMO: cyclohexanone monooxygenase; CPMO: cyclopentanone monooxygenase; CDMO: cyclododecanone monooxygenase; SMO: steroid monooxygenase; HAPMO: hydroxyacetophenone monooxygenase. The references give the first paper reporting the cloning of the enzyme.
Enzyme / year of cloning
Catalyzed name giving reaction Reference
CHMO
1988
O
O
O
[133]
CPMO
2002
O
O
O
[130]
CDMO
2001
OO
O
[134]
SMO
1999
O
O
O
OO
[135]
HAPMO
2001 HO
O
HO
O
O
[136]
Introduction 14
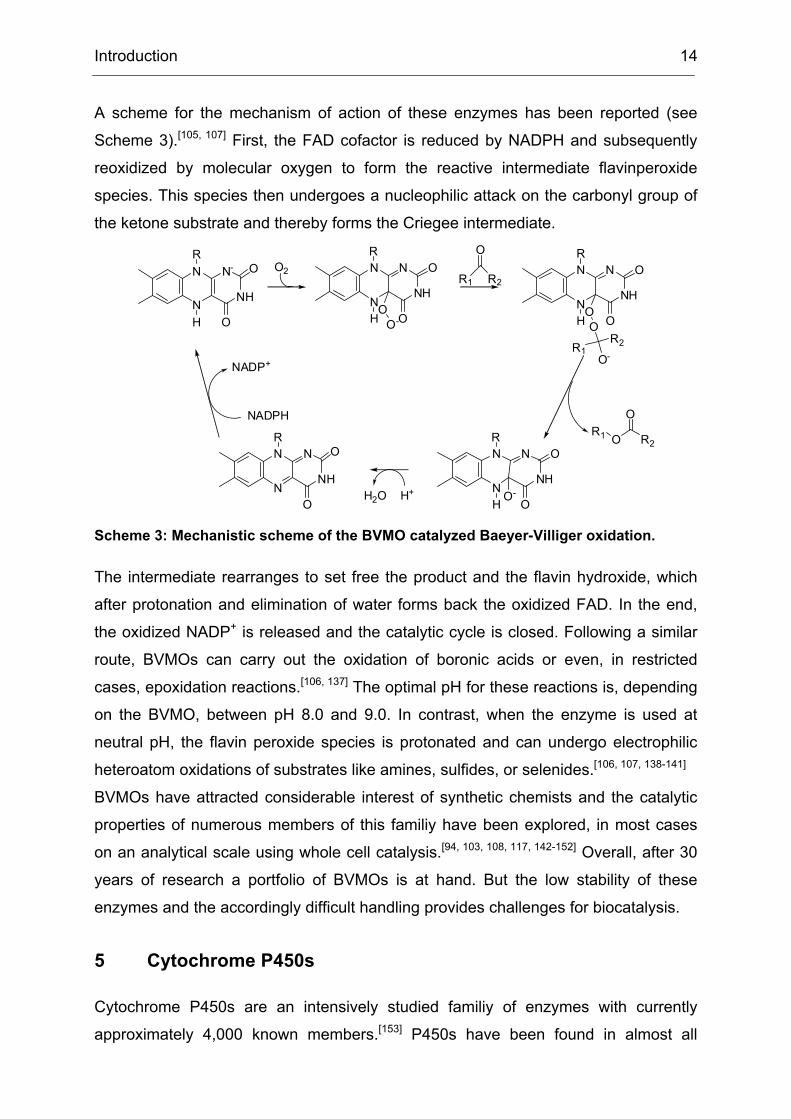
A scheme for the mechanism of action of these enzymes has been reported (see
Scheme 3).[105, 107] First, the FAD cofactor is reduced by NADPH and subsequently
reoxidized by molecular oxygen to form the reactive intermediate flavinperoxide
species. This species then undergoes a nucleophilic attack on the carbonyl group of
the ketone substrate and thereby forms the Criegee intermediate.
N
N
NH
N-R
H O
O2
N
N
NH
NR
H
O
OO
O-
O
N
N
NH
NR
H
O
OOO
R1
O
R2
R2R1O-
R1 O
O
R2
N
N
NH
NR
H
O
OO-N
N
NH
NR
O
O
H+H2O
NADPH
NADP+
Scheme 3: Mechanistic scheme of the BVMO catalyzed Baeyer-Villiger oxidation.
The intermediate rearranges to set free the product and the flavin hydroxide, which
after protonation and elimination of water forms back the oxidized FAD. In the end,
the oxidized NADP+ is released and the catalytic cycle is closed. Following a similar
route, BVMOs can carry out the oxidation of boronic acids or even, in restricted
cases, epoxidation reactions.[106, 137] The optimal pH for these reactions is, depending
on the BVMO, between pH 8.0 and 9.0. In contrast, when the enzyme is used at
neutral pH, the flavin peroxide species is protonated and can undergo electrophilic
heteroatom oxidations of substrates like amines, sulfides, or selenides.[106, 107, 138-141]
BVMOs have attracted considerable interest of synthetic chemists and the catalytic
properties of numerous members of this familiy have been explored, in most cases
on an analytical scale using whole cell catalysis.[94, 103, 108, 117, 142-152] Overall, after 30
years of research a portfolio of BVMOs is at hand. But the low stability of these
enzymes and the accordingly difficult handling provides challenges for biocatalysis.
5 Cytochrome P450s
Cytochrome P450s are an intensively studied familiy of enzymes with currently
approximately 4,000 known members.[153] P450s have been found in almost all
Introduction 15
branches of the “tree of life”, ranging from microorganisms over plants to
mammalians. They are abundant in eukariotic genomes (57 human P450 are
known), whereas their occurrence in prokaryotic genomes is comparably low (on the
average one P450 per sequenced genome, ~500 total). P450, iron heme containing
enzymes, became most kown for their efficiency in hydroxylation of non-activated
carbon centers, even though they can catalyze a variety of different reactions.[154]
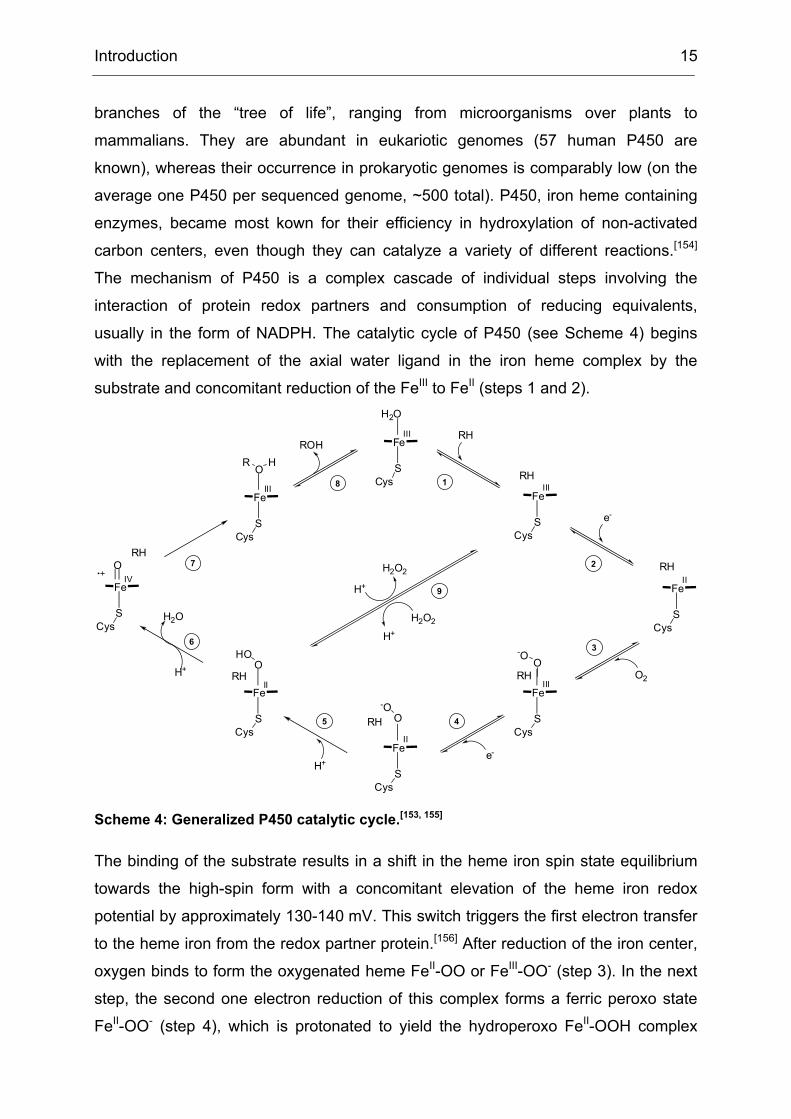
The mechanism of P450 is a complex cascade of individual steps involving the
interaction of protein redox partners and consumption of reducing equivalents,
usually in the form of NADPH. The catalytic cycle of P450 (see Scheme 4) begins
with the replacement of the axial water ligand in the iron heme complex by the
substrate and concomitant reduction of the FeIII to FeII (steps 1 and 2).
The binding of the substrate results in a shift in the heme iron spin state equilibrium
towards the high-spin form with a concomitant elevation of the heme iron redox
potential by approximately 130-140 mV. This switch triggers the first electron transfer
to the heme iron from the redox partner protein.[156] After reduction of the iron center,
oxygen binds to form the oxygenated heme FeII-OO or FeIII-OO- (step 3). In the next
step, the second one electron reduction of this complex forms a ferric peroxo state
FeII-OO- (step 4), which is protonated to yield the hydroperoxo FeII-OOH complex
Introduction 16
(step 5). In case of many P450, this species can be directly obtained by treatment
with hydrogen peroxide (“peroxide shunt pathway”, step 9). Following a second
protonation and elimination of water (step 6), the reactive species is formed, called
“Compound I”. This reactive species, presumably a FeIV-complex (see reference [153]
for a detailed discussion), carries out the actual hydroxylation reaction. Both electron
transfer steps (steps 2 and 4) are brought about by redox partner proteins. P450 from
different biological sources show different characteristics in these partner proteins.
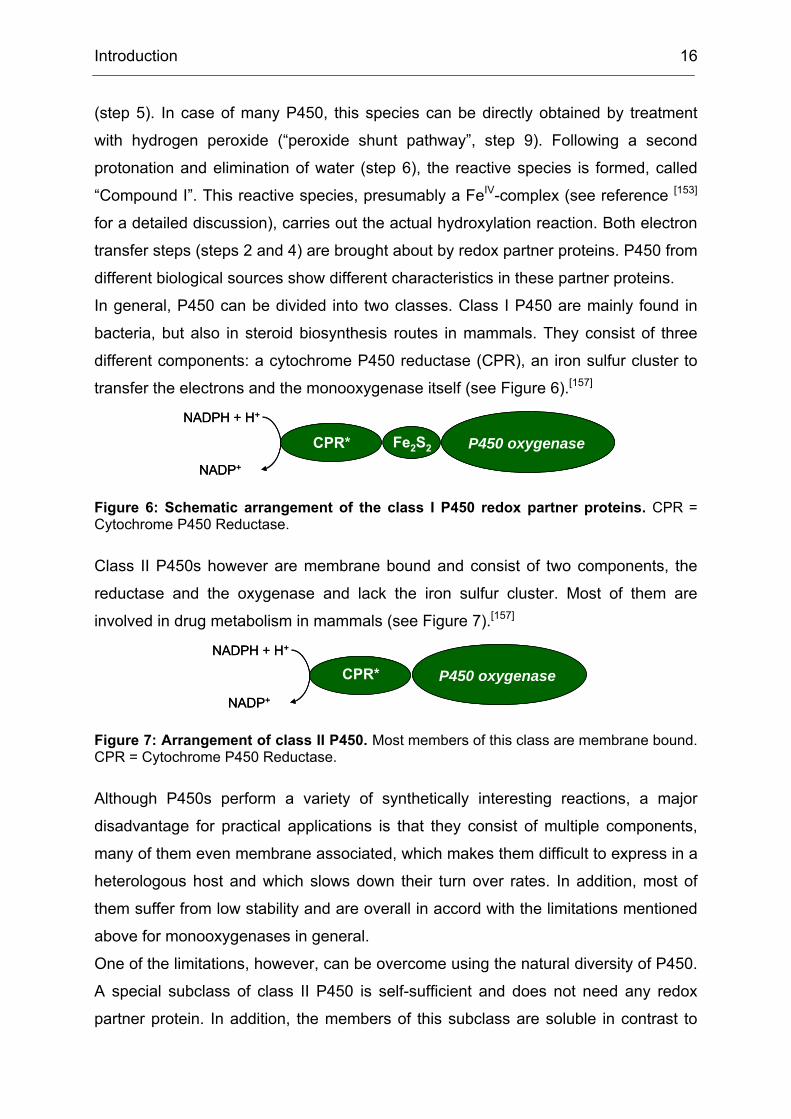
In general, P450 can be divided into two classes. Class I P450 are mainly found in
bacteria, but also in steroid biosynthesis routes in mammals. They consist of three
different components: a cytochrome P450 reductase (CPR), an iron sulfur cluster to
transfer the electrons and the monooxygenase itself (see Figure 6).[157]
NADPH + H+
NADP+
CPR* Fe2S2 P450 oxygenase
NADPH + H+
NADP+
CPR* Fe2S2 P450 oxygenase
Figure 6: Schematic arrangement of the class I P450 redox partner proteins. CPR = Cytochrome P450 Reductase.
Class II P450s however are membrane bound and consist of two components, the
reductase and the oxygenase and lack the iron sulfur cluster. Most of them are
involved in drug metabolism in mammals (see Figure 7).[157]
NADPH + H+
NADP+
CPR* P450 oxygenase
NADPH + H+
NADP+
CPR* P450 oxygenase
Figure 7: Arrangement of class II P450. Most members of this class are membrane bound. CPR = Cytochrome P450 Reductase.
Although P450s perform a variety of synthetically interesting reactions, a major
disadvantage for practical applications is that they consist of multiple components,
many of them even membrane associated, which makes them difficult to express in a
heterologous host and which slows down their turn over rates. In addition, most of
them suffer from low stability and are overall in accord with the limitations mentioned
above for monooxygenases in general.
One of the limitations, however, can be overcome using the natural diversity of P450.
A special subclass of class II P450 is self-sufficient and does not need any redox
partner protein. In addition, the members of this subclass are soluble in contrast to
Introduction 17
the other class II P450. Their prototype enzyme is P450 BM3 from Bacillus
megaterium (CYP102A1), identified in the 1980s by Fulco et al.[158, 159] In this
subclass, the CPR is fused to the monooxygenase forming a single polypeptide of
approximately 119 kDa size. This fusion arrangement enhances catalytic efficiency,
in terms of both reaction velocity (kcat) and coupling efficiency (i.e. less wastage of
reducing equivalents in non-product coupled reduction of oxygen). BM3 catalyzes the
hydroxylation of saturated fatty acids at subterminal positions at rates of up
to ~17,000 min− 1 (i.e. ~280 s− 1), which is at least two orders of magnitude faster than
observed for eukaryotic (CYP4) fatty acid hydroxylases.[160] The Km values of BM3 for
several fatty acid substrates are comparable to those for several eukaryotic fatty acid
hydroxylases (CYP4), but BM3’s much greater kcat values overall dramatically
improve the catalytic efficiency (kcat/KM). P450 BM3 is reduced by NADPH, with
electrons transferred to the FAD cofactor in its CPR domain. Electrons are
transferred singly from FAD to FMN within the CPR domain and then on to the heme
iron in the P450 domain.
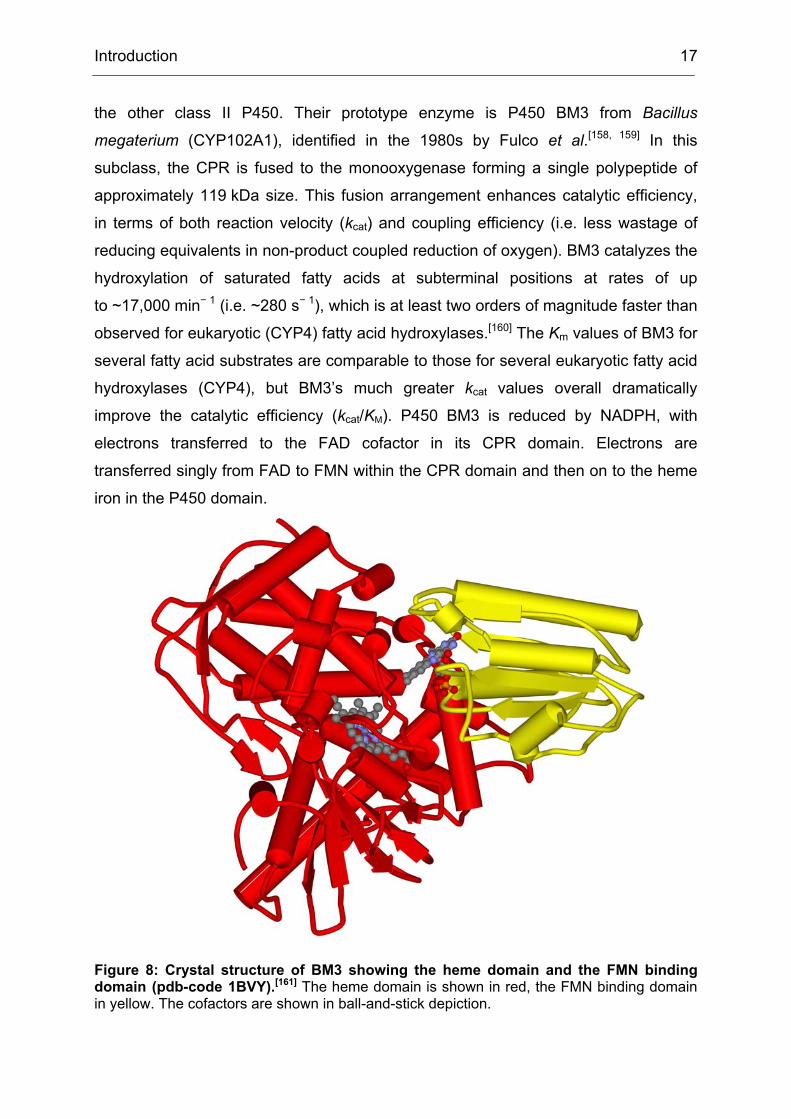
Figure 8: Crystal structure of BM3 showing the heme domain and the FMN binding domain (pdb-code 1BVY).[161] The heme domain is shown in red, the FMN binding domain in yellow. The cofactors are shown in ball-and-stick depiction.
Introduction 18
The x-ray structure of the heme domain of BM3 has been solved in the absence and
in the presence of a variety of different substrates or inhibitors and one structure of a
fusion between the heme domain and the FMN binding part has been reported (see
Figure 8; for a review on the structure of BM3 see reference [162]). However, the
structure of the complete BM3 remains to be solved. BM3 has been intensively
studied not just with the aim to elucidate its structure and mechanism but also with a
focus on biocatalysis. The motivation for this research is its high catalytic efficiency
which makes it superior to other P450 and its comparably good expressablility in
heterologous hosts. However, as the substrate scope of BM3 is rather narrow
(centered around long chain fatty acids), extensive enzyme engineering efforts,
mainly by directed evolution, were invested to improve this property (for reviews on
the engineering of BM3 see reference [101, 163]). BM3 variants which catalyze the
hydroxylation of small molecules such as ethane[164] or larger substrates[165] were
reported, demonstrating the potential of this approach. Nevertheless, the low
operational stability and the still very limited availability of BM3 variants with defined
properties leave many open questions for research on this exciting enzyme.
Introduction 19
6 Conceptual Formulation
This thesis deals with monooxygenases, specifically with Baeyer-Villiger
monooxygenases and Cytochrome P450s. In the introduction a number of factors
were described, which limit biocatalytic applications of this class of enzymes. Among
them was the lack of available enzymes for the enantioselective oxidation of defined
substrates, the low operational stability of available enzymes, and the cofactor
dependence that is always accompanying the use of redox enzymes. All of these
factors were addressed in this work.
The strategies that were applied were as diverse as the problem sets. Most important
was the engineering of Baeyer-Villiger monooxygenases by means of directed
evolution and rational design towards high enantioselectivity and a broadened
substrate scope. In addition, novel enzymes should be identified and cloned and
laboratory procedures should be developed which would make the synthetic
application of the developed enzymes feasible and would solve the problem of
cofactor dependence.
Results and Discussion 20
II Results and Discussion
PART I – Baeyer-Villiger Monooxygenases
Results and Discussion 21
1 Directed Evolution of Cyclohexanone Monooxygenase towards high Enantioselectivity
1.1 Introduction – CHMO as a Target Enzyme for Directed Evolution
Baeyer-Villiger monooxygenases (BVMOs) represent a largely unexplored class of
enzymes with respect to enzyme engineering. This is due to their size and complexity
on the one hand and due to the lack of structural information about them on the other
hand. In spite of intensive research since the time of their discovery, no useful
structural model could be devised to enable rational design of these enzymes.
Instead, researchers who wanted to develop new biocatalysts for Baeyer-Villiger
oxidations had to rely on the discovery of new enzymes from hitherto unknown
sources.
Therefore, we decided to develop a scheme for directed evolution of a BVMO. As the
model enzyme we chose Cyclohexanone Monooxygenase (CHMO) from
Acinetobacter calcaoaceticus NCIMB 9871 (accession code AB006902) for several
reasons. CHMO was the best studied BVMO, first described in the 1970s by Trudgill
and coworkers and a wealth of information was available concerning its biocatalytic
properties.[103-106, 108, 113, 117, 166-169] Second, the enzyme was expressable in an
appropriate host such as E. coli.[133, 170] The enantioselectivity of the enzyme was
chosen as the property that should to be improved. Even though CHMO-WT often
showed a remarkably high enantioselectivity, it inevitably failed to do so in a number
of cases in the oxidation of non-natural substrates. This would be a means to prove
the power of this strategy in enzyme engineering due to the above mentioned
complexity, both in terms of size and in handling, and in addition these experiments
would provide the scientific community with new enzymes as potentially better
biocatalysts.
Another reason that made the choice of CHMO as a target for directed evolution of a
BVMO reasonable was that this enzyme had a remarkably broad substrate scope.[103]
It has been described that the evolvability of an enzyme was partly a function of its
capacity to catalyze secondary reactions that did not initially contribute to the fitness
of the natural producer.[171] This was assumed, because these proteins required the
fewest mutations to adapt to novel reaction conditions, and therefore most likely
Results and Discussion 22
fulfilled artificial requirements such as a different enantioselectivity or even the
survival of environmental changes.
We decided to initially rely on error-prone PCR (epPCR) as the mutagenesis method.
Within this specific experimental framework this method for random mutagenesis had
significant advantages over alternative methods. Most importantly, it did not require
any knowledge about structure or mechanism of the enzyme and furthermore it was
quick and easy to apply and reliably yielded libraries with a scalable level of diversity
(depending on the mutagenesis rate during the epPCR as determined by the
distorting agent, for example excess MgCl2) combined with a high level of active
variants. Alternative methods such as homology independent recombination with
other BVMOs would have generated a higher diversity but at the same time a large
fraction of inactive enzyme variants due to frameshift mutations for example. This
effect would have been deleterious since the screening needed to rely on gas
chromatography. This analytical method could be parallelized and sped up in
comparison to the standard format that was in use for routine synthesis control but
nevertheless represented rather a medium-throughput than a high-throughput
format.[42]
The goals of the project were as follows. We expected on the one hand to identify hot
spots in the sequence of CHMO that would allow for later, more rationalized, enzyme
engineering approaches. On the other hand we strove for synthetically useful
biocatalysts as an improved alternative to CHMO-WT.
Results and Discussion 23
1.2 Generation and Screening of epPCR libraries
The work described in this chapter is mainly based on the results of T. Schneider and
B. Brunner.[172]
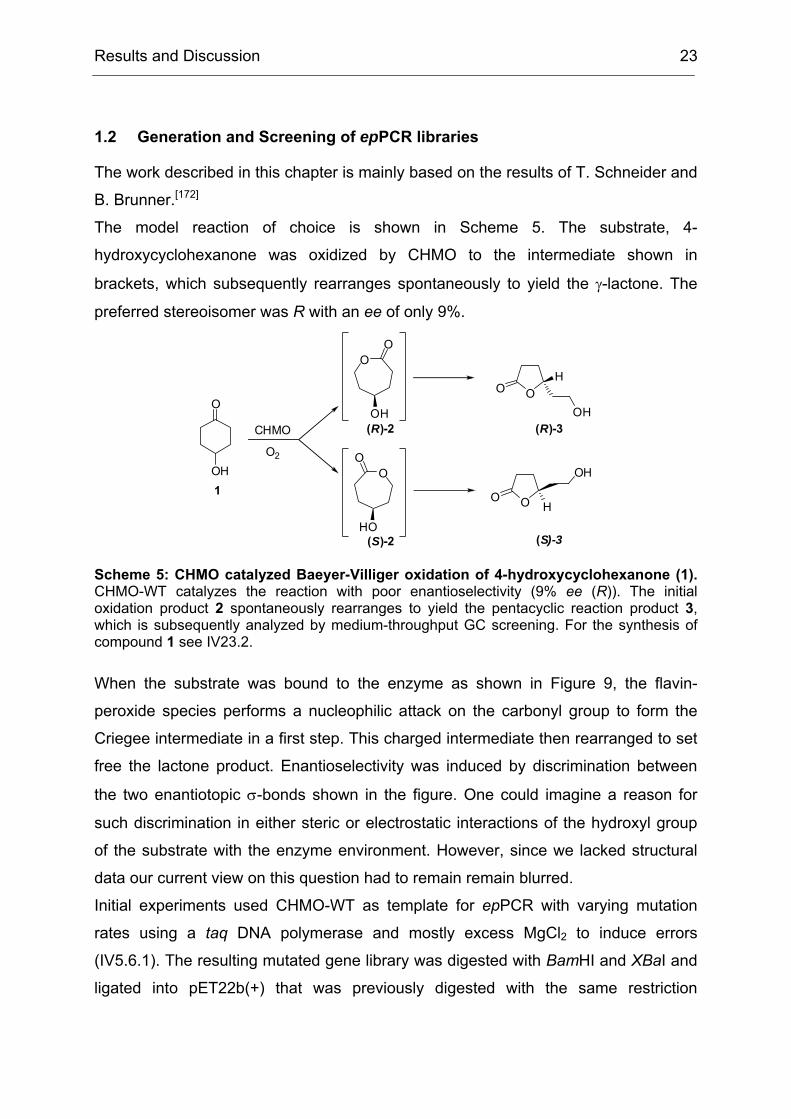
The model reaction of choice is shown in Scheme 5. The substrate, 4-
hydroxycyclohexanone was oxidized by CHMO to the intermediate shown in
brackets, which subsequently rearranges spontaneously to yield the γ-lactone. The
preferred stereoisomer was R with an ee of only 9%.
O
OH
CHMO
O2
OO
OH
OO
HO
OOH
OH
OOH
OH
(R)-2
(S)-2
(R)-3
(S)-3
1
Scheme 5: CHMO catalyzed Baeyer-Villiger oxidation of 4-hydroxycyclohexanone (1). CHMO-WT catalyzes the reaction with poor enantioselectivity (9% ee (R)). The initial oxidation product 2 spontaneously rearranges to yield the pentacyclic reaction product 3, which is subsequently analyzed by medium-throughput GC screening. For the synthesis of compound 1 see IV23.2.
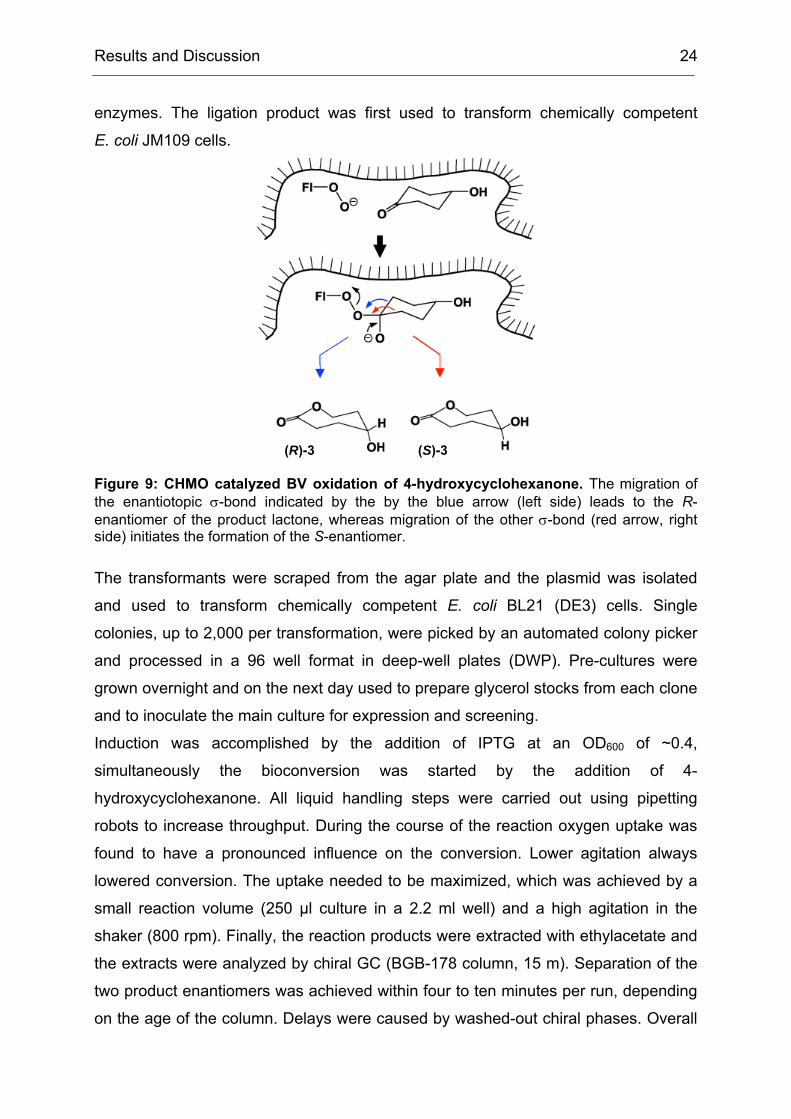
When the substrate was bound to the enzyme as shown in Figure 9, the flavin-
peroxide species performs a nucleophilic attack on the carbonyl group to form the
Criegee intermediate in a first step. This charged intermediate then rearranged to set
free the lactone product. Enantioselectivity was induced by discrimination between
the two enantiotopic σ-bonds shown in the figure. One could imagine a reason for
such discrimination in either steric or electrostatic interactions of the hydroxyl group
of the substrate with the enzyme environment. However, since we lacked structural
data our current view on this question had to remain remain blurred.
Initial experiments used CHMO-WT as template for epPCR with varying mutation
rates using a taq DNA polymerase and mostly excess MgCl2 to induce errors
(IV5.6.1). The resulting mutated gene library was digested with BamHI and XBaI and
ligated into pET22b(+) that was previously digested with the same restriction
Results and Discussion 24
enzymes. The ligation product was first used to transform chemically competent
E. coli JM109 cells.
Figure 9: CHMO catalyzed BV oxidation of 4-hydroxycyclohexanone. The migration of the enantiotopic σ-bond indicated by the by the blue arrow (left side) leads to the R-enantiomer of the product lactone, whereas migration of the other σ-bond (red arrow, right side) initiates the formation of the S-enantiomer.
The transformants were scraped from the agar plate and the plasmid was isolated
and used to transform chemically competent E. coli BL21 (DE3) cells. Single
colonies, up to 2,000 per transformation, were picked by an automated colony picker
and processed in a 96 well format in deep-well plates (DWP). Pre-cultures were
grown overnight and on the next day used to prepare glycerol stocks from each clone
and to inoculate the main culture for expression and screening.
Induction was accomplished by the addition of IPTG at an OD600 of ~0.4,
simultaneously the bioconversion was started by the addition of 4-
hydroxycyclohexanone. All liquid handling steps were carried out using pipetting
robots to increase throughput. During the course of the reaction oxygen uptake was
found to have a pronounced influence on the conversion. Lower agitation always
lowered conversion. The uptake needed to be maximized, which was achieved by a
small reaction volume (250 µl culture in a 2.2 ml well) and a high agitation in the
shaker (800 rpm). Finally, the reaction products were extracted with ethylacetate and
the extracts were analyzed by chiral GC (BGB-178 column, 15 m). Separation of the
two product enantiomers was achieved within four to ten minutes per run, depending
on the age of the column. Delays were caused by washed-out chiral phases. Overall
(R)-3 (S)-3
Results and Discussion 25
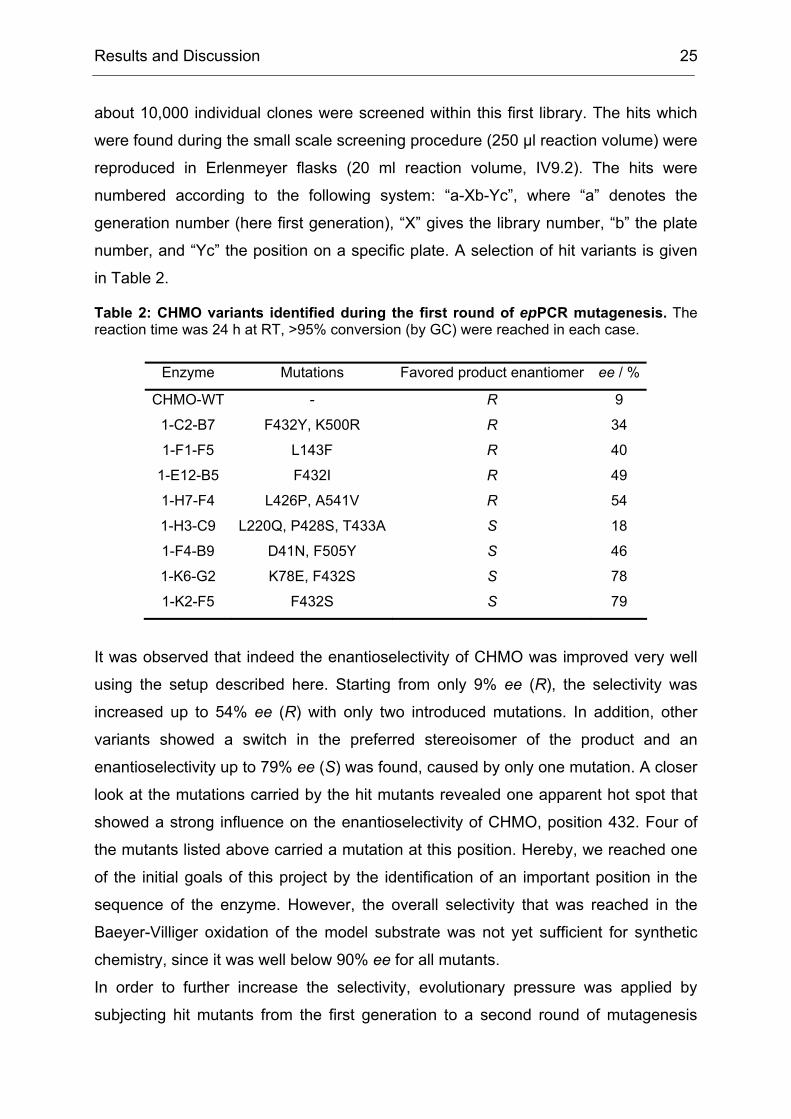
about 10,000 individual clones were screened within this first library. The hits which
were found during the small scale screening procedure (250 µl reaction volume) were
reproduced in Erlenmeyer flasks (20 ml reaction volume, IV9.2). The hits were
numbered according to the following system: “a-Xb-Yc”, where “a” denotes the
generation number (here first generation), “X” gives the library number, “b” the plate
number, and “Yc” the position on a specific plate. A selection of hit variants is given
in Table 2.
Table 2: CHMO variants identified during the first round of epPCR mutagenesis. The reaction time was 24 h at RT, >95% conversion (by GC) were reached in each case.
Enzyme Mutations Favored product enantiomer ee / %
CHMO-WT - R 9
1-C2-B7 F432Y, K500R R 34
1-F1-F5 L143F R 40
1-E12-B5 F432I R 49
1-H7-F4 L426P, A541V R 54
1-H3-C9 L220Q, P428S, T433A S 18
1-F4-B9 D41N, F505Y S 46
1-K6-G2 K78E, F432S S 78
1-K2-F5 F432S S 79
It was observed that indeed the enantioselectivity of CHMO was improved very well
using the setup described here. Starting from only 9% ee (R), the selectivity was
increased up to 54% ee (R) with only two introduced mutations. In addition, other
variants showed a switch in the preferred stereoisomer of the product and an
enantioselectivity up to 79% ee (S) was found, caused by only one mutation. A closer
look at the mutations carried by the hit mutants revealed one apparent hot spot that
showed a strong influence on the enantioselectivity of CHMO, position 432. Four of
the mutants listed above carried a mutation at this position. Hereby, we reached one
of the initial goals of this project by the identification of an important position in the
sequence of the enzyme. However, the overall selectivity that was reached in the
Baeyer-Villiger oxidation of the model substrate was not yet sufficient for synthetic
chemistry, since it was well below 90% ee for all mutants.
In order to further increase the selectivity, evolutionary pressure was applied by
subjecting hit mutants from the first generation to a second round of mutagenesis
Results and Discussion 26
and screening. Libraries were created based on all R-selective mutants and on one
S-selective variant from the first generation (1-K2-F5; see Table 2). In the creation of
these libraries the first difficulties were encountered due to a significant number of
inactive second generation mutants, which caused a complete failure of screening in
case of several libraries, and due to a lowered reproducibility of the ee-values
measured by the chiral GC screening (see II1.4). In a library based on 1-F1-F5 a
variant could be identified that showed a major increase in enantioselectivity. In detail
the model substrate was oxidized with an ee-value of 90% (R). This second-
generation variant 2-D19-E6 carried overall four mutations, three new ones (E292G,
L435Q, T464A) were added to the L143F mutation of 1-F1-F5. An attempt to
increase the enantioselectivity to values even higher than 90% ee by constructing a
third generation based on 2-D19-E6 failed. The fraction of active mutants in all
libraries (high and low mutation rates) was between 1% and 10% and no mutants
with an increased selectivity were found within the 2,400 mutants screened.
Overall, the directed evolution of CHMO towards higher enantioselectivity in the
oxidation of a non-natural substrate was successful. Both initial goals were reached.
The enantioselectivity of the enzyme was significantly improved and a number of hot
spots in its sequence were identified. Based on the knowledge about these hot spots
the opportunity of saturation mutagenesis was opened up.
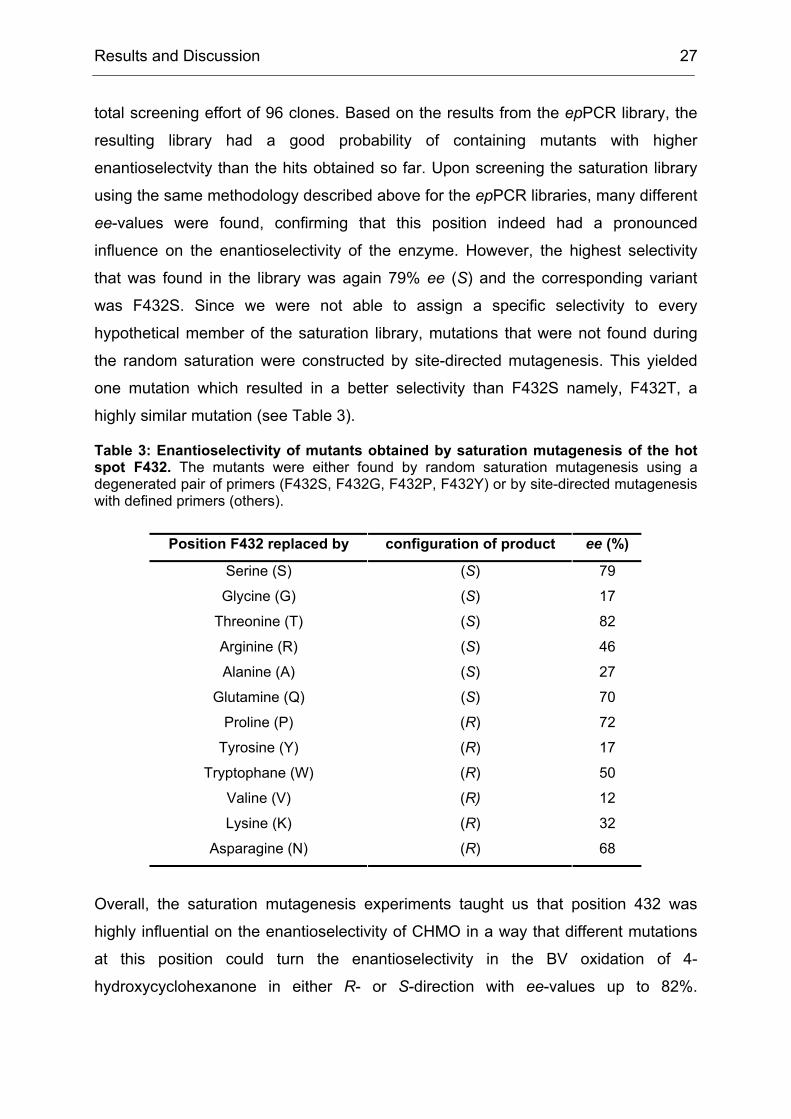
1.3 Saturation Mutagenesis of selected Hot spots – How to Draw Conclusions from Random Mutagenesis
Position 432 in CHMO-WT was subjected to saturation mutagenesis. For this
purpose, a degenerate pair of primers was used and the mutagenesis was carried
out by whole-plasmid amplification (IV5.6.2). The degeneracy used for these primers
was NNK (IUPAC code; 32 codons, 20 AA encoded, 1 stop codon included).[173]
When such a library was constructed the goal was that all possible mutants were
represented. This could not be taken for granted when only a number of colonies was
screened that corresponded to the number of codons encoded by the mutagenic
primers, in case of a NNK degeneration for example 32. Bosley and Ostermeier have
developed mathematical expressions that helped in the calculation of the probability,
that in a library of a given size all different codons were included.[174] Usually a 95%
probability of complete coverage of a library was sufficient, which required a three-
fold so called oversampling of a library, which meant in case of 32 different codons a
Results and Discussion 27
total screening effort of 96 clones. Based on the results from the epPCR library, the
resulting library had a good probability of containing mutants with higher
enantioselectvity than the hits obtained so far. Upon screening the saturation library
using the same methodology described above for the epPCR libraries, many different
ee-values were found, confirming that this position indeed had a pronounced
influence on the enantioselectivity of the enzyme. However, the highest selectivity
that was found in the library was again 79% ee (S) and the corresponding variant
was F432S. Since we were not able to assign a specific selectivity to every
hypothetical member of the saturation library, mutations that were not found during
the random saturation were constructed by site-directed mutagenesis. This yielded
one mutation which resulted in a better selectivity than F432S namely, F432T, a
highly similar mutation (see Table 3).
Table 3: Enantioselectivity of mutants obtained by saturation mutagenesis of the hot spot F432. The mutants were either found by random saturation mutagenesis using a degenerated pair of primers (F432S, F432G, F432P, F432Y) or by site-directed mutagenesis with defined primers (others).
Position F432 replaced by configuration of product ee (%)
Serine (S) (S) 79
Glycine (G) (S) 17
Threonine (T) (S) 82
Arginine (R) (S) 46
Alanine (A) (S) 27
Glutamine (Q) (S) 70
Proline (P) (R) 72
Tyrosine (Y) (R) 17
Tryptophane (W) (R) 50
Valine (V) (R) 12
Lysine (K) (R) 32
Asparagine (N) (R) 68
Overall, the saturation mutagenesis experiments taught us that position 432 was
highly influential on the enantioselectivity of CHMO in a way that different mutations
at this position could turn the enantioselectivity in the BV oxidation of 4-
hydroxycyclohexanone in either R- or S-direction with ee-values up to 82%.
Results and Discussion 28
However, a mutation at this position alone did not resulted in a selectivity on a
preparatively useful level, which would be well above 90% ee.
1.4 Limitations of Directed Evolution of CHMO
A continuation of the directed evolution project of CHMO towards an even higher
stereoselectivity in the model reaction (Scheme 5) was initially anticipated but finally
hampered by two difficulties. First, the fraction of inactive mutants in the libraries
which were created in the second generation and especially in the third generation
were overwhelmingly high, which led to a reduced efficiency of the GC-screening
system. An agar plate based pre-screening system for activity was tested based on a
change of pH upon formation of ε-caprolactone catalyzed by CHMO followed by
hydrolysis of the lactone by pig liver esterase.[175] However, this system did not yield
reproducible results on agar plates which hampered its applicability in screening
large numbers of clones in a short amount of time. The utility of our GC-based
screening system on the other hand was hampered by its inherently low throughput
compared to systems which were available for lipase screening, for example.[44]
Considering the low number of active mutants (~ 1 active clone per 96 wells) and the
average GC run time the screening system became too inefficient. This finding was
in accordance with studies which demonstrated that a thermostable enzyme was
easier to evolve (see II1.1).[171, 176-178] It was found that the level of soluble expression
of the second generation variant 2-D19-E6 was significantly lower than of CHMO-
WT, a value that usually correlated with thermostability. Therefore, in the end of this
project it was found that another factor has a pronounced influence on the
evolvability of CHMO namely, the thermstability of the enzyme. CHMO is an unstable
protein, a common property of all BVMOs known at the beginning of the project,
which was in the end found to limit its laboratory evolution.
Not an inherent but an experimental reason why the project was stopped on this level
was the use of the GC based screening system because of its insufficient sensitivity.
The concentration of the minor enantiomer in the reaction mixture was that low when
using highly selective CHMO mutants that under the conditions used during the
screening of the first generation an ee-value of 80% was not reproducibly
distinguishable from an ee-value of 95%. This was mainly because the mutants from
these libraries were not sufficiently active anymore, which led to a decrease of
conversion. An increase of the reaction scale was limited to 500 µl by the oxygen
Results and Discussion 29
uptake that was necessary to drive the reaction. Thus, doubling the scale from 250 µl
to 500 µl improved the chromatography slightly, but nevertheless the reproducibility
of the system was low (see Table 4). Overall we decided to stop the project at this
already advanced level. Instead of driving the directed evolution further, experiments
were started to investigate the properties of the mutants obtained so far.
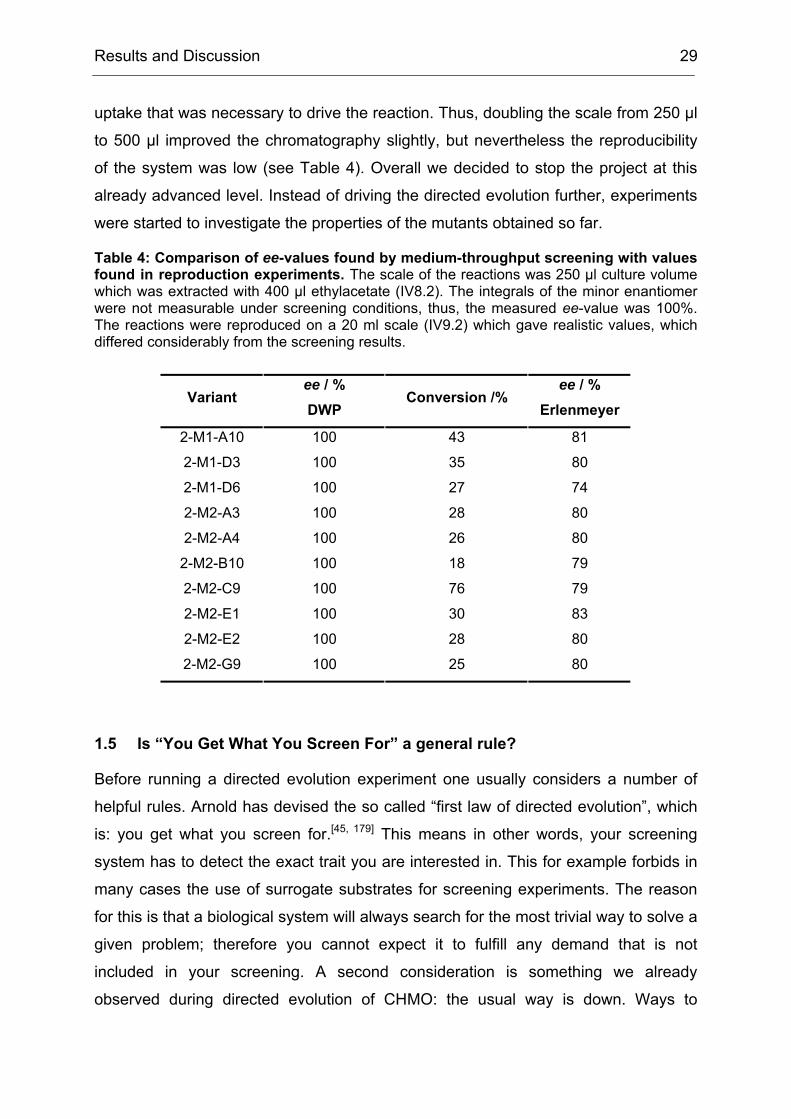
Table 4: Comparison of ee-values found by medium-throughput screening with values found in reproduction experiments. The scale of the reactions was 250 µl culture volume which was extracted with 400 µl ethylacetate (IV8.2). The integrals of the minor enantiomer were not measurable under screening conditions, thus, the measured ee-value was 100%. The reactions were reproduced on a 20 ml scale (IV9.2) which gave realistic values, which differed considerably from the screening results.
Variant ee / % DWP
Conversion /% ee / %
Erlenmeyer
2-M1-A10 100 43 81
2-M1-D3 100 35 80
2-M1-D6 100 27 74
2-M2-A3 100 28 80
2-M2-A4 100 26 80
2-M2-B10 100 18 79
2-M2-C9 100 76 79
2-M2-E1 100 30 83
2-M2-E2 100 28 80
2-M2-G9 100 25 80
1.5 Is “You Get What You Screen For” a general rule?
Before running a directed evolution experiment one usually considers a number of
helpful rules. Arnold has devised the so called “first law of directed evolution”, which
is: you get what you screen for.[45, 179] This means in other words, your screening
system has to detect the exact trait you are interested in. This for example forbids in
many cases the use of surrogate substrates for screening experiments. The reason
for this is that a biological system will always search for the most trivial way to solve a
given problem; therefore you cannot expect it to fulfill any demand that is not
included in your screening. A second consideration is something we already
observed during directed evolution of CHMO: the usual way is down. Ways to
Results and Discussion 30
improve a given enzyme are few, because enzymes are already finely tuned by
natural evolution.
However, we started to explore the catalytic profile of the CHMO variants which we
obtained by laboratory evolution. In detail, we were interested if they would have lost
properties of CHMO-WT and tested the BV oxidation of a number of different
substrates for the wild type. In a first experiment, the oxidation of 4-
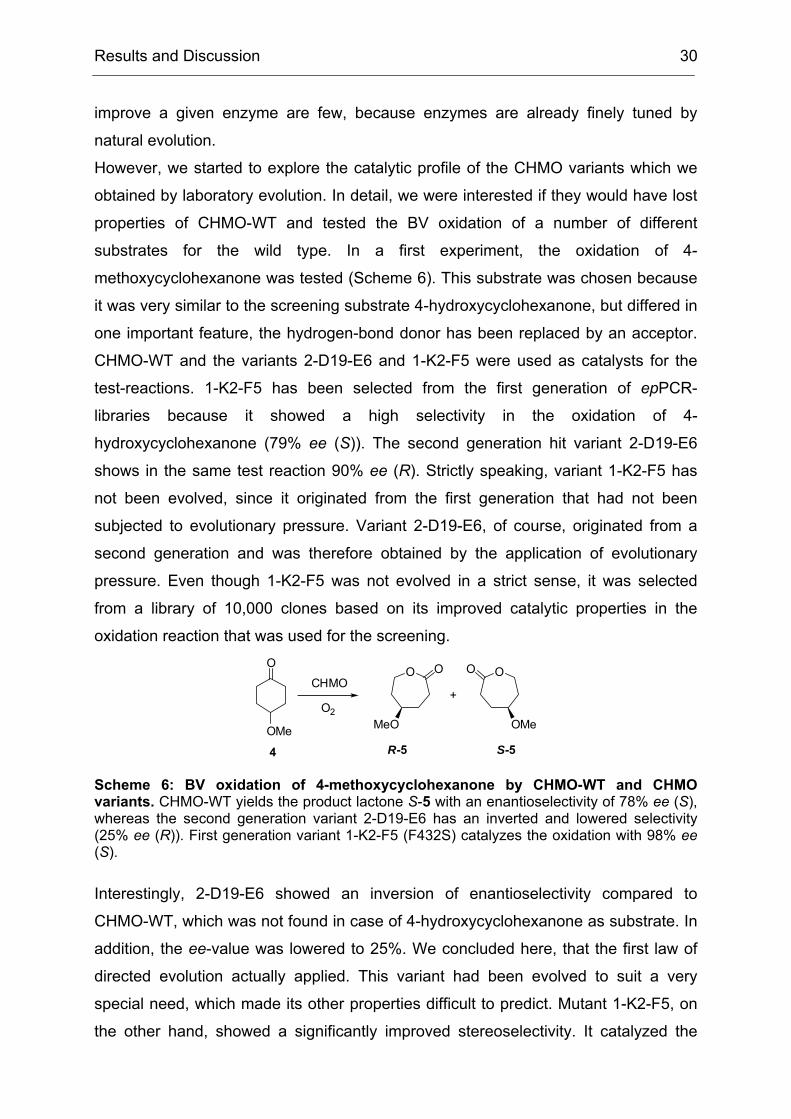
methoxycyclohexanone was tested (Scheme 6). This substrate was chosen because
it was very similar to the screening substrate 4-hydroxycyclohexanone, but differed in
one important feature, the hydrogen-bond donor has been replaced by an acceptor.
CHMO-WT and the variants 2-D19-E6 and 1-K2-F5 were used as catalysts for the
test-reactions. 1-K2-F5 has been selected from the first generation of epPCR-
libraries because it showed a high selectivity in the oxidation of 4-
hydroxycyclohexanone (79% ee (S)). The second generation hit variant 2-D19-E6
shows in the same test reaction 90% ee (R). Strictly speaking, variant 1-K2-F5 has
not been evolved, since it originated from the first generation that had not been
subjected to evolutionary pressure. Variant 2-D19-E6, of course, originated from a
second generation and was therefore obtained by the application of evolutionary
pressure. Even though 1-K2-F5 was not evolved in a strict sense, it was selected
from a library of 10,000 clones based on its improved catalytic properties in the
oxidation reaction that was used for the screening. O
OMe
O O
MeO
OO
OMe
+
S-5
CHMO
O2
4 R-5
Scheme 6: BV oxidation of 4-methoxycyclohexanone by CHMO-WT and CHMO variants. CHMO-WT yields the product lactone S-5 with an enantioselectivity of 78% ee (S), whereas the second generation variant 2-D19-E6 has an inverted and lowered selectivity (25% ee (R)). First generation variant 1-K2-F5 (F432S) catalyzes the oxidation with 98% ee (S).
Interestingly, 2-D19-E6 showed an inversion of enantioselectivity compared to
CHMO-WT, which was not found in case of 4-hydroxycyclohexanone as substrate. In
addition, the ee-value was lowered to 25%. We concluded here, that the first law of
directed evolution actually applied. This variant had been evolved to suit a very
special need, which made its other properties difficult to predict. Mutant 1-K2-F5, on
the other hand, showed a significantly improved stereoselectivity. It catalyzed the
Results and Discussion 31
oxidation of 4-methoxycyclohexanone with an even higher ee-value than the model
substrate in the screening reaction (98.6% ee (S)). Could we conclude here, that
instead of having picked a mutant with an increased selectivity in the oxidation of the
specific screening substrate, we have found a mutant with an increased selectivity in
the oxidation of more than one substrate? Maybe even a mutant with a generally
increased enantioselectivity within the limitations of the substrate scope? More
experiments were necessary to address this question.
The next substrates that were oxidized using 1-K2-F5 as catalyst were other
cyclohexanone derivatives with different substituents at C-4 (Scheme 7). It was
found, that the high enantioselectivity that is observed when using CHMO-WT is not
significantly altered when 1-K2-F5 is used instead (95-99% ee).
R = -Me; -Et;-Cl; -Br; -I
O
R
O O
R
OO
R
+
S-7
CHMO
O2
6 R-7
Scheme 7: Reactions catalyzed by both CHMO-WT and CHMO 1-K2-F5 mutant. The enantioselectivity of the oxidation reactions remains in the same range.
These results encouraged us to more closely investigate the catalytic profile of not
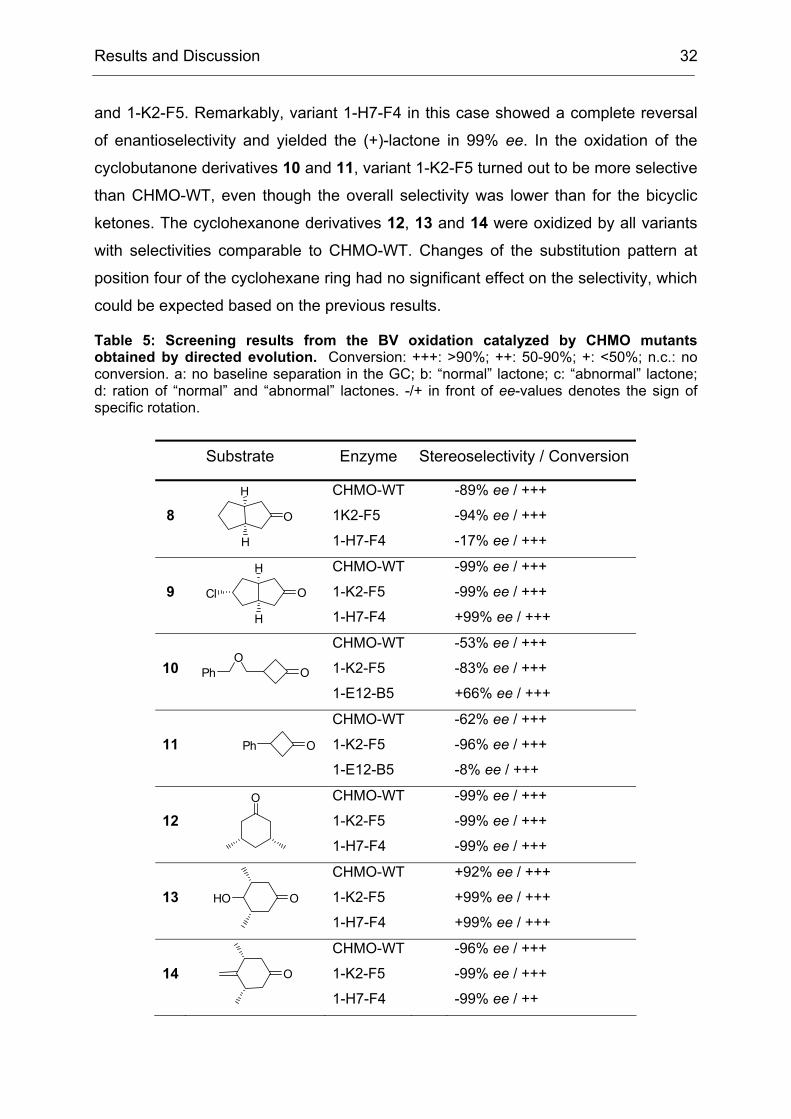
just 1-K2-F5 but of all mutants listed in Table 2. In collaboration with the group of
M. Mihovilovic in Vienna, Austria, all these mutants were subjected to a substrate
screening using a number of substrates of synthetic interest, among them
monocyclic, bicyclic, and tricyclic ketones with up to three chiral centers (see Table
5). For this screening, the CHMO variants were expressed on a 1 ml culture scale
and the oxidations were carried out with 0.5 mg of each substrate, in each case one
equivalent of β-cyclodextrin was added to facilitate solubility of the hydrophobic
substrates.[180] This scale was sufficiently comparable with shaking flask cultivation
and at the same time allowed for an increased throughput when 24-well plates were
used. Besides this, the reactions were carried out as described above (II1.2, for a
detailed protocol see IV8). Conversion of the 5,5’-bicycloketone 8 with CHMO-WT
gave the corresponding (-)-lactone with a good yield and enantioselectivity. Mutant 1-
K2-F5 (F432S) showed a slightly increased enantioselectivity, whereas 1-H7-F4
(L426P/A541V) showed a significant decrease in selectivity. The more lipophilic
ketone 9 was oxidized with almost complete enantioselectivity by both, CHMO-WT
Results and Discussion 32
and 1-K2-F5. Remarkably, variant 1-H7-F4 in this case showed a complete reversal
of enantioselectivity and yielded the (+)-lactone in 99% ee. In the oxidation of the
cyclobutanone derivatives 10 and 11, variant 1-K2-F5 turned out to be more selective
than CHMO-WT, even though the overall selectivity was lower than for the bicyclic
ketones. The cyclohexanone derivatives 12, 13 and 14 were oxidized by all variants
with selectivities comparable to CHMO-WT. Changes of the substitution pattern at
position four of the cyclohexane ring had no significant effect on the selectivity, which
could be expected based on the previous results.
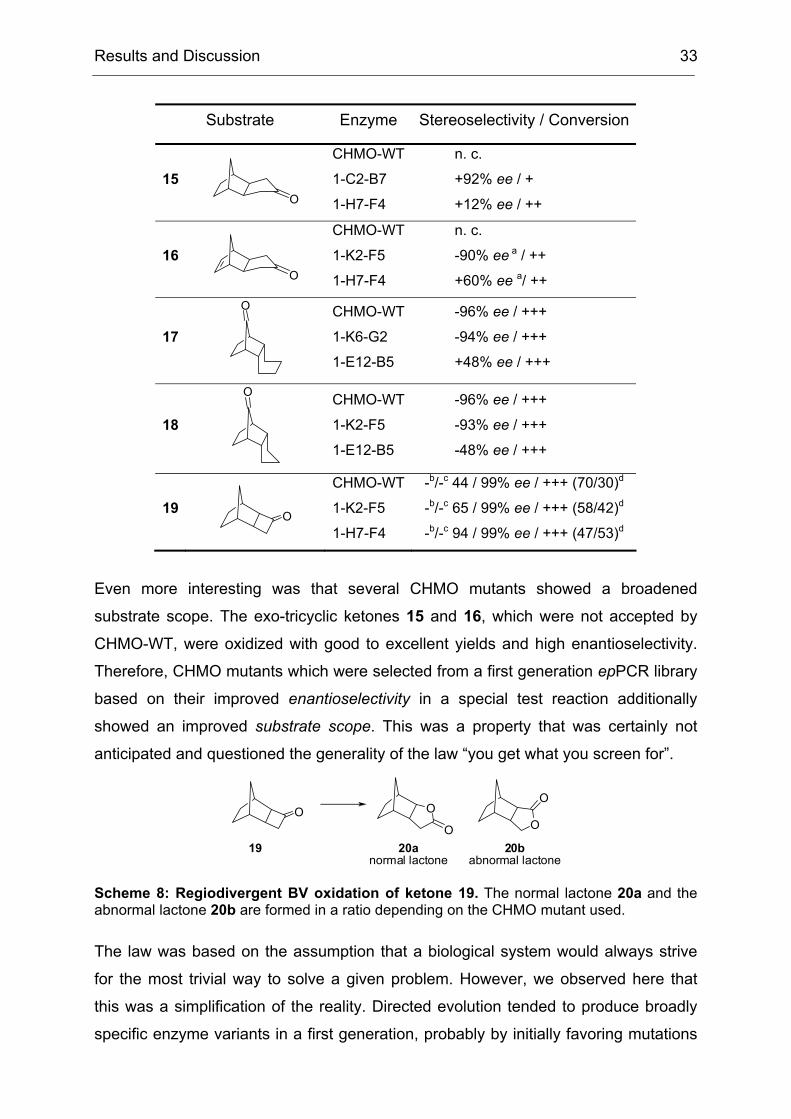
Table 5: Screening results from the BV oxidation catalyzed by CHMO mutants obtained by directed evolution. Conversion: +++: >90%; ++: 50-90%; +: <50%; n.c.: no conversion. a: no baseline separation in the GC; b: “normal” lactone; c: “abnormal” lactone; d: ration of “normal” and “abnormal” lactones. -/+ in front of ee-values denotes the sign of specific rotation.
Substrate Enzyme Stereoselectivity / Conversion
8 O
H
H
CHMO-WT
1K2-F5
1-H7-F4
-89% ee / +++
-94% ee / +++
-17% ee / +++
9 OCl
H
H
CHMO-WT
1-K2-F5
1-H7-F4
-99% ee / +++
-99% ee / +++
+99% ee / +++
10 OO
Ph
CHMO-WT
1-K2-F5
1-E12-B5
-53% ee / +++
-83% ee / +++
+66% ee / +++
11 OPh
CHMO-WT
1-K2-F5
1-E12-B5
-62% ee / +++
-96% ee / +++
-8% ee / +++
12 O
CHMO-WT
1-K2-F5
1-H7-F4
-99% ee / +++
-99% ee / +++
-99% ee / +++
13 OHO
CHMO-WT
1-K2-F5
1-H7-F4
+92% ee / +++
+99% ee / +++
+99% ee / +++
14 O
CHMO-WT
1-K2-F5
1-H7-F4
-96% ee / +++
-99% ee / +++
-99% ee / ++
Results and Discussion 33
Substrate Enzyme Stereoselectivity / Conversion
15 O
CHMO-WT
1-C2-B7
1-H7-F4
n. c.
+92% ee / +
+12% ee / ++
16 O
CHMO-WT
1-K2-F5
1-H7-F4
n. c.
-90% ee a / ++
+60% ee a/ ++
17
O
CHMO-WT
1-K6-G2
1-E12-B5
-96% ee / +++
-94% ee / +++
+48% ee / +++
18
O
CHMO-WT
1-K2-F5
1-E12-B5
-96% ee / +++
-93% ee / +++
-48% ee / +++
19 O
CHMO-WT
1-K2-F5
1-H7-F4
-b/-c 44 / 99% ee / +++ (70/30)d
-b/-c 65 / 99% ee / +++ (58/42)d
-b/-c 94 / 99% ee / +++ (47/53)d
Even more interesting was that several CHMO mutants showed a broadened
substrate scope. The exo-tricyclic ketones 15 and 16, which were not accepted by
CHMO-WT, were oxidized with good to excellent yields and high enantioselectivity.
Therefore, CHMO mutants which were selected from a first generation epPCR library
based on their improved enantioselectivity in a special test reaction additionally
showed an improved substrate scope. This was a property that was certainly not
anticipated and questioned the generality of the law “you get what you screen for”.
O OOO
O
19 20anormal lactone
20babnormal lactone
Scheme 8: Regiodivergent BV oxidation of ketone 19. The normal lactone 20a and the abnormal lactone 20b are formed in a ratio depending on the CHMO mutant used.
The law was based on the assumption that a biological system would always strive
for the most trivial way to solve a given problem. However, we observed here that
this was a simplification of the reality. Directed evolution tended to produce broadly
specific enzyme variants in a first generation, probably by initially favoring mutations
Results and Discussion 34
that increased the conformational flexibility of active site residues.[34, 171, 181] This
partial destabilization of previously specialized active site structures enabled novel
modes of transition state binding, often with only modest diminution of natural
activities.[182] Thus, the first generation increased the evolvability of CHMO with
respect to the earlier statement (II1.1), that the evolvabilty of an enzyme was among
other features a function of its ability to catalyze secondary reactions. During the
course of directed evolution this property dwindled away again, since the obtained
mutants were more and more adapted to the specific problem that was given in the
screening measurement. In the case of CHMO, the first law of directed evolution
applied from the second generation on, but in the first one we got much more than
just what we screened for.
2 High-Level Expression and Purification of CHMO
Of particular interest was the rationalization of the results obtained during the
directed evolution of CHMO. We wanted to know why the obtained mutants were
more selective than CHMO-WT. Since by the time of this project not a single BVMO
structure (x-ray or NMR-based) was available, there were no data to base an
interpretation of the results on. We started a collaboration with I. Schlichting at the
Max-Planck-Institute for Medical Research in Heidelberg to crystallize CHMO and
solve its structure. In the second part of the project, this structure should be used to
rationalize our results.
Our contribution to the first part of the collaboration was to provide optimized
protocols for the preparation of CHMO in large quantities and in a quality that would
be sufficient for crystallization experiments.
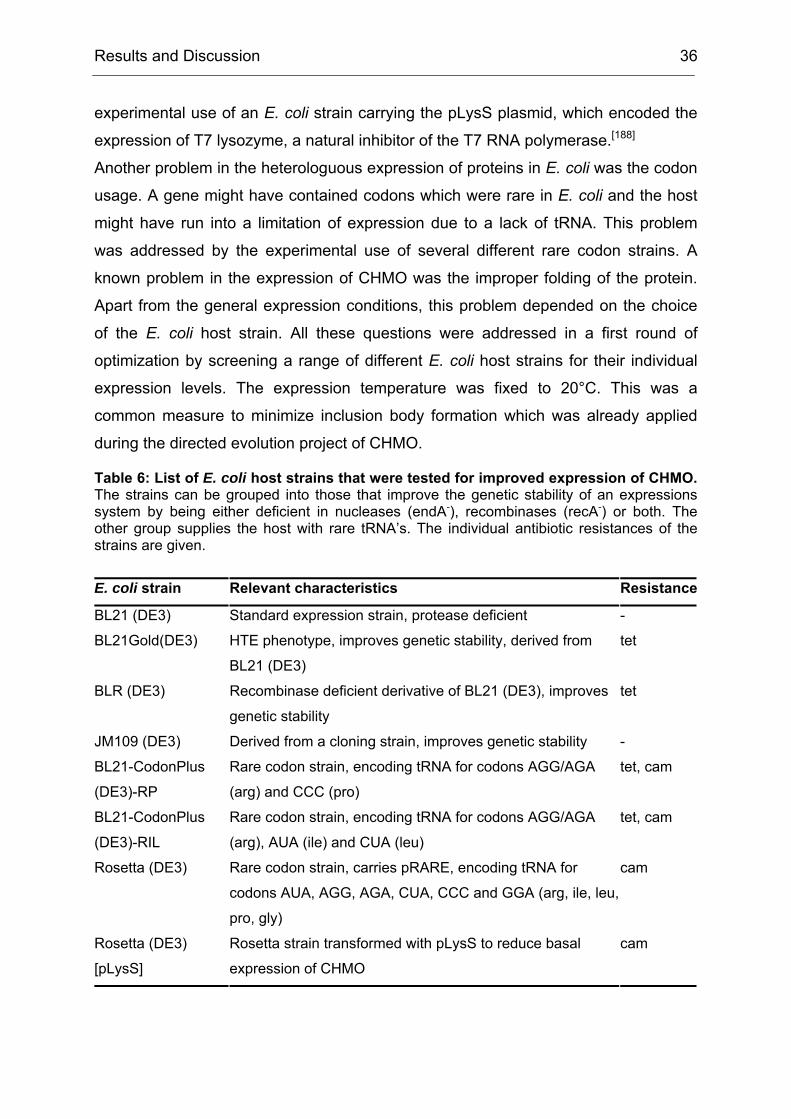
Challenges to be met included:
1. To express CHMO in quantities higher than 10 mg/l of culture
2. To purify CHMO in a quick way to prevent denaturation of the enzyme during
the purification procedure
3. To stabilize CHMO by means of additives that would increase its half-life time
Even though, several protocols for the expression and purification of CHMO were
published, each of them suffered from one or more drawbacks. Either the yield of the
expression system was too low due to unoptimized expression conditions or the
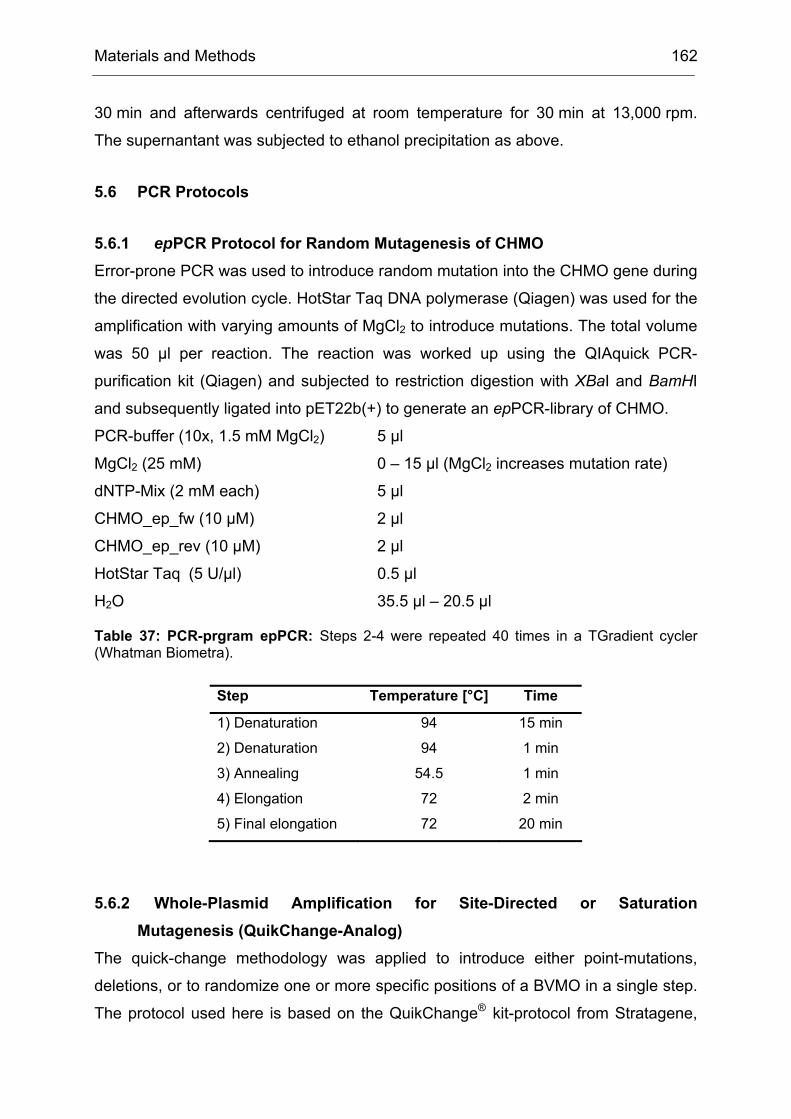
purification procedure was too time consuming, which lead to a partial denaturation
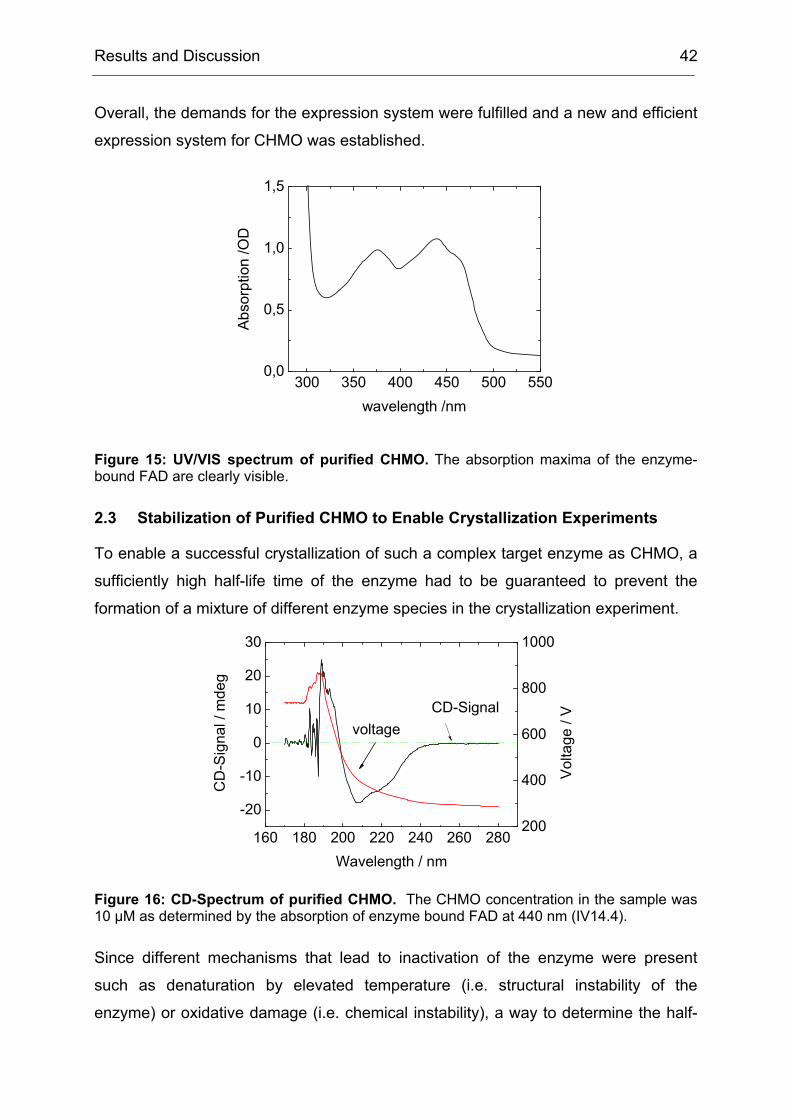
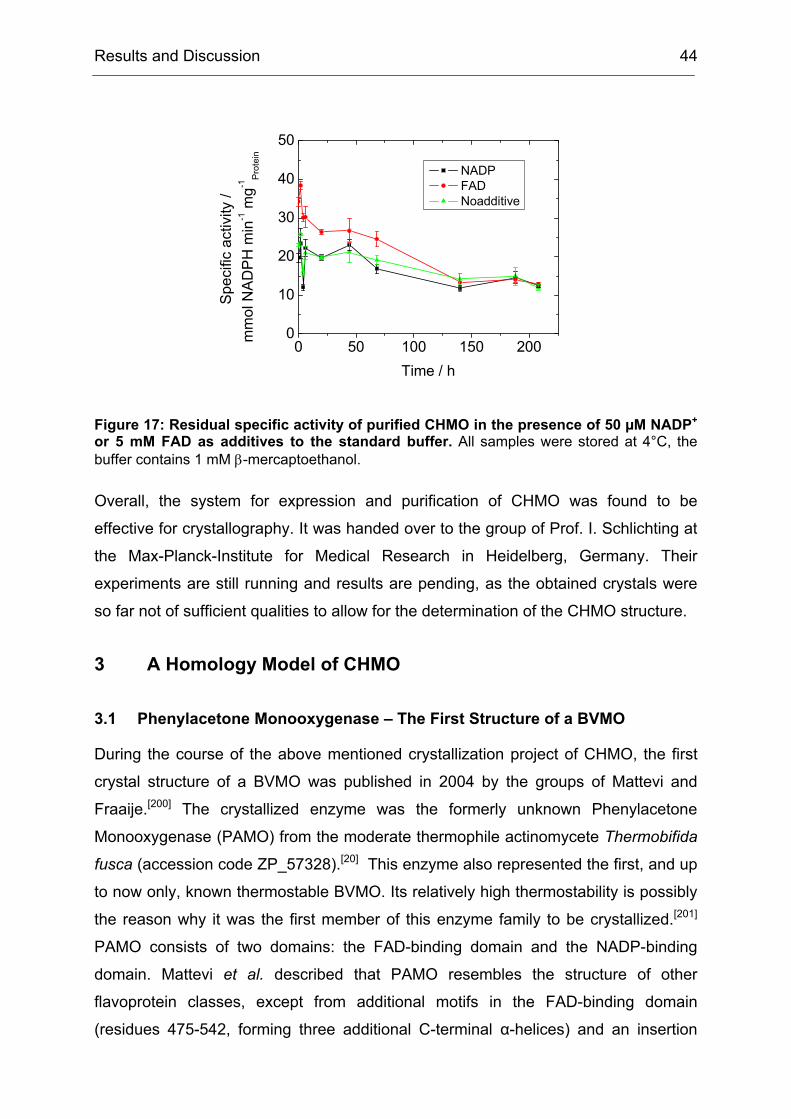
Results and Discussion 35
of CHMO over time. Overall, a protocol was required that would on the one hand
allow the high-level expression of CHMO in E. coli and on the other hand a quick and
simple purification with negligible loss of enzyme activity. We started from our
BL21(DE3)[pET22b-CHMO] expression system which was already used for the
directed evolution of CHMO. To optimize the expression level, the conditions of
expression had to be varied.
2.1 High-Level Expression of CHMO
pET vectors potentially yielded high amounts of target protein but suffered even more
than other E. coli based expression systems from the expression of insoluble protein
in form of inclusion bodies and from genetic instability.[183, 184]
There were numerous factors that influenced the level of heterologuous protein
expression in E. coli.[185-187] The most critical among them was the choice of the
expression system itself, comprising the vector and bacterial strain. The existing
system using a pET vector was kept because expression under the T7lac-promoter
yielded large amounts of protein.[184] The use of this vector required the expression
strain to have a chromosomal copy of the T7 RNA polymerase under control of the
inducible lacUV5-promoter, which somewhat limited the choice of the host strains
such as BL21(DE3). In the absence of the inducer, typically isopropyl-β-D-
thiogalactoside (IPTG), little T7 RNA polymerase and therefore little target protein
should be present in this system and the cells should grow well. Upon addition of
IPTG, T7 RNA polymerase was expressed, which transcribed the DNA controlled by
the T7lac promoter. This polymerase was so active, that the amount of target RNA
produced was comparable to the amount of ribosomal RNA in a cell. Therefore, the
translation initiation signal in the transcribed RNA directed most of the cells protein
synthesis towards the target protein, which subsequently accumulated to become a
major fraction of the total cell protein. The drawback of this system was that the T7
RNA polymerase was so active, that small basal expression levels lead to substantial
expression of the target protein even in the absence of IPTG. This limited the stability
of the expression system, even if the target protein was not toxic to the cell. The level
of basal expression was somewhat reduced by the copy of the lac operator sequence
(the binding site for the lac repressor) downstream of the T7 promoter, but still this
phenomenon might have decreased the genetic stability of the system and hence the
level of expression. This potential problem was probed and targeted by the
Results and Discussion 36
experimental use of an E. coli strain carrying the pLysS plasmid, which encoded the
expression of T7 lysozyme, a natural inhibitor of the T7 RNA polymerase.[188]
Another problem in the heterologuous expression of proteins in E. coli was the codon
usage. A gene might have contained codons which were rare in E. coli and the host
might have run into a limitation of expression due to a lack of tRNA. This problem
was addressed by the experimental use of several different rare codon strains. A
known problem in the expression of CHMO was the improper folding of the protein.
Apart from the general expression conditions, this problem depended on the choice
of the E. coli host strain. All these questions were addressed in a first round of
optimization by screening a range of different E. coli host strains for their individual
expression levels. The expression temperature was fixed to 20°C. This was a
common measure to minimize inclusion body formation which was already applied
during the directed evolution project of CHMO.
Table 6: List of E. coli host strains that were tested for improved expression of CHMO. The strains can be grouped into those that improve the genetic stability of an expressions system by being either deficient in nucleases (endA-), recombinases (recA-) or both. The other group supplies the host with rare tRNA’s. The individual antibiotic resistances of the strains are given.
E. coli strain Relevant characteristics Resistance
BL21 (DE3) Standard expression strain, protease deficient -
BL21Gold(DE3) HTE phenotype, improves genetic stability, derived from
BL21 (DE3)
tet
BLR (DE3) Recombinase deficient derivative of BL21 (DE3), improves
genetic stability
tet
JM109 (DE3) Derived from a cloning strain, improves genetic stability -
BL21-CodonPlus
(DE3)-RP
Rare codon strain, encoding tRNA for codons AGG/AGA
(arg) and CCC (pro)
tet, cam
BL21-CodonPlus
(DE3)-RIL
Rare codon strain, encoding tRNA for codons AGG/AGA
(arg), AUA (ile) and CUA (leu)
tet, cam
Rosetta (DE3) Rare codon strain, carries pRARE, encoding tRNA for
codons AUA, AGG, AGA, CUA, CCC and GGA (arg, ile, leu,
pro, gly)
cam
Rosetta (DE3)
[pLysS]
Rosetta strain transformed with pLysS to reduce basal
expression of CHMO
cam
Results and Discussion 37
A variety of strains transformed with pET22b-CHMO-His6 (see Table 6) and the
protein was expressed in LB-medium. Expression was induced at an OD600 around
0.5 by the addition of IPTG to a final concentration of either 25 µM or 50 µM. The
differences in optical density by the time of induction were due to the different growth
rates of the individual strains, since for example JM109(DE3) growed significantly
slower than the BL21(DE3) derivatives.
0 2 4 6 8 10 120
20
40
60
80
100
rela
tive
activ
ity /
%
time of induction / h
A B C D E F G
Figure 10: Relative rates of CHMO expression by the E. coli strains. IPTG concentration: 25 µM, LB-medium, 20°C, 130 rpm in 125 ml Erlenmeyer flasks. The following strains were tested: A: JM109 (DE3); B: BL21 (DE3); C: BLR (DE3); D: BL21-CodonPlus (DE3)-RP; E: BL21-CodonPlus (DE3)-RIL; F: Rosetta (DE3); G: Rosetta (DE3) [pLysS]
The strain BL21-CodonPlus(DE3)-RP was found to yield the highest CHMO activity
of all strains tested. The optimal time of induction was 8-9 h at 20°C in the presence
of 25 µM IPTG. In the presence of 50 µM IPTG all strains showed a decrease of
activity, correlating with a large amount of insoluble CHMO in these samples, which
was found by SDS-PAGE analysis. With this information in hand, the next round of
optimization was started; this time, media and media additives were tested. The
selection of media included TB-medium as well as the standard LB-medium plus
supplements to LB. The rich TB-medium was chosen because higher cell densities
and therefore higher amounts of protein were obtained this way. In addition to this it
has been reported, that rich media can increase the fraction of solubly expressed
protein in E. coli by reducing inclusion body formation.[189] Sorbitol and sucrose,
respectively, in the high concentrations used in the experiments (see Table 7),
induced osmotic stress on E. coli. In some cases, both have been described to
Results and Discussion 38
enhance the heterologous expression of soluble proteins, though they have negative
effects on cell growth.[190, 191]
Table 7: Media and media additives which were tested for their effect on the functional expression of CHMO in BL21-CodonPlus (DE3)-RP. Expression conditions: 20°C, 8 h induction time, 25 µM IPTG, 140 rpm, 200 ml in 1 l Erlenmeyer flask. The cells were harvested and then frozen at -80°C. The pellets were suspended in sonication buffer (0.5 g cww/ml) and lysed by sonication. After clarification the specific activities of the lysates were determined by NADPH depletion assays and Bradford analysis (IV12.3; IV14.2).
Medium Additives Specific activity
/µmol NADPH min-1 mg-1
LB - 10.0
LB-Sucrose 30 g/l sucrose 6.3
LB-Sortbitol 0.5 M sorbitol 7.4
LB-riboflavin 50 µM riboflavine 10.4
LB-KPi 100 mM KH2PO4 (pH 7.4) 11.7
TB - 16.7
However, both additives failed to increase the specific activity. Quite the contrary,
both decreased the specific activity of the lysate in comparison to pure LB-medium.
Riboflavin, which was chosen as an additive because it was the natural precursor of
the protein cofactor FAD, did not show a significant effect in the concentrations that
were tested. When LB-medium was supplemented with potassium phosphate buffer
in the same way as TB-medium, a slight increase of specific activity was observed
(~17%). The best results were obtained, when TB-medium was used for the
expression. Not only were the cell densities higher at the time of the harvest, but also
the specific activity in the lysate was more than 50% higher in comparison to LB-
medium. To further enhance the fraction of soluble CHMO during the expression, the
effect of chaperones was studied. In detail, the strain BL21-CodonPlus(DE3)-
RP[pET22b-CHMO-His6] was transformed with pG-KEJ7, a plasmid directing the
expression of the chaperone machinery DnaK-DnaJ-GrpE and GroEL-GroES.[192-194]
These proteins were also called foldases and aided in the correct folding of proteins
in the cytoplasm of E. coli. Their expression was induced by the addition of L-
arabinose, which was added in various concentrations (0.01% (w/v) – 0.1% (w/v).
However, coexpression of the chaperones did not increase the specific activity of the
crude extract. On the contrary, at elevated levels of chaperone expression, induced
by higher concentrations of L-arabinose, a decrease in CHMO activity was observed.
Results and Discussion 39
This was contradictory to the finding of Lee et al., who described an increase of
CHMO expression in a similar system.[193]
At this stage, optimization of the expression of CHMO was almost completed. A
factor that was neglected up to now was the oxygen uptake during the expression of
CHMO. Even though the uptake had to be high for whole cell catalysis as seen
during the directed evolution project of CHMO, it has been described that the
expression of CHMO in a fermenter worked best at low dissolved oxygen tensions
(DOT).[195] To gain control over this parameter, CHMO was expressed in a 5 l
fermenter (Labfors) in a semi batch run in TB-medium using the pre-optimized
conditions from the Erlenmeyer flask experiments. Fermentation was carried out
under control of the dissolved oxygen tension (DOT), pH, temperature, stirrer speed,
and of the OD600.
0 2 4 6 80
2
4
6
8
10
12
14
0
20
40
60
80
100
0
2
4
6
8
0
200
400
600
800
1000
OD
600
Time / h
DO
T / %
pH
Stir
rer S
peed
/ rp
m
Figure 11: Profile of a fermentation run for the large scale expression of CHMO. The DOT is given as % of oxygen saturation. The DOT was continuously adjusted by air and nitrogen flow rates and stirrer speed. From approximately four hours on, E. coli was under oxygen limitation.
Control of all these parameters was proposed to be important, since the stability of
CHMO was not just limited for the isolated enzyme, but also in living cells of E.
coli.[100] It was found, that this indeed improved the yield of soluble and active CHMO
(see below). After the fermentation was finished, the cells were harvested by
centrifugation and frozen at -80°C, which had no negative effect on the activity of
CHMO. Starting from this preparation CHMO, was purified by Ni-NTA affinity
chromatography.
Results and Discussion 40
2.2 Purification of CHMO
Since a quick means to purifiy CHMO was needed, affinity chromatography was
chosen followed by desalting or high-resolution gelfiltration. The method of choice in
affinity chromatography was immobilized metal affinity chromatography (IMAC) by
means of a Ni-NTA solid phase.[196-198] The pET22b-CHMO vector included a His6-tag
that was out-of-frame. The tag was moved in-frame by the deletion of one base pair
using whole-plasmid amplification (primers: Chisfor and Chisrev; protocol IV5.6.2).
The resulting tagged CHMO was fifteen amino acids longer at the C-terminus than
CHMO-WT (KHGSRAAALEHHHHHH). It was experimentally confirmed, that the
His6-tag has no effect on the acitivity of CHMO preparations.
pET22-CHMO7020 bp
lacI
CHMOCHMO-CHisAmp(r)
T7 promoterlacO
f1 oriT7 terminator
Chisfor (100.0%)
Chisrev (100.0%)
Figure 12: Plasmid map of pET22-CHMO including the C-terminal His6-tag. The two mutagenic primers used to introduce a frame shift which resulted in a fusion of the His6-tag are shown, including their homology to the newly formed tagged CHMO-gene. For comparison the CHMO-WT is shown as well.
CHMO was known to denature rapidly at room temperature (t1/2 = 24 h at 25°C),
which required working under cool conditions. Thus, buffers were pre-cooled at 4°C
and the enzyme solutions (crude extract or purified enzyme) were kept on ice.
However, temperature was not the only reason for the denaturation of CHMO,
oxidative damage was also described to have a detrimental effect on the activity.[195]
To maintain low oxidative stress throughout the purification procedure, the buffers
were degassed and the lysis buffer was supplemented with β-mercaptoethanol,
which was found to have a stabilizing effect on the protein. Purification was
straightforward via Ni-NTA chromatography on a 1 ml HiTrap column using a step
gradient of imidazole (IV13.1). The enzyme preparation was afterwards desalted,
Results and Discussion 41
either by dialysis or by gelfiltration (IV13.3, IV13.4) and finally concentrated by
centrifuge filters.
Figure 13: 10% SDS-PAGE analysis of the Ni-NTA purification of CHMO. Gel A: 1: complete E. coli protein after lysis; 2: insoluble fraction; 3: soluble fraction; 4: flowthrough after column load. Gel B: CHMO fractions after elution from the Ni-NTA column.
Figure 14: SDS-PAGE analysis of the gelfiltration of CHMO after Ni-NTA chromatography. Fractions 1-4 do not contain CHMO (and are therefore not yellow), fractions 6 and 7 (plus following fractions) are yellow and contain CHMO. Thus, the gelfiltration removed an impurity with a high molecular weight, which was not separated on the Ni-NTA column.
The concentration of purified flavoproteins was determined using UV/VIS
spectroscopy due to the characteristic absorption of the enzyme bound flavin (FAD in
the case of CHMO, see Figure 15). The yield of purified CHMO from the old
expression system in comparison to the new one was determined. Using the old
system employing BL21(DE3)[pET22b-CHMO-His6], the yield of active CHMO after
Ni-NTA chromatography and desalting was 9.5 mg/l of culture (146 nmol/l). This
value was increased to 18 mg/l of culture (276 nmol/l) when the expression was
carried out in shaking flasks employing BL21-CodonPlus (DE3)-RP[pET22b-CHMO-
His6], and to more than 30 mg/l of culture (461 nmol/l) using the same system in a
batch-run in the fermenter.
A 1 2 3 4
B
97 66 45 30
1 2 3 4 5 6 7 8
Results and Discussion 42
Overall, the demands for the expression system were fulfilled and a new and efficient
expression system for CHMO was established.
300 350 400 450 500 5500,0
0,5
1,0
1,5
Abs
orpt
ion
/OD
wavelength /nm
Figure 15: UV/VIS spectrum of purified CHMO. The absorption maxima of the enzyme-bound FAD are clearly visible.
2.3 Stabilization of Purified CHMO to Enable Crystallization Experiments
To enable a successful crystallization of such a complex target enzyme as CHMO, a
sufficiently high half-life time of the enzyme had to be guaranteed to prevent the
formation of a mixture of different enzyme species in the crystallization experiment.
160 180 200 220 240 260 280
-20
-10
0
10
20
30
200
400
600
800
1000
CD
-Sig
nal /
mde
g
Wavelength / nm
CD-Signalvoltage
Vol
tage
/ V
Figure 16: CD-Spectrum of purified CHMO. The CHMO concentration in the sample was 10 µM as determined by the absorption of enzyme bound FAD at 440 nm (IV14.4).
Since different mechanisms that lead to inactivation of the enzyme were present
such as denaturation by elevated temperature (i.e. structural instability of the
enzyme) or oxidative damage (i.e. chemical instability), a way to determine the half-
Results and Discussion 43
life time at various temperatures had to be based on the measurement of residual
activity. Indirect ways such as CD-spectroscopy to measure the structural integrity of
the purified enzyme appeared to be useful at the first glance, but were found to be
inappropriate since no significant difference between functional CHMO preparations
and a non-reconstitutable preparation of apo-CHMO could be found (see Figure 16;
for a protocol see IV13.2).
Therefore a NADPH-depletion based assay was utilized to enable an accurate
determination of the residual activity of CHMO after incubation in the presence of
various stabilizing agents. Taking into account that t1/2 of CHMO at room temperature
was short and that the choice of stabilizing additives was very restricted because of
the requirements of the crystallographers, this appeared to be a formidable
challenge. To avoid an interference with the crystallization process, typical stabilizers
such as sugars in high concentrations or other proteins such as BSA had to be
avoided. To evaluate the effect of potential stabilizers, purified CHMO was incubated
in the presence of several ingredients at different temperatures and the residual
activity of each preparation was measured at defined time points by NADPH-
depletion. The following substances were tested for their effect, either as a single
additive or in combination:
− β-mercaptoethanol (1 mM)
− FAD (5 mM)
− NADP+ (50 µM)
− Glutamate (25 mM and 50 mM)
− Arginine (25 mM and 50 mM)
FAD and NADP+ were chosen as additives because the addition of enzyme cofactors
often increased the lifetime of purified enzymes and β-mercaptoethanol because it
protected the enzyme from oxidative damage and was found to be effective in the
lysis buffer. Glutamate and arginine in concentrations as high as 50 mM were
described to enhance solubility and stability of several enzymes.[199] FAD and β-
mercaptoethanol were again found to stabilize CHMO. NADP+ was not found to have
any significant effect, glutamate and arginine in the high concentrations used showed
rather negative effects. By the addition of β-mercaptoethanol and FAD to a
preparation of CHMO which was constantly stored at 4°C, the half-life time of the
enzyme preparation was increased from one day to more than four days, a lifespan
which was sufficient to start crystallization experiments (see Figure 17).
Results and Discussion 44
0 50 100 150 2000
10
20
30
40
50
Spe
cific
act
ivity
/ m
mol
NA
DP
H m
in-1 m
g-1P
rote
in
Time / h
NADP FAD Noadditive
Figure 17: Residual specific activity of purified CHMO in the presence of 50 µM NADP+ or 5 mM FAD as additives to the standard buffer. All samples were stored at 4°C, the buffer contains 1 mM β-mercaptoethanol.
Overall, the system for expression and purification of CHMO was found to be
effective for crystallography. It was handed over to the group of Prof. I. Schlichting at
the Max-Planck-Institute for Medical Research in Heidelberg, Germany. Their
experiments are still running and results are pending, as the obtained crystals were
so far not of sufficient qualities to allow for the determination of the CHMO structure.
3 A Homology Model of CHMO
3.1 Phenylacetone Monooxygenase – The First Structure of a BVMO
During the course of the above mentioned crystallization project of CHMO, the first
crystal structure of a BVMO was published in 2004 by the groups of Mattevi and
Fraaije.[200] The crystallized enzyme was the formerly unknown Phenylacetone
Monooxygenase (PAMO) from the moderate thermophile actinomycete Thermobifida
fusca (accession code ZP_57328).[20] This enzyme also represented the first, and up
to now only, known thermostable BVMO. Its relatively high thermostability is possibly
the reason why it was the first member of this enzyme family to be crystallized.[201]
PAMO consists of two domains: the FAD-binding domain and the NADP-binding
domain. Mattevi et al. described that PAMO resembles the structure of other
flavoprotein classes, except from additional motifs in the FAD-binding domain
(residues 475-542, forming three additional C-terminal α-helices) and an insertion
Results and Discussion 45
into the NADP-binding domain (residues 220-340, directly at the center of the
proposed NADP-binding site). The latter inserted residues form an α-helical
subdomain, which interacts with the FAD-binding domain and additionally form a part
of the active site (see Figure 18). These subdomain residues display rather poor
sequence conservation, as found by alignment studies. Additionally, a DALI search
(http://www.ebi.ac.uk/dali/) showed that there are no other protein structures
possessing an inserted subdomain of such a topology.[202] Therefore, this appears to
be a characteristic feature of the Baeyer-Villiger monooxygenase class of enzymes.
The crystal structure of PAMO has revealed a number of interesting details that shine
some light on the mechanism of BVMOs.
Figure 18: Crystal structure of Phenylacetone Monooxygenase (PAMO; pdb-code 1W4X).[200]The overall structure of the enzyme is shown, including the enzyme bound FAD and a sulfate ion bound in the position proposed to be the binding site for NADPH. Dark green: Insertion into the NADP-binding site of PAMO (residues 220-340); dark blue: Additional helices to the FAD-binding domain at the C-terminus of PAMO (residues 475-542).
One of them is position Arg337, a residue which is strictly conserved among all
BVMOs. It was found to be located in the active site of PAMO, directly next to the
FAD cofactor in front of its C4a atom where the peroxide adduct is formed. Previous
experiments with a different BVMO demonstrated that the mutation of the
corresponding Arg residue to Ala rendered the enzyme completely inactive.[203] It was
Results and Discussion 46
proposed that this arginine stabilized the negatively charged flavin-peroxide species;
an interpretation that was supported by the analysis of the crystal structure.[200] In the
crystal Arg337 was found in two different conformations and in both positions, the
side chain appeared to be directly able to interact with the peroxide intermediate,
possibly by H-bonds.
Figure 19: Representation of the proposed main conformational change occuring during the catalytic cycle of PAMO. The reaction starts with the binding of NADPH and simultaneously Arg337 adopts the OUT position (Step 1). The reduced enzyme reacts with oxygen to form the flavin peroxide species. This step 2 requires a conformational change, possibly by a domain rotation, the Arg337 is brought into IN position (Step 2).The substrate binds and is oxidized and the product released, while NADP+ stays bound to the enzyme (Step 3). Figure adopted from reference [200].
However, the different conformations and the overall position of Arg337 suggested a
more complex role in catalysis. Its apparent flexibility was proposed by Mattevi et al.
to be catalytically relevant (see Figure 19). The reduction of the enzyme bound flavin
by NADPH was generally brought about by the direct transfer of a hydride anion from
the reduced nicotinamide to the N5 atom of the flavin. The reaction proceeded by
positioning the nicotinamide adjacent to the flavin in a way that the two ring systems
overlap each other. This must involve a movement of the Arg337 side chain, which
must shift away from the position observed in the crystal structure to allow the
binding of the nicotinamide in the correct position. Based on the crystal structure, the
side chain of the arginine was predicted to occur in two positions: an IN position
which is potentially involved in the stabilization of the flavin-peroxide anion, and an
OUT position, which freed the space for the NADPH to carry out the reduction of the
flavin. This interpretation was supported by findings from Massey et al., who reported
Step 1 Step 2 Step 3
Results and Discussion 47
large spectral changes of Cyclohexanone Monooxygenase upon binding of
NADP+.[105]
3.2 Homology Modeling of CHMO
We used PAMO to create a structural model of CHMO using homology modeling.[204]
The sequence identity between CHMO (523 amino acids) and PAMO (524 amino
acids; pdb-code 1W4X) was sufficiently high (40.3%) and the calculated BLAST
alignment score was 526 (VectorNTI software; www.invitrogen.com).[205] The model
was generated using the CBS-CPHmodels-2.0 3D-homology modeling server
(www.cbs.dtu.dk/services/CPHmodels).[206] In the final model, all conserved motifs
typical for flavin and NADP-binding sites were correctly aligned, which spoke for the
reliability of the predicted 3D model.
Figure 20: Zoom into the homology model of CHMO. The protein scaffold is shown in light blue lines, the central FAD and Arg327 (the homolog to Arg337 in PAMO) are shown as sticks. The hot spots for the control of the enantioselectivity are included in ball-and-stick depiction, which were found by random mutagenesis during the directed evolution of CHMO (see Table 2). The most prominent hot spot, position 432, is shown in green, the other positions in dark blue. Approximately half of the residues are close to the FAD, i.e. close to the active site in a radius of 10 Å.
The positions previously found to influence the enantioselectivity of CHMO were
highlighted in the model (see Figure 20, for the positions found by epPCR see
chapter II1.2). According to the model, a significant fraction of the hot spots was
Results and Discussion 48
located close to the active site of the enzyme (which was defined by a 10 Å radius
around FAD and the catalytic arginine, in the case of CHMO Arg327). Most of them
were on the front side of the FAD, which was easily explained by the vicinity of the
reaction center. Indeed, the active site was found to be to a significant fraction
directly shaped by those residues. Therefore, a direct interaction between the hot
spots and the substrate could be expected.
However, the usefulness of both the crystal structure of PAMO and hence also the
homology model of CHMO was hampered by the fact that co-crystallization of PAMO
with any substrate, NADP+ or NADP-analog failed.[200] Instead, the enzyme was
crystallized in form of a dimer, where the entrance of the active site was blocked by a
neighboring enzyme (see Figure 21). This might be considered to be a crystallization
artifact as the active enzyme existed mainly as a monomer in solution, as reported by
Fraaije et al.[20]
Figure 21: Zoom into the PAMO crystal structure (pdb-code 1W4X), revealing the dimeric crystal. The NADP-analog (NDP) is shown in blue, the FAD in ball-and-sticks depiction, the catalytic Arg337 in sticks. The neighboring enzyme in the crystal structure is shown in orange. The dimerzation is brought about by an interaction between the loop formed by the residues Tyr503 to Val513. This loop lies directly at the phosphate binding site which is crucial for NADPH-recognition. A close interaction between the NDP and the catalytic Arg337 is also observed. The modeled structure of the NADP-analog was provided by M. Bocola.
In the crystal, a close interaction of the two monomers was visible, which implicated a
change in the folding of the active site of the enzyme. This conformational impact of
the dimerization was difficult, if not impossible, to theoretically evaluate and other
Results and Discussion 49
experimental results which would aid in this problem were missing. To gain further
insight into the value of the crystal structure, the position of an NADP-analog in the
enzyme was modeled into the active site of the enzyme, and a steric clash between
the redox cofactor and the neighboring enzyme was observed, which was most likely
the reason for the failure of the co-crystallization experiments of Mattevi et al.[207] In
addition, a clash of the NADP-analog with the catalytic Arg337 is observed, which
supports the IN-OUT hypothesis from Mattevi and Fraaije.
Forced by these theoretical findings we refrained from the use of the CHMO
homology model for the detailed explanation of the improved stereoselectivity of the
mutants as it would have been too speculative and possible explanantions would
have been difficult to evaluate experimentally. The crystal structure 1W4X apparently
shows PAMO in an inactive, “resting”, state.
Overall, helpful as they certainly are, the crystal structure of PAMO and the
consequential homology model of CHMO had to be handled with care to avoid an
overinterpretation of the available experimental data. Nevertheless, if not for detailed
mechanistic studies, we still expected these structural models to aid in protein
engineering experiments, which was true as shown in the following chapter.
4 Rational Design of Phenylacetone Monooxygenase towards a Broadened Substrate Scope
PAMO was considered to be interesting for biocatalytic applications due to its
stability, which was extraordinarily high in comparison to related enzymes such as
CHMO. However, besides thermal stability, other important factors for this purpose
were of course the substrate scope and the enantioselectivity of the enzyme.
Fraaije and colleagues explored the substrate scope of PAMO and found that the
enzyme catalyzed the oxidation of a number of ketones and thioethers which showed
a high similarity among each other (see Scheme 9).[20, 208, 209] The substrate scope
was described to be centered around small and linear aromatic ketones and
thioethers. Cyclic ketones were either not accepted as substrates or oxidized with
poor catalytic efficiencies. In addition, the stereoselectivity in the Baeyer-Villiger
oxidations, if applicable, was only low to moderate, whereas the enzyme performed
well in sulfoxidation reactions.
Results and Discussion 50
SR
n SR
n
O
PAMO-wt
On On
O
PAMO-wt
Scheme 9: Substrate scope of PAMO-WT for the Baeyer-Villiger oxidation and for oxidation of thioethers as described in the literature. [20, 209] In exchange for the phenyl-group of the ketones, also long, hydrophobic alkyl-chains are described. Cyclic ketones are either not accepted or with poor catalytic efficiencies (kcat/KM < 100 M-1 s.1). The catalytic efficiency for the oxidation of phenylacetone on the other hand is quite high (kcat/KM = 32,000 M-1 s.1, KM = 59 µM, kcat = 1.9 s-1).
These findings certainly limited the usefulness of this promising enzyme which
tempted us to address this problem by utilizing the results obtained by directed
evolution experiments of CHMO. These results were complemented by a qualitative
interpretation of the crystal structure of PAMO. An improvement of the substrate
scope and stereoselectivity of this enzyme was intended.
4.1 Mutational Study of the PAMO Active Site
Upon comparing the CHMO homology model with the crystal structure of PAMO, a
remarkable structural difference became apparent within the otherwise highly similar
architectures. Directly at the position in PAMO which was homologous to the
prominent hot spot Phe432 in CHMO, two additional amino acids were found which
form a bulge directly in the center of the active site of PAMO in the FAD binding
Figure 22: Differences in the arginine interacting loop between PAMO and CHMO. Excerpt of the sequence alignment between PAMO and CHMO. Identical residues are shaded in black and homologous residues are shaded in grey. The blue box surrounds the so called arginine interacting loop (see below). The SAL motif that is located directly at the position in PAMO which is homologous to Phe432 in PAMO is colored in red.
This from now on Serine-Alanine-Leucine (SAL) bulge called motif was absent in
CHMO and, based on a visual inspection of the two enzyme structures, appeared to
limit the space available for substrate binding in PAMO (Figure 23).
Results and Discussion 51
Figure 23: Comparison of the crystal structure 1W4X of PAMO (left) and the homology model of CHMO (right). In detail, a zoom into the active site is shown with the enzyme bound FAD (stick depiction) together with the catalytical residue Arg337 (PAMO) and Arg327 (CHMO) (ball-and-stick depiction). To its right the region around residue Phe432 (CHMO) is shown, which enables the identification of a major difference between these two enzymes. PAMO has at the position homologous to Phe432 in CHMO two additional amino acids (highlighted in yellow) which limit the size of the active site.
The SAL bulge was spatially located next to the catalytic Arg337 in a way that it
should not interact directly with a bound substrate or intermediate, but instead with
the catalytic arginine. The region around the bulge was therefore termed the arginine
interacting loop. We devised a working hypothesis such, that a partial or complete
deletion of the SAL bulge should free enough space in the active site of PAMO to
enable the conversion of cyclic substrates. Thus, a deletion of the SAL bulge should
shift the catalytic properties of PAMO towards those of CHMO. The initial
experiments aimed at the generation of three PAMO variants by manipulating the
SAL bulge in the following way:
− PAMO-P1: deletion of Ala442
− PAMO-P2: deletion of Ala442 and Leu443
− PAMO-P3: deletion of Ser441 and Ala442.
These three mutants had either the top of the bulge (P1) or either one of the two
flanks (P2, P3) deleted. The three mutants were generated by site-directed
mutagenesis of pPAMO (for plasmid map see Figure 25) using whole-plasmid
amplification (see Figure 24). The resulting mutated plasmids were used to transform
Leu443 Ala442
Ser441 Phe432
Results and Discussion 52
E. coli TOP10 and PAMO-P1, -P2, and –P3 were expressed following literature
protocols for the wild type enzyme.[20]
Figure 24: 1% TBE-agarose gel of a mutagenic whole-plasmid amplification to delete the SAL bulge within the PAMO active site. P1-P3 denotes the three different PAMO mutants. Amplification condition 1: 0.25 µM primer and 5 ng template; 2: 0.5 µM primer, 0.5 ng template; 3: 0.25 µM primer, 1 ng template. primers: P1: PAMO_A_fw, PAMO_A_rev; P2: PAMO_AL_fw, PAMO_AL_rev; P3: PAMO_SA_fw, PAMO_SA_rev; general protocol IV5.6.2.killen
PAMO-pBAD5676 bp
PAMO
Amp(r)
pUC ori
AraCBAD
RBS
SAL-Cassette
His-tagMyc-epitope tag
Figure 25: Vector map of pPAMO. The protein is expressed fused to a His6-tag and a myc-epitope-tag to enable affinity chromatography.[20]
4.2 Purification and Characterization of the PAMO Deletion Mutants
The mutated enzymes were expressed in a 200 ml scale (see protocol IV15.1) and
then purified by heat treatment at 50°C for one hour followed by Ni-NTA
chromatography using a step gradient of imidazole, and by desalting via PD10
columns (see protocols IV16.1 and IV16.3). The purity of the enzyme preparations
were documented by SDS-PAGE analysis (Figure 26) and the concentrations of the
purified enzymes were determined by UV/VIS spectroscopy (IV17.1). Via the
P1 1 2 3
P2 1 2 3
P3 1 2 3
Results and Discussion 53
NADPH-depletion assay the functional expression of the PAMO mutants was
confirmed by the oxidation of phenylacetone (21), the best substrate for PAMO-WT.
Figure 26: 10% SDS-PAGE documentation of the purification of PAMO-P3 by Ni-NTA chromatography. Lane 1: Flowthrough after loading of the 1 ml HiTrap Ni-NTA column (Amersham). Lane 2: Eluted PAMO-P3. PAMO-WT and all of its mutants were prepared in an analogous manner with similar results. The protocol was based on the literature for PAMO-WT and slightly modified to enable the use of available equipment.[20]
First, the substrate scope of the new variants was explored (Scheme 10).
PhO
O Ph
O
OR O
O
R
O2
PAMO-wt
O2
PAMO-mutants
21 22
23 24
Scheme 10: Oxidation of ketones by PAMO-WT or PAMO mutants, respectively. 23a: R = -Ph, 23b: R = -Bz; 23c: R = -Allyl. All substrates were dissolved in acetonitrile before added to the reaction. The final concentration of acetonitrile was always kept below 5% (v/v) in 50 mM Tris-HCl buffer (pH 8.0).
All mutants were found to catalyze the oxidation of phenylacetone, thereby showing
that this property had been maintained. Furthermore, it was found that only the
generated mutants, but not the wild type, catalyzes the oxidation of rac-2-
phenylcyclohexanone (23a), the simplest cyclic analog to phenylacetone. In addition,
only PAMO-P3 was found to catalyze the oxidation of rac-2-benzylcyclohexanone
(23b) and of rac-2-allylcyclohexanone (23c). None of the enzymes accepted 4-
progesterone, cyclohexanone, or cyclopentanone as substrates. Based on these
1 2 M65 kDA
Results and Discussion 54
findings, we could conclude that the substrate scope of the PAMO mutants by the
deletion of the SAL bulge, especially of PAMO-P3, was expanded in comparison to
PAMO-WT. However, the need for a hydrophobic substitutent, preferably aromatic, in
α-position of the ketone substrate was still present. The effect of the deletion
mutagenesis was illustrated by modeling the structure of the Criegee intermediate
during the oxidation of ketone 23a into the structure of PAMO-WT and PAMO-P3.
The modeling was done using the united atom force field MAB as implemented in the
program MOLOC with implicit solvation.[210-212] The structure was minimized and
relaxed by molecular dynamics according to a previously described procedure.[212]
Figure 27: A model of the Criegee intermediate of the Baeyer-Villiger oxidation of 2-phenylcyclohexanone by PAMO-P3. The postulated H-bond between the Arg337 and the negatively charged oxygen of the Criegee intermediate as well as the interaction between Arg337 and the mutated bulge are shown. (Ser441 and Ala442 are deleted in this mutant, freeing the space necessary for the formation of the cyclic Criegee intermediate). Note that this structure is only for illustration purposes and only one out of many possible structures. It was not possible to rule out which of them was closest to the reality. The model was provided by M. Bocola.
The formation of the Criegee intermediate required Arg337 to free space for the bulky
cyclic structure and to move towards the SAL bulge. In case of PAMO-WT, steric
hindrance appears to avoid this movement of the Arg337 side chain, thereby
inhibiting the formation of the intermediate. In case of PAMO-P3, however, the
formation of the intermediate appeared to be feasible. In addition, an H-bond
between Arg337 and the intermediate was observed (see Figure 27). Thus, it could
be proposed that the role of Arg337 in the catalytic cycle of PAMO, most likely also
valid as a model for other BVMOs, was necessary for two individual steps of the
catalytic cycle of the enzyme. It not only facilitated the formation of the reactive
species before the actual beginning of the oxidation reaction but also influenced the
Criegee
intermediate
Arg337
Asn“445“
Ser“444“
Pro440 Leu“443“
Results and Discussion 55
course of the reaction itself by an interaction with the central intermediate. The
positioning of the catalytic arginine by the arginine interacting loop appears to have a
pronounced effect on the catalytic properties of BVMOs. The hot spot that was found
to be important in the case of CHMO could straightforwardly be transferred to PAMO,
which speaks for a general importance of the amino acids within the arginine
interacting loop and will certainly help in future engineering experiments of BVMOs.
To quantify the effects of the mutagenesis, steady-state kinetics were measured for
the oxidation of phenylactone (21) and 2-phenylcyclohexanone (23a) for all mutants.
It was found that ,indeed, the straightforward mutagenesis carried out in this study
had remarkable effects on the catalytic profile of the enzyme. The oxidation of
phenylactone (21) was slowed down by one order of magnitude (kcat) and the KM
value was increased by three orders of magnitude in comparison to the wild type
enzyme.
0 1 2 3 4 50
10
20
30
40
50
60
70
v / m
OD
min
-1
c(2-phenylcyclohexanone) / mM
P1 P2 P3
0 1 2 3 4 50
5
10
15
20
25
30
35
v / m
OD
min
-1
c(phenylacetone) / mM
P1 P2 P3
Figure 28: Steady-state kinetics for the oxidation of 2-phenylcyclohexanone and phenylacetone by PAMO mutants. The data were analyzed by direct fitting of the Michaelis-Menten equation to the data shown here using Microcal Origin 7.0.
Even though the mutants still accepted this substrate as found by the initial NADPH-
depletion assays, they were significantly less effective in that. On the other hand, all
three mutants showed activities in the oxidation of ketone 23a. Whereas PAMO-WT
did not show a significant activity, PAMO-P3 was found to have a KM value as low as
70 µM coupled to a kcat value of 0.25 s-1. The kcat values for the oxidation of this
substrate were comparable for all three mutants but the KM values differed by two
orders of magnitude. The KM value for PAMO-P1 was 2.3 mM which results in a
catalytic efficiency of the same range as in the oxidation of phenylacetone by this
PAMO mutant. As it can be rationalized from the mutagenesis strategy, PAMO-P1
Results and Discussion 56
was apparently half way in its properties between the double deletion mutants P2
and P3 and the wild type enzyme. The change in the substrate scope appeared to be
caused by substrate affinity effects, as demonstrated by the large changes in the KM
values. This finding was in accordance with our working hypothesis, which was that
the deletion of the SAL bulge would change the substrate binding properties of
PAMO.
Table 8: Steady-state kinetic parameters of PAMO-WT and PAMO mutants (see protocol IV17.2).
Substrate PAMO variant KM (mM) kcat (s-1) kcat/KM (M-1·s-1)
Phenylacetone (21) WT[a][20] 0.059 1.9 32000
P1[b] >1.1 >0.2 182
P2[b] >1.3 >0.1 77
P3[b] >1.1 >0.1 91
2-phenylcyclohexanone (23a) WT n.d. n.d. n.d.
P1[c] 2.3 ± 0.5 0.31 ± 0.03 134
P2[c] 0.5 ± 0.1 0.5 ± 0.2 1054
P3[c] 0.07 ± 0.01 0.25 ± 0.02 3395
[a] Literature value was measured without addition of acetonitrile [b] Due to limited substrate solubility saturation could not be obtained [c] A racemic mixture was used
Finally, it was necessary to analyze the effect of the mutagenesis experiments on the
thermal stability of the enzyme. The thermostability of the new PAMO mutants was
comparable to the wild type and was determined by prolonged incubation of samples
of the purified proteins at 50°C. For variant P1 we found a half-life time of 29 h with a
free energy for the denaturation of 105.3 kJ/mol, for variants P2 and P3 half-life times
of 16 h (103.7 kJ/mol) and 17 h (103.9 kJ/mol), respectively. These values show that
the thermostability of PAMO has been largely maintained.[20] In addition the necessity
for temperature activation (maximum activity is reached after heat activation at 50°C)
is maintained as well. Therefore, for all experiments the PAMO mutants had to be
activated for 30 minutes.
Results and Discussion 57
Table 9: Half-life time and free energy of denaturation for PAMO mutants.
Enzyme Half-life time (t1/2) / h ΔGdenat / kJ/mol
PAMO-P1 29 ± 2 105.3 ± 0.5
PAMO-P2 16 ± 3 103.7 ± 0.5
PAMO-P3 17 ± 2 103.9 ± 0.5
Overall, Phenylacetone Monooxygenase (PAMO) was turned into a thermostable
Phenylcyclohexanone Monooxygenase (PCHMO) with a broadened substrate scope
and an increased stereoselectivity.
4.3 Whole Cell Biotransformations of Ketones and Thioethers using PAMO Mutants on an Analytical Scale
To investigate parameters such as the stereoselectivity of the newly developed
PAMO mutants, the use of this enzyme in whole cell catalysis was established. The
difficulty in this, otherwise apparently straightforward, experiment was the heat-
activation of PAMO, which had to be accomplished in living E. coli cells. Since E. coli
was not sufficiently heat tolerant to incubate it at 50°C for a prolonged period of time
as it would have been optimal for PAMO, a compromise between maximum activity
of PAMO and viability of the cells had to be found. Both parameters were monitored
by the conversion of phenylactone (21) by whole cell preparations of PAMO-WT,
since of course this parameter depended on the activity of the enzyme and the
concomitant regeneration of NADPH required sufficiently viable cells. After optimizing
temperature and duration of heat activation, it was found that shaking a glycerol
supplemented expression culture at 45°C for 15 minutes was most effective. The
culture was previously grown under inducing conditions at 37°C to an OD600 of 2.5-
3.0 to express significant amounts of PAMO. This procedure approximately doubled
the activity of PAMO-WT for the oxidation of phenylactone in comparison to a culture
without heat treatment (see protocol IV9.3). These preparations were subsequently
used for whole cell biotransformations of ketones and thioethers (for protocols see
IV9.4 and IV9.5).
Initially, the oxidation of ketones 23a and 23b was tested, later, inspired by following
experiments (II5.2), 23c was included into the study. Heat activated expression
cultures were supplemented with substrate solutions in acetonitrile and further
Results and Discussion 58
cultivated at 37°C for up to 24 h. In case of 23b and 23c the addition of
2-hydroxypropyl-β-cyclodextrin was necessary prior to the addition of the substrates
to improve the solubility of the hydrophobic compounds. At defined time points
samples were taken from the reactions and analyzed by chiral GC (IV9.1).
Compounds 23a, 23b and 23c were chiral and used as racemic mixtures, which
offered the opportunity to study racemate resolution reactions (see Table 10). In
these experiments, PAMO-WT was also found to yield very low amounts of lactone
24a, even though the activity of the enzyme in this reaction was insignificant in the
NADPH-depletion assay. Table 10 shows the conversions and enantioselectivties
obtained by the whole cell catalysis experiments. PAMO-WT catalyzed the oxidation
of 23a with low conversion and essentially no stereoselectivity, whereas we observed
increasing conversion in case of the mutants in the order P1<P2<P3. The most
active enzyme, PAMO-P3, also showed excellent stereoselectivity in the kinetic
resolution of 23a and 23b. (R)-24a was isolated with 97% ee and a yield of 50% after
less than two hours of reaction (E-value ~ 100). Interestingly, it has been reported
previously that CHMO showed identical selectivity in the same reaction.[151] This was
another indication that, indeed, the catalytic properties of PAMO were shifted towards
the properties of CHMO by the deletion of the SAL bulge. Mutant PAMO-P3 retained
the thermal stability of PAMO-WT and gained the high enantioselectivity of CHMO-
WT, hence a combination of both advantages was achieved.
Table 10: Kinetic resolution of 2-phenylcyclohexanone, 2-benzylcyclohexanone, and 2-allylcyclohexanone using whole cell catalyis. The differences of the stereoselectivity and conversion between PAMO and its mutants are shown. The selectivity factor E was in each case determined at a conversion of 40-50%, when applicable, otherwise at the maximum conversion reached after 24 h.
Ketone PAMO variant
E conversion after 24 h
/ % Preferred
enantiomer
2-phenylcyclohexanone WT 1.2 10 S
(23a) P1 35 51 R
P2 23 72 R
P3 100 91 R
2-benzylcyclohexanone WT - 0 -
(23b) P1 - 0 -
P2 - 0 -
P3 >200 40 R
Results and Discussion 59
Ketone PAMO variant
E conversion after 24 h
/ % Preferred
enantiomer
2-allylcyclohexanone WT - 0 -
(23c) P1 - 0 -
P2 - 0 -
P3 1.6 31 n.d.
The conversion and the ee-values of both educt and product were measured using
chiral GC-analysis as a function of time (Figure 29).
0 5 10 15 20 250
20
40
60
80
100
0
20
40
60
80
100
0
20
40
60
80
100
Con
vers
ion
/ %
Time / h
ee
(lact
one)
/ %
ee
(ket
one)
/ %
Figure 29: Kinetics of the PAMO-P3 catalyzed BV oxidation of 2-phenylcyclohexanone (23a) using heat activated whole cell preparations. The reaction reaches 50% conversion, which is the desired maximum for racemate resolutions, after approximately 2 h, yielding the lactone with a selectivity of 97% ee (R). For the following ~40% conversion another 22 h are necessary, which demonstrates the difference between the reaction rates for the two substrate enantiomers. (For analogous measurements for the other variants see Supporting Information VII2)
Conversion of ketone 23b was in general less efficient than the conversion of ketone
23a. However, at a conversion of 40% lactone 24b was isolated in an essentially
enantiomerically pure form, which again was similar to the oxidation by CHMO-
WT.[151] The non-aromatic substrate 23c, contrariwise, was oxidized with an
efficiency similar to the benzyl substituted 23b, but the enantioselectivity was as low
as 20% ee (product, absolute configuration not determined), corresponding to an E-
value of 1.6 (see Table 10). Therfore, we initially concluded that PAMO and its
mutants had a strong preference for aromatic substrates, at least if good
Results and Discussion 60
stereoselectivities are desired. However, the following experiments questioned this
interpretation, as it was contradictory to the results obtained from the oxidation of
bicyclo[3.2.0]hept-2-en-6-one (25), a common benchmark substrate for BVMOs. This
substrate was reported to be readily oxidized by CHMO in an enantioselective way
and the products of this reaction were valuable intermediates in prostaglandin
synthesis.[152] It was already described by Fraaije to be a substrate for PAMO-WT,
but the stereochemistry of this reaction was neglected in that study. The catalytic
efficiency, however, was described to be low (kcat/KM = 73 M-1s-1) compared to
phenylacetone (kcat/KM = 32,000 M-1s-1).[20]
O
rac-25
OO
OO
O
O
O
O+
(-)26
(+)26
(-)27
(+)27
BVMO
O2
Scheme 11: BV oxidation of bicyclo[3.2.0]hept-2-en-6-one (25) catalyzed by PAMO and PAMO mutants.
We subjected this substrate to whole cell biotransformations using PAMO-WT and all
of its mutants. After a reaction time of 24 h we found a conversion of 43% and
moderate enantioselectivities for lactones (-)26 and (+)27 for the wild-type. The
conversion was drastically improved with mutants P1, P2, and P3 to more than 95%
under the same conditions. This result was expected, since we had targeted the
mutations at an increased activity in the conversion of cyclic ketones. Additionally, for
PAMO-P2 and –P3 high enantiopurities for both product lactones were achieved (see
Table 11). This corresponded to the results described above, as again PAMO-P3
proved to be a highly selective catalyst. Nevertheless, it did not fit into the picture of
the need for an aromatic moiety within the substrate as postulated above. The
efficiency of conversion of ketone 25 depended significantly on substrate
concentration and reaction temperature. At lower temperature (30°C), the conversion
was significantly decreased in comparison to 37°C, but could be restored by
decreasing the concentration of the substrate. Lowering the substrate concentration
on the other hand somewhat lowered the enantioselectivity of the reaction. The effect
Results and Discussion 61
of the substrate concentration on the catalytic efficiency of PAMO will be discussed
later in a chapter about the upscaling of this reaction (see chapter II6).
Table 11: Activity of PAMO and PAMO mutants in the BV-oxidation of bicyclo[3.2.0]hept-2-en-6-one at a substrate concentration of 1 g/l in whole cell catalysis. Conversion was measured after 24 h of reaction. The optimal reaction conditions were: c(substrate) = 1 g/l.
Enzyme Concentration / g/l Temperature / °C Conversion / % Product ee / %
(-)26 27
PAMO-WT 1 37 43 92 48 (+)
0.5 30 65 76 41 (+)
1 30 20 90 66 (+)
PAMO-P1 1 37 >95 80 99 (-)
0.5 30 93 86 >99 (-)
1 30 49 91 >99 (-)
PAMO-P2 1 37 >95 93 >99 (-)
0.5 30 99 92 >99 (-)
1 30 90 91 >99 (-)
PAMO-P3 1 37 >95 92 >99 (-)
0.5 30 96 89 >99 (-)
1 30 80 91 >99 (-)
Finally, we turned our attention towards sulfoxidation reactions. Thioethers are often
good substrates for BVMOs.[103, 117, 119, 213-217] Hence, we wanted to explore the
properties of our PAMO mutants in this reaction which followed an electrophilic attack
of the flavin hydroperoxide at the substrate in contrast to the nucleophilic attack of
the flavin peroxide anion on ketones during the BV oxidation. In detail, we studied the
Results and Discussion 62
oxidation of p-methylbenzyl methyl sulfide (28) and p-methylphenyl methyl sulfide
(30) (see Scheme 12).
S SO ..
SO ..
+
O2
BV-monooxygenase
S O2
BV-monooxygenase
SO ..
SO ..
28 (R)-29 (S)-29
30 (R)-31 (S)-31
+
Scheme 12: Desymmetrizing sulfoxidation reactions catalyzed by PAMO and PAMO mutants.
Both substrates were subjected to whole cell catalysis using preparations of heat
activated PAMO-WT and the mutants (see protocol IV9.5). In both cases, the
addition of 2-hydroxypropyl-β-cyclodextrin was necessary to facilitate solubility of the
substrates and to reduce their toxic effects on E. coli. In addition due to the higher
volatility of the substrates, the reactions had to be carried out at 30°C instead of the
usual 37°C. At defined time points samples were taken and analyzed by chiral HPLC
(results are summarized in Table 12). In case of thioether 28, PAMO-WT performed
well, showing more than 40% conversion with an ee-value of 80.7% (R).
Table 12: Conversion and enantioselectivity found for the sulfoxidation reactions of thioether 28 catalyzed by the three different PAMO mutants and the wild type enzyme. The values given are measured after 24 h of reaction time in a whole cell biotransformation (IV9.5). In each case, the R-enantiomer is preferred.
Enzyme Conversion / % ee / %
PAMO-WT 40.5 80.7
PAMO-P1 54.5 18.2
PAMO-P2 62.5 18.5
PAMO-P3 52 89.8
Both PAMO-P1 and –P2 showed a higher conversion but lower ee-values. Only
PAMO-P3 yielded the thioether (R)-29 in a higher enantiomeric purity than the wild
type. The reason for the higher ee-value lay in a simultaneous kinetic resolution of
the sulfoxide. The minor enantiomer was selectively oxidized to the corresponding p-
methylbenzyl methyl sulfone, whereas the major enantiomer stayed comparably
untouched (Figure 30). In case of PAMO-WT and of the other two variants, only a
Results and Discussion 63
negligible sulfone formation was observed (Figure 31). This meant in reverse, that
the higher conversion of the thioether 28 by PAMO-P3 did not correspond to a higher
yield of sulfoxide, since a significant fraction of this product was directly consumed.
Thus, in the desymmetrization of thioether 28 mutant PAMO-P3 functioned
cooperatively in two different catalytic reactions. It catalyzed the favored formation of
(R)-29 and the enantioselective oxidative destruction of the opposite enantiomer (S)-
29.
0 5 10 15 20 250
10
20
30
40
50
60
0
20
40
60
80
100
0
10
20
30
40
50
60
Con
vers
ion
/ %
Time / h
ee
/ %
Sul
fone
form
atio
n / %
Figure 30: Oxidation of thioether 28 using PAMO-P3. The ee-value for the thioether is after an initial drop rising again during the course of the reaction. This is due to a parallel kinetic resolution of the unbalanced racemate. The final yield of sulfone is 20% which significantly reduces the yield of sulfoxide.
Previously, a similar phenomenon was observed during the directed evolution of
CHMO towards a higher enantioselectivity in the oxidation of the same thioether
28.[218] CHMO-WT catalyzes this reaction with 14% ee (R). During one round of
mutagenesis and screening, this value was significantly increased, but up to 26%
sulfone formation were observed. Also in this case, the overoxidation consumed the
minor enantiomer of the product sulfoxide, thus leading to an increased ee-value.
Results and Discussion 64
0 5 10 15 20 250
10
20
30
40
50
60
0
20
40
60
80
100
0
10
20
30
40
50
60
Con
vers
ion
/ %
Time / h
ee
/ %
Sul
fone
form
atio
n / %
Figure 31: Sulfoxidation of thioether 28 by PAMO-WT. The amount of overoxidation to the sulfone is negligible, which leads to a somewhat lowered ee-value in comparison to PAMO-P3.
A second round of mutagenesis and screening, this time for high stereoselectivity
and low amount of sulfone formation led to the discovery of mutations which
suppress the overoxidation.[218] Inspection of the CHMO homology model showed
that all these mutations lie on the backside of the enzyme bound FAD, thus a direct
interaction with the enzyme bound substrate or with previously mutated residues
could be excluded.
The oxidation of thioether 30 also revealed some new properties of the mutants. This
substrate was not efficiently oxidized by PAMO-WT (<1% conversion), whereas the
mutants showed significant activity. The highest conversion (~15%) was again found
in the case of P3, whereas P2 showed the highest stereoselectivity (41% ee).
However, since all of these values were only mediocre, the reaction was not further
investigated (see Table 13).
Table 13: Conversion and enantioselectivity found for the sulfoxidation of thioether 30 catalyzed by the three different PAMO mutants and the wild type enzyme, respectively. The values were measured after 24 h of reaction time in a whole cell biotransformation (IV9.5).
Enzyme Conversion / % ee / %
PAMO-WT <1 20
PAMO-P1 10 55
PAMO-P2 9.5 41
PAMO-P3 15 8
Results and Discussion 65
5 Experiments towards the Directed Evolution of PAMO
Proper folding is a prerequisite for molecular recognition, so thermostability should
correlate with mutational robustness and, therefore, with evolvability as discussed
above.[171, 178, 219] Hence, PAMO should be an evolvable enzyme and ideally suited
for a directed evolution experiment. The goal was to find PAMO variants which are
able to replace CHMO in stereoselective biotransformations while preserving the high
stability of PAMO. The development of such variants would certainly impact the use
of the BVMO enzyme familiy. Even though the above mentioned PAMO variants
PAMO-P1, -P2, and -P3 showed a significantly improved performance over the wild
type enzyme, they were not well adopted to, for example, the oxidation of non-
aromatic cyclohexanone derivatives or more complex and synthetically relevant
substrates (see Table 5) as found by a substrate screening carried out by the
Mihovilovic group.[220] Therefore, a directed evolution approach appeared to be
appropriate and promising, especially since a crystal structure of the enzyme was
available, which would aid to some degree in the design of the libraries using the
CASTing strategy.
5.1 The Saturation Mutagenesis of a Known Hot Spot Yields Implications for Directed Evolution Experiments
In a first series of experiments, a saturation library starting from PAMO-P2 was
created to investigate the effect of different residues at position 441, the hot spot that
led to the discovery of the hit mutants PAMO-P2 and –P3. Significant differences in
terms of both activity and stereoselectivity were found between mutants P2 and P3,
which in fact represented two members of the planned library. Mutagenesis was
carried out by site-directed mutagenesis using whole-plasmid amplification with
defined primers. The library was assayed twice using 2-phenylcyclohexanone (23a)
and bicyclo[3.2.0]hept-2-en-6-one (25) as substrates to investigate the effect of
different mutations on the activity and stereoselectivity of the enzyme. Due to the
small number of clones, all reactions were carried out in a 20 ml scale in whole cell
catalysis using the above described protocols. A significant variation of activity
between the different mutants was found in the oxidation of ketone 23a, ranging from
almost no conversion to rates comparable to PAMO-P3. However, in each case
Results and Discussion 66
ketone 25 yielded high to excellent ee-values for the products and almost full
conversion (see Table 14).
Table 14: Conversion and enantioselectivity of mutants obtained by saturation mutagenesis of the hot spot 441 in PAMO-P2. Substrates 23a and 25 were used as model compounds. Reaction times: Substrate 23a: 6 h, substrate 25: 24 h. Compound 26: abnormal lactone, 27: normal lactone. In case of substrate 23a, ee-values are only given for conversions higher than 15%. Reference values for 23a: P1: 17% conv. 93% ee (R); P2: 34% conv. 88% ee (R); P3: 58% conv. 75% ee (R). All mutants were generated by whole-plasmid amplification using the primers PAMO-SAT-xy (Table 33).
Position Ser441 replaced by Substrate Conversion / % ee-value / %
Alanine 23a 20 96 (R)
25 97 90 (-)26 / >99 (-)27
Phenylalanine 23a 20 96 (R)
25 98 95 (-)26 / >99 (-)27
Isoleucine 23a 16 n.d.
25 98 92 (-)26 / >99 (-)27
Methionine 23a 12 n.d.
25 99 95 (-)26 / >99 (-)27
Aspartate 23a 5 n.d.
25 95 92 (-)26 / >99 (-)27
Glutamine 23a 13 n.d.
25 99 93 (-)26 / >99 (-)27
Glutamate 23a 8 n.d.
25 99 94 (-)26 / >99 (-)27
Asparagine 23a 9 n.d.
25 97 95 (-)26 / >99 (-)27
Cysteine 23a 4 n.d.
25 92 88 (-)26 / >99 (-)27
Histidine 23a 6 n.d.
25 98 92 (-)26 / >99 (-)27
Arginine 23a 4 n.d.
25 95 89 (-)26 / >99 (-)27
Lysine 23a 14 n.d.
25 98 90 (-)26 / >99 (-)27
Proline 23a 15 n.d.
25 97 95 (-)26 / >99 (-)27
Threonine 23a 11 n.d.
Results and Discussion 67
Position Ser441 replaced by Substrate Conversion / % ee-value / %
25 98 91 (-)26 / >99 (-)27
Tryptophane 23a 18 98 (R)
25 99 94 (-)26 / >99 (-)27
Valine 23a 23 97 (R)
25 >99 90 (-)26 / >99 (-)27
Glycine 23a 29 96 (R)
25 >99 93 (-)26 / >99 (-)27
These values led to interesting observations. Apparently, for the oxidation of the
strained bicyclic ketone 25, only the deletion of the SAL bulge (see II4.1) is of
importance to induce high activities and high selectivities. For the cyclohexanone
derivative 23a both activity and selectivity strongly depend on the exact amino acid
that pointed towards the catalytic Arg337 (compare Figure 27, page 54). By chance,
in this case the first experiments for the deletion of the SAL bulge have already
yielded the optimal biocatalyst for this reaction, namely PAMO-P3. However, for
directed evolution of both enantioselectivity and substrate scope of PAMO, this
position must not be neglected for fine tuning.
Results and Discussion 68
5.2 Directed Evolution of PAMO towards an Expanded Substrate Scope Using the CASTing Strategy
5.2.1 Applying the CAST Principle to PAMO The ultimate goal of the enzyme engineering of PAMO would be to have well
described variants that can catalyze the selective oxidation of a broad substrate
range. As mentioned in the introduction, a promising strategy to improve the
substrate scope and the enantioselectivity of enzymes was recently developed in our
group. The Combinatorial Active-Site Saturation Test (CAST) utilizes simultaneous
randomization of two or more residues by saturation mutagenesis. The selection of
the positions is knowledge driven and based upon an available crystal structure or
homology model of the enzyme. Normally, the active site residues are selected within
a radius of up to 10 Å around the proposed substrate binding site.
To commence directed evolution of PAMO, in a first step, the property to be
screened for was defined. Since the substrate scope should be enlarged, a number
of substrates were selected for screening. The major criteria for their selection were
structural diversity on the one hand, commercial availability and a relationship to
substrates of other BVMOs on the other hand (for review on BVMOs and their
substrates see ref.[117]) Nine different compounds were selected to increase the
probability of finding a hit mutation (see Figure 32 and Figure 33).
OO
OO
O
O
H
O
HO
32 33 34 35
36 37
Figure 32: Mixture A of ketones for PAMO library screening. 32: 3,3-dimethylcyclohexanone; 33: 2-decalone; 34: 7-methoxy-3,4-dihydronaphtalen-1(2H)-one; 35: 4-methylcyclohexanone; 36: progesterone; 37: cyclododecanone. Compounds 36 and 37 are name-giving substrates for two BVMOs: Steroid Monooxygenase (SMO) and Cyclododecanone Monooxygenase (CDMO).[117]
Results and Discussion 69
O O O
25 38 23c
Figure 33: Mixture B of ketones for PAMO library screening. 25: known substrate for PAMO, the goal is to change the regio- and stereoselectivity of the oxidation; 38: adamantine-2-on; 23c: 2-allylcyclohexanone. Compound 23c was initially assumed not to be a substrate for any of our previous PAMO mutants and chosen as a non-aromatic model compound. Preliminary experiments revealed that it is a substrate for PAMO-P3 and converted with low enantioselectivity (see chapter II4.3).
The selection of the residues to be randomized was much more complex. The
application of the CASTing strategy to PAMO was complicated by the fact, that no
substrate or inhibitor was bound to the enzyme in the crystal structure and by the
high probability of crystal artifacts in 1W4X (see chapter II3). Therefore, the library
design had to base upon molecular modeling or experimental intuition to identify the
substrate binding site. PAMO libraries were planned based upon the idea that
Arg337 plays a vital role in catalysis and thus, the mutations should be concentrated
within a radius of less than 10 Å around this position (see Figure 34). The selection of
the residues was assisted by an alignment of BVMOs with different substrate scopes
(see Supporting Information VII1.1), since strictly conserved amino acids could be
excluded this way. In libraries A to C, in each case two positions were randomized
simultaneously, whereas library D comprised four different positions. The
simultaneous randomization of four different residues would have resulted in an
enormous library size, especially with several substrates to be screened for;
therefore approaches to minimize the screening effort had to be found (see below).
The directed evolution started from PAMO-WT and not, for example, from mutant
PAMO-P3, because the absence of the SAL bulge in BVMOs was restricted to
Cyclohexanone Monooxygenase (see alignment VII1.1).
Results and Discussion 70
Figure 34: Selection of residues for CAST libraries of PAMO. FAD and Arg337 are shown in sticks. Residues 152 and 153 (Lib A, green), residues 338 and 339 (Lib B, red), residues 334 and 335 (Lib C, orange), and residues 441-444 (Lib D, blue) are shown in ball-and-stick depiction. Conserved residues, as indicated by an alignment of all known BVMOs, were excluded from the libraries (see alignment VII1.1).
Cyclopentanone Monooxygenase (CPMO), for example, shows a significantly
broader substrate scope than CHMO, including high activity in the oxidation of bulky
substrates,[221-224] but carries the bulge according to our alignment studies. In
addition, as a rule in enzyme engineering, one should always introduce as few
mutations as possible during a directed evolution procedure. This minimizes
destabilization of the enzyme, as for example in case of CHMO, the enzyme turned
increasingly unstable with the accumulation of too many mutations.
5.2.2 Approaches to Minimize the Screening Effort Several ideas to limit the screening effort which was accompanying such a big
diversity of substrates and residues were developed. First, a reduced set of codons
was proposed to replace the usual NNK (IUPAC code; 32 codons, 20 AA encoded, 1
stop codon included). The degeneracy used for the first generation primers was NNT
(IUPAC code; 16 codons, 15 AA encoded, no stop codon included).[173] When two
codons at once were randomized using this degeneration, the total screening effort
was reduced to 765 colonies instead of 3,066 colonies as in case of NNK-
Lib A
Lib B
Lib C
Lib D
Results and Discussion 71
degeneration (for three codons: 12,269 colonies (NNT) to 98,163 colonies (NNK)). At
the same time, the diversity of the library was somewhat lowered, as several amino
acids were not included any more (Gln, Glu, Lys, Met, Trp). However, we hoped that
these amino acids would not be vitally important, except, of course, for later stage
fine tuning experiments.
A second idea to limit the screening effort, which was used in combination with the
first one, was to use substrate and clone mixtures. Later, this approach has also
been proposed and discussed by Bommarius et al.[225] This so called pooling of a
library was an established method for example to increase the throughput in
screening assays for lead optimization in combinatorial chemistry.[226] Screening of
enzyme libraries from directed evolution experiments shared the same "needle in a
haystack" situation. However, several complicating factors had to be considered.
Each member of a library potentially had a different level of activity, which might lead
to undetectable conversions if the corresponding enzyme is further diluted in a pool
of others. Hence, interesting mutations might be missed and any screening strongly
depended on the sensitivity of the detection system. In addition, mutants might differ
in their expression efficiency and several clones of E. coli which are mixed together
in a pool might influence each other in an unpredictable manner. For example in later
stages of expression, the culture would be dominated by the initially very low number
of clones which might have lost their plasmid.[184, 225] We nevertheless decided to use
clone mixtures for the screening reaction due to the enormous potential of this
strategy in reducing the screening effort.
To minimize disturbing effects resulting from the mixtures, the expression was carried
out in independent deep well plates. Afterwards, eight different expression cultures
were pooled to yield one reaction culture. The effect was an eight-fold increased
screening throughput. A further increase was initially expected to result from the
parallel use of substrate mixtures (Mixture A and mixture B, see Figure 32 and Figure
33). In this scheme, up to six different ketones were added simultaneously to a
mixture of eight clones, yielding 48 different screening reactions in one single well,
hence yielding as well 48 different read-outs in the following screening within one
measurement. In comparison, the effect of a reduced codon set on the library size
was comparably low (four-fold acceleration in case of NNT instead of NNK). As
described above, in case of libraries A to C, two positions were randomized
simultaneously, whereas library D comprised four different positions, resulting in an
Results and Discussion 72
enormous library size, even though NNT degeneration was used (total screening
effort: 196,326 clones, screening for the conversion of six different substrates: >1.1
million clones). By means of pooling, this number decreased to 24,540 screening
reactions in total, which corresponded to approximately 255 deep-well-plates (DWP).
Of course an undersampling of the library could not be avoided, but this was not
dramatic any more. In addition, this screening yielded the information about the
catalytic properties of the mutants gained from almost 400,000 reactions. In case of
two positions comprising one library, the screening effort would be only one 96 well
DWP per library, yielding the results from more than 1,500 different reactions.
In summary, a combination of NNT-degeneration and pooling of a library resulted in a
768-fold reduction of the screening effort when six different substrates were used.
Overall, a scheme for the directed evolution of PAMO using substrate and clone
mixtures was developed as follows (for a detailed protocol see IV8.3).
Screening of the libraries relied on whole cell catalysis followed by GC analysis. In
the past the Mihovilovic group has shown that a large diversity of ketones can be
oxidized using whole cell catalysis, therefore we were expecting this straightforward
approach to be appropriate.[147, 170, 221, 224, 227-232] Library creation was performed by
whole-plasmid amplification using degenerate primers. The amplification product was
used to transform E. coli TOP10 cells. The functional expression of PAMO in DWP
was carried out in LB-medium at 37°C. Following the expression, eight different
plates were pooled into one in a way that all eight wells from a given position of the
plates, for example A1, were mixed. Afterwards, the cultures were supplemented with
glycerol and heat activation of the PAMO mutants was carried out by shaking for
45 minutes at 42°C. This protocol differed from one used for PAMO catalyzed
reactions on the 20 ml scale, since the heat transfer rates in the rotary incubator at
42°C using the DWP as containers for the cultures were significantly lower (for
comparison see II4.3). Finally, 2-hydroxypropyl-β-cyclodextrin and substrate mixture
A (Figure 32) dissolved in acetonitrile were added. The reactions were analyzed by
non-chiral GC (Figure 79, page 176). This procedure was optimized and tested using
libraries A and B in combination with substrate mixture A. However, an accumulation
of screening artifacts was found during the screening of these libraries. A
considerable number of false-positive hits were found which required efforts to be
validated. Overall, it was decided, that the combination of clone mixtures and
substrate mixtures probably resulted in too high a complexity of the mixture, leading
Results and Discussion 73
to non-reproducible results. The libraries were rescreened without the use of clone
mixtures and the results were only slightly better, still the number of false-positives
was high. Thus, we decided to abandon the idea of substrate mixtures in the CAST
experiments, at least under the given circumstances using a GC as the screening
device.
5.2.3 An Individual Degeneration for each Codon in a CASTing Library The planning of the libraries had to be readjusted. The general use of the NNT
degeneration would have resulted in such a large library size, at least for library D,
that the library coverage would have been intolerably small. A new plan was based
upon the following idea. The substrate scopes of the different BVMOs varied
considerably.[117, 119, 142, 145] Hence, if the diversity of a given active site position
throughout all known BVMOs comprised for example only five different amino acids,
we concluded that this was the diversity necessary to generate the observed
variations in the substrate scope. Thus, this would be the minimum diversity that
needed to be included in the CAST libraries. Based on this principle, the alignment of
the BVMOs (see Supporting Information VII1.1) was inspected and new primers were
designed with individually different codons for every position (Table 15). Libraries
based on these degenerations are currently under study.[233]
Table 15: Libraries for CASTing experiments of PAMO. The positions are selected based in the crystal structure; the degenerations are in each case based on an analysis of alignments of a number of other BVMOs with PAMO. Codons: Number of codon combinations encoded by a specific library; Total Screening Effort: Gives the number of colonies which must be screened to obtain theoretical 95% library coverage (oversampling).
Library Position Degeneration Codons Total Screeening effort / colonies
Lib A 152 BHK
153 KKG 72 214
Lib B 338 VYA
339 NBC 72 214
Lib C 334 DDK
335 DBC 162 484
Lib D 441 KCA
442 KBG
443 BDC
444 NSC
864 2587
Results and Discussion 74
Another option for the library design would be an epPCR guided selection of the
positions for saturation mutagenesis.
Table 16: Known CHMO hot spots and the corresponding positions in PAMO. The combinations of mutations that lead to an improvement of CHMO in terms of either enantioselectivity and / or substrate scope are transferred to PAMO. Positions L443 and S444 are part of the SAL bulge in PAMO, in order to mimic the mutations of CHMO in PAMO, mutant P2 or P3 must be used as a starting point, which ensures a similarily shaped active site starting structure. ee: improved enantioselectivity of CHMO; Substrate scope: broadened substrate scope of CHMO.
CHMO-Mutations Effect on CHMO PAMO-Positions
F432Y, K500R ee L443, P511
L143F ee Q152
L426P, A541V ee A435, S552
L220Q, P428S, T433A ee / Substrate scope L230, P417, S444
D41N, F505Y ee D50, L516
K78E, F432S ee / Substrate scope T87, L443
In this case, the hot spots found by epPCR in CHMO (chapter II1) directly lead to the
identification of the corresponding homologous positions in PAMO via an alignment
(Table 16). These positions plus their neighbors could be randomized following the
basic idea of CASTing. However, this concept was not yet completely put into
practice, even though a number of these positions were already part of the CASTing
libraries described above in this chapter (residues 152, 443, 444).
5.2.4 Conclusions and Implications for Directed Evolution Experiments This project started with the ambitious plan of evolving PAMO in several directions in
parallel. Nine structurally diverse substrates were used to identify PAMO variants
mainly with a broadened substrate scope in comparison to the wild type enzyme. To
reach this ambitious goal, a number of obstacles had to be solved. One was the
selection of the saturation sites based on the structure of an inactive conformation of
PAMO, a problem which is still remaining and is not easy to eliminate. Another hurdle
of almost equal complexity and of general concern in directed evolution projects was
the large size of the enzyme libraries, which have lead to a large screening effort.
Several approaches to limit this effort were proposed and tested in this project. The
major result so far was that the complexity of screening assays should be kept low,
as a high diversity of chemical entities can apparently lead to a chaotic behaviour of
Results and Discussion 75
the system. This unpredictable behaviour prohibited the use of mixtures of substrates
in one reaction, but we can still assume that clone mixtures will be of use in the
running CASTing experiments using PAMO which are still going on.
6 Stereoseletive Oxidations on a Preparative Laboratory Scale using a BVMO as Catalyst
6.1 Application of BVMOs – The Case of Whole Cell vs. in vitro Catalysis
Procedures for large scale applications of BVMOs, with an emphasis on industrial
applications, have been intensively studied by several groups. However, procedures
for biocatalytic BV oxidations on gram scale in a chemical laboratory have been
largely neglected up to date.[100, 195, 234-240] The large scale applications of CHMO
required considerable investments into equipment, especially fermenters, and
necessitated specialized personnel. We reasoned that the development of such
protocols might lead to a small number of industrial processes. But to achieve broad
acceptance among synthetic organic chemists, practical procedures had to be
developed. For this, the overriding principle had to be simplicity, which was certainly
not given when complex bioreactors are used. We decided to develop such a
protocol using PAMO or one of its mutants as the enzyme of choice. PAMO had the
strong advantage over the other known BVMOs that it was much more stable, which
certainly facilitated the ease of handling and hence the reproducibility of the
biotransformations.
In the course of developing such a protocol, we were first left with the choice
between whole cell and in vitro catalyis. To evaluate the pros and cons of each
approach a number of factors had to be considered (see Table 17).
Table 17: Pros and cons of using whole cells versus in vitro biocatalysis. Table adopted in a shortened form from K. Faber, Lit. [1].
Biocatalyst Formulation Pro Con
“isolated”
enzyme
Any Simple apparatus,
simple workup
Higher productivity
due to higher
concentration
Cofactor recycling necessary
Results and Discussion 76
Biocatalyst Formulation Pro Con
Dissolved in
water
High enzyme activity Limited substrate solubility;
workup requires extraction
Suspended in
organic
solvents
Simple experimental
setup, high substrate
solubility, simple
enzyme recovery
Lowered enzyme activities
Immobilized Simple enzyme
recovery
Loss of activity during
immobilization and low specific
activity of the immobillizate
Whole cells Any No cofactor recycling
necessary, no
additional enzyme
preparation necessary
Expensive equipment, tedious
workup due to large volumes, low
productivity, side reactions
possible due to uncontrolled
metabolism, toxicity effects
In the end we decided that the in vitro approach would be most suitable, if we wanted
to address synthetic chemists with our protocol. Using a cofactor recycling system
the high cost of the nicotinamide cofactor could be reduced to an extent that would
not matter any more up to gram scale conversions. Also, PAMO’s stability as the
major advantage of this enzyme would become more visible in in vitro catalysis.
However, mainly in order to be able to perform a distinct comparison, but also
curiosity driven, we decided to first investigate some whole cell catalyzed reactions.
Also in these experiments, we tried to keep the procedures simple and excluded
complex devices from our experiments. Later on, a robust and efficient protocol for
the preparative application of PAMO-P3 on a gram-scale of product was developed
using in vitro catalysis.
6.2 Whole Cell Catalysis Experiments
6.2.1 Using a BVMO in Dynamic Kinetic Resolutions A major issue in kinetic resolutions is the maximum useful conversion of 50%, which
means that half of the final reaction mixture is the formed product and the other half
is the remaining educt, which has to be separated in an in most cases tedious way.
As normally only one stereoisomer is desired, the other one has to be discarded. A
Results and Discussion 77
possibility to overcome this limitation is to continuously racemise the educt while
selectively consuming one educt enantiomer in the simultaneously running kinetic
resolution (Scheme 13).[1, 241-245] Both substrate enantiomers can thus be converted
into a single enantiomer of the product with 100% theoretical yield. A number of
successful examples for such dynamic kinetic resolutions (DKR) have been reported
in the literature. There are chemical methods[246] and combined chemical and
biocatalytical methods.[247-249] Two paramters are of major concern in the setup of a
DKR. First, the two reactions, racemization and kinetic resolution, have to be
compatible with each other, which in case of combined chemical / biochemical
catalysis in most cases cannot be taken for granted.
O
O
O
O
O
O
PAMO-P3
O2
(R)-23a
(S)-23a
(R)-24a
(S)-24a
O-
OH-
OH-
Scheme 13: Scheme for the dynamic kinetic resolution of 2-phenylcyclohexanone. PAMO-P3 as the catalyst for the resolution reaction preferably catalyzes the oxidation of the R-enantiomer of the starting material. The continous racemization is brought about by base treatment.
Second, the racemization reaction must be at least as fast as the kinetic resolution
reaction to ensure the continuous presence of a racemate.[244] We decided to
investigate the DKR of 2-phenylcyclohexanone (23a) as a model system for the use
of PAMO in such a reaction (see Scheme 13). A similar experiment has been
reported by Furstoss et al. before, but the use of the unstable CHMO in that study
limited the efficiency of the reaction.[250] Racemization was brought about by
treatment with base and concomitant formation of the prochiral enolate. E. coli was
known to tolerate pH-values up to pH 9, a value which was therefore used in the
experiments. E. coli TOP10 expression cultures of PAMO-P3 were grown on a 20 ml
scale as described in chapter II4.3. Prior to substrate addition the pH was adjusted to
pH 9.0 by the addition of KOH or NaOH. The course of a representative reaction is
shown in Figure 35 (for a detailed protocol see IV9.6). Indeed, we found that this
scheme was successful, yielding the product lactone 24a at almost full conversion
Results and Discussion 78
(>95%) with an ee-value of 45% (R). For comparison, in the absence of base, the
enantiomeric excess of 24a at the maximum conversion that was reached (85%) was
only 33% ee (R).
0 5 10 15 20 250
20
40
60
80
100
0
20
40
60
80
100
Con
vers
ion
/ %
Time / h
ee
(lact
one)
/ %
Figure 35: A dynamic kinetic resolution of 2-phenylcyclohexanone (23a) using PAMO-P3 in a whole cell catalysis. Racemization of the substrate is accomplished by adjusting the pH of the culture to ~ pH 9.0, in the case shown here using NaOH as base, resulting in a final concentration of 4 g/l NaOH. A significant enhancement of enantioselectivity at conversions higher than 50% was achieved in comparison to reactions in the absence of additional base.
In addition, the speed of the reaction was comparable to control experiments in the
absence of base, indicating a sufficient viability of the cells and full activity of PAMO-
P3 under these conditions. Therfore, a simultaneous racemization and kinetic
resolution could be imagined to be feasible in comparison to the results reported by
Furstoss et al. However, the chemical racemization reaction was slow in comparison
to the biocatalytic Baeyer-Villiger oxidation which caused diminished ee-values of the
product. Higher pH-values, which would accelerate racemization, would not be
compatible to the use of E. coli. Hence, an option for optimization would have been to
reduce the concentration of the biocatalyst thereby slowing down the oxidation
reaction. Recently, Furstoss et al. published an improved procedure for a DKR, again
using whole cell preparations of CHMO as the catalyst for the resolution reaction.[251]
In this optimized protocol, the reaction was carried out at nearly neutral pH and the
racemization was brought about by the use of an anion-exchange resin, which
continuously absorbed, racemized and desorbed the starting material. At a
conversion of 83%, the corresponding product lactone in this case was isolated with
Results and Discussion 79
>98% ee, which was clearly superior to our preliminary results. Nevertheless, the use
of PAMO-P3 was promising in such a setup, since we have not found any inhibition
of PAMO-P3 under the racemization conditions used, which was not achieved by
Furstoss et al. using CHMO in their initially comparable approach.
6.2.2 Two-Phase Biotransformations using Whole Cells Initial experiments to enable a preparative whole cell catalysis using PAMO mutants
in the oxidation of bicyclo[3.2.0]hept-2-en-6-one (25) showed that the conversion was
strongly depending on the substrate concentration (Figure 36).
0 2 4 6 8 10 12 14 160
20
40
60
80
100
conv
ersi
on /
%
Concentration of bicyclo[3.2.0]hept-2-en-6-one / g/l
Figure 36: Substrate inhibition by bicyclo[3.2.0]hept-2-en-6-one in the oxidation of this compound by whole cell preparations of PAMO-P3.
Concentrations higher than 1 g/l led to diminished conversion, at concentrations
higher than 2 g/l almost no conversion was detected. This phenomenon was
described in the literature for CHMO. The optimum concentration of 25 for CHMO
was between 0.2 and 0.4 g/l and at product concentrations above 4.5 to 5 g/l the
specific activity of the whole cells fell to zero. In addition to this apparent substrate
inhibition, the scale up of this oxidation was also hampered by product inhibition[237]
and substrate toxicity.[252]
The minimum inhibitory concentrations were slightly better for PAMO and and
PAMO-P1, -P2, and -P3. Nevertheless it became obvious that the scale-up of this
particular reaction would not become trivial, as such low substrate concentrations
could not be tolerated in preparative reactions.
Results and Discussion 80
The groups around Furstoss and Woodley reported the development of a
methodology to overcome the substrate inhibition by compound 25 on CHMO. In
detail, they used a resin as a solid support to for a reactant feeding and in situ
product removal (ISPR) approach.[234-236]
O
OO
CHMO
O2 H2ONADPH
NADP+
cofactor regeneration &metabolism
absorbant
E. coli cell
Scheme 14: Simplified scheme of an in situ substrate feed and product removal process using a two-in-one resin.[236] Both substrate and product are in an equilibrium between resin-bound and free form.
We decided to transfer this process to a laboratory scale reaction, which was not
necessarily straightforward. It was described that factors such as oxygen uptake and
carbon source feed had to be carefully monitored and adjusted to obtain good
results, which was not feasible if we restricted ourselves to simple equipment.
However, several different resins were tested in these experiments using a PAMO-
P3 expression culture in shaking flasks supplemented with the substrate bound to to
the resin. The resins were:
− Dowex Optipore L493
− Lewatit VPOC 1164 MPPH
− Amberlite XAD-4
− Amberlite XAD-7 HP
General handling and loading of these solid phases with substrate was done using a
literature protocol.[236] Afterwards, the resins were added to the culture (60 mg
substrate /100 mg solid phase / 20 ml of culture) and the mixtures were incubated in
an Erlenmeyer flask at 37°C (for a detailed protocol see IV9.8). Only the use of
Dowex Optipore L493, the resin that was reported to be optimal for this application by
Furstoss and coworkers, was found to yield product. However, already at a
concentration of 25 of 3 g/l signifcant loss of conversion was observed, which could
not be overcome using this simple experimental setup.
Results and Discussion 81
Table 18: PAMO catalyzed oxidation of ketone 25. The total concentration of substrate was 3 g/l. The reactions were carried out at 37°C in an Erlenmeyer flask. Scale: 20 ml of culture / 60 mg substrate. The whole cell preparations of PAMO and its mutants were prepared as described in chapter II4.3, 5 g/l glycerol was added in each case before heat-activation. The cultures were afterwards mixed with the resin bound substrate. Solid phase and liquid supernatant were extracted separately and the conversion was monitored via GC.
Medium Enzyme Conversion / %
aqueous phase solid phase total
LB + glycerol PAMO-WT 38 24 33
PAMO-P1 26 20 24
PAMO-P2 70 47 63
PAMO-P3 78 68 75
TB + glycerol PAMO-WT 79 41 49
PAMO-P1 96 69 76
PAMO-P2 29 16 20
PAMO-P3 68 42 50
Using an organic solvent instead of a resin as the second phase in biocatalysis has
been studied by numerous groups in the past, from academia as well as from
industry, especially with a view on preparative applications.[1, 95, 96, 99, 253, 254] It was for
example used to overcome low substrate solubilities and to solve problems like
substrate or product inhibition.
We therefore turned our attention to two-liquid-phase catalysis. E. coli was known to
tolerate non-miscible solvents in high concentrations, the level of tolerance
depending on the hydrophobicity of the organic phase. Solvents possessing a logP-
value >8.0 were known to be tolerated very well (logP-rule, Lit. [254]). Based on this
available knowledge, we tested several solvents for their efficiency in supporting the
oxidation of ketone 25 by PAMO-P3. From the solvents tested, dioctylphtalate was
found to best suited for this purpose as it could be anticipated based on its high logP-
value (9.6; [254]). More polar solvents such as octanol were found to be not applicable.
To enable a preparative scale biocatalysis using dioctylphtalate as the second liquid
phase, the following setup was developed (for a detailed protocol see IV9.7). A 20 ml
expression culture of PAMO-P3 was prepared as described above using TB-medium
and after heat-activation the culture was mixed in a three-necked chemistry flask with
20 ml dioctylphtalate and 120 mg (3 g/l) ketone 25. The mixture was stirred and air
was bubbled through the reaction. After 24 h, full conversion was found in both
Results and Discussion 82
phases, which was better than the results obtained using a solid phase support.
However, conversion began to level off at elevated concentrations.
Overall, by using a second phase, being either a solid or a liquid one, the
concentration of the difficult substrate bicyclo[3.2.0]hept-2-en-6-one (25) in the
biocatalytic oxidation by PAMO-P3 could be increased three-fold while maintaining
the high conversions. Throughout all these experiments, only simple and low-cost
equipment was used, which was a premise in this project. Anyhow, it became
apparent that using whole cell preparations of PAMO, no simple and truly efficient
protocol for preparative biocatalytic Baeyer-Villiger oxidations would be
accomplishable. A significant improvement could only be expected using more polar
organic phases which allow more favorable partitioning of the reactant between
aqueous and organic phase. Such organic solvent, however, were not compatible
with whole cell catalysis.[254] A major general argument in addition to these
experimental results was, however, that many organic chemists do not have the
equipment or the education to run whole cell catalysis experiments due to the obove
mentioned difficulties (Table 17).
6.3 In Vitro Catalysis Experiments
6.3.1 Introduction We therefore concluded that in the case of BVMOs only in vitro biocatalysis had the
potential of achieving true preparative relevance for the majority of organic chemists.
The benefits and challenges of in vitro biocatalysis could be summarized as follows.
The benefits were:
− The reaction was independent of bacterial cells – toxicity of the substrate did
not matter
− High substrate concentrations were possible when organic (co)solvents were
used
− A better control of the conditions was possible, since a defined reaction
system could be achieved
The challenges were:
− The enzyme might become unstable in organic solvents or at high substrate
concentrations
− A cofactor recycling was necessary
Results and Discussion 83
− A purification or enrichment of the enzyme was often necessary
En route to the goal of rendering BVMOs truly practical catalysts, these challenges
had to be met. A great one emerged with the necessity to increase the efficiency of
the BVMOs, specifically in terms of volumetric activites and cost efficiency of the
enzyme and cofactor. As in part discussed in the previous chapter the solubilities of
the hydrophobic substrates as well as possible effects such as substrate or product
inhibition had to be addressed in particular. At the same time activity and stability of
the biocatalyst under the resulting unnatural reaction conditions had to be preserved.
In detail, organic solvents usually have an adverse effect on stability, yet they may
well be necessary in order to reach high space-time yields.
In the present chapter the aforementioned limitations are addressed. The
preparative-scale enantioselective BV-oxidation of rac-bicyclo [3.2.0]hept-2-en-6-one
(25) (mainly complicated by substrate inhibition) and 2-phenylcyclohexanone (23a)
(mainly complicated by low substrate solubility) was developed in a way that any
synthetic organic chemist can perform. In particular it was demonstrated that PAMO
could be stabilized in an aqueous-organic two-liquid phase medium under reaction
conditions with high concentrations of several substrates. A general strategy for the
practical biocatalytic preparation of enantiopure lactones based on BVMOs is
proposed.
6.3.2 Choosing the Experimental Setup In vitro catalysis using a redox enzyme such as PAMO necessitats efficient recycling
of the cofactor NADPH. For this purpose a number of systems have been described.
Indeed, several enzymes for recycling systems are commercially available.[255-258] For
efficient BV-oxidation catalysis with PAMO, the regeneration system has to fulfill
several requirements. The enzyme needs to be easily available. For this purpose an
E. coli expression system was considered to be appropriate due to the ease of
handling this microorganism. The recycling enzyme has to be thermostable at least
to the extent of the production enzyme PAMO, and in addition it has to exhibit a high
degree of tolerance towards organic solvents. We speculated that thermostable
alcohol dehydrogenases may meet these demands and decided to use the
secondary alcohol dehydrogenase (2°ADH) from Thermoanaerobacter
ethanolicus.[259-264] This 2°ADH oxidized secondary alcohols such as isopropanol to
Results and Discussion 84
the corresponding ketones, thereby recycling one equivalent of NADPH which can
then be utilized by PAMO in a coupled reaction (see Scheme 15).
O
O
O
O
O
O
NADPH NADP+
R
OH
R
O
organic phase
aqueous phase
O2 H2O
PAMO
2°ADH
R = -CH3, n-C3H7
39 40
Scheme 15: Two-liquid phase catalysis for the BVMO catalyzed BV oxidation. The substrate, in this case phenylacetone, is mainly present in the organic layer, whereas the BVMO and the 2°ADH, the recycling enzyme, are present in the aqueous phase, where the reaction proceeds.
Preparation of this enzyme from an overexpressing E. coli strain proved to be
straightforward, simple heat treatment being sufficient to purify it up to near
homogeneity.[259]
6.3.3 The Stabilization of PAMO in the Presence of Organic Solvents Of major concern in these experiments was the behaviour of the production enzyme,
PAMO, in the presence of organic solvents. In order to stabilize PAMO in the
presence of an organic phase, we evaluated various buffer additives such as sugars,
non-ionic detergents, and bovine serum albumin (BSA) which were known to exert
beneficial effects on other enzymes.[265] The most pronounced effect on the stability
of the enzyme resulted from the use of detergents.
Results and Discussion 85
Table 19: Substances assayed as stabilizing additives (semi-quantitative weighing). 0 = no significant effect on enzyme stability, + - +++ = increasingly beneficial effect on stability, - = negative effect on stability. Also mixtures of these additives in variying concentrations were tested. An exact quantification of the residual activities was not possible due to the presence of organic solvents in the assays.
Additive Effect Remark
Monosaccharides: glucose /
xylose
+ / 0 Beneficial effects of sugars have been
described for other enzymes [265]
Disaccharides: saccharose /
lactose
0 / +
Sugar alcohols: sorbitol / mannitol 0 / 0
Bovine Serum Albumin (BSA) + For beneficial effects see Lit. [265]
Non-ionic detergents: Triton X-
100/ Tween-20/ Tween-80
- / +++/
++
FAD ++ Stabilizing effect of FAD is described in ref. [200]
Catalase 0 Catalase might stabilize enzyme towards
H2O2
Overall we found a buffer consisting of 50 mM Tris-HCl (pH 8.5 at RT, corresponding
to pH 8.0 at 40°C), 2 g/l BSA, 5% (w/v) glucose, 5% (w/v) lactose, and 0.1% (v/v)
Tween-20 to be optimal in maintaining PAMO stability. The influence of different
solvents was then assayed in a 1:1 mixture under the reaction conditions envisaged
(40°C, vigorous mixing). From the given selection of solvents, cyclohexane proved to
be most suitable, exhibiting moderate influence on PAMO-stability, and methyl tert-
butyl ether (MTBE) was found to be second best. However, in the case of
cyclohexane, 50% of the initial enzyme activity was lost during the first five minutes
of incubation (see Figure 37). For the other solvents this effect was even more
pronounced. After this initial short period the loss of activity of the enzyme proceeded
much slower. The 2°ADH showed less dependency of its activity on the solvent and
buffer composition and was generally more stable than PAMO.
Results and Discussion 86
Figure 37: Effect of different solvents on the stability of PAMO, measured as residual activity. For cyclohexane as second phase values in 50 mM Tris-HCl and in optimized standard buffer are given, the results for the other solvents are shown only using the standard buffer. The first data points represent the residual activity after five minutes. The half-life time was measured by NADPH-depletion assays after prolonged incubation time under reaction conditions (40°C, vigorous mixing, solvent/buffer : 1/1).
Interestingly, no apparent correlation could be drawn between the hydrophobicity of
the solvent (expressed as logP) and the PAMO activity and stability, as it was found
in the case of whole-cell catalysis.[254] This is in agreement with results found
previously for other systems.[266]
6.3.4 Preparation of the Enzymes We decided that the enzymes should be easy to prepare and to handle without
cooling or other special precautions. To do so, we used the clarified lysate of the E.
coli cells after the expression of PAMO and heat-treated it at 50°C for 1 h (protocol
IV15.2). Following centrifugation to again clarify the lysate, the resulting enzyme
solution was used without further purification (see Figure 38). The fraction of PAMO
of the total protein was estimated densitometrically to be around 35%, the total
protein concentration as measured by a Bradford assay was 800 µg/ml, resulting in a
Results and Discussion 87
specific activity of 3.75 U/mg of total protein (1 U corresponds to the amount of
enzyme that consumes 1 μmol/min of NADPH at 25°C).
Figure 38: 10% SDS-PAGE analysis of preparations of PAMO-WT and PAMO-P3. Lane 1: PAMO-WT after heat treatment. Lane 2: PAMO-WT before heat treatment; Lane 3: PAMO-P3 after heat treatment; Lane 4: PAMO-P3 before heat treatment. Lane 5: Size standard. By heat treatment PAMO is slightly enriched within the lysate.
For the 2°ADH we proceeded in a similar way and purified the enzyme by heat-
treating the E.coli cells resuspended in Tris-buffer at 85°C for 15 min, followed by 15
min at 72°C, and afterwards centrifuged as above (protocol IV18). The resulting
enzyme solutions could be stored at room temperature for days or at 4°C for weeks
without significant loss of activity. For long term storage aliquots of the enzyme
solutions were frozen at -80°C.
6.3.5 Upscaling of the Enzymatic Reaction Optimization of the reaction conditions was then performed using the cheap
phenylacetone (39) and PAMO-WT as a model system. The setup for the initial
catalysis experiments was a glass-flask in each case, well ventilated with air and
equipped with a magnetic stirrer and a reflux-cooler to prevent evaporation of the
solvent. A reaction temperature of 40°C was chosen as a compromise between
enzyme and NADPH-cofactor stability on the one hand, and high enzyme activity on
the other. In the reaction we used significantly higher NADPH-regeneration activity (4
U/ml of 2°ADH) than PAMO-activity (0.6 U/ml) to force the in situ ration of the
NADPH/NADP+-couple to the reduced side. Thus, not just kinetic inhibition of the
desired oxygenation reaction due to NADPH-limitation was circumvented. The
stability of the cofactor itself was also increased, since NADP+ was known to be
rather unstable under basic conditions.[267] Isopropanol, being the most effective
stoichiometric sacrificial electron donor, resulted in significantly decreased stability of
1 2 3 4 5 65 kDa
Results and Discussion 88
both enzymes used. Up to 5% (v/v) of isopropanol were tolerated by both enzymes
without a significant loss of activity. In order to enhance conversion, we added
surplus reducing equivalents in the form of 2-pentanol as a sacrificial substrate.
Thus, due to the more favorable partitioning coefficient of 2-pentanol between the
aqueous and the organic phase, lower actual alcohol concentrations in the aqueous
phase could be achieved. Overall, the system benefited from the two liquid-phase
approach in two respects, first by circumventing inhibitory effects of the
substrates/products on the enzyme production and second by avoiding negative
effects of the alcohol. Following this protocol it was possible to perform the BV-
oxidation of phenylacetone (39) with formation of ester 40 in concentrations up to 1
g/l with 80% conversion within 24 h. With this optimized protocol we evaluated the
oxidation of ketones rac-bicyclo [3.2.0]hept-2-en-6-one (25) (Scheme 11) and rac-2-
phenylcyclohexanone (23a) (Scheme 10). As delineated above, both ketones were
converted enantioselectively by mutant PAMO-P3 in whole cell catalysis. We were
pleased to observe essentially identical enantioselectivities when applying in vitro
catalysis (for ketone 25 compare Table 11; the kinetic resolution of ketone 23a was
characterized by a selectivity factor of E = 100, the enantiopurity of lactone 24a being
95.4% ee (R), compare Table 10). Ketone 25 could be quantitatively oxidized in a
concentration of 5 g/l to the corresponding product lactones within 24 h, but at a
concentration of 20 g/l yield decreased to 50–60%. In this case the corresponding
alcohol, bicyclo [3.2.0]hept-2-en-6-ol, was also obtained in up to 30% yield,
presumably as the product of the reduction by 2°ADH. This opened up the
opportunity to start the reaction not from the ketone, but already from the
corresponding alcohol in a more elegant way, thus circumventing the sacrificial
alcohol.[268] Overall, we concluded that the originally observed substrate/product
inhibition in whole-cell catalysis was no longer the problem. Thus, the in vitro
catalysis approach was successful. The BV-oxidation of ketone 23a at concentrations
of 5 g/l caused no problems following a slight modification. In this case the reaction
was found to be more effective when MTBE was used as the second phase, due to
the low solubility of the substrate in cyclohexane. The kinetic resolution reached the
optimal 50% conversion after about 24 h. Upscaling to gram-quantities was straight-
forward without changes in the procedure. Overall we obtained turnover numbers
(TN) of more than 30,000 for the P3-PAMO-catalyzed BV-oxidation of ketone 25,
Results and Discussion 89
which to the best of our knowledge is unprecedented for flavin-dependent
monooxygenases in the presence of organic solvents (see Table 20).
Table 20: Catalytic efficiency of WT- and P3-PAMO in in vitro catalysis with two-liquid phases. TF: Turnover frequency; TN: Total turnover number. Similarly high TN values for NADP+ were also obtained for substrates 23a and 39, albeit on analytical scale. Therefore, these values are not included in this table.
Substrate Enzyme Substrate
concentration / g/l
TF / h-1 (BVMO)
TN (BVMO)
TN (NADP+)
Reaction scale / ml
23a PAMO-
P3 5 394 9471 23.3 200
25 PAMO-
P3 5 313 37640 400 20
39 PAMO-
WT 1 98 4715 12 20
P3-PAMO was found to be active for more than 10 hours in the reaction without any
loss of activity (Figure 39) and to exhibit reaction rates that are comparable to those
that were found previously in steady-state-kinetic analysis in the absence of organic
solvents for ketone 23a as substrate (see chapter II4.2).
0 5 10 15 20 250
10
20
30
40
50
conv
ersi
on /
%
time / h
Figure 39: Conversion during the oxidation of 2-phenylcyclohexanone (23a) in a two-liquid phase system over the time. The catalyst shows no decrease in activity for at least 10 hours.
Results and Discussion 90
Therefore, the addition of the organic solvent did not significantly reduce the stability
of the enzyme when the optimized buffer was used. This was not achieved previously
with related systems and was especially not possible when using immobilized
enzymes, a standard method for stabilizing them.
6.4 Performance of the System in Comparison to a Chemical Catalyst
We compared the system developed in this study to an analogous synthetic
organocatalyst for the enantioselective BV-oxidation as described by Murahashi et al.
in 2002 (see Figure 40).[269] The Murahashi system is related to PAMO from a
chemist’s perspective because it also uses a flavin-derived catalyst within a chiral
environment.
H H
N
N
N+
N
NO
N+N
NO
O
2 ClO4-
Figure 40: Structure of the chiral Murahashi bis-flavin.[269]
Of course, the molecular weights of the catalysts differ vastly. However, the
comparison showed that the PAMO-catalyzed BV-oxidation was in fact more
powerful on the laboratory scale in terms of stereoselectivity, catalyst productivity and
stability and finally also in the ease of carrying out such reactions when compared to
the Murahashi system (
Table 21). Furthermore, it should be noted that the synthesis of the biocatalyst
proceeded from renewable starting material. Also, by-products from the synthesis
were toxicologically harmless. Overall, it was found, that a synthetic application of
PAMO or one of its mutants is feasible. The biocatalyst showed a significantly better
performance in a simple experimental setup than any possible alternative.
Results and Discussion 91
Table 21: Comparison of P3-PAMO with Murahashi’s chiral bisflavin organocatalyst as a chemical model catalyst for enantioselective BV-oxidations. [269]
Murahashi’s bis-flavine PAMO-P3
Steps in catalyst
synthesis
5 2a
Time required for
synthesis of the
catalyst
2.2 db <1.5 d
Yield of catalyst
synthesis
55.4% ~0.2 %c
g (catalyst) / g
(product)
~0.5 g / 1 g (based on 4-phenyl-
dihydrofuran-2-one as product)
~0.044 g / 1 g (based on lactones
26 and 27 as products)d
Substrate scope and
stereoselectivity
4-membered cyclic ketones
described; highest ee-value:
74%
cyclic and non-cyclic ketones,
substrate scope can be
engineered; highest ee-value:
99%
Turnover number 9 >30000
Turnover frequency 0.06 h-1 313 h-1
Oxidants used H2O2e O2, NADPH
Reaction conditions
Solvents /
temperature
CF3CH2OH/MeOH/H2O
-30 °C
buffer/cyclohexane (or MTBE)
40 °C
a One step for the production of each enzyme, PAMO and 2°ADH are counted. b Time demand is calculated on the basis of the reaction times as given in the publication. c Yield is based on the ingredients used for preparation of the bacterial medium: Yeast
extract, peptone, and glycerol, calculated as mass-percent. d Total amount of protein as well as NADP+ are taken into account. e Recently a variant with reductive regeneration of the flavin catalyst has been reported,
though not yet in an enantioselective version.[270]
Results and Discussion 92
7 New Cofactor Regeneration Systems for BVMOs
In vitro catalysis using monooxygenases and redox enzymes in general is always
complicated by the need for reducing equivalents, usually in form of a redox cofactor
such as NAD(P)H. Given the high cost of of these nicotinamides, their stoichiometric
use is economically not feasible and hence various in situ regeneration methods
have been developed that allow the use of catalytic quantities.[101, 256, 258, 271-273] In
addition this cofactor regeneration simplifies product isolation and prevents problems
of product inhibition by the cofactor.[257] Regeneration of the nicotinamides can be
accomplished using a variety of techniques. The most commonly used methods are
regeneration systems employing a coupled enzymatic reaction. The most successful
examples from this area are formate dehydrogenase (FDH, E.C. 1.2.1.2.)[274-278] and
glucose dehydrogenase (GDH, E.C. 1.1.1.47)[279-282]. Another option is the use of
alcohol dehydrogenases, as demonstrated in the last chapter. However, all these
enzymatic regeneration system have their individual disadvantages, especially in the
regeneration of monooxygenases. The stability of FDH is impaired by the presence
of oxygen[283], glucose dehydrogenase generates an acidic product upon the
oxidation of glucose, and a secondary alcohol dehydrogenase can for example lead
to the formation of byproducts or to an inhibition of the production enzyme by the
high concentrations of alcohol in the reaction. The latter limitations have been
demonstrated in the previous chapter (II6.3.5). In addition, the regeneration enzymes
themselves may be costly.
Therefore, as an alternative to these processes, a number of non-enzymatic
regeneration systems has been developed.[258] Simple chemical or electrochemical
reductants, such as sodium dithionite or electrodes, have been studied in the
reduction of NAD(P)+, but lack a sufficient selectivity in this reaction.[284] The most
commonly used technique for the non-enzymatic regeneration of reduced
nicotinamides is to use 2,2'-bipyridyl)(pentamethylcyclopentadienyl)rhodium
([Cp*Rh(bpy)(H2O)]2+) as a catalyst for this reaction.[285, 286] The catalytically active
form of the rhodium complex can either be regenerated chemically[287],
electrochemically[288] or photochemically.[289] This synthetic recycling system has also
been applied to PAMO-WT, but no TN-values were reported.[290] However, the
preparative application of this rhodium complex is limited by several factors, such as
Results and Discussion 93
the low specific activity and its inhibitory effect on most enzymes.[258] Overall, there is
a clear demand for novel concepts for cofactor regeneration to complement the
weaknesses of the known procedures.
This challenge is addressed in the present chapter. Several concepts for the
regeneration of flavin-dependent redox enzymes are presented and PAMO has been
used as a model system to study the experimental implementation of these concepts.
In general, regeneration of the active flavin-peroxide species, as it can be observed
in BVMOs, can be brought about via a reductive pathway, as in the natural
regeneration by NADPH. Alternatively, it can be imagined to be brought about about
via an oxidative pathway by for example H2O2, as it is well implemented for
Cytochrome P450 (see Scheme 16).[291-293]
N
N
NH
N-R
H O
O2
N
N
NH
NR
H
O
OO
O-
O
N
N
NH
NR
H
O
OOO
R1
O
R2
R2R1O-
R1 O
O
R2
N
N
NH
NR
H
O
O-ON
N
NH
NR
O
O
H+H2O
NADPH
NADP+
H2O2
H+
FADred
FADox
FADox*
sacrificialelectron donors
decomposition products
hvC B A
Scheme 16: Proposed reactions to regenerate the enzyme-bound FAD during the catalytic cycle of a BVMO. Besides the natural reductive pathway using NADPH, two newly introduced pathways are shown. A: Direct oxidative regeneration of the flavin-peroxide species using H2O2 (only theoretically implemented); B: Reductive pathway using NADPH or another reducing equivalent, for example a synthetic nicotinamide analog; C: Indirect reductive light-driven regeneration using EDTA as source of electrons (experimentally implemented).
7.1 A Flavo-Peroxide-Shunt Pathway?
The probably most elegant way to regenerate the flavin-peroxide species would have
been to directly form it by a treatment of the enzyme with hydrogen peroxide
(Pathway A, Scheme 16). This option came into reach for the use of PAMO for two
reasons. First, this enzyme showed a high tolerance for hydrogen peroxide (see
Figure 41).
Results and Discussion 94
0 10 20 30 40 50 60 700
20
40
60
80
100
% re
lativ
e re
sidu
al a
ctiv
ity
H2O2 concentration / mM
Figure 41: Tolerance of hydrogen peroxide by PAMO-P3. Preparations of PAMO-P3 were incubated in the presence of various concentrations of H2O2 for 20 h. Subsequently, residual activities were determined using a NADPH-depletion assay. The graph shows the residual activities relative to a sample incubated in the absence of H2O2.
Second, it was known that such a reaction was indeed possible from a chemist’s
point of view, provided the flavin was chemically modified (see Scheme 17).[141, 294-297]
N+
N
NH
NR
O
O H2O2
N
N
NH
NR
O
O
OO
H
Scheme 17: Peroxide driven formation of a flavin-peroxide species in a chemical model reaction. When an alkyl-iminium ion is formed by alkylation at the N5, the resulting flavor-cation can react with H2O2 to form the reactive flavins-peroxide species that can subsequently carry out sulfoxidations or Baeyer-Villiger oxidations.
It was necessary to activate the C4a-atom in the isoalloxzine ring system of the flavin
by alkylation of the N5. Thereby, the electrophilicity of the neighbouring C4a was
increased (see Scheme 17). The attempt to transfer this principle to an enzyme,
however, was not that straightforward. Of course, a selective alkylation of the FAD
N5 within a complex biological system such as PAMO would have been extremely
demanding, the only possibility being the formation of the apo-protein and
reconstitution with a separately alkylated FAD. This procedure was not taken into
consideration as it would have been very tedius and hence, the elegance of this
regeneration method would have been lost. Thus, a biochemical activation of the C4a
had to be brought about while keeping the synthetic approach in mind. The simplest
Results and Discussion 95
analogous reaction of an imine alkylation as shown in Scheme 17 would have been a
protonation.
Inspection of the crystal structure of PAMO (pdb-code 1W4X) revealed a Cys-residue
(Cys65) in close proximity to the N5 (see Figure 42). A plan for the implementation of
a flavo-peroxide shunt by rational protein design was devised as such, that this
residue should be exchanged by acidic amino acids (Glu or Asp) using site-directed
mutagenesis. The resulting mutants should be tested for reactivity in the presence of
H2O2.
Figure 42: Zoom into the crystal structure of PAMO showing the FAD from the backside. Cys65Glu is shown in yellow, the neighboring residues Tyr72, Trp55, and Ile96, which appear to interact directly with Cys65Glu are shown in light blue. Mutation Cys65Glu has been modeled into the enzyme using SPDBV, upon a preoptimization of the resulting structure, the shown residues appear to interact with the newly introduced amino acid, thereby preventing the adoption of a correct position to protonate the flavin N5. Mutagenesis of PAMO-WT was accomplished by whole-plasmid amplification using the primers Cys65Glu and Cys65Glu-rev or Cys65Asp-fw, Cys65Asp-rev.
The mutations Cys65Glu and Cys65Asp were introduced in PAMO-WT and PAMO-
P3 and all resulting mutants were expressed (protocol IV15.1) and purified by affinity
chromatography (protocol IV16.1). Phenylacetone and 2-phenylcyclohexanone were
tested for conversion in the presence of various amounts of H2O2 and NADP+ (the
latter one to enable an active conformation of PAMO, see below) under basic as well
as under neutral reaction conditions. No product formation could be detected by
GC/MS coupling. However, all mutants were found to be active in NADPH driven
reactions. The usually low decoupling of PAMO and PAMO-P3, however, was
significantly increased for all mutants, and even to values above 50% in case of P3.
The crystal structure was further inspected and a qualitative model to explain the
failure of these experiments was developed. The orientation of the side chain of
N5
Results and Discussion 96
Cys65Glu which positions the carboxylic acid moiety closest to the N5 was sterically
hindered by three neighboring amino acids (Tyr72, Trp55, and Ile96). It might be
appropriate to apply the CASTing strategy to this problem and to randomize these
positions accordingly. In addition, an alternative acidic amino acid might be
introduced such as tyrosine, which is a common proton donor on biological systems.
Further experiments are certainly appropriate.
7.2 Synthetic Reductants for the Regeneration of the Flavin – Mimicking the Natural Way
In the search for novel reductive ways for the regeneration of the enzyme bound
flavin, we initially used sodium dithionite as the reducing agent in PAMO-catalyzed
reactions. This resulted, at potentially useful concentrations of dithionite (mM-range),
in the rapid denaturation of the enzyme. We therefore turned to a synthetically more
demanding solution. Artificial NAD(P)H analogs were synthesized and tested for their
capability to drive a PAMO-P3 catalyzed Baeyer-Villiger oxidation (see Figure 43 for
the structures of the reduced synthetic nicotinamides). Interestingly, PAMO-P3, in
contrast to for example horse liver alcohol dehydrogenase (HLADH)[298] appeared to
be highly specific for NADPH, as none of the analogs was accepted by the enzyme
to an extent that would have resulted in detectable product formation. This is in line
with following results, indicating that the native cofactor, may it be reduced or
oxidized, is necessary to maintain PAMO in a catalytically active state.
N
H H
R
O
R =
NH
NH
NH
HO
N
O
O
41a 41b
41c 41d
N
H H
NH2
O
42
Figure 43: NAD(P)H mimetics used in the experiments. Unless otherwise stated all substances were used in both enantiomers separately. The mimetics were tested in analytical scale biotransformations at a final concentration of up to 3.3 mM. PAMO-P3 was used as catalyst at 30°C for 20 h. For the use of compound 42 in the regeneration of HLADH see [298]. All nicotinamides shown here were prepared by F. Hollmann and A. Taglieber.[299]
Results and Discussion 97
7.3 Let the Sunshine in - A Light Driven Biocatalytic Oxidation
7.3.1 A Direct Regeneration of Flavoenzymes Using Light as the Energy Source
Within this framework, our interest was aroused by the photochemical reduction of
flavins, a reaction that has been known for a long time. In the 1950s Frisell and
coworkers described that flavins, when excited by irradiation with visible light, can be
reduced by simple electron donors such das EDTA and reoxidized by molecular
oxygen.[300, 301] Later other groups, mainly around Massey and Hemmerich used this
light driven reaction to reduce flavo-proteins for mechanistic studies.[302-306] Even
though these findings opened up a fascinating new way for the direct regeneration of
reduced flavin cofactors, circumventing the native reductant NADPH, it has never
been exploited for biocatalytic purposes.
We therefore devised a catalytic cycle in which NADPH was replaced by light in
combination with the sacrificial electron donor EDTA using PAMO-P3 as the model
enzyme in BV oxidations (see Scheme 18).
NADPHR O
OR'
R R'
O
FADred
EDTA
decompositionproducts
A
B FADox
BVMOGlucose Dehydrogenase
light
β -D-glucose
D-glucono-1,5-lactone
E-FADred
E-FADox
O2
H2O
BVMO
E-FADred
E-FADox
NADP+
R O
OR'
R R'
OO2
H2O
Scheme 18: Simplified scheme to compare the new light-driven regeneration system with a classical one using a coupled enzyme. The regeneration enzyme in scheme A is glucose dehydrogenase, a common system for the regeneration of both NADH and NADPH. In scheme B the need for this second enzyme is circumvented by the use of light and the addition of EDTA as a source of electrons. The EDTA is decomposed to ethylenediamine triacetate, CH2O and CO2.
For the experimental implementation of this concept, PAMO-P3 was expressed and
purified on a large scale (for detailed protocols see IV15.2 and IV16.2). Purified
PAMO-P3 was mixed with EDTA, FAD and substrate (2-phenylcyclohexanone, 23a,
see Scheme 10) and exposed to visible light from an ordinary white light bulb. FAD
Results and Discussion 98
was included in the reaction, because Massey et al. have observed that an efficient
photochemical reduction of flavoproteins could only be accomplished when external
flavin was added as a cocatalyst.[303, 304] This was explained by the assumption that
the photochemical reduction of flavins occurs in two single electron transfer reactions
(see Scheme 20). Simultaneously, reduced flavin could undergo a synproportionation
reaction with oxidized flavin to yield the corresponding flavosemiquinone (see
Scheme 19). The equilibrium for this reaction lies on the left side for free flavins,
whereas in case of their enzyme bound counterparts, the flavosemiquinone
dominates.[303, 304]
FADox + FADredH2 2 FADH°
E-FADox + E-FADredH2 2 E-FADH°
Scheme 19: The equilibrium of the synproportionation reaction of free flavins (here FAD) lies on the left side, thus yielding fully reduced or oxidized FAD, respectively. In case of enzyme bound FAD, Massey has postulated that the same equilibrium lies dominatingly on the right side, even though this synproportionation must be significantly slower than the analogous reaction for free flavins.[303]
FADoxEDTA, light
FlavinredH2
FADredH2 + E-FADoxdark
FADH° + E-FADH°
E-FADH° + FADredH2 E-FADredH2 + FADH°dark
Scheme 20: Scheme for the electron transfer reaction that can be postulated for the flavin mediated reducation of enzyme bound FAD. The light driven first reaction step reduces free flavins by two subsequent single-electron transfers. In two following reaction steps reduced free flavins reduce their enzyme-bound counterpart. [303]
Thus, by an excess of free reduced flavin, the dark reaction which yields the reduced
enzyme bound species could be shifted to the right side.
Unfortunately, after prolonged irradiation no significant conversion was found. We
explained this finding with experimental data from other groups which demonstrated
that the oxidized nicotinamide cofactor stays bound to BVMOs during the active
catalytic cycle, suggesting a pivotal role of the bound NADP+ in sustaining a
catalytically active conformation of the enzyme.[105, 115, 290] Therefore, the reaction
was repeated in the presence of catalytic amounts of NADP+ (for a detailed protocol
plus pictures of the experimental setup see IV11). This protocol was successful and
resulted in almost 50% conversion of 23a to yield lactone 24a with excellent
enantioselecivty (48% conversion, 97% ee (R)). The optical purity of the product
Results and Discussion 99
lactone was essentially identical to that obtained from previous experiments using a
native regeneration system in whole cell or in vitro catalysis (see chapters II4.3 and
II6.3.5). Apparently, the inherent stereoselectivity of PAMO-P3 was not impaired by
the unnatural regeneration conditions, suggesting a non-altered meachnism of the
actual oxidation reaction. The reactions were repeated using 2-benzylcyclohexanone
(23b) and bicyclo[3.2.0]hept-2-en-6-one (25) as substrates (see Table 22). In these
cases, the reactions were likewise successful, delivering the corresponding lactones
in the same high enantiomeric purities that were found for the native regeneration
systems.
Table 22: Stereoselectivities and conversions found for the light driven biocatalytic reactions. For comparison the results obtained for a native regeneration system are shown in brackets. General conditions for light driven reactions: 10 µM PAMO-P3; 25 mM EDTA; 100 µM FAD; 250 µM NADP+; 1 or 2 mM substrate; 50 mM Tris-HCl (pH 7.4); T = 30°C; 100 W Osram white light bulb.
Control experiments corroborated the mechanistic postulations shown above
(Scheme 18). In the absence of either light, EDTA, FAD, or enzyme no conversion
could be detected. It was therefore clear that the Tris base used in the buffer did not
serve as an electron donor, even though this has been reported previously.[306] In
addition, no evidence for the photoreduction of NADP+ was found by photometry.
Results and Discussion 100
0 1 2 3 4 5 6 70
10
20
30
40
50
conv
ersi
on /
%
time / h
sudden change fromsunny to cloudy weather
sunlight
Figure 44: Comparison of sunlight driven and light bulb driven oxidation of ketone 23a. Conditions for the sunlight driven reaction: 10 µM PAMO-P3; 25 mM EDTA; 100 µM FAD; 250 µM NADP+; 1 mM 23a; 50 mM Tris-HCl (pH 7.4); the reaction vessel was placed in the sunshine on aluminium foil. Conditions for the light buld driven reaction as described in the caption of Table 22 (1 mM 23a).
Inspired by these results using an artificial light source, we decided to utilize the most
abundant source of energy available, namely sunlight. This “green” regeneration
system provided results comparable to those obtained using a light bulb. For
example, in case of ketone 23a, two hours of bright sunshine in central Europe
induced the expected transformation, 20% conversion was reached under these
conditions (see Figure 44). Compared to the use of a light bulb, the reaction rated
were in the same range of magnitude, whereas the conversion was limited as a result
of a sudden weather change.
Under the conditions described here, however, the catalytic performance of PAMO-
P3 was significantly lower than in cases where a conventional regeneration system
was used (II6.3.5). Potentially, several reasons potentially accounted for this reduced
performance of the light driven approach. On the one hand, enzyme stability might
have been impaired as under the present conditions non-enzyme regulated
reoxidation of the reduced free flavin (decoupling of the regeneration reaction from
the enzyme related oxygen activation and subsequent substrate oxygenation) lead to
the formation of significant amounts of H2O2. However, comparative experiments
testing the residual PAMO activity after incubation in the presence of H2O2 excluded
this possibility (see Figure 41; page 94). Furthermore, the linear course of the
reaction over at least seven hours was an indication that none of the reaction
components was inactivated throughout the reaction (see Figure 44). Alternatively,
Results and Discussion 101
we suspected slow electron transfer kinetics to be rate limiting under the present
conditions.
Table 23: Performance of the light driven BVMO regeneration system in comparison with a native regeneration system and an electrochemical system of comparable simplicity. The catalyst turnover frequency (TOF) is given as the initial rate. [a]: A cathode was used as the source of reducing equivalents[307]; [b]: NADPH was regenerated by a coupled enzyme, see chapter II6.3.
Enzyme Mediator Source of reducing
equivalents
TOF / h-1
TN
Enzyme Mediator
PAMO FAD EDTA; hν 10 96 9.6
StyA[a] FAD Cathode 104 26 0.2
PAMO[b] NADPH Isopropanol 394 9471 400
Other simplified regeneration systems have been reported in the literature.[258] The
one with the highest degree of simplification was based on a cathode as a source of
reducing equivalents (see Table 23).[307] In this electrochemical system under
optimized conditions significantly higher rates were obtained. This was achieved at
the expense of a non-catalytic performance of the mediator FAD, which suggests a
high degree of uncoupling. In addition, the rather harsh reaction conditions led to a
rapid deactivation of the enzyme. In contrast to this, our new light driven system was
stable for at least seven hours with no indication of decomposition of the enzyme
(see Figure 44). This represented a significant advantage of this principle over the
established ones.
7.3.2 Investigation of the Reaction Parameters In the last chapter, largely unoptimized conditions for the light driven regeneration of
PAMO-P3 are described. To further investigate the reason for the reason for the
apparent sluggish reaction rate and to evaluate the scope of the new, light driven
biocatalytic oxygenation approach, further experiments were performed. Several
reaction parameters were varied and the effect on rate and yield of the PAMO-P3-
catalyzed BV oxidation of 23a was investigated to get further insights into the limiting
factors.
Results and Discussion 102
One parameter that was investigated was the concentration of the putative “allosteric
regulator” NADP+, which was a parameter of the enzyme itself and hence not directly
related to the light driven approach. Upon varying the NADP+ concentration under
otherwise constant conditions (1 mM 23a, 100 W light bulb, 25 mM EDTA) we found
that the enzyme was saturated with NADP+ at a concentrations well above 100 µM.
Therefore, to ensure constant conditions, the concentration of the oxidized
nicotinamide cofactor was kept at 250 µM throughout all experiments.
The first parameter of the light driven reaction that was investigated was the power of
the light source. For this purpose, light bulbs of different intensities were tested for
their efficiency in driving the PAMO-P3 catalyzed oxidation of ketone 23a (see Table
24).
Table 24: Influence of the power of the light source on the rate of the oxidation of 2-phenylcyclohexanone (23a). Conditions: 10 µM PAMO-P3; 25 mM EDTA; 100 µM FAD; 250 µM NADP+; 1 mM 23a; 50 mM Tris-HCl (pH 7.4); T = 30°C. The initial rate was determined after 4 h of reaction. The conversion was determined after 26 h of reaction.
Power of light source / W
Initial rate / µM h-1
Conversion / %
40 0.6 ± 0.1 <1
100 56.7 ± 2.0 53.8 ± 1.6
200 71.2 ± 2.4 56.6 ± 1.7
It was found that the power of the light source has a significant impact on the rate of
the reaction. A 40 W light bulb was not sufficiently powerful to induce the
photochemical reduction of FAD, whereas 100 W and 200 W lamps induced total
reaction rates of 56.7 µM/h and 71.2 µM/h, respectively. The conversion was not
influenced to a comparable extent in case of the two stronger lamps, which indicated
that the reaction was not limited by the photostability of the reaction components.
Doubling the enzyme concentration resulted in a doubling of the reaction rate. The
effect of the enzyme concentration on the rate of the reaction was therefore the same
as in case of a native regeneration system.
Results and Discussion 103
Table 25: Influence of the enzyme concentration on the conversion of 1-phenylcyclohexanone (23a). Conditions: 10 µM PAMO-P3; 25 mM EDTA; 100 µM FAD; 250 µM NADP+; 1 mM 23a; 50 mM Tris-HCl (pH 7.4); T = 30°C ; 100 W Osram white light bulb. The initial rate was determined after 5 h. [a]: determined after 19 h; [b]: determined after 24 h.
PAMO-P3 concentration
/ µM
Initial rate / µM h-1
Conversion / %
10 62.7 ± 2.1 65.0[a]
5 28.9 ± 1.2 38.0[b]
Massey et al. reported that the photochemical reduction of flavoproteins can be
catalyzed not only by the specific type of flavin (FAD, FMN or riboflavin) that is bound
to the enzyme, but by flavins in general.[303, 304] We therefore investigated this
parameter, also to exclude an exchange mechanism of the light driven reaction
(exchange of reduced free flavin with oxidized enzyme bound flavin via an
intermediate formation of the apo-protein). We found that the reaction can indeed be
co-catalyzed not only by FAD (the cofactor of PAMO) as used in the initial
experiments, but also by the other commercially available flavins, FMN and riboflavin
(Vitamine B2). Interestingly, varying reaction rates were observed depending on the
type of flavin used (see Figure 45, Figure 46 and Table 26).
0 5 10 15 20 250
100
200
300
400
500
600
700
conv
ersi
on / μM
pro
duct
time / h
250 μM 100 μM 50 μM
Figure 45: Rate of the light driven oxidation of ketone 23a using FAD as co-catalyst. The concentration of FAD is varied from 50 µM over 100 µM to 250 µM. Otherwise the standard conditions are used (initial concentration of substrate: 1 mM).
Results and Discussion 104
0 5 10 15 20 250
100
200
300
400
500
600
700
conv
ersi
on / μM
pro
duct
time / h
50 μΜ 100 μΜ 250 μΜ
Figure 46: Rate of the light driven oxidation of ketone 23a using FMN as co-catalyst. Again, the concentration of the flavin co-catalyst is varied from 50 µM over 100 µM to 250 µM. The standard reaction conditions are applied (initial concentration of substrate: 1 mM).
Table 26: Influence of the external flavin and its concentration on the light driven PAMO-P3 catalyzed oxidation of ketone 23a. Standard conditions were employed. The initial rates were calculated after 4 h of reaction; the conversion was determined after 22 h. [a]: Due to the low solubility of riboflavin in water, the highest concentration tested was 150 µM.
External Flavin Flavin concentration
/ µM
Initial rate / µM h-1
Conversion / %
FAD 250 59.6 ± 1.8 48.5 ± 2.0
100 56.7 ± 2.0 47.2 ± 2.0
50 35.5 ± 3.1 25.7 ± 2.6
FMN 250 96.7 ± 3.4 54.1 ± 0.7
100 106.7 ± 6.3 58.3 ± 2.1
50 77.8 ± 3.9 45.1 ± 4.1
Riboflavin[a] 150 59.9 ± 2.1 43.6 ± 0.5
100 48.7 ± 2.1 46.1 ± 1.2
50 41.0 ± 1.9 42.5 ± 3.2
A plausible explanation for the apparent saturation kinetics might be a Michaelis-
Menten-like behaviour for the reduction of the enzyme bound FADox by the reduced
free flavins as shown in Scheme 20. The low rate of this reaction in comparison to
Results and Discussion 105
the native reduction pathway might be explained assuming a sterically impeded
interaction between the free flavin and the enzyme bound FAD. In fact, the crystal
structure of PAMO shows the FAD deeply buried within the enzyme cavity with poor
accessibility from the solvent phase (see Figure 47). As a result, both flavins cannot
interact optimally for electron transfer due to an unfavorable geometry and
distance.[308] This assumption was somewhat supported by the increasing reaction
rate using the smaller FMN instead of FAD. However, the lowered rate upon the use
of the even sterically less hindered riboflavin remained to be understood. It could only
be weakly explained by the presence of a phosphate binding site in PAMO, which
should be rather occupied by NADP+, which was present in larger amounts.
Figure 47: Zoom into the substrate access channel of PAMO (x-ray structure, pdb-code 1W4X). The protein is shown in CPK-depiction, the enzyme bound FAD is shown in yellow in ball-and-stick depiction. Only the A-ring of the isoalloxazine moiety of the flavin is visible, the rest of the cofactor is shielded by the protein.
Another explanation for poor catalytic efficiency of the light driven pathway might be
an oxygen limitation due to increased decoupling as shown in Scheme 21.
Flox + FlredH2 2 FlH°a)
FlH° + O2 FlO2°b)
Scheme 21: Decoupling reaction under oxygen depletion. By a big excess of free oxidized flavin the equilibrium of reaction a) can be shifted to the right side. The rate constant of reaction b) is very fast and would in this case remove the flavosemiquinone from the equilibrium, thus shifting the equilibrium even further to the right. This way, the biocatalytic reaction might run into an oxygen limitation
Results and Discussion 106
Synproportionation of free flavins results in the formation of semiquinone that reacts
very fast with molecular oxygen (not a spin-forbidden reaction), eventually leading to
the formation of H2O2. Thus, O2 is very efficiently consumed and therefore not
available for reaction with enzyme-bound FADred and subsequent BVMO
The concentration of the sacrificial electron donor, EDTA, was expected to be an
important parameter of the light driven reaction. The effect of varying EDTA
concentrations on the conversion of ketone 23a was monitored as a function of time
(see Figure 48). Apparently, within the range examined, the concentration of EDTA
had no significant influence on the rate of the reaction. But the yield of the reaction
directly correlated to the amount of EDTA present. This was best visible at the
concentrations of 5 mM and 10 mM EDTA. These concentrations of electron donor
yielded ~145 µM and ~350 µM of lactone 24a, respectively. Thus, approximately 3%
of the EDTA that was applied was actually consumed in the oxygenation reaction.
The remaining 97% were presumably wasted in the decoupling reaction.
0 5 10 15 20 250
100
200
300
400
500
600
700
conv
ersi
on / μΜ
pro
duct
time / h
1 mM 2 mM 5 mM 10 mM 25 mM 50 mM
Figure 48: Influence of the EDTA concentration on the light driven PAMO-P3 catalyzed oxidation of ketone 23a. Conditions: 100 W light bulb, 30°C, 10 µM PAMO-P3, 100 µM FAD, 1 mM substrate, 250 µM NADP+, 50 mM Tris-HCl pH 7.4.
Overall, this decoupling reaction is a major limitation towards preparative useful
photochemical enzymatic BVMOs. Further investigations will have to focus on its
minimization. Maybe covalent attachment of external flavins will minimize the
undesired decoupling and at the same time increase the reduction of prosthetic FAD.
Results and Discussion 107
7.3.3 Implications for Light Driven Biocatalytic Redox Reactions Overall, we speculated that in case of PAMO, the major limiting factors en route to
synthetic applications of the light driven regeneration system are the low rate of
electron transfer from the free flavin to the enzyme bound FAD and the high rate of
decoupling. To further support this speculation we enlarged, the light-driven to YqjM
(an old yellow enzyme homolog from Bacillus subtilis (E.C.1.6.99.1)). As this enzyme
is an O2 independent flavin-dependent reductase, decoupling can be largely
circumvented. Furthermore, YjqM-bound FMN is largely exposed to the solvent
thereby potentially exhibiting higher reaction rates when compared to PAMO (see
Figure 49).
Figure 49: Zoom into the crystal structure of YqjM (pdb-code 1Z41). The enzyme is shown in CPK- and the enzyme bound FMN in ball-and-stick-depiction (yellow). It is clearly visible, that the isoalloxazine moiety of the flavin cofactor is much better accessible than in case of PAMO (see Figure 47).
Indeed, we found that light driven reaction using this enzyme as a catalyst was
significantly faster, had a lower decoupling and a higher turnover number that PAMO
under otherwise comparable conditions (the addition of NADP+ was not necessary in
case of the old yellow enzyme homolog).[299]
Results and Discussion 108
PART II – Cytochrome P450
Results and Discussion 109
8 Cloning and Expression of BM3 and BM3-like P450 in E. coli
The goal of the Cytochrome P450 project line was to set the stage for the cloning and
engineering of novel P450 as practial biocatalysts for preparative synthetic chemistry.
This had to begin with cloning, heterologous expression and purification of the
enzymes, followed by the development of the methodology for the generation and
screening of enzyme libraries for the envisaged directed evolution experiments.
We considered self-sufficient P450 to be the most promising subclass of this enzyme
family, their most prominent member being P450 BM3 (CYP102A1). Thus, we
decided to focus our efforts on these so called BM3-like P450s. The reason for this
decision was based on a number of facts, as delineated in the introduction (I5). The
most important reason was the high catalytic efficiency of BM3 in the hydroxylation of
its native substrates, long chain fatty acids. BM3 catalyzes fatty acid hydroxylation at
rates of up to ~17,000 min− 1 (~280 s− 1).[160] Especially the value of the kcat is not only
high for the class of P450 enzymes, but also for other monooxygenases (for example
two orders of magnitude higher than the kcat found for PAMO in the oxidation of the
best substrate; chapter II4.2). Other factors were the comparably straightforward
expression in a host such as E. coli in comparison to multicomponent P450 and the
available knowledge about the structure and mechanism of BM3, which would help in
enzyme engineering experiments.
Besides the establishment of P450 BM3 in our laboratory we decided to identify,
clone, and express a number of previously undescribed self-sufficient P450 from
bacterial sources, more specifically from actinomycetes and bacilli. The goal was
here to get access to the natural diversity. P450 BM3 has a rather narrow substrate
scope, being mainly limited to long-chain fatty acids and has to be engineered for
most biocatalytic purposes. Thus, we speculated that novel BM3-like P450 might
possess properties of BM3 such as the high reaction rates and might show different
substrate scopes and would therefore provide a better starting point for the genetic
development of novel biocatalysts.
Results and Discussion 110
8.1 Cloning of P450 BM3 from Bacillus megaterium
To establish a platform for the engineering of P450 BM3 in our laboratory, a new
expression system for this enzyme had to be generated. Thus, the first experiments
dealt with the cloning and expression of the first self-sufficient P450, BM3. For this
purpose, B. megaterium was cultivated in LB-medium at 30°C. The genomic DNA
was isolated (for a detailed protocol see chapter IV5.1). The obtained genomic DNA
was used as template for PCR amplification of the bm3 gene (IV5.6.3). The PCR
product was digested with NcoI and NotI and then ethanol precipitated (see protocol
IV5.7). After restriction digestion and gel purification of the vector pETM11 using the
same restriction endonucleases, digested vector and insert were ligated (ratio 1:4).
The ligation product was purified by ethanol precipitation and used to transform
electrocompetent BL21Gold(DE3) cells, which resulted in the expression strain
BL21Gold(DE3)[pETM11-BM3]. Clones containing the correct construct (see Figure
50) were identified by colony PCR (see gel picture Figure 51, for a detailed protocol
of a colony PCR see IV5.6.8).
pETM11BM-38474 bp
lacI
Kan(r)
BM-3
His-tev
NcoI
T7
ori
T7 terminator
NotI
bm3
pETM11BM3
8,474 bp
pETM11BM-38474 bp
lacI
Kan(r)
BM-3
His-tev
NcoI
T7
ori
T7 terminator
NotI
bm3
pETM11BM3
8,474 bp
pETM11BM3
8,474 bp
Figure 50: Expression plasmid pETM11-BM3. The enzyme is expressed with a N-terminal His6-tag and a TEV-recognition site to enable a proteolytic removal of the tag.
Results and Discussion 111
Figure 51: Identification of clones carrying pETM11-BM3 by colony PCR. 1% TBE agarose gel electrophoresis.
Three positive clones were picked and the corresponding plasmid DNA was isolated,
restriction digested using NcoI and NotI and the resulting fragments were separated
in a 1% TBE agarose gel to confirm the presence of an insert of the correct size
(Figure 52). The gel displayed the vector band at 5,500 bp and the correctly sized
bm3 insert at ~3,000 bp, which clearly demonstrated a successful ligation.
Amplification and cloning was likewise successful for the heme domain of BM3
(amino acids 1-436). Here, NcoI and EcoRI digestion was used for both insert and
vector, again successful ligation was controlled by colony PCR and restriction
analysis.
Figure 52: 1% TBE agarose gel of a restriction analysis of three positive pETM11-BM3 plasmids using NotI and NcoI. (M) 1 kb DNA ladder (Fermentas).
8.1.1 Optimization of the Expression Conditions To enable the high level expression of such a large protein as BM3 in E. coli, a small
series of experiments was set up. Mainly, the effect of medium composition on the
expression level (measured as activity of BM3) was evaluated. Other parameters
such as expression temperature, IPTG concentration and the addition of a trace
metal mix were kept constant after a number of preliminary experiments (constant
conditions: 20°C; 25 µM IPTG; 1x trace metal mix (TMM), TMM was modified from
6,000 bp 3,000 bp
M BM3
Results and Discussion 112
ref. [184]; tetracycline was found to reduce expression levels and hence omitted from
the medium even though the expression strain BL21Gold(DE3) carries a resistance
gene). A variety of different media were tested and the resulting BM3 expression
levels were monitored by measuring activity [U] and specific activity [U/mg] as well as
by SDS PAGE analysis (Table 27 and Figure 53). The activity of BM3 in the crude
extracts was measured by the oxidation of 10-pNCA (43, see Scheme 22).[309]
O
O2N
OH
O NADPH+ H+
NADP+
O2 H2O
O
O2N
OH
O
OH
H2O
NO2
O-
OOH
O
H
+
43 44
4645
Scheme 22: pNCA assay for the detection of fatty acid hydroxylase activity of BM3. The p-nitrophenolate ether 43 is selectively hydroxylated at the terminal C-atom, yielding a hemiacetale (44) which spontaneously hydrolyzes. Under slightly basic conditions (pH 8.2), the formed p-nitrophenol (45) is deprotonated and shows an intensive yellow color (410 nm). Compound 43 was synthesized and the assay was carried out as described by Schmid et al.[309]
Table 27: Different media and additives for BM3 expression. Auto = auto induction me-dium ZYP5052[184]; C- = complex medium without glucose; C-* = complex medium without glucose supplied with power mix; C+ = complex medium with glucose; C+*= complex medium with glucose and power mix; LB = Luria Bertani; LB* = Luria Bertani with power mix; YT = yeast tryptone medium; YT* = 2x yeast tryptone medium with power mix; TB = terrific broth; TB* = terrific broth with power mix. Conditions: 20 ml culture volume in a 125 ml Erlenmeyer flask, 125 rpm, 20°C, induction at an OD600 ~ 1, 14 h expression time, cells were harvested, frozen at -80°C and disrupted by sonication. For the composition of the media see IV2.1.
Ranking U/mg Medium U Medium
1 211 C-* 4543 TB*
2 184 TB* 4432 TB
3 170 TB 3726 C-*
4 168 C- 3543 C+*
5 151 C+* 2392 auto induction
6 140 C+ 2180 C+
7 123 auto induction 1592 auto induction*
8 119 YT* 1558 YT*
9 117 YT 1244 YT
10 71 auto induction* 983 C-
Results and Discussion 113
Figure 53: 10% SDS-PAGE analysis of the expression of BM3 using different media.
Medium C-* yielded the highest specific activity, whereas the highest total activity
was reached in TB* medium. The addition of the so called power mix (PM) resulted in
a significant increase of expression in all media examined, except from the
autoinduction medium ZYP5052. The power mix consisted of 40% glycerol (v/v) and
saturated glutamate in a phosphate buffered solution (pH 7.4) and was diluted 100-
fold into the media. Glycerol was chosen as an additive because it is a good carbon
source and has been described to show beneficial effects on the expression of
recombinant proteins in E. coli in general.[310] More specifically, glycerol was reported
to have beneficial effects on the expression of P450s.[190] As a reason for these
improvements, the induction of osmotic stress was proposed under elevated
concentrations of glycerol (up to 0.8% (v/v) = concentration in TB* medium), which
was found to induce the expression of heat-shock proteins. In addition, E. coli was
known to produce only insignificant amounts of acetate when grown on glycerol as a
carbon source, in contrast to the use of glucose.[311] Glutamate was chosen as an
additive, because it was the precursor for 5-aminolevulinic acid, the major
intermediate in the biosynthesis of heme.[312] Later, a more detailed literature search
revealed that the regulation of the heme biosynthesis was far too complex to be
influenced in such an easy manner.[313, 314] However, control experiments using
complex medium without glucose (C-) showed that both components of the power
mix, glycerol and glutamate, were needed for the observed enhancement of
expression of BM3. Omitting either one of the components resulted in a reduction of
BM3 expression. The deletion of glutamate from the medium was also not
complemented by the addition of NH4Cl (final concentration 25 mM). Thus, the role of
glutamate was more than only the one of a nitrogen source.
C+ TB* TB YT* YT C-* C- M auto* auto C+*
50 kDa
120 kDa
Results and Discussion 114
Ultimately, BM3 was routinely expressed in TB* medium supplemented with trace
metal mix in shaking flasks at low agitation to minimize oxygen uptake (for a detailed
expression protocol see IV19.1). The cells were harvested by centrifugation and
disrupted by sonication (see protocol IV19.2). Afterwards, the crude extracts of the
BM3 preparations were analyzed by a UV/VIS photometer to record both a spectrum
of the oxidized P450 (characteristic absorption maximum at 417 nm) and a CO
differential spectrum (see Figure 54).[315, 316] The latter one allowed the quantification
of the expression level and demonstrated the expression of correctly folded BM3
heme domain by the characteristic absorption maximum at 450 nm. The yield of
correctly folded BM3 was ~80 mg/l of culture (690 nM). The activity of the protein
preparation was confirmed by the pNCA assay. Although the temperature during
expression was as low as 20°C, about 50% of the enzyme was produced in form of
insoluble inclusion bodies, which were detected in the E. coli cell debris using SDS
PAGE (data not shown). During the writing up of this thesis, Urlacher et al. reported
an optimized protocol for the large scale expression of BM3 in E. coli.[317] They came
to similar results and also observed a pronounced effect of glycerol and of TB
medium on the expression level. Starting from a very similar Erlenmeyer flask
expression protocol in comparison to the one described in this thesis, they optimized
the expression conditions for this enzyme in a fed batch fermentation. Constant
supply of glycerol and a low DOT were found to greatly improve the expression levels
to more than 1 g/l.
Our protocol was also applied to express the BM3 heme domain alone. Again, the
quality of the expression was monitored by a CO differential spectrum (Figure 55),
and the yields were comparable to the expression of the complete protein.
Results and Discussion 115
300 350 400 450 5000,0
0,2
0,4
0,6
0,8
1,0
1,2A
bsor
ptio
n
wavelength /nm
400 420 440 460 480 5000,0
0,2
0,4
0,6
0,8
1,0
Abs
orpt
ion
wavelength /nm
Figure 54: Spectra of BM3. A: Spectrum of the crude extract as obtained after bacterial lysis. The maximum at 417 nm is characteristic for the oxidized iron heme. B: CO differential spectrum after reduction of the crude extract and formation of the CO complex. See IV21.3 for a detailed protocol.
400 420 440 460 480 5000,0
0,2
0,4
0,6
0,8
1,0
Abs
orpt
ion
wavelength /nm
Figure 55: CO differential spectrum of BM3 heme.
8.1.2 Purification of P450 BM3 A purification of BM3 via Ni-NTA chromatography using the N-terminal His6-tag was
prohibited by the inhibitory effect of imidazol on the enzyme. Thus, purification via
anion exchange chromatography (IEX) was set up using DEAE Hitrap columns (GE
Healthcare). The purification was started from the crude extract using a linear NaCl
concentration gradient to determine the concentration of NaCl needed to elute BM3
(see Figure 56). Then, based on these results, a step gradient was established. With
the first step (160 mM NaCl, 16% buffer B) E. coli proteins were eluted while the
target protein still remained on the column. P450 BM3 was eluted at a NaCl
concentration of 260 mM (26% buffer B) (see Figure 57). Fractions which showed
absoption at 280 nm and at 417 nm were collected.
A B
417 nm 450 nm
Results and Discussion 116
0 5 10 15 20 25 30 350
100
200
300
400
500
600
700m
AU
/280
nm
Volume /ml
0
100
200
300
400
500
600
700
mA
U /4
17 n
m
0
20
40
60
80
100
Con
duct
ivity
/µs/
cm
0
20
40
60
80
100
Gra
dien
t /%
Figure 56: Purification of BM3 on a DEAE FF column using a linear NaCl gradient. The absoption at 280 nm (blue), absorption at 417 nm (red), the conductivity (black), and the gradient (green) were monitored. The fraction size was 1 ml.
0 5 10 15 20 25
500
1000
1500
2000
mA
U /2
80 n
m
Volume /ml
0200400600800100012001400160018002000
mA
U /4
17 n
m
0
20
40
60
80
100
Con
duct
ivity
/µs/
cm
0
20
40
60
80
100
Gra
dien
t /%
Figure 57: Purification of BM3 on a DEAE FF column using a step gradient of NaCl. The absoption at 280 nm (blue), absorption at 417 nm (red), the conductivity (black), and the gradient (green) were monitored. The fraction size was 1 ml. The first step was 160 mM NaCl for eight column volumes (CV), the second one at 260 mM NaCl for eight CV.
Ten fractions were pooled and the purity of the enzyme preparation was documented
by 10 % SDS-PAGE analysis (Figure 58). A one step purification protocol on an ion
exchange column resulted in a fairly pure enzyme preparation (Figure 58, lane 2).
Results and Discussion 117
Figure 58: 10% SDS-PAGE documentation of the purification of BM3-like P450 in this study. 1: crude extract BM3; 2: BM3 after IEX purification; 3: crude extract RM (see below); 4: RM after IEX enrichment; 5: crude extract SA; 6: SA after IEX purification; M: 10-200 kDa protein ladder.
8.2 BM3-like P450 from Streptomyces avermitilis
8.2.1 The Actinomycete Streptomyces avermitilis A BLAST search[205] using the Vector NTI software (www.invitrogen.com) with the
amino acid sequence of BM3 as template identified a BM3-like P450 (CYP102D1;
gene accession code: NC_003155; locus NP_821750) in the genome sequence of
Streptomyces avermitilis (DSMZ 46492).[318, 319] The calculated BLAST score was
473.0, the homology to BM3 was 44.6% (identity). Also, other BM3-like P450 were
identified (see following chapters and for a phylogenetic tree Figure 59). BM3
BM3_like B. anthracis
BM3_like B. cereus
BM3_like B. subtilis
BM3_like B. subtilis 2
BM3_like S. avermitilis
BM3_like R. metallidurans
BM3_like A. pretiosum
BM3_like F. oxysporum
BM3
BM3_like B. anthracis
BM3_like B. cereus
BM3_like B. subtilis
BM3_like B. subtilis 2
BM3_like S. avermitilis
BM3_like R. metallidurans
BM3_like A. pretiosum
BM3_like F. oxysporum
Figure 59: Phylogenetic tree of BM3-like P450 found by a BLAST search. Guide Tree calculation is based on a sequence distance method and utilizes the Neighbor Joining (NJ) algorithm.[320] BM3-likes from B. megaterium, B. cereus, B. subtilis, B. anthracis, and from the fungus F. oxysporum are known.
S. avermitilis belongs to the bacterial order of actinomycetales which are mainly soil
bacteria with branching filamentous structures forming mycelia (see Figure 60).
50 kDa
120 kDa P450 1 2 3 4 5 6 M
Results and Discussion 118
(A) (B)
Figure 60: Pictures of the growth of Streptomyces sp.. A: microscopic picture of the filamentous growth; B: Growth on agar plate (GYM-agar).
Streptomyces avermitilis is a bacterium that carried out not only a complex
morphological differentiation but also the production of secondary metabolites, one of
which, avermectin, is commercially important in human and veterinary medicine.
Generally, the major interest in the genus Streptomyces is the diversity of its
production of secondary metabolites as an industrial microorganism. A previous
analysis of its genome sequence revealed 33 different P450s.[321] One of them
showed the open reading frame (ORF) of a BM3-like P450, but it was never studied
before.
8.2.2 Cloning of the BM3-like P450 from S. avermitilis S. avermitilis was obtained from the DSMZ and grown in GYM-medium at ambient
temperature. The genomic DNA was isolated (see IV5.1) and used as a template for
the amplification of the ORF encoding the BM3-like P450 (from now on called sa).
However, the high GC-content of 70% of the gene complicated the PCR amplification
of sa (see Figure 61).
Figure 61: 1% TBE agarose gel analysis of the optimization of the PCR amplification of sa. In all experiments Phusion DNA polymerase (Finnzymes) was used. Five different annealing temperatures were tested for each of experiments 1-4, otherwise the composition of the PCR mixture was varied. 1: HF-buffer; 2: HF-buffer + Q-solution; 3: GC-buffer; 4: GC-buffer + 5% DMSO; 5 and 6: direct assembly of three separately amplified ~ 1 kbp-long sa-fragments; 7: PCR amplification using 100 ng restriction digested genomic DNA as template in GC-buffer plus Q-solution; 8: same as 7, but 200 ng of template; 9: PCR amplification of previously assembled ~ 1 kb-long sa-fragments. M: 1kb marker.
M 1 2 3 4 M 5 6 7 8 9 M
sa
Results and Discussion 119
The use of a variety of different polymerases (KOD Hotstart, PfuTurbo, Pfu, Phusion)
showed, that only Phusion polymerase (Finnzymes) was able to amplify sa, however
using this polymerase under a number of different amplification conditions resulted
only in unspecific amplification. DNA segments with high GC content have proved
difficult to amplify. These regions may form rigid, constrained secondary structures
that are diffcult or even impossible for the DNA polymerases to enter under standard
PCR conditions.[322] Additives such as DMSO or betaine (the major component of Q-
solution) are commonly used as PCR enhancers to weaken the strong interactions
within these templates. However, the use of a range of common additives alone was
found to be unsuccessful in the amplification of sa (see Figure 61, lanes 1-4).
Inspired by a report of Vazquez et al. on the amplification of GC-rich mammalian
DNA,[323] the genomic DNA of S. avermitilis was restriction digested using NcoI to
yield sa within fragments of 3,000 to 6,000 bp. These fragments were gel purified and
then used as template in the PCR (see Figure 61, lane 7 and 8), which yielded the
amplicon with high specificity (for a detailed protocol see IV5.6.5). Sequencing of the
product proved a specific amplification without the introduction of mutations, thus, the
fidelity of the Phusion DNA polymerase was not significantly impaired under the
reaction conditions used.
Afterwards, a restriction digest using both BspHI and EcoRI was performed to
prepare the insert for the ligation into pETM11. The resulting ligation product was
used to transform E. coli BL21Gold(DE3) yielding the expression strain
BL21Gold(DE3)[pETM11-SA]. Successful ligation was examined by colony PCR and
analytical restriction digestion as in case of BM3 (data not shown).
(A) (B)
Figure 62: Amplification of sa from S. avermitilis. A: 0.7% TBE preparative agarose gel of the restriction digestion of the S. avermitilis genomic DNA, the region between 3,000 and 6,000 bp is excised. B: Preparative gel purification of the PCR product from the amplification of sa using the fragment of the genomic DNA resulting from gel A. The product is excised.
3,000 bp 2,000 bp
3,000 bp PCR product sa
Results and Discussion 120
8.2.3 Expression and Purification of S. avermitilis BM3-like P450 For the expression of the S. avermitilis BM3-like P450 (from now on called SA), the
strain BL21Gold(DE3)[pETM11-SA] was cultivated as described above for BM3. Only
the expression time was increased to 48 h (see IV19.1). Using SDS PAGE analysis
the expression levels appeared to be lower than in case of BM3. Attempts to
increase them by addition of ethanol to the expression medium or increased IPTG
concentrations were unsuccessful. Ethanol is an elicitor of heat shock response in
E. coli including the induction of the expression of chaperone machineries DnaK-
DnaJ-GrpE and GroEL-GroES and was therefore tested as an additive in 2.5% or 5%
(v/v).[324]
400 420 440 460 480 5000,00
0,01
0,02
0,03
0,04
0,05
Abs
orpt
ion
wavelength /nm
400 420 440 460 480 500
0,00
0,05
0,10
0,15
Abs
orpt
ion
wavelength /nm
Figure 63: CO differential spectra of SA. A: Standard lysis protocol. 50 mM Tris-HCl, pH 7.4; cells disrupted by sonication; B: optimized lysis buffer, cells lyzed by lysozyme.
A
420 450
B
420 450
Results and Discussion 121
The preparation of crude extracts of the expression cultures for the purification of this
enzyme was found to be complicated by the fact that the enzyme did not tolerate cell
lysis by sonication. Sonication resulted in more than 50% denatured protein, as
judged by a major peak at 420 nm in the CO differential spectrum (see Figure 63).
In addition, when the cells were lysed in Tris buffer alone a major fraction of SA was
found to be in the insoluble fraction. This was a phenomenon which was previously
described for another P450 from S. avermitilis, where the enzyme was found to have
a high affinity to the bacterial membranes, even though it was not formally membrane
bound.[325, 326] Thus, a new lysis buffer was developed which contained lysozyme,
20% glycerol, 0.1% Tween-20, and 1 mM β-mercaptoethanol. The components were
chosen for the following reasons. Glycerol in concentrations between 10% and 20%
as well as β-mercaptoethanol were frequently described to stabilize P450 (for
example see ref. [327-329]). Tween-20 was chosen as an additive on the one hand to
increase the solubility of SA upon bacterial lysis (compare ref.[325]) and on the other
hand to facilitate the lysis itself. In the following, cell lysis was accomplished by one
cycle of freezing (-80°C) and thawing followed by gentle suspension the cells in lysis
buffer and incubation at ambient temperature to enable a lysozyme driven lysis (for a
detailed protocol see IV19.3). Cotransformation of the expression strain with pLysS
which would have improved the lysis, resulted in an almost complete loss of
expression. Overall, the fraction of correctly folded SA, as indicated by the absorption
maximum at 450 nm, was greatly improved (see Figure 63).
SA was purified in a similar manner as BM3. Again, a DEAE FF column was used for
IEX chromatography. Following elution via a linear gradient, a step gradient of NaCl
for the elution of SA was established. With the first step (160 mM NaCl, 16% buffer
B) E. coli proteins and inactive SA were eluted while the correctly folded fraction of
SA still remained on the column. Correctly folded SA was eluted at a NaCl
concentration of 290 mM (29% buffer B) (see Figure 65). Fractions which showed
absoption at 280 nm and at 417 nm were collected and pooled.
Results and Discussion 122
0 5 10 15 20 25 30 35
200
400
600
800
1000m
AU
/280
nm
Volume /ml
0
200
400
600
800
1000
mA
U /4
17 n
m
0
20
40
60
80
100
Con
duct
ivity
/µS
/cm
0
20
40
60
80
100
Gra
dien
t /%
Figure 64: Purification of SA on a DEAE FF column using a linear NaCl gradient. The absoption at 280 nm (blue), absorption at 417 nm (red), the conductivity (black), and the gradient (green) were monitored. The fraction size was 0.5 ml.
0 10 20 30 40 500
1000
2000
3000
4000
5000
0
500
1000
1500
2000
0
20
40
60
80
100
0
20
40
60
80
100
mA
U /2
80 n
m
Volume /ml
mA
U /4
17 n
m
Con
duct
ivity
/µS
/cm
Gra
dien
t /%
Figure 65: Purification of SA on a DEAE FF column using a step gradient of NaCl. The absoption at 280 nm (blue), absorption at 417 nm (red), the conductivity (black), and the gradient (green) were monitored. The fraction size was 0.5 ml. The first step was 160 mM NaCl for eight column volumes (CV), the second one at 290 mM NaCl for seven CV, and the third one at 350 mM NaCl for four CV.
The pooled sample was examined on an SDS PAGE gel to analyze the success of
the purification. The SDS PAGE in Figure 58 (lane 6) clearly showed that one ion
exchange chromatography step was sufficient to purify this new enzyme.
Results and Discussion 123
8.3 BM3-like P450 from Actinosynnema pretiosum ssp. auranticum
8.3.1 The Actinomycete Actinosynnema pretiosum ssp. auranticum
Actinosynnema pretiosum ssp. auranticum was the second actinomycete which was
found in the BLAST search for BM3-like P450 (locus AAM54108; accession code
AF453501.1). This rare actinomycete was isolated from blades of grass in Japan and
is an antibiotic and vitamin producer. Its BM3-like P450 was identified by sequencing
of biosynthetic gene clusters and initially proposed to catalyze the epoxidation of a
polyketide produced by this strain.[330] This hypothesis was questioned by later
experiments[331] and its real function remains unknown, since it has never been
cloned and studied.
8.3.2 Cloning of the BM3-like from Actinosynnema pretiosum ssp.
auranticum A. pretiosum ssp. auranticum was obtained from the DSMZ (DSMZ 44131) and
grown in GYM medium at 28°C. The genomic DNA was isolated (see protocol IV5.1)
and restriction digested with BamHI to enable a PCR amplification of this GC-rich
ORF (from now on called ap; 75% GC content). For the PCR the same protocol as
for sa was applied which resulted in a sufficiently specific amplification (PCR protocol
IV5.6.6). This demonstrates the robustness of this PCR protocol (which is in the
meantime also applied in other laboratories).
Figure 66: Amplification of ap from A. pretiosum ssp. auranticum. Preparative gel purification of the PCR product from the amplification of ap using a fragment of the genomic DNA as template. The product is excised from the gel.
The purified PCR product was digested with BspHI and EcoRI and afterwards ligated
into pETM11 (digested with NcoI and EcoRI) as sa before and the resulting plasmid
was used to transform BL21Gold(DE3), yielding the expression construct
Results and Discussion 124
BL21Gold(DE3)[pETM11-AP]. Successful ligation was examined by analytical
restriction digestion (data not shown).
Subsequent expression experiments were unsuccessful using the protocols which
were established for SA and BM3. By SDS PAGE analysis no overexpressed protein
was found in either the insoluble cell debris or the soluble supernatant as obtained
after after cell lysis. In addition, no P450 was detected by CO differential
spectroscopy. Other E. coli strains might potentially solve this experimental problem,
such as for example the rare codon strain Rosetta(DE3), but have not yet been
investigated.
8.4 BM3-like P450 from Ralstonia metallidurans
8.4.1 The Bacterium R. metallidurans Another bacterium that was found to possess a BM3-like P450 according to a BLAST
search was Ralstonia metallidurans (DSMZ 2839; CYP102E1; gene accession code
NC_007973; locus YP_585608). The BLAST score was 492, the sequence identity to
BM3 49.2%. R. metallidurans CH34, formerly Ralstonia eutropha and Alcaligenes
eutrophus, is a gram-negative, non-sporulating bacillus that flourishes in millimolar
concentrations of toxic heavy metals. Although the reference strain, CH34, was first
isolated in 1976 from the sludge of a zinc decantation tank in Belgium that was
polluted with high concentrations of several heavy metals, it and other metal-resistant
members of the genus Ralstonia are frequently found in sediments and soils with a
high content of heavy metals from diverse geographical locations. A typical feature of
these metal-resistant Ralstonia is the presence of one or two large mega-plasmids
which contain genes for multiple resistances to heavy metals. The reference strain,
CH34, which was selected for its capacity to grow on minimal salt medium of low
complexity containing cobalt, zinc, and cadmium ions, contains two large plasmids,
pMOL28 (180 kb) and pMOL30 (240 kb).[332, 333]
8.4.2 Cloning of the BM3-like P450 from R. metallidurans R. metallidurans was obtained from the DSMZ and grown in NB medium at 28°C.
The genomic DNA was isolated (IV5.1) and used as a template for the amplification
of the ORF which encoded the BM3-like P450 (from now on called rm). In contrast to
Results and Discussion 125
the PCR amplification of sa, the amplification of rm was found to be straightforward
The direct amplification using the genomic DNA as template resulted in a single band
without any side products (see Figure 67, for a detailed protocol see IV5.6.4). The
PCR product was digested with PciI and EcoRI and ligated into pETM11 (digested
with NcoI and EcoRI). The ligation product was used to transform BL21Gold(DE3) to
yield the expression strain BL21Gold(DE3)[pETM11-RM].
8.4.3 Expression and Purification of R. metallidurans BM-like P450 For the heterologous expression of RM E. coli BL21Gold(DE3)[pETM11-RM] was
cultivated as described above for the other BM3-like P450. Again, somewhat lower
expression levels in comparison to BM3 were observed. A large fraction of the
protein was expressed in form of insoluble inclusion bodies. This protein was also
found to be susceptible to sonication, thus a lysis procedure similar to SA was set up
to enable purification (for a detailed protocol for expression and lysis see IV19.1 and
IV19.4, expression time 40 h). The purification was carried out using IEX, but
because of the higher calculated isoelectric point (IP) of the enzyme (pH 5.8) a
higher pH of the buffer solutions used for purification was chosen (pH 8.0) to improve
the binding capacity and avoid too early an elution of the target protein from the
column. A purification using the weak anion exchange material DEAE FF was found
to enrich the target protein but to obtain a higher purity we decided to optimize the
purification protocol and use the scouting functionality of the Äkta purifier to find
alternative conditions (see Figure 58, lanes 3 and 4). Several other anion exchange
column materials were tested for their applicability in the purification of RM (ANX FF,
M rm
Results and Discussion 126
Q XL, and Resource Q, all GE Healthcare) using different NaCl gradients and pH
values.
0,0 0,5 1,0 1,5 2,00
1000
2000
3000
4000
5000
0
500
1000
1500
2000
0
2
4
6
8
10m
AU /2
80 n
m
Volume /CV
mAU
/417
nm
Con
duct
ivity
/µS/
cm
Figure 68: Buffer exchange of the crude extract of RM after bacterial lysis. Column: Hitrap Desalting, 5 ml. Flow rate: 5 ml/min (1 CV/min). The absoption at 280 nm (blue), absorption at 417 nm (red) and the conductivity (black) were monitored. The fraction volume was 0.5 ml.
The strong anion exchange column Resource Q (GE Healthcare) was found to be a
good starting point for further optimization. To enable the use of this column, the
crude extract as obtained after bacterial lysis first had to be desalted (see Figure 68).
At the same time, the buffer was exchanged from the lysis buffer (pH 7.4, for the
detailed composition see IV19.4) to the purification buffer (25 mM Tris-HCl, pH 8.0).
0 2 4 6 8 10 12 140
500
1000
1500
2000
0
100
200
300
400
500
0
20
40
60
80
100
0
20
40
60
80
100
mA
U /2
80 n
m
Time /min
mAU
/417
nm
Con
duct
ivity
/µS
/cm
Gra
dien
t /%
Figure 69: Purification of RM on a Resource Q column using a linear NaCl gradient. The absoption at 280 nm (blue), absorption at 417 nm (red), the conductivity (black), and the gradient (green) were monitored. The fraction size was 0.5 ml; the flowrate was 4 ml/min.
Results and Discussion 127
0 5 10 15 200
1000
2000
3000
4000
0
100
200
300
400
500
600
700
0
20
40
60
80
100
0
20
40
60
80
100m
AU
/280
nm
Time /min
mA
U /4
17 n
m
Con
duct
ivity
/µS
/cm
Gra
dien
t /%
Figure 70: Purification of RM on a Resource Q column using a step gradient of NaCl. The absoption at 280 nm (blue), absorption at 417 nm (red), the conductivity (black), and the gradient (green) were monitored. The fraction size was 0.5 ml; the flowrate was 4 ml/min.
Purification of RM using the strong anion exchange material and a linear gradient
was unsuccessful (Figure 69), but after optimization of the conditions a baseline
separation of the proteins was achieved using a mixed step/linear gradient (Figure
70). RM was eluted with first step at 200 mM NaCl for eight column volumes.
8.5 Biochemical Characterization of the Enzymes
In order to commence the characterization of the newly cloned and purified enzymes,
a search for substrates was started. Using the NADPH-depletion assay, various
compounds were tested for hydroxylation by the new BM3-likes RM and SA. The
compounds tested for conversion were mainly carboxylic acids and the search
started with fatty acids, as they were described to be hydroxylated by BM3. Table 28
shows the tested compounds and the activity of RM and SA.
Table 28: Possible substrates tested for activity with RM and SA. Relative activity is given as – (no activity), + (activity), ++ (high activity), and +++ (very high activity). In each case, the compound was dissolved in millimolar concentrations in DMSO and added to an aliquot of a crude extract from the expression of the enzymes, which was diluted 1/10 with 50 mM Tris-HCl (pH 7.4, 20% glycerol) to final concentrations of 0.5% or 1% DMSO. The resulting mixtures were incubated at RT for approximately five mintues and the reaction was started by the addition of NADPH (final concentration 100 µM). The NADPH-depletion was monitored at 340 nm. The background was measured in each experiment by the addition of DMSO without substrate.
Results and Discussion 128
Compound Name Activity
SA Activity
RM
47 OH
O Oleic acid - -
48 OH
O Laurinic acid - +
49 OH
O
Caprylic acid + +
50 OH
O
Hexanoic acid ++ +++
51 O
O
Methyl-caprylate - -
52 OH
OH2N
6-Aminohexanoic acid - -
53 OH
ON
O
6-Acetamidohexanoic
acid
++ ++
54 OH
O Citronellic acid + ++
55 OO
ε-Caprolactone - -
56 OH
O
Cyclohexanecarboxylic
acid
+++ +
57 OH
O
2-Methylvalerianic acid + ++
Results and Discussion 129
Compound Name Activity
SA Activity
RM
58 H2N
HO O
NH2
rac-Lysine - -
59 OH
O
NH2
D-Norleucine - -
60 OH 1-Octanol + +
61 OH
O
Ibuprofen - -
62
O
OH
O
Naproxen - -
63 OOH
O
Ketoprofen - -
64 OH
O
α-Phenylbutyric acid + +
65 OH
O
α-Phenylpropionic acid + ++
43 OH
OO
O2N
10-pNCA - +
During these experiments, it became apparent that the substrate scopes of the new
BM3-like P450 differ considerably from BM3. Even though both enzymes showed a
preference for carboxylic acids (caprylic acid 49 was oxidized in contrast to its methyl
ester 51), both enzymes accepted small substrates with short and even branched
carbon chains. This was a property for which BM3 had to be engineered, as it proved
to oxidize these compounds in barely detectable efficiency.[334] On the other hand,
long chain fatty acids such as for example compound 47, which is a good substrate
Results and Discussion 130
for BM3, did not induce NADPH-depletion over the background for the new enzymes.
Complex aromatic substances like ibuprofen (61) and related compounds (62 and
63) were not accepted by the enzymes, whereas the smaller aromatic carboxylic
acids 64 and 65 induced significant NADPH-depletion. Overall, this speaks for a
smaller active site of both new enzymes in comparison to BM3.
Further experiments to confirm actual conversion of the compounds which were
tested positive using the indirect NADPH-assay and to identify the products are
currently under study.
Results and Discussion 131
9 A Platform for the Directed Evolution of P450 BM3
Regio- and stereoseletive hydroxylation reactions represent great challenges for
organic synthesis. Enzymes like P450 BM3 appear to provide a means to carry out
numerous chemical transformations of this kind in an economically feasible manner.
However, BM3 has a narrow substrate scope and therefore a limited applicability. A
reaction of particular interest which was not within the scope of BM3-WT was the
direct α-hydroxylation of carbonyl groups. This reaction was highly difficult if the
synthetic repertoire would have been restricted to classic organic synthesis.
In collaboration with a company, the basis for the development of a BM3 derived
biocatalyst for the α-hydroxylation of compounds 66a and 66b had to be established.
BM3 variants were known to be able to catalyze a reaction of this type, but no
general rule for the mutagenesis necessary to accomplish this was reported.[335]
Neither BM3-WT nor any other of the P450 studied in this work was found to oxidize
these compounds, hence an enzyme engineering approach by directed evolution
was envisaged to develop a suitable BM3 variant. O
R
O
O66a: ZK90162 R1= -OAc66b: ZK90163 R2= -OH
Figure 71: Substrates for α-hydroxylations. (1S,2R,3aR,6aS)-1-(hydroxymethyl)-5-oxooctahydropentalen-2-yl-benzoate (66b) and the acetyl ester thereof (66a).
The preferred strategy for the mutagenesis of BM3 was CASTing and based on the
vast literature which was available regarding BM3, the selection of the libraries was
straightforward (see Figure 72). The positions were selected based on their vicinity to
the manually docked substrate 66b. Docking was performed using the Accelrys
Viewer with a force field optimized structure of the substrate. Positions which were
reported to be crucial for catalysis such as 263 were excluded from the selection (see
Table 29).
Results and Discussion 132
Figure 72: Selected positions for the design of CASTing libraries of BM3 based on the crystal structure of BM3 (pdb-code 1JPZ). The substrate bound to the enzyme in the crystal structure 1JPZ was manually replaced by compound 66b (shown in blue in a ball-and-stick depiction; the structure of 66b was preoptimized using the MM+ force field as implemented in HyperChem 7.0, Hypercube, 2002). Afterwards, the amino acids in a circle of 6 Å around the manually docked compound were selected (shown as sticks). The selection was completed by the residues 47, 51, and 188 which are located at the entrance of the substrate access channel.
Table 29: Selected residues for the design of CASTing libraries of BM3. The residues were selected based on the manual docking of compound 66b into the crystal structure 1JPZ and compared with literature known hot spots. For literature known positions, the reference is given.
Position Literature Position Literature
47 Ref. [336] 260
51 Ref. [336] 264 Ref. [337]
188 Ref. [165] 265
72 267
74 Ref. [165] 328 Ref. [338]
75 329
78 Ref. [165] 330
87 Ref. [85] 437
438
The next step was to develop an efficient system that allows for a rapid screening of
the CAST libraries towards α-hydroxylase activity. It was considered to be optimal for
Results and Discussion 133
the screening to run the test reactions using whole cell catalysis followed by a quick
colorimetric screen. A reaction to detect α-hydroxyketones in a biological
environment was reported by Breuer et al. in 2002.[339] The colorimetric assay is
based on the reduction of the colorless triphenyltetrazoliumchloride (TTC, 69) by
aromatic α-hydroxyketones, yielding the red formazane 70, which shows a strong
absorption at 510 nm. In this work, the protocol described by Breuer et al. was
modified so that it is also applicable for aliphatic compounds using 67 as a model
substance. O
OH
O
O
N N+N
N
N
N
N
NH
67 68
69 70
Scheme 23: Reaction for the detection of α-hydroxyketones. TTC (69) oxidizes the model compound 67 to the corresponding diketone. (For the detailed protocol see IV21.2)
The media which were initially tested for their efficiency in the expression of BM3
(see Table 27) were now tested for their background signal in this assay. The
complex medium without glucose supplied with power mix, which has yielded the
highest specific activity of BM3 in the ealier experiments, was found to be best suited
also for the TTC assay. TB medium, which yielded the highest total activity of BM3
was not suitable for the assay, as the background signal was too high. Overall, a
concentration of 100 µM 67 in the culture supernatant of a BM3 expression was
reproducibly detected over the background signal (Figure 73, Figure 74). Other
alcohols such as 3-octanol (secondary alcohol), prop-2-en-1-ol (allylic alcohol),
alcohol), ethanol (primary alcohol), and 5-hydroxy-pentan-2-one (γ-hydroxyketone) as
well as compounds 66a and 66b did not induce a signal in the TTC assay within one
hour of measurement time, whereas compound 67 was detected within less than 10
minutes. After an incubation time of more than 12 h, a signal was also found for
allylic and benzylic alcohols. This indicated that it should be possible to adjust this
assay to screen also for the corresponding hydroxylation reactions.
Results and Discussion 134
0,0 0,2 0,4 0,6 0,8 1,00,0
0,5
1,0
1,5
2,0
2,5
OD
510
c(67) /mM
Figure 73: Detection of the concentration of compound 67 in a culture supernatant of BL21Gold(DE3)[pETM11-BM3] after the expression of BM3. First, NaOH was added followed by TTC in methanol.
Figure 74: Microtiterplate based TTC assay. Rows A to D contain decreasing concentrations of the model compound 67 in a culture supernatant of BL21Gold(DE3)[pETM11-BM3] after the expression of BM3. Rows A2 to D2 show the background signals of the supernatant alone in the absence of compound 67.
The assay was therefore found to be highly selective and to be able to provide the
ideal screening system for the directed evolution of BM3 towards α-hydroxylation
activity. Overall, taking together the high level expression system for BM3, the
substrate docking based selection of the library positions in the BM3 crystal structure,
and the high-throughput suitable screening system, the stage is set for a directed
evolution of BM3 towards new hydroxylase activities.
Results and Discussion 135
10 A Genetic Screening for Thermostable BM3-like P450
As explained in the introduction, the low operational stability of monooxygenases
significantly contributes to the limited applicability of this enzyme class. This is
especially true for P450 BM3, as its use is not restricted by for example low reaction
rates or a poor expressability in E. coli. Therefore, a thermostable BM3-like P450 as
it might naturally occur in thermophilic microorganisms should provide research and
industry with a powerful new biocatalyst for selective oxidation reactions.
Up to now, the majority of BM3-like P450 were found in bacilli. Nevertheless, the
frequency of occurrence of these enzymes in nature was estimated to be rather low,
as the BLAST search has revealed only a handful of these enzymes encoded by
ORFs within the so far sequenced genomes. We decided to start a genetic screening
for novel BM3-like P450 in unsequenced genomes of (mostly moderate) thermophilic
bacilli and geobacilli which were initially selected based on their vicinity in a
phylogenetic tree to B. megaterium, B. subtilis, B. cereus, or B. anthracis, the known
BM3-like possessing strains.[340-342]
10.1 The Basis for a Genetic Screening
The linker region between the heme and the reductase domains was a typical feature
of BM3-like P450. A selective detection of this region by analytical PCR should
enable the detection of a member of this enzyme class and should be distinguishable
from multicomponent P450.
First, the genes encoding the self-sufficient P450 in the genomes of B. megaterium,
B. subtilis, B. cereus, and B. anthracis were aligned using AlignX from the Vector NTI
software package. Based on highly conserved boundaries of the linker, a set of
degenerated primers was designed which would allow for a toudown PCR based
detection of this specific region, yielding a product of approximately 500 bp (for the
sequences see “fish”-primers in IV1.3 and for the complete alignment of the genes in
the supporting information VII1.2.2). The linker region itself, however, was found to
exhibit only very low sequence conservation. Hence, primers which would directly
The thermophilic bacilli listed in Table 30 were obtained from the DSMZ and grown at
50°C following their specific media requirements. The genomic DNA was isolated
(see protocol IV5.1) and used as template for an analytical scale touchdown PCR in
the presence of DMSO using all possible combinations of the degenerate primers.
Genomic DNA of B. megaterium and B. subtilis served as templates in control
reactions. The size of the expected PCR product was about 500 bp as demonstrated
with the control reactions, which gave a clear and distinct signal with the right size
(see Figure 76, lanes 10 and 11).
Table 30: Thermophilic bacilli which were tested for the presence of BM3-like P450. The strains were grown in the medium shown in the table at 50°C.
Name DSMZ number
Optimal Temperature
Growth medium
B. smithii 4216 55°C NB
G. thermoglucosidasius 2542 55°C GYM
Bacillus sp. 405 70°C NB
Bacillus sp. 406 70°C NB
G. stearothermophilus 1550 55°C NB
Figure 76: Touchdown PCR amplification of the linker region using degenerated primers. 1: 100 bp marker, 2: 1 kb marker, 3: G. stearothermophilus C4, 4: G. thermoglucosidasius D2, 5: G. thermoglucosidasius D6, 6: B. sp. 405 E5, 7: B. sp. 405 E6, 8: B. sp. 406 F5, 9: B. smithii G4, 10: control B. megaterium, 11: control B. subtilis, 12: 100 bp marker.
The samples tested did not show one single distinct band (Figure 76). The reactions
resulted in several bands, nevertheless also showing a band with the expected
9 10 11 12
500 bp
500 bp
1 2 3 4 5 6 7 8
Results and Discussion 138
correct size except for Bacillus sp. 405 E5 (Figure 76, lane 6). These experiments
were fully reproducible with a fresh preparation of genomic DNA.
Based on the DNA alignment (see VII1.2.2), the strains which were tested positive in
this preliminary screen, all backexcept from Bacillus sp. 406, were used as templates
for a second round of genetic screening. This time, degenerated primers covering
almost the complete length of the genes were used (see “fishfull” primers in IV1.3).
The new primers were expected to amplifiy a fragment of approximately 2.2 kbp.
Figure 77: PCR amplification of almost full length genes of possible thermostable P450 BM3-likes. 1: 1 kb ladder (Fermentas). 2: G. thermoglucosidasius, 3: B. sp. DSM 405, 4: B. subtilis using f3f and f1r as primers. 5–7: same organisms as in 1-3 with primers f3f and f2r. 8–9: same organisms as in 1-3 using primers f3f and f3r. b–d same organisms as in 1-3 using primers f2f and f1r; e-g: same organisms as in 1-3 but using primers f2f and f2r; h-j: same organisms as in 1-3 but using primers f2f and f3r. See IV5.6.7 for the protocol.
Figure 78: Amplification of the long fragment. 1+2: B5; 3+4: control reactions, primer fsf and fsr; 6+7: A6; 8+9: control reactions, primer combinations used f2f and f3r. 5: 1kb ladder.
1 2 3 4 5 6 7 8 9 10
a b c d e f g h i j
1 2 3 4 5 6 7 8 9
Results and Discussion 139
All possible combinations of the degenerated primers were tested using genomic
DNA from as B. subtilis control and genomic DNA from G. thermoglucosidasius and
Bacillus. sp. 405 served as templates for an analytical scale touchdown PCR. The
positive primer combinations were scaled up for gel purification. The fragments were
extracted using the freeze ‘n’ squeeze method (IV5.7) and then precipitated by pellet
paint. The pink pellets were resuspended in H2O and dATP, Taq polymerase and the
corresponding buffer were added in order to generate A-overhangs on both 3’ and 5’
ends of the PCR products. Then, 4 µl of each reaction was used to perform a TOPO
TA cloning (Invitrogen, IV6.2). Selection of positive clones was carried out by blue
white screening and was additionally based upon kanamycin resistance of the TOPO
vector. Positive, white colonies were picked, plasmid DNA was isolated and analyzed
by a restriction digest using EcoRI. Clones carrying the appropriately sized inserts
were selected for DNA sequence analysis. These results are still pending.
Summary and Conclusions 140
III Summary and Conclusions
Biocatalysis is more and more recognized by synthetic chemists as a valuable tool
for the synthesis of complex organic compounds with high specificity and under
environmentally benign conditions. In many cases biocatalysis can complement
partial weaknesses of methods from classic organic synthesis. In particular,
biocatalytic redox reactions seldom possess a chemical counterpart showing
comparable stereo- and regiospecificities together with the virtual absence of
competing side reactions. This extraordinary potential of redox biocatalysts however
is not reflected by the current number of synthetic applications using redox active
enzymes.[95] This apparent discrepancy derives from a variety of different factors, as
there are the often low stability of the enzymes under operational conditions, their
dependency on redox cofactors (for example nicotinamides, NAD(P)H and NAD(P)+),
and the still limited availability of redox enzymes showing the desired specificities to
perfom a particular reaction.
In order to overcome these limitations, two different classes of monooxygenases, a
currently underdeveloped family of redox enzymes, were studied within the
framework of this thesis. Baeyer-Villiger Monooxygenases (BVMOs) were subjected
to enzyme engineering by directed evolution and rational design techniques and
subsequently used for synthetic applications. In the second project line, novel
Cytochrome P450s were cloned from a number of bacterial strains, expressed in
E. coli, purified and initially characterized in terms of their biocatalytic potential.
Both classes of enzymes, Baeyer-Villiger monooxygenases and Cyctochrome P450s,
have in common that they show a great potential for synthetic use, since for the
reaction scope of both classes, the equivalent methods in synthetic chemistry are
weak concerning selectivity. But at the same time, both classes of enzymes possess
challenges to be met for research and development.
The first milestone was to engineer the enantioselectivity of a BVMO by means of
directed evolution. For our study, we chose the desymmetrization of 4-
hydroxycyclohexanone as the model reaction and Cyclohexanone Monooxygenase
(CHMO) from Acinetobacter calcaoaceticus NCIMB 9871 (EC 1.14.13.22) as the
“Baeyer–Villigerase”. CHMO catalyzes the oxidation of a range of different ketones,
often with high enantioselectivity, but inevitably many non-natural substrates fail to
Summary and Conclusions 141
react with sufficiently high ee. Since no structural information was available, we
chose error prone PCR as mutagenesis method for the creation of enzyme libraries.
Over two rounds of directed evolution we achieved to increase the enantioselectivity
of CHMO in the model reaction from 9% ee (R) to 90% ee (R). In addition, other
mutants of CHMO yielded the opposite enantiomer of the product lactone. These
results represent the first successful engineering of a BVMO.
Further characterization of several hit mutants revealed that the increase of
selectivity was not restricted to the model substrate, but that these mutated CHMOs
could catalyze the oxidation of a variety of structurally complex ketones with high
enantioselectivity and again in many of these cases, depending on the mutant used,
both enantiomers of the product could be isolated. In addition, a number of mutants
catalyzes the oxidation of substrates which were rejected by the wild-type and
yielded products with a high degree of enantioselectivity. Overall a hot spot in the
sequence of CHMO was identified, which enabled the control of enantioselectivity of
CHMO and contributes to the substrate scope of the enzyme, not only for a variety of
ketones but also for sulfoxidation reactions.
To provide a means for the rationalization of these results, a project was started in
collaboration with the protein crystallography group of Prof. Dr. I. Schlichting to purify
and crystallize CHMO and its mutants. During the course of this project, a high level
expression system of CHMO was established and a procedure for the purification
and in vitro stabilization of this highly sensitive enzyme was developed and handed
over to the crystallographers.
During the course of this project the first crystal structure of a BVMO was published
by another group. The crystallized enzyme was Phenylacetone Monooxygenase
(PAMO). PAMO represents the first described thermostable BVMO and was
therefore promising for biocatalytic applications, especially since the applicability of
established enzymes such as CHMO is hampered by their low stability. However, the
drawback of PAMO is its comparably narrow substrate scope and its limited
enantioselectivitiy in Baeyer-Villiger oxidations. We used the structure of PAMO to
build a homology model of CHMO and in this model we located the hot spot that
controls the enantioselectivity of CHMO and contributes to the substrate scope. The
information gained in this theoretical work was used to devise an approach for the
rational design of PAMO to increase its substrate scope and enantioselectivity. The
Summary and Conclusions 142
catalytic profile of PAMO was shifted close to CHMO, without loss of thermostability.
This provided us with a potentially practical biocatalyst for enantioselective synthesis.
To evaluate the synthetic applicability of the new PAMO mutants, a setup for
preparative scale biocatalytic Baeyer-Villiger oxidations was developed. By means of
buffer additives we could protect PAMO and its mutants from deactivation by organic
solvents, which enabled the use of a second liquid phase in in vitro experiments. This
way, the usual limitations of aqueous phase biocatalysis such as low substrate
solubility and substrate or product inhibition of the enzyme could be circumvented. A
protocol for gram scale biocatalytic Baeyer-Villiger oxidations with high turnover
numbers for the enzyme (TN > 30,000) in combination with high substrate
concentrations (20 g/l) was developed. Regeneration of the NADPH cofactor was in
this case achieved by standard methodology using a coupled enzyme.
In a following project, a new scheme for a much more simplified regeneration of the
enzyme was developed to bypass the need for the highly expensive NADPH or a
complex NADPH regeneration system. In detail, light was used as the driving force
for the BVMO catalyzed reaction. Hereby, free FAD, which was added in catalytic
amounts, was photochemically activated for its reduction by simple electron donors
such as EDTA. The resulting reduced free FAD replaced the usual NADPH and
brought about the reduction of its enzyme bound counterpart, which initiated the
Baeyer-Villiger oxidation of the substrates. This light driven system was found to not
only work for the regeneration of Baeyer-Villiger Monooxygenases, but also for other
classes of flavin dependent redox enzymes. It therefore represents a tool of broad
applicability in biocatalytic redox reactions.
The second project line of this thesis aimed at self-sufficient BM3-like P450. Since
only a small number of P450 BM3-like enzymes were known, altogether with a
limited substrate scope, a project was initiated aiming on the one hand at the finding
of novel BM3 homologs and on the other hand at the directed evolution of BM3 itself.
P450 BM3 was cloned from B. megaterium and a new expression system in E. coli
was set up for this enzyme, which yielded more than 80 mg of enzyme per liter of
culture. To enable a directed evolution of the substrate scope and regioselectivity of
this enzyme in collaboration with an industrial partner, a high-troughput screening
system was developed.
In another project, novel BM3 homologs were identified by genome mining in several
microbes. Using a small number of them as sources for the genes, we cloned and
Summary and Conclusions 143
expressed these enzymes in E. coli. Purification of the enzymes and ensuing
characterization revealed considerably different substrate scopes of these enzymes
compared to BM3, while possessing other beneficial properties such as the
comparably straightforward expression in E. coli.
The P450 project line was completed by the genetic screening of microbial libraries
for the presence of BM3 homologs. A number of strains were found by analytical
PCR to possess such enzymes. Further investigations aiming at the cloning and
characterization of them are currently under study.
Overall, the goal of this thesis was to render monooxygenases, a class of difficult to
handle enzymes, into a ready to use toolbox for biocatalysis. Monooxygenases
catalyze selective partial oxidations of often complex molecules and hence are of
outstanding interest for applications in organic synthesis. However, as delineated
above, these enzymes pose numerous challenges. A number of them were
successfully met within this thesis work, but of course many more are remaining. The
development of PAMO derived thermostable BVMO variants into easy to use
catalysts for stereoselective Baeyer-Villiger oxidations of broad applicability is a
challenge that is expected to be met in the near future based upon the results and
strategies presented in this work and can be expected to show a considerable impact
on the synthetic application of this enzyme family.
The cofactor regeneration project poses interesting questions of pratical as well as of
fundamental concern. The development of a flavo-peroxide shunt using the CAST
strategy in a directed evolution experiment will result in a further simplification of
handling of Baeyer-Villiger monooxygenases. In addition, it will demonstrate the
usefulness of this focused mutagenesis approach to change the mechanism of an
enzyme as complex as a monooxygenase. The light driven regeneration of flavo-
proteins can be expected to be applicable to not only Baeyer-Villiger
monooxygenases and old yellow enzyme homologs but also to P450, especially to
self-sufficient P450 such as BM3.
Within the P450 project line, many interesting experiments can be devised. On the
one hand, the further characterization of the novel BM3-like enzymes which were
expressed and purified in this work will potentially yield interesting information about
BM3-like P450, since they appear to differ considerably from the homologous
enzymes found in Bacilli. Especially, the study of the BM3-like from A. pretiosum ssp.
auranticum will be of enzymological interest. If this enzyme will be found to actually
Summary and Conclusions 144
oxidize a polyketide as it was previously proposed it would be the very first member
of the BM3-like P450 subclass which is not a fatty acid hydroxylase and will provide
insights into the enzymology of these proteins.
Finally, getting a BM3-like P450 with a high operational stability in hands, a property
which is usually linked to the thermostability of the enzyme, would certainly be a
breakthrough in P450 biocatalysis. This goal can be envisaged to be reached either
by enzyme engineering of BM3 based on the B-factor guided Iterative Saturation
Mutagenesis or by the discovery of novel BM3-like enzymes from moderately
thermophilic bacterial strains. The choice of moderately thermophilic bacteria is
important in this respect as enzymes from these sources often show a high activity at
ambient temperature, which is not given for enzymes from hyperthemophilic strains.
Overall, as a number of projects have been started within this work, in part motivated
out of practical aspects and in part out of curiosity, an alternative title of this thesis
could very well have been: Playing with Monooxygenases.
Materials and Methods 145
IV Materials and Methods
1 Microorganisms, Vectors, Plasmids, and Primers
1.1 Microorganisms
Table 31: Strains used in the experiments. All strains are E. coli, unless otherwise stated.
n. d. = not determined
Strain Genotype/Phenotype Source
JM109 (DE3)
endA1, recA1, gyrA96, thi, hsdR17 (rk–
, mk+), relA1, supE44, λ–, Δ(lac-
proAB), [F´, traD36, proAB,
lacIqZΔM15], lDE3
Promega
BL21 (DE3) F- ompT hsdSB(rB-mB
-) gal dcm (DE3) In house
BL21Gold(DE3) B F- omp T hsdSB(rB
-mB-) dcm+ Tetr gal
λ(DE3) endA Hte Stratagene
BLR (DE3) recA- derivative of BL21 (DE3) Tetr Novagen
phenylcyclohexanone and 444 mg (2.3 mmol, 40%) of the corresponding (R)-lactone
were isolated with an ee of 95.4% (for GC see IV9.1).
Materials and Methods 187
11 Light-driven Biocatalytic Oxidations
Light-source: commercial light-bulbs from Osram®, normally 100W OSRAM®-white
light bulb, CLASSIC A, CLAS A CL 100, 230V, E27/ES.
Reaction vessel: 1.5 ml GC-glass-vial sealed with a plastic cap and punctured with a
canula to supply the reaction with air. The vial was attached to the outside of a
double-walled and water-cooled DURAN®-glass cylinder which was placed in a water
bath at 30°C. The light source was placed inside the glass cylinder, the whole setup
finally was covered by aluminium foil.
Figure 84: Setup for light-driven reactions. The reaction vessels are attached to the glass cylinder containing the light source by rubber bands and placed in a water bath.
Final reaction volume: 250 µl
Reaction components:
− 10 µM PAMO-P3 (purified from IV16.2)
− 25 mM EDTA (concentrations were varied during optimization)
− 100 µM FAD (or other flavins in varying concentrations during optimization)
− 250 µM NADP+
− 1 mM or 2 mM substrate
− 50 mM Tris-HCl (pH 7.4)
Materials and Methods 188
Figure 85: Setup for light-driven reactions during irradiation.
The reaction mixtures were extracted with 275 µl of ethyl acetate each (for 2-phenyl
cyclohexanone containing 40 µM n-hexadecane GC-standard) and analyzed by GC
(see IV9.1).
12 Heterologous Expression of Cyclohexanone Monooxygenase
12.1 Expression in E. coli BL21-CodonPlus (DE3)-RP in Shaking Flasks
From a glycerol stock of E. coli BL21-CodonPlus (DE3)-RP [pET22-CHMO-His6] 25
ml of LB-CB medium in a 125 ml Erlenmeyer flask were inoculated and grown at
30°C/125 rpm. In a 1 L Erlenmeyer flask 250 ml of TB-CB-CAM medium were
inoculated 1/100 from this pre-culture and cultivated at 37°C/125 rpm to an OD600 of
~0.5. Expression was induced by adding IPTG to a final concentration of 25 µM and
transferring the flask to a shaker at 20°C/125 rpm. After further 8 h of cultivation, cells
were harvested (4°C/4000xg) and the resulting pellets were frozen at -80°C.
12.2 Expression in E. coli BL21-CodonPlus (DE3)-RP in a 5 l Fermenter
With 80 ml of TB-CB-CAM pre-culture 5 l of TB-CB-CAM medium were inoculated
and grown at 37°C and oxygen saturation (DOT 90-100%) to an OD600 ~ 0.5,
subsequently the temperature was lowered to 22°C and expression was induced by
the addition of IPTG to a final concentration of 25 µM. The DOT was down regulated
Materials and Methods 189
to levels < 20% to protect the sensitive enzyme from oxidative stress. After 9.5 h of
culturing cells were harvested by centrifugation and the pellets were frozen at -80°C.
12.3 Cell Disruption
Cell pellet obtained from expression cultures in either shaking flasks or fermenter
runs, respectively (IV12.1, IV12.2) was thawed on ice and suspended in sonication
buffer (IV3.2) at a concentration of 0.5 g cww/ml by vortexing. Lysis was
accomplished by sonication on an ice/water mixture. Cell debris was removed by
centrifugation at 10,000xg, 4°C. The clarified lysate was subsequently used for
purification.
13 Purification of Cyclohexanone Monooxygenase
13.1 Ni-NTA Affinity Chromatography
All buffers (except from sonication buffer) were degassed by argon bubbling for six
hours prior to use and were constantly cooled on ice. Protein samples were kept on
ice whenever possible. The column used for purification was at RT, the flow rate was
1 ml/min. The lysate obtained after clarification was supplemented with 5 M NaCl to a
final concentration of 0.5 M and with imidazol to a concentration of 10 mM. 20 ml
lysate were loaded on a 1 ml Ni-NTA HighTrap column (Amersham) in 5 ml aliquots.
After the loading the column showed an intensive yellow colour. The column was
washed with 10 ml washing buffer 1 and 5 ml of washing buffer 2 (see IV3.2) to
remove unspecifically bound protein. CHMO was eluted by washing with 5 ml elution
buffer (see IV3.2), which was fractionated to selectively collect the yellow fractions
containing CHMO.
13.2 Ni-NTA Chromatography and On-Column Preparation of apo-CHMO
CHMO was bound to a Ni-NTA HighTrap column as described above (IV13.1) and
washed with washing buffers 1 and 2. Subsequently, the column was washed with
5 ml Apo-buffer (see IV3.2) and again with 5 ml washing buffer 1 (see IV3.2). During
the treatment with Apo-buffer the yellow colour of the column was fully washed out.
Elution of apo-CHMO was accomplished as described above (IV13.1). The eluted
Materials and Methods 190
fractions were analyzed using a 10% SDS-PAGE and subjected to dialysis prior to
further analysis.
13.3 Gelfiltration
Gelfiltration was carried out using a Superdex 200 26/60 column (Amersham). The
column was preequilibrated with 20 mM Tris-HCl (pH 7.4) (2.5 mM β-
mercaptoethanol). 5 ml of concentrated protein sample were loaded on the column
and eluted with preequilibration buffer.
13.4 Dialysis
Dialysis was carried out in a cold room at <10°C. A 2 l beaker was equipped with a
magnetic stir bar and filled with 25 mM Tris-HCl (pH 7.4). 5 ml of yellow protein
sample obtained after affinity chromatography was filled into a dialysis tubing (mwco
= 10,000) and placed in the buffer. The solution was gently stirred for 12 h,
throughout which the protein solution kept its yellow color. Subsequently the protein
solution was recovered and its activity was determined.
14 Characterization of Purified Cyclohexanone Monooxygenase
14.1 Determination of Concentration of Purified CHMO
The concentration of purified CHMO was determined by UV/VIS-spectrophotometry
based on the absorption of enzyme bound FAD at 440 nm (13.8 mM-1 cm-1).[105]
14.2 NADPH-Depletion Assay for CHMO
To measure the activity of CHMO preparations the rate of NADPH-depletion in the
oxidation of cyclohexanone to ε-caprolactone was measured. The reaction volume
was 200 µl and the reactions were run in microtiterplates in the Spectramax 96 well
photometer.
− 10 µl CHMO-preparation
− 10 µl cyclohexanone (100 mM in H2O)
− 10 µl NADPH (2 mM)
− 170 µl of glycine-NAOH buffer (pH 9.0)
Materials and Methods 191
Reactions were started by the addition of NADPH, background depletion was
determined in the absence of substrate.
14.3 Stabilization of Purified CHMO for Crystallization Experiments
To stabilize purified CHMO a variety of potentially stabilizing agents were tested for
their effect. Preparations of purified CHMO were incubated in the presence of these
agents for a prolonged time at either 20°C or 4°C. At certain time points, samples
were taken and measured for their residual activity by NADPH-depletion.
14.4 CD-Spectroscopy of CHMO
CD-spectroscopy was applied to monitor the denaturation of CHMO over the time.
The goal was to measure the stability of apo-CHMO without the need to reconstitute
the holo-protein before each activity assay. The method however, was found to be
not applicable for these purposes.
Instrument: Magnetic circular dichroism (MCD) spectrometer (JASCO, 200 –
1100 nm), with superconducting magnet/cryostat (Oxford Instruments; 0-11 Tesla;
1.5 - 300 K), the magnet was switched off during the experiments.
CHMO and apo-CHMO samples were diluted to 10 µM enzyme with 10 mM Tris-HCl
(pH 7.4) and measured directly against background.
15 Heterologous Expression of Phenylacetone Monooxygenase
15.1 Expression in E. coli TOP10 in Shaking Flasks
Heterologous expression of Phenylacetone Monooxygenase and mutants thereof
was carried out using E. coli TOP10 [pPAMO]. From a glycerol stock 25 ml of LB-CB
medium in a 125 ml Erlenmeyer flask was inoculated and kept at 37°C/125 rpm
overnight. From this pre-culture 250 ml of TB-CB (0.1% L-arabinose) medium in a 1 l
Erlenmeyer flask were inoculated 1/100 and cultured at 37°C/125 rpm for 12 h. Cells
were harvested by centrifugation (4°C/5000xg) and cell pellets were frozen at -80°C.
15.2 Expression in E. coli TOP10 in a 5 l Fermenter
Large scale expression of PAMO-P3 mutant was carried out in a 5 l fermenter in TB-
CB medium (0.1% L-arabinose). As an inoculum 100 ml of TB-CB pre-culture were
Materials and Methods 192
used. Temperature and stirrer speed were kept constant (800 rpm/37°C). After
approximately 7 h of expression the cells were harvested by centrifugation and the
resulting cell paste frozen at -80°C.
1 2 3 4 5 6 70
2
4
6
8
10
12
OD
600
Time / h
Figure 86: Fermentation profile for large scale expression of PAMO-P3.
16 Purification of Phenyacetone Monooxygenase
16.1 Small Scale Purification via Ni-NTA Chromatography
Cell pellet obtained from expression in shaking flasks was thawed on ice and
suspended in 50 mM Tris-HCl (pH 7.4) at a concentration of 0.5 g cww/ml. Cells were
disrupted by sonication on ice and cell debris was removed by centrifugation
(10,000xg, 4°C, 45 min). The clarified supernatant was incubated at 50°C for 1 h in a
water bath, then again clarified by centrifugation. 5 ml supernatant were
supplemented with 5 M NaCl to a final concentration of 0.5 M and loaded on a 1 ml
HighTrap Ni-NTA column (Amersham) at a flow rate of 1 ml/min. The column turned
yellow and was washed first with 10 ml of 50 mM Tris-HCl (pH 7.4), second with 10
ml 50 mM Tris-HCl (pH 7.4) supplemented with 5 mM imidazol. PAMO was eluted
with 5 ml 50 mM Tris-HCl (pH 7.4) supplemented with 200 mM imidazol and product
containing fractions were identified by their yellow colour and kept on ice.
16.2 Large Scale Purification of PAMO-P3 via Ni-NTA Chromatography
The complete cell paste resulting from a 5 l TOP10 [pPAMO-P3] expression culture
run in a fermenter was after one cycle of freezing (-80°C) and thawing suspended in
250 ml 20 mM KH2PO4 (pH 7.4) containing 10 µM FAD and 0.2 mg/ml lysozyme and
Materials and Methods 193
incubated at 4°C for 30 min. Cells were disrupted by sonication and the lysate
clarified by centrifugation (10,000xg, 4°C, 60 min). The supernatant was incubated at
50°C for 1 h in a water bath and subsequently centrifuged again. This time the
supernatant was supplemented with 0.5 M NaCl and mixed with 35 ml of Novagen
Fractogel His-bind resin (preequilibrated and loaded with Ni2+ as recommended by
the manufacturer). The suspension was gently mixed for 30 min then manually
loaded into a 500 ml glass column and packed under 1.5 bar Ar-pressure. The
flowthrough obtained was loaded onto the column once more, subsequently the
column was washed with 350 ml of 20 mM KH2PO4 (pH 7.4), then with 350 ml 20 mM
KH2PO4 (pH 7.4) supplemented with 1 mM imidazol. PAMO-P3 was eluted with 100
ml 50 mM Tris-HCl (pH 7.4) containing 200 mM imidazol. In total 25 ml of yellow
eluate were collected and concentrated to 12.5 ml by centrifuge filters (Amicon,
mwco = 10,000).
16.3 Desalting of PAMO Eluates
The final purification step in each case was desalting of the eluates via PD-10
columns (Amersham, 8.3 ml Sephadex G-25 medium). The columns were
preequilibrated with 50 mM Tris-HCl (pH 7.4), the 2.5 ml of sample were loaded on
and the desalted protein was eluted with 3.5 ml of 50 mM Tris-HCl (pH 7.4).
17 Characterization of Purified PAMO and PAMO mutants
17.1 Determination of Concentration of Purified PAMO
The concentration of purified enzyme in 50 mM Tris-HCl (pH 7.4) was determined by
the UV/VIS absorbance at 441 nm (ε441nm = 12.4 mM-1 cm-1; [20]).
17.2 Steady-state Kinetics
Michaelis-Menten kinetic parameters of PAMO and PAMO mutants were determined
utilizing the change of absorbance at 340 nm upon NADPH-depletion throughout the
oxidation reaction (absorbance of NADPH, ε340nm = 6.22 mM-1 cm-1) on a Spectramax
96 well spectrophotometer.
The reaction mixture comprised a total volume of 200 µl containing
− 1 µM purified PAMO (see IV16.1)
Materials and Methods 194
− 0.1 mM NADPH
− 50 mM Tris-HCl (pH 8.0)
− 2.5 % acetonitrile (v/v) containing the substrate of choice in various
concentrations
Final concentration of substrates (resulting from a dilution row):
[1] K. Faber, Biotransformations in Organic Chemiystry, 5th ed., Springer, 2004. [2] K. Drauz, H. Waldmann, Enzyme Catalysis in Organic Synthesis. A
Comprehensive Handbook, 2 ed., Wiley-VCH, Weinheim, 2002. [3] A. Schmid, J. S. Dordick, B. Hauer, A. Kiener, M. Wubbolts, B. Witholt, Nature
2001, 409, 258. [4] U. T. Bornscheuer, K. Buchholz, Eng. Life Sci. 2005, 5, 309. [5] M. Breuer, K. Ditrich, T. Habicher, B. Hauer, M. Keßeler, R. Stürmer, T.
Zelinski, Ang. Chem. Int. Ed. 2004, 43, 788. [6] M. Held, A. Schmid, J. B. van Beilen, B. Witholt, Pure Appl. Chem. 2000, 72,
1337. [7] C. Wandrey, A. Liese, D. Kihumbu, Org. Process Res. Dev. 2000, 4, 286. [8] A. Liese, M. Villela, Curr. Opin. Biotechnol. 1999, 10, 595. [9] D. J. Pollard, J. M. Woodley, Trends Biotechnol. 2007, 25, 66. [10] F. M. Menger, Acc. Chem. Res. 1993, 26, 206. [11] A. M. Klibanov, Acc. Chem. Res. 1990, 23, 114. [12] G. Carrea, S. Riva, Ang. Chem. Int. Ed. 2000, 39, 2226. [13] G. Carrea, G. Ottolina, S. Riva, Trends Biotechnol. 1995, 13, 63. [14] R. Wichmann, C. Wandrey, A. F. Buckmann, M. R. Kula, Biotechnol. Bioeng.
1981, 23, 2789. [15] M. R. Kula, C. Wandrey, Methods Enzymol. 1987, 136, 9. [16] M. Biselli, U. Kragl, C. Wandrey, in Enzyme Catalysis in Organic Synthesis. A
Comprehensive Handbook, Vol. I, 2 ed. (Eds.: K. Drauz, H. Waldmann), Wiley-VCH, 2002, pp. 185.
[17] D. Vasic-Racki, U. Kragl, A. Liese, Chem. Biochem. Eng. Q. 2003, 17, 7. [18] U. Kragl, W. Kruse, W. Hummel, C. Wandrey, Biotechnol. Bioeng. 1996, 52,
309. [19] P. Lorenz, J. Eck, Eng. Life Sci. 2004, 4, 501. [20] M. W. Fraaije, J. Wu, D. Heuts, E. W. van Hellemond, J. H. L. Spelberg, D. B.
Janssen, Appl. Microbiol. Biotechnol. 2005, 66, 393. [21] J. Y. Kim, G. S. Choi, I. S. Jung, Y. W. Ryu, G. J. Kim, Protein Eng. 2003, 16,
357. [22] P. Lorenz, K. Liebeton, F. Niehaus, J. Eck, Curr. Opin. Biotechnol. 2002, 13,
572. [23] R. Daniel, Curr. Opin. Biotechnol. 2004, 15, 199. [24] M. Smith, Annu. Rev. Genet. 1985, 19, 423. [25] M. A. Dwyer, L. L. Looger, H. W. Hellinga, Science 2004, 304, 1967. [26] H. W. Hellinga, Curr. Opin. Biotechnol. 1996, 7, 437. [27] M. A. Dwyer, H. W. Hellinga, Curr. Opin. Struct. Biol. 2004, 14, 495. [28] M. K. DiTursi, S. J. Kwon, P. J. Reeder, J. S. Dordick, Protein Eng. Des. Sel.
2006, 19, 517. [29] D. N. Bolon, C. A. Voigt, S. L. Mayo, Curr. Opin. Chem. Biol. 2002, 6, 125. [30] V. G. H. Eijsink, A. Bjork, S. Gaseidnes, R. Sirevag, B. Synstad, B. van den
Burg, G. Vriend, J. Biotechnol. 2004, 113, 105. [31] D. R. Mills, R. L. Peterson, S. Spiegelmann, Proc. Natl. Acad. Sci. U.S.A.
1967, 58, 217. [32] M. Eigen, W. Gardiner, Pure Appl. Chem. 1984, 56, 967.
References 204
[33] H. Liao, T. McKenzie, R. Hageman, Proc. Natl. Acad. Sci. U.S.A. 1986, 83, 576.
[34] A. Aharoni, L. Gaidukov, O. Khersonsky, S. M. Gould, C. Roodveldt, D. S. Tawfik, Nat. Genet. 2005, 37, 73.
[35] H. H. Guo, J. Choe, L. A. Loeb, Proc. Natl. Acad. Sci. U.S.A. 2004, 101, 9205. [36] S. Brakmann, K. Johnsson, Directed Molecular Evolution of Proteins. Or How
to Improve Enzymes for Biocatalysis Wiley VCH, 2002. [37] M. T. Reetz, Proc. Natl. Acad. Sci. U.S.A. 2004, 101, 5716. [38] N. J. Turner, Trends Biotechnol. 2003, 21, 474. [39] P. A. Dalby, Curr. Opin. Struct. Biol. 2003, 13, 500. [40] J. R. Cherry, A. L. Fidantsef, Curr. Opin. Biotechnol. 2003, 14, 438. [41] I. P. Petrounia, F. H. Arnold, Curr. Opin. Biotechnol. 2000, 11, 325. [42] M. T. Reetz, Angew. Chem. Int. Ed. 2001, 40, 284. [43] H. Tao, V. W. Cornish, Curr. Opin. Chem. Biol. 2002, 6, 858. [44] K. E. Jaeger, T. Eggert, A. Eipper, M. T. Reetz, Appl Biochem Biotechnol
2001, 55, 519. [45] C. Schmidt-Dannert, F. H. Arnold, Trends Biotechnol. 1999, 17, 135. [46] F. H. Arnold, A. A. Volkov, Curr. Opin. Chem. Biol. 1999, 3, 54. [47] J. D. Bloom, M. M. Meyer, P. Meinhold, C. R. Otey, D. MacMillan, F. H.
Arnold, Curr. Opin. Struct. Biol. 2005, 15, 447. [48] T. W. Johannes, H. Zhao, Curr. Opin. Microbiol. 2006, 9, 261. [49] C. Roodveldt, A. Aharoni, D. S. Tawfik, Curr. Opin. Struct. Biol. 2005, 15, 50. [50] F. H. Arnold, Nat. Biotechnol. 2006, 24, 328. [51] F. H. Arnold, Acc. Chem. Res. 1998, 31, 125. [52] D. W. Leung, E. Chen, D. V. Goeddel, Technique (Philadelphia) 1989, 1, 11. [53] R. C. Cadwell, G. F. Joyce, PCR Methods Appl. 1992, 2, 28. [54] Stratagene, in United States Patent 6,803,216, USA, 2005. [55] R. Fujii, M. Kitaoka, K. Hayashi, Nucleic Acids Res. 2004, 32, MID. [56] R. Fujii, M. Kitaoka, K. Hayashi, Nat. Protocols 2006, 1, 2493. [57] T. S. Wong, K. L. Tee, B. Hauer, U. Schwaneberg, Nucleic Acids Res. 2004,
32, MID. [58] T. S. Wong, K. L. Tee, B. Hauer, U. Schwaneberg, Anal. Biochem. 2005, 341,
187. [59] S. Lutz, W. M. Patrick, Curr. Opin. Biotechnol. 2004, 15, 291. [60] D. A. Drummond, J. J. Silberg, M. M. Meyer, C. O. Wilke, F. H. Arnold, Proc.
Natl. Acad. Sci. U.S.A. 2005, 102, 5380. [61] W. P. C. Stemmer, Nature 1994, 370, 389. [62] W. P. C. Stemmer, Proc. Natl. Acad. Sci. U.S.A. 1994, 91, 10747. [63] A. Crameri, S. A. Raillard, E. Bermudez, W. P. C. Stemmer, Nature 1998, 391,
288. [64] J. E. Ness, S. Kim, A. Gottman, R. Pak, A. Krebber, T. V. Borchert, S.
Govindarajan, E. C. Mundorff, J. Minshull, Nat. Biotechnol. 2002, 20, 1251. [65] H. M. Zhao, L. Giver, Z. X. Shao, J. A. Affholter, F. H. Arnold, Nat. Biotechnol.
1998, 16, 258. [66] L. Giver, F. H. Arnold, Curr. Opin. Chem. Biol. 1998, 2, 335. [67] H. M. Zhao, F. H. Arnold, Nucleic Acids Res. 1997, 25, 1307. [68] T. Eggert, S. A. Funke, N. M. Rao, P. Acharya, H. Krumm, M. T. Reetz, K.-E.
Jaeger, ChemBioChem 2005, 6, 1062. [69] W. M. Coco, W. E. Levinson, M. J. Crist, H. J. Hektor, A. Darzins, P. T.
Pienkos, C. H. Squires, D. J. Monticello, Nat. Biotechnol. 2001, 19, 354. [70] J. M. Joern, P. Meinhold, F. H. Arnold, J. Mol. Biol. 2002, 316, 643.
References 205
[71] M. Ostermeier, J. H. Shim, S. J. Benkovic, Nat. Biotechnol. 1999, 17, 1205. [72] M. Ostermeier, A. E. Nixon, S. J. Benkovic, Bioorg. Med. Chem. 1999, 7,
2139. [73] M. Ostermeier, A. E. Nixon, J. H. Shim, S. J. Benkovic, Proc. Natl. Acad. Sci.
U.S.A. 1999, 96, 3562. [74] S. Lutz, M. Ostermeier, S. J. Benkovic, Nucl. Acids Res. 2001, 29, e16. [75] S. Lutz, M. Ostermeier, G. L. Moore, C. D. Maranas, S. J. Benkovic, Proc.
Natl. Acad. Sci. U.S.A. 2001, 98, 11248. [76] K. L. Morley, R. J. Kazlauskas, Trends Biotechnol. 2005, 23, 231. [77] R. J. Kazlauskas, Curr. Opin. Chem. Biol. 2005, 9, 195. [78] J. A. Wells, M. Vasser, D. B. Powers, Gene 1985, 34, 315. [79] K. M. Derbyshire, J. J. Salvo, N. D. Grindley, Gene 1986, 46, 145. [80] M. T. Reetz, S. Wilensek, D. Zha, K.-E. Jaeger, Ang. Chem. Int. Ed. 2001, 40,
3589. [81] M. Isalan, Nat. Protocols 2006, 1, 468. [82] M. L. Geddie, G. ML, I. Matsumura, M. I, J. Biol. Chem. 2004, 279, 26462. [83] L. Rui, Y. M. Kwon, A. Fishman, K. F. Reardon, T. K. Wood, Appl. Environ.
Microbiol. 2004, 70, 3246. [84] M. R. Parikh, I. Matsumura, J. Mol. Biol. 2005, 352, 621. [85] P. Meinhold, Matthew W. Peters, A. Hartwick, Alisha R. Hernandez, F. H.
Arnold, Adv. Synth. Catal. 2006, 348, 763. [86] T. Sakamoto, J. M. Joern, A. Arisawa, F. H. Arnold, Appl. Environ. Microbiol.
2001, 67, 3882. [87] K. Miyazaki, P. L. Wintrode, R. A. Grayling, D. N. Rubingh, F. H. Arnold, J.
Mol. Biol. 2000, 297, 1015. [88] C. M. Hill, W. S. Li, J. B. Thoden, H. M. Holden, F. M. Raushel, J. Am. Chem.
Soc. 2003, 125, 8990. [89] M. T. Reetz, M. Bocola, J. D. Carballeira, D. Zha, A. Vogel, Ang. Chem. Int.
Ed. 2005, 44, 4192. [90] M. T. Reetz, J. D. Carballeira, J. Peyralans, H. Höbenreich, A. Maichele, A.
Vogel, Chem.-Eur. J. 2006, 12, 6031. [91] M. T. Reetz, L.-W. Wang, M. Bocola, Ang. Chem. Int. Ed. 2006, 45, 1236. [92] M. T. Reetz, C. Torre, A. Eipper, R. Lohmer, M. Hermes, B. Brunner, A.
Maichele, M. Bocola, M. Arand, A. Cronin, Y. Genzel, A. Archelas, R. Furstoss, Org. Lett. 2004, 6, 177.
[93] C. M. Clouthier, M. M. Kayser, M. T. Reetz, J. Org. Chem. 2006, 71, 8431. [94] S. Flitsch, G. Grogan, D. Ashcroft, in Enzyme Catalysis in Organic Synthesis.
A Comprehensive Handbook, Vol. III (Eds.: K. Drauz, H. Waldmann), Wiley-VCH, 2002.
[95] A. J. J. Straathof, S. Panke, A. Schmid, Curr. Opin. Biotechnol. 2002, 13, 548. [96] J. B. van Beilen, W. A. Duetz, A. Schmid, B. Witholt, Trends Biotechnol. 2003,
21, 170. [97] P. J. Loida, S. G. Sligar, Biochemistry 1993, 32, 11530. [98] S. Narasimhulu, Biochim. Biophys. Acta 2007, 1770, 360. [99] W. A. Duetz, J. B. van Beilen, B. Witholt, Curr. Opin. Biotechnol. 2001, 12,
419. [100] A. Z. Walton, J. D. Stewart, Biotechnol. Prog. 2004, 20, 403. [101] V. B. Urlacher, R. D. Schmid, Curr. Opin. Chem. Biol. 2006, 10, 156. [102] Z. Li, J. B. van Beilen, W. A. Duetz, A. Schmid, A. de Raadt, H. Griengl, B.
Witholt, Curr. Opin. Chem. Biol. 2002, 6, 136. [103] J. D. Stewart, Curr. Org. Chem. 1998, 2, 195.
References 206
[104] N. Donoghue, D. Norris, P. Trudgill, Eur. J. Biochem. 1976, 63, 175. [105] D. Sheng, D. P. Ballou, V. Massey, Biochemistry 2001, 40, 11156. [106] C. T. Walsh, Y. C. J. Chen, Angew. Chem. Int. Ed. 1988, 27, 333. [107] C. C. Ryerson, D. P. Ballou, C. Walsh, Biochemistry 1982, 21, 2644. [108] A. Willetts, Trends Biotechnol. 1997, 15, 55. [109] D. J. Manstein, V. Massey, S. Ghisla, E. F. Pai, Biochemistry 1988, 27, 2300. [110] M. B. Kneller, M. J. Cheesman, A. E. Rettie, Biochem. Biophys. Res.
Commun. 2001, 282, 899–903. [111] M. J. Cheesman, M. B. Kneller, A. E. Rettie, Chem.-Biol. Interact. 2003, 146,
157. [112] O. Abril, C. C. Ryerson, C. Walsh, G. M. Whitesides, Bioorg. Chem. 1989, 17,
41. [113] A. Palfey, V. Massey, Comprehensive Biological Catalysis 1998, 3, 83 [114] V. Massey, J. Biol. Chem. 1994, 269, 22459. [115] R. H. H. van den Heuvel, N. Tahallah, N. M. Kamerbeek, M. W. Fraaije, W. J.
H. van Berkel, D. B. Janssen, A. J. R. Heck, J. Biol. Chem. 2005, 280, 32115. [116] M. W. Fraaije, N. M. Kamerbeek, A. J. Heidekamp, R. Fortin, D. B. Janssen, J.
Biol. Chem. 2004, 279, 3354. [117] N. M. Kamerbeek, D. B. Janssen, W. J. H. van Berkel, M. W. Fraaije, Adv.
Synth. Catal. 2003, 345, 667. [118] M. W. Fraaije, N. M. Kamerbeek, W. J. H. van Berkel, D. B. Janssen, Febs
Letters 2002, 518, 43. [119] W. J. H. van Berkel, N. M. Kamerbeek, M. W. Fraaije, J. Biotechnol. 2006,
124, 670. [120] B. G. Kyte, P. Rouviere, Q. Cheng, J. D. Stewart, J. Org. Chem 2004, 69, 12. [121] A. E. Keppler, A. L. M. Porto, I. H. Schoenlein-Crusius, J. V. Comasseto, L. H.
Andrade, Enzyme Microb. Technol. 2005, 36, 967. [122] R. A. C. Goncalvez, A. L. M. Porto, L. Pinheiro, J. R. Cagnon, G. P. Manfio, A.
J. Marsaioli, Food Technol. Biotechnol. 2004, 42, 355. [123] J. D. Carballeira, E. Alvarez, J. V. Sinisterra, J. Mol. Catal. B 2004, 28, 25. [124] H. Iwaki, Y. Hasegawa, M. Teraoka, T. Tokuyama, L. Bernard, P. C. K. Lau, in
Biocatalysis in Polymer Science, Vol. 840, 2003, pp. 80. [125] P. C. Brzostowicz, D. M. Walters, S. M. Thomas, V. Nagarajan, P. E.
Rouviere, Appl. Environ. Microbiol. 2003, 69, 334. [126] Y. Hasegawa, Y. Nakai, T. Tokuyama, H. Iwaki, Biosci., Biotechnol., Biochem.
2000, 64, 2696. [127] A. F. Keppler, A. L. M. Porto, I. H. Schoenlein-Crusius, J. V. Comasseto, L. H.
Andrade, Enzyme Microb. Technol. 2005, 36, 967. [128] D. Bonsor, S. F. Butz, J. Solomons, S. Grant, I. J. S. Fairlamb, M. J. Fogg, G.
Grogan, Org. Biomol. Chem. 2006, 4, 1252. [129] C. Wang, M. Gibson, J. Rohra, M. A. Oliveiraa, Acta Crystallogr Section F
2005, 61, 1023. [130] H. Iwaki, Y. Hasegawa, S. Wang, M. M. Kayser, P. C. K. Lau, Appl. Environ.
Microbiol. 2002, 68, 5671–5684. [131] H. Iwaki, S. Wang, S. Grosse, H. Bergeron, A. Nagahashi, J. Lertvorachon, J.
Yang, Y. Konishi, Y. Hasegawa, P. C. K. Lau, Appl. Environ. Microbiol. 2006, 72, 2707.
[132] J. B. van Beilen, F. Mourlane, M. A. Seeger, J. Kovac, Z. Li, T. H. M. Smits, U. Fritsche, B. Witholt, Environ. Microbiol. 2003, 5, 174.
[133] Y. C. J. Chen, O. P. Peoples, C. T. Walsh, J. Bacteriol. 1988, 170, 781.
References 207
[134] K. Kostichka, S. M. Thomas, K. J. Gibson, V. Nagarajan, Q. Cheng, J. Bacteriol. 2001, 183, 6478.
[135] S. Morii, S. Sawamoto, Y. Yamauchi, M. Miyamoto, M. Iwami, E. Itagaki, J. Biochem. 1999, 126, 624.
[136] N. M. Kamerbeek, M. J. H. Moonen, J. G. M. van der Ven, W. J. H. van Berkel, M. W. Fraaije, D. B. Janssen, Eur. J. Biochem. 2001, 268, 2547.
[137] S. Colonna, N. Gaggero, G. Carrea, G. Ottolina, P. Pasta, F. Zambianchi, Tetrahedron Lett. 2002, 43, 1797–1799.
[138] S. Colonna, V. Pironti, G. Carrea, P. Pastab, F. Zambianchi, Tetrahedron 2004, 60, 569.
[139] S. Colonna, V. Pironti, P. Pastab, F. Zambianchi, Tetrahedron Lett. 2003, 44, 869.
[140] G. Ottolina, S. Bianci, B. Belloni, G. Carrea, B. Danieli, Tetrahedron Lett. 1999, 40, 8483.
[141] Y. Imada, H. Iida, S. Ono, S. I. Murahashi, J. Am. Chem. Soc. 2003, 125, 2868.
[142] M. D. Mihovilovic, F. Rudroff, B. Grotzl, Curr. Org. Chem. 2004, 8, 1057. [143] M. D. Mihovilovic, B. Muller, P. Stanetty, Eur. J. Org. Chem. 2002, 3711. [144] M. D. Mihovilovic, B. Müller, M. Spina, A. I. Durrani, P. Stanetty, G. Dazinger,
K. Kirchner, Monatsh. Chem. 2006, 137, 785. [145] M. D. Mihovilovic, F. Rudroff, B. Grötzl, P. Kapitan, R. Snajdrova, J. Rydz, R.
Mach, Ang. Chem. Int. Ed. 2005, 44, 3609. [146] S. Wang, M. M. Kayser, H. Iwaki, P. C. K. Laub, J. Mol. Catal. B: Enzym.
2003, 22, 211. [147] M. D. Mihovilovic, F. Rudroff, B. Muller, P. Stanetty, Bioorg. Med. Chem. Lett.
2003, 13, 1479. [148] S. Colonna, S. Del Sordo, N. Gaggero, G. Carrea, P. Pasta, Heteroat. Chem.
2002, 13, 467. [149] F. Petit, R. Furstoss, Tetrahedron Asymmetry 1993, 4, 1341. [150] V. Alphand, R. Furstoss, J. Org. Chem. 1992, 57, 1306130. [151] V. Alphand, R. Furstoss, S. Pedragosa-Moreau, S. Roberts, A. Willetts, J.
Chem. Soc., Perkin Trans. 1 1996, 1867 [152] V. Alphand, A. Archelas, R. Furstoss, Tetrahedron Lett. 1989, 30, 3663. [153] I. G. Denisov, T. M. Makris, S. G. Sligar, I. Schlichting, Chem. Rev. 2005, 105,
2253. [154] E. M. Isin, F. P. Guengerich, Biochim. Biophys. Acta 2007, 1770, 314. [155] I. Schlichting, J. Berendzen, K. Chu, A. M. Stock, S. A. Maves, D. E. Benson,
B. M. Sweet, D. Ringe, G. A. Petsko, S. G. Sligar, Science 2000, 287, 1615. [156] A. W. Munro, D. G. Leys, K. J. McLean, K. R. Marshall, T. W. B. Ost, S. Daff,
C. S. Miles, S. K. Chapman, D. A. Lysek, C. C. Moser, C. C. Page, P. L. Dutton, Trends Biochem. Sci. 2002, 27, 250.
[157] B. Meunier, S. P. deVisser, S. Shaik, Chem. Rev. 2004, 104, 3947. [158] L. Narhi, A. Fulco, J. Biol. Chem. 1987, 262, 6683. [159] L. O. Narhi, A. J. Fulco, J. Biol. Chem. 1986, 261, 7160. [160] A. W. Munro, H. M. Girvan, K. J. McLean, Biochim. Biophys. Acta 2007, 1770,
345. [161] I. F. Sevrioukova, H. Li, H. Zhang, J. A. Peterson, T. L. Poulos, Proc. Natl.
Acad. Sci. U.S.A. 1999, 96, 1863. [162] A. J. Warman, O. Roitel, R. Neeli, H. M. Girvan, H. E. Seward, S. A. Murray,
K. J. McLean, M. G. Joyce, H. Toogood, R. A. Holt, D. Leys, N. S. Scrutton, A. W. Munro, Biochem. Soc. Trans. 2005, 33, 747.
References 208
[163] V. B. Urlacher, R. D. Schmid, Methods Enzymol. 2004, 388, 208. [164] P. Meinhold, M. W. Peters, M. M. Y. Chen, K. Takahashi, F. H. Arnold,
ChemBioChem 2005, 6, 1765. [165] D. Appel, S. Lutz-Wahl, P. Fischer, U. Schwaneberg, R. D. Schmid, J.
Biotechnol. 2001, 88, 167. [166] M. D. Mihovilovic, F. Rudroff, B. Grötzl, Curr. Org. Chem. 2004, 8, 1057. [167] M. J. Lenn, C. J. Knowles, Enzmye Microb. Technol. 1994, 16, 964. [168] J. D. Stewart, Curr. Opin. Biotechnol. 2000, 11, 363. [169] S. Flitsch, G. Grogan, in Enzyme Catalysis in Organic Synthesis. A
Comprehensive Handbook, Vol. III (Eds.: K. Drauz, H. Waldmann), Weinheim: Wiley-VCH, 2002, pp. 1202
[170] M. D. Mihovilovic, G. Chen, S. Wang, B. Kyte, F. Rochon, M. M. Kayser, J. D. Stewart, J. Org. Chem. 2001, 66, 733.
[171] T. L. O'Loughlin, W. M. Patrick, I. Matsumura, Protein Eng. 2006, 19, 439. [172] T. Schneider, Dissertation, Ruhr-Universität Bochum 2004. [173] A. Cornish-Bowden, Nucl. Acids Res. 1985, 13, 3021. [174] A. D. Bosley, M. Ostermeier, Biomolecular Engineering 2005, 22, 57. [175] A. B. Watts, J. Beecher, C. S. Whitcher, J. A. Littlechild, Biocatal.
Biotransform. 2002, 20, 209. [176] M. Vendruscolo, A. Maritan, J. R. Banavar, Phys. Rev. Lett. 1997, 78, 3967. [177] E. Bornberg-Bauer, H. S. Chan, Proc. Natl. Acad. Sci. U.S.A. 1999, 96, 10689. [178] J. D. Bloom, S. T. Labthavikul, C. R. Otey, F. H. Arnold, Proc. Natl. Acad. Sci.
U.S.A. 2006, 103, 5869. [179] L. You, F. H. Arnold, Protein Eng. 1996, 9, 77. [180] M. D. Mihovilovic, R. Snajdrova, A. Winninger, F. Rudroff, Synlett 2005, 2751. [181] I. Matsumura, A. D. Ellington, J. Mol. Biol. 2001, 305, 331. [182] L. C. James, D. S. Tawfik, Trends Biochem. Sci. 2003, 28, 361. [183] S.-h. Pan, B. A. Malcolm, BioTechniques 2000, 29, 1234. [184] F. W. Studier, Protein Expr Purif. 2005, 41, 207–234. [185] F. Baneyx, Curr. Opin. Biotechnol. 1999, 10, 411. [186] S. Jana, J. K. Deb, Appl. Microbiol. Biotechnol. 2005, 67, 289. [187] S. C. Makrides, Microbiol. Rev. 1996, 60, 512. [188] F. W. Studier, J. Mol. Biol. 1991, 219, 37. [189] J. T. Moore, A. Uppal, F. Maley, G. F. Maley, Protein Expr. Purif. 1993, 4, 160. [190] N. Kagawa, Q. Cao, Arch. Biochem. Biophys. 2001, 393, 290. [191] S. Barth, M. Huhn, B. Matthey, A. Klimka, E. A. Galinski, A. Engert, Appl.
Environ. Microbiol. 2000, 66, 1572. [192] K. Nishihara, M. Kanemori, M. Kitagawa, H.Yanagi, T. Yura, Appl. Environ.
Microbiol. 1998, 64, 1694–1699. [193] D.-H. Lee, M.-D. Kim, W.-H. Lee, D.-H. Kweon, J.-H. Seo, Appl. Microbiol.
Biotechnol. 2004, 63, 549–552. [194] A. de Marco, V. de Marco, J. Biotechnol. 2004, 109, 45. [195] S. D. Doig, L. M. O’Sullivan, S. Patelb, J. M. Ward, J. M. Woodley, Enzyme
Microb. Technol. 2001, 28, 265. [196] G. S. Chaga, J. Biochem. Biophys. Methods 2001, 49, 313. [197] J. Porath, Protein Expr. Purif. 1992, 3, 263. [198] V. Gaberc-Porekar, V. Menart, J. Biochem. Biophys. Methods 2001, 49, 335. [199] A. P. Golovanov, G. M. Hautbergue, S. A. Wilson, L.-Y. Lian, J. Am. Chem.
Soc. 2004, 126, 8933. [200] E. Malito, A. Alfieri, M. W. Fraaije, A. Mattevi, Proc Natl Acad Sci U S A 2004,
101, 13157–13162.
References 209
[201] M. W. Fraaije, personal communication, 2004. [202] L. Holm, C. Sander, J. Mol. Biol. 1993, 233, 123. [203] N. M. Kamerbeek, M. W. Fraaije, D. B. Janssen, Eur. J. Biochem. 2004, 271,
2107. [204] W. J. Browne, A. C. T. North, D. C. Phillips, K. Brew, T. C. Vanaman, R. L.
Hill, J. Mol. Biol. 1969, 42, 65. [205] S. F. Altschul, W. Gish, W. Miller, E. W. Myers, D. J. Lipman, J. Mol. Biol.
1990, 215, 403. [206] O. Lund, M. Nielsen, C. Lundegaard, P. Worning, in Abstract at the CASP5
conferenceA102, 2002. [207] M. Bocola, personal communication, 2006. [208] D. E. T. Pazmino, G. de Gonzalo, G. Ottolina, G. Carrea, D. B. Janssen, M. W.
Fraaije, J. Biotechnol. 2005, 118, S129. [209] G. de Gonzalo, D. E. T. Pazmio, G. Ottolina, M. W. Fraaije, G. Carrea,
Tetrahedron: Asymmetry 2005, 16, 3077. [210] P. R. Gerber, K. Müller, J. Comput.-Aided Mol. Des. 1995, V9, 251. [211] P. R. Gerber, J. Comput.-Aided Mol. Des. 1998, V12, 37. [212] M. Bocola, N. Otte, K.-E. Jaeger, M. T. Reetz, W. Thiel, ChemBioChem 2004,
5, 214. [213] P. Pasta, G. Carrea, H. L. Holland, S. Dallavalle, Tetrahedron Asymmetry
1995, 6, 933. [214] S. Colonna, N. Gaggero, G. Carrea, P. Pasta, Tetrahedron Asymmetry 1996,
7, 565. [215] S. Colonna, S. D. Sordo, N. Gaggero, G. Carrea, P. Pasta, Heteroat. Chem.
2002, 13, 467. [216] F. Secundo, G. Carrea, S. Dallavalle, G. Francosi, Tetrahedron Asymmetry
1993, 4, 1981. [217] F. Zambianchi, P. Pasta, G. Carrea, S. Colonna, N. Gaggero, J. M. Woodley,
Biotechnol. Bioeng. 2002, 78, 489. [218] M. T. Reetz, F. Daligault, B. Brunner, H. Hinrichs, A. Deege, Angew. Chem.
2004, 116, 4170. [219] J. D. Bloom, C. O. Wilke, F. H. Arnold, C. Adami, Biophys. J. 2004, 86, 2758. [220] M. Mihovilovic, personal communication, 2006. [221] M. D. Mihovilovic, F. Rudroff, B. Grotzl, P. Stanetty, Eur. J. Org. Chem. 2005,
809. [222] S. Z. Wang, M. M. Kayser, V. Jurkauskas, J. Org. Chem. 2003, 68, 6222. [223] S. Z. Wang, M. M. Kayser, H. Iwaki, P. C. K. Lau, J. Mol. Catal. B 2003, 22,
211. [224] M. D. Mihovilovic, B. Muller, M. M. Kayser, P. Stanetty, Synlett 2002, 700. [225] K. M. Polizzi, M. Parikh, C. U. Spencer, I. Matsumura, J. H. Lee, M. J. Realff,
A. S. Bommarius, Biotechnol. Prog. 2006, 22, 961. [226] M. Bajpai, K. K. Adkison, Curr. Opin. Drug Discovery Dev. 2000, 3, 63. [227] M. D. Mihovilovic, B. Müller, M. M. Kayser, J. D. Stewart, J. Fröhlich, P.
Stanetty, H. Spreitzer, J. Mol. Catal. B: Enzym. 2001, 11, 349–353. [228] M. D. Mihovilovic, P. Kapitan, J. Rydz, F. Rudroff, F. H. Ogink, M. W. Fraaije,
J. Mol. Catal. B 2005, 32, 135. [229] M. D. Mihovilovic, P. Kapitan, Tetrahedron Lett. 2004, 45, 2751. [230] M. D. Mihovilovic, F. Rudroff, W. Kandioller, B. Grotzl, P. Stanetty, H.
Spreitzer, Synlett 2003, 1973. [231] M. D. Mihovilovic, B. Muller, A. Schulze, P. Stanetty, M. M. Kayser, Eur. J.
Org. Chem. 2003, 2243.
References 210
[232] M. D. Mihovilovic, B. Muller, M. M. Kayser, J. D. Stewart, P. Stanetty, Synlett 2002, 703.
[233] S. Wu, F. Schulz, F. Leca, unpublished work, 2006. [234] I. Hilker, M. C. Gutierrez, M. Alphand, R. Wohlgemuth, R. Furstoss, Org. Lett.
2004, 6, 1955. [235] I. Hilker, R. Wohlgemuth, V. Alphand, R. Furstoss, Biotechnol. Bioeng. 2005,
92, 702. [236] I. Hilker, V. Alphand, R. Wohlgemuth, R. Furstoss, Adv. Synth. Catal. 2004,
346, 203. [237] V. Alphand, G. Carrea, R. Wohlgemuth, R. Furstoss, J. M. Woodley, Trends
Biotechnol. 2003, 21, 318. [238] S. D. Doig, P. J. Avenell, P. A. Bird, P. Gallati, K. S. Lander, G. J. Lye, R.
Wohlgemuth, J. M. Woodley, Biotechnol. Prog. 2002, 18, 1039. [239] C. V. F. Baldwin, J. M. Woodley, Biotechnol. Bioeng. 2006, 95, 362. [240] A. Z. Walton, J. D. Stewart, Biotechnol. Prog. 2002, 18, 262. [241] Bettina M. Nestl, W. Kroutil, K. Faber, Adv. Synth. Catal. 2006, 348, 873. [242] M. T. Reetz, K. Schimossek, Chimia 1996, 50, 668. [243] P. Gadler, S. M. Glueck, W. Kroutil, B. M. Nestl, B. Larissegger-Schnell, B. T.
Ueberbacher, S. R. Wallner, K. Faber, Biochem. Soc. Trans. 2006, 34, 296. [244] K. Faber, Chemistry 2001, 7, 5004. [245] U. T. Strauss, U. Felfer, K. Faber, Tetrahedron-Asymmetry 1999, 10, 107. [246] R. Noyori, T. Ohkuma, Angew. Chem. Int. Ed. 2001, 40, 40. [247] O. Pamies, J. E. Bäckvall, Trends Biotechnol. 2004, 22, 130. [248] N. J. Turner, Curr. Opin. Chem. Biol. 2004, 8, 114. [249] J. Paetzold, J. E. Bäckvall, J. Am. Chem. Soc. 2005, 127, 17620. [250] N. Berezina, V. Alphand, R. Furstoss, Tetrahedron-Asymmetry 2002, 13,
1953. [251] M. C. Gutierrez, R. Furstoss, V. Alphand, Adv. Synth. Catal. 2005, 347, 1051. [252] J. M. Woodley, in Biotrans 2005, Delft, The Netherlands, 2005, p. 49. [253] G. R. Castro, C. GR, T. Knubovets, K. T, Crit Rev Biotechnol 2003, 23, 195. [254] C. Laane, S. Boeren, K. Vos, C. Veeger, Biotechnol. Bioeng. 1987, 30, 81. [255] A. Liese, in Technology Transfer in Biotechnology: from Lab to Industry to
Production, Vol. 92, Springer-Verlag Berlin, Berlin, 2005, pp. 197. [256] R. Wichmann, D. Vasic-Racki, in Technology Transfer in Biotechnology: From
Lab to Industry to Production, Vol. 92, 2005, pp. 225. [257] W. A. van der Donk, H. Zhao, Curr. Opin. Biotechnol. 2003, 14, 421. [258] F. Hollmann, K. Hofstetter, A. Schmid, Trends Biotechnol. 2006, 24, 163. [259] D. S. Burdette, C. Vieille, J. G. Zeikus, Biochem. J. 1996, 316, 115. [260] C. Zheng, V. T. Pham, R. S. Phillips, Bioorg. Med. Chem. Lett. 1992, 2, 619. [261] D. S. Burdette, V. Tchernajencko, J. G. Zeikus, Enzyme Microb. Technol.
2000, 27, 11. [262] C. Heiss, M. Laivenieks, J. G. Zeikus, R. S. Phillips, Bioorg. Med. Chem. 2001,
9, 1659. [263] C. Vieille, G. J. Zeikus, Microbiol. Mol. Biol. Rev. 2001, 65, 1. [264] A. E. Tripp, D. S. Burdette, J. G. Zeikus, R. S. Phillips, J. Am. Chem. Soc.
1998, 120, 5137. [265] K. Hofstetter, J. Lutz, I. Lang, B. Witholt, A. Schmid, Ang. Chem. Int. Ed. 2004,
43, 2163. [266] M. V. Filho, T. Stillger, M. Müller, A. Liese, C. Wandrey, Ang. Chem. Int. Ed.
2003, 42, 2993. [267] H. K. Chenault, G. M. Whitesides, Appl Biochem Biotechnol 1987, 14, 147.
References 211
[268] A. Willetts, C. Knowles, M. Levitt, S. Roberts, H. Sandey, N. Shipston, J Chem Soc Perkin Trans 1 1991, 1608
[269] S.-I. Murahashi, S. Ono, Y. Imada, Ang. Chem. Int. Ed. 2002, 41, 2366. [270] Y. Imada, H. Iida, S. Ono, Y. Masui, S. I. Murahashi, Chem.-Asian J. 2006, 1,
136. [271] W. Hummel, Trends Biotechnol. 1999, 17, 487. [272] H. Zhao, W. A. van der Donk, Curr. Opin. Biotechnol. 2003, 14, 583. [273] R. Ruinatscha, V. Höllrigl, K. Otto, A. Schmid, Adv. Synth. Catal. 2006, 348,
2015. [274] K. Seelbach, Tetrahedron Lett. 1997, 37, 1377. [275] S. Rissom, U. Schwarz-Linek, M. Vogel, V. I. Tishkov, U. Kragl, Tetrahedron:
Asymmetry 1997, 8, 2523. [276] H. Gröger, W. Hummel, S. Buchholz, K. Drauz, T. V. Nguyen, C. Rollmann, H.
Husken, K. Abokitse, Org. Lett. 2003, 5, 173. [277] R. Wichmann, C. Wandrey, A. F. Bückmann, M.-R. Kula, Biotechnol. Bioeng.
2000, 67, 791. [278] H. Schute, J. Flossdorf, H. Sahm, M. R. Kula, Eur J Biochem. 1976, 62, 151. [279] G. Ottolina, G. Carrea, S. Riva, A. Buckmann, Enzyme Microb Technol. 1990,
12, 596. [280] X. Zhinan, J. Keju, L. Ying, C. Peilin, J. Ind. Microbiol. Biotechnol. 2007, V34,
83. [281] X. Zhinan, L. Ying, F. Limei, J. Xiaoxia, J. Keju, C. Peilin, Appl. Microbiol.
Biotechnol. 2006, V70, 40. [282] T. Eguchi, Y. Kuge, K. Inoue, N. Yoshikawa, K. Mochida, T. Uwajima, Biosci
Biotechnol Biochem. 1992, 56, 701. [283] H. Slusarczyk, S. Felber, M.-R. Kula, M. Pohl, Eur. J. Biochem. 2000, 267,
1280. [284] F. Hollmann, A. Schmid, Biocatal. Biotransform. 2004, 22, 63 [285] D. Westerhausen, S. Herrmann, W. Hummel, E. Steckhan, Angew. Chem. Int.
Ed. 1992, 31, 1529. [286] H. C. Lo, O. Buriez, J. B. Kerr, R. H. Fish, Ang. Chem. Int. Ed. 1999, 38, 1429. [287] F. Hollmann, B. Witholt, A. Schmid, J. Mol. Catal. B: Enzym. 2002, 19-20, 167. [288] F. Hollmann, A. Schmid, E. Steckhan, Ang. Chem. Int. Ed. 2001, 40, 169. [289] Z. Jiang, C. Lu, H. Wu, Ind. Eng. Chem. Res. 2005, 44, 4165. [290] G. de Gonzalo, G. Ottolina, G. Carrea, M. W. Fraaije, Chem. Comm. 2005,
3724. [291] G. D. Nordblom, R. E. White, M. J. Coon, Arch. Biochem. Biophys. 1976, 175,
524. [292] E. G. Hrycay, J. A. Gustafsson, M. Ingelman-Sundberg, L. Ernster, Biochem.
Biophys. Res. Commun. 1975, 66, 209. [293] M. Sono, M. P. Roach, E. D. Coulter, J. H. Dawson, Chem. Rev. 1996, 96,
2841. [294] A. A. Linden, M. Johansson, N. Hermanns, J. E. Bäckvall, J. Org. Chem.
2006, 71, 3849. [295] A. A. Linden, L. Kruger, J. E. Bäckvall, J. Org. Chem. 2003, 68, 5890. [296] K. Bergstad, J. E. Bäckvall, J. Org. Chem. 1998, 63, 6650. [297] K. Bergstad, S. Y. Jonsson, J. E. Bäckvall, J. Am. Chem. Soc. 1999, 121,
10424. [298] H. C. Lo, R. H. Fish, Ang. Chem. Int. Ed. 2002, 41, 478. [299] A. Taglieber, projected PhD-thesis, Ruhr-Universität Bochum 2007. [300] W. R. Frisell, C. W. Chung, C. G. Mackenzie, J. Biol. Chem. 1959, 234, 1297.
References 212
[301] L. P. Vernon, Biochim. Biophys. Acta 1959, 36, 177. [302] V. Massey, G. Palmer, Biochemistry 1966, 5, 3181. [303] V. Massey, M. Stankovich, P. Hemmerich, Biochemistry 1978, 17, 1. [304] V. Massey, P. Hemmerich, W. R. Knappe, H. J. Duchstein, H. Fenner,
Biochemistry 1978, 17, 9. [305] V. Shumyantseva, T. Bulko, A. Zimin, V. Uvarov, A. Archakov, Biochem. Mol.
Biol. Int. 1996, 39, 503. [306] A. V. Hodgson, H. W. Strobel, Anal. Biochem. 1996, 243, 154. [307] F. Hollmann, K. Hofstetter, T. Habicher, B. Hauer, A. Schmid, J. Am. Chem.
Soc. 2005, 127, 6540. [308] C. H. Hamann, W. Vielstich, Elektrochemie 3rd ed., Wiley-VCH, 1998. [309] U. Schwaneberg, C. Schmidt-Dannert, J. Schmitt, R. D. Schmid, Anal.
Biochem. 1999, 269, 359. [310] J. H. Choi, S. J. Lee, S. J. Lee, S. Y. Lee, Appl. Environ. Microbiol. 2003, 69,
4737. [311] S. Y. Lee, Trends Biotechnol. 1996, 14, 98. [312] P. M. Jordan, Curr. Opin. Struct. Biol. 1994, 4, 902. [313] S. I. Woodard, H. A. Dailey, Arch. Biochem. Biophys. 1995, 316, 110. [314] E. Verderber, L. J. Lucast, J. A. Van Dehy, P. Cozart, J. B. Etter, E. A. Best, J.
Bacteriol. 1997, 179, 4583. [315] T. Omura, R. Sato, J. Biol. Chem. 1964, 239, 2370. [316] T. Omura, R. Sato, J. Biol. Chem. 1964, 239, 2379. [317] S. Pflug, S. M. Richter, V. B. Urlacher, J. Biotechnol. 2007, In Press,
Corrected Proof. [318] H. Ikeda, J. Ishikawa, A. Hanamoto, M. Shinose, H. Kikuchi, T. Shiba, Y.
Sakaki, M. Hattori, S. Omura, Nat. Biotechnol. 2003, 21, 526. [319] S. Omura, H. Ikeda, J. Ishikawa, A. Hanamoto, C. Takahashi, M. Shinose, Y.
Takahashi, H. Horikawa, H. Nakazawa, T. Osonoe, H. Kikuchi, T. Shiba, Y. Sakaki, M. Hattori, Proc. Natl. Acad. Sci. U.S.A. 2001, 98, 12215.
[320] N. Saitou, M. Nei, Mol. Biol. Evol. 1987, 4, 406. [321] D. C. Lamb, H. Ikeda, D. R. Nelson, J. Ishikawa, T. Skaug, C. Jackson, S.
Omura, M. R. Waterman, S. L. Kelly, Biochem. Biophys. Res. Commun. 2003, 307, 610.
[322] L. L. Hansen, J. Justesen, in PCR Primer, 2nd ed. (Eds.: C. W. Dieffenbach, G. S. Dveksler), Cold Spring Harbor Laboratory Press, 2003, pp. 53.
[323] R. Vazquez, M. L. Steinberg, BioTechniques 1999, 26, 91. [324] K. Kusano, M. R. Waterman, M. Sakaguchi, T. Omura, N. Kagawa, Arch.
Biochem. Biophys. 1999, 367, 129. [325] R. Quaderer, S. Omura, H. Ikeda, D. E. Cane, J. Am. Chem. Soc. 2006, 128,
13036. [326] R. Quaderer, (Ed.: F. Schulz), 2006. [327] H. A. Hussain, J. M. Ward, Enzyme Microb. Technol. 2003, 32, 790. [328] H. A. Hussain, J. M. Ward, Appl. Environ. Microb. 2003, 69, 373. [329] H. Ogura, C. R. Nishida, U. R. Hoch, R. Perera, J. H. Dawson, P. R. Ortiz de
Montellano, Biochemistry 2004, 43, 14712. [330] T. W. Yu, L. Bai, D. Clade, D. Hoffmann, S. Toelzer, K. Q. Trinh, J. Xu, S. J.
Moss, E. Leistner, H. G. Floss, Proc. Natl. Acad. Sci. USA 2002, 99, 7968. [331] P. Spiteller, L. Bai, G. Shang, B. J. Carroll, T. W. Yu, H. G. Floss, J. Am.
Chem. Soc. 2003, 125, 14236.
References 213
[332] M. Mergeay, S. Monchy, T. Vallaeys, V. Auquier, A. Benotmane, P. Bertin, S. Taghavi, J. Dunn, D. van der Lelie, R. Wattiez, FEMS Microbiology Reviews 2003, 27, 385.
[333] D. H. Nies, FEMS Microbiology Reviews 2003, 27, 313. [334] T. W. B. Ost, C. S. Miles, J. Murdoch, Y.-F. Cheung, G. A. Reid, S. K.
Chapman, A. W. Munro, FEBS Letters 2000, 486, 173. [335] M. Landwehr, L. Hochrein, C. R. Otey, A. Kasrayan, J. E. Backvall, F. H.
Arnold, J. Am. Chem. Soc. 2006, 128, 6058. [336] M. A. Noble, C. S. Miles, S. K. Chapman, D. A. Lysek, A. C. MacKay, G. A.
Reid, R. P. Hanzlik, A. W. Munro, Biochem. J. 1999, 339, 371. [337] M. G. Joyce, H. M. Girvan, A. W. Munro, D. Leys, J. Biol. Chem. 2004, 279,
23287. [338] M. W. Peters, P. Meinhold, A. Glieder, F. H. Arnold, J. Am. Chem. Soc. 2003,
125, 13442. [339] M. Breuer, M. Pohl, B. Hauer, B. Lingen, Analytical and Bioanalytical
Chemistry 2002, V374, 1069. [340] C. Ash, J. A. E. Farrow, S. Wallbanks, M. D. Collins, Lett. Appl. Microbiol.
1991, 13, 202. [341] D. J. Studholme, R. A. Jackson, D. J. Leak, FEMS Microbiol. Lett. 1999, 172,
85. [342] T. N. Nazina, T. P. Tourova, A. B. Poltaraus, E. V. Novikova, A. A. Grigoryan,
A. E. Ivanova, A. M. Lysenko, V. V. Petrunyaka, G. A. Osipov, S. S. Belyaev, M. V. Ivanov, Int. J. Syst. Evol. Microbiol. 2001, 51, 433.
[343] L. M. Guzman, D. Belin, M. J. Carson, J. Beckwith, J. Bacteriol. 1995, 177, 4121.
[344] K. J. Breslauer, R. Frank, H. Blocker, L. A. Marky, Proc. Natl. Acad. Sci. U.S.A. 1986, 83, 3746.
[345] J. Altenbuchner, J. Cullum, Mol. Gen. Genet. 1984, 66, 134. [346] H. C. Birnboim, Methods Enzymol. 1983, 100, 243. [347] T. A. Brown, Gentechnologie für Einsteiger, 3rd ed., Spektrum Akademischer
Verlag, 2002. [348] D. Hanahan, J. Mol. Biol. 1983, 166, 557.
CHMOwt (475) CANIAEMTLFPK----AQSWIFGANIPGKKNTVYFYLGGLKEYRSALANC BAA24454-STMO (491) CRNRAEASLLNS----ANSWYLGANIPGRPRVFMPFLGGFGVYREIITEV AAG01289-CHMO1 (478) TIRGAESTVMSIEGPKAGAWFIGGNIPGKSREYQVYMGGGQVYQDWCREA AAG01290-CHMO2 (491) VDDIFVNSLFPK----AKSWYWGANVPGKPAQMLNYSEASPHI------- CAD10798-CPMO (493) IADFWDSSLFPR----AKSWYQGSNIPGKKVESLNFPLGLPTYISKFNES AAL14233-CDMO (543) LLDHGRPLGNPE-CTPGYYNNEGKPAELKDRLNVGYPAGSAAFFRMMDHW P12015-CHMO3 (475) CANIAEMTLFPK----AQSWIFGANIPGKKNTVYFYLGGLKEYRTCASNC Consensus (551) V DIAE TLFPK A SWY GANIPGK R L YLGG YR E 601 637 PAMO (532) AAKGYEGFVLTKLGPEQKLISEEDLNSAVDHHHHHH- CHMOwt (521) KNHAYEGFDIQLQRSDIKQPANA-------------- BAA24454-STMO (537) AESGYKGFAILEG------------------------ AAG01289-CHMO1 (528) EESDYATFLNADSIDGEKVRESAGMK----------- AAG01290-CHMO2 (530) ------------------------------------- CAD10798-CPMO (539) AEKGYAGFSLAS------------------------- AAL14233-CDMO (592) LAAGSFDGLTFR------------------------- P12015-CHMO3 (521) KNHAYEGFDIQLQRSDIKQPANA-------------- Consensus (601) GY GF I K
1.2 P450 BM3-like Alignments
1.2.1 BM3, SA, RM, and AP (Amino Acid Sequences) 1 50 BM3 (1) -------MTIKEMPQPKTFGELKNLPLLNTDKPVQALMKIADELGE---I SA (1) -MTTQPETDLRPIRSPRGVPLFGHTPQIPSTNPVEYFGKLSKQFPEG--L AP (1) -----MVATGTRIPGPKPLPLVGNLLDVLTSDLDTDVDFLDRCHREHGGI RM (1) MSTATPAAALEPIPRDPGWPIFGNLFQITPGEVGQHLLARSRHHDG---I Consensus (1) T P ATLKPIP PKGVPLFGNLPQI TSDPVQHLLKLSR H E I 51 100 BM3 (41) FKFEAPGRVTRYLSSQRLIKEACDESRFDKNLS-QALKFVRDFAGDGLFT SA (48) YGMEIAGIEQVFVWDPDLVAEVCDETRFFKQIDKTPLAHVRDYAGAGLFT AP (46) VALTFAGQRQVFASSHELVARMCSDPSWGKAVH-PALEQVRDFAGDGLFT RM (48) FELDFAGKRVPFVSSVALASELCDATRFRKIIG-PPLSYLRDMAGDGLFT Consensus (51) FALEFAGKRQVFVSS DLVAELCDETRF KNI PPLAHVRDFAGDGLFT 101 150 BM3 (90) SWTHEKNWKKAHNILLPSFSQQAMKGYHAMMVDIAVQLVQKWERLNADEH SA (98) AHQHEEEWGMAHRVLLPVFSQRAMKGYFGQMLEIAQNLVGKWERK-EGQP AP (95) ARGDEPNWGKAHRLLMPAFGPTAMRDHFPAMLDIAEQMLVRWRRFGPDHR RM (97) AHSDEPNWGCAHRILMPAFSQRAMKAYFDVMLRVANRLVDKWDRQGPDAD Consensus (101) AHSHEPNWGKAHRILLPAFSQRAMKGYFAMMLDIANQLV KWER GPD 151 200 BM3 (140) IEVPEDMTRLTLDTIGLCGFNYRFNSFYRDQPHPFITSMVRALDEAMNKL SA (147) VNITDDYTRLTLDTIALSGFGYRFDSFAKEDLHPFLNALLQALVESLRRS AP (145) IDVADDMTRLTLDTIALCAFGARFNSFYRDRAHPFVDAMVRSLVEAGERA RM (147) IAVADDMTRLTLDTIALAGFGYDFASFASDELDPFVMAMVGALGEAMQKL Consensus (151) IDVADDMTRLTLDTIALCGFGYRFNSFYRDDLHPFV AMVRALVEAMNKL 201 250 BM3 (190) QRANPDDPAYDENKRQFQEDIKVMNDLVDKIIADRKAS--GEQSDDLLTH SA (197) QELPVMTKMRKADDKKYRENIRLMRDLVENVIKERREGK-GTGEDDLLGL AP (195) ERLPGVQPFLVGRNQRYRDDIATMNRIADGIVAARAALPAGERPDDLLER RM (197) TRLPIQDRFMGRAHRQAAEDIAYMRNLVDDVIRQRRVSP--TSGMDLLNL Consensus (201) QRLPIMDPFL A RQYREDIALMRDLVD IIADRRASP GT DDLL L 251 300 BM3 (238) MLNGKDPETGEPLDDENIRYQIITFLIAGHETTSGLLSFALYFLVKNPHV SA (246) MLEATDPETGKGLDDDNVRDQVVTFLIAGHETTSGLLSFATYSLMRNPHI AP (245) MLTCADPVTGERLSARNVRYQLATFLIAGHETTSGLLSFAVHRLLAHPEV RM (245) MLEARDPETDRRLDDANIRNQVITFLIAGHETTSGLLTFALYELLRNPGV Consensus (251) MLEAKDPETGERLDDDNIRYQVITFLIAGHETTSGLLSFALY LLRNPHV
Supporting Information 217
301 350 BM3 (288) LQKAAEEAARVLV-DPVPSYKQVKQLKYVGMVLNEALRLWPTAPAFSLYA SA (296) LAQAYAEVDRLLPGDTVPDYDTIMQMDVIPRILEETLRLWAPIPMIGKSP AP (295) LRKAKDAVDGVLG-DRVPAFEDLARLDYLGQVLRETLRLHPTAPAFALAP RM (295) LAQAYAEVDTVLPGDALPVYADLARMPVLDRVLKETLRLWPTAPAFAVAP Consensus (301) LAQAYAEVDRVLPGD VPAYDDLARLDYLGRVLKETLRLWPTAPAFALAP 351 400 BM3 (337) KEDTVLGGEYPLEKGDELMVLIPQLHRDKTIWG-DDVEEFRPERFENPSA SA (346) LEDTVIGGCYGLKKGARVNILEGPLHTHPKAWERPEEFDINRWLPENRVN AP (344) DEPAELGGHA-IGAGEPVLVMLPTLHRDPAVWRDPDVFDPERFAPERMDE RM (345) FDDVVLGGRYRLRKDRRISVVLTALHRDPKVWANPERFDIDRFLPENEAK Consensus (351) EDTVLGG Y LKKGDRVLVLLP LHRDPKVWA PDVFDIDRFLPEN A 401 450 BM3 (386) IPQHAFKPFGNGQRACIGQQFALHEATLVLGMMLKHFDFEDHT-NYELDI SA (396) HHPHAYKPFGNGVRACIGRQFALTEARLALALVLQKFKFADTD-DYKMDV AP (393) IPACAWMPFGHGARACIGRPFALQEATLVLALVLQRFDLALADPDHRLTI RM (395) LPAHAYMPFGQGERACIGRQFALTEAKLALALMLRNFAFQDPH-DYQFRL Consensus (401) IPAHAYMPFGNG RACIGRQFALTEATLVLALMLQKFDFAD D DYKLDI 451 500 BM3 (435) KETLTLKPEGFVVKAKSKKIPLGGIPSPSTEQSAKKVRKKAENAHNTPLL SA (445) KEALTRKPGGFELNVRARQEHERTVFGAADLQTDDTQAQAAVSGVGVNLT AP (443) KQTLTLKPDSLVVRARPRADRPGAT---ATVETVVPHQVPATHRHGTPLH RM (444) KETLTIKPDQFVLRVRRRRPHERFV-TRQASQAVADAAQTDVRGHGQAMT Consensus (451) KETLTLKPDGFVLRVRARKDHERAV S ATLQTV AQ AV GHGTPLT 501 550 BM3 (485) VLYGSNMGTAEGTARDLADIAMSKGFAPQVATLDSHAGNLPREGAVLIVT SA (495) VAYGSSLGSCEDLARTIADRGERSGFGTTLVGLDELGDNLPTEGLLVVVA AP (490) VFYGSNGGSGEGLARTIAGDGAARGWATSVAPLDDAVRALPASGPVVIVS RM (493) VLCASSLGTARELAEQIHAGAIAAGFDAKLADLDDAVGVLPTSGLVVVVA Consensus (501) VLYGSSLGSAEGLARTIAD AIARGFATSLA LDDAVGNLPTSGLVVIVA 551 600 BM3 (535) ASYNGHPPDNAKQFVDWLDQAS-ADEVKGVRYSVFGCGDKNWATTYQKVP SA (545) SSYNGKAPDNAQRFDDLLAAGLPEGSLSNVRFALLGAGNTQWVATYQGFP AP (540) SSYNGAPPDNAAHFVRWLTQDG--PDLSGVDYLVLGCGNLDWSATYQRVP RM (543) ATYNGRAPDSARKFEAMLDADDASGYRANGMRLALLGCGNSQWATYQAFP Consensus (551) ASYNGKPPDNAKKFVDWLDQD AGDLSNVRYLVLGCGN NWAATYQKVP 601 650 BM3 (584) AFIDETLAAKGAENIADRGEADASDDFEGTYEEWREHMWSDVAAYFNLDI SA (595) KRIEAGLLAAGATRVIERGIADAAGDFDGMATRWMDTLWTTLAEEYAADT AP (588) TLIDEAMAAAGARRLRERGATDARADFFGDWERWYEPLWPLLSAECGVEV RM (593) RRVFDFFITAGAVPLLPRGEADGNGDFDQAAERWLAQLWQALQADGAGTG Consensus (601) KRIDEALAAAGA RLIERGEADAAGDFDG AERWLE LWS LAAEFALDI 651 700 BM3 (634) ENSEDNKSTLSLQFVDSAADMPLAKMHGAFSTNVVASKELQQPGS----- SA (645) --SETTGPRFEVQLLTEAEVRPAIVSEQAYPLTVVANEELVSDATGLWDF AP (638) --------GEIGPRFRVVESDAADGLGDLASAVVLENRELVRGPD----- RM (643) ------GLGVDVQVRSMAAIRAETLPAGTQAFTVLSNDELVGDPSGLWDF Consensus (651) SE G GLDVQLLSMAEIRPA LLAGAFS TVLANKELV DPSGLWDF 701 750 BM3 (679) -----ARSTRHLEIELPKEASYQEGDHLGVIPRNYEGIVNRVTARFGLDA SA (693) SIEPPRPAAKSITIELPDGVTYDTGNHLAVFAKNEPVLVNRALARLGVDR AP (675) -----AGSKRHLELRLPDGTSYRTGDYLSVLPQNHPDLVRRAVARLGTRA RM (687) SIEAPRTSTRDIRLQLPPGITYRTGDHIAVWPQNDAQLVSELCERLDLDP Consensus (701) SIE PR STRHIEIELPDGISYRTGDHLAVLPQNHP LVNRALARLGLDA 751 800 BM3 (724) SQQIRLEAEEEKLAHLPLAKTVS-VEELLQYVELQDPVTRTQLRAMAAKT SA (743) DQVLRLDQPGGGRTHLPVGTPVTTGLLFTEFVELQDVATRSQIQELAEHT AP (720) ERVVTVES-SAPTGLVPVGRALRVDELLTRCVDLSAPAGAGVVARLAERC RM (737) DAQATISAPHGMGRGLPIDQALPVRQLLTHFIELQDVVSRQTLRALAQAT Consensus (751) DQVITLEAP G AHLPVGKALSV ELLT FVELQDVVTRSQLRALAEKT 801 850 BM3 (773) VCPPHKVELEALLEK-----QAYKEQVLAKRLTMLELLEKYPACEMKFSE
Supporting Information 218
SA (793) QCPWTRPQLQAYTADTAEAEERYQKEILGKRVSVLNLLERFPAVELPLAV AP (769) PCPPERAELAATTGA--------------T---LLELLERFPSCAVDLAL RM (787) RCPFTKQSIEQLASD--DAEHGYATKVVARRLGILDVLVEHPAIALTLQE Consensus (801) CPPTK ELEALTAD DAE AY VLAKRLSILELLERFPACEL LAE 851 900 BM3 (818) FIALLPSIRPRYYSISSSPRVDEKQASITVSVVSGEAWSGYGEYKGIASN SA (843) FLEMMGPIRPRFYSISSSPLANPRHVRLTVGLLEGPALSGDGRYRGTCSS AP (802) ALELLPAPRTRLYSISSAAEEQRAEVALTVSVTG------------VTSG RM (835) LLACTVPMRPRLYSIASSPLVSPDVATLLVGTVCAPALSGRGQFRGVAST Consensus (851) FLELLPPIRPRLYSISSSPLVNPK VSLTVSVV GPALSG G YRGVASS 901 950 BM3 (868) YLAELQEGDTITCFISTPQSEFTLPKDPETPLIMVGPGTGVAPFRGFVQA SA (893) YIAGLESGDVFYGYVRVPSPTFAPPADPATPLLLIGPGTGIAPLRGFLEE AP (840) YLSRVRPGDRVAVGIASPPESFRPPADNTVPVVLIAAGTGIAPFRGFLRA RM (885) WLQHLPPGARVSASIRTPNPPFAPDPDPAAPMLLIGPGTGIAPFRGFLEE Consensus (901) YLA L PGDRVSAFIRTPNPSFAPPADPATPLLLIGPGTGIAPFRGFLEE 951 1000 BM3 (918) RKQLKEQGQSLGEAHLYFGCRSPHEDYLYQEELENAQSEGIITLHTAFSR SA (943) RAHQHAHGTQVGLSQVFVGCRHPEHDYFYRQEMQDWEQAGIAQVHTAFSA AP (890) RAAL---GGEPGPALLLFGCRGPELDDLYAEEFAALGD--WLEVDRAYSR RM (935) RALRKMAGNAVTPAQLYFGCRHPQHDWLYREDIERWAGQGVVEVHPAYSV Consensus (951) RA LK GNAVGPAQLYFGCRHPEHDYLYREEIE WA GIIEVHTAFSR 1001 1050 BM3 (968) MPNQPKTYVQHVMEQDGKKLIELLDQGAHFYICGDGSQMAPAVEATLMKS SA (993) VTGHPARFVQDAIVGAADTVWQAIQDGAYVYVCGDGRRMAPAVREALAAI AP (935) HPDGEVRHVQHRLWQRRDRVRELVDAGARVYLCGDATRVGPAVEEVLGRI RM (985) VPDAP-RYVQDLLWQRREQVWAQVRDGATIYVCGDGRRMAPAVRQTLIEI Consensus (1001) VPDAP RYVQHLLWQRRDKVWELVDDGAHVYVCGDGRRMAPAVRETLIKI 1051 1082 BM3 (1018) YADVHQVSEADARLWLQQLEEKGRYAKDVWAG SA (1043) YRKHTGSDDEAAQQWLAQLEADERYQQDVFA- AP (985) GPGAG---------WLDALRAGGRYATDVF-- RM (1034) GMAQGGMTDKAASDWFGGLVAQGRYRQDVFN- Consensus (1051) Y A GGMSD AA WLAQLEA GRYAQDVFA
1.2.2 BM3-likes from Bacilli (DNA-Sequences) 1 50 B. anthracis (1) ATGGATAAAAAAGTATCTGCCATTCCTCAACCGAAAACATATGGACCGCT B. cereus (1) ATGGAAAAAAAAGTATCTGCCATTCCTCAGCCGAAAACATATGGACCGCT B. subtilis 1 (1) ATGAAGGAAACA--AGCC-CGATTCCTCAGCCGAAGACGTTTGGGCCGCT B. subtilis 2 (1) ATGAAACAGGCA--AGCG-CAATACCTCAGCCCAAAACATACGGACCTTT BM3 (1) ATGACAATTAAA------GAAATGCCTCAGCCAAAAACGTTTGGAGAGCT Consensus (1) ATGAAAAAAAAA A C GC ATTCCTCAGCCGAAAACATATGGACCGCT 51 100 B. anthracis (51) GGGGAATCTCCCATTAATCGATAAAGATAAACCGACTCTATCGTTTATTA B. cereus (51) GGGTAATCTCCCATTAATCGATAAAGATAAACCGACCCTATCCTTTATCA B. subtilis 1 (48) CGGCAATTTGCCTTTAATTGATAAAGACAAACCGACGCTTTCGCTGATCA B. subtilis 2 (48) AAAAAATCTTCCGCATCTGGAAAAAGAACAGCTTTCTCAATCCTTATGGC BM3 (45) TAAAAATTTACCGTTATTAAACACAGATAAACCGGTTCAAGCTTTGATGA Consensus (51) GG AATCT CC TTAAT GATAAAGATAAACCGACTCTATC TT AT A 101 150 B. anthracis (101) AGCTGGCGGAAGAGTATGGTCCCATTTTTCGGATGCAAACTTTAAGTGAT B. cereus (101) AGATAGCGGAAGAGTATGGTCCCATTTTTCAAATTCAAACTTTAAGTGAT B. subtilis 1 (98) AACTGGCGGAAGAACAGGGCCCGATTTTTCAAATCCATACACCCGCGGGC B. subtilis 2 (98) GGATAGCTGATGAATTGGGACCGATTTTCCGTTTTGATTTTCCGGGAGTA BM3 (95) AAATTGCGGATGAATTAGGAGAAATCTTTAAATTCGAGGCGCCTGGTCGT Consensus (101) AGAT GCGGAAGAATA GG CC ATTTTTCAAAT CA ACTCC GGTG T 151 200 B. anthracis (151) ACCATCATTGTCGTTTCTGGACATGAACTGGTAGCAGAAGTCTGTGACGA B. cereus (151) ACCATCATTGTCGTTTCTGGACATGAATTGGTAGCGGAAGTCTGTGACGA
Supporting Information 219
B. subtilis 1 (148) ACGACCATTGTAGTGTCCGGCCATGAATTGGTGAAAGAGGTTTGTGATGA B. subtilis 2 (148) TCCAGTGTTTTTGTGTCCGGCCACAATCTTGTGGCTGAAGTGTGTGATGA BM3 (145) GTAACGCGCTACTTATCAAGTCAGCGTCTAATTAAAGAAGCATGCGATGA Consensus (151) ACCA CATTGTCGT TC GG CATGAACTGGT GCAGAAGT TGTGATGA 201 250 B. anthracis (201) AACACGGTTCGATAAAAGTATAGAGGGTGCTTTAGCAAAGGTTCGTGCTT B. cereus (201) AACACGGTTCGATAAAAGTATAGAGGGTGCTTTAGCAAAAGTTCGTGCCT B. subtilis 1 (198) AGAACGGTTTGATAAAAGCATTGAAGGCGCCTTGGAAAAGGTTCGCGCAT B. subtilis 2 (198) AAAACGCTTTGACAAGAACCTTGGCAAAGGCTTGCAAAAGGTGCGTGAGT BM3 (195) ATCACGCTTTGATAAAAACTTAAGTCAAGCGCTTAAATTTGTACGTGATT Consensus (201) AACACGGTTTGATAAAAGCATAGA GG GC TT GAAAAGGTTCGTGC T 251 300 B. anthracis (251) TTGCTGGAGATGGATTATTTACAAGCGAGACTCAAGAGCCTAACTGGCAA B. cereus (251) TTGCTGGGGACGGATTATTTACTAGCGAGACTCACGAGCCTAACTGGAAA B. subtilis 1 (248) TTTCCGGTGACGGATTGTTTACGAGCTGGACGCATGAGCCTAACTGGAGA B. subtilis 2 (248) TCGGGGGAGATGGCTTATTTACAAGCTGGACGCACGAACCGAACTGGCAA BM3 (245) TTGCAGGAGACGGGTTATTTACAAGCTGGACGCATGAAAAAAATTGGAAA Consensus (251) TTGC GGAGACGGATTATTTACAAGCTGGACGCA GAGCCTAACTGGAAA 301 350 B. anthracis (301) AAAGCTCATAATATTTTGATGCCTACATTCAGCCAAAGAGCAATGAAAGA B. cereus (301) AAAGCTCATAATATTTTGATGCCTACATTCAGCCAACGGGCAATGAAAGA B. subtilis 1 (298) AAAGCGCACAACATTCTGATGCCGACGTTCAGCCAGCGGGCCATGAAGGA B. subtilis 2 (298) AAAGCCCACCGCATTTTGCTGCCGAGTTTTAGTCAAAAAGCGATGAAAGG BM3 (295) AAAGCGCATAATATCTTACTTCCAAGCTTCAGTCAGCAGGCAATGAAAGG Consensus (301) AAAGC CATAATATTTTGATGCC AC TTCAGCCAACGGGCAATGAAAGA 351 400 B. anthracis (351) TTACCATGCTATGATGGTCGATATTGCCGTACAACTCGTTCAAAAATGGG B. cereus (351) TTACCATGCCATGATGGTCGATATTGCTGTACAACTCGTTCAAAAATGGG B. subtilis 1 (348) CTATCATGAGAAAATGGTCGATATCGCTGTTCAGCTCATTCAAAAATGGG B. subtilis 2 (348) CTATCATTCTATGATGCTGGATATCGCAACCCAGCTGATTCAAAAGTGGA BM3 (345) CTATCATGCGATGATGGTCGATATCGCCGTGCAGCTTGTTCAAAAGTGGG Consensus (351) CTATCATGC ATGATGGTCGATATCGC GT CAGCTCGTTCAAAAATGGG 401 450 B. anthracis (401) CAAGACTGAATCCGAATGAAAACGTAGATGTTCCGGAAGATATGACTCGC B. cereus (401) CACGGCTTAATCCGAATGAAAACGTAGATGTTCCGGAGGATATGACACGT B. subtilis 1 (398) CAAGGCTCAACCCGAATGAAGCAGTCGATGTCCCGGGAGATATGACCCGG B. subtilis 2 (398) GCCGGTTAAACCCTAATGAAGAAATTGATGTAGCGGACGATATGACACGT BM3 (395) AGCGTCTAAATGCAGATGAGCATATTGAAGTACCGGAAGACATGACACGT Consensus (401) CACGGCT AATCCGAATGAA A GT GATGT CCGGAAGATATGACACGT 451 500 B. anthracis (451) CTTACATTAGATACAATTGGTCTATGTGGTTTTAATTATCGATTTAATAG B. cereus (451) CTTACGTTAGATACAATTGGTCTATGTGGTTTTAATTACCGATTCAATAG B. subtilis 1 (448) CTGACGCTCGACACCATTGGGCTATGCGGGTTTAACTACCGCTTTAACAG B. subtilis 2 (448) CTGACGCTTGATACGATTGGGTTATGCGGGTTTAACTATCGATTCAACAG BM3 (445) TTAACGCTTGATACAATTGGTCTTTGCGGCTTTAACTATCGCTTTAACAG Consensus (451) CT ACGCT GATACAATTGGTCTATGCGG TTTAACTATCGATTTAACAG 501 550 B. anthracis (501) CTTTTATCGTGAGACCCCTCATCCTTTTATTACTAGTATGACCCGTGCGT B. cereus (501) CTTTTATCGTGAGACACCTCATCCTTTTATTACTAGCATGACCCGTGCTC B. subtilis 1 (498) TTACTACAGAGAAACGCCCCACCCGTTTATCAACAGCATGGTGCGGGCGC B. subtilis 2 (498) CTTTTACCGTGATTCACAGCATCCGTTTATCACCAGTATGCTCCGTGCCT BM3 (495) CTTTTACCGAGATCAGCCTCATCCATTTATTACAAGTATGGTCCGTGCAC Consensus (501) CTTTTACCGTGA AC CCTCATCC TTTATTAC AGTATG TCCGTGC C 551 600 B. anthracis (551) TAGATGAGGCGATGCACCAATTACAGCGGCTGGATATAGAAGACA-AACT B. cereus (551) TAGATGAGGCGATGCACCAATTGCAGCGGCTGGATATAGAAGACA-AACT B. subtilis 1 (548) TTGATGAAGCGATGCATCAAATGCAGCGGCTTGATGTTCAAGATA-AGCT B. subtilis 2 (548) TAAAAGAGGCGATGAATCAATCGAAAAGACTGGGCCTGCAAGATA-AAAT BM3 (545) TGGATGAAGCAATGAACAAGCTGCAGCGAGCAAATCCAGACGACCCAGCT Consensus (551) TAGATGAGGCGATGCACCAATTGCAGCGGCTGGAT TAGAAGACA AACT 601 650 B. anthracis (600) CATGTGGAGAACGAAACGTCAATTTCAGCATGATATTCAATCTATGTTTT
Supporting Information 220
B. cereus (600) TATGTGGAGAACGAAACGTCAATTTCAGCATGATATCCAATCTATGTTTT B. subtilis 1 (597) TATGGTCAGAACAAAGCGGCAATTCCGCTATGATATTCAAACGATGTTTT B. subtilis 2 (597) GATGGTGAAAACGAAGCTGCAGTTCCAAAAGGATATAGAAGTCATGAACT BM3 (595) TATGATGAAAAC-AAGCGCCAGTTTCAAGAAGATATCAAGGTGATGAACG Consensus (601) TATG TGAGAACGAAGCG CAATTTCA ATGATAT CAA C ATGTTTT 651 700 B. anthracis (650) CATTAGTAGATAATATTATTGCTGAACGTAAAAGTAGTGAAAATCAGGAA B. cereus (650) CTTTAGTAGATAATATTATTGCTGAACGTAAAAGTAGTGGAGATCAGGAA B. subtilis 1 (647) CGTTAGTCGACAGCATTATTGCAGAGCGCAGGGCGAATGGAGACCAGGAT B. subtilis 2 (647) CCCTGGTTGATAGAATGATAGCGGAGCGAAAGGCGAATCCGGATGAAAAC BM3 (644) ACCTAGTAGATAAAATTATTGCAGATCGCAAAGCAAGCGGTGAACAAAGC Consensus (651) C TTAGTAGATAA ATTATTGC GA CG AAAGC AGTGGAGATCAGGA 701 750 B. anthracis (700) GAAAATGATTTGCTTTCCCGTATGTTAAATGTGCAGGATCCAGAAACTGG B. cereus (700) GAAAATGATTTACTTTCCCGTATGTTAAATGTGCCAGATCCGGAAACTGG B. subtilis 1 (697) GAAAAAGATTTGCTCGCCCGCATGCTGAATGTGGAAGATCCGGAAACTGG B. subtilis 2 (697) ATTAAGGATCTCTTGTCTCTCATGCTTTATGCCAAAGATCCAGTAACGGG BM3 (694) G---ATGATTTATTAACGCATATGCTAAACGGAAAAGATCCAGAAACGGG Consensus (701) GAAAATGATTT CT TCCCGTATGCTAAATGTG AAGATCCAGAAACTGG 751 800 B. anthracis (750) TGAAAAATTAGATGATGAAAATATTCGTTTCCAAATTATTACCTTTTTAA B. cereus (750) TGAAAAATTAGATGATGAAAACATTCGTTTCCAAATTATTACTTTTTTAA B. subtilis 1 (747) TGAAAAGCTCGACGACGAAAATATCCGCTTTCAGATCATCACGTTTTTGA B. subtilis 2 (747) TGAAACGCTGGATGACGAAAACATTCGATACCAAATCATCACATTTTTAA BM3 (741) TGAGCCGCTTGATGACGAGAACATTCGCTATCAAATTATTACATTCTTAA Consensus (751) TGAAAAGCT GATGACGAAAACATTCG TTCCAAATTATTAC TTTTTAA 801 850 B. anthracis (800) TAGCTGGGCATGAGACAACAAGTGGATTGTTATCTTTTGCAATCTATTTT B. cereus (800) TAGCTGGACATGAGACAACAAGTGGATTGTTATCTTTTGCAATTTACTTC B. subtilis 1 (797) TTGCCGGCCATGAAACAACGAGCGGCCTGCTTTCCTTTGCGACTTACTTT B. subtilis 2 (797) TTGCTGGACATGAGACAACAAGCGGGTTGCTATCCTTTGCGATTTATTGT BM3 (791) TTGCGGGACACGAAACAACAAGTGGTCTTTTATCATTTGCGCTGTATTTC Consensus (801) TTGCTGGACATGAGACAACAAGTGG TTGTTATC TTTGCGATTTATTTT 851 900 B. anthracis (850) TTATTAAAGAATCCGGATAAATTGAAAAAAGCCTATGAAGAAGTAGATCG B. cereus (850) TTATTAAAGAATCCGGATAAATTGAAAAAAGCCTATGAAGAAGTAGACCG B. subtilis 1 (847) TTATTGAAGCATCCTGACAAACTGAAAAAGGCGTATGAAGAGGTCGATCG B. subtilis 2 (847) CTGCTTACACATCCGGAAAAACTGAAAAAAGCTCAGGAGGAAGCGGATCG BM3 (841) TTAGTGAAAAATCCACATGTATTACAAAAAGCAGCAGAAGAAGCAGCACG Consensus (851) TTATT AAGAATCCGGATAAATTGAAAAAAGC TATGAAGAAGTAGATCG 901 950 B. anthracis (900) GGTTTTGACAGATTCTACTCCAACATACCAACAAGTTATGAAATTAAAGT B. cereus (900) TGTTTTGACAGATCCTACTCCAACATACCAACAAGTTATGAAACTGAAGT B. subtilis 1 (897) GGTGCTGACGGATGCAGCGCCGACCTATAAACAAGTGCTGGAGCTTACAT B. subtilis 2 (897) CGTGTTAACGGATGACACGCCTGAATATAAACAAATCCAGCAGCTCAAAT BM3 (891) AGTTCTAGTAGATCCTGTTCCAAGCTACAAACAAGTCAAACAGCTTAAAT Consensus (901) GTTTTGACAGAT CTACTCCAACATACAAACAAGT ATG AGCT AAAT 951 1000 B. anthracis (950) ATATACGGATGATTTTAAATGAATCACTACGTCTATGGCCTACTGCTCCA B. cereus (950) ATATGCGGATGATTTTAAATGAATCGCTACGTCTATGGCCTACCGCTCCA B. subtilis 1 (947) ACATACGGATGATTTTAAATGAATCACTGCGCTTATGGCCGACAGCTCCG B. subtilis 2 (947) ACATTCGGATGGTTTTAAATGAAACCCTCAGACTGTATCCAACAGCTCCG BM3 (941) ATGTCGGCATGGTCTTAAACGAAGCGCTGCGCTTATGGCCAACTGCTCCT Consensus (951) ATAT CGGATGATTTTAAATGAATC CT CG CTATGGCC AC GCTCC 1001 1050 B. anthracis (1000) GCATTTAGTCTCTATGCAAAAGAAGATACAGTAATTGGTGGAAAATACCC B. cereus (1000) GCATTCAGTCTTTATGCAAAAGAAGATACAGTGATTGGCGGGAAATACCC B. subtilis 1 (997) GCTTTCAGCCTTTATCCAAAAGAAGACACAGTCATTGGCGGAAAATTTCC B. subtilis 2 (997) GCTTTTTCTCTATATGCGAAGGAGGATACTGTTCTAGGCGGGGAATATCC BM3 (991) GCGTTTTCCCTATATGCAAAAGAAGATACGGTGCTTGGAGGAGAATATCC Consensus (1001) GC TTTAGTCT TATGCAAAAGAAGATACAGT ATTGGCGGAAAATATCC 1051 1100
Supporting Information 221
B. anthracis (1050) AATTAAGAAAGGCGAA-GATCGTATTTCTGTTCTGATTCCACAGCTACAT B. cereus (1050) AATTAAGAAAGGAGAA-GATCGTATTTCTGTTCTTATTCCACAGCTACAT B. subtilis 1 (1047) GATCACGA----CGAATGACAGAATTTCTGTGCTGATTCCGCAGCTTCAT B. subtilis 2 (1047) GATCAGCAAAG-GGCA-GCCAG--TCACTGTTTTAATTCCAAAACTGCAC BM3 (1041) TTTAGAAAAAGGCGAC-GAACTAATG---GTTCTGATTCCTCAGCTTCAC Consensus (1051) AT AAGAAAGGCGAA GA CG ATTTCTGTTCTGATTCCACAGCT CAT 1101 1150 B. anthracis (1099) AGGGATAAAGACGCGTGGGGAGACAATGTGGAAGAATTTCAACCTGAACG B. cereus (1099) AGGGATAAAGATGCATGGGGAGACAATGTGGAAGAATTCCAACCTGAACG B. subtilis 1 (1093) CGTGATCGAGACGCTTGGGGAAAGGACGCAGAAGAATTCCGGCCGGAACG B. subtilis 2 (1093) CGGGATCAAAACGCTTGGGGACCGGATGCGGAAGATTTCCGTCCGGAACG BM3 (1087) CGTGATAAAACAATTTGGGGAGACGATGTGGAAGAGTTCCGTCCAGAGCG Consensus (1101) CGGGATAAAGACGCTTGGGGAGACGATGTGGAAGAATTCCG CC GAACG 1151 1200 B. anthracis (1149) ATTTGAAGAGCTGGATAAGGTTCCTCATCATGCTTATAAGCCATTTGGAA B. cereus (1149) ATTTGAAGAGCTGGATAAGGTTCCTCATCATGCTTATAAGCCATTTGGAA B. subtilis 1 (1143) GTTTGAGCATCAGGACCAAGTGCCTCATCATGCGTACAAACCATTCGGAA B. subtilis 2 (1143) GTTTGAGGATCCTTCAAGTATCCCTCACCATGCGTATAAGCCGTTTGGAA BM3 (1137) TTTTGAAAATCCAAGTGCGATTCCGCAGCATGCGTTTAAACCGTTTGGAA Consensus (1151) TTTGAAGATC GGATAAGGTTCCTCATCATGCGTATAAGCCATTTGGAA 1201 1250 B. anthracis (1199) ATGGTCAGCGAGCATGTATCGGTATGCAGTTTGCACTTCATGAAGCAACA B. cereus (1199) ATGGCCAGAGAGCATGTATCGGTATGCAATTTGCACTTCATGAAGCCACT B. subtilis 1 (1193) ATGGACAACGGGCCTGTATCGGCATGCAGTTTGCCCTTCATGAAGCCACA B. subtilis 2 (1193) ACGGACAGCGCGCTTGTATTGGCATGCAGTTTGCTCTTCAAGAAGCGACA BM3 (1187) ACGGTCAGCGTGCGTGTATCGGTCAGCAGTTCGCTCTTCATGAAGCAACG Consensus (1201) ATGG CAGCG GC TGTATCGGTATGCAGTTTGC CTTCATGAAGC ACA 1251 1300 B. anthracis (1249) CTCGTGATGGGAATGCTTCTTCAACATTTTGAATTCATCGATTATGAAGA B. cereus (1249) CTTGTAATGGGAATGCTTCTTCAACATTTTGAATTAATCGATTATCAAAA B. subtilis 1 (1243) CTTGTGTTAGGCATGATTCTAAAATATTTCACATTGATTGATCATGAGAA B. subtilis 2 (1243) ATGGTTCTCGGTCTTGTATTAAAGCATTTTGAATTGATAAACCATACTGG BM3 (1237) CTGGTACTTGGTATGATGCTAAAACACTTTGACTTTGAAGATCATACAAA Consensus (1251) CT GT T GG ATG TTCTAAAACATTTTGAATT AT GATCAT AAAA 1301 1350 B. anthracis (1299) ATATCAGCTGGACGTAAAACAAACATTAACGCTAAAGCCTGGTGATTTTA B. cereus (1299) CTATCAGCTGGACGTAAAACAAACATTAACGCTAAAGCCCGGTGATTTTA B. subtilis 1 (1293) TTATGAGCTTGATATCAAACAAACCTTAACACTTAAGCCGGGCGATTTTC B. subtilis 2 (1293) CTACGAACTAAAAATCAAAGAAGCATTAACGATCAAGCCGGATGATTTTA BM3 (1287) CTACGAGCTGGATATTAAAGAAACTTTAACGTTAAAACCTGAAGGCTTTG Consensus (1301) CTATGAGCTGGA AT AAACAAACATTAACGCTAAAGCC GGTGATTTTA 1351 1400 B. anthracis (1349) AAATTAGGATTGTACCCCGAAATCAAACTATTAGCCATACTACTGTTCTT B. cereus (1349) AGATTAGGATTCTACCCCGAAAACAAACTATTAGTCATCCTACTGTTCTT B. subtilis 1 (1343) ACATCAGTGTTCAAAGCCGTCATCAGGAAGCCATTCATGCAGACGTCCAG B. subtilis 2 (1343) AAATTACTGTGAAACCGCGAAAAACAGCGGCAATCAAT------GTACAG BM3 (1337) TGGTAAAAGCAAAATCGAAAAAAATTCCGCTTGGCGGT--A----TTCCT Consensus (1351) A ATTAG GTT AACCCCGAAAACAA C TTAGCCAT C GTTC T 1401 1450 B. anthracis (1399) GCGCCTACAGAGGAGAAACTAAAAAACCATGAAATTAAGCAGCAAGTTCA B. cereus (1399) GCACCTACAGAGGACAAGCTGAAAAACGATGAAATTAAGCAACATGTCCA B. subtilis 1 (1393) GCAGCTGAAAAAGCCGCGCCTGATGAGCA--AAAGGAGAAAACGGAAGCA B. subtilis 2 (1387) ------AGAAAAGAACAGGCAGA----CATCAAAGCA-GAAACAAAGCCA BM3 (1381) TCACCTAGCACTGAACAGTCTGCT----AAAAAAGTACGCAA-AAAGGCA Consensus (1401) GCACCTA AAA GA AGCC GA A CAT AAAGTA GCAACAAA CA 1451 1500 B. anthracis (1449) GAAAACTCCTTCCATTATTGGAGCCGATAATCTTTCACTTCTTGTTCTGT B. cereus (1449) GAAGACACCTTCTATTATTGGGGCCGATAATCTTTCACTTCTTGTTCTGT B. subtilis 1 (1441) -AAGGGTGCATCGGTCATCGGTCTTAACAACCGCCCGCTTCTCGTGCTGT B. subtilis 2 (1426) AAAGAAACCAAACCTAAACACGGCACAC-------CTTTACTTGTTCTTT BM3 (1426) GAAAACGC---TCATAATA-----CG--------CCGCTGCTTGTGCTAT Consensus (1451) GAAGAC CC TCCAT AT GG GCCGA AA C C CTTCTTGTTCTGT
Supporting Information 222
1501 1550 B. anthracis (1499) ATGGCTCAGATACAGGGGTAGCAGAAGGTATTGCAAGAGAACTAGCAGAT B. cereus (1499) ATGGCTCGGATACAGGTGTAGCAGAAGGTATTGCAAGAGAATTAGCAGAT B. subtilis 1 (1490) ACGGCTCAGATACCGGCACCGCAGAAGGCGTCGCCCGGGAGCTTGCTGAT B. subtilis 2 (1469) TTGGTTCAAATCTTGGGACAGCTGAGGGAATAGCCGGTGAACTGGCTGCT BM3 (1460) ACGGTTCAAATATGGGAACAGCTGAAGGAACGGCGCGTGATTTAGCAGAT Consensus (1501) ATGGCTCAGATAC GG ACAGCAGAAGG AT GC G GAACTAGCAGAT 1551 1600 B. anthracis (1549) ACAGCTAGTTTAGAAGGTGTTCAAACGGAAGTGGCAGCTCTTAACGATCG B. cereus (1549) ACAGCTAGTTTAGAAGGAGTTCAAACGGAAGTGGTAGCTCTTAACGATCG B. subtilis 1 (1540) ACTGCCAGTCTTCACGGCGTAAGGACAAAGACAGCACCTCTGAACGACCG B. subtilis 2 (1519) CAAGGCCGCCAGATGGGCTTTACAGCTGAAACGGCTCCGCTTGATGATTA BM3 (1510) ATTGCAATGAGCAAAGGATTTGCACCGCAGGTCGCAACGCTTGATTCACA Consensus (1551) ACAGC AGT T AAGG GTT AACGGAAGTGGCA CTCTTAACGATCG 1601 1650 B. anthracis (1599) AATTGGAAGTTTGCCAAAAGAAGGAGCGGTTCTTATTGTAACTTCTTCTT B. cereus (1599) AATTGGAAGTTTGCCAAAAGAAGGAGCGGTACTTATTGTGACTTCTTCTT B. subtilis 1 (1590) GATTGGAAAGCTGCCGAAAGAGGGAGCGGTTGTCATTGTGACCTCGTCTT B. subtilis 2 (1569) TATCGGCAAGCTCCCTGAAGAAGGGGCAGTCGTCATTGTAACGGCTTCTT BM3 (1560) CGCCGGAAATCTTCCGCGCGAAGGAGCTGTATTAATTGTAACGGCGTCTT Consensus (1601) ATTGGAAATCTGCC AAAGAAGGAGCGGT T ATTGTAAC TCTTCTT 1651 1700 B. anthracis (1649) ATAATGGAAAGCCGCCAAGTAATGCAGGGCAGTTTGTGCAGTGGCTGGAG B. cereus (1649) ATAATGGAAAACCGCCAAGTAATGCAGGGCAGTTTGTGCAATGGTTGGAG B. subtilis 1 (1640) ATAATGGAAAGCCGCCAAGCAATGCCGGACAATTCGTGCAGTGGCTTCAA B. subtilis 2 (1619) ATAATGGGGCGCCGCCTGATAATGCTGCCGGATTTGTAGAGTGGCTGAAA BM3 (1610) ATAACGGTCATCCGCCTGATAACGCAAAGCAATTTGTCGACTGGTTAGAC Consensus (1651) ATAATGGAAAGCCGCCAAGTAATGCAGGGCAATTTGTGCAGTGGCTGGA 1701 1750 B. anthracis (1699) GAATTAAAAGGGGATGAGCTAAAAGGTGTTCAATACGCAGTTTTTGGTTG B. cereus (1699) GAACTAAAACCAGATGAGCTAAAAGGGGTTCAATACGCAGTTTTTGGTTG B. subtilis 1 (1690) GAAATCAAACCGGGTGAGCTTGAGGGCGTCCATTACGCGGTATTTGGCTG B. subtilis 2 (1669) GAGCTTGAGGAAGGCCAATTGAAAGGTGTTTCCTATGCGGTATTCGGCTG BM3 (1660) CAAGCGTCTGCTGATGAAGTAAAAGGCGTTCGCTACTCCGTATTTGGATG Consensus (1701) GAA T AAAGC GATGAGCTAAAAGG GTTCA TACGC GTATTTGG TG 1751 1800 B. anthracis (1749) TGGAGACCATAATTGGGCTAGTACCTATCAGCGAATTCCAAGATACATTG B. cereus (1749) TGGAGATCATAATTGGGCTAGTACCTACCAACGGATTCCAAGATACATTG B. subtilis 1 (1740) CGGCGACCACAACTGGGCGAGCACGTATCAATACGTGCCGAGATTCATTG B. subtilis 2 (1719) CGGAAACCGGAGCTGGGCCAGCACGTATCAGCGGATTCCCCGCCTGATTG BM3 (1710) CGGCGATAAAAACTGGGCTACTACGTATCAAAAAGTGCCTGCTTTTATCG Consensus (1751) CGGAGACCA AACTGGGCTAGTACGTATCAACG ATTCC AGATTCATTG 1801 1850 B. anthracis (1799) ATGAGCAAATGGCGCAAAAAGGAGCAACAAGATTTTCTACACGTGGAGAA B. cereus (1799) ATGAGCAAATGGCTCAAAAAGGAGCAACAAGATTTTCTAAACGCGGAGAA B. subtilis 1 (1790) ATGAGCAGCTTGCGGAGAAAGGCGCGACTCGGTTTTCTGCGCGCGGGGAA B. subtilis 2 (1769) ATGACATGATGAAAGCAAAGGGGGCATCGCGTTTAACAGCGATTGGGGAA BM3 (1760) ATGAAACGCTTGCCGCTAAAGGGGCAGAAAACATCGCTGACCGCGGTGAA Consensus (1801) ATGAGCAGATGGC GAAAAAGG GCAACAAG TTTTCTGC CGCGG GAA 1851 1900 B. anthracis (1849) GCGGATGCAAGTGGTGATTTCGAGGAACAGCTCGAGCAATGGAAACAAAG B. cereus (1849) GCAGATGCAAGTGGTGATTTCGAGGAACAGCTTGAGCAATGGAAACAAAA B. subtilis 1 (1840) GGGGATGTGAGCGGTGATTTTGAAGGGCAGCTTGACGAGTGGAAAAAAAG B. subtilis 2 (1819) GGTGACGCCGCCGATGATTTTGAAAGCCACCGCGAGTCTTGGGAAAACCG BM3 (1810) GCAGATGCAAGCGACGACTTTGAAGGCACATATGAAGAATGGCGTGAACA Consensus (1851) GC GATGCAAGCGGTGATTTTGAAGG CAGCTTGAG AATGGAAA AAAG 1901 1950 B. anthracis (1899) AATGTGGTCTGATGCGATGAAGGTATTTGGATTGGAACTTAACAAAAACA B. cereus (1899) CATGTGGTCTGATGCGATGAAGGCATTTGGATTGGAGCTCAACAAAAATA B. subtilis 1 (1890) CATGTGGGCGGATGCCATCAAAGCATTCGGACTTGAGCTTAATGAAAACG B. subtilis 2 (1869) CTTCTGGAAGGAAACGATGGACGCATTTG------ATATTAACGAAATAG BM3 (1860) TATGTGGAGTGACGTAGCAGCCTACTTTAACCTCGACATTGAAAACAGTG
Supporting Information 223
Consensus (1901) CATGTGG CTGATGCGATGAA GCATTTGGA T GA CTTAACAAAAA G 1951 2000 B. anthracis (1949) TGGAGAAAGAACGCAG---TACATTAAGTTTACAATTTGTCAGTCGTCTT B. cereus (1949) TGGAAAAAGAGCGCAG---TACTTTGAGTCTGCAATTTGTCAGTCGTCTT B. subtilis 1 (1940) CTGATAAGGAACGAAG---CACGCTGAGCCTTCAGTTTGTCAGAGGGCTG B. subtilis 2 (1913) CCCAGAAAGAAGACAGGCCTTCATTATCGATTACTTTTCTCAGTGAAGCG BM3 (1910) AAGATAATAAAT-C-----TACTCTTTCACTTCAATTTGTCGACAGCGCC Consensus (1951) GA AAAGAACGCAG TAC TT AG CTTCAATTTGTCAGT G CT 2001 2050 B. anthracis (1996) GGAGGATCTCCTCTTGCGCGAACATATGAAGCAGTTTATGCATCTATACT B. cereus (1996) GGAGGATCTCCTCTTGCACGAACATATGAAGCAGTTTATGCATCTATACT B. subtilis 1 (1987) GGCGAGTCTCCGCTCGCTAGATCGTACGAAGCCTCTCACGCATCCATTGC B. subtilis 2 (1963) ACGGAAACGCCGGTTGCTAAAGCATATGGCGCGTTTGAAGGGATTGTGTT BM3 (1954) GCGGATATGCCGCTTGCGAAAATGCACGGTGCGTTTTCAACGAACGTCGT Consensus (2001) GG GAATCTCCGCTTGC AGAACATATGAAGC TTTTA GCATCTAT T 2051 2100 B. anthracis (2046) AGAAAATCGTGAACTTCAATCATCTAGCAGTGAAAGAAGCACGCGACATA B. cereus (2046) AGAAAATCGTGAACTTCAATCATCCAGCAGTGATAGAAGTACACGACATA B. subtilis 1 (2037) CGAAAATCGTGAACTCCAGTCCGCAGACAGCGATCGAAGCACTCGCCATA B. subtilis 2 (2013) AGAGAATCGAGAACTCCAGACAGCTGCCAGCACGCGTTCAACCCGCCATA BM3 (2004) AGCAAGCAAAGAACTTCAACAGCCAGGCAGTGCACGAAGCACGCGACATC Consensus (2051) AGAAAATCGTGAACTTCAATCA C GGCAGTGA CGAAGCAC CGACATA 2101 2150 B. anthracis (2096) TTGAAATATCTTTGCCAGAAGGCGCTACATATAAAGAAGGAGACCATCTT B. cereus (2096) TCGAGGTATCTTTGCCAGAAGGCGCTACATATAAAGAAGGAGATCACCTT B. subtilis 1 (2087) TCGAAATTGCATTGCCGCCGGATGTTGAATATCAAGAGGGCGACCATCTT B. subtilis 2 (2063) TTGAATTGGAAATTCCGGCTGGTAAAACATATAAAGAAGGCGATCATATC BM3 (2054) TTGAAATTGAACTTCCAAAAGAAGCTTCTTATCAAGAAGGAGATCATTTA Consensus (2101) TTGAAAT GCATTGCCAGAAGG GCTACATATAAAGAAGGAGATCATCTT 2151 2200 B. anthracis (2146) GGGGTACTGCCAATTAATAGCGAGAAAAATGTCAACCGAATTTTAAAACG B. cereus (2146) GGAGTGTTGCCAGTTAATAGCGAGAAAAATATCAACCGAATTTTAAAACG B. subtilis 1 (2137) GGCGTATTGCCAAAAAACAGCCAAACCAATGTCAGCCGGATTCTTCACAG B. subtilis 2 (2113) GGAATCCTGCCAAAGAACAGCAGGGAGCTTGTTCAGCGGGTTCTCAGCCG BM3 (2104) GGTGTTATTCCTCGCAACTATGAAGGAATAGTAAACCGTGTAACAGCAAG Consensus (2151) GG GT TGCCAA AACAGCGAGAAAAATGTCAACCG ATT TAAAACG 2201 2250 B. anthracis (2196) CTTTGGATTAAACGGGAAGGATCAAGTCATACTGAGTGCAAGTGGACGAA B. cereus (2196) TTTTGGATTAAATGGGAAGGATCAAGTTATACTGAGTGCAAGTGGACGAA B. subtilis 1 (2187) ATTCGGTCTGAAGGGAACCGACCAAGTGACATTGTCGGCAAGCGGCCGCA B. subtilis 2 (2163) ATTCGGTTTGCAGTCCAATCATGTGATAAAAGTAAGCGGAAGCGCTCA-- BM3 (2154) GTTCGGCCTAGATGCATCACAGCAAATCCGTCTGGAAGCAGAAGAAGAAA Consensus (2201) TTCGG TTAAA GG AA GATCAAGT A ACTGAG GCAAG GGACGAA 2251 2300 B. anthracis (2246) GTGTAAATCACATACCTTTAGACAGTCCTGTTCGTTTATATGACCTTCTT B. cereus (2246) GTATAAATCACATACCTTTAGACAGTCCTGTTAGTTTATTGGCCCTTCTT B. subtilis 1 (2237) GTGCGGGGCATCTGCCATTGGGCCGTCCTGTCAGCCTGCATGATCTTCTC B. subtilis 2 (2211) -TATGGCTCATCTGCCGATGGATCGGCCAATCAAAGTAGTGGATTTATTG BM3 (2204) AATTAGCTCATTTGCCACTCGCTAAAACAGTATCCGTAGAAGAGCTTCTG Consensus (2251) GT TAG TCAT TGCC TT GACAGTCCTGT AG TA A GA CTTCT 2301 2350 B. anthracis (2296) AGTTATAGTGTTGAAGTGCAAGAAGCAGCCACTCGAGCACAAATACGAGA B. cereus (2296) AGTTATAGTGTTGAAGTTCAAGAAGCTGCCACTCGAGCACAAATACGAGA B. subtilis 1 (2287) AGCTACAGCGTCGAGGTGCAGGAAGCAGCCACAAGAGCGCAAATACGTGA B. subtilis 2 (2260) TCGTCCTATGTAGAGCTGCAGGAACCGGCATCAAGGCTTCAGCTTCGGGA BM3 (2254) CAATAC---GTGGAGCTTCAAGATCCTGTTACGCGCACGCAGCTTCGCGC Consensus (2301) AG TACAGTGT GAGGTGCAAGAAGC GCCAC CGAGC CAAATACG GA 2351 2400 B. anthracis (2346) AATGGTGACATTCACAGCATGCCCTCCTCATAAAAAGGAATTGGAATCAT B. cereus (2346) AATGGTAACATTCACAGCATGTCCTCCTCATAAAAAAGAATTGGAAGCAT B. subtilis 1 (2337) ACTGGCGTCATTTACAGTGTGTCCGCCGCATAGGCGCGAATTAGAAGAAC B. subtilis 2 (2310) GCTGGCCTCTTATACAGTTTGTCCGCCGCATCAAAAAGAGCTGGAACAGC
Supporting Information 224
BM3 (2301) AATGGCTGCTAAAACGGTCTGCCCGCCGCATAAAGTAGAGCTTGAAGCCT Consensus (2351) AATGGC CATT ACAGT TGTCCGCCGCATAAAAAAGAATTGGAAGCAT 2401 2450 B. anthracis (2396) TA---TTGGAAGACGGAGTTTATCAAGAACAAATATTAAAGAAACGTATT B. cereus (2396) TA---TTAGAAGAAGGAGTTTATCATGAACAAATATTAAAGAAACGGATT B. subtilis 1 (2387) TG---TCAGCAGAGGGTGTTTATCAGGAGCAAATATTGAAAAAACGAATT B. subtilis 2 (2360) TCGTTTCAGATGATGGCATTTACAAAGAGCAGGTACTTGCAAAACGTCTT BM3 (2351) TG---CTTGAAAAGCAAGCCTACAAAGAACAAGTGCTGGCAAAACGTTTA Consensus (2401) T TTAGAAGA GGAGTTTATCAAGAACAAATATT AAAAAACGTATT 2451 2500 B. anthracis (2443) TCAATGTTGGATCTTCTTGAAAAGTATGAGGCTTGTGAAATTCGATTTGA B. cereus (2443) TCAATGTTGGACCTTCTTGAAAAGTATGAGGCTTGTGAAATCCGATTTGA B. subtilis 1 (2434) TCCATGCTGGATCTGCTTGAAAAGTATGAAGCGTGTGACATGCCGTTTGA B. subtilis 2 (2410) ACCATGCTTGATTTTTTAGAGGATTATCCTGCTTGCGAAATGCCGTTTGA BM3 (2398) ACAATGCTTGAACTGCTTGAAAAATACCCGGCGTGTGAAATGAAATTCAG Consensus (2451) TCAATGCTGGATCTTCTTGAAAAGTATGAGGCTTGTGAAATGC ATTTGA 2501 2550 B. anthracis (2493) ACCCTTTTTAGAACTTCTTCCTGCGCTCAAACCGCGTTACTATTCAATTT B. cereus (2493) ACGCTTTTTAGAACTTCTTCCTGCGCTCAAACCGCGTTACTATTCTATTT B. subtilis 1 (2484) ACGATTTTTAGAGCTTTTACGGCCGTTAAAACCGAGATACTATTCGATTT B. subtilis 2 (2460) ACGGTTTTTAGCACTTTTGCCATCACTAAAACCGAGATACTATTCCATTT BM3 (2448) CGAATTTATCGCCCTTCTGCCAAGCATACGCCCGCGCTATTACTCGATTT Consensus (2501) ACG TTTTTAGAACTTCT CC CGCTAAAACCGCG TACTATTC ATTT 2551 2600 B. anthracis (2543) CAAGCTCTCCACTCGTTGCACAGGATCGTCTGAGCATTACGGTTGGTGTT B. cereus (2543) CAAGCTCTCCACTCGTTGCACACAATCGTCTGAGCATTACGGTCGGTGTT B. subtilis 1 (2534) CAAGCTCTCCAAGAGTGAATCCGCGGCAAGCATCGATCACAGTCGGTGTC B. subtilis 2 (2510) CAAGCTCACCGAAAGTTCATGCAAATATCGTGAGCATGACGGTAGGAGTT BM3 (2498) CTTCATCACCTCGTGTCGATGAAAAACAAGCAAGCATCACGGTCAGCGTT Consensus (2551) CAAGCTCTCCAC GTTGATCA AATC GTGAGCAT ACGGTCGGTGTT 2601 2650 B. anthracis (2593) GTGAATGCGCCTGCATGGAGCGGGGAAGGGACATATGAAGGAGTCGCTTC B. cereus (2593) GTTAATGCGCCTGCATGGAGTGGGGAAGGGACATATGAAGGAGTCGCTTC B. subtilis 1 (2584) GTGCGCGGCCCGGCGTGGAGCGGCCGTGGCGAATACAGGGGTGTGGCATC B. subtilis 2 (2560) GTGAAAGCCTCAGCATGGAGCGGCCGAGGTGAATACCGGGGTGTCGCCTC BM3 (2548) GTCTCAGGAGAAGCGTGGAGCGGATATGGAGAATATAAAGGAATTGCGTC Consensus (2601) GTGAA GC CC GCATGGAGCGG AAGG GAATAT AAGGAGTCGC TC 2651 2700 B. anthracis (2643) TAATTATTTAGCTCAGCGTCATAATAAAGATGAGATTATCTGTTTCATTC B. cereus (2643) TAATTACTTAGCTCAGCGTCATAATAAAGATGAGATTATCTGTTTCATTC B. subtilis 1 (2634) AAATGATTTAGCTGAGCGTCAAGCCGGTGATGATGTCGTGATGTTTATCC B. subtilis 2 (2610) TAATTATTTAGCAGAATTGAATACAGGTGATGCAGCAGCTTGCTTCATTC BM3 (2598) GAACTATCTTGCCGAGCTGCAAGAAGGAGATACGATTACGTGCTTTATTT Consensus (2651) TAATTATTTAGCTGAGCGTCATAA GGAGATGAGATTAT TG TTCATTC 2701 2750 B. anthracis (2693) GAACGCCACAATCAAACTTTCAATTACCTGAAAATCCAGAAACACCAATT B. cereus (2693) GAACGCCACAATCAAACTTTGAATTACCTAAAGATCCAGAAACACCAATT B. subtilis 1 (2684) GCACACCGGAATCCCGGTTTCAGCTTCCGAAAGACCCTGAAACGCCAATT B. subtilis 2 (2660) GTACGCCGCAGTCCGGATTTCAGATGCCGAATGATCCTGAAACGCCTATG BM3 (2648) CCACACCGCAGTCAGAATTTACGCTGCCAAAAGACCCTGAAACGCCGCTT Consensus (2701) G ACGCCGCAATCA A TTTCAG T CC AAAGATCCTGAAACGCCAATT 2751 2800 B. anthracis (2743) ATTATGGTTGGACCAGGCACTGGAATTGCACCATTCCGTGGATTTTTACA B. cereus (2743) ATTATGGTTGGGCCAGGTACTGGAATTGCACCATTCCGTGGATTCTTGCA B. subtilis 1 (2734) ATTATGGTCGGGCCAGGCACGGGAGTCGCGCCATTTCGCGGTTTCCTTCA B. subtilis 2 (2710) ATTATGGTCGGGCCGGGCACAGGAATTGCGCCATTCAGAGGCTTTATTCA BM3 (2698) ATCATGGTCGGACCGGGAACAGGCGTCGCGCCGTTTAGAGGCTTTGTGCA Consensus (2751) ATTATGGTCGGGCCAGGCAC GGAATTGCGCCATTCCG GG TTT T CA 2801 2850 B. anthracis (2793) AGCACGACGTGTTCAAAAGCAAAAAGGTATGAACGTAGGAGAAGCACATC B. cereus (2793) AGCGCGTCGTGTTCAAAAGCAAAAAGGTATGAACTTAGGACAAGCGCATC B. subtilis 1 (2784) AGCCCGCGATGTTTTAAAGCGGGAGGGCAAAACGCTCGGTGAGGCTCATC
Supporting Information 225
B. subtilis 2 (2760) GGCAAGATCGGTTTTGAAGAAGGAAGGAAGCACCCTTGGTGAAGCACTTT BM3 (2748) GGCGCGCAAACAGCTAAAAGAACAAGGACAGTCACTTGGAGAAGCACATT Consensus (2801) AGC CG TGTTCTAAAGCAA AAGG A GACCCT GGAGAAGCACATC 2851 2900 B. anthracis (2843) TATACTTTGGTTGTCGTCATCCTGAAAAGGATTATCTTTATCGTACAGAA B. cereus (2843) TATATTTTGGTTGTCGTCATCCTGAAAAAGATTATCTCTATCGTACAGAA B. subtilis 1 (2834) TCTATTTTGGATGCAGGAAC---GATCGGGATTTTATTTACCGAGATGAG B. subtilis 2 (2810) TATACTTCGGCTGCCGCCGCCCGGACCATGACGACCTTTACAGAGAAGAG BM3 (2798) TATACTTCGGCTGCCGTTCACCTCATGAAGACTATCTGTATCAAGAAGAG Consensus (2851) TATACTTTGG TGCCGTCA CCTGA A GATTATCTTTATCGAGAAGAG 2901 2950 B. anthracis (2893) CTAGAGAATGATGAAAGAGATGGATTAATCTCTTTACACACAGCTTTTTC B. cereus (2893) TTAGAAAATGATGAAAGAGATGGATTAATCTCTTTACACACAGCTTTTTC B. subtilis 1 (2881) CTTGAGCGGTTTGAAAAAGACGGAATCGTCACTGTCCACACAGCCTTTTC B. subtilis 2 (2860) CTGGATCAAGCGGAACAGGACGGTTTGGTCACAATCCGCCGATGCTACTC BM3 (2848) CTTGAAAACGCCCAAAGCGAAGGCATCATTACGCTTCATACCGCTTTTTC Consensus (2901) CT GA AA G TGAAAGAGA GGATT ATCACT T CACACAGCTTTTTC 2951 3000 B. anthracis (2943) TCGCTTAGAAGGACAAGCTAAAACATATGTACAGCATGTAATAAAAGAAG B. cereus (2943) TCGTCTAGAGGGACATCCAAAAACATATGTACAGCATTTGATAAAACAAG B. subtilis 1 (2931) CCGAAAAGAGGGCATGCCGAAAACATATGTCCAGCATCTCATGGCTGACC B. subtilis 2 (2910) GCGCGTCGAAAACGAACCAAAAGGATATGTCCAGCACTTGCTCAAGCAAG BM3 (2898) TCGCATGCCAAATCAGCCGAAAACATACGTTCAGCACGTAATGGAACAAG Consensus (2951) TCGC TAGAAGG CA CC AAAACATATGT CAGCAT T AT AAACAAG 3001 3050 B. anthracis (2993) ATAGAATCCATTTAATTTCGTTATTAGATAATGGAGCTCATCTTTACATA B. cereus (2993) ATAGAATCAATTTAATTTCGTTATTAGATAATGGAGCTCATCTTTATATA B. subtilis 1 (2981) AAGCAGATACATTAATATCAATCCTTGACCGCGGTGGCAGGCTTTATGTA B. subtilis 2 (2960) ATACGCAGAAATTGATGACACTCATTGAAAAAGGGGCTCATATTTACGTA BM3 (2948) ACGGCAAGAAATTGATTGAACTTCTTGATCAAGGAGCGCACTTCTATATT Consensus (3001) ATAGAAA AAATTAATTTCA T TTGATAA GGAGCTCATCTTTATATA 3051 3100 B. anthracis (3043) TGTGGTGATGGAAGTAAAATGGCTCCTGACGTAGAAGATACCCTTTGTCA B. cereus (3043) TGTGGTGATGGAAGTAAAATGGCTCCGGATGTAGAAGATACCCTTTGTCA B. subtilis 1 (3031) TGCGGTGATGGCAGCAAAATGGCCCCGGATGTGGAGGCGGCACTTCAAAA B. subtilis 2 (3010) TGCGGTGATGGATCGCAAATGGCTCCTGATGTAGAGAGAACTTTGCGATT BM3 (2998) TGCGGAGACGGAAGCCAAATGGCACCTGCCGTTGAAGCAACGCTTATGAA Consensus (3051) TGCGGTGATGGAAG AAAATGGCTCCTGATGTAGAAG AC CTT G A 3101 3150 B. anthracis (3093) AGCATATCAAGAAATTCATGAAGTCAGTGAACAAGAAGCAAGGAATTGGT B. cereus (3093) AGCATATCAAGAAATTCATGAAGTCAGTGAACAAGAAGCAAGAAATTGGT B. subtilis 1 (3081) AGCGTATCAGGCTGTCCATGGAACCGGGGAACAAGAAGCGCAAAACTGGC B. subtilis 2 (3060) GGCATATGAAGCTGAAAAAGCAGCAAGTCAGGAAGAATCAGCTGTATGGC BM3 (3048) AAGCTATGCTGACGTTCACCAAGTGAGTGAAGCAGACGCTCGCTTATGGC Consensus (3101) AGCATATCAAGA GTTCATGAAGTCAGTGAACAAGAAGCA G AA TGGC 3151 3200 B. anthracis (3143) TGGACCGTCTGCAAGAGGAAGGACGATATGGAAAAGATGTTTGGGCTGGT B. cereus (3143) TGGATCGTGTGCAAGATGAAGGGCGATATGGAAAAGATGTTTGGGCTGGT B. subtilis 1 (3131) TGAGACATCTGCAGGATACCGGTATGTACGCTAAGGATGTCTGGGCAGGG B. subtilis 2 (3110) TGCAAAAGCTGCAAGATCAAAGACGTTATGTGAAAGACGTTTGGACAGGA BM3 (3098) TGCAGCAGCTAGAAGAAAAAGGCCGATACGCAAAAGACGTGTGGGCTGGG Consensus (3151) TG A CATCTGCAAGAT AAGG CGATATG AAAAGATGTTTGGGCTGG 3201 B. anthracis (3193) ATATAA B. cereus (3193) ATATGA B. subtilis 1 (3181) ATATAG B. subtilis 2 (3160) ATGTAA BM3 (3148) TAA--- Consensus (3201) ATATAA
Supporting Information 226
2 Whole Cell Kinetics
0 5 10 15 20 250
20
40
60
80
100
0
20
40
60
80
100
0
20
40
60
80
100C
onve
rsio
n / %
Time / h
ee
(lact
one)
/ %
ee
(ket
one)
/ %
Figure 87: Kinetics of the PAMO-P1 catalyzed BV oxidation of 2-phenylcyclohexanone (23a) using heat activated whole cell preparations.
0 5 10 15 20 250
20
40
60
80
100
0
20
40
60
80
100
0
20
40
60
80
100
Con
vers
ion
/ %
Time / h
ee
(lact
one)
/ %
ee
(ket
one)
/ %
Figure 88: Kinetics of the PAMO-P2 catalyzed BV oxidation of 2-phenylcyclohexanone (23a) using heat activated whole cell preparations.
Supporting Information 227
0 5 10 15 20 25
0
10
20
30
40
50
60
102030405060708090100
0
10
20
30
40
50
Con
vers
ion
/ %
Time / h
ee
/ %
Sul
fone
form
atio
n / %
Figure 89: Kinetics of the oxidation of thioether 30 catalyzed by PAMO-P1 using heat-activated whole cell preparations.
3 Äkta Methods
3.1 Method File for Purification of SA
Method: C:\UNICORN\Local\Fil\default\Method\SZF DEAE FF SA stufengradient.m02 Method Duration: Total volume: 77.42 ml Total time: 54.92 min Variables Column HiTrap_DEAE_FF_1_ml Wash_Inlet_A1_ OFF Wash_Inlet_A2_ OFF Wash_Inlet_B1_ OFF Wash_Inlet_B2_ OFF Flow_Rate 1.000 {ml/min} Column_PressureLimit 0.30 {MPa} Wavelength_1 280 {nm} Wavelength_2 417 {nm} Wavelength_3 OFF {nm} Averaging_Time_UV 5.12 {sec} Pump_A_Inlet A1 Pump_B_Inlet B1 Start_ConcB 0 {%B} Column_Position Position2 Equilibrate_with 10.00 {CV} System_Pump Normal System_PressLevel 0 {MPa} System_MinFlow 0 {ml/min}
Supporting Information 228
Flowthrough_TubeType 96WellPlate Flowthrough_FracSize 1 {ml} Flowthrough_StartAt NextTube Empty_loop_with 3.50 {ml} Wash_column_with 2 {CV} 1_PumpAInlet A1 1_PumpBInlet B1 1_WashInlet_A1 OFF 1_WashInlet_A2 OFF 1_WashInlet_B1 OFF 1_WashInlet_B2 OFF 1_ConcB_Step 0 {%B} 1_Flush_Volume 5.00 {ml} 1_Tube_Type 96WellPlate 1_Fraction_Size 0.750 {ml} 1_Start_at NextTube 1_PeakFrac_TubeType 96WellPlate 1_PeakFraction_Size 0 {ml} 1_PeakFrac_Start_at NextTube 1_Length_of_Step 5.00 {CV} 2_PumpAInlet A1 2_PumpBInlet B1 2_WashInlet_A1 OFF 2_WashInlet_A2 OFF 2_WashInlet_B1 OFF 2_WashInlet_B2 OFF 2_ConcB_Step 16 {%B} 2_Flush_Volume 5.00 {ml} 2_Tube_Type 96WellPlate 2_Fraction_Size 0.750 {ml} 2_Start_at NextTube 2_PeakFrac_TubeType 96WellPlate 2_PeakFraction_Size 0 {ml} 2_PeakFrac_Start_at NextTube 2_Length_of_Step 8 {CV} 3_PumpAInlet A1 3_PumpBInlet B1 3_WashInlet_A1 OFF 3_WashInlet_A2 OFF 3_WashInlet_B1 OFF 3_WashInlet_B2 OFF 3_ConcB_Step 29 {%B} 3_Flush_Volume 5.00 {ml} 3_Tube_Type 96WellPlate 3_Fraction_Size 0.750 {ml} 3_Start_at NextTube 3_PeakFrac_TubeType 96WellPlate 3_PeakFraction_Size 0 {ml} 3_PeakFrac_Start_at NextTube 3_Length_of_Step 8 {CV} 4_PumpAInlet A1
Supporting Information 229
4_PumpBInlet B1 4_WashInlet_A1 OFF 4_WashInlet_A2 OFF 4_WashInlet_B1 OFF 4_WashInlet_B2 OFF 4_ConcB_Step 35 {%B} 4_Flush_Volume 5.00 {ml} 4_Tube_Type 96WellPlate 4_Fraction_Size 1.500 {ml} 4_Start_at NextTube 4_PeakFrac_TubeType 96WellPlate 4_PeakFraction_Size 0 {ml} 4_PeakFrac_Start_at NextTube 4_Length_of_Step 5 {CV} 5_PumpAInlet A1 5_PumpBInlet B1 5_WashInlet_A1 OFF 5_WashInlet_A2 OFF 5_WashInlet_B1 OFF 5_WashInlet_B2 OFF 5_ConcB_Step 100 {%B} 5_Flush_Volume 5.00 {ml} 5_Tube_Type 96WellPlate 5_Fraction_Size 1.500 {ml} 5_Start_at NextTube 5_PeakFrac_TubeType 96WellPlate 5_PeakFraction_Size 0 {ml} 5_PeakFrac_Start_at NextTube 5_Length_of_Step 5 {CV} Gradient_Delay 2 {ml} Reequilibrate_with 5.00 {CV} Column(s): HiTrap_DEAE_FF_1_ml
Supporting Information 230
3.2 Method File for Desalting of RM Method: C:\UNICORN\Local\Fil\default\Method\SZF buffer exchange.m02 Method Duration: Total volume: 297.05 ml Total time: 59.41 min Run 1 Volume: 59.41 ml, Time: 11.88 min Run 2 Volume: 59.41 ml, Time: 11.88 min Run 3 Volume: 59.41 ml, Time: 11.88 min Run 4 Volume: 59.41 ml, Time: 11.88 min Run 5 Volume: 59.41 ml, Time: 11.88 min Variables Column HiTrap_Desalting Wash_Inlet_A1_ OFF Wash_Inlet_A2_ OFF Wash_Inlet_B1_ OFF Wash_Inlet_B2_ OFF Flow_Rate 5.000 {ml/min} Column_PressureLimit 0.30 {MPa} Wavelength_1 280 {nm} Wavelength_2 417 {nm} Wavelength_3 OFF {nm} Averaging_Time_UV 1.28 {sec} Pump_A_Inlet A1 Pump_B_Inlet B1 Start_ConcB 0 {%B} Column_Position Position8 Equilibrate_with 10 {CV} System_Pump Normal System_PressLevel 0 {MPa} System_MinFlow 0 {ml/min} Empty_loop_with 1.50 {ml} TubeType_EluateFrac 96WellPlate Eluate_Frac_Size 1.000 {ml} EluateFrac_StartAt NextTube TubeType_PeakFrac 96WellPlate Peak_Frac_Size 1.000 {ml} PeakFrac_StartAt NextTube Length_of_Elution 1.50 {CV} Column(s): HiTrap_Desalting_5_ml
3.3 Method File for Purification of RM Method: C:\UNICORN\Local\Fil\default\Method\SZF RM step resq.m02 Method Information
Supporting Information 231
Method Duration: Total volume: 97.91 ml Total time: 21.48 min Variables Column RESOURCE_Q_1_ml Wash_Inlet_A1_ OFF Wash_Inlet_A2_ OFF Wash_Inlet_B1_ OFF Wash_Inlet_B2_ OFF Flow_Rate 4.000 {ml/min} Column_PressureLimit 1.50 {MPa} Wavelength_1 280 {nm} Wavelength_2 417 {nm} Wavelength_3 OFF {nm} Averaging_Time_UV 1.28 {sec} Pump_A_Inlet A1 Pump_B_Inlet B1 Start_ConcB 0 {%B} Column_Position Position7 Equilibrate_with 10 {CV} System_Pump Normal System_PressLevel 0 {MPa} System_MinFlow 0 {ml/min} Flowthrough_TubeType 96WellPlate Flowthrough_FracSize 0.25 {ml} Flowthrough_StartAt NextTube Empty_loop_with 5.00 {ml} Wash_column_with 2 {CV} 1_PumpAInlet A1 1_PumpBInlet B1 1_WashInlet_A1 OFF 1_WashInlet_A2 OFF 1_WashInlet_B1 OFF 1_WashInlet_B2 OFF 1_ConcB_Step 0 {%B} 1_Flush_Volume 5.00 {ml} 1_Tube_Type 96WellPlate 1_Fraction_Size 0.25 {ml} 1_Start_at NextTube 1_PeakFrac_TubeType 96WellPlate 1_PeakFraction_Size 0 {ml} 1_PeakFrac_Start_at NextTube 1_Length_of_Step 8 {CV} 2_PumpAInlet A1 2_PumpBInlet B1 2_WashInlet_A1 OFF 2_WashInlet_A2 OFF 2_WashInlet_B1 OFF 2_WashInlet_B2 OFF 2_ConcB_Step 20 {%B}