Human Interleukin-4 binding protein epitope involved in high-affinity binding of Interleukin-4: Molecular analysis and characterisation Dissertation zur Erlangung des naturwissenschaftlichen Doktorgrades der Bayerischen Julius-Maximilians-Universität Würzburg vorgelegt von Irina Wietek aus Sofia, Bulgarien Würzburg, Juli 2001
Transcript
Human Interleukin-4 binding protein epitope involved in high-affinity
binding of Interleukin-4: Molecular analysis and characterisation
Dissertation zur Erlangung des
naturwissenschaftlichen Doktorgrades
der Bayerischen Julius-Maximilians-Universität Würzburg
vorgelegt von
Irina Wietek
aus
Sofia, Bulgarien
Würzburg, Juli 2001
Eingereicht am: 23. Juli 2001 Mitglieder der Promotionskommission: ................................................................................. Vorsitzender: ........................................................................................................................... Gutachter: Prof. Dr. Walter Sebald Gutachter: Prof. Dr. Erich Buchner Tag des Promotionskolloquiums: ........................................................................................... Doktorurkunde ausgehändigt am: .....................................
2.7.4.1 Preparation of electrocompetent bacterial cells ........................................................30 2.7.4.2 Electrotransformation of competent E.coli...............................................................30
2.7.5 Storage of Bacterial Cultures ............................................................................................30
2.8 Molecular Biological Methods ..............................................................................................31 2.8.1 Determination of the Concentration of Nucleic Acids......................................................31 2.8.2 Phenol Extraction of DNA................................................................................................31 2.8.3 Ethanol Precipitation of DNA...........................................................................................31 2.8.4 DNA Molecular Standards................................................................................................32 2.8.5 DNA Agarose Gel Electrophoresis ...................................................................................32 2.8.6 Purification of DNA by Agarose Gel Electrophoresis ......................................................33 2.8.7 Site-directed Mutagenesis by PCR....................................................................................33 2.8.8 Site-directed Mutagenesis Using DNA Cassettes .............................................................35 2.8.9 Digestion of DNA .............................................................................................................35 2.8.10 Ligation of DNA .............................................................................................................36 2.8.11 Preparation of Plasmid DNA ..........................................................................................36
2.8.11.1 Lysozyme-alkaline-lysis procedure ........................................................................36 2.8.11.2 PEG precipitation procedure...................................................................................37 2.8.11.3 Preparation of plasmid DNA with LiCl..................................................................38
2.8.12 DNA Sequencing ............................................................................................................39
2.9 Protein Chemical Methods ....................................................................................................39 2.9.1 Determination of the Protein Concentration .....................................................................39 2.9.2 Lyophilization of Proteins.................................................................................................40 2.9.3 Molecular Weight Standard for Protein Samples..............................................................40
2.9.4 SDS - Polyacrylamide Gel Electrophoresis ......................................................................40 2.9.5 Concentration of Protein Samples by TCA.......................................................................41 2.9.6 Biotinylation of Proteins ...................................................................................................42
2.10 Immunological methods - Western Blot.............................................................................42 2.10.1 Transfer of Proteins to a Nitrocellulose Membrane........................................................42 2.10.2 Detection of Western Blots by a Peroxidase Coupled Antibody ....................................43
2.11 Expression of Recombinant Proteins in E.coli ..................................................................44 2.11.1 Temperature Induced Protein Expression .......................................................................44 2.11.2 Preparation of Inclusion Bodies ......................................................................................45 2.11.3 Denaturation and Renaturation of Proteins .....................................................................45
2.12 Expression of Recombinant Proteins in SF9 cells .............................................................46 2.12.1 General Handling Techniques.........................................................................................46
2.12.1.1 Insect cell culture media .........................................................................................46 2.12.1.2 Cultivation of Sf9 cells ...........................................................................................46 2.12.1.3 Staining and counting of Sf9 cells ..........................................................................47 2.12.1.4 Long-term cell storage............................................................................................47 2.12.1.5 Monolayer culture...................................................................................................48 2.12.1.6 Suspension culture ..................................................................................................48
2.12.2 Generation of Recombinant Baculoviruses.....................................................................49 2.12.2.1 The Baculovirus expression system........................................................................49 2.12.2.2 Co-transfection of BaculoGold DNA and a transfer vector into insect cells .........49 2.12.2.3 Generating pure virus stocks by plaque purification ..............................................51
2.12.3 Amplification of Virus Stocks ........................................................................................52 2.12.3.1 Virus amplification from a single virus plaque ......................................................52 2.12.3.2 Virus amplification in a small volume scale...........................................................53 2.12.3.3 Virus amplification in a large volume scale ...........................................................53 2.12.3.4 Determination of virus titer by plaque assay ..........................................................53 2.12.3.5 Virus storage...........................................................................................................54 2.12.4 Protein Expression .....................................................................................................54
2.13 Purification of Recombinant Proteins................................................................................55 2.13.1 Purification of Proteins Expressed in E.coli ...................................................................55
2.13.1.1 Protein purification by ion exchange chromatography...........................................55 2.13.1.2 Protein purification by RP-HPLC...........................................................................55
2.13.2 Purification of Proteins Expressed in Sf9 Cells ..............................................................57 2.13.2.1 Affinity chromatography using IL-4 as a ligand ....................................................57 2.13.2.2 Affinity chromatography using X14/38 as a ligand ...............................................57 2.13.2.3 Dialysis ...................................................................................................................58 2.13.2.4 Concentration of proteins by ultrafiltration ............................................................58
2.14 Analysis of Protein-Protein Interactions by BIAcore Technology ..................................59 2.14.1 Immobilization of Proteins by Streptavidin-Biotin Coupling.........................................60 2.14.2 Measuring and Evaluation of Protein-Protein Interactions.............................................60 2.14.3 Assessment of the Energetic Effects of Introduced Mutations .......................................61
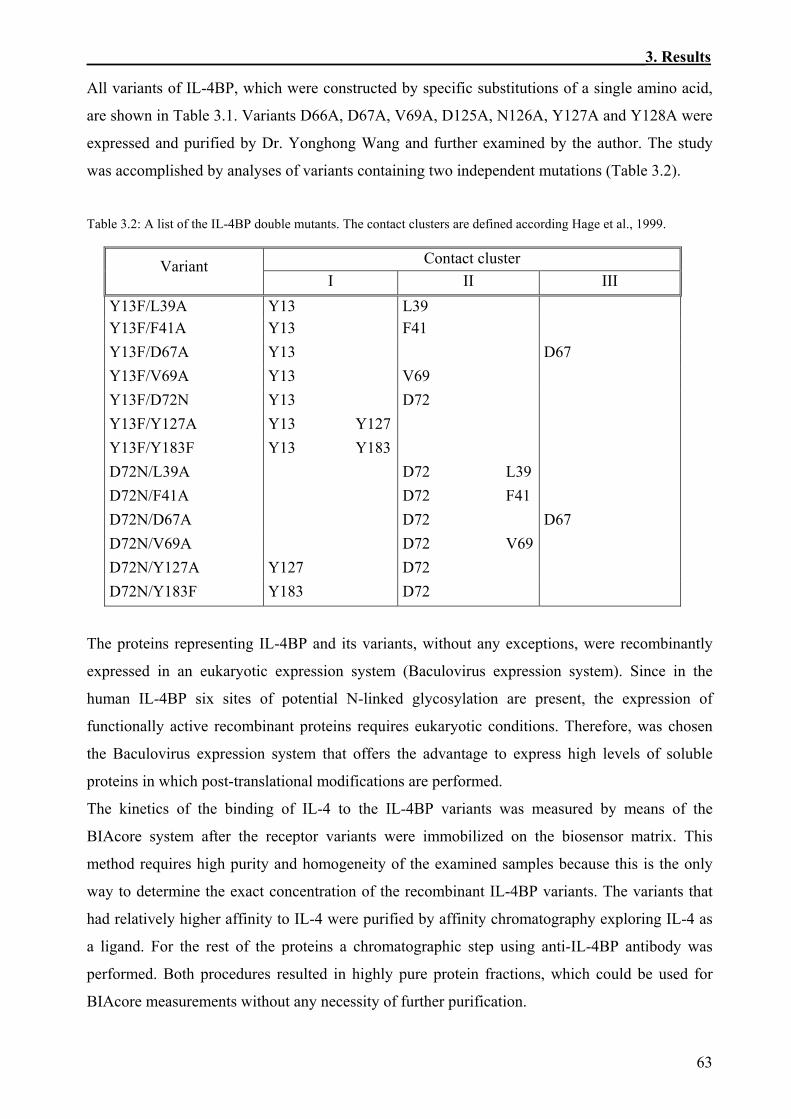
3.1 Preparation of Recombinant IL-4BP and Its Variants ......................................................62 3.1.1 Cloning of IL-4BP and Its Variants in the Baculovirus Transfer Vector pAcGP67B ......64
3.1.2 Co-transfection into SF9 Insect Cells and Amplification of the Recombinant Virus.......68 3.1.3 Expression and Purification of Recombinant IL-4BP and Its Variants ............................69
3.1.3.1 Purification of IL-4BP and its variants by IL-4 affinity column ..............................69 3.1.3.2 Purification of IL-4BP variants through Antibody column......................................74
3.1.4 Biotinylation of IL-4BP Recombinant Variants ...............................................................77
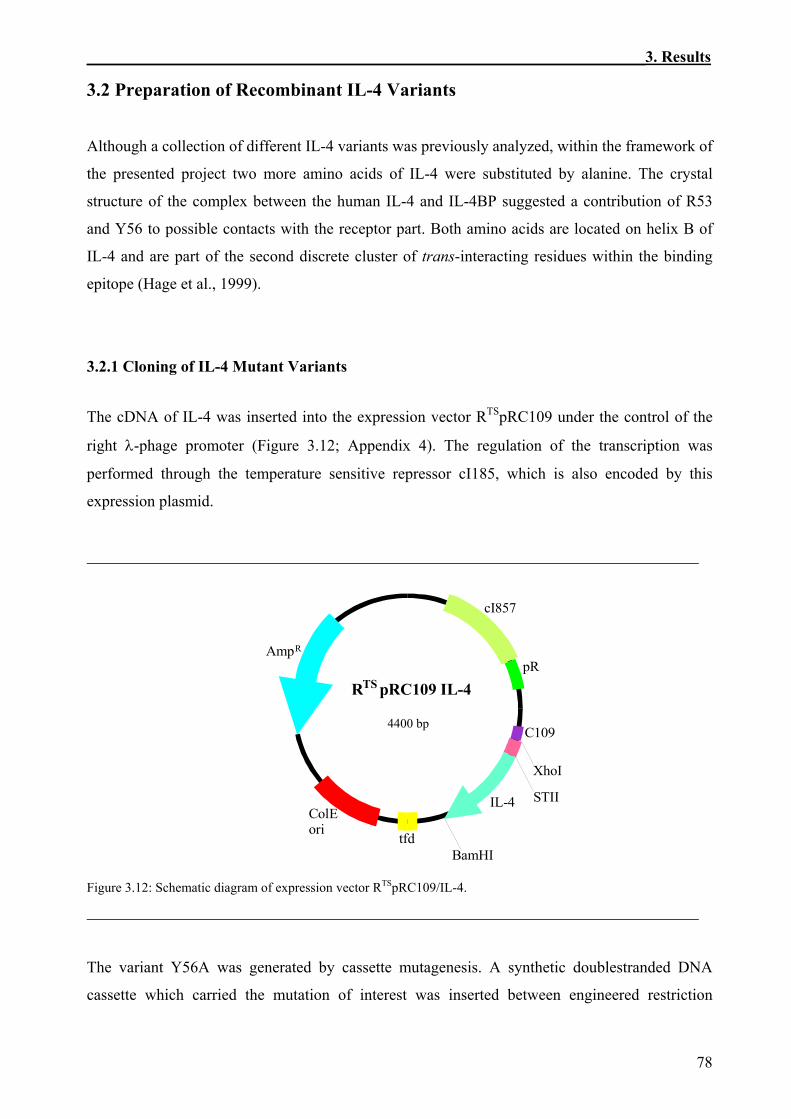
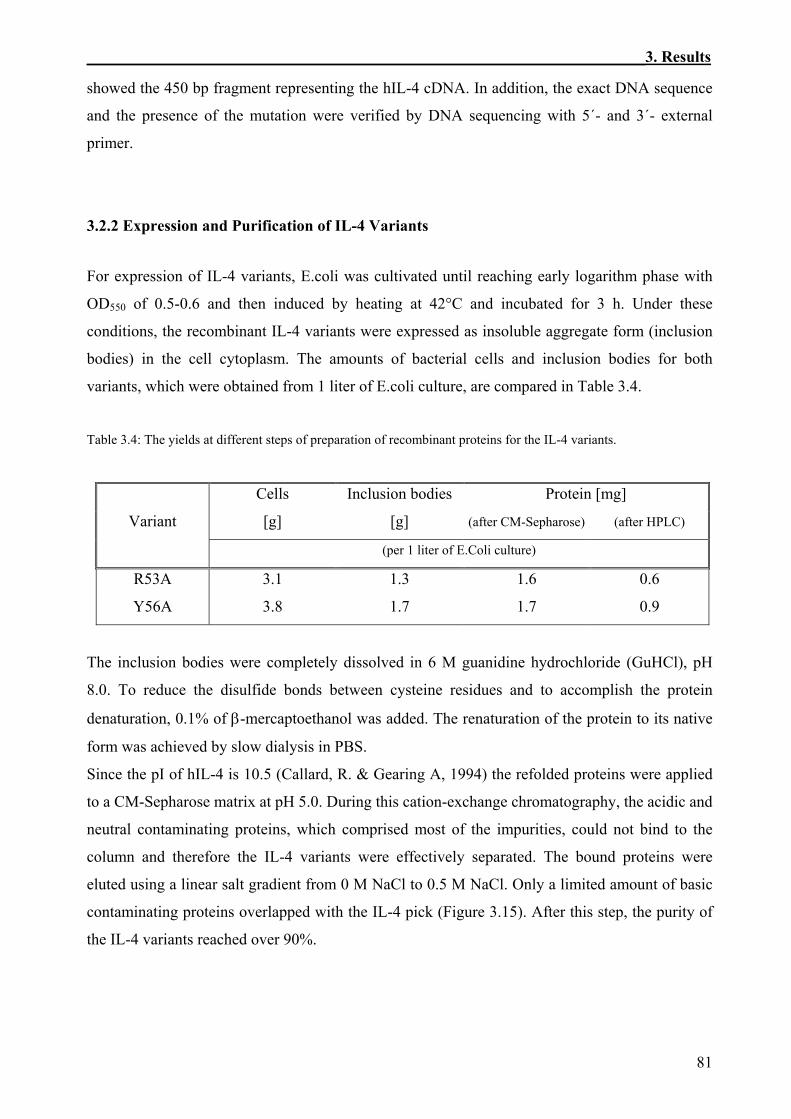
3.2 Preparation of Recombinant IL-4 Variants ........................................................................78 3.2.1 Cloning of IL-4 Mutant Variants ......................................................................................78 3.2.2 Expression and Purification of IL-4 Variants ...................................................................81
3.3 Kinetic Analysis of the Interaction of IL-4 with the IL-4BP Variants Using BIAcore Technology.............................................................................................................................84
3.3.1 Immobilization of the Biotinylated IL-4BP and its Variants on the Sensor Chips ...........84 3.3.2 Kinetics of the Interaction of IL-4 and IL-4BP.................................................................87 3.3.3 Effects of Site-Specific Perturbations in IL-4BP on the Interaction with IL-4.................89
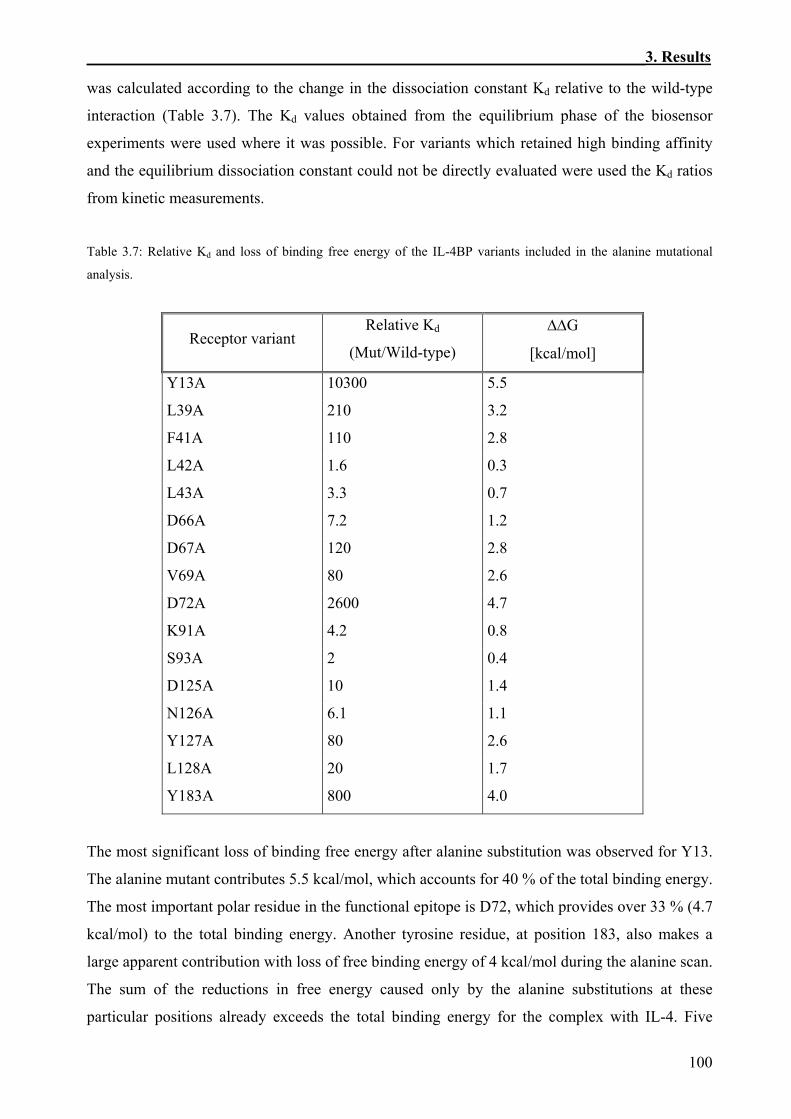
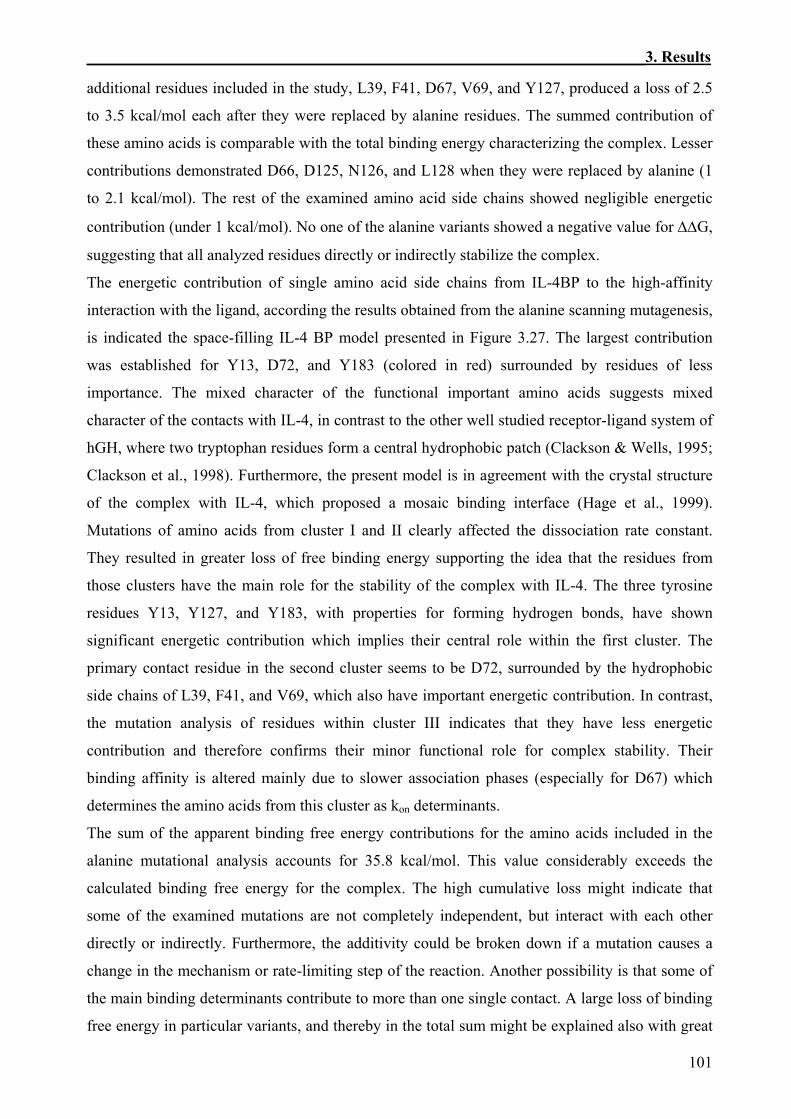
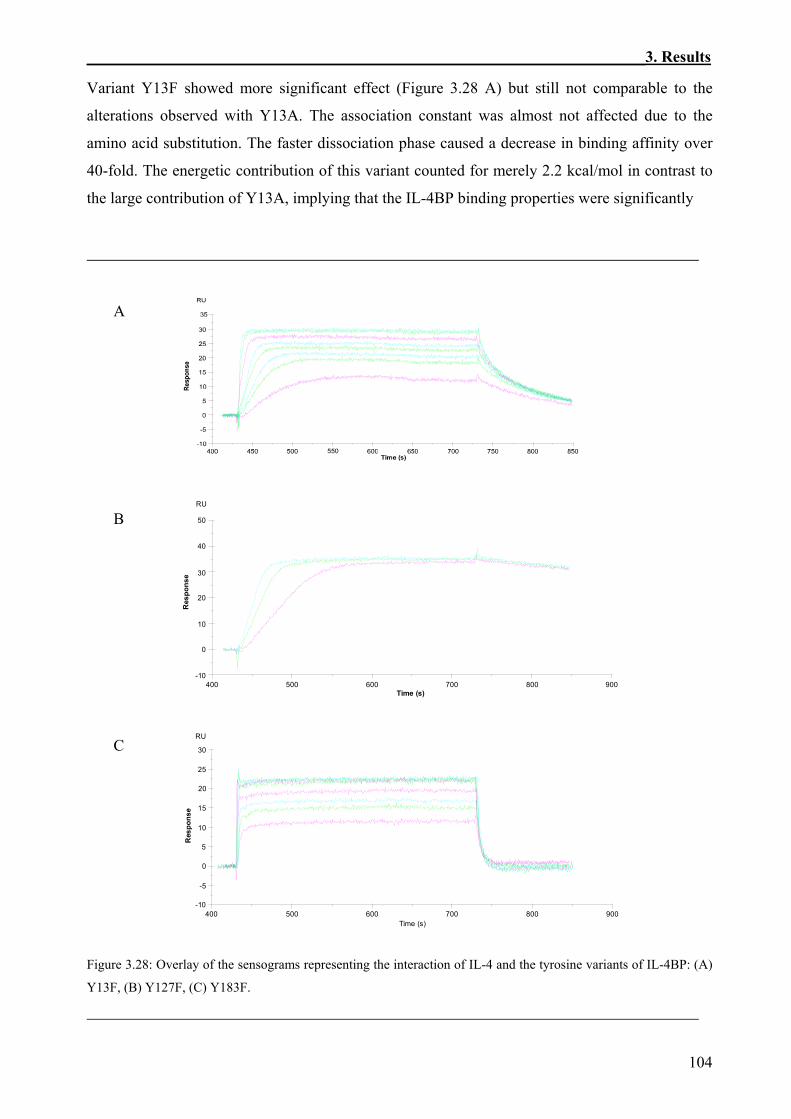
3.3.3.1 Kinetics of the binding of IL-4 to the alanine variants of IL-4BP............................89 3.3.3.2 Thermodynamic aspects of the interaction between IL-4 and the IL-4BP variants
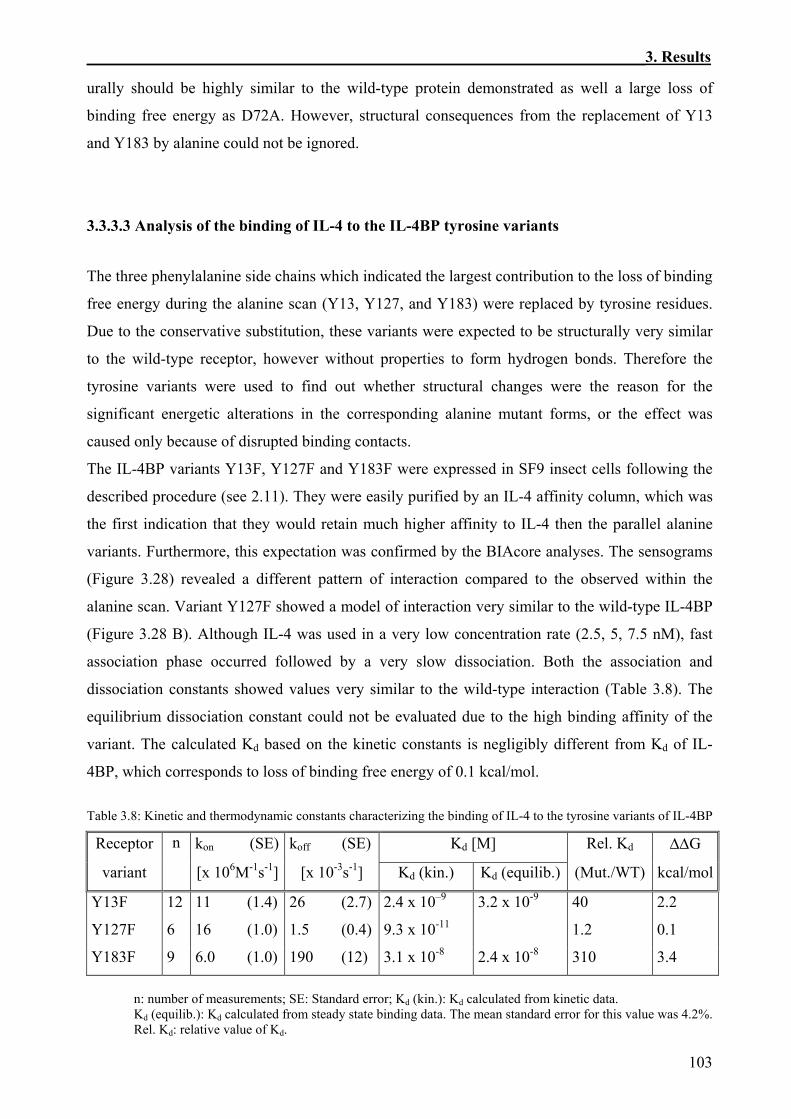
included in the alanine scanning mutagenesis........................................................99 3.3.3.3 Analysis of the binding of IL-4 to the IL-4BP tyrosine variants............................103
3.3.4 Analysis of IL-4BP Double Mutants...............................................................................105
3.4 Biosensor Analysis of the Kinetics of Binding of IL-4 Variants to the IL-4BP..............110
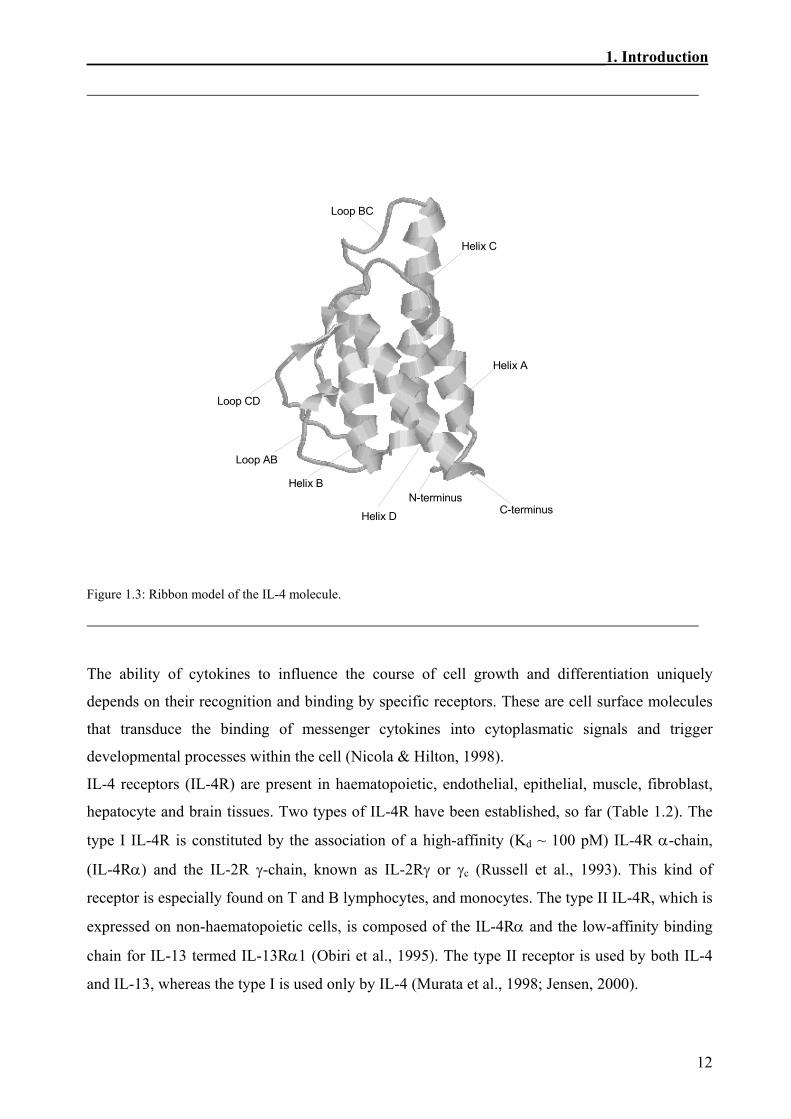
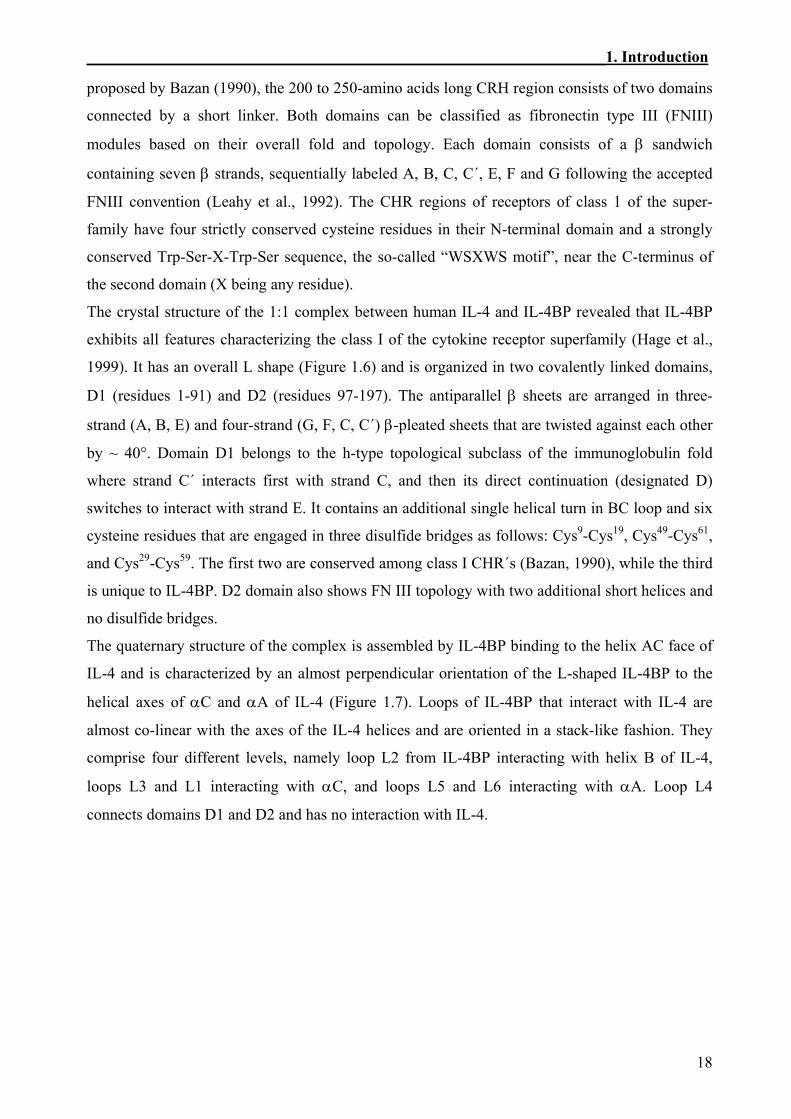
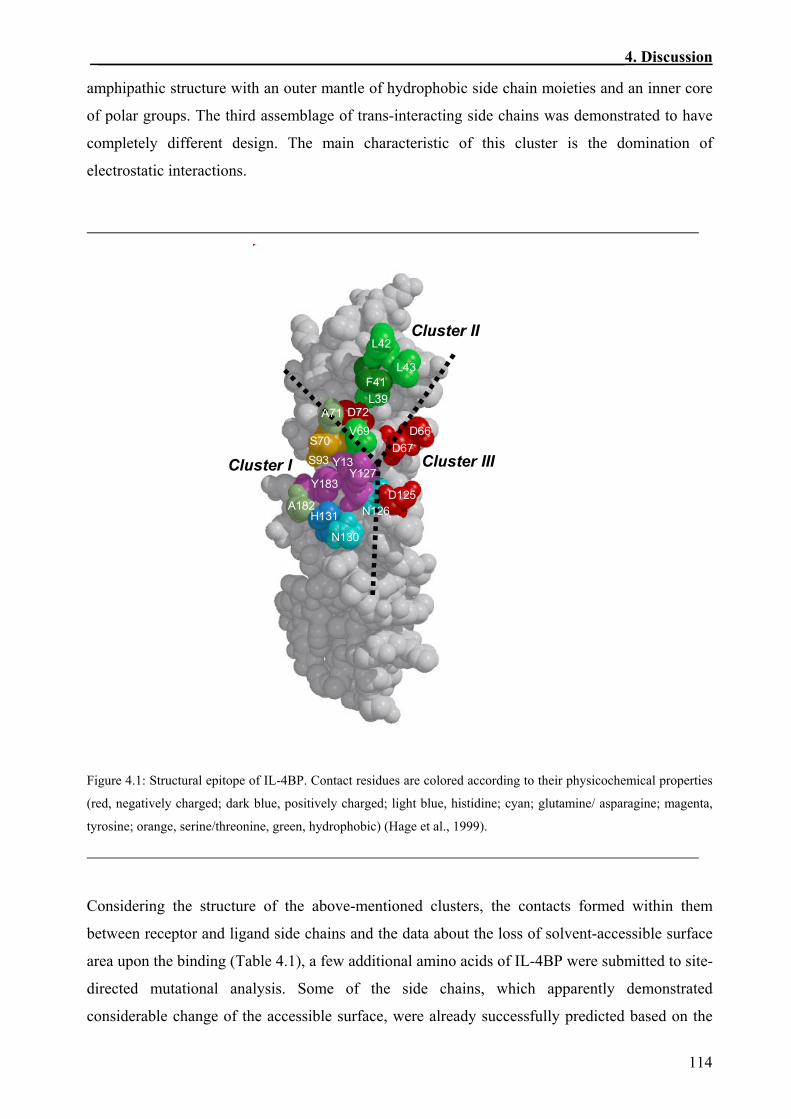
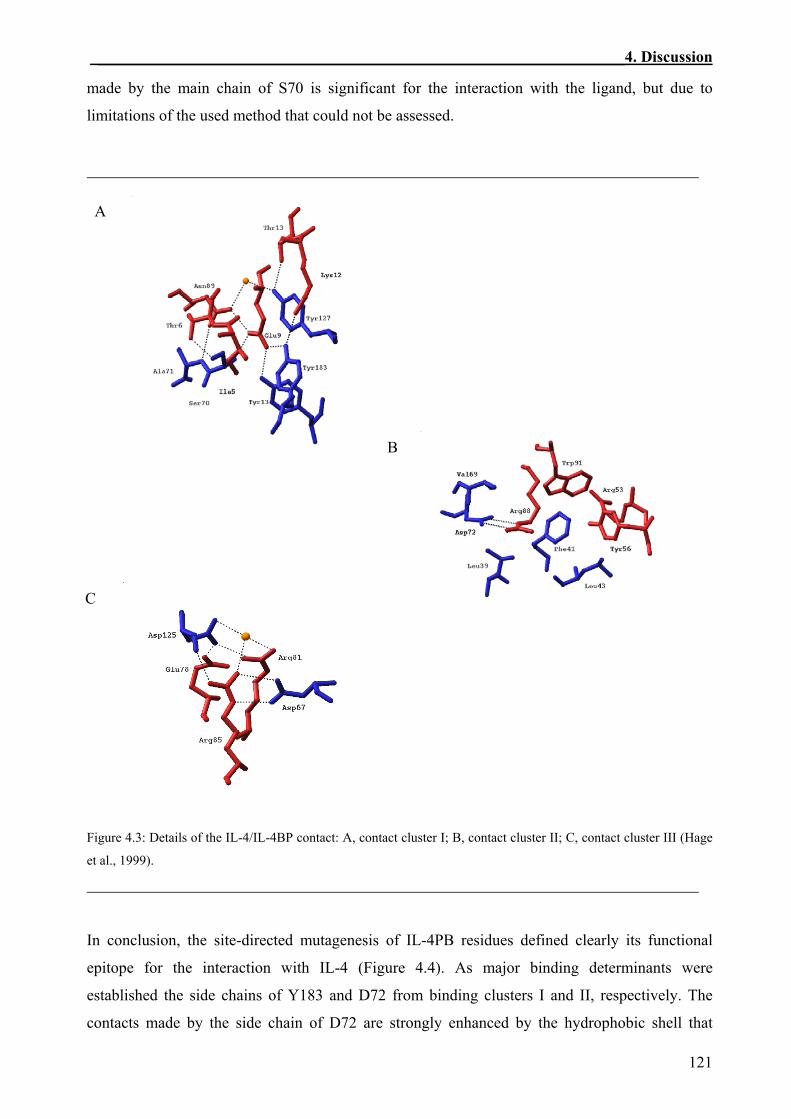
4.1 Structural Features and Binding Site of Human IL-4BP.................................................112
4.2 Defining Functional Important Residues from The Interface of Human IL-4BP for the Interaction with IL-4 ..........................................................................................................116
4.3 Additivity and Cooperativity in the Functional Epitope of IL-4BP................................124
4.4 Comparison of the Structural and the Functional IL-4BP Epitopes ..............................126
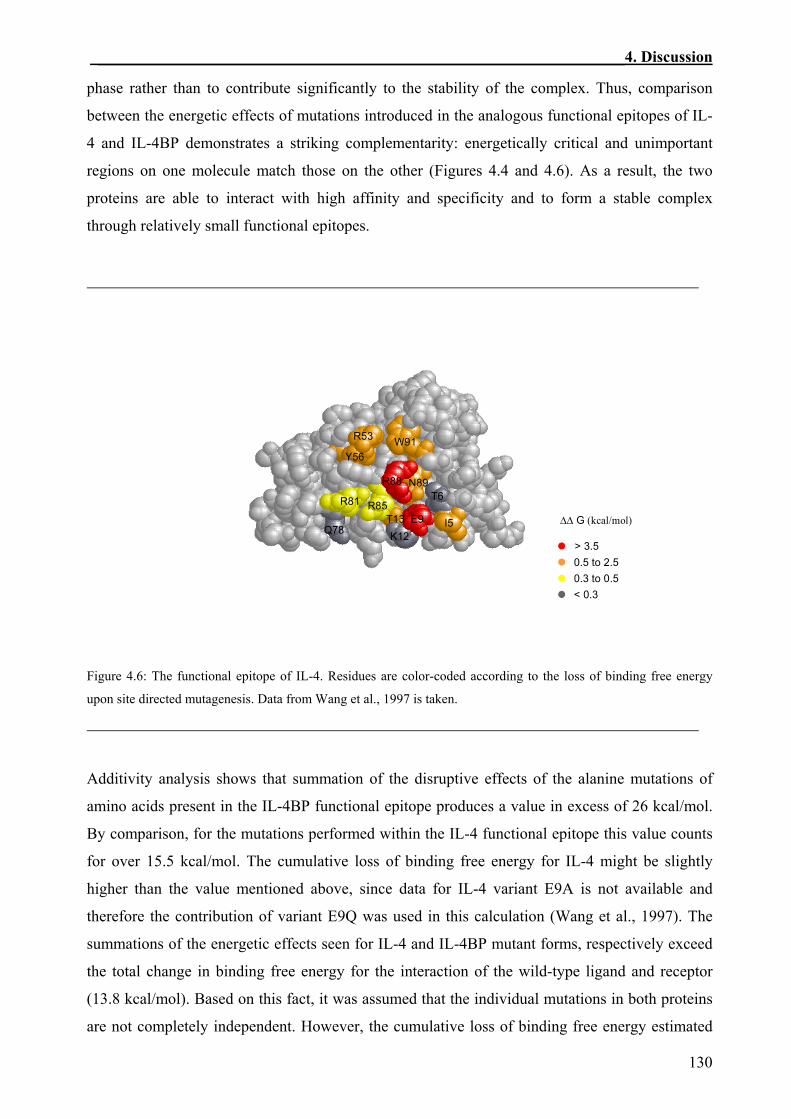
4.5 Complementarity between the Functional Epitopes of Human IL-4 and IL-4BP .........129
4.6 Comparison of the IL-4BP Functional Epitope to Other Cytokine Receptors ..............131
Cytokines are a diverse group of proteins, which can be subdivided into several families,
including the haematopoietins, the interferons, tumor necrosis factor (TNF)-related molecules,
immunoglobulin super-family members, and the chemokines (Paul & Seder, 1994). Among these
molecules substantial overlap in functions is observed. These pleiotropic mediators act
synergistically or antagonistically to orchestrate the behavior, proliferation and death of cells,
acting directly or by regulating the expression of other cytokines. A paradigm of cytokine biology
arises from the regulation of the differentiation of naive T cells. Among cloned lines of CD4+ T
cells, two major subsets (TH1 and TH2) have been identified, which have shown a great degree of
polarization in their cytokine-producing phenotype (Romagnani, 1991). TH1 clones tend to
produce IL-2, IFNγ and TNFβ as their unique products, while TH2 clones express IL-4, IL-5, IL-6,
IL-10 and IL-13. TH1 and TH2 cells develop from precursors of T helper cells (pTH), which are bi-
potent and their differentiation is determined by the present cytokines (Figure 1.1). IL-4 appears
to be essential for priming the differentiation of pTH cells into TH2 cells, while IFNγ inhibits it
(Seder et al., 1992). The differentiation into TH1 cells is enhanced by IL-12 and diminished by IL-
4 (Hsieh et al., 1993; Seder et al., 1993).
+IL-2 and IL-4
+IL-2 and IL-12
IFN , IL-2, TNFγ β
IL-4, IL-5, IL-6IL-10, IL-13
Cellularimmunity
Help for antibodyproduction
IL-4 inhibits
IFN inhibitsγ
TH2 cell
TH1 cell
pTH cell
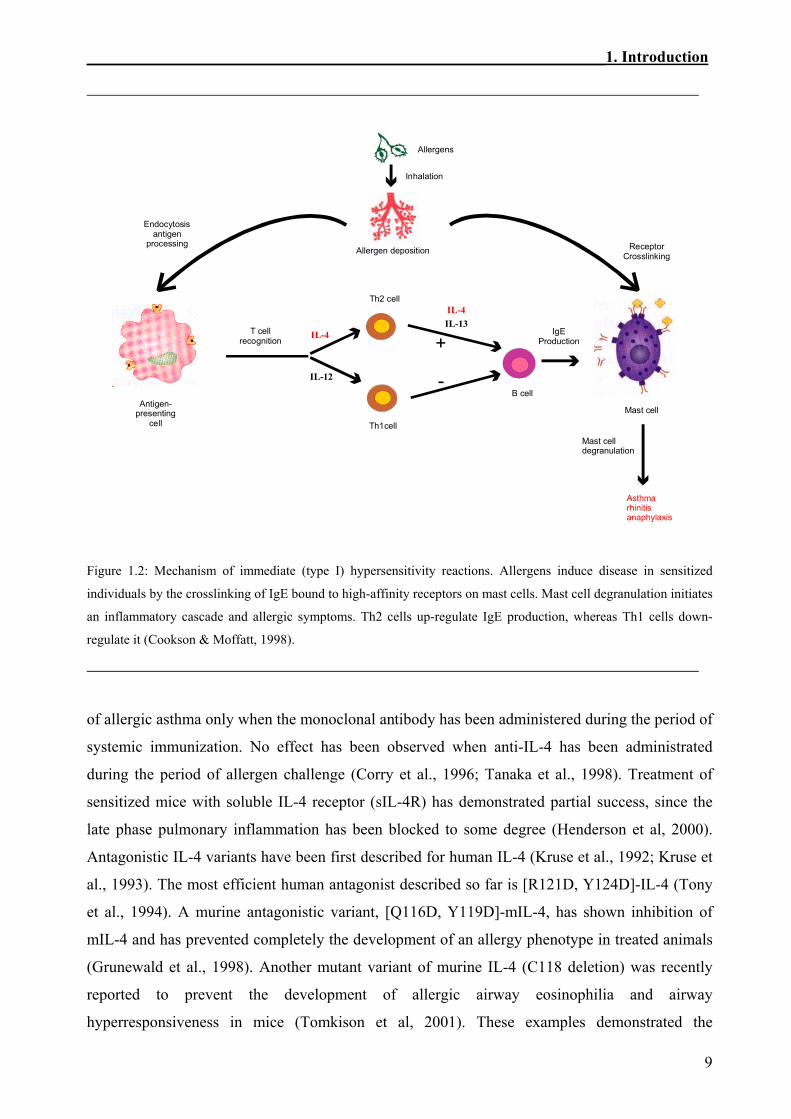
Figure 1.1: Differentiation of pTH cells into TH1 and TH2 subtypes is determined by cytokines. A system through, which the polarization of CD4+ T cell response toward the production of IFNγ and the expression of cellular immunity or toward the production of IL-4 and expression of help for antibody production is mediated (Paul & Seder, 1994).
ENB-amp-plates 15 g agarose in 800 ml H2O was autoclaved. When the agarose
solution was cooled to 50oC, 200 ml 5 x ENB-medium, 2.5 ml 2M
glucose, 0.5 ml thiamin solution in H2O (10mg/ml) and 50 mg
ampicilin in 2ml 1M TrisHCl buffer (pH 8.0) were added. After
mixing, the agarose solution was filled into plates, cooled at RT
and kept at 4oC
Ampicillin solution, 50 mg/ml in 1M TrisHCl pH 8.0, must be freshly prepared and added to final
concentration of 50 µg/ml for all kinds of media.
2.7.3 Culturing of Bacteria Glycerin stock-culture was spread over an agar plate and incubated at 30oC or 37oC overnight. A
colony was picked up and incubated in 2 ml of medium at 30oC or 37oC for a day. This culture
was further used for making larger culture.
29
________________________________________________________2. Materials and Methods
2.7.4 Electrocompetent E.coli 2.7.4.1 Preparation of electrocompetent bacterial cells E.coli from an agar plate or frozen stock were cultivated in 2 ml of TB-medium with ampicillin at
37oC for 8 h. From this culture was started 200 ml of a new culture, which was incubated and
shook (200 rpm, Cetromat-R) overnight under the same conditions.
The overnight culture was centrifuged at 3500 rpm (Beckmann J2-21, JA-10 rotor), 4oC for 10
min. and then washed with 200 ml cold solution of 10% glycerin/H2O (v/v). The suspension was
consecutively centrifuged in the same way and resuspended in 100 ml, 50 ml, 20 ml and 2 ml of
cold 10% glycerol solution. The final suspension was aliquoted in chilled Eppendorf tubes (40µl)
and frozen in liquid Nitrogen. The competent cells were stored at -70oC.
2.7.4.2 Electrotransformation of competent E.coli The electrocompetent E.coli were placed on ice and thawed out. 10-20 ng of DNA (in TE-buffer)
were added and the suspension was mixed and transferred to a chilled 0.2 cm electroporation
cuvette. Immediately after the pulse was applied (Biorad Gene PulserTM: 250 V, 25 mF and 200
W), 500 µl of LB-medium were added and the cuvette was vigorously shaken. The suspension
was incubated at 30oC or 37oC for 30 min. For selection the bacterial material was placed in 2
ENB-amp-plates, which were kept at 30oC or 37oC overnight.
2.7.5 Storage of Bacterial Cultures 10 µl bacterial suspension was spread over an agar plate and incubated at 30oC or 37oC overnight
until colonies appeared. Such a plate can be kept 4 to 6 weeks at 4oC.
For long-term bacterial storage, a single bacterial colony was cultivated in 50 ml of LB-medium
with ampicillin at 30oC or 37oC until the suspension reached OD550 of 1.5 - 1.7 (LKB Novaspec).
The following centrifugation was carried out at 3000 rpm for 10 min. The pellet was resuspended
in 2 ml of LB-medium/amp and mixed with 2ml of sterilized glycerol (87%). This culture can be
kept at -20oC several years.
30
________________________________________________________2. Materials and Methods
2.8 Molecular Biological Methods 2.8.1 Determination of the Concentration of Nucleic Acids The concentration of nucleic acids was measured by spectrophotometry in the absorption
spectrum range 240-320 nm. (Kontron Uvikon 930 Spectrophotometer). Considering an
extinction value of 1, the relation between A260 and the concentration is as follows:
(60 ml 5M KOAc with 11.5 ml acetic acid and 28.5 ml H2O)
solution 4: 5M LiCl
RNase solution: 10 mg/ml RNase A (DNase free)
The underwritten method is a simple way to prepare more plasmid DNA comparing to the
described already PEG precipitation. The purity and the amount of the prepared DNA is
sufficient for co-transfection in Sf9 cells.
Bacterial culture was started from a single colony in 2 ml of TB-medium/amp and incubated 8 h
at 37oC. 10-20 µl were transferred in 30-40 ml of fresh medium and cultivated at 37oC overnight.
The bacterial suspension was transferred in a Falcon tissue culture tube and was spun down by
centrifugation at 3000 rpm for 5 min (Megafuge1.0, Heraeus). The pellet was resuspended in 2
ml of solution 1 and after 50 µl of RNase solution were added, the sample was mixed and placed
on ice for 5-10 min. 3 ml of solution 2 were added, the content was thoroughly but gently mixed
by inverting the tube and incubated for 5-10 min on ice. After this step, 2 ml of solution 3 were
added and the tube was thoroughly but gently inverted until a homogeneous suspension was
formed. The sample was incubated 5-10 min on ice, 6 ml of solution 4 (5M LiCl) were added and
the content was mixed. After 5-10 min of incubation on ice, the sample was centrifuged for 15
min at 5500 rpm (Megafuge 1.0, Heraeus). The supernatant was further filtered through 2 layers
of precision wiper paper and transferred to a new Falcon tissue culture tube. DNA was
precipitated with an equal volume of isopropanol and after the pellet was rinsed with 70% EtOH,
it was dried under vacuum. Then the pellet was resuspended in 500 µl of dH2O, transferred to a
fresh Eppendorf tube and 50 µl of RNase solution were added to the DNA solution. The sample
was incubated for 30-60 min at 37oC. DNA was extracted with 400 µl saturated phenol/tris and
400 µl of chloroform/isoamylalcohol (24:1) solution. The aqueous phase was transferred to a new
Eppendorf tube and 1/10 Vol. of 3M NaOAc and an equal volume of isopropanol were added to
it. The sample was thoroughly vortexed, incubated at RT for 5 min and centrifuged at high speed
38
________________________________________________________2. Materials and Methods
(14000 rpm) for 10 min. The pellet was briefly dried under vacuum and redissolved in 40 µl of
dH2O. When the plasmid DNA was isolated to be used for co-transfection in Sf9 cells, the pellet
from the last step was dried under sterile conditions and was dissolved in sterile dH2O.
The concentration of the plasmid DNA was determined by spectrophotometry and the quality was
examined by agarose gel electrophoresis.
2.8.12 DNA Sequencing
The DNA sequencing was performed by Wolgang Haedelt, using an automatic DNA Seguencer
(Applied Biosystems, Model 373A) and according to manufacturer’s instructions.
The used method, according to Sanger, relies on the base-specific termination of the DNA chain
elongation by random integration of labeled ddNTPs at the end of the chain. Four independent
sequencing reactions were carried out for each analyzed DNA sample. Each reaction contained
different chain-terminating ddNTP coupled to a corresponding fluorescent day. After the end of
PCR, the products of the four reactions were mixed together and analyzed on a 7 %
polyacrylamide gel. Due to the different fluorescence, the single DNA fragments could be
detected by an argon laser beam.
2.9 Protein Chemical Methods 2.9.1 Determination of the Protein Concentration The concentration of a protein solution, when it is diluted to 0.1-0.5 mg/ml, can be measured by
spectrophotometry at the absorption spectrum range 250-320 nm (Kontron Uvikon 930
Spectrophotometer). For calculation was used the absorbency value A at 280 nm. The
concentration of IL-4 and IL-4BP per absorbency unit (A280 = 1) and the path length equal to 1
cm are shown in the Table 2.6.
Table 2.6: Molar absorbency factor and concentration of IL-4 and IL-4BP
Protein Molar absorbency factor [mol-1*cm-1]
Concentration per absorbency unit 1 [mg/ml]
IL-4 8610 1.7 IL-4BP 66930 0.357
39
________________________________________________________2. Materials and Methods
2.9.2 Lyophilization of Proteins The purified protein was divided into aliquots of 100 µl each and then placed in an aluminum
block and frozen at -70oC overnight. The frozen protein aliquots were then transferred to a
Lyophilizator (Christ Lac-1), which was pre-cooled to -55oC and vacuum pumped to 0.02 bar
overnight. KOH was kept in the lyophilization chamber as a dry reagent.
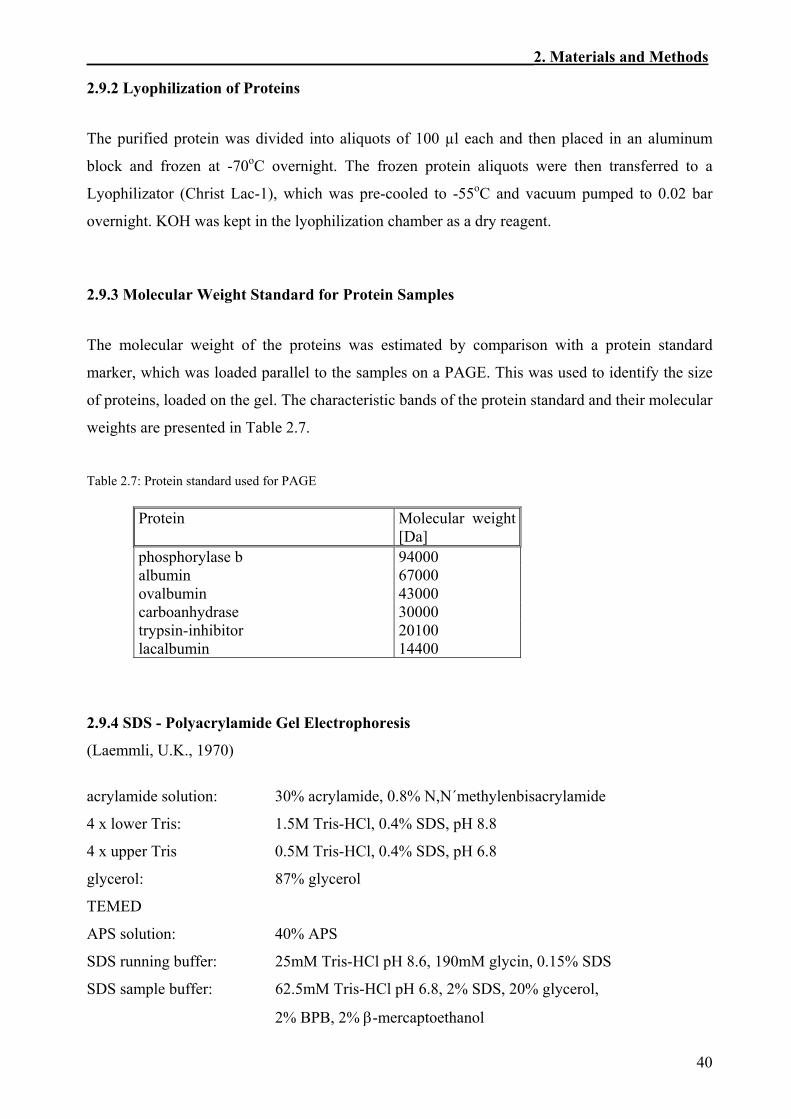
2.9.3 Molecular Weight Standard for Protein Samples The molecular weight of the proteins was estimated by comparison with a protein standard
marker, which was loaded parallel to the samples on a PAGE. This was used to identify the size
of proteins, loaded on the gel. The characteristic bands of the protein standard and their molecular
weights are presented in Table 2.7.
Table 2.7: Protein standard used for PAGE
Protein Molecular weight [Da]
phosphorylase b 94000 albumin 67000 ovalbumin 43000 carboanhydrase 30000 trypsin-inhibitor 20100 lacalbumin 14400
In denaturating SDS-polyacrylamide gels the proteins were separated by their molecular weight.
The electrophoresis was performed in a vertical gel electrophoresis system Mini-V 8.10 (Gibco
BRL). Different acrylamide concentrations can be used for different gel preparations (Table 2.8)
depending on the size of the separated proteins.
Table 2.8: Amount of the different components used for SDS-polyacrylamide gel electrophoresis
Solution Stacking gel Separating gel 7.5% 10% 12% acrylamide solution 0.25 ml 1.25 ml 1.67 ml 2 ml 4 x lower Tris - 1.25 ml 1.25 ml 1.25 ml 4 x upper Tris 0.62 ml - - - H2O 1.6 ml 1.5 ml 1.1 ml 0.75 ml 87% glycerol - 1 ml 1 ml 1 ml TEMED 6 µl 5 µl 7 µl 7 µl 40% APS 6 µl 5 µl 7 µl 7 µl
The separating gel solution was decanted between two vertical glass-slabs (layer thickness 0.75
mm) with a Pasteur pipette to 2/3 of the glasses upper edge and then covered with a water layer.
After polymerization, the water was poured out, the stacking gel solution was filled on the top
and a comb was immediately inserted.
The protein samples and SDS sample buffer (1:1) were mixed and boiled at 100oC for 5 min. A
microlitre syringe was used to place the protein solutions in the wells of the slab. For each well
0.5-2 µg of protein was loaded. In the first lane, parallel to the samples, was loaded the protein
standard. Until the samples were concentrating, the gel was running at 100 V and for the
separating part 150 V were used.
After the end of the electrophoresis, the gel was placed for 30 min in a coomassie solution for
staining. The destaining was done overnight. The ready gel was kept 1 h in 20 % methanol and
dried between two pieces of cellophane.
2.9.5 Concentration of Protein Samples by TCA
When the protein concentration was low, concentration by TCA was done before the sample was
loaded on PAGE. To the protein sample, which had to be concentrated was added 1/9 Vol. of 5%
TCA. After mixing, the protein solution was incubated for 20 min on ice and then centrifuged for
41
________________________________________________________2. Materials and Methods
20 min at 14000 rpm (Eppendorf Centrifuge). The pellet was dissolved in desired volume of SDS
sample buffer. When the solution had a yellow color, 1 µl of 2.5M Tris-HCl pH 8.0 was added
until the color got blue.
2.9.6 Biotinylation of Proteins For biotinylation were used protein solutions of purified IL-4BP in PBS. To 300 µl of such a
solution 50 µl of 0.5M NaHCO3, pH 8.5 were added. A solution of 1 µg EZ-LinkTM Sulfo-NHS-
LC-Biotin (Pierce) in 300 µl DMSO was prepared. Biotin solution was added to the protein
sample in such an amount that the protein and the biotin were in a molar ratio of 1:5. The sample
was shortly vortexed and then incubated on ice for 3 h.
The biotinylated protein sample was separated from the free biotin by gel filtration through a
column filled with Biogel P6DG. The column volume was about 14 ml and for elution was used
PBS. The biotinylated protein was eluted after 4-5 ml flow through. The sample was divided into
aliquots, which were kept at -20oC.
2.10 Immunological methods - Western Blot 2.10.1 Transfer of Proteins to a Nitrocellulose Membrane
(Gershoni and Palade, 1983)
Transfer buffer: 25mM Tris-HCl, 192 mM glycin, 20% methanol
To the suspension, containing inclusion bodies slowly were added 3 volumes of 6 M guanidine
hydrochloride solution and 0.1% (by volume) 2-mercaptoethanol. The mixture was stirred for 30
min at RT and then centrifuged at 11000 rpm (Beckmann J2, JA-10 rotor) for 15 min at 4oC. 4
volumes H2O were added drop by drop to the supernatant. The sample was centrifugated at 11000
rpm for 20 min at 4oC. The supernatant was dialysed against 20 volumes of PBS pH 7.4 for 16-20
h at 4oC. The cloudy suspension first was adjusted to pH 5.0, using 4 M acetic acid and then was
centrifuged at 11000 rpm (Beckmann JA-14 rotor) for 20 min at 4oC. The protein containing
supernatant was further purified by ion exchange chromatography.
45
________________________________________________________2. Materials and Methods
2.12 Expression of Recombinant Proteins in SF9 cells
2.12.1 General Handling Techniques
2.12.1.1 Insect cell culture media
Insect - Express medium (BioWhittaker)
SF - 1 medium (BioConcept)
Sf - 900 II Serum-Free Medium (Gibco BRL)
Pluronic F68 for ICM - 10% (BioConcept)
Lipid Ethanol solution for ICM (BioConcept)
L - Glutamine (Seromed)
FCS (Gibco BRL)
All of these media provide basic nutrients for Sf9 cells and have a pH of approximately 6.2.
Insect-Express medium does not require additional supplements and was completed only with 5%
of FCS. The rest of the mentioned mediums were supplemented as shown in Table 2.9.
Table 2.9: Insect cell culture media and required supplements
Medium Lipid mix Pluronic L-glutamine FCS Insect-Express
1000 ml -
- - 50 ml
SF-1 950 ml
1 ml 10 ml 25 ml 50 ml
SF-900 SFM II 980 ml
1 ml 10 ml 10 ml 50 ml
2.12.1.2 Cultivation of Sf9 cells
To prevent bacterial or yeast contamination, all experiments dealing with Sf9 cells were
performed at sterile conditions. Glass pipettes, plastic materials and solutions were sterilized.
Flasks and tubes, containing cells were opened only in a laminar flow hood (LaminAir HB
2448S, Heraeus).
Old medium was exchanged with fresh every second day, since the healthy Sf9 cells double every
18-24 h. The culture was incubated at 27oC in incubators (Heraeus, Memmert).
46
________________________________________________________2. Materials and Methods
2.12.1.3 Staining and counting of Sf9 cells
trypan blue 0.4% (w/v) solution in PBS
The trypan blue exclusion method was used to count the proportion of viable cells and their
concentration in the suspension. Since the exclusion of the stain is a selectively working
definition for viability, the dead cells appear as blue spots, when observed with an inverse
microscope.
A small aliquot of cells was mixed with trypan blue solution at a ratio of 1:1 and kept at RT for 1
min. Apart of this, the suspension was placed in a Neubauer’s chamber and observed with an
inverse microscope. The viable cells in 16 different squares were counted. To calculate the cell
density (cells/ml), the sum of cells counted within those squares has to be multiplied by 104.
2.12.1.4 Long-term cell storage
freezing medium: 90% culture medium and 10% DMSO, freshly filtered through
22 µm filter
cryovials: 2.0 ml, sterile (Nalgene)
Sf9 cells can be stored for long periods of time by freezing in liquid nitrogen. Sf9 cells from a
healthy, log-phase culture were spun down at 2500 rpm (Megafuge 1.0, Heraeus) for 10 min.
After the supernatant was decanted, the cell pellet was kept on ice and resuspended in such a
volume of freezing medium, that the final cell density was 4 x 10⁶. The cell suspension was
aliquoted (1 ml) into freezing vials. To freeze the cells slowly, the vials were placed at -20oC for
1 h and then kept at -80oC overnight. The next day the cells were transferred to liquid nitrogen. A
week or two after the cells were frozen, one vial was thawed to check for cell viability and
contamination.
The frozen cells were quickly thawed by gentle agitation in a 37oC water bath. Then, they were
transferred to a centrifuge tube (Falcon) and 25 ml of fresh medium were added. The cells were
spun down by centrifugation at 1000 rpm (Megafuge 1.0, Heraeus) for 5 min. The pellet was
resuspended in 40 ml of fresh medium and centrifuged again at the same conditions. After the
supernatant was removed, the cells were resuspended in 10 ml of medium and the suspension was
seeded in a 25 cm2 culture flask, which was incubated at 27oC. After 12-24 h the old medium was
replaced with fresh and the culture was incubated at 27oC as long as the cells needed to get
47
________________________________________________________2. Materials and Methods
confluent. Then they were transferred to a bigger flask (75 cm2) and the medium was exchanged
with fresh.
2.12.1.5 Monolayer culture
tissue culture flasks: 25 cm2 (Falcon)
75 cm2 (Falcon)
175 cm2 (Falcon)
Insect cells grow well both in suspension and as monolayer cultures and can be transferred from
one to the other with minimal adaptation.
Sf9 cells from a monolayer culture were subcultured when they were 80-90% confluent. After the
culture was examined for contaminations and cells floating in the medium, the old medium was
discarded and the cells were washed from the surface of the flask by gentle pipetting using 10 ml
of fresh medium. A small aliquot of this suspension was stained with trypan blue. The cells were
examined and counted with an inverse microscope. The suspension was diluted and the cells were
seeded in a new flask with a density of 7.0 x 10⁴ - 1.0 x 10⁵ cells/cm2 in a final volume of 5 ml
(for 25 cm2 flask), 15 ml (for 75 cm2 flask) or 35 ml (for 175 cm2 flask). A culture prepared with
such cell density was ready for next passage in 2-3 days. The flasks were incubated in a
humidified incubator at 27oC.
2.12.1.6 Suspension culture
plastic roller bottles: 2 l (Greiner)
Continuous propagation of Sf9 cells in suspension for more than a few passages resulted in
decreased cell viability and growth rate. That was the reason, that the stock cultures were
passaged as monolayer and used then to seed suspension cultures when it was required.
Usually, 2-3 confluent 175 cm2 flasks were used to start one bottle of a suspension culture. After
the cells were counted, they were inoculated in a plastic roller bottle with a density of 0.8 x 10⁵ -
1.0x 10⁶ cells/ml in a total volume of 80-100 ml. The bottle was incubated at 27oC in an
incubator, where it was slowly rolled (5 rpm). When cells from the suspension attached to the
wall of the bottle and the cell density reached 3-4 x 10⁶ cells/ml, fresh medium was added to the
48
________________________________________________________2. Materials and Methods
culture. In a roller bottle were incubated maximum 200 ml of cell suspension and the cell density
was controlled to be not more than 4.5 x 10⁶ cells/ml.
2.12.2 Generation of Recombinant Baculoviruses 2.12.2.1 The Baculovirus expression system Baculoviruses belong to a diverse group of large double-stranded DNA viruses that infect
different insects as their natural hosts (Matthews, R.E.F., 1982). The Baculovirus genome is
replicated and transcribed in the nuclei of infected host cells where the large Baculovirus DNA
(between 80 and 120 kbp) is packaged into rod-shaped nucleocapsids. Since the size of this
nucleocapsids is flexible, recombinant Baculovirus particles can accumulate large amounts of
foreign DNA.
One of the most commonly used Baculoviruses for expression vector work is Autographa
californica nuclear polyhedrosis virus (AcNPV). Infectious AcNPV particles enter susceptible
insect cells by endocytosis or fusion and viral DNA is uncoated in the nucleus. DNA replication
starts 6 h post-infection. The virus infection cycle can be divided into two different phases: early
and late. During the early phase, the infected insect cell releases extracellular virus particles by
budding off from the cell membrane of infected cells. During the late phase of the infection cycle,
occluded virus particles are assembled inside the nucleus. The occluded viruses are embedded in
a homogenous matrix made predominantly of a single protein, the polyhedrin protein. That is
why, during the late phase of infection, the polyhedrin protein accumulates to very high levels.
Although the polyhedrin protein seems to be one of the most abundant proteins in infected insect
cells, it is not essential for the Baculovirus life cycle in tissue culture. Cloning of a gene of
interest under the control of the polyhedrin promoter, leads to high expression levels of the
recombinant protein. This fact defines the Baculovirus expression vector system as one of the
most powerful available systems for eukaryotic expression of recombinant proteins.
2.12.2.2 Co-transfection of BaculoGold DNA and a transfer vector into insect cells The Baculovirus genome is too large to directly insert foreign genes easily. Hence the foreign
gene has to be cloned first in a transfer vector, which later is co-transfected with AcNPV DNA
into Sf9 cells.
49
________________________________________________________2. Materials and Methods
For co-transfection was used BaculoGold DNA (Pharmingen), which is a modified AcNPV
Baculovirus DNA, containing a lethal deletion and does not code for viable virus. Co-transfection
of BaculoGold DNA with a complementing Baculovirus Transfer Vector rescues the lethal
deletion. The foreign gene has to be cloned into a transfer vector that contains flanking
sequences, which are homologous to the Baculovirus genome. After co-transfection,
recombination takes place within the insect cells between the homologous regions in the transfer
vector and the BaculoGold DNA. Recombinant virus produces recombinant protein and also
infects additional insect cells, thereby resulting in additional recombinant virus.
As a transfer vector was used pAcGP67B, where the gene of interest was cloned under the
control of the strong Baculovirus polyhedrin promoter. It also contains gp67 signal sequence
upstream of a multiple cloning site, which is one of the most effective Baculovirus-encoded
signal sequences for protein secretion. The signal peptide mediates the forced secretion of the
recombinant protein, even if it is normally not secreted. During transport across the cell
membrane, the signal peptide is cleaved and the native protein can be purified from the infection
supernatant. The vector has an E.coli origin of replication, which allows to be amplified in
bacteria. It was prepared for co-transfection by LiCl purification method (see 2.7.11.3).
Co-transfection was performed using BaculoGold transfection kit (Pharmingen). The following
materials were required:
confluent monolayer culture of Sf9 cells
BaculoGold transfection kit: linearized BaculoGold Baculovirus DNA
transfection buffer A
transfection buffer B
AcNPV wild-type high titer stock solution
purified recombinant Baculovirus transfer vector (pAcGP67B)
FCS
6-well tissue-culture plate
Confluent Sf9 cells were counted and diluted with medium containing 5% FCS to a cell density
of 7 x 10⁵ cells/ml. In each well of a 6-well tissue culture plate, 1 ml of this cell suspension was
seeded and 1 ml of fresh medium was added. The plate was incubated shortly at 27oC until the
cells attached firmly to the bottom.
In a sterile Eppendorf tube in a laminar hood, 1 µg of the pure recombinant transfer vector was
mixed with 0.25 µg (2.5 µl) of BaculoGold DNA. After 5 min of incubation at RT, 500 µl of
transfection buffer B were added to the co-transfection mixture. To prepare the positive control,
50
________________________________________________________2. Materials and Methods
25 µl of AcPNV wild-type high titer stock solution were added to 1.5 ml of medium. The old
medium from the cells in the experimental co-transfection well was aspirated and replaced with
500 µl of transfection buffer A. The medium in the positive control well was replaced with the
mixture containing wild-type AcNPV. In the negative control well the medium was aspirated and
1.5 ml of fresh medium were added. Nothing else was added to this well. Drop-by-drop, in the
experimental co-transfection well was added the earlier prepared solution containing BaculoGold
DNA and Baculovirus transfer vector. After every 3-5 drops, the plate was gently rocked back
and forth to mix the drops with the medium. During this procedure, a fine calcium
phosphate/DNA precipitate with white color was formed. The plate was incubated for 4 h at 27oC
and then the medium from the experimental and the positive control wells was aspirated. The
cells there were washed with 1.5 ml of fresh medium, which then was removed. Again 1.5 ml of
fresh medium was added to each of these wells. The plate was placed in a incubator and kept at
27oC for 5 days.
After 5 days the cells in the three wells were examined for signs of infection. The supernatant
from the experimental co-transfection well was collected and centrifuged at 2500 rpm (Biofuge
A, Heraeus) for 5 min. The supernatant was stored at 4oC in the dark and later was used for
plaque purification.
2.12.2.3 Generating pure virus stocks by plaque purification The principle of the following method is to infect cells with extremely low numbers of infectious
particles, so that only isolated cells become infected. An overlay of agarose keeps the cells stable
and limits the spread of virus. When the originally infected cell produces virus and eventually
lyses, only the immediate neighboring cells become infected. Each group of infected cells is
referred to as a plaque. Uninfected cells are dispersed throughout the culture, surrounding the
plaques. After several infection cycles, the infected cells in the center of the plaques begin to lyse
and the peripheral infected cells remain surrounded by uninfected cells. All the virus particles in a
plaque derive from a single infectious particle. Therefore, clonal virus populations may be
purified by isolating individual plaques.
confluent monolayer Sf9 culture
FCS
Insect Express Medium (2 x) (BioWhittaker)
agarose solution: 1.8% SeaPlaque Agarose (BioZym) dissolved in H20, autoclaved
and kept at 65oC
51
________________________________________________________2. Materials and Methods
MTT solution: 1 mg/ml MTT dissolved in H2O, filtered through 22 µl filter
6-well tissue culture plate
The cells were counted and diluted to a cell density of 1.2 x 10⁶ cells/ml. In each well was seeded
1 ml of cell suspension and 1 ml of fresh medium was added. The plate was kept 10-15 min at
27oC on a level surface to allow the cells to spread evenly over the bottom. Serial dilutions of the
viral transfection supernatant in fresh medium were made, as it follows:
3 x 10⁻¹, 1 x 10⁻¹, 1 x 10⁻², 1 x 10⁻³ and 1 x 10⁻⁴.
All dilutions were performed in a total volume of 1 ml in sterile Eppendorf tubes. The medium
was aspirated and replaced with the virus in oculum. One well was used for negative control and
there only fresh medium was added. The plate was incubated at 27oC for 1 h. For each plate was
prepared a solution containing 5 ml of agarose solution, 4.5 ml of Insect Express Medium (2x),
and 500 µl of FCS, which was kept fluid at 40oC. The virus dilutions were aspirated and the cells
were overlaid with an agarose containing solution (1 ml/well). The plate was kept on a leveled
surface until agarose hardened (about 20 min). The plate was incubated in a humid atmosphere at
27oC until visible plaques developed (usually 5-6 days).
To better visualize the plaques, the cells were stained with solution of MTT. To each well was
applied 1 ml of it and the plate was incubated for 1 h at RT. After this time, the plaques were seen
as small white points on a violet background.
2.12.3 Amplification of Virus Stocks The generation of a pure high titer virus stock involved the preparation of a stock starting from a
single infectious unit. During the virus amplification, the following steps were performed to
increase the volume and the titer of the virus stock.
2.12.3.1 Virus amplification from a single virus plaque The plaques were picked from wells containing not more than 20 single plaques. To pick up the
plaques, a sterile micropipette tip was used. Each single plaque was placed in a sterile Eppendorf
tube containing 1 ml of medium and was incubated for 1 h at 27oC. In a 6-well tissue-culture
plate was seeded 1 ml/well Sf9 cells from confluent culture with a cell density of 1.2-1.5 x 10⁶
cells/ml and 1 ml of fresh medium was added to each well. After the cells attached to the bottom,
52
________________________________________________________2. Materials and Methods
the medium was replaced with plaque containing solutions. In the negative control well, 1 ml of
fresh medium was added. The plate was incubated for 1 h at 27oC and then 1 ml of fresh medium
was added to each well.
After 3 days of incubation at 27oC, the supernatant from the different virus clones was collected
and centrifuged at 2500 rpm (Biofuge A, Heraeus) for 5 min. This amplifying step was repeated
once more using 500 µl of each virus stock mixed with 500 µl of fresh medium. After the second
amplification, the virus clones were tested for protein expression by Western blotting (see 2.9).
The virus clone, which showed the best expression level, was chosen for further amplification.
2.12.3.2 Virus amplification in a small volume scale In a 175 cm2 tissue-culture flask were seeded Sf9 cells with a density of 1.6-2.0 x 10⁵ cells/cm2 in
a total volume of 35 ml. After the cells attached to the bottom, the medium was aspirated and
cells were infected with 1 ml of the virus supernatant collected after the second amplification
step. Additionally, 10 ml of fresh medium were added and the flask was incubated for 1 h at
27oC. Then 24 ml of fresh medium were added to the flask. After 3 days of incubation at 27oC,
the virus supernatant was collected and centrifuged (Megafuge 1.0, Heraeus) at 2500 rpm for 5
min.
2.12.3.3 Virus amplification in a large volume scale 5 ml from the virus supernatant collected after the described amplification step were used to
infect Sf9 cells in a roller bottle (Greiner). 95 ml of suspension culture from Sf9 cells with cell
density 1.5 x 10⁶ cells/ml were transferred to a fresh plastic roller bottle and then the virus stock
was added. After 3 days of incubation at 27oC, the supernatant was centrifuged at 2500 rpm
(Megafuge 1.0, Heraeus) for 5 min and was used for determination of virus titer.
2.12.3.4 Determination of virus titer by plaque assay The titer of a virus stock is the concentration of infectious virus particles in that stock. It was
determined by a plaque assay. Plaque assay of a virus stock involves essentially the same
protocol as plaque purification. Because each plaque derives from a single infectious unit,
53
________________________________________________________2. Materials and Methods
counting the number of plaques formed by different dilutions of a virus stock allows determining
the concentration of infectious units in the stock. Viral titers determined in this manner are
expressed in plaque-forming units/ml (pfu/ml). For practical purposes, the virus stock titered by
plaque assay was diluted as it follows:
1 x 10⁻⁴, 1 x 10⁻⁵, 1 x 10⁻⁶, 1 x 10⁻⁷ and 1 x 10⁻⁸.
2.12.3.5 Virus storage
(Jarvis, D.L. et al., 1994)
Working stocks of recombinant viruses were stored at 4oC in tissue-culture medium containing
5% of FCS. Infected cells and cell debris were removed from the virus stock by centrifugation at
1000 x g for 5 min. The stocks were stored in the dark, because the viruses are extremely light
sensitive.
For long-term storage, aliquots of the virus stock were frozen in polypropylene cryovials at
-80oC without any cryoprotectant. Before freezing, FCS was added to 10%. Virus stocks were
retitrated before use after prolonged storage.
2.12.4 Protein Expression After the virus titer was determined, the high titer virus stock was used for protein expression.
200 ml of suspension culture with cell density 1.5 x 10⁶ cells/ml, were transferred to a fresh
plastic roller bottle. The cells were infected with such an amount of high titer virus stock, that the
multiplicity of the infection (infectious virus units/cell) was between 3 and 5. The bottle was
rolled (5 rpm) at 27oC. Aliquots were examined under a microscope and depending on the
number of infected cells, the expression was done for 4 or 5 days. The suspension was
centrifuged at 3000 rpm for 10 min. The protein containing supernatant was frozen and stored at -
20oC.
54
________________________________________________________2. Materials and Methods
2.13 Purification of Recombinant Proteins 2.13.1 Purification of Proteins Expressed in E.coli 2.13.1.1 Protein purification by ion exchange chromatography buffer A: 25mM NH4OAc, pH 5.0
buffer B: 25mM NH4OAc, 1M NaCl, pH 5.0
column: 3 x 10 cm (Biorad)
ion exchanger: CM-Sepharose fast flow
pump: LKB 2232 Microperpex S Peristaltic Pump
detector: LKB 2238 Uvicord, LKB 2210 Recorder
collector: ISCO Retriever II
CM-Sepharose fast flow (Pharmacia) was equilibrated with 4 M NH4OAc, pH 5.0 and washed
several times with 25 mM NH4OAc, pH 5.0 by a funnel. The so prepared ion exchanger was
packed in a column (5-10 ml) and washed with solution A, until the elute reached pH 5.0. The
protein containing solution was slowly loaded (ca. 250 ml/h) into the column. This was followed
by rinsing with five column volumes of solution A. The elution of proteins was performed by a
60 ml linear salt gradient from 0 to 0.5 M NaCl/25 mM NH4OAc pH 5.0 with a flow rate ca.0.5
ml/min. The elute peak was detected with an absorbance device at 280 nm and recorded. The
described procedure was performed in a 4oC room. The collected fractions (2 ml each) were
measured at 280 nm (Konto Uvikon 930 Spectrophotometer), using solution A as a blank.
Further, the fractions (10 µl from each) were examined on a SDS-polyacrylamide gel. The
fractions, which contained pure protein in a sufficient amount were combined and later purified
additionally by the use of RP-HPLC.
2.13.1.2 Protein purification by RP-HPLC controller: LKB 2152 HPLC Controller
The flow rate was 0.7 ml/min for the column (250 x 4.6 mm) and 2 ml/min for the column (250 x
8 mm). The protein concentration of the collected fractions was measured at the absorption
spectrum range 250-320 nm (Kontron Uvikon 930 Spectrophotometer). An aliquot (10 µl) from
every fraction was mixed with 30 µl of protein buffer and 5 µl from this solution was analyzed by
SDS-polyacrylamide gel electrophoresis. The fractions with the highest amount of pure protein
were combined, aliquoted and lyophilized.
In addition to the SDS-PAGE, the protein purity was also examined by analytical RP-HPLC,
performed with the use of the small column (250 x 4.6 mm). The procedure followed the
described details for preparative RP-HPLC, except that only 100 µg of protein were required for
analysis and the detection sensitivity was set at 0.08.
56
________________________________________________________2. Materials and Methods
2.13.2 Purification of Proteins Expressed in Sf9 Cells 2.13.2.1 Affinity chromatography using IL-4 as a ligand PBS: 120mM NaCl, 2mM KCl, 3mM NaH2PO4, pH 7.4
eluent: 4M MgCl2
affinity adsorbent: IL-4, immobilised to Sepharose gel
pre-column: 1 x10 cm column (Biorad)
filling for pre-column: CM Sepharose fast flow (Pharmacia)
The affinity matrix (2 ml) was packed in a sterile Pasture pipette. The so prepared affinity column
was washed with 10 volumes of PBS and stored at 4oC. The filling for the pre-column (CM
Sepharose fast flow) was washed several times with 20 x PBS, using a funnel. The gel was stored
under 20 x PBS at 4oC. Immediately before the purification step, 2-3 ml were used to fill the pre-
column, which was washed with 10 volumes of PBS.
The protein containing supernatant was thawed out and centrifuged at 2500 rpm (Megafuge 1.0,
Heraeus) for 10 min to eliminate the precipitate, resulting from freezing. After the affinity
column and the pre-column were connected, the protein material was loaded in a way that it
passed slowly (about 100 ml/h) first through the pre-column. The two columns were
disconnected and the affinity column was washed with 10 column volumes (20 ml) of PBS.
During the elution, which was performed with 4 M MgCl2, 5-6 protein fractions were collected
(each 1.5 ml). The described procedure was carried out at 4oC. The protein concentration was
measured at the absorption spectrum range 250-320 nm (Kontron Uvikon 930
Spectrophotometer). The quality of the protein was analyzed by an SDS-PAGE, where 15 µl of
every fraction were loaded. The fractions containing the highest amount of pure protein were
combined.
The pre-column could be used only once, and then had to be cleaned and refilled with fresh CM
Sepharose. After elution, the affinity column was washed with 20 ml of PBS and recovered in
this way for the next protein purification. It was stored at 4oC under PBS.
2.13.2.2 Affinity chromatography using X14/38 as a ligand PBS: 120mM NaCl, 2mM KCl, 3mM NaH2PO4, pH 7.4
eluent: 4M MgCl2
affinity adsorbent: X-14-38, bond to Sepharose gel
57
________________________________________________________2. Materials and Methods
pre-column: 1 x10 cm column (Biorad)
filling for pre-column: CM Sepharose fast flow (Pharmacia)
X14/38 is an anti-IL-4BP monoclonal antibody, which was used as a ligand for the purification of
low-affinity IL-4BP variants that could not be purified by the method described in above.
The procedure is essentially the same as described in 2.12.2.1. The main difference was, that the
protein containing supernatant was loaded very slowly (usually overnight) onto the columns.
2.13.2.3 Dialysis After the purification by an affinity column, the fractions containing the highest amount of pure
IL-4BP, were combined and dialyzed in order to reduce the high salt concentration. The protein
solution was placed in a semi-permeable dialysis tubing (type 20/32, Roth) made of cellulose
acetate. The dialysis was performed in 2 l of PBS, which was stirred at 4oC overnight. At the next
day, the buffer was exchanged with fresh and the dialysis repeated one more night. To prevent
contamination with foreign proteins, the tubing was touched only through gloves.
2.13.2.4 Concentration of proteins by ultrafiltration ultrafilter: YM10 = 10000 MW (Amicon)
apparatus: stirred cell covering range 1-10 ml (Amicon 8010)
During ultrafiltration, water and other small molecules were driven out of the protein solution
through a semi-permeable membrane by a transmembrane force, such as high pressure.
The new membrane was washed according to the manufacturer’s instructions and stored under
30% ethanol at 4oC. Before use, the filter was washed with dH2O. The system was assembled and
the membrane was placed with the glossy side toward the solution. It was rinsed by filtering a
few ml of PBS at 3.5 atm. PBS was replaced by the dialyzed protein solution (10-15 ml) and
pressure of 4 atm was applied until the protein sample reached a volume of 1-1.5 ml. The
ultrafilter was rinsed in dH2O and stored under 30% ethanol solution at 4oC. The protein
concentration was measured at the absorption spectrum range 250-320 nm. Aliquots of 350 µl
were frozen at -20oC and further biotinylated.
58
________________________________________________________2. Materials and Methods
2.14 Analysis of Protein-Protein Interactions by BIAcore Technology The analysis of kinetic and thermodynamic data of protein-protein interactions between the
extracellular domain of IL-4 receptor (IL-4BP) and its mutated variants with the ligand (IL-4)
was performed with a BIAcore 2000 (Pharmacia). BIAcore 2000 is an instrument, which
measures bio-molecular interactions in real time without labeling of the interactants and allows
detailed investigation of the reaction kinetics by analysis of the resultant signals (Karlsson, R. &
Fealt, A., 1997).
For this purpose, one interactant (here IL-4BP or its variants) is immobilized on the surface of a
sensor chip and a solution containing the other binding partner (IL-4) flows continuously over the
chip. The sensor chip consists of a glass slide coated with a thin gold film to which is attached, by
an inert linker layer, a dextran matrix onto which the mentioned interactant can be immobilized
using well-defined chemistry. The sensor chip forms one wall of a micro-flow cell where its
matrix covered side comes into contact with the solution containing the second interactant. This
system uses the detection principle of surface plasmon resonance. During the interaction, light
passing a prism is focused onto the gold surface of the sensor chip through the glass, and
reflected light is monitored. Evanescent wave photons produced by the incident polarized light
interact with free oscillating electrons (plasmons) in the gold surface. Resonance occurs at a
critical angle of the incident light, and light energy is transferred to electrons in the metal film
surface, causing a minima in the reflected light. This angle depends on the refractive index at, or
close to the metal surface opposite to where the light is focused. By measuring small changes in
refractive index, the instrument monitors the change in mass as a ligand binds to, or dissociates
from, its binding partner. Data are presented as sensograms that show the change in resonance
units (RU) versus time. For proteins, which have a refractive index increment of approximately
0.18, a signal of 1000 RU is equivalent to a surface concentration of 1 ng/mm2 (Stenberg, E. et
al., 1990).
Association is monitored when a sample is injected and binding occurs to the immobilized
interactant. After sample injection, buffer alone flows over the sensor surface and dissociation
parameters can be recorded. At the end of the experiment, the surface can be regenerated using
suitable reagents to remove remaining bound analyte without denaturing the immobilized
reaction partner and the chip can be used for a new cycle of measurements (Nice, E.C. &
Catimel, B., 1999)
59
________________________________________________________2. Materials and Methods
2.14.1 Immobilization of Proteins by Streptavidin-Biotin Coupling After streptavidin was covalently immobilized onto the surface of a sensor chip, the biotinylated
The concentration of biotinylated proteins used for immobilization was usually 0.1 µg/ml.
2.14.2 Measuring and Evaluation of Protein-Protein Interactions A typical sensogram recorded with BIAcore 2000 is characterized by the following three phases:
1) Association phase - when the sample is injected; increases in the signal correspond to binding
to the immobilized interactant.
2) The signal reaches a constant plateau when equilibrium between association and dissociation is
reached.
3) Dissociation phase - occurs when buffer alone flows over the sensor surface. The decrease in
signal reflects dissociation of analyte from the surface-bound complex.
60
________________________________________________________2. Materials and Methods
Kinetic rate constants can be derived from the association and dissociation phases of the
sensogram. The height of the plateau represents the thermodynamic affinity of binding.
The program BIAevaluation 2.0 was used to calculate the kinetic and thermodynamic constants.
The theoretical equations, which describe the kinetics and equilibrium of interactions in real-time
BIA, are listed in Appendix 1.
2.14.3 Assessment of the Energetic Effects of Introduced Mutations Substitution of a residue, which is direct or indirect involved in binding is followed by a change
in the binding energy of the protein-protein complex. The equilibrium dissociation constants
determined by experiments performed with the BIAcore 2000 analytical system were used to
calculate the loss of binding free energy (∆∆G) characterizing the mutated variants:
∆∆G = R*T*ln (Kd mut/Kd wt)
where R is the gas constant, T is the absolute temperature, Kd mut is the equilibrium dissociation
constant for the mutant variant, Kd wt is the equilibrium dissociation constant for the wild-type
interaction.
The total change in binding free energy (∆G) for the interaction of IL-4 and IL-4BP was
calculated according to the formula:
∆G = -R*T*ln (1/Kd)
where R is the gas constant, T is the absolute temperature, Kd is the equilibrium dissociation
3.1.1 Cloning of IL-4BP and Its Variants in the Baculovirus Transfer Vector pAcGP67B
The cDNA representing the first 207 residues of mature human IL-4 receptor α chain,
extracellular domain was mutated by recombinant PCR. As a template was used the vector
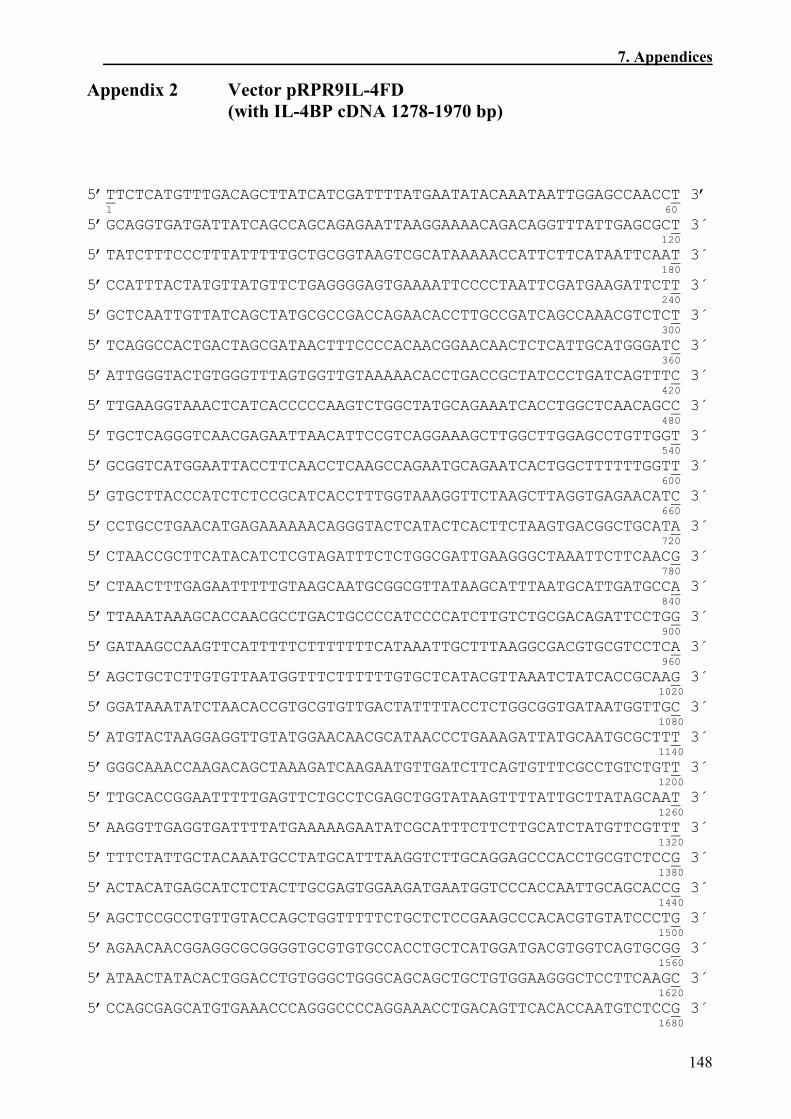
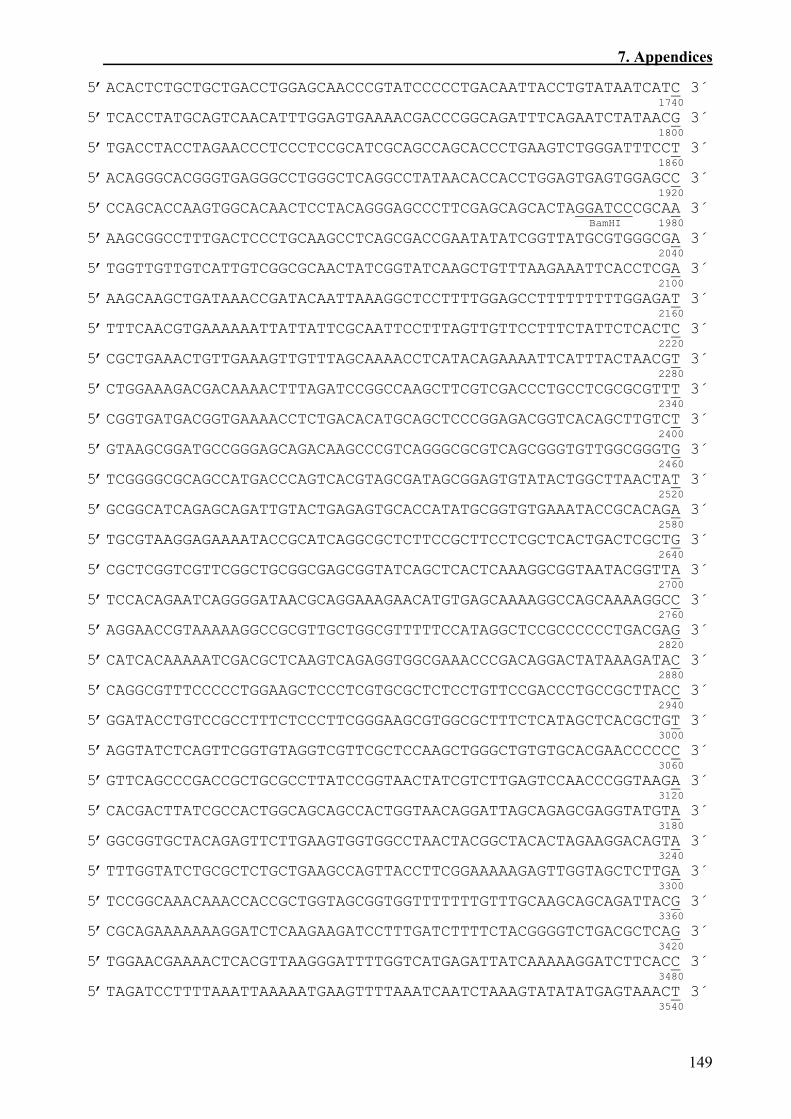
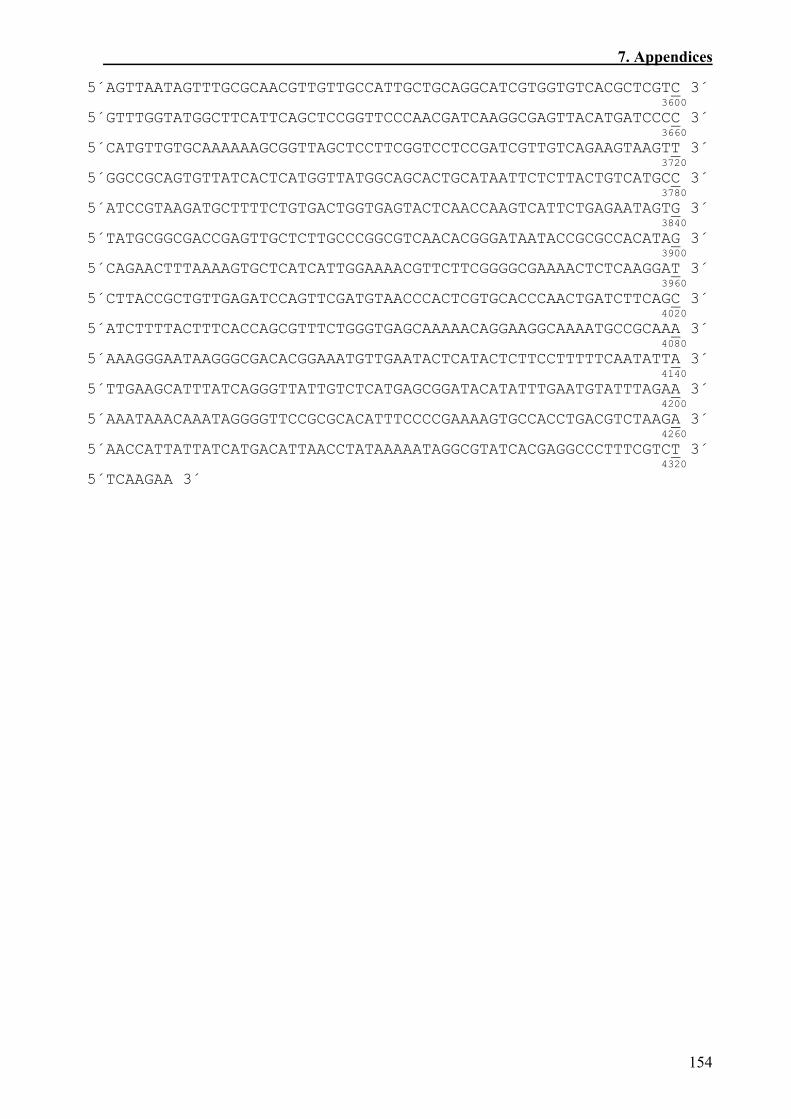
pRPR9IL4FD (C. Söder, based on vector RTSpRC109, McCarthy et al., 1985, Appendix 2). It
contains an IL-4BP cDNA modified at position C182A, in which the free cysteine is substituted
in order to prevent the formation of disulfide bridges. The complete nucleotide and amino acid
sequence of hIL-4BP is shown in Figure 3.1.
Y A F K V L Q E P T C V S D Y M S I S T 5´CTATGCATTTAAGGTCTTGCAGGAGCCCACCTGCGTCTCCGACTACATGAGCATCTCTAC 3´ 10 20 30 40 50 60
3´GATACGTAAATTCCAGAACGTCCTCGGGTGGACGCAGAGGCTGATGTACTCGTAGAGATG 5´ C E W K M N G P T N C S T E L R L L Y Q 5´TTGCGAGTGGAAGATGAATGGTCCCACCAATTGCAGCACCGAGCTCCGCCTGTTGTACCA 3´ 70 80 90 100 110 120
3´AACGCTCACCTTCTACTTACCAGGGTGGTTAACGTCGTGGCTCGAGGCGGACAACATGGT 5´ L V F L L S E A H T C I P E N N G G A G 5´GCTGGTTTTTCTGCTCTCCGAAGCCCACACGTGTATCCCTGAGAACAACGGAGGCGCGGG 3´ 130 140 150 160 170 180
3´CGACCAAAAAGACGAGAGGCTTCGGGTGTGCACATAGGGACTCTTGTTGCCTCCGCGCCC 5´ C V C H L L M D D V V S A D N Y T L D L 5´GTGCGTGTGCCACCTGCTCATGGATGACGTGGTCAGTGCGGATAACTATACACTGGACCT 3´ 190 200 210 220 230 240
3´CACGCACACGGTGGACGAGTACCTACTGCACCAGTCACGCCTATTGATATGTGACCTGGA 5´ W A G Q Q L L W K G S F K P S E H V K P 5´GTGGGCTGGGCAGCAGCTGCTGTGGAAGGGCTCCTTCAAGCCCAGCGAGCATGTGAAACC 3´ 250 260 270 280 290 300
3´CACCCGACCCGTCGTCGACGACACCTTCCCGAGGAAGTTCGGGTCGCTCGTACACTTTGG 5´ R A P G N L T V H T N V S D T L L L T W 5´CAGGGCCCCAGGAAACCTGACAGTTCACACCAATGTCTCCGACACTCTGCTGCTGACCTG 3´ 310 320 330 340 350 360
3´GTCCCGGGGTCCTTTGGACTGTCAAGTGTGGTTACAGAGGCTGTGAGACGACGACTGGAC 5´ S N P Y P P D N Y L Y N H L T Y A V N I 5´GAGCAACCCGTATCCCCCTGACAATTACCTGTATAATCATCTCACCTATGCAGTCAACAT 3´ 370 380 390 400 410 420
3´CTCGTTGGGCATAGGGGGACTGTTAATGGACATATTAGTAGAGTGGATACGTCAGTTGTA 5´ W S E N D P A D F R I Y N V T Y L E P S 5´TTGGAGTGAAAACGACCCGGCAGATTTCAGAATCTATAACGTGACCTACCTAGAACCCTC 3´ 430 440 450 460 470 480
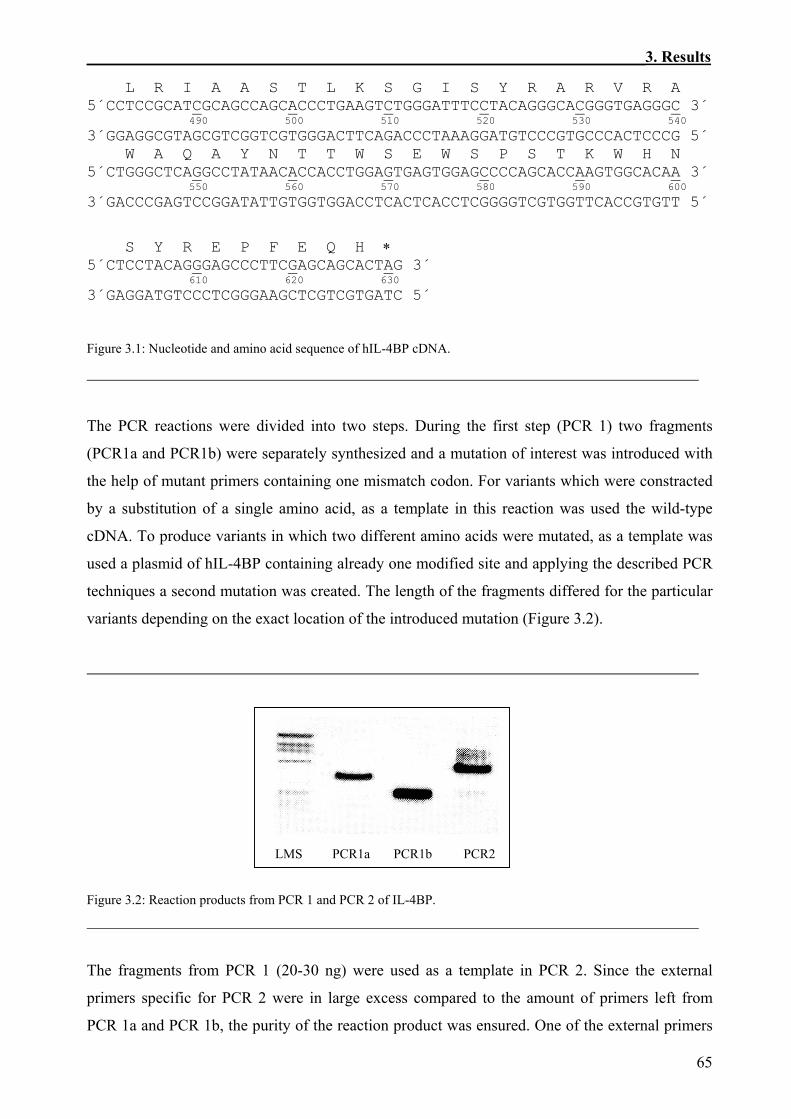
L R I A A S T L K S G I S Y R A R V R A 5´CCTCCGCATCGCAGCCAGCACCCTGAAGTCTGGGATTTCCTACAGGGCACGGGTGAGGGC 3´ 490 500 510 520 530 540
3´GGAGGCGTAGCGTCGGTCGTGGGACTTCAGACCCTAAAGGATGTCCCGTGCCCACTCCCG 5´ W A Q A Y N T T W S E W S P S T K W H N 5´CTGGGCTCAGGCCTATAACACCACCTGGAGTGAGTGGAGCCCCAGCACCAAGTGGCACAA 3´ 550 560 570 580 590 600
3´GACCCGAGTCCGGATATTGTGGTGGACCTCACTCACCTCGGGGTCGTGGTTCACCGTGTT 5´ S Y R E P F E Q H ∗ 5´CTCCTACAGGGAGCCCTTCGAGCAGCACTAG 3´ 610 620 630
3´GAGGATGTCCCTCGGGAAGCTCGTCGTGATC 5´ Figure 3.1: Nucleotide and amino acid sequence of hIL-4BP cDNA.
The PCR reactions were divided into two steps. During the first step (PCR 1) two fragments
(PCR1a and PCR1b) were separately synthesized and a mutation of interest was introduced with
the help of mutant primers containing one mismatch codon. For variants which were constracted
by a substitution of a single amino acid, as a template in this reaction was used the wild-type
cDNA. To produce variants in which two different amino acids were mutated, as a template was
used a plasmid of hIL-4BP containing already one modified site and applying the described PCR
techniques a second mutation was created. The length of the fragments differed for the particular
variants depending on the exact location of the introduced mutation (Figure 3.2).
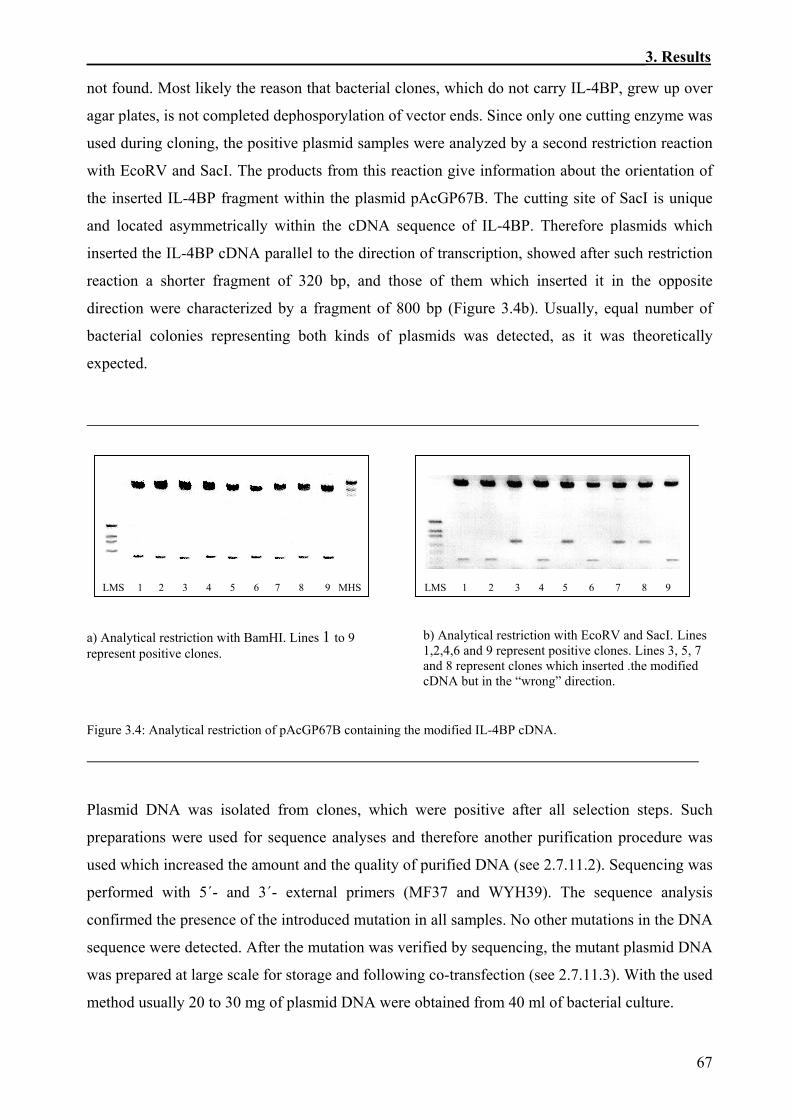
LMS PCR1a PCR1b PCR2 Figure 3.2: Reaction products from PCR 1 and PCR 2 of IL-4BP.
The fragments from PCR 1 (20-30 ng) were used as a template in PCR 2. Since the external
primers specific for PCR 2 were in large excess compared to the amount of primers left from
PCR 1a and PCR 1b, the purity of the reaction product was ensured. One of the external primers
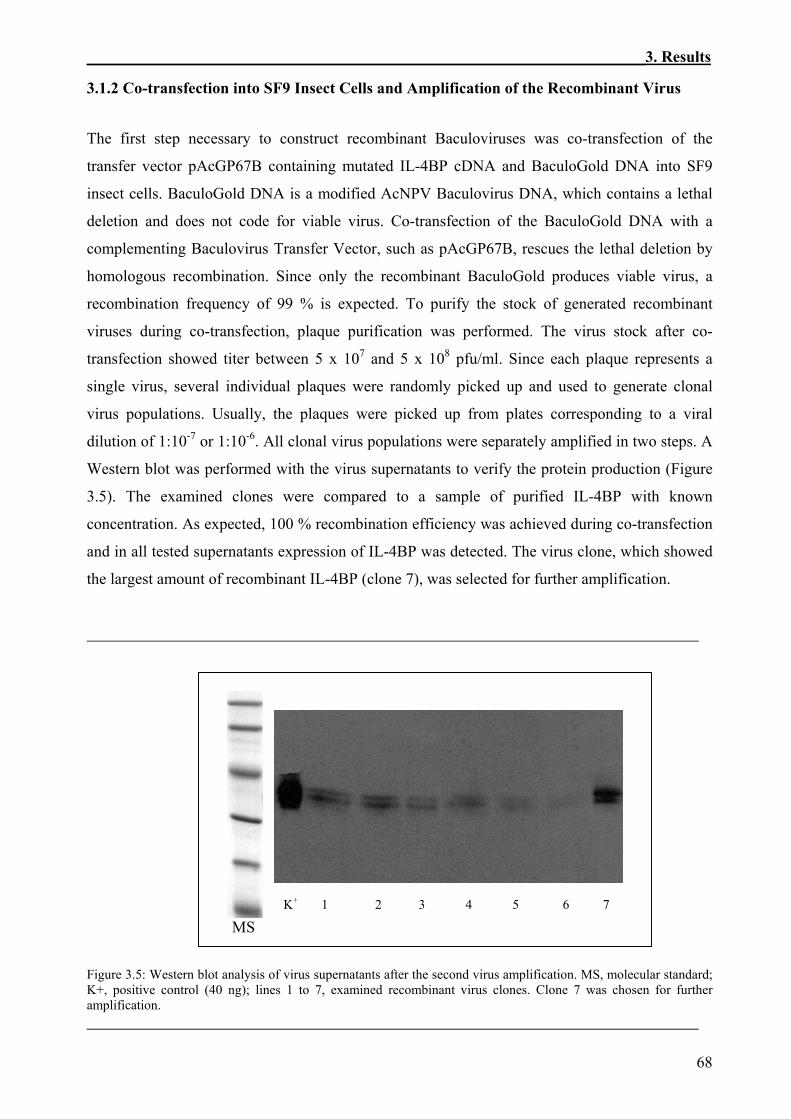
not found. Most likely the reason that bacterial clones, which do not carry IL-4BP, grew up over
agar plates, is not completed dephosporylation of vector ends. Since only one cutting enzyme was
used during cloning, the positive plasmid samples were analyzed by a second restriction reaction
with EcoRV and SacI. The products from this reaction give information about the orientation of
the inserted IL-4BP fragment within the plasmid pAcGP67B. The cutting site of SacI is unique
and located asymmetrically within the cDNA sequence of IL-4BP. Therefore plasmids which
inserted the IL-4BP cDNA parallel to the direction of transcription, showed after such restriction
reaction a shorter fragment of 320 bp, and those of them which inserted it in the opposite
direction were characterized by a fragment of 800 bp (Figure 3.4b). Usually, equal number of
bacterial colonies representing both kinds of plasmids was detected, as it was theoretically
expected.
LMS 1 2 3 4 5 6 7 8 9 MHS LMS 1 2 3 4 5 6 7 8 9
a) Analytical restriction with BamHI. Lines 1 to 9 represent positive clones.
b) Analytical restriction with EcoRV and SacI. Lines 1,2,4,6 and 9 represent positive clones. Lines 3, 5, 7 and 8 represent clones which inserted .the modified cDNA but in the “wrong” direction.
Figure 3.4: Analytical restriction of pAcGP67B containing the modified IL-4BP cDNA.
Plasmid DNA was isolated from clones, which were positive after all selection steps. Such
preparations were used for sequence analyses and therefore another purification procedure was
used which increased the amount and the quality of purified DNA (see 2.7.11.2). Sequencing was
performed with 5´- and 3´- external primers (MF37 and WYH39). The sequence analysis
confirmed the presence of the introduced mutation in all samples. No other mutations in the DNA
sequence were detected. After the mutation was verified by sequencing, the mutant plasmid DNA
was prepared at large scale for storage and following co-transfection (see 2.7.11.3). With the used
method usually 20 to 30 mg of plasmid DNA were obtained from 40 ml of bacterial culture.
3.1.2 Co-transfection into SF9 Insect Cells and Amplification of the Recombinant Virus The first step necessary to construct recombinant Baculoviruses was co-transfection of the
transfer vector pAcGP67B containing mutated IL-4BP cDNA and BaculoGold DNA into SF9
insect cells. BaculoGold DNA is a modified AcNPV Baculovirus DNA, which contains a lethal
deletion and does not code for viable virus. Co-transfection of the BaculoGold DNA with a
complementing Baculovirus Transfer Vector, such as pAcGP67B, rescues the lethal deletion by
homologous recombination. Since only the recombinant BaculoGold produces viable virus, a
recombination frequency of 99 % is expected. To purify the stock of generated recombinant
viruses during co-transfection, plaque purification was performed. The virus stock after co-
transfection showed titer between 5 x 10⁷ and 5 x 10⁸ pfu/ml. Since each plaque represents a
single virus, several individual plaques were randomly picked up and used to generate clonal
virus populations. Usually, the plaques were picked up from plates corresponding to a viral
dilution of 1:10-7 or 1:10-6. All clonal virus populations were separately amplified in two steps. A
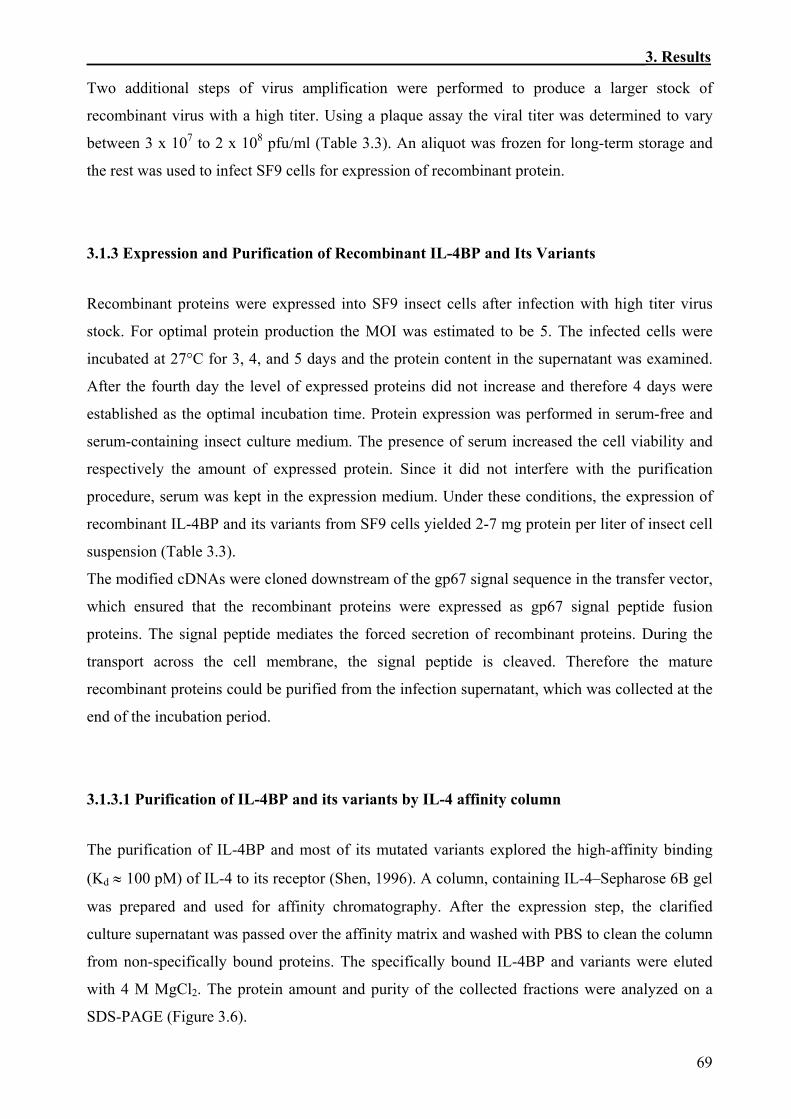
Western blot was performed with the virus supernatants to verify the protein production (Figure
3.5). The examined clones were compared to a sample of purified IL-4BP with known
concentration. As expected, 100 % recombination efficiency was achieved during co-transfection
and in all tested supernatants expression of IL-4BP was detected. The virus clone, which showed
the largest amount of recombinant IL-4BP (clone 7), was selected for further amplification.
MS K+ 1 2 3 4 5 6 7
Figure 3.5: Western blot analysis of virus supernatants after the second virus amplification. MS, molecular standard; K+, positive control (40 ng); lines 1 to 7, examined recombinant virus clones. Clone 7 was chosen for further amplification.
Two additional steps of virus amplification were performed to produce a larger stock of
recombinant virus with a high titer. Using a plaque assay the viral titer was determined to vary
between 3 x 10⁷ to 2 x 10⁸ pfu/ml (Table 3.3). An aliquot was frozen for long-term storage and
the rest was used to infect SF9 cells for expression of recombinant protein.
3.1.3 Expression and Purification of Recombinant IL-4BP and Its Variants Recombinant proteins were expressed into SF9 insect cells after infection with high titer virus
stock. For optimal protein production the MOI was estimated to be 5. The infected cells were
incubated at 27°C for 3, 4, and 5 days and the protein content in the supernatant was examined.
After the fourth day the level of expressed proteins did not increase and therefore 4 days were
established as the optimal incubation time. Protein expression was performed in serum-free and
serum-containing insect culture medium. The presence of serum increased the cell viability and
respectively the amount of expressed protein. Since it did not interfere with the purification
procedure, serum was kept in the expression medium. Under these conditions, the expression of
recombinant IL-4BP and its variants from SF9 cells yielded 2-7 mg protein per liter of insect cell
suspension (Table 3.3).
The modified cDNAs were cloned downstream of the gp67 signal sequence in the transfer vector,
which ensured that the recombinant proteins were expressed as gp67 signal peptide fusion
proteins. The signal peptide mediates the forced secretion of recombinant proteins. During the
transport across the cell membrane, the signal peptide is cleaved. Therefore the mature
recombinant proteins could be purified from the infection supernatant, which was collected at the
end of the incubation period.
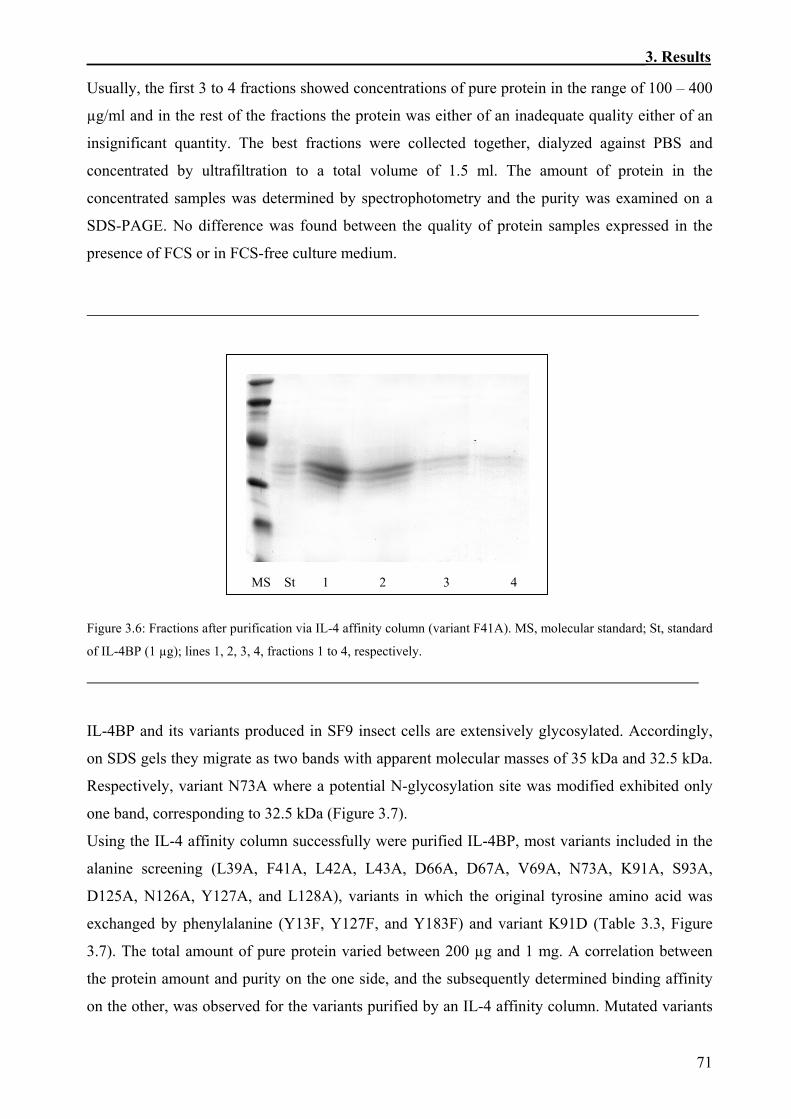
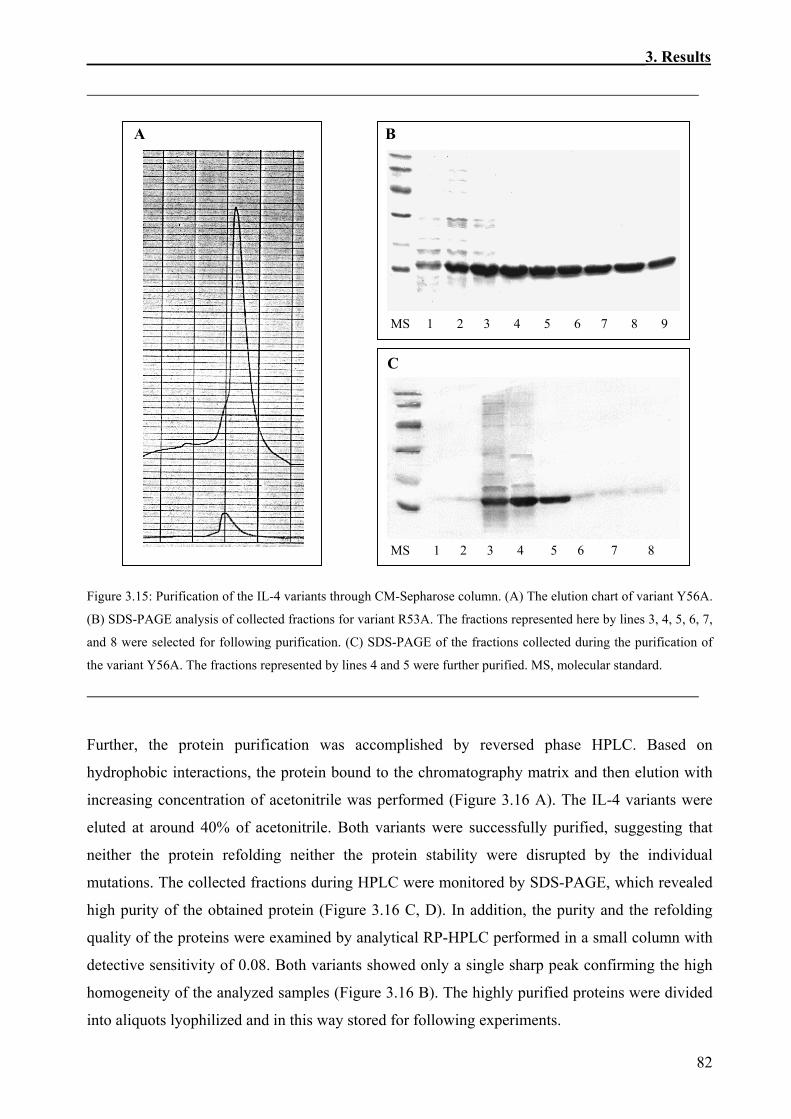
3.1.3.1 Purification of IL-4BP and its variants by IL-4 affinity column The purification of IL-4BP and most of its mutated variants explored the high-affinity binding
(Kd ≈ 100 pM) of IL-4 to its receptor (Shen, 1996). A column, containing IL-4–Sepharose 6B gel
was prepared and used for affinity chromatography. After the expression step, the clarified
culture supernatant was passed over the affinity matrix and washed with PBS to clean the column
from non-specifically bound proteins. The specifically bound IL-4BP and variants were eluted
with 4 M MgCl2. The protein amount and purity of the collected fractions were analyzed on a
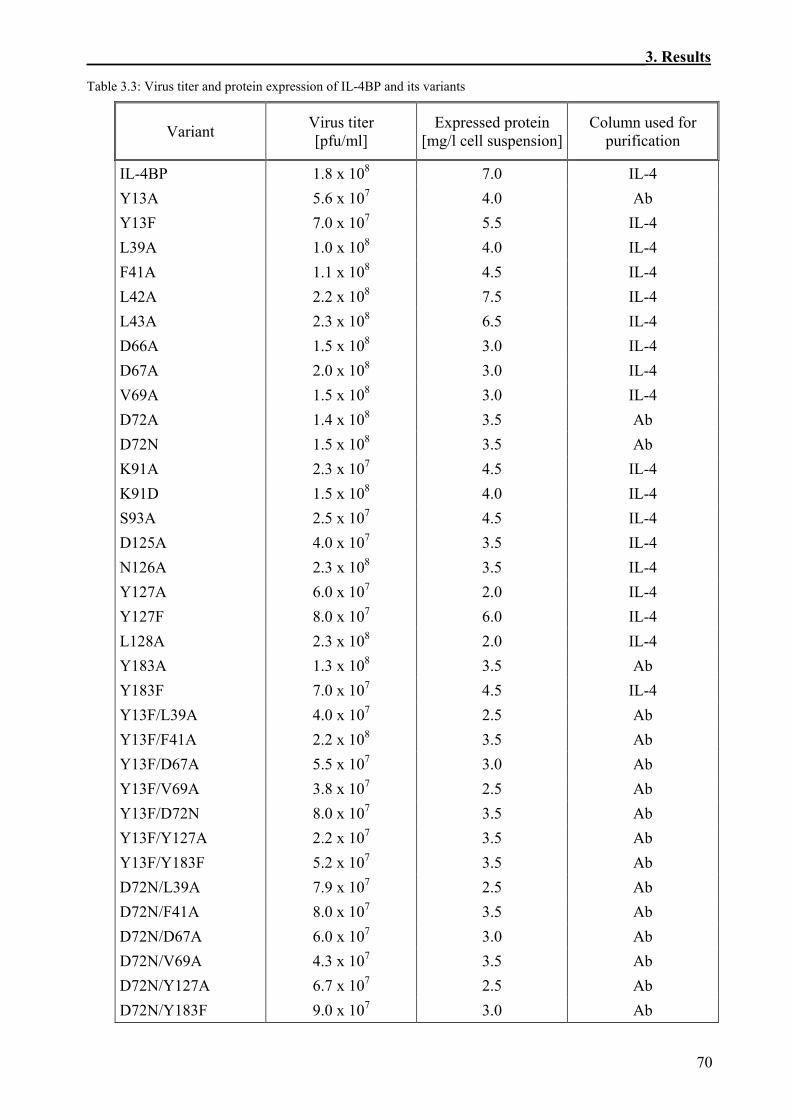
Table 3.3: Virus titer and protein expression of IL-4BP and its variants
Virus titer [pfu/ml]
Expressed protein Column used for purification Variant [mg/l cell suspension]
IL-4BP 1.8 x 10 8 7.0 IL-4 Y13A 5.6 x 10 7 4.0 Ab Y13F 7.0 x 10 7 5.5 IL-4 L39A 1.0 x 10 8 4.0 IL-4 F41A 1.1 x 10 8 4.5 IL-4 L42A 2.2 x 10 8 7.5 IL-4 L43A 2.3 x 10 8 6.5 IL-4 D66A 1.5 x 10 8 3.0 IL-4 D67A 2.0 x 10 8 3.0 IL-4 V69A 1.5 x 10 8 3.0 IL-4 D72A 1.4 x 10 8 3.5 Ab D72N 1.5 x 10 8 3.5 Ab K91A 2.3 x 10 7 4.5 IL-4 K91D 1.5 x 10 8 4.0 IL-4 S93A 2.5 x 10 7 4.5 IL-4 D125A 4.0 x 10 7 3.5 IL-4 N126A 2.3 x 10⁸ 3.5 IL-4 Y127A 6.0 x 10⁷ 2.0 IL-4 Y127F 8.0 x 10⁷ 6.0 IL-4 L128A 2.3 x 10⁸ 2.0 IL-4 Y183A 1.3 x 10⁸ 3.5 Ab Y183F 7 4.5 IL-4 Y13F/L39A 4.0 x 10⁷ 2.5 Ab Y13F/F41A 2.2 x 10⁸ 3.5 Ab Y13F/D67A 5.5 x 10⁷ 3.0 Ab Y13F/V69A 3.8 x 10⁷ 2.5 Ab Y13F/D72N 8.0 x 10⁷ 3.5 Ab Y13F/Y127A 2.2 x 10⁷ 3.5 Ab Y13F/Y183F 5.2 x 10⁷ 3.5 Ab D72N/L39A 7.9 x 10⁷ 2.5 Ab D72N/F41A 8.0 x 10⁷ 3.5 Ab D72N/D67A 6.0 x 10⁷ 3.0 Ab D72N/V69A 4.3 x 10⁷ 3.5 Ab D72N/Y127A 6.7 x 10⁷ 2.5 Ab D72N/Y183F 9.0 x 10⁷ 3.0 Ab
that migrated on a SDS-PAGE as IL-4BP, generally the purity was of inadequate quality. Since
the interaction between variant Y183A and IL-4 was characterized by Kd ≈ 60 nM, such a
constant value seems to settle the affinity limits for purification of IL-4BP variants by the IL-4
affinity column.
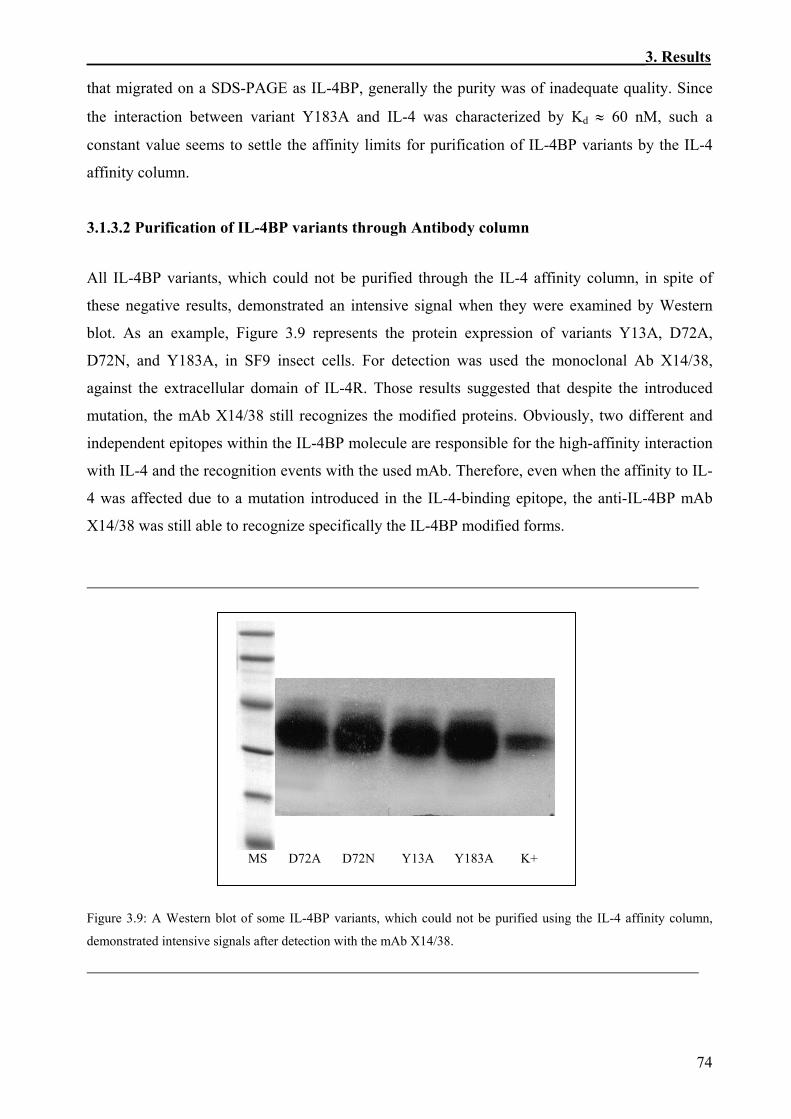
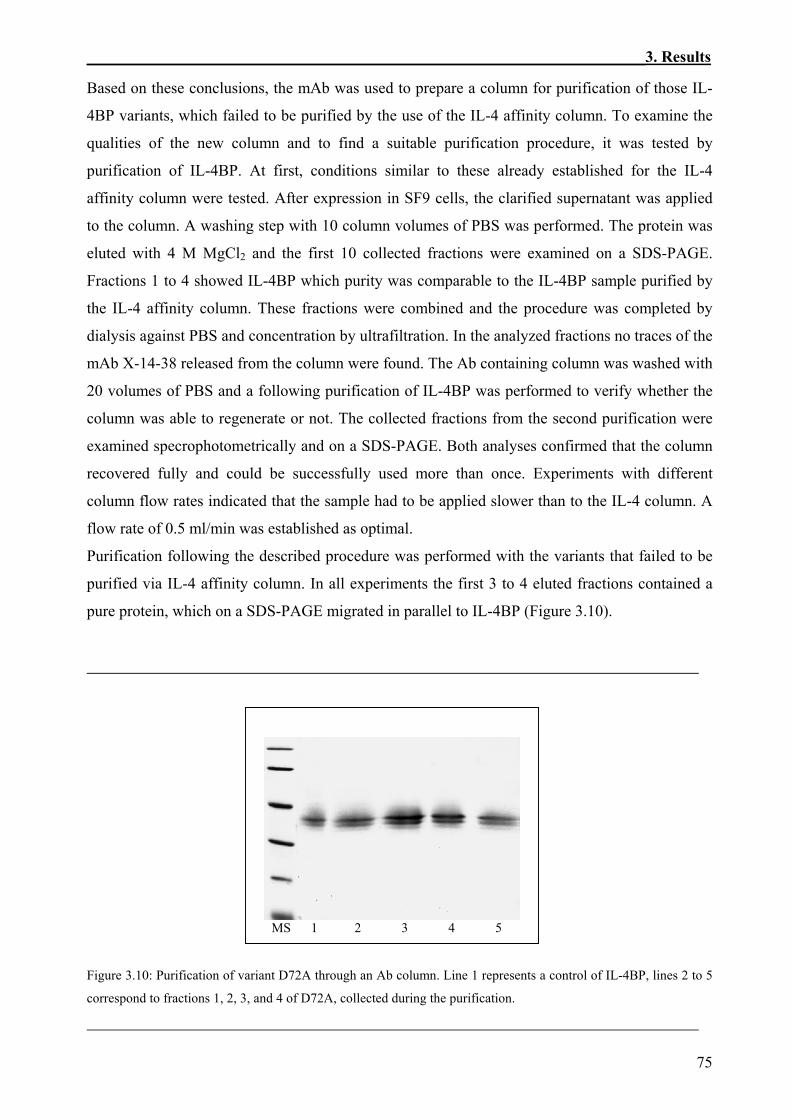
3.1.3.2 Purification of IL-4BP variants through Antibody column All IL-4BP variants, which could not be purified through the IL-4 affinity column, in spite of
these negative results, demonstrated an intensive signal when they were examined by Western
blot. As an example, Figure 3.9 represents the protein expression of variants Y13A, D72A,
D72N, and Y183A, in SF9 insect cells. For detection was used the monoclonal Ab X14/38,
against the extracellular domain of IL-4R. Those results suggested that despite the introduced
mutation, the mAb X14/38 still recognizes the modified proteins. Obviously, two different and
independent epitopes within the IL-4BP molecule are responsible for the high-affinity interaction
with IL-4 and the recognition events with the used mAb. Therefore, even when the affinity to IL-
4 was affected due to a mutation introduced in the IL-4-binding epitope, the anti-IL-4BP mAb
X14/38 was still able to recognize specifically the IL-4BP modified forms.
MS D72A D72N Y13A Y183A K+ Figure 3.9: A Western blot of some IL-4BP variants, which could not be purified using the IL-4 affinity column,
demonstrated intensive signals after detection with the mAb X14/38.
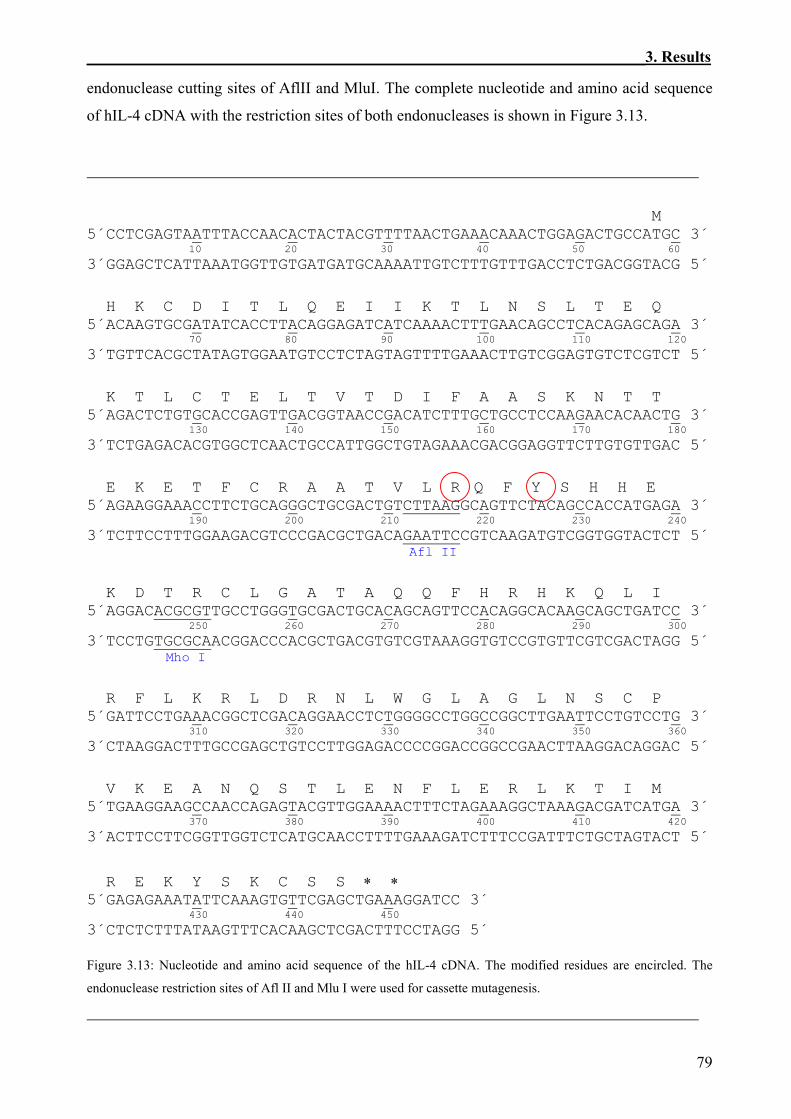
endonuclease cutting sites of AflII and MluI. The complete nucleotide and amino acid sequence
of hIL-4 cDNA with the restriction sites of both endonucleases is shown in Figure 3.13.
M 5´CCTCGAGTAATTTACCAACACTACTACGTTTTAACTGAAACAAACTGGAGACTGCCATGC 3´ 10 20 30 40 50 60
3´GGAGCTCATTAAATGGTTGTGATGATGCAAAATTGTCTTTGTTTGACCTCTGACGGTACG 5´ H K C D I T L Q E I I K T L N S L T E Q 5´ACAAGTGCGATATCACCTTACAGGAGATCATCAAAACTTTGAACAGCCTCACAGAGCAGA 3´ 70 80 90 100 110 120
3´TGTTCACGCTATAGTGGAATGTCCTCTAGTAGTTTTGAAACTTGTCGGAGTGTCTCGTCT 5´ K T L C T E L T V T D I F A A S K N T T 5´AGACTCTGTGCACCGAGTTGACGGTAACCGACATCTTTGCTGCCTCCAAGAACACAACTG 3´ 130 140 150 160 170 180
3´TCTGAGACACGTGGCTCAACTGCCATTGGCTGTAGAAACGACGGAGGTTCTTGTGTTGAC 5´ E K E T F C R A A T V L R Q F Y S H H E 5´AGAAGGAAACCTTCTGCAGGGCTGCGACTGTCTTAAGGCAGTTCTACAGCCACCATGAGA 3´ 190 200 210 220 230 240
3´TCTTCCTTTGGAAGACGTCCCGACGCTGACAGAATTCCGTCAAGATGTCGGTGGTACTCT 5´ Afl II
K D T R C L G A T A Q Q F H R H K Q L I 5´AGGACACGCGTTGCCTGGGTGCGACTGCACAGCAGTTCCACAGGCACAAGCAGCTGATCC 3´ 250 260 270 280 290 300
3´TCCTGTGCGCAACGGACCCACGCTGACGTGTCGTAAAGGTGTCCGTGTTCGTCGACTAGG 5´ Mho I
R F L K R L D R N L W G L A G L N S C P 5´GATTCCTGAAACGGCTCGACAGGAACCTCTGGGGCCTGGCCGGCTTGAATTCCTGTCCTG 3´ 310 320 330 340 350 360
3´CTAAGGACTTTGCCGAGCTGTCCTTGGAGACCCCGGACCGGCCGAACTTAAGGACAGGAC 5´ V K E A N Q S T L E N F L E R L K T I M 5´TGAAGGAAGCCAACCAGAGTACGTTGGAAAACTTTCTAGAAAGGCTAAAGACGATCATGA 3´ 370 380 390 400 410 420
3´ACTTCCTTCGGTTGGTCTCATGCAACCTTTTGAAAGATCTTTCCGATTTCTGCTAGTACT 5´ R E K Y S K C S S ∗ ∗ 5´GAGAGAAATATTCAAAGTGTTCGAGCTGAAAGGATCC 3´ 430 440 450
3´CTCTCTTTATAAGTTTCACAAGCTCGACTTTCCTAGG 5´ Figure 3.13: Nucleotide and amino acid sequence of the hIL-4 cDNA. The modified residues are encircled. The
endonuclease restriction sites of Afl II and Mlu I were used for cassette mutagenesis.
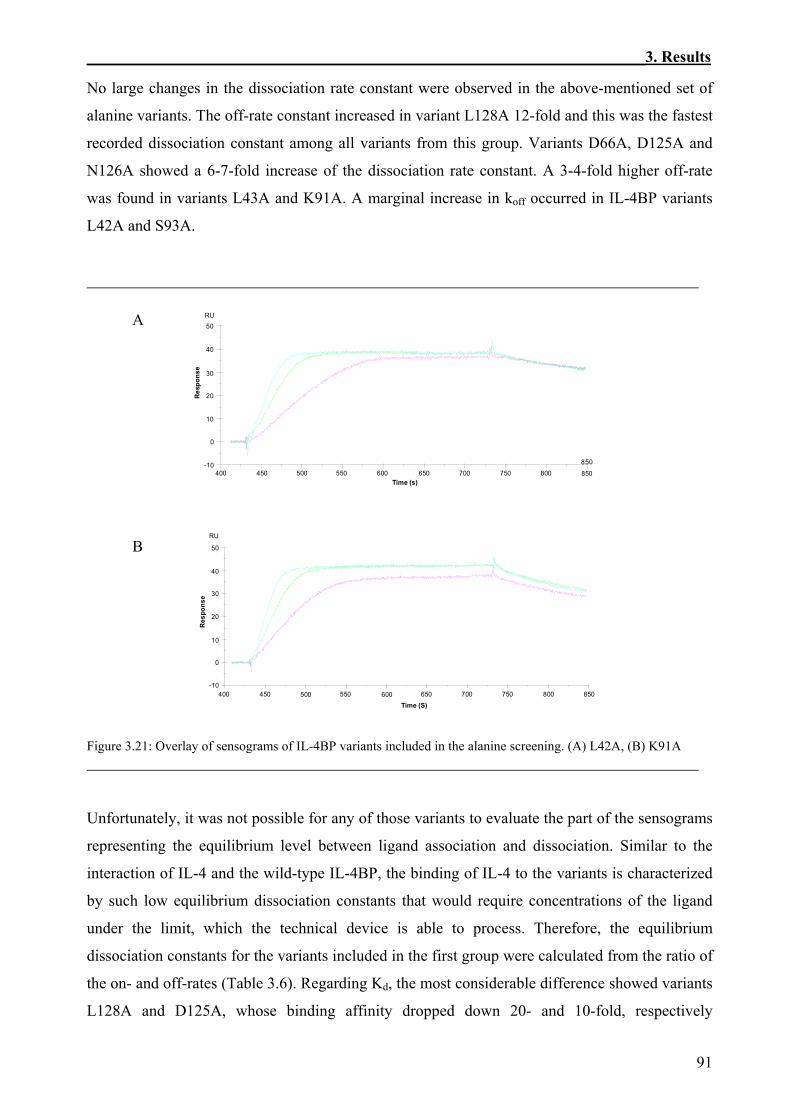
3.3 Kinetic Analysis of the Interaction of IL-4 with the IL-4BP Variants Using BIAcore Technology
The purified IL-4BP and its variants were used in a biomolecular examination to determine both,
the kinetic and equilibrium binding constants characterizing the interaction with the ligand. This
comprehensive analysis was carried out to assess the roles of the mutated side chains in
modulating the affinity and kinetics of binding.
A biosensor technology that relies upon surface plasmon resonance to measure changes in
refractive index upon ligand binding to an immobilized receptor was explored to record binding
curves and to evaluate the kinetic parameters of the interaction. The evaluation methods are
described in 2.13.2.
3.3.1 Immobilization of the Biotinylated IL-4BP and its Variants on the Sensor Chips Among the several available immobilization techniques, the amine coupling and streptavidin-
biotin coupling had been chosen to immobilize IL-4BP and its mutated variants on sensor chips.
Earlier experiments have proven that this method offered a higher ligand binding capacity of the
chip, considering the certain amount of immobilized receptors (Shen et al., 1996). The reason for
this seems to be the nonspecific nature of the amine coupling technique and stereo obstacle,
which gives rise to association perturbation of IL-4 to IL-4BP. Therefore the streptavidin-biotin
coupling was used as a standard immobilization method in this study.
First, the four cells of a sensor chip CM5 were coated with streptavidin employing the amine
coupling procedure as described in 2.13.1 (Figure 3.17). Thereafter, the matrix of flow cells 2, 3
and 4 was loaded separately with different IL-4BP variants, which earlier were randomly
biotinylated (Figure 3.18). No receptor was loaded onto flow cell 1. It was used to record a
background sensogram that was subtracted during the evaluation from the sample sensograms in
flow cells 2, 3 and 4.
Experimental conditions connected with different density of the immobilized receptor were
tested. Usually, in the beginning the variants were loaded on the chip with a density of
approximately 150 RU. Since the streptavidin-biotin interaction has an extremely high affinity
(~1015 M-1) (BIAcore Handbook, 1995) the chips could be repeatedly regenerated and the amount
of the immobilized receptor could be increased. For low affinity variants more receptor was
added to the chip until a density of 200, 400 or 500 RU was reached (Table 3.5).
Figure 3.17: Sensogram showing the immobilization of streptavidin on a sensor chip CM5 by using standard amine coupling. (1) Baseline signal for the unmodified sensor chip treated with continuous flow buffer HBS (5 µl/min). (2) Injection of 35 µl of NHS/EDC for 7 min. to activate the dextran matrix. (3) 7 min. injection of 35 µl of streptavidin (50 µg/ml). (4) Injection of 35 µl of ethanolamine hydrochloride (1 M) to deactivate the matrix and remove non-covalently bound streptavidin.
Time [S]
400 450350300250200150100500
RU
Res
pons
e
15600
15650
15700
15750
15800
15850
15900
Figure 3.18: Immobilization of an IL-4BP variant on a streptavidin chip. The protein was manually injected into the chip and the injection was stopped at 200 RU.
Table 3.5: Amount of the immobilized receptor at the biosensor matrix for IL-4BP and the different variants
Receptor variant Immobilized protein [g] [M] Rel. Resp. [RU]IL-4BP 4.0 x 10⁻¹⁰ 6.6 x 10⁻¹¹ 79 Y13A 5.4 x 10⁻⁹ 3.3 x 10⁻¹⁰ 243 Y13F 2.8 x 10⁻¹⁰ 6.7 x 10⁻¹¹ 89 L39A 2.8 x 10⁻¹⁰ 6.7 x 10⁻¹¹ 103 F41A 6.4 x 10⁻¹⁰ 6.7 x 10⁻¹¹ 151 L42A 5.6 x 10⁻¹⁰ 6.7 x 10⁻¹¹ 151 L43A 7.4 x 10⁻¹⁰ 6.7 x 10⁻¹¹ 148 D66A 7.0 x 10⁻¹⁰ 1.6 x 10⁻¹⁰ 163 D67A 6.7 x 10⁻¹⁰ 1.1 x 10⁻¹⁰ 157 V69A 3.4 x 10⁻⁹ 3.3 x 10⁻¹⁰ 503 D72A 6.4 x 10⁻¹⁰ 1.8 x 10⁻¹⁰ 225 D72N 6.1 x 10⁻¹⁰ 1.7 x 10⁻¹⁰ 223 K91A 5.6 x 10⁻¹⁰ 6.6 x 10⁻¹¹ 154 K91D 1.6 x 10⁻⁹ 6.6 x 10⁻¹¹ 145 S93A 8.4 x 10⁻¹⁰ 6.6 x 10⁻¹¹ 152 D125A 5.6 x 10⁻¹⁰ 6.6 x 10⁻¹¹ 152 N126A 7.0 x 10⁻¹⁰ 1.7 x 10⁻¹⁰ 156 Y127A 2.3 x 10⁻⁹ 2.9 x 10⁻¹⁰ 505 Y127F 2.4 x 10⁻¹⁰ 6.6 x 10⁻¹¹ 102 L128A 4.0 x 10⁻¹⁰ 1.7 x 10⁻¹⁰ 154 Y183A 9.4 x 10⁻¹⁰ 6.7 x 10⁻¹¹ 152 Y183F 3.6 x 10⁻¹⁰ 6.6 x 10⁻¹¹ 94 Y13F/L39A 2.0 x 10⁻¹⁰ 3.3 x 10⁻¹⁰ 128 Y13F/F41A 7.0 x 10⁻¹⁰ 2.6 x 10⁻¹⁰ 97 Y13F/D67A 4.0 x 10⁻¹⁰ 3.3 x 10⁻¹⁰ 136 Y13F/V69A 7.0 x 10⁻¹⁰ 1.7 x 10⁻¹⁰ 216 Y13F/D72N 8.0 x 10⁻⁹ 1.3 x 10⁻¹⁰ 423 Y13F/Y127A 6.0 x 10⁻¹⁰ 1.8 x 10⁻¹⁰ 225 Y13F/Y183F 7.0 x 10⁻¹⁰ 1.9 x 10⁻¹⁰ 248 D72N/L39A 1.0 x 10⁻⁹ 1.7 x 10⁻¹⁰ 417 D72N/F41A 1.1 x 10⁻⁹ 1.7 x 10⁻¹⁰ 400 D72N/D67A 1.3 x 10⁻⁹ 1.7 x 10⁻¹⁰ 394 D72N/V69A 1.1 x 10⁻⁹ 1.7 x 10⁻¹⁰ 413 D72N/Y127A 1.2 x 10⁻⁹ 1.7 x 10⁻¹⁰ 410 D72N/Y183F 9.5 x 10⁻⁹ 1.8 x 10⁻¹⁰ 407
3.3.3 Effects of Site-Specific Perturbations in IL-4BP on the Interaction with IL-4 Initially, the amino acids from IL-4BP which were submitted to site-directed mutagenesis, were
selected using the structural alignment between the receptor sequences including human and
mouse IL-4BP, hGHbp (human growth hormone- binding protein), human and mouse IL-2β and
γc (Bamborough et al., 1994). Furthermore, the set of amino acids of interest was extended based
on the results obtained from the crystal structure of the complex between IL-4 and IL-4BP (Hage
et al., 1999). With the purpose of establishing the structure-function correlation, as targets for
mutagenesis were identified residues involved in polar and hydrophobic interactions in the
complex. Basically, all amino acids of interest were included in an alanine scanning mutational
analysis. In order to define the results from the alanine scan more accurately, it was necessary to
replace additionally a few tyrosine residues, involved in potentially important contacts with the
ligand, by phenylalanine.
3.3.3.1 Kinetics of the binding of IL-4 to the alanine variants of IL-4BP The rationale behind alanine scanning mutagenesis is that all interactions of a side chain except
for the Cβ are eliminated (Lau & Fersht, 1987; Cunningham & Wells, 1989). This strategy
assumes that the alanine substitution eliminates interaction without introducing new properties.
The contribution of the deleted groups relative to the alanine residue is assessed from the
difference between the properties of the wild-type relative to the alanine mutant. Free energies of
binding are used to quantify the effect of the alanine substitution at any given site (Di Cera,
1998).
To assess the effect of the introduced mutation on the binding of IL-4 to the IL-4BP, every single
variant was immobilized to a sensor chip as mentioned above (Table 3.5). Sensograms recorded
at different concentrations of IL-4 were evaluated for the kinetic constants (Table 3.6). Based on
the results from the BIAcore measurements the alanine variants assessed in the frame of this
study could be classified into 3 main groups, according to the extent to which the mutation affects
the functional properties of the IL-4BP molecule.
1. Variants L42A, L43A, D66A, K91A, S93A, D125A, N126A, and L128A showed a pattern of
binding very similar to this observed during the interaction of IL-4 and the wild-type IL-4BP. As
the sensograms revealed (Figure 3.21 - A and B), these variants rapidly associate when perfusion
with IL-4 is committed and slowly dissociate when it is changed to perfusion with buffer alone.
IL-4 was applied in concentrations of 2.5, 5 and 7.5 nM. Under such conditions it was possible to
compared to the wild-type. The effect is due to the relatively high ratios of koff, which were
recorded for both mutant forms. Marginal increases in Kd, 2 to 7-fold, were observed for variants
L43A, D66A, K91A, and N126A. The equilibrium dissociation constant of variants L42A and
S93A was almost not altered in comparison to the wild-type receptor (Table 3.7).
A B
520515510505500495490485480475Time (s)
3333.634.234.835.4
3636.637.237.838.4
39
RU
Res
pons
e
75275074874674474274073836.6
37
37.4
37.8
38.2
38.6
RU
Res
pons
e
Time (s)
C D
748746744742740738736Time (s)
39.539.840.140.440.7
4141.341.641.942.242.5
RU
Res
pons
e
525521517513509505501497493489485Time (s)
3535.736.4
37.837.1
38.539.239.940.641.3
42
RU
Res
pons
e
Figure 3.22: Plots representing the association (A, C) and the dissociation (B, D) phase of variants with high affinity to IL-4. (A) and (B), L42A; (C) and (D), K91A.
Based on the models of the complex between IL-4 and IL-4BP, K91 was suggested to stabilize
this complex by forming an ion pair with the IL-4 residue E9 (Bamborough et al., 1994).
Therefore, K91 was a residue of particular interest, and additionally to the alanine substitution it
was subjected to a charge conversion. The positive charge was exchanged with negative by
replacing the original lysine residue with aspartic acid. Although a dramatic effect was expected,
structural perturbations due to the alanine substitution. Such effects would be rather structural
than functional. This does not seem to be the case for D72, since the variant D72N, which struct-
Y129
N126
Y13
L39F41
L42
D72
Y183
D67V69
Y127
Y74
D125L128
V68
P92
L43
D66
N73
K91
S93
M14S15
S70E94
∆∆G (kcal/mol)
>4.02.5 to 3.51.0 to 2.10.5 to 1.00 to 0.5Untested
Figure 3.27: Loss of binding free energy of residues from IL-4BP due to alanine substitution. Residues have been color-coded as indicated to denote their apparent contributions to the loss of binding free energy, as determined by alanine scanning mutagenesis. Data from a previous study have been used for residues M14, S15, V68, S70, N73, Y74, P92, E94, and Y129.
urally should be highly similar to the wild-type protein demonstrated as well a large loss of
binding free energy as D72A. However, structural consequences from the replacement of Y13
and Y183 by alanine could not be ignored.
3.3.3.3 Analysis of the binding of IL-4 to the IL-4BP tyrosine variants The three phenylalanine side chains which indicated the largest contribution to the loss of binding
free energy during the alanine scan (Y13, Y127, and Y183) were replaced by tyrosine residues.
Due to the conservative substitution, these variants were expected to be structurally very similar
to the wild-type receptor, however without properties to form hydrogen bonds. Therefore the
tyrosine variants were used to find out whether structural changes were the reason for the
significant energetic alterations in the corresponding alanine mutant forms, or the effect was
caused only because of disrupted binding contacts.
The IL-4BP variants Y13F, Y127F and Y183F were expressed in SF9 insect cells following the
described procedure (see 2.11). They were easily purified by an IL-4 affinity column, which was
the first indication that they would retain much higher affinity to IL-4 then the parallel alanine
variants. Furthermore, this expectation was confirmed by the BIAcore analyses. The sensograms
(Figure 3.28) revealed a different pattern of interaction compared to the observed within the
alanine scan. Variant Y127F showed a model of interaction very similar to the wild-type IL-4BP
(Figure 3.28 B). Although IL-4 was used in a very low concentration rate (2.5, 5, 7.5 nM), fast
association phase occurred followed by a very slow dissociation. Both the association and
dissociation constants showed values very similar to the wild-type interaction (Table 3.8). The
equilibrium dissociation constant could not be evaluated due to the high binding affinity of the
variant. The calculated Kd based on the kinetic constants is negligibly different from Kd of IL-
4BP, which corresponds to loss of binding free energy of 0.1 kcal/mol.
Table 3.8: Kinetic and thermodynamic constants characterizing the binding of IL-4 to the tyrosine variants of IL-4BP
Y13F 12 11 (1.4) 26 (2.7) 2.4 x 10⁻⁹ 3.2 x 10⁻⁹ 40 2.2
Y127F 6 16 (1.0) 1.5 (0.4) 9.3 x 10⁻¹¹ 1.2 0.1
Y183F 9 6.0 (1.0) 190 (12) 3.1 x 10⁻⁸ 2.4 x 10⁻⁸ 310 3.4
n: number of measurements; SE: Standard error; Kd (kin.): Kd calculated from kinetic data. Kd (equilib.): Kd calculated from steady state binding data. The mean standard error for this value was 4.2%. Rel. Kd: relative value of Kd.
R53A 9 8.6 (0.7) 21 (1.6) 2.5 x 10⁻⁹ 2.7 x 10⁻⁹ 36 2.1
Y56A 9 9.9 (0.8) 6.3 (0.9) 6.4 x 10⁻¹⁰ 8 1.2 n: number of measurements. SE: Standard error. Kd (kin.): Kd calculated from kinetic data. Kd (eq.): Data for Kd from equilibrium binding. The mean standard error for this value was 5 %. ∆∆G: loss in free binding energy.
4.3 Additivity and Cooperativity in the Functional Epitope of IL-4BP Additive and cooperative mutational effects between the residues from the functional IL-4BP
epitope were examined by applying double mutants. The side chains of amino acids L39, F41,
D67, V69, Y127, and Y183 were analyzed for potential intramolecular interactions with Y13 and
D72, respectively. In addition, a variant containing mutations at both sites, D72 and Y13, was
created.
Comparison of the theoretically predicted ∆∆Gadd and the estimated change of binding free
energy (Table 3.9) for variants Y13F/Y127A and Y13F/Y183F indicates that the effects between
the residues from contact cluster I are additive. This suggests not only that the sites act
functionally independent, but also that no one of the introduced mutations caused structural
perturbations. Indirectly this fact confirmed the assumption that mutation Y127A in the
corresponding single variant was not disruptive to the structure and the observed effect
represented basically the functional contribution of this residue to binding. Further, the analysis
of double mutants indicated that the hydroxyl group from the side chain of Y13 is not involved in
contacts to other residues from the cluster, but just in the interaction with IL-4. Therefore the
mutational effect demonstrated by variant Y13F (2.2 kcal/mol) should be seen as the entire
contribution of Y13 to ligand binding. The site-directed mutational analysis revealed that Y13 is
important probably for the structure of the whole cluster. Since in these double mutated forms of
the receptor Y13 was exchanged by the similar phenylalanine residue, which clearly did not
affect the structure, it seems that the aromatic ring of Y13 is a crucial structural element
supporting the conformation and the integrity of the cluster.
Independent contributions to binding were shown from the side of Y13 and the hydrophobic shell
surrounding D72, since the binding free energies of variants Y13F/L39A, Y13F/F41A, and
Y13F/V69A negligibly differ from the corresponding ∆∆Gadd values. Likewise, additivity was
established between the effects of Y13F and the binding determinant from cluster III D67. The
binding free energies characterizing the double mutants, which carry the mutations D72N/Y127A
and D72N/Y183F were very close to the values predicted by adding the energies of the single
mutants. This is a clear indication that the main functional determinant D72 behaves in a
completely independent manner from the two tyrosine residues from cluster I.
The analyses of variants D72N/L39A, D72N/F41A, and D72N/V69A suggested that the
examined sites in those double mutants are not independent in their effects. As those residues are
parts from one and the same binding cluster it is likely that they cooperate and the effects from
the individual substitutions are not additive. Further, the values of ∆∆Gadd are greater than the
estimated ∆∆G for the three variants suggesting favorable interactions between the side chains
interfaces (Shen et al., 1996; Wang et al., 1997). Accordingly, variant D67A demonstrated the
slowest association rate constant in the site-directed mutational analysis. The association phase of
D72N could not be examined. In addition, alanine substitutions of the hydrophobic side chains
surrounding D72 in cluster II revealed small but systematic reduction of the on-rate for L39, F41,
and V69, suggesting that perhaps the entire cluster is recognized early in association. The third
charged residue within the functional epitope of IL-4BP (D125) did not indicate significant effect
on the association. It is likely that the charges of D72 and D67 are critical for the initiation of
electrostatic steering between receptor and ligand and therefore their simultaneous loss in variant
D72N/D67A results in such low electrostatic potential in the receptor that is under the point,
which allows the complex formation. This suggestion is in agreement with the mechanism of
association proposed for the complex of hGH and its receptor (Cunningham & Wells, 1993).
Accordingly, the association is a multi-step process that starts with the formation of an initial
weak complex, which undergoes further desolvation and cooperative rearrangement.
Not all amino acids from IL-4BP examined by site-directed mutagenesis were included in the
analysis of double mutants and therefore perhaps not all cases of cooperativity were identified.
However, cooperative effects clearly were demonstrated to take part at least between amino acids
within contact cluster II. This fact gives to some degree an explanation for the high cumulative
loss of binding free energy, which was calculated according to the contribution of alanine
variants.
4.4 Comparison of the Structural and the Functional IL-4BP Epitopes Generally, the functional epitope of IL-4BP defined by mutational analyses is in a good
agreement with the structural data. Similarly to the structural epitope, the functional important
residues of IL-4BP are assembled in three differentiated clusters. The crystal structure of the IL-
4/IL-4BP complex proposed that the clusters are independent, but did not exclude the possibility
that cooperative interactions take place in the same contact cluster (Hage et al., 1999).
Respectively, the present analysis did not show a clear indication for interactions between the
defined clusters. Furthermore, cooperativity was demonstrated to occur between side chains
within one and the same cluster.
The structure revealed that 835 Å2 of the receptor surface area are buried upon complex
formation (Hage et al., 1999). This indicates that the high-affinity interaction between IL-4 and
IL-4BP is generated from a relatively small contact area and that its size is not directly connected
to binding affinity. Accordingly, amino acids localized out of the structural epitope did not appear
to have significant effects on binding affinity when they were mutated. Although segregation in
the contribution of the examined residues present in the structural epitope of IL-4BP was
observed, nearly all of them showed considerable effect on binding. Thus, the modest size of the
IL-4BP structural epitope determines a corresponding functional epitope, which has a similar
size.
The structure of contact clusters I and II was compared to an “avocado fruit” and was suggested
to be highly relevant to binding because polar interactions are enhanced in a hydrophobic
environment (Hage et al., 1999). Agreeably, the mutational analysis indicated as main binding
determinants residues from the central core of IL-4BP clusters I and II. Particularly large
contribution to binding demonstrated the side chains of Y183 and D72, respectively. Most of the
residues from their close surrounding certainly are implicated in the interaction with IL-4,
although the mutations at those sites caused a loss in binding affinity to a lesser extent. Contact
clusters I and II were proposed to have the same contribution to binding (Hage et al., 1999).
However, based on the findings from the mutagenesis study of IL-4BP it seems that, comparing
functional contributions, cluster II has slight prevalence over cluster I. Estimated from the loss of
free binding energy in the mutant proteins, the entire cluster II (13.3 kcal/mol) accounts
approximately for 95 % of binding energy, while the energetic contribution of cluster I
corresponds to around 60 % (8.8 kcal/mol)1. In agreement with the suggestions based on
structural data, the mutational analysis indicated that the residues from the third contact cluster
have minor functional role in complex stability and the entire cluster contributes with 30 % (4.2
kcal/mol) to binding energy. Additionally, the importance of this cluster, and particularly of the
side chain of D67, for the association phase was confirmed. Alanine substitutions of a few
residues present in the defined structural epitope did not produce considerable effect on binding
affinity. Those are amino acids localized in the periphery of the binding epitope, and it is likely
that the contacts made by their side chains are not of importance for the high-affinity interaction
with IL-4. It is possible that some of them are directly involved in binding by their main chains,
but due to limitations of the used approach such a suggestion could not be verified. Furthermore,
it cannot be excluded that the periphery of the interface has another important role. For instance,
it might contribute substantially to the specificity of binding by repulsion of non-target molecules
through unfavorable electrostatic or steric interactions, or both.
Comparison between the change of buried surface area upon binding and the change in the free
energy of binding when the particular side chain was mutated revealed a very poor correlation
1 The contribution of cluster I was estimated considering the loss of binding affinity of variants Y13F, Y127A, and Y183A. Variant Y13F was favoured, since it represents better the functional properties of Y13 than the analogous alanine variant. Data about variants L39A, F41A, V69A, and D72A, was used for cluster II. Other variants were not included, as they demonstrated negligible contribution to binding.
The other major binding determinant of hGHbp, W104, according to the sequence alignment
corresponds directly to S70 of IL-4BP (Figure 4.7). Mutational analysis clearly demonstrated that
the side chain of S70 has no functional importance for the interaction with IL-4. However, the
same receptor loop (L3) contains the major binding determinant D72 from the second binding
cluster of IL-4BP that is involved in tight interaction with IL-4 R88. It approximately resembles
not only W104 of hGHbp, but also F93 of EPB, which is a critical determinant of erythropoietin
binding (Barbone et al, 1997). Likewise, the position of IL-4BP D72 correlates to Y172 of
GCSF-R that has been suggested to take part in functionally very important hydrogen bonds to
residues from the ligand (Layton et al, 1997; Aritomi et al, 1999). Thus, it seems that the
presence of residues critical for binding in loop L3 might be a common feature of class I cytokine
receptors.
G - - - -- - - - -T A R G AP - - - -
C
N - - - VD P - - IE - - - IP P E D T
structure D1 βΑ βΒ α 1 βC βC βD
ruler 10 20 30 40 50IL4-BP F K V L Q E P T C V S D Y M S I S T C E W K M N G P T - - N C S T E L R L L Y Q L V F L L - - - S E A H - T C I P E - - - - N N GhGHbp - - E P K F T K C R S P E R E T F S C H W T D E V H H G T K N L G P I Q L F Y T R R N T Q E W T Q E W K - E C P D Y V S A G E - -EBP - - - - E E L L C F T E R L E D L V C F W E E A A S A G V G P - G N Y S F S Y Q L E D - - - - - E P W K - L C R L H - - - - Q A Pgp130 E K P K - N L S C I V N E G K K M R C E W D G G R E T - - H L E T N F T L K S E W A T - - - - - - H K F A D C K A K - - - - A A T
structure βE βF βG 310A D1ruler 60 70 80 90IL4-BP A G C V C H L L - - M D D - V V S A D N Y T L D L W A G - Q Q L - - - L W - K G S F K P S E H VhGHbp - - N S C Y F N S S F T - - S I W - I P Y C I K L T S N - G G T - - - V D - E K C F S V D E I VEBP V R F W C S L P - - T A D T S S - F V P L E L R V T A A S G A P - - - R Y - H R V I H I N E V Vgp130 - - T S C T V D - - Y S T - V Y F - V N I E V W V E A E - N A L G K V T S D H I N F D P V Y K V
structure D2 βΑ βΒ 310B βC
ruler 100 110 120 130 140IL4-BP K P R A P G N L T V H T N V - - - - - - S D T - L L L T W S N P - - Y P P D N - - Y L Y N H L T Y A V N I W S E N D P A D F R I YhGHbp Q P D P P I A L N W T L L N V S L T G I H A D - I Q V R W E A P R N A D I - Q K G W M V - - L E Y E L Q Y K E V N - E T K W K M MEBP L L D A P V G L V A R L A D - - - - - - E S G H V V L R W L P P - - P E T - P - - M - T S H I R Y E V D V S A G N G A G S V Q R Vgp130 K P N P P H N L S V I N S L V I N S L - S S I - L K L T W T N P - - S I K S - - - V I - - I L K Y N I Q Y R T K D A S T W S - Q I
structure βE βF 310C βG D2ruler 160 170 180 190 197IL4-BP - T - Y L E P S L R I A A S T L K S G I S Y R A R V R A W A - Q A - Y N T T W S E W S P S T K W H *hGHbp - L - T - - T S V P V Y S L - - K V D K E Y E V R V R S K Q R N - - - S G N Y G E F S E V L Y V T *EBP - L E G R - T E C V L S N L R G - - R T R Y T F A V R A R M A E P S F G G F W S A W S E P V S L L *gp130 A S - T R - S S F T V Q D L K P - - F T E Y V F R I R C M K - E D - G K G Y W S D W S E E A S G I *
L4
L5
L6
L3
L1 L2
Figure 4.7: Structure-based sequence alignment of different extracellular domains of cytokine receptors (IL-4BP,
hGHbp, EBP, and gp130). Amino acid sequences are given in one letter code; deletions are marked “-“, sequence
numbering and secondary structure designations are given for IL-4BP. β strands and α/310 helices are depicted by
black and red boxes, respectively. A gray background indicates structural superposition (Hage et al., 1999).
In accordance with the sequence alignment, no important side chains of hGHpb and EPB
correspond to IL-4BP Y183. Nevertheless, the structurally guided mutagenesis of IL-4BP
residues revealed that Y183 is the main binding component of cluster I engaged in interaction
independent manner. However, cooperative interactions between residues present in one and the
same cluster were observed. Moreover, the clusters could be distinguished according to their
apparent contribution and functional importance for the binding. Estimated from the loss of free
binding energy in the affected mutant variants, contact cluster II has the greatest contribution to
binding followed by cluster I and cluster III, respectively. Both clusters I and II appear to have
important functions in stabilizing the complex between IL-4 and its receptor, since mutations
introduced in those assembles resulted in considerably affected binding properties. In contrast,
substitutions of residues from cluster III caused merely small effects on binding affinity,
indicating that the cluster plays a role mainly in electrostatic steering in order to accelerate
complex formation.
The mutational analysis presented in this thesis, together with the already established IL-4
functional epitope and the structure of the intermediate complex between IL-4 and IL-4BP,
improves the understanding of the molecular mechanisms of receptor binding and activation for
members of the cytokine receptor family. Detailed knowledge about the molecular recognition
between cytokines and their receptors is not only of theoretical interest, but is also important as a
base for drug design.
136
6. Literature
6. Literature
Aman, M.J., Tayebi, N., Obiri, N., Puri, R.K., Modi, W.S. & Leonard, W.J. (1996) cDNA cloning and characterisation of the human interleukin 13 receptor α chain. J. Biol. Chem. 271, 29265-29270 Anderson, G.G. & Morrison, J.F. (1998) Molecular biology and genetics of allergy and asthma. Arch. Dis. Chil. 78, 488 Aritomi, M., Kunishima, N., Okamoto, T., Kuroki, R., Ota, Y. & Morikawa, K. (1999) Atomic structure of the GCSF-receptor complex showing a new cytokine-receptor recognition scheme. Nature 401, 713-717 Baixeras, E., Roman-Roman, S., Jitsukawa, S., Genevee, C., Mechiche, S., Viegas-Pequignot, E., Hercend, T. & Triebel, F. (1990) Cloning and expression of a lymphocyte activation gene (Lag-1) Mol. Immunol. 27, 1091-1102 Bamborough, P., Hedgecock, C.JR. & Richards, W.G. (1994) The interleukin-2 and interleukin-4 receptors studied by molecular modeling. Structure 15, 839-851 Barbone, F.P., Middleton, S.A., Johnson, D.L., McMahon, F.J., Tullai, J., Gruninger, R.H., Schilling, A.E., Jolliffe, L.K. & Mulcahy, L.S. (1997) Mutagenesis studies of the human erythropoietin receptor. J. Biol. Chem. 272, 4985-4992 Bazan, J.F. (1990) Structural design and molecular evolution of a cytokine receptor superfamily. Proc. Natl., Acad. Sci. USA 87, 6934-6938 Beckmann, M.P., Cosman, D., Fanslow, W., Maliszewski, C.R. & Lyman, S.D. (1992) Interleukins: Molecular biology and immunology. Chem. Immunol. 51, 107-134 Bennett, B.L., Cruz, R., Lacson, R.G., Manning, A.M. (1997) Interleukin-4 suppression of TNFα-stimulated E-selectin gene transcription in mediated by STAT6 antagonism of NFκB. J. Biol. Chem. 272, 10212-10219 BIAcore Handbook (1995) Biacore 2000 Handbook, Pharmacia Birnboim, H.C. & Doly, J. (1979) A rapid extraction procedure for screening recombinant plasmid DAN. Nucl Acid Res 7, 1513-1523. Bravo, J., Staunton, D., Heath, J.K. & Jones, E.Y. (1998) Crystal strucrure of a cytokine-binding region of gp 130. The EMBO J. 17, 1665-1674 Brusselle, G., Kips, J., Joos, G., Bluethmann, H. & Pauwels, R. (1995) Allergen-induced airway inflammation and bronchial responsiveness in wild-type and interleukin-4-deficient mice. Am. J. Respir. Cell Mol. Biol. 12, 254-259 Brusselle, G.G., Kips, J.C., Tavernier, J.H., van der Heyden, J.G., Cuvelier, C.A., Pauwels, R.A. & Bluethmann, H.
(1994) Attenuation of allergic airway inflammation in IL-4 feficient mice. Clin. Exp. Allergy 24, 73-80
Callard, R. & Gearing A. (1994) The cytokine facts book, p53 Carter, P., Winter, G., Wilkinson, J., & Fersht, R. (1984) Cell 38, 835-840 Chen, H.J. & Paul, W.E. (1997) Cultured NK1.1(+)CD4(+) T cells produce large amounts of IL-4 and IFNγ upon activation by anti-CD3 or CD1. J. Immunol. 159, 2240-2249 Chomarat; P. & Banchereau, J. (1997) An update on interleukin-4 and its receptor. Eur. Cytokine Netw. 8, 333-344 Clackson, T. & Wells, J.A. (1995) A hot spot of binding energy in a hormone-receptor interface. Science 267, 383-386
137
6. Literature
Clackson, T., Ultsch, M.H., Wells, J.A. & de Vos, A.M. (1998) Structural and functional analysis of the 1:1 growth hormone: receptor complex reveals the molecular basis for receptor affinity. J. Mol.. Biol. 277, 1111-1128 Coffman, R.L., Ohara, J., Bond, M.W., Carty J., Zlotnik, A. & Paul, W.E. (1986) B cell stimulatory factor 1 enhances the IgE response of lipopolysacchride-activated B cells. J. Immunol. 136, 4538-4541 Cohn, L., Homer, R.J., MacLeod, H., Mohrs, M., Brombacher, F. & Bottomly, K. (1999) Th2-induced airway mucus production is dependent on IL-Rα, but not on eosinophils. J.Immunol. 162, 6178-6183 Cookson, W.O. & Moffatt, M.F. (1998) Alchemy for asthma. Nature Medicine 4, 500-501 Corry, D.B., Folkesson, H.G., Warnock, M.L., Erle, D.J., Matthay, M.A., Wiener-Kronish, J.P. & Locksley, R.M. (1996) Interleukin 4, but not interleukin 5 or eosinophils, is required in a murine model of acute airway hyperreactivity. J. Exp. Med. 183, 109-117 Cunningham, B.C. & Wells, J.A. (1993) Comparison of a structural and a functional epitope. J. Mol. Biol. 234, 554-563 Cunningham, B.C. & Wells, J.A. (1995) Science 244, 1081-1085 D´Eustachio, P., Brown, M., Watson, C. & Paul, W.E. (1988) The IL-4 gene maps to chromosome 11, near the gene encoding IL-3. J. Immunol. 141, 3067 David, M., Petricoin, E., Benjamin, C., Pine, R., Weber, M.J. & Larner, A.C. (1995) requirementfor MAP kinase activity in interferon α and interferon β-stimulated gene expression through STAT protein. Science 269, 1721-1723 De Vos, A.M., Ultsch, M. & Kossiafoff, A.A. (1992) Human growth hormone and extracellular domain of ist receptor: crystal structure of the complex. Science 255, 306-312 Defrance, T., Aubry, J.P. Rousset, F., Vandervliet, B., Bonnefoy, J.Y., Arai, N., Takebe, Y., Yokota, T., Lee, F., Arai, k., (1987) Human recombinant interleukin-4 induces Fcε receptors (CD23) on normal human b lymphocytes. J. Exp. Med. 165, 1459-67 Dh, R., Hiles, I., Panayotou, G., Roche, S., Fry, M.J., Gout, I., Totty, N.F., Truong, O., Vicendo, P., Yonezawa, K., et al., (1994): PI-3 kinase is a dual specificity enzyme: autoregulation by an intrinsic protein-serine kinase activity. EMBO J. 13, 522-533. Di Cera, E. (1998) Site – specific analysis of mutational effects in proteins. Advances in Protein Chemistry 51, 59-119 Dubucquoi, S., Desreumaux, P., Janin, A., klein, O., Goldman, M., Tavernier, J., Capron, M. & Capron, A. (1994) Interleukin-5 secretion by eosinophils – association with granules and immunoglobulin-dependant secretion. J. Exp. Med. 179, 703-708 Duschl, A. & Sebald, W. (1996) Transmembrane and intracellular signalling by interleukin-4: receptor dimerization and beyond. Eur. Cytokine Netw. 7, 37-49 Fernandez-Botran, R. & Vitetta, E.S. (1990) A soluble, high-affinity, interleukin-4 binding protein is present in the biological fluids of mice. Proc. Natl., Acad. Sci. USA 87, 4202-4206 Fernandez-Botran, R. & Vitetta, E.S. (1991) Evidence that natural murine soluble interleukin 4 receptors may act as transport proteins. J. Exp. Med. 174, 673-681 Franke, T.F., Kaplan, D.R. & Cantley, L.C. (1997) PI3K: downstream action blocks apoptosis. Cell 88, 435-437. Friedrich, K. & Wietek, S. (2001) Experimental regulation of STAT gene expression reveals an involvement of STAT5 in IL-4-drivem cell proliferation. Biol. Chem. 382, 343-351 Friedrich, K., Wietek, S., Lischke, A., Wellbrock, C., Kreitman, R.J., Pastan, I. & Sebald, W. (1999) A two-step selection approach for identification of ligand-binding determinants in cytokine receptors. Anal. Biochem. 268, 179-186
138
6. Literature
Frisch, C., Schreiber., G., Johnson, C.M. & Fersht, A.R. (1997) Thermodynamics of the interaction of barnase and barstar: changes in free energy versus chnges in enthalpy on mutation. J Mol Biol 267, 696-706 Gascan, H., Gauchat, J.F., Roncarolo, M.G., Yssel, H. & de Vries, J.E. (1991) Human B cell clones can be induced to proliferate and to switch to IgE and IgG4 synthesis by interleukin 4 and signal provided by activated CD4+ T cell clones. J. Exp. Med. 173, 747-750 Gavett, S.H. et al. (1994) Am. J. Respir. Cell Mol. Biol. 10, 587 Gavett, S.H. et al. (1995) J. Exp. Med. 182, 1527 Gershoni, J.M. & Palade, G.E. (1983) Anal. Biochem. 131, 1-15 Grabstein, K., Eisenman, J., Mochizuki, D., Shanebeck, K., Conlon, P., Hopp, T., March, C. & Gillis, S. (1986) Purification of homogeneity of B cell stimulating factor. J. Exp. Med. 163, 1405 Gruenig, G., Watnock, M., Wakil, A.E., Venkayya, R., Brombacher, F., Rennick, D.M., Sheppard, D., Mohrs, M., Donaldson, D.D., Locksley, R.M. & Corry, D.B. (1998) Requirement for IL-13 independently of IL-4 in experimental asthma. Science 282, 2261-2263 Grunewald, S.M., Brocker, E.B., Sebald, W. & Duschl, A. (1998) Cytokine antagonists and allergy. Eur. Cytokine Netw. 9, 92-94 Grunewald, S.M., Werthmann, A., Schnarr, B., Klein, C.E., Brocker, E.B., Mohrs, M., Brombacher, F., Sebald, W. & Duschl, A. (1998) An antagonistic IL-4 preventstype I allergy in mouse. Inhibition of the IL-4/IL-13 receptor system completely abrogates humoral immune response to allergen and development of allergic symptoms in vivo. J. Immunol. 160, 404 Gustchina, A., Zdanov, A., Schalk-Hihi, C. & Wlodawer, A. (1995) A model of the complex between interleukin-4 and its receptor. Proteins 21, 140-148 Hage, T. (1999) PhD Thesis, Julius-Maximilians University of Wuerzburg Hage, T., Sebald, W. &Reinemer, P. (1999) Crystal structure of the interleukin-4/receptor α chain complex reveals a mosaic binding interface. Cell 97, 271-281 Hamelmann, E., Wahn, U. & Gelfand, E.W. (1999) Role of Th2 cytokines in the development of allergen-induced airway inflammation and hyperresponsiveness. Int. Arch. Allergy Immunol 118, 90-94 Henderson, W.R., Chi, E.Y. & Maliszewski, C.R. (2000) Soluble IL-4R inhibits airway inflammation following allergen challenge in a mouse model of asthma. J. Immunol. 164, 1086-1095 Hermann, R.G., Whitefield, P.R. &Bottomly, W. (1980) Gene 8, 179-191 Hilser V.J., Dowdy D., Oas, T.G. & Freire E. (1998) The structural distribution of cooperative interactions in proteins: analisys of the native state ensemble. Proc. Natl. Acad. Sci. USA 95, 9903-9908 Hoffman, R.C., Castner, B.J., Gerhart, M., Gibson, M.G., Rasmussen, B.D., March, C.J., Weatherbee, J., Tsang, M., Gustchina, A., Schalk-Hihi, C., Reshetnikova, L. & Wlodawer, A. (1995) Direct evidence of a heteromeric complex of human interleukin-4 with its receptor. Prot. Sci. 4, 382-386 Horovitz, A. & Fersht, A.R. (1990) Strategy for analysing the co-operativity of intramolecular interactions in peptides and proteins. J Mol. Biol. 214, 613-617 Horsten, U., Muller-Newen, G., Gerhartz, C., Wollmer, A., Wijdenes, J., Heinrich, P.C. 6 Grotzinger J. (1997) Molecular modeling-guided mutagenesis of the extracellular part of gp 130 leads to the identification of contact site in the interleukin-6-IL-6 receptor-gp 130 complex. J. Biol. Chem. 272, 23748-23757 Howard, M., Farrar, J., Hilfiker, M., Johnson, B., Takatsu, K., Hamaoka, T., Paul, W.E. (1982) Identification of T-cell derived B-cell growth factor distinct from interleukin 2. J. Exp. Med. 155, 914
139
6. Literature
Hsieh, C.S., Heimberger, A.B., Gold J.S., O´Garra, a. & Murphy, K.M. (1992) Differential regulation of T helper phenotype development by interleukins 4 and 10 in an alpha beta T-cell receptor transgenic system. Proc. Natl. Acad. Sci. USA 89, 6065-6069 Hu-li, J., Shevach, E.M., Mizuguchi, J., Ohara, J., Mosmann, T. & Paul, W.E. (1987) B cell stimulatory factor 1 (interleukin 4) is a potent stimulant for normal resting T-lymphocytes. J. Exp. Med. 165, 157-172
Izuhara K., Umeshita-Suyama, R., Akaiwa, M., Shirakawa, T., Deichmann, K.A., Arima, K. & Hopkin, J.M. (2000) Recent advances in understanding how IL-13 signals are involved in the pathogenesis of bronchial asthma. Arch. Immunol. The.r Exp. 48, 502-512
Jones, S. & Thornton, M. (1996) Principles of protein-protein interactions. Proc. Natl. Acad. Sci. USA 93, 13-20
Koph, M., Le Gros, G., Bachmann, M., Lamers, M.C., Bluethmann, H. & Koehler, G. (1993) Disruption of murine IL-4 gene blocks Th2 cytokine responses. Nature, 362, 245-248
Kruse, ., Shen, B.J., Arnold, S, Tony, H.P., Mueller, T. & Sebald, W. (1993) Two distinct functional sites of human interleukin 4 are identified by variants impaired in either receptor binding or receptor activation. EMBO J. 12, 5121
Kruse, N., Tony, H.-P. & Sebald, W. (1992) Coversion of human interleukin-4 into a high affinity antagonist by a single amino acid replacement. The EMBO J 11, 3237-3244
Kühn, R., Rajewsky, K. & Müller, W. (1991) Generation and analysis of interleukin 4 deficient mice. Science 254, 707-710
Layton, J., Iaria, J., Smith, D. & Treutlein, H. (1997) Identification of a ligand-binding site on the Granulocyte Colony-stimulating Factor Receptor by molecular modeling and mutagenesis. J. Biol. Chem. 272, 29735-29741
Idzerda, R.L., March, C.J., Mosely, B., Lyman, S.D., VandenBos, T., Gimpel, S.D., Din, W.S., Grabstein, K.H., Widmer, M.B., Park, L.S., Cosman, D. & Beckmann, M.P. (1990) Human interleukin-4 receptor confers biological responsiveness and defines a novel receptor super-famaly. J. Exp. Med. 171, 86
Jarvis, D.L. & Garcia A. (1994) Long-term stability of baculoviruses stored under various conditions. BioTechniques 16, 508-513
Jin, L. & Wells, J. A. (1992) Dissecting the enrgetics of an antibody-antigen interfaceby alanine shaving and molecular grafting. Protein Sci. 3, 2351-2357
Karlsson, R. & Fealt, A (1997) Experimental design for kinetic analysis of protein-protein interactions with surface plasmon resonance biosensors. J. Immonol. Meth. 200, 121-133
Kossiakoff, A. & de Vos, A.M. (1998) Strustural basis for cytokine hormone-receptor recognition and receptor activation. Adv Prot Chem 52, 67-108
Kruse, N., Lehrnbecher, T. & Sebald, W. (1991) Site-directed mutagenesis reveals the importance of disulfide bridges aromatic residues for structure and proliferative activity of human interleukin-4. FEBS Lett. 286, 58-60
Kuby, J. (1994) Immunology. Second Edition, 1-19
Lau, F. T. & Fersht, A. R. (1987) Nature 326, 811-812
Le Beau, M.M., Lemons, E.R.S., Espinosa, R., Larson, R.A., Arai, N. & Rowley, J.D. (1988) IL-4 and IL-5 map to human chromosome 5 in a region encoding growth factors and receptors and are deleted in myeloid leukemias with a del(5q) Blood 73, 647 Le, H.V., Ramanathan, L., Labdon, J.E., Mays-Ichinco, C.A., Sytp, R., Arai, N., Hoy, P., Takebe, Y., Nagabhushan, T.L. & Trotta, P.P. (1988) Isolation and characterisation of multiple variants of recombinant human iterleukin 4 expressed in mammalian cells. J. Biol. Chem. 263, 10817
140
6. Literature
Leahy, D.J., Hendrickson, W.A., Aukhil, I. & Erickson, H.P. (1992) Structure of a fibronectin type III domain from tenascin phased by MAD analysis of the selenomethionyl protein. Science 258, 987-991. Lee, F., Yokota, T., Otsuka, T., Meyerson, P., Villaret, D., Coffman, R., Mosmann, T., Rennick, D., Roehm, N., Smith, C., Zlotnick, A. & Arai, K. (1986) Isolation and characterisation of mouse interleukin cDNA clone that expresses B-cells stimulatory factor 1 and T-cell and mast-cell-stimulating activities. Proc. Natl. Acad. Sci. USA 83, 2061 Leonard W.J. & O´Shea, J.J. (1998) JAKS and STATS: biological implications, Annu. Rev. Immunol. 16, 293-322 Letzelter, F., Wang, Y. & Sebald, W. (1998) The interleukin-4 site-2 epitope determining binding of the common receptor γ chain Eur. J. Biochem. 257, 11-20 Lonjou, C., Barnes, K., Chen, H., Cookson, W.O., Deichmann, K.A., Hall, I.P., Holloway, J.W., Laitinen, T., Palmer, L.J., Wjst, M. & Moton, N.E. (2000) A first trial of retrospective collaboration for positional cloning in complex inheritance: assay of the cytokine region on chromosome 5 by COAG. Proc. Natl. Acad. Sci. USA 97, 10942-10947 Look, D.C., Pelletier, M.R., Tidwell, R.M., Roswit, W.T. & Holtzman, M.J. (1995) STAT-1depends on transcriptional synergy with Sp1. J. Biol. Chem. 270, 30264-30267 Lukacs, N.W., Strieter, R.M., Chensue, S.W. & Kunkel, S.L. (1994) Am. J. Respir. Cell Mol. Biol. 10, 526 Manian, P. (1997) Genetics of asthma: a review. Chest 112, 1397 Marone G. (1998) Asthma: recent advances. Immunology Today 19, 5-9 Marsh, D.G. et al. (1996) Science 264, 1152 Matthews, R.E.F. (1982) Classification and nomenclature of viruses. Fourth report of international committee on taxonomy of viruses. Karger, Basel McCarthy, J.E., Schairer, H.U. & Sebald, W. (1985) Translation initiation frequency of atp genes from Escherichia coli: identification of an intercistronic sequence that enhances translation. Embo J 4, 519-526 McKenzie A.N. (2000) Regulation of T helper type immunity by IL-4 and IL-13. Pharmacol. Ther. 88, 143-151 Middletone, S.A., Barbone, F.P., Johnson, D.L., Thurmond, R.L., McMahon, F.J., Jin, R., Livnah, O., Tullai, J., Farrell, F.X., Goldsmith, M.A., Wilson, I.A. & Jolliffe L.K. (1999) Shared and unique determinants of the erythropoietin (EPO) receptor are important for binding EPO and EPO mimetic protein. J. Biol. Chem. 274, 14163-14169 Miossec, P. (1994) Acting on the cytokine balance to control autoimmunity and chronic inflammation. Eur. Cytoline Netw. 4, 245f. Miyajima, A., Kitamura, T., Harada, N., Yokota, T., & Arai, K. (1992) Cytokine receptors and signal transduction. Annu. Rev.Immunol. 10, 295-331 Miyazaki, T., Kawahara, A., Fujii, H., Nakagawa, Y., Minami, Y., Liu, Z., Oishi, I., Silvennoinen, O., Witthahn, B.A., Ihle, J.N. (1994) Functional activation of Jak1 and Jak3 by selective association with IL-2R subunits. Science 266, 1045-47 Murata, T., Taguchi, J. & Puri, R.K. (1998) Interleukin –13 receptor α´ but not α chain: a functional component of interleukin-4 receptors. Blood 91, 3884-3891 Nanavaty, U., Goldstein, A.D. & Levine S.J. (2001) Polymorphisms in candidate asthma genes. Am. J. Med. Sci. 321, 11-16 Nelms, K., Keegan, A.D., Zamorano, J., Ryan, J.J. & Paul, W.E. (1999) The IL-4 receptor: signaling mechanisms and biologic function. Annu. Rev. Immunol. 17, 701-738
141
6. Literature
Nice, E.C. & Catimel, B. (1999) Instrumental biosensors: new perspectives for the analysis of biomolecular interactions. BioEssays 21, 339-352 Nicola, N. & Hilton, D. (1998) General classes and function of four-helih bundle cytokines. Adv Prot Chem 52, 1-65 Nicola, N.A. ed.(1994)”Guidebook to cytokines and their receptors”. Oxford University Press, Oxford, 1-7 Noben-Trauth, N., Schultz, L.D., Brombacher, F., Urban, J.F.; Gu, H. & Paul, W.E. (1997) An interleukin 4 independent pathway for CD4+ T-cell IL-4 production is revealed in IL-4 receptor deficient mice. Proc. Natl. Acad. Sci. USA 94, 10838-10843 Noelle, R., Kramme, R.P., Ohara, J., Uhr, J.W., Vitetta, E.S. (1984) Increased expression of Ia antigens on resting B cells: an additional role for B-cell growth factor. Proc. Natl. Acad. Sci. USA 81, 6149-6153 Obiri, N.I., Debinski, W., Leonard, W.J. & Puri, R.K. (1995) Receptor for interleukin 13- interaction with interleukin 4 by a mechanism that does not involve the common γ chain shared by receptors for interleukin 2, 4, 7, 9, and 15. J. Biol. Chem. 270, 8797-8804 Ohara, J. & Paul, W.E. (1988) Up-regulation of interleukin-4/B-cell stimulatory factor 1 receptor expression. Proc. Natl. Acad. Sci. USA 85, 8221-8225 Ohara, J., Lahet, S., Inman, J. & Paul, W.E. (1985) Partial purification of murine B-cell stimulatory factor –1. J. Immunol. 135, 2518 Otzen, D.E. & Fersht, A.R. (1999) Analysis of protein-protein interactions by mutagenesis: direct versus indirect effects. Prot. Engin. 12, 41-45 Patel, B.K.R., Pierce, J.H. & LaRochelle, W.J. (1998) Regulation of Interleukin-4-mediated signalling by naturally occurring dominant negative and attenuated forms of human STAT-6. Proc. Natl. Acad. Sci. USA 95, 172-177 Paul, W.E. & Seder, R.A. (1994) Lymphocyte responses and cytokines. Cell 76, 241-251 Pene, J., Rousset, F., Briere, F., Chretien, I., Bonnefoy, J.Y., Spits, H., Yokota, T., Arao, N., Arai, K.I., Bancherea, J. & de Vries, J.E. (1988) IgE production by normal human lymphocytes is induced by interleukin-4 and suppressed by IFN γ and αand prostaglandin E2. Proc. Natl. Acad. Sci. USA 85, 6880-6884 Powers, R., Garrett, D.S., March, C.J., Frieden, E.A., Gronenborn, A.M. & Clore, G.M. (1992) Three-dimensional solution structureof human interleukin-4 by multidimensional heteronuclear magnetic resonance spectroscopy. Science 256, 1673-1677 Prasad, M.R., Bahekar, R.H. & Rao, (2000) Recent perspectives in the design of antiasthamatic agents. Pharmazie 55, 457-482 Ramshaw, H., Woodcock, J., Bagley, C., McClure, B., Hercus, T. & Lopez, A. (2001) New approaches in the treatment of asthma. Immunol. Cell Biol. 79, 154-159 Rebollo, A., Gomez, J. & Martnez-A., C. (1996) lessons from immunological, biochemical and molecular pathways of the activation mediated by IL-2 and IL-4. Adv. Immunol. 63, 127-196 Renz, H., Bradley, K., Enssle, K., Loader, J.E., Larsen, G.L. & Gelfand, E.W. (1996) prevention of development of immediate hyperresponsiveness following in vivo treatment with soluble IL-4 receptor. Int. Arch. Allergy Immunol. 109, 167-176 Reusch, P., Arnold, S., Heusser, C., Wagner, K., Weston, B. & Sebald, W. (1994) Neutralizing monoclonal antibodies define two different functional sites in human interlekin-4. Eur J Biochem 222, 491-499 Romagnani, S. (1991) Human TH1 and TH2 subsets:doubt no more. Immunol. Today 12, 256-257 Russell, S.M., Keegan, A.D., Harada, N., Nakamura, Y., Noguchi, M., Leland, P., Friedmann, M.C., Miyajima, A., Puri, R.K., Paul, W.E. & Leonard, W.J. (1993) Interleukin-2 receptor γ chain: a functional component of the interleukin-4 receptor. Science 262, 1880-1883
142
6. Literature
Sambrook, J., Fritsch, E.F. & Maniatis, T. (1989) Molecular cloning: a laboratory manual. Cold Spring Habour Laboratory Press, USA. Schaefer, T.S., Sanders, L.K. & Nathans, D. (1995) Co-operative transcriptional activity of Jun and STAT-3β, a short form of STAT-3. Proc. Natl. Acad. Sci. USA 92, 9097-9101
Schreiber, G. & Fersht, A.R. (1995) Energetics of protein-protein interactions: analysis of barnase-barstar interface by single mutations and double mutant cycles. J Mol. Biol. 248, 478-486
Seder, R.A., Gazzinelli, R., Sher, A. & Paul, W.E. (1993) IL-12 acts directly on CD4+ T cells to enhance priming for IFNγ production and diminishes IL-4 inhibition of such priming. Proc. Natl. Acad. Sci. USA 90, 10188-10192
Seder, R.A., Paul, W.E., Davis, M.M. & Fazekas de St. Groth, B. (1992) The presence of interleukin 4 during in vitro priming determines the lymphokine-producing potential of CD4+ T cells from T cell receptor transgenic mice. J. Exp. Med. 176, 1091-1098
Shen, B-J. (1996) Thesis work, University of Wuerzburg
Seder, R.A. & Paul, W.E. (1994) Acquisition of lymphokine-producing phenotype by CD4+ T-cells. Annu. Rev. Immunol. 12, 635-673
Shen, B. (1996) Molecular recognition during binding of human IL-4 to its receptor. PhD Thesis, Julius-Maximilians University of Wuerzburg
Smerz-Bertling, C. & Duschl, A. (1995) Both interleukin-4 and interleukin-13 induce tyrosine phosphorilation of the 140 kD subunit of the interleukin-4 receptor. J. Bol. Chem. 270, 966-970 Smith, L.J., Redfield, C., Boyd, J., Lawrence, G., Edwards, R.G., Smith, R.A.G. & Dobson, C.M. (1992) Human interleukin 4- the solution structure of a four-helih bundle protein. J. Mol. Biol. 224, 899-904 Snapper, C.M., Hornbeck, P.V., Atasoy, U., Pereira, G.M. & Paul, W.E. (1988) Interleukin 4 induces membrane Thy-1 expression on normal murine B cells. Proc. Natl. Acad. Sci. USA 85, 6107-6111 Sprang, S.R. & Bazan, J.F. (1993) Cytokine structural taxonomy and mechanisms of receptor engagement. Curr. Opin. Struct. Biol. 3, 815-827 Sugamura, K., Asao, H., Kondo, M., Tanaka, N., Ishii, N., Nakamura, M. & Takeshita, T. (1995) The common γ-chain for multiple cytokine receptors. Adv. Immunol. 59, 225-277 Sugamura, K., Asao, H., Kondo, M., Tanaka, N., Ishii, N., Ohbo, K., Nakamura, M. & Takeshita, T. (1996) The interleukin-2 receptor γ chain: its role in the multiple cytokine receptor complexes and T cell development in XSCID. Annu. Rev. Immunol. 14, 179-205 Sun, X.J., Wang, L.M., Zhang, Y., Yenush, L., Myers, M.G.J., Glasheen, E., Lane, W.S., Pierce, J.H. & White, M.F. (1995) Role of IRS-2 in insulin and cytokine signalling. Nature 377, 173-177 Takeshita, T., Asao, H., Ohtani, K., Ishii, N., Kumaki, S., Tanaka, N., Munakata, H., Nakamura, M. & Sugamura, K. (1992) Cloning of the γ chain of the human IL-2 receptor. Science 257, 551-556 Tanaka, H., Nagai, H. & Maeda., Y. (1998) Effect of anti-IL-4 and anti-IL-5 antibodies on allergic airway hyperresponsiveness in mice. Life. Sci. 62, 169-174 Tartof, K.D. & Hobbs, C.A. (1987) Improved media for growing plasmid and cosmid clones. Bethesda Res. Lab. Focus 9:12 Tepper, R.I. & Mule, J.J. (1994) Experimental and clinical studies of cytokine gene-modified tumor cells. Hum. Gene. Ther. 5, 153-164 Tepper, R.I., Levinson, D.A., Stanger, B.Z., Campos-Torres, Abbas, A.K. & Leder, P. (1990) II-4 induces allergic-like inflammatory disease and alters T cell development in transgenic mice. Cell 62, 457-467
143
6. Literature
Thornhill, M.H., Wellicoms, S.M., Mahiouz, D.L., Lanchbury, J.S., Kyan-Aung, U. & Haskard, D.O. (1991) TNF combines with interleukin 4 or IFNγ to selectively enhance andothelial cell adhesiveness for T cells. The contribution of vascular cell adhesion molecule-1-dependent and independent binding mechanisms. J. Immunol. 146, 592-598 Toker, A. & Cantley, L.C. (1997) Signalling through the lipid products of phsophoinositide-3-OH kinase. Nature 387, 673-676. Tomkinson, A., Duez, C., Cieslewicz, G., Pratt, J.C., Joetham, A., Shanafelt, .C., Gundel, R. & Gelfand, E.W. (2001) A murine IL-4R antagonist that inhibits IL-4- and IL-13-induced responses prevents antigen-induced airway eosinophilia and airway hypeeesponsiveness. J. Immunol. 166, 5792-5800 Tony H.P., Shen , B.J., Reusch, P. & Sebald, W. (1994) Design of human interleukin-4 antagonists inhibiting interleukin-4-dependent and interleukin-13-dependent responses in T cells and B cells with high efficiency. Eur. J. Biochem. 225, 659 Tsicopoulos, A., Janin, A., Akoum, H., Lamblin, C., Vorng, H., Hamid, Q., Tonnel, A.B. & Wallaert, B. (2000) Cytokine profile in MSGs from patients with bronchial asthma. Allergy Clin. Immunol. 106, 687-696 Turner, B., Rapp, U., App, H., Greene, M., Dobashi, K. & Reed, J. (1991) Interleukin-2 induces tyrosine phosphorylation and activation of p72-74 Raf-1 kinase in a T-cell line. Proc. Natl. Acad. Sci. USA 88, 1227f. Vaughn, J.L., Goodwin, R.H. & Tompkins, G.J. (1977) In vitro 13, 213-217 Velazquez, L., Fellous, M., Stark, G.R. & Pellegrini, S. (1992) A protein tyrosine kinase in the interferon α/β signalling pathway. Cell 70, 313-322 Walker, C. et al. (1992) Am. Rev. Respir. Dis. 146, 109 Walter, M.R., Cook, W.J., Zhao, B.G., Cameron, R.P., Ealick, S.E., Walter, R.L., Reichert, P., Nagabhushan, T.L., Trotta, P.P. & Bugg, C.E. (1992) Crystal structure of recombinant human interleukin-4. J. Biol. Chem. 267, 20371-20376
Wang, Y., Shen, B-J. & Sebald, W. (1997) A mixed – charge pair in human interleukin 4 dominates high-affinity interaction with the receptor α chain. Proc. Natl. Acad. Sci. USA 94, 1657-1662
Wells, J.A. (1990) Additivity of mutational effects in proteins. Biochemistry, 29, 8509-8517
Wills-Karp, M., Luyimbazi, J., Xu, X., Schofield, B., Neben, T.Y., Karp, C.L. & Donaldson, D.D. (1998) Interleukin-13: central mediator of allergic asthma. Science 282, 2258-2261
Yanisch-Perron, C., Vieira, J. & Messing, J. (1985) Improved M13 phage cloning vectors and host strains: nucleotide sequences of M13amp18 and pUC19 vectors. Gene 33, 103-119
Wang, H.Y., Paul, W.E. & Keegan, A.D. (1996) IL-4 function can be transferred to the IL-2 receptor by tyrosine containing sequences found in the IL-4 receptor alpha chain. Immunity 4, 113-121.
Welham, M.J., Learmonth, L., Bone, H., Schrader, J.W. (1995) Interleukin-13 signal transduction in lymphohemopoietic cells. Similarities and differences in signal transduction with interleukin-4 and insulin. J. Biol. Chem. 270, 12286-12296
Wietek, S. (1999) Gezielte Beeinflussung der Signaltransduktion des humanen Interleukin-4 Rezeptors durch Expression von mutierten Komponenten der Signalweiterleitungs-Kaskade. PhD Thesis, Julius-Maximilians University of Wuerzburg
Wlodawer, A., Pavlovsky, A. & Gustchina, A. (1992) Crystal structure of human recombinant interleukin-4 at 2.25 A resolution. FEBS lett. 309, 59-64
Yokota, T., Otsuka, T., Mosmann, T., Banchereau, J., Defrance, T., Blanchard, D., de Vries, J.E., Lee., F. & Arai, K. (1986) Isolation and characterisation of a human interleukin cDNA clone homologous to mouse B-cell stimulatory factor 1 that expresses B-cell and T-cell-stimulatory activities. Proc. Natl. Acad. Sci. USA 83, 5894
144
6. Literature
Yoon, C., Johnston, S., Tang, J., Stahl, M., Tobin, J.F. & Somers, W.S. (2000) Charged residues dominate a unique interlocking topography in the heterodimeric cytokine interleukin-12. EMBO J. 19, 3350-3541
Zamorano, J. & Keegan, A.D. (1998) Regulation of apoptosis by tyrosine containing domains of IL-4Rα:Y497 and Y713, but not the Stat-6-docking tyrosine, signal protection from apoptosis. J. Immunol. 161, 859-867
Yoshimoto, T. & Paul, W.E. (1994) CD4pos, NK1.1pos T-cells pomtly produce Interleukin-4 in response to in vivo challenge with anti-CD3. J. Exp. Med. 179, 1285-1295
145
7. Appendices
7. Appendices
Appendix 1 Kinetic and equilibrium theory for the evolution of data
obtained from BIAcore experiments
For the association of an analyte A with an immobilized ligand B
a kinetic of first order is assumed:
k : association rate constant a
d:
For the starting concentration of free B, is valid:
( 3 )
Equation ( 2 ) can therefore be rearranged to give:
( 4 )
If one equates [ with the maximal signal of the BIAcore experiment R , with the
actually measured signal R and with the used concentration of analyte C, equation ( 4 ) can
be written as:
( 5 )
[ABBA ⇔+ ] ( 1 )
( 2 ) [ ] [ ] [ ] [ ]AB x k B x A x kdt / ABd da −=
k dissociation rate constant
[ ]0B
[ ] [ ] [AB B B0 += ]
[ ] [ ] [ ] [ ] [ ]AB xk) ABB ( A xkdt / ABd d0a −−=
] ]0B [AB
[ ]A
max
R x k
)k C x (ky
R x C x kdtdR / s
damaxa +−=
146
7. Appendices
Equation ( 5 ) is the equation of a straight line with k as gradient. s
( 6 )
s s
d
By measurement at different analyte concentrations C through this graphical representation k as
well as k can be determined. In practice, the determination of k by graphical representa-tion is
not very accurate, because in general is valid:
a
d
d
For the dissociation a time law of first order is assumed:
This can be transformed into
A graphical representation of ln against results in a straight line with k as
gradient.
das k C x k k +=
The graphical representation of k against C results also in a straight line with k as gradient and
the k as ordinate segment.
d
da k C x k >>
The determination of k therefore is achieved according to another method.
The present work was carried out at the Department for Physiological Chemistry II of the Theodor-Boveri-Institute of the University of Würzburg between June 1997 and January 2000. I would like to thank all these who worked together with me, who supported me and who were responsible for the nice working atmosphere: I am very much thankful to Prof. Dr. W. Sebald for the opportunity to carry out my Ph.D. in his working group, the lots of discussions and invaluable guidance he gave to me. Especially I would like to thank him for introducing me to the BIAcore technology. I particularly wish to thank Prof. Dr. E. Buchner (Department of Genetics) for being the second referee of this work and for representing this work in front of the Faculty of Biology. I thank very much Mrs. Mayer for her general support and her kindness and helpfulness with finding lodging. I am grateful to Dr. Y. Wang and Michael Blässe for introducing me into the project and some of the used techniques. I would like to say many thanks to Christian Söder for the excellent technical assistance in protein purification. To Wolfgang Hädelt I would like to thank for the excellent technical assistance in DNA sequencing. I would like to say thank you to Dr. Thorsten Hage for his helpful discussions and technical support. Many thanks also to Dr. Joachim Nickel for various useful scientific discussions. For the friendly and nice atmosphere in lab 349 I am thankful to Michael Blässe, Dr. Thorsten Hage, Thomas Hom, Dr. Felix Letzelter, Dr. Joachim Nickel and Angelika Wagner. I am thankful to my husband Dr. Stefan Wietek for his useful comments and discussions and for his technical help with the formation of the present thesis. I highly appreciate his patience, understanding and moral support in the time of my Ph.D. work. To my parents and my brother I would like to thank for the moral support and courage, which they gave me and for their efforts to keep in order all my affairs in Bulgaria during my foreign stage.
I would like to address my thanks to all the other people, who have not been mentioned here by names, but who helped me during my thesis work and who made my stage in Würzburg an exciting experience.
155
Lebenslauf Persönliche Daten: Name: Irina Wietek geb. Simeonova Anschrift: Motorstr. 46 D-80809 München Tel.: 089 / 35 70 96 71 Mobil: 0178 / 687 58 78 geboren am: 6. Januar 1972 in Sofia (Bulgarien) Familienstand: verheiratet Nationalität: Bulgarisch
Berufstätigkeit: seit 07/00 Analyst Customer Integration bei der eLabsEurope AG, München
09/95-06/97 Labor für Molekulare Pathologie, Universitätsklinik für Geburtshilfe und Gynäkologie, Sofia (molekulare Basis und Diagnose vererbbarer Erkrankungen)
Promotion: seit 06/97 Biozentrum der Universität Würzburg, Prof. W. Sebald (Medizinische Fakultät, Abteilung Physiologische Chemie) “Human Interleukin-4 binding protein epitope involved in high-affinity binding of Interleukin-4: Molecular analysis and characterisation”
Studium: 07/95 Diplom in Biochemie und Mikrobiologie; Gesamtnote: ausgezeichnet
01-07/95 Diplomarbeit im Labor für Molekulare Pathologie, Universitätsklinik für Geburtshilfe und Gynäkologie, Sofia: „DNS-Analyse von Familien mit spinaler Muskelatrophy“; Gesamtnote: ausgezeichnet 09/93-12/94 Spezialisierung in Klinischer Chemie, Abteilung Biochemie, Universität Sofia und Abteilung für Klinisches Labor und Klinische Immunologie, Medizinische Universität Sofia 09/90-07/93 Biochemie und Mikrobiologie an der Universität Sofia, Fakultät für Biologie; Vor-Diplom
Stipendium 09/90-07/95 St. Kliment Ohridsky Universität Sofia
Schulausbildung: 09/86-06/90 Nationales Gymnasium für Mathematik und Naturwissenschaften 09/79-06/86 Grundschule
156
Erklärung Ich erkläre hiermit ehrenwörtlich, daß ich die Dissertation „Human Interleukin-4 binding protein
epitope involved in high-affinity binding of Interleukin-4: Molecular analysis and
characterisation“ selbständig angefertigt und keine anderen als die von mir angegebenen Quellen
und Hilfsmittel benutzt habe.
Ich erkläre, daß diese Dissertation weder in der gleichen noch in einer anderen Form in einem
anderen Prüfungsverfahren vorgelegen hat.
Außer den mit dem Zulassungsgesuch urkundlich vorgelegten Graden habe ich keine weiteren
akademischen Grade erworben oder zu erwerben versucht.