DIPLOMARBEIT Enhancing non‐viral cell transfection through lysosomal escape mediated by listeriolysin O angestrebter akademischer Grad Magister der Naturwissenschaften (Mag. rer.nat.) Verfasser:: Ara Hacobian Matrikel-Nummer: 0105260 Studienrichtung /Studienzweig Molekulare Biologie (A490) Betreuer: Ao. Prof. Udo Bläsi Wien, Juni 2009
Transcript
DIPLOMARBEIT
Enhancing non‐viral cell transfection through lysosomal escape mediated by listeriolysin O
angestrebter akademischer Grad
Magister der Naturwissenschaften (Mag. rer.nat.) Verfasser:: Ara Hacobian Matrikel-Nummer: 0105260 Studienrichtung /Studienzweig Molekulare Biologie (A490) Betreuer: Ao. Prof. Udo Bläsi Wien, Juni 2009
2
3
Acknowledgements
This work was performed at the Ludwig Boltzmann Institute for Experimental and Clinical
Traumatology under the administration of Prof. Dr. Heinz Redl.
I would like to thank Prof. Dr. Heinz Redl and Prof. Dr. Martijn van Griensven for always
believing in my work and for all the support and the freedom to accomplish problems my
personal way and for their efforts to improve my work by life saving advice which always
returns me back on track again. Furthermore, I would like to thank for their belief in giving
me additional tasks to improve and refine my knowledge and skills in many different
matters.
Additionally, I would like to thank for the accommodation of Prof. Bläsi observing and
supporting my work and additionally giving me crucial and helpful thought‐provoking
impulses.
I also would like to thank Mag. Georg Feichtinger for his scientific and social advices and for
the professional and simultaneously relaxed working atmosphere giving an ideal background
for my work (Citation: “Don´t panic!“). Additionally, I would like to thank my better half
Susanne Falkner for helping by giving me her critical point of view about some chapters of
my work for her presence during the ups and downs of my life (Citation: “I know you will
cope with it!“). I would also like to thank my friends, Manuel Heiduk und Gabriel Zupcan, and
especially Kerstin Schorn, for always helping me to regain my mental balance after stressful
and hard working days. And furthermore to my colleagues Clemens Wassermann, Paulo
Bessa, Krystyna Labuda, Karin Brenner, Andreas Teuschl and Anna Hofmann for helpful
advices and interesting interdisciplinary conversations. Finally, special thanks to my family,
especially to my father giving me an ideal support in all matters of life and always helping me
with his sagacity enriched during his life (Citation: “Don't get discouraged!“).
There's not a problem that I can't fix, ´cause I can do it in the mix!
4
5
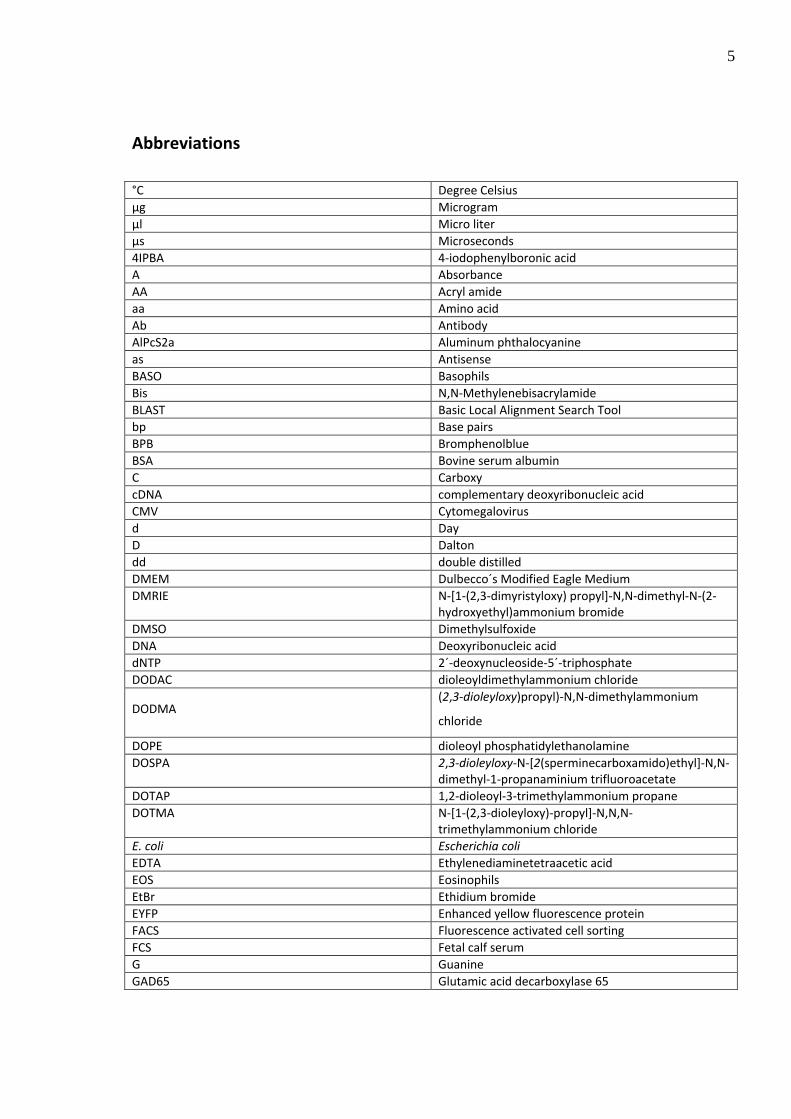
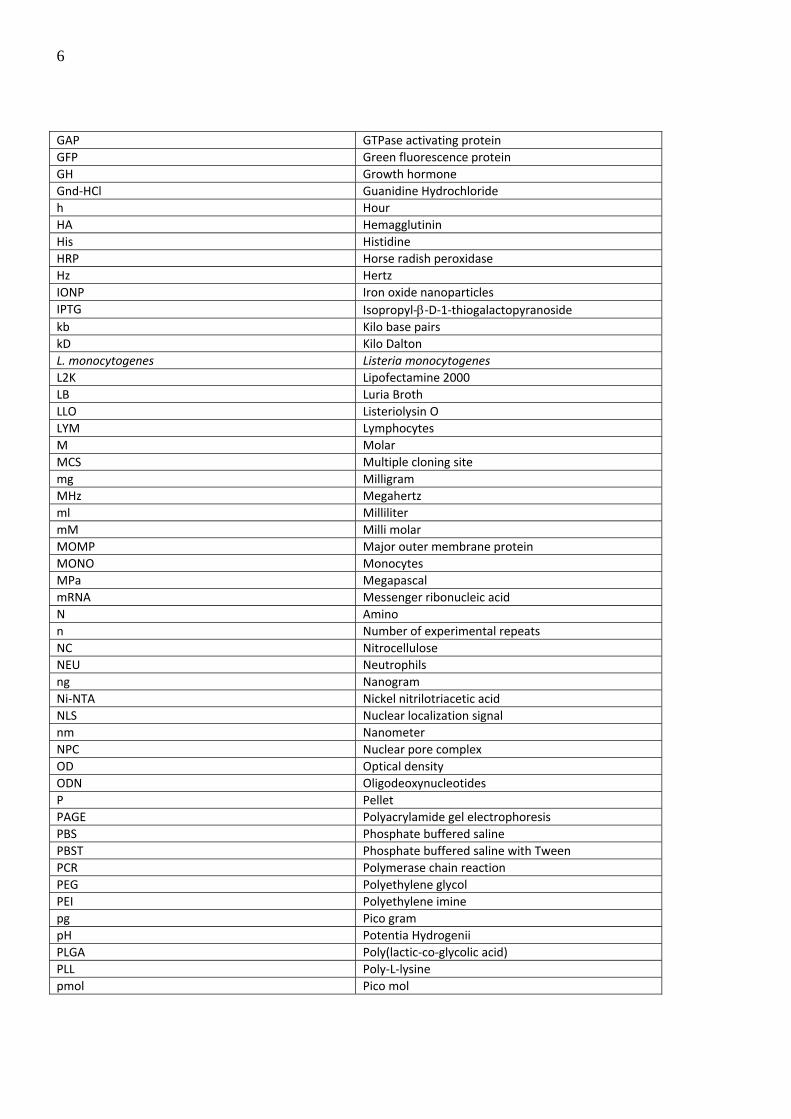
Abbreviations
°C Degree Celsius µg Microgram µl Micro liter µs Microseconds 4IPBA 4‐iodophenylboronic acid A Absorbance AA Acryl amide aa Amino acid Ab Antibody AlPcS2a Aluminum phthalocyanine as Antisense BASO Basophils Bis N,N‐Methylenebisacrylamide BLAST Basic Local Alignment Search Tool bp Base pairs BPB Bromphenolblue BSA Bovine serum albumin C Carboxy cDNA complementary deoxyribonucleic acid CMV Cytomegalovirus d Day D Dalton dd double distilled DMEM Dulbecco´s Modified Eagle Medium DMRIE N‐[1‐(2,3‐dimyristyloxy) propyl]‐N,N‐dimethyl‐N‐(2‐
trimethylammonium chloride E. coli Escherichia coli EDTA Ethylenediaminetetraacetic acid EOS Eosinophils EtBr Ethidium bromide EYFP Enhanced yellow fluorescence protein FACS Fluorescence activated cell sorting FCS Fetal calf serum G Guanine GAD65 Glutamic acid decarboxylase 65
6
GAP GTPase activating protein GFP Green fluorescence protein GH Growth hormone Gnd‐HCl Guanidine Hydrochloride h Hour HA Hemagglutinin His Histidine HRP Horse radish peroxidase Hz Hertz IONP Iron oxide nanoparticles IPTG Isopropyl‐β‐D‐1‐thiogalactopyranoside kb Kilo base pairs kD Kilo Dalton L. monocytogenes Listeria monocytogenes L2K Lipofectamine 2000 LB Luria Broth LLO Listeriolysin O LYM Lymphocytes M Molar MCS Multiple cloning site mg Milligram MHz Megahertz ml Milliliter mM Milli molar MOMP Major outer membrane protein MONO Monocytes MPa Megapascal mRNA Messenger ribonucleic acid N Amino n Number of experimental repeats NC Nitrocellulose NEU Neutrophils ng Nanogram Ni‐NTA Nickel nitrilotriacetic acid NLS Nuclear localization signal nm Nanometer NPC Nuclear pore complex OD Optical density ODN Oligodeoxynucleotides P Pellet PAGE Polyacrylamide gel electrophoresis PBS Phosphate buffered saline PBST Phosphate buffered saline with Tween PCR Polymerase chain reaction PEG Polyethylene glycol PEI Polyethylene imine pg Pico gram pH Potentia Hydrogenii PLGA Poly(lactic‐co‐glycolic acid) PLL Poly‐L‐lysine pmol Pico mol
7
PrV Pseudorabies virus RBC Red blood cell rpm Rounds per minute RT Room temperature s Sense SDS Sodium dodecyl sulfate sec Second SiO2 Silica SN Supernatant SV40 Simian virus 40 T Thymine T1D Type 1 diabetes Taq Thermus aquaticus TBE Tris boric acid EDTA TEMED N,N,N´,N´‐Tetramethylethylenediamine TfR Transferrin receptor Tris 2‐Amino‐2‐(hydroxymethyl)‐propan‐1‐3‐diole U Unit V Volt VEE Venezuelan Equine Encephalitis VEGF Vascular endothelial growth factor
1.1.2.1. DNA condensation and N/P ratio ...........................................................................23
1.1.2.2. Properties of polycationic carriers complexed with different types of DNA .........24
1.1.2.3. Cytotoxicity (+ modifications to decrease toxicity)................................................24
1.1.2.4. Non specific interactions with cells and proteins (blood components).................25
1.1.2.5. Protection of DNA against degradation by nucleases............................................26
1.1.2.6. Transfection of cells using polycations (and modifications to enhance transfection)...........................................................................................................27
1.1.2.7. Properties of polycations for lysosomal escape (proton sponge)..........................28
1.1.2.8. Modifications to enhance transfection ..................................................................28
Figure 1 Quick overview about barriers and solutions for an efficient delivery of DNA and other macromolecules
Figure 2 Schematic illustration of linear and branched poly‐L‐lysine (PLL) Figure 3 Formation of cationic and anionic microparticles by combining polycations with
cationic lipids.
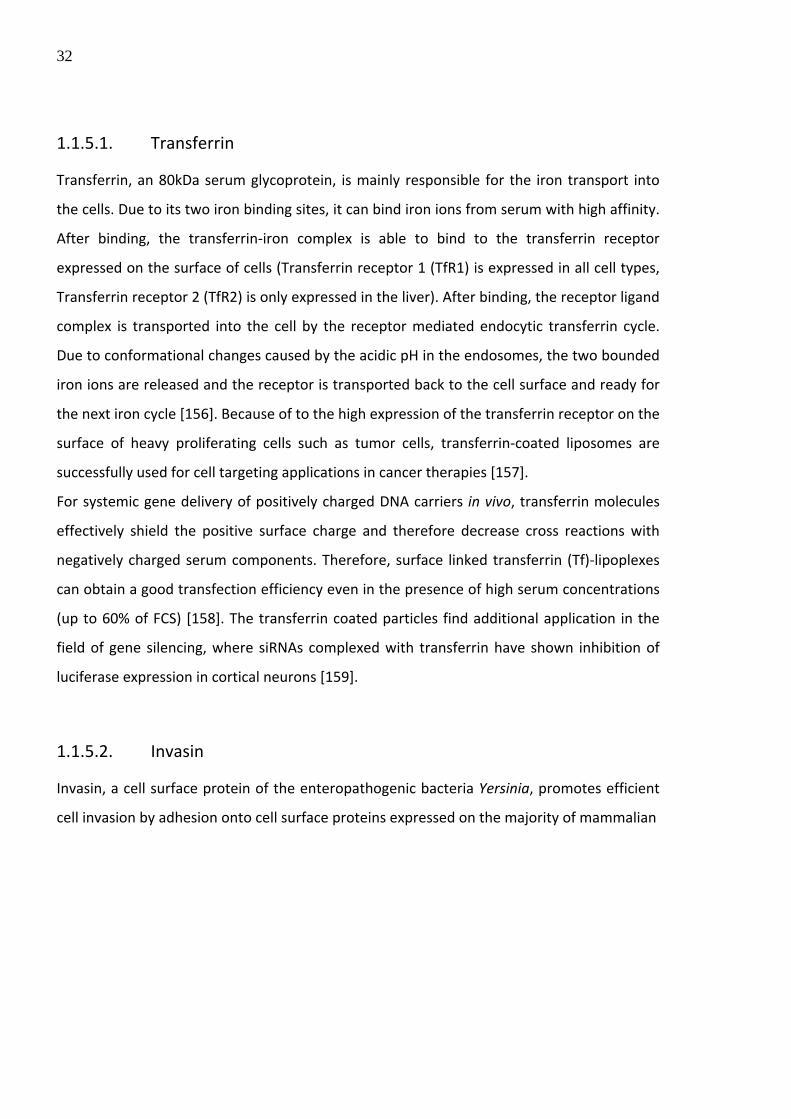
Figure 4 Invasin and truncated forms sufficient for the receptor‐mediated uptake by eukaryotic cells
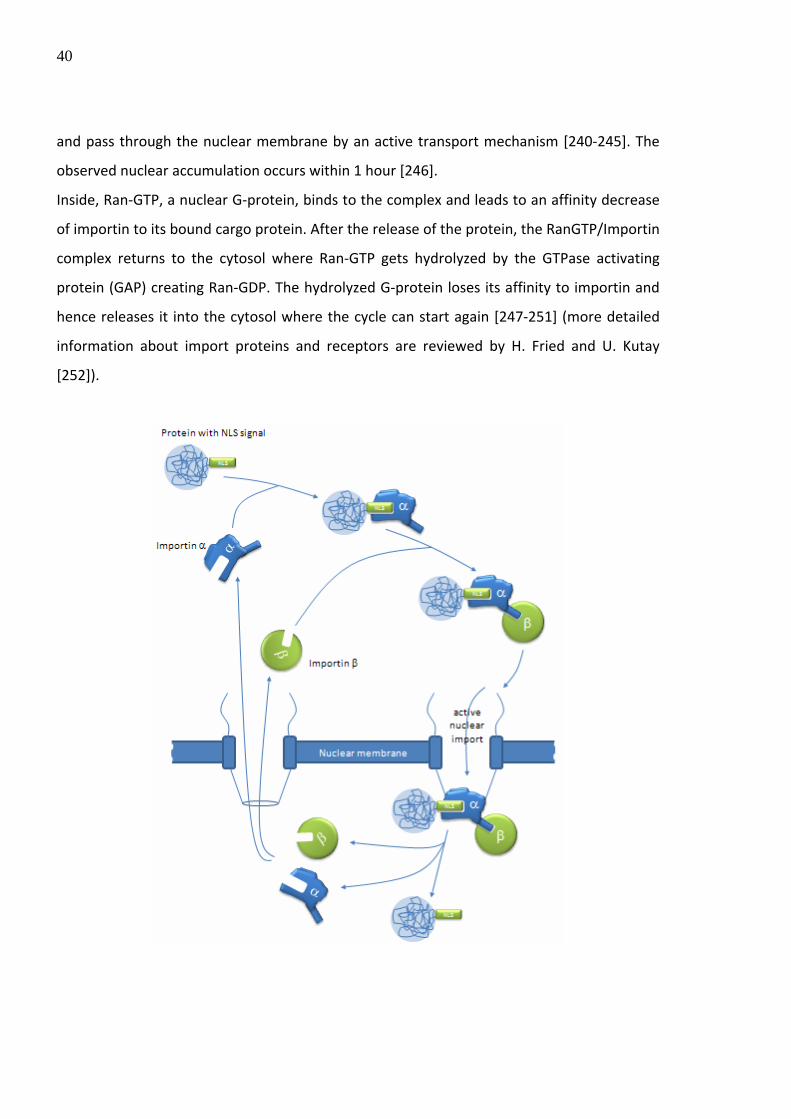
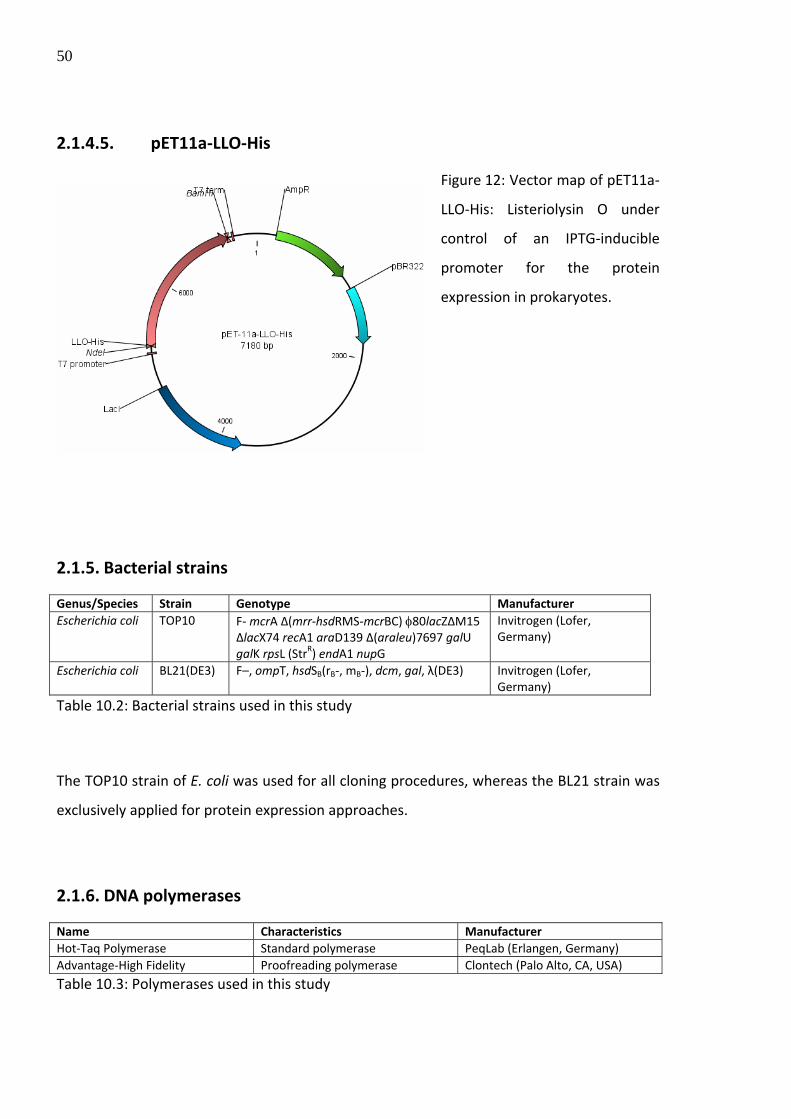
Figure 5 Life cycle of the influenza virus Figure 6 The nuclear pore complex transport channel between nucleus and cytoplasm Figure 7 Importin pathway for active transport of NLS‐tagged proteins into the cell nucleus Figure 8 Vector map of pCR2.1 Figure 9 Vector map of pDsRed‐Express‐C1 Figure 10 The vector map of pcDNA3 Figure 11 Vector map of pET11a Figure 12 Vector map of pET11a‐LLO‐HisListeriolysin O under control of an IPTG‐inducible
promoter for the protein expression in prokaryotes.
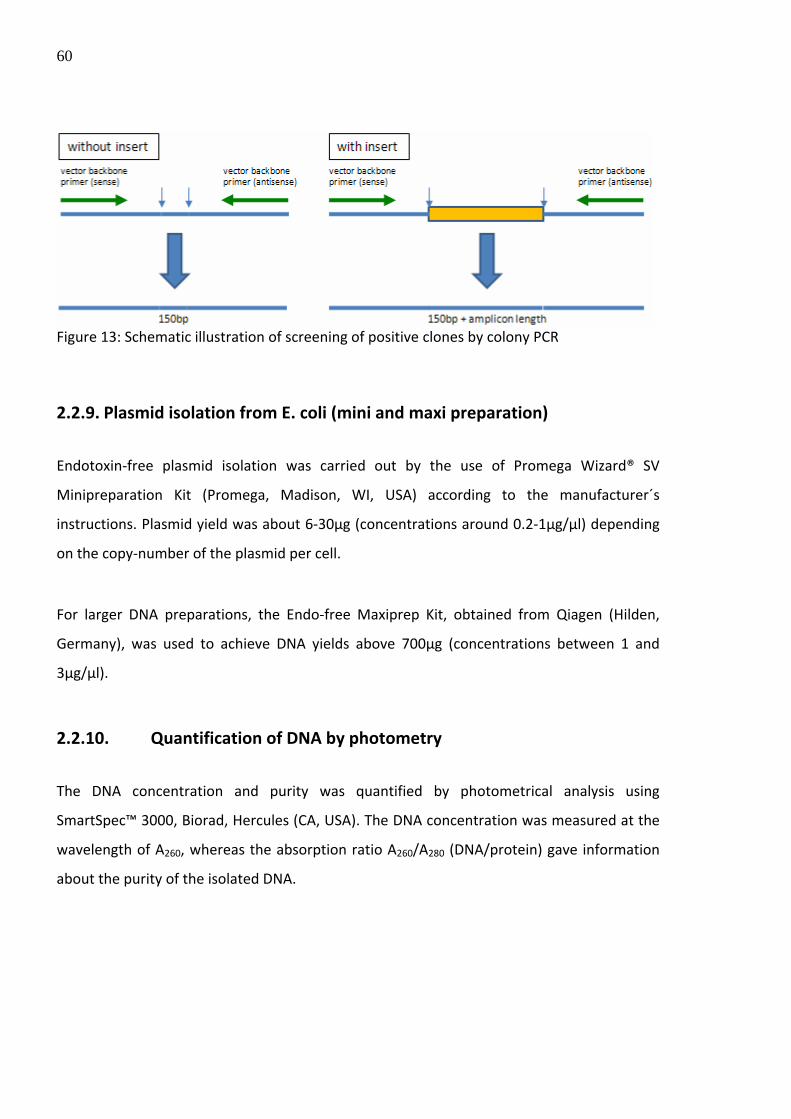
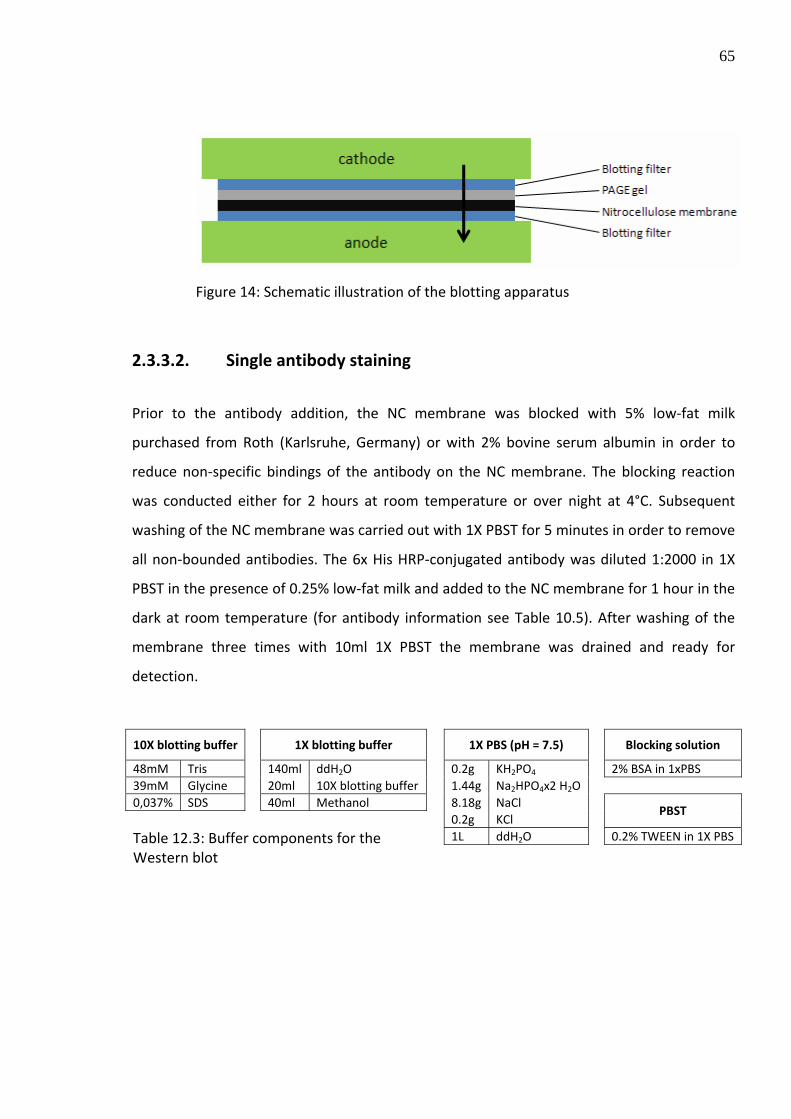
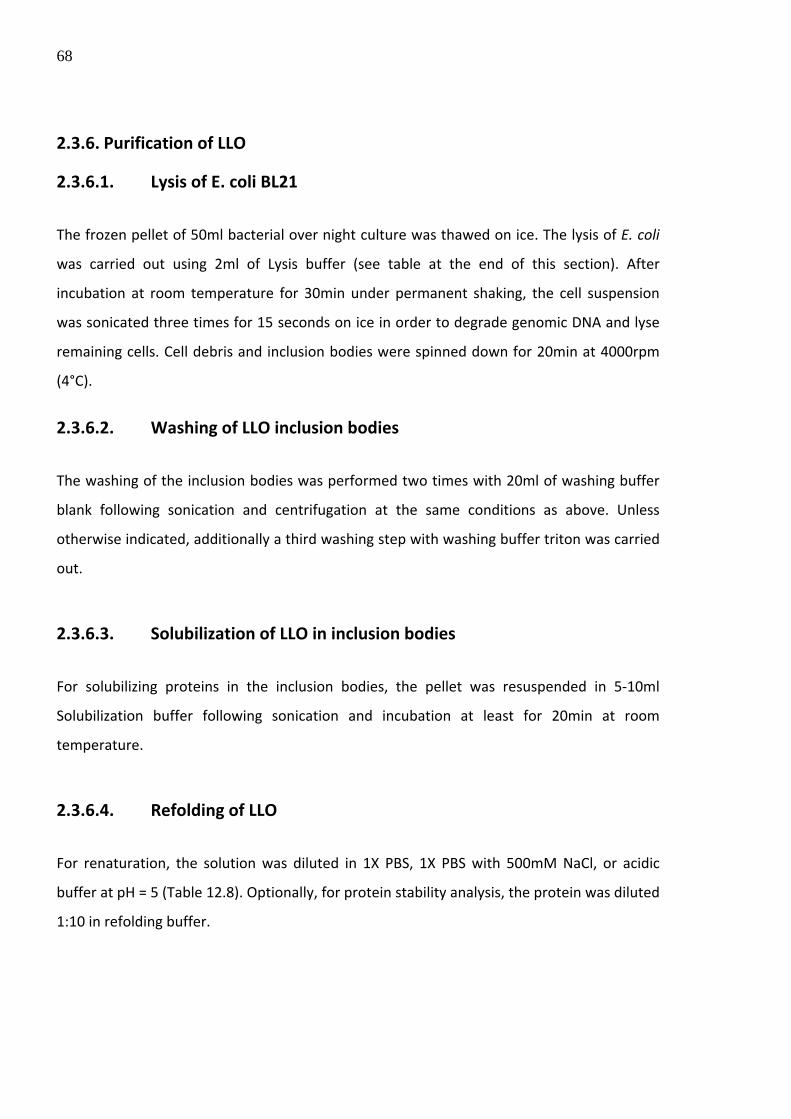
Figure 13 Schematic illustration of screening of positive clones by colony PCR Figure 14 Schematic illustration of the blotting apparatus Figure 15 Self‐made affinity column Figure 16 Calibration line of bovine serum albumin Figure 17 Washing of red blood cells Figure 18 Centrifuged non‐lysed and lysed RBCs Figure 19 PCR amplified LLO sequence on a 1% agarose gel Figure 20 Schematic illustration of LLO amplicon Figure 21 PAGE gel of protein expression screen with altered IPTG concentration and induction
time, respectively.
Figure 22 PAGE gels performed after the protein expression at different conditions (RT, 37°C, 2h, 4h, 0mM IPTG, 0,3mM IPTG)
Figure 23 PAGE gel and western blot of the expression and purification steps of Listeriolysin O (LLO) (10%)
Figure 24 PAGE gel of the expression and purification steps of Listeriolysin O (LLO) (10%) Figure 25 pH dependent hemolytic activity of purified LLO Figure 26 Schematic illustration of the protein refolding set up Figure 27 Listeriolysin O (LLO) stability after solubilization of the inclusion bodies in 5ml Gnd‐
HCl (50ml bacterial suspension) following dilution 1:10 with the depicted buffers.
Figure 28 Listeriolysin O (LLO) stability after solubilization of the inclusion bodies in 10ml Gnd‐HCl (50ml bacterial suspension) following dilution 1:10 with the depicted buffers.
Figure 29 Listeriolysin O (LLO) stability after solubilization of the inclusion bodies in 20ml Gnd‐HCl (50ml bacterial suspension) following dilution 1:10 with the depicted buffers.
Figure 30 Listeriolysin O (LLO) stability after solubilization of the inclusion bodies in 20ml Gnd‐HCl (50ml bacterial suspension) following dilution 1:10 with the depicted buffers
Figure 31 Stability of Listeriolysin O frozen in liquid nitrogen, stored at ‐80°C and thawed after different time points
Figure 32 Verification of the condensation capacity of poly‐L‐lysine (PLL) of about 30kDa at different moral ratios of plasmid DNA and PLL
Figure 33 Condensation of DNA labeled with SYBR green
14
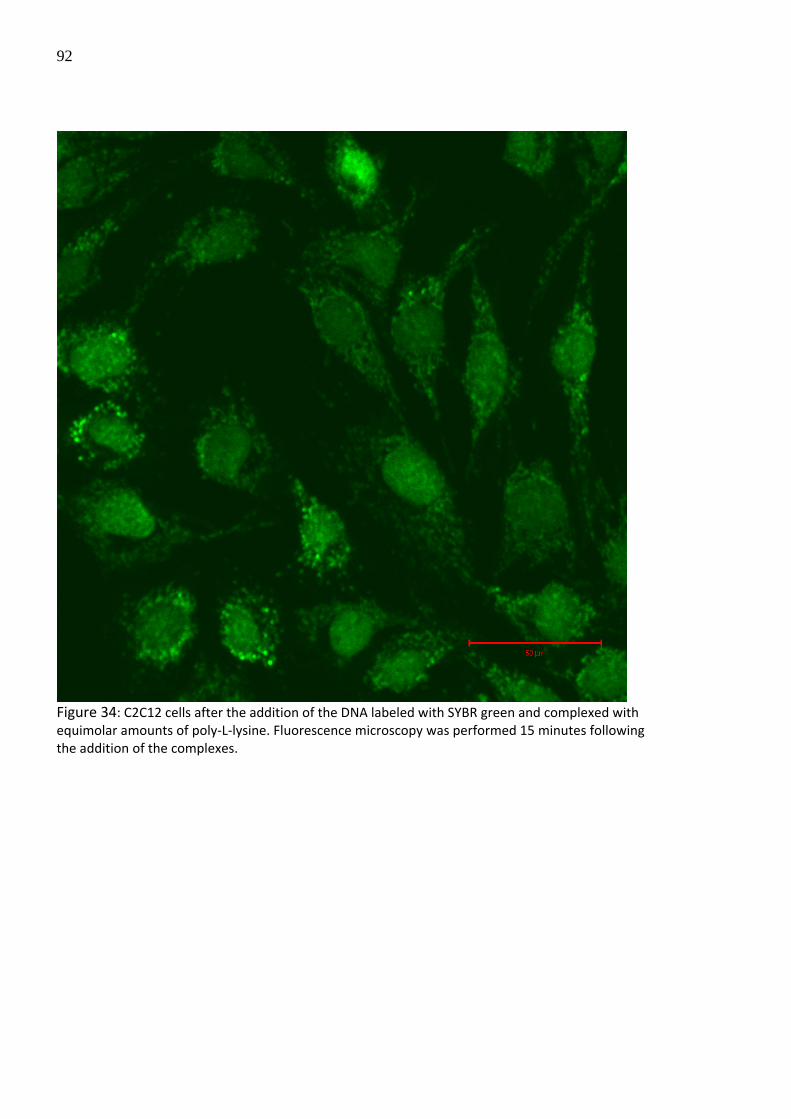
Figure 34 C2C12 cells after the addition of the DNA labeled with SYBR green and complexed with equimolar amounts of poly‐L‐lysine
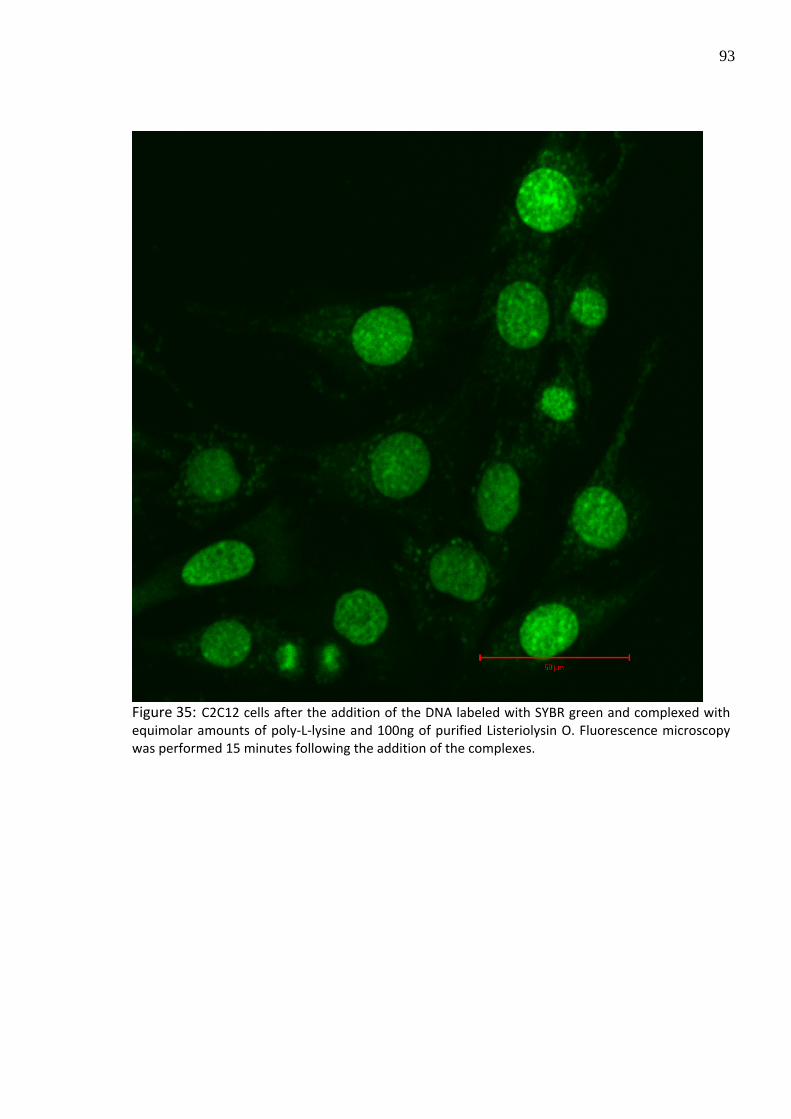
Figure 35 C2C12 cells after the addition of the DNA labeled with SYBR green and complexed with equimolar amounts of poly‐L‐lysine and 100ng of purified Listeriolysin O
15
1. Introduction
In contrast to strategies based on the introduction of transgenic cells expressing growth
factors (ex vivo therapy), or the direct administration of recombinant growth factors into
target systems, in vivo gene therapy approaches (introduction of therapeutic plasmids
encoded for growth factors) provide a promising alternative associated with lower
manufacturing costs, higher safety and increased bioactivity of the produced proteins (due
to host‐specific post‐translational modifications and correct folding of the locally produced
growth factors). In order to introduce exogenous DNA into cells in vitro and in vivo, several
strategies based on viral or non‐viral approaches can be applied.
viruses [4‐7], herpes viruses [8], lentiviruses [9] and epstein‐barr viruses [10, 11]) show by far
the highest transfection efficiencies in vitro and in vivo, whereas non‐viral vectors
(polycations, cationic lipids (section 1.1.2 and section 1.1.3), and mechanical methods
(1.1.1)) are limited in their efficacy to deliver genes, especially in the presence of serum and
other proteins, which makes unmodified non‐viral vectors inapplicably for in vivo
approaches. But nevertheless, due to safety aspects, the application of non‐viral gene
delivery systems in vivo gain more popularity due to the high disadvantageous potency of
viral systems to promote detrimental immune responses. Additionally, the viral tendency to
integrate introduced exogenous DNA into the host genome dramatically increases the
probability of tumor cell growth in target cells. Furthermore, non‐viral vectors score
concerning their manufacturing cost and easy handling during gene therapy approaches.
To conclude, it is more worthwhile, easier and non‐risky to increase the efficacy of the gene
delivery using non‐viral vectors by specific modifications or additional auxiliary substances,
than trying to make viral systems safer.
16
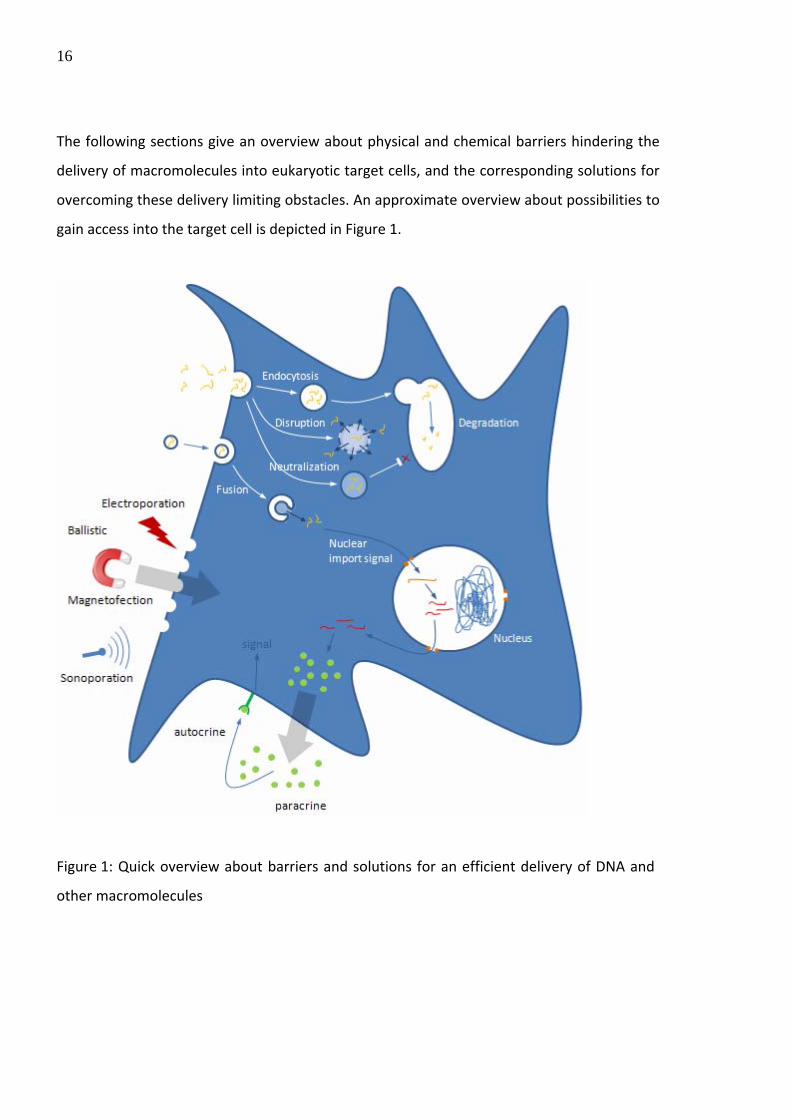
The following sections give an overview about physical and chemical barriers hindering the
delivery of macromolecules into eukaryotic target cells, and the corresponding solutions for
overcoming these delivery limiting obstacles. An approximate overview about possibilities to
gain access into the target cell is depicted in Figure 1.
Figure 1: Quick overview about barriers and solutions for an efficient delivery of DNA and
other macromolecules
17
1.1. Overcoming the cell membrane
Although the transfection efficiency and the level of gene expression is dependent on
various factors such plasmid size and copy number [12], the transfection efficiency in general
using nude DNA (DNA without auxiliary carrier systems, section 1.1.2), showed weak
efficacy, independently of the targeted cell and tissue type in vitro and in vivo, respectively.
1.1.1. Mechanical/physical methods
1.1.1.1. Magnetofection
Magnetic nanoparticles, formed by complexation of nucleic acids with biodegradable,
cationic and magnetic beads by electrostatic interactions, result in efficient DNA delivery
vectors in the presence of a locally applied magnetic field. The transport of these particles by
an adjacent magnetic field leads to a high transfection rate with low toxicity and avoids
harming the cell membrane (in contrast to biolistic transfection methods described in
chapter 1.1.1.4). Transfection with DNA or siRNA occurs within 15 minutes to 24h by
endosomal uptake on a broad range of cell types [13‐17].
1.1.1.2. Electroporation
Local application of repeated short electric pulses by small electrodes increases the
permeability of the cell membrane and therefore dramatically increases the uptake rate of
DNA directly into the cytosol [18, 19]. Transfection by electroporation is effectively applied
for in vitro transfection approaches for eukaryotic cells, especially in the case of hard to
transfect cells [20], whereas the transfection efficacy varies depending on the targeted cell
type. Advantageously, the electric pulses can be applied locally to the desired target cells or
tissue, avoiding unintentional systemic side‐effects. In vivo application has reached several
promising results concerning the transfection efficacy [21, 22], even in the transfection of
18
neuronal cells in the mammalian brain [23]. But there are still some attributes required to be
optimized, like cell and tissue damages due to the applied electric pulses.
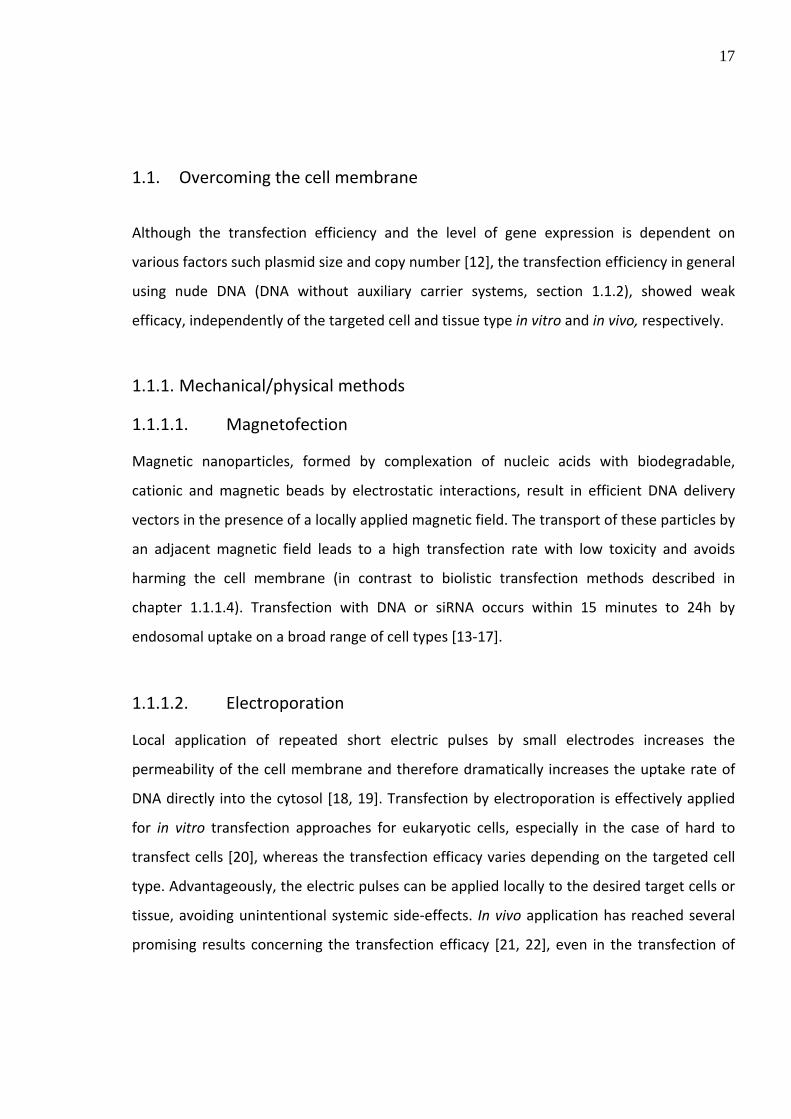
1.1.1.3. Sonoporation
Beside the electroporation technique, the mediation of DNA delivery by ultrasound offers a
promising and safe technique with a broad range of possibilities for clinical applications [24].
Depending on the settings of the sonoporation equipment (Table 1), an increased
permeability of the eukaryotic cell membrane is achieved [25‐29]. Additionally, for an
enhanced delivery of macromolecules like therapeutic DNA vectors, the introduction of
microbubbles, which are cavitated by the ultrasonic pulses, show significantly enhanced
results concerning gene delivery [30]. In contrast to the delivery of macromolecules by
electroporation (1.1.1.2), sonoporation offers a non‐invasive and a more gentle technology
for an efficient delivery of macromolecules in vivo.
Insonating acoustic pressure 0.05 to 3.5 MPa Pulse duration 4 to 32 µs Pulse frequency 0.5 to 5.0 MHz Pulse repetition frequency 10 to 3000 Hz Insonation time 0.1 to 900 s
Table 1: Parameters of sonoporation. Changes in the settings can significantly influence the efficiency of gene delivery [26]
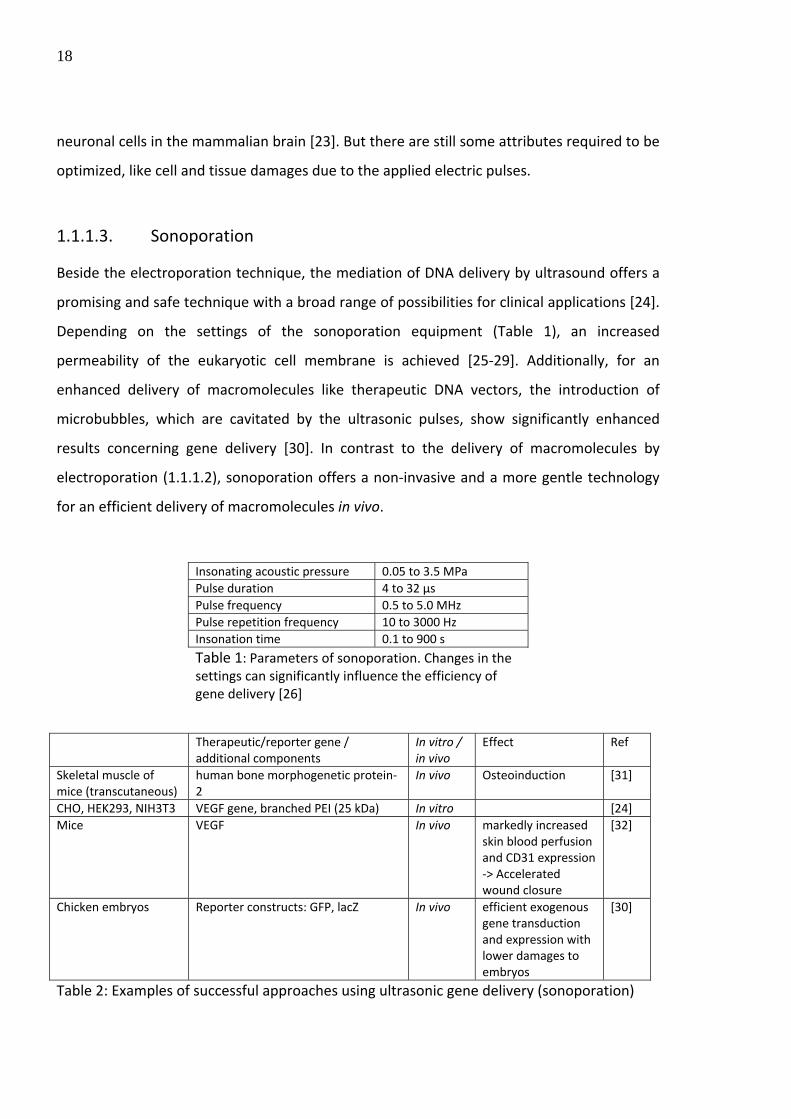
Therapeutic/reporter gene /
additional components In vitro / in vivo
Effect Ref
Skeletal muscle of mice (transcutaneous)
human bone morphogenetic protein‐2
In vivo Osteoinduction [31]
CHO, HEK293, NIH3T3 VEGF gene, branched PEI (25 kDa) In vitro [24] Mice VEGF In vivo markedly increased
skin blood perfusion and CD31 expression ‐> Accelerated wound closure
[32]
Chicken embryos Reporter constructs: GFP, lacZ In vivo efficient exogenous gene transduction and expression with lower damages to embryos
[30]
Table 2: Examples of successful approaches using ultrasonic gene delivery (sonoporation)
19
in vitro and in vivo
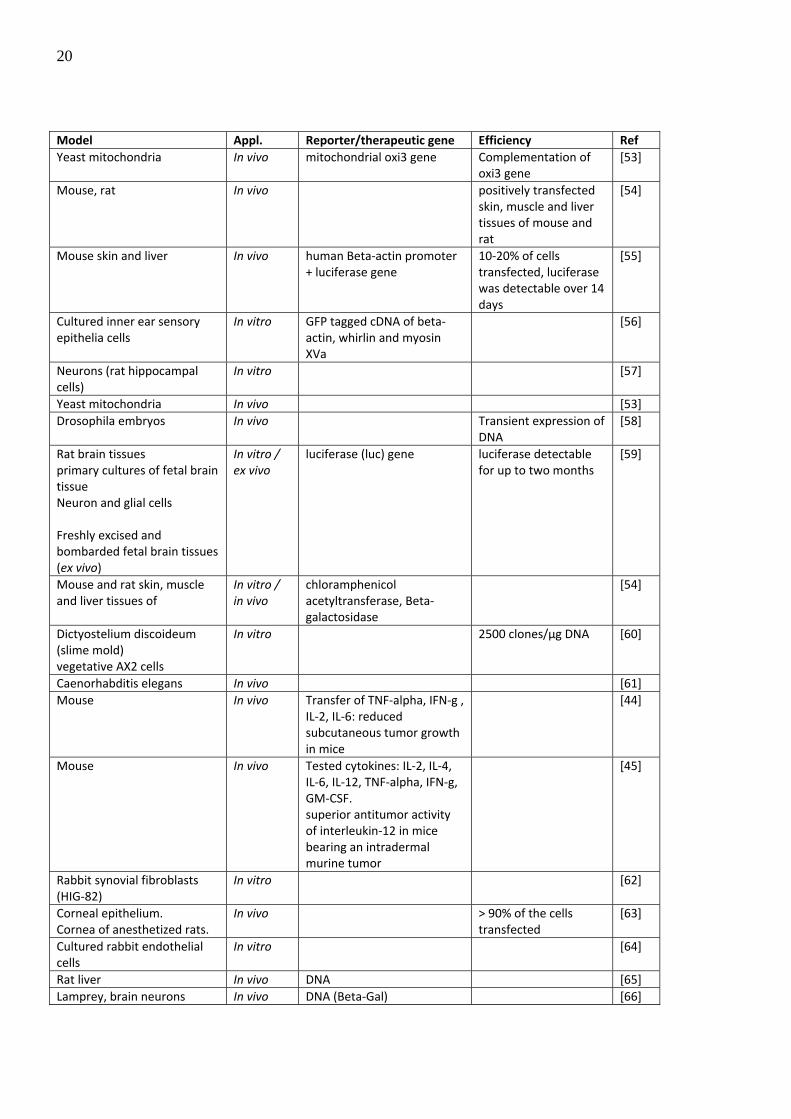
1.1.1.4. Ballistic gene delivery (gene gun)
Ballistic gene delivery methods offer a quick, contact‐free and easy to use application by
bombardment of cells with gold particles conjugated with exogenous DNA, which functions
as biolistic DNA bullets [33, 34]. The gold particles conjugated with macromolecules are
accelerated via helium gas pressure. Initially designed for efficient transfection of cells of
plant tissues [35‐40], this mechanical transfection method gain more and more popularity
for the application of in vitro transfection of DNA and other macromolecules in a broad
range of cells (Table 3) [41, 42]. However, the transfection efficiency is cell type dependent
and shows the highest efficacy if applied on skin cells.
To date, different specific modifications and optimizations of the ballistic gene delivery
method have been proceeded to adapt the gene delivery method to a broad range of
applications [33, 34, 41, 43]. Moreover, gene transfer by ballistic methods gains more and
more popularity for anti‐tumor treatment. For affirmation, local ballistic administration of
cytokine genes into tumor‐bearing animals to suppress tumor growth and indicate tumor
degradation is demonstrated to be a promising alternative application spectrum [44‐46].
Furthermore, direct ballistic gene transfer shows great success in the immunization and
vaccination of mice. In fact, an increase of the immune reaction according to the
introduction of viral and bacterial genes (V antigen of Yersinia pestis or the E2 glycoprotein
of Venezuelan Equine Encephalitis (VEE) virus [47] and immediate early protein of
pseudorabies virus [48]), as well as vaccination of turkeys by introducing plasmids encoding
the gene for the major outer membrane protein of Chlamydia psittaci [49], demonstrates
the high potency of ballistic gene delivery approaches. Moreover, ballistic introduction of
exogenous genes encoded for viral structural proteins [50] or mimotope genes (molecular
mimicry) [51, 52] shows promising effects in the immunization of mice.
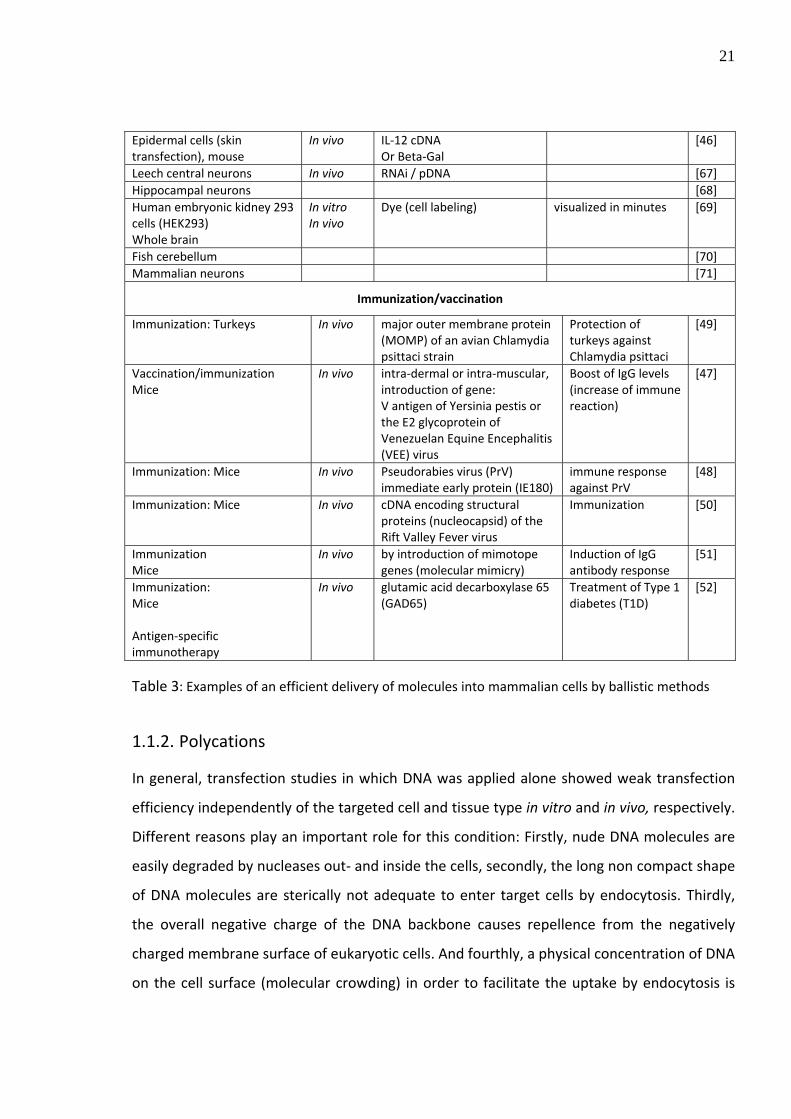
The following table lists examples successful delivery of macromolecules into mammalian
cells using ballistic methods.
20
Model Appl. Reporter/therapeutic gene Efficiency Ref Yeast mitochondria In vivo mitochondrial oxi3 gene Complementation of
oxi3 gene [53]
Mouse, rat In vivo positively transfected skin, muscle and liver tissues of mouse and rat
[54]
Mouse skin and liver In vivo human Beta‐actin promoter + luciferase gene
10‐20% of cells transfected, luciferase was detectable over 14 days
[55]
Cultured inner ear sensory epithelia cells
In vitro GFP tagged cDNA of beta‐actin, whirlin and myosin XVa
[56]
Neurons (rat hippocampal cells)
In vitro [57]
Yeast mitochondria In vivo [53] Drosophila embryos In vivo Transient expression of
DNA [58]
Rat brain tissues primary cultures of fetal brain tissue Neuron and glial cells Freshly excised and bombarded fetal brain tissues (ex vivo)
In vitro / ex vivo
luciferase (luc) gene luciferase detectable for up to two months
Caenorhabditis elegans In vivo [61] Mouse In vivo Transfer of TNF‐alpha, IFN‐g ,
IL‐2, IL‐6: reduced subcutaneous tumor growth in mice
[44]
Mouse In vivo Tested cytokines: IL‐2, IL‐4, IL‐6, IL‐12, TNF‐alpha, IFN‐g, GM‐CSF. superior antitumor activity of interleukin‐12 in mice bearing an intradermal murine tumor
[45]
Rabbit synovial fibroblasts (HIG‐82)
In vitro [62]
Corneal epithelium. Cornea of anesthetized rats.
In vivo > 90% of the cells transfected
[63]
Cultured rabbit endothelial cells
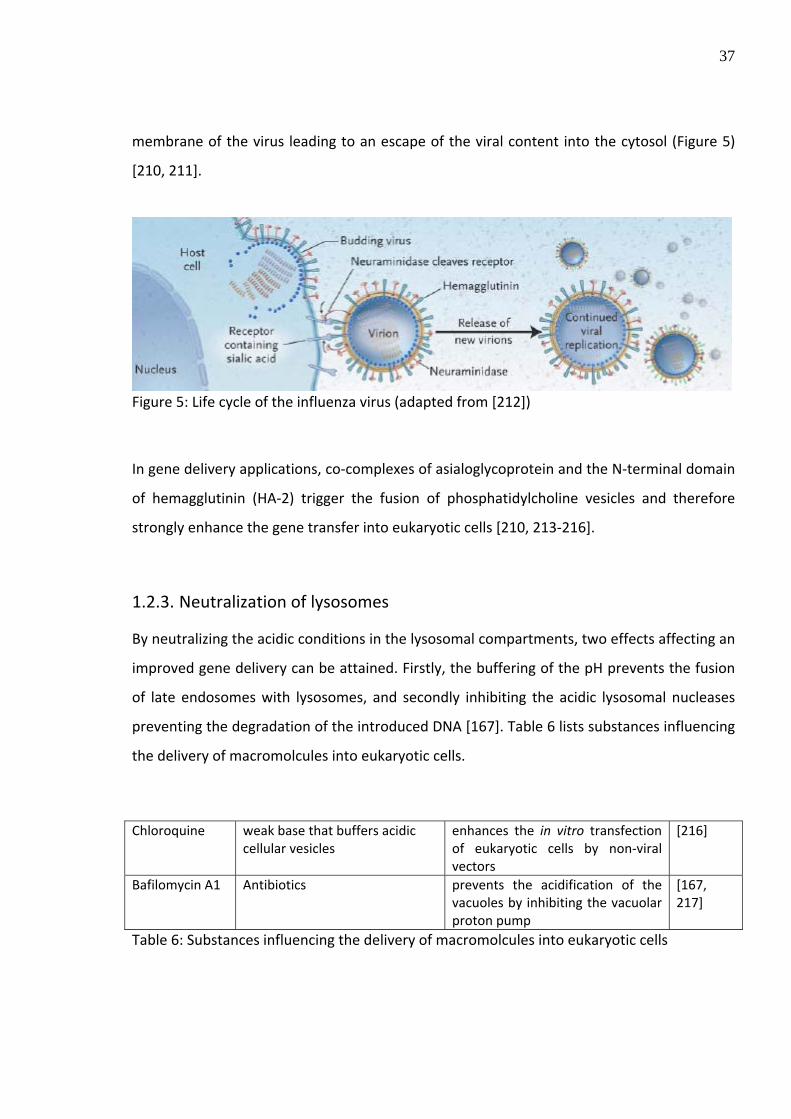
In vitro [64]
Rat liver In vivo DNA [65] Lamprey, brain neurons In vivo DNA (Beta‐Gal) [66]
21
Epidermal cells (skin transfection), mouse
In vivo IL‐12 cDNA Or Beta‐Gal
[46]
Leech central neurons In vivo RNAi / pDNA [67] Hippocampal neurons [68] Human embryonic kidney 293 cells (HEK293) Whole brain
In vitro In vivo
Dye (cell labeling) visualized in minutes [69]
Fish cerebellum [70] Mammalian neurons [71]
Immunization/vaccination
Immunization: Turkeys In vivo major outer membrane protein (MOMP) of an avian Chlamydia psittaci strain
Protection of turkeys against Chlamydia psittaci
[49]
Vaccination/immunization Mice
In vivo intra‐dermal or intra‐muscular, introduction of gene: V antigen of Yersinia pestis or the E2 glycoprotein of Venezuelan Equine Encephalitis (VEE) virus
Boost of IgG levels (increase of immune reaction)
[47]
Immunization: Mice In vivo Pseudorabies virus (PrV) immediate early protein (IE180)
immune response against PrV
[48]
Immunization: Mice In vivo cDNA encoding structural proteins (nucleocapsid) of the Rift Valley Fever virus
Immunization [50]
Immunization Mice
In vivo by introduction of mimotope genes (molecular mimicry)
Induction of IgG antibody response
[51]
Immunization: Mice Antigen‐specific immunotherapy
In vivo glutamic acid decarboxylase 65 (GAD65)
Treatment of Type 1 diabetes (T1D)
[52]
Table 3: Examples of an efficient delivery of molecules into mammalian cells by ballistic methods
1.1.2. Polycations
In general, transfection studies in which DNA was applied alone showed weak transfection
efficiency independently of the targeted cell and tissue type in vitro and in vivo, respectively.
Different reasons play an important role for this condition: Firstly, nude DNA molecules are
easily degraded by nucleases out‐ and inside the cells, secondly, the long non compact shape
of DNA molecules are sterically not adequate to enter target cells by endocytosis. Thirdly,
the overall negative charge of the DNA backbone causes repellence from the negatively
charged membrane surface of eukaryotic cells. And fourthly, a physical concentration of DNA
on the cell surface (molecular crowding) in order to facilitate the uptake by endocytosis is
22
not given. To avoid the described situations, additional components have to be included in
order to protect the DNA against degradation, decrease or entire neutralize the negative
charge and convert the DNA structure into a sterically more applicable form.
By complexing free DNA with
positively charged carriers
(polycations or cationic lipids), all of
these conditions can be attained at
once in order to guarantee a more
efficient delivery of exogenous DNA
into the target cells. Concerning the
net surface charge, complexation of
DNA leads to an overall neutral or
positive surface charge and allows
the DNA:carrier complex to interact
with the target cell membrane by
electrostatic interactions in order to
enhance the cellular uptake through
the endocytotic pathway [72].
Furthermore, the compact structure
of the DNA particles is sterically
advantaged for the uptake by
endocytosis. And moreover, the
complexation protects the bound DNA against the digestion by nucleases. The classical and
most promising DNA carriers include the positively charged polyethyleneimine (PEI) [73],
Poly(lactic‐co‐glycolic acid) (PLGA) [74] and poly‐L‐Lysine (PLL) with consists of
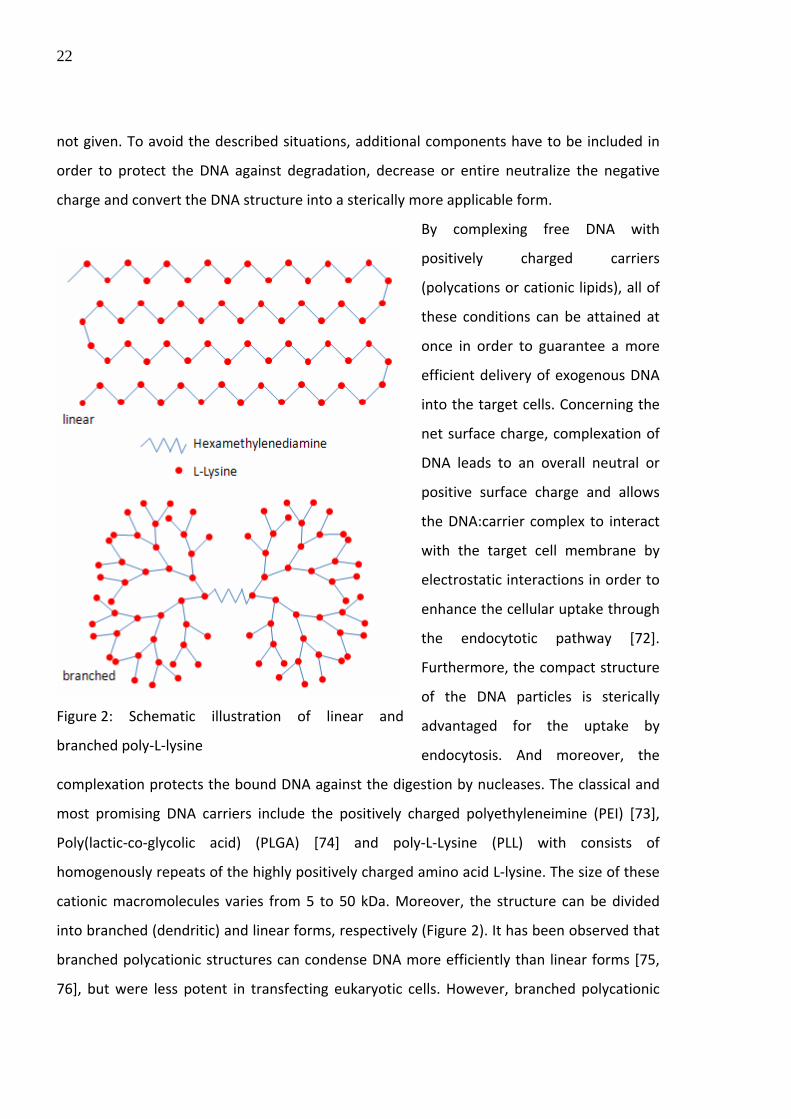
homogenously repeats of the highly positively charged amino acid L‐lysine. The size of these
cationic macromolecules varies from 5 to 50 kDa. Moreover, the structure can be divided
into branched (dendritic) and linear forms, respectively (Figure 2). It has been observed that
branched polycationic structures can condense DNA more efficiently than linear forms [75,
76], but were less potent in transfecting eukaryotic cells. However, branched polycationic
Figure 2: Schematic illustration of linear and
branched poly‐L‐lysine
23
macromolecules score to be less toxic than their linear forms, which in turn is an important
factor concerning in vivo applications [77, 78].
Nevertheless, different behavior and characteristics in complexation, cytotoxicity, release
and uptake of the complexed DNA can be achieved by altering the size [79], the structure
and the molecular ratio [80] of DNA and polycationic carrier, and finally by additional
chemical and structural modifications, respectively (Table 4) [75].
1.1.2.1. DNA condensation and N/P ratio
Concerning cell transfection efficacy, the formation of DNA condensates determines the
future properties and behavior of the complexed particles. Alterations in the efficiency of
DNA condensation by changing the N/P ratio influence cytotoxicity, uptake efficiency, DNA
protection potential and release kinetics of DNA:polycation particles and is therefore
considered to be an important factor in influencing the transfection efficiency.
Due to positively charged amino groups of polycationic macromolecules, ionical interactions
with negatively charged phosphate groups of the DNA backbone leads to DNA condensation
into small DNA:polycation particles [73, 76, 81, 82]. For estimation of the ionic balance of
polycation and DNA, the N/P ratio gives a good benchmark for the relative amounts of the
positively charged nitrogen groups of the polycation (N) and the negatively charged
phosphate groups of the DNA backbone (P). By indicating the N/P ratio, an approximate
value of the relativeness of DNA and cationic agent, and therefore the condensation
behavior, is given [73, 83].
Complete complexation of polycations with DNA is observed to occur at N/P ratios between
1 and 4, forming particles with a neutral net charge [73, 80, 84]. In addition, the molecular
weight of polycations is direct proportional to the DNA condensation efficiency. Decrease of
the molecular weight leads to a less effective DNA binding activity [75]. However, small
molecular weight PLL (10–30 residues) have still sufficient potential for DNA binding, and
24
advantageously form larger DNA particles with decreased toxicity compared with DNA
particles complexed with high molecular weight PLL [72, 85].
1.1.2.2. Properties of polycationic carriers complexed with different types of DNA
Comparative studies with application of different DNA types (circular and linearized plasmid
DNA, small oligonucelotides) imply that the uptake of the complexed particles is
independent of the type of the DNA, but circular DNA was more active to get expressed
inside the cells [80]. Nevertheless, condensation of small single‐stranded DNA molecules
with PLL leads to smaller complexes and increased gene delivery in comparison to double‐
stranded DNA [86].
1.1.2.3. Cytotoxicity (+ modifications to decrease toxicity)
Cytotoxic and immunogenic effects of polycationic DNA carriers are of imminent importance
in particular for in vivo applications [73, 87‐89]. Toxicity analysis reveal that non‐modified
cationic gene delivery carriers induce production of cytokines [90], and moreover,
comparative studies in mouse fibroblasts rank PEI as the most toxic component followed by
PLL and poly(diallyl‐dimethyl‐ammonium chloride) [91]. For affirmation, additional toxicity
studies with PEI conjugated with DNA and PEI alone demonstrate an alteration of the gene
expression pattern in vitro [92] and an activation of Th1/Th2‐ and adaptive immune
responses in vivo [93]. Interestingly, PEI complexed with DNA shows a higher
immunogenicity compared to PEI alone.
In conclusion, as rule of thumb, the transfection efficiency is inverse proportional to the
toxicity [88, 94]. Wadhwa, M.S., et al. demonstrate lower cytotoxicity by decreasing the
molecular weight of PLL. Moreover, 13–18 lysine residues have shown to have sufficient
potential to bind DNA and form microparticles with decreased cytotoxicity [85]. Based on
these results, additional modifications on polycations have demonstrated to lower their
toxicity (Table 4) [95‐97].
25
1.1.2.4. Non specific interactions with cells and proteins (blood components)
The transfection efficiency with cationic polymers (PEI and PLL) and lipids (DOTAP) is limited
through the high ionical interaction potency of DNA carriers with serum and tissue
components [98‐100], especially with bovine serum albumin (BSA), lipoproteins,
macroglobulin [89] and erythrocytes [101‐103].
Unlike for in vitro applications, the avoidance of serum components in order to prevent non
specific crossreactions, is not feasible for approaches in vivo. Therefore, interactions of the
DNA carrier with circulating blood components have to be reduced by shielding the net
positive charge of the polycationic carrier in order to achieve an efficient cell transfection.
But by shielding the net charge, also the electrostatic attraction and adhesion with the
negatively charged cell membrane is attenuated at the same time. For this reason, additional
surface receptors or ligands have to be introduced into the vector system to ensure specific
attachment onto the cell surface for an efficient cellular uptake [84]. As example, a
promising DNA carrier arises by covalent attachment of polyethyleneglycol (PEG) onto the
surface of cationic particles. The introduction of PEG (PEGylation) results in shielding the
particles from non specific interactions with blood components and extended half life
through stabilization of the microparticles, which transforms the cationic particles in a more
applicable vector for systemic and local gene delivery in vivo [75, 84, 97, 101]. Additionally, a
lower toxic effect is achieved (Table 4) [95, 96].
26
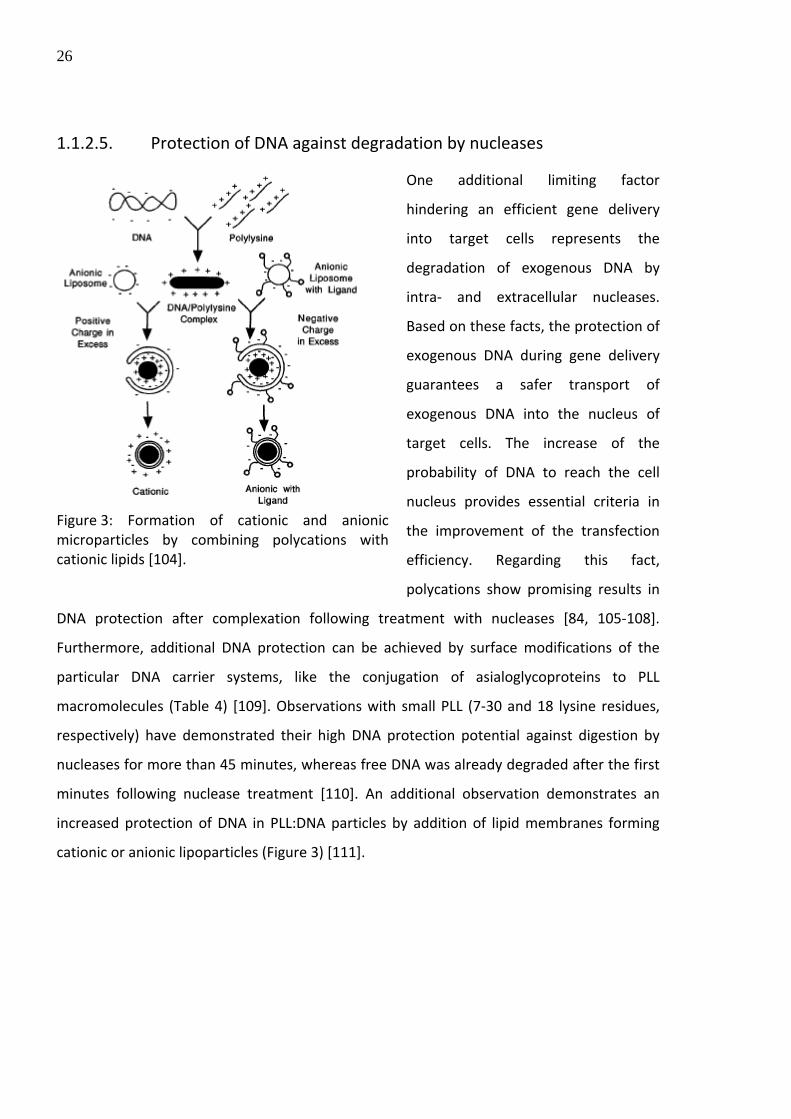
1.1.2.5. Protection of DNA against degradation by nucleases
One additional limiting factor
hindering an efficient gene delivery
into target cells represents the
degradation of exogenous DNA by
intra‐ and extracellular nucleases.
Based on these facts, the protection of
exogenous DNA during gene delivery
guarantees a safer transport of
exogenous DNA into the nucleus of
target cells. The increase of the
probability of DNA to reach the cell
nucleus provides essential criteria in
the improvement of the transfection
efficiency. Regarding this fact,
polycations show promising results in
DNA protection after complexation following treatment with nucleases [84, 105‐108].
Furthermore, additional DNA protection can be achieved by surface modifications of the
particular DNA carrier systems, like the conjugation of asialoglycoproteins to PLL
macromolecules (Table 4) [109]. Observations with small PLL (7‐30 and 18 lysine residues,
respectively) have demonstrated their high DNA protection potential against digestion by
nucleases for more than 45 minutes, whereas free DNA was already degraded after the first
minutes following nuclease treatment [110]. An additional observation demonstrates an
increased protection of DNA in PLL:DNA particles by addition of lipid membranes forming
cationic or anionic lipoparticles (Figure 3) [111].
Figure 3: Formation of cationic and anionic microparticles by combining polycations with cationic lipids [104].
27
1.1.2.6. Transfection of cells using polycations (and modifications to
enhance transfection)
An efficient uptake and expression of exogenous genes in vitro and in vivo is dependent on
an efficient DNA protection against degradation by nucleases in the blood circulation and
cell‐cell compartments [110], the rate of condensation and release kinetics of DNA bound to
the polycation, and their rate of interactions with blood components, cell membrane and
extracellular matrix, respectively [84].
Polycationic particles complexed with DNA are able to transfect primary cells [112‐115] and
cell lines [107, 116, 117] in vitro and in vivo [98, 115, 118], respectively, whereas the
transfection efficiency varies depending on the cell and tissue type [73, 119]. As a
benchmark, the internalization of polycationic particles occurs within 10‐30 min, whereas
maximum uptake is reached after 2 hours [116, 120]. Based on this, different chemical
structures of the DNA carrier effect different physicochemical behavior and can either in‐ or
decrease the cellular uptake and therefore influence the transfection efficiency [121]. By
increasing the positive net charge and the particle size, the interaction with the cell
membrane and the proteoglycans on the cell surface and therefore the uptake rate of
particles is enhanced [86, 110, 119]. In conclusion, the transfection efficiency is influenced
by the particle size and the net surface charge which can be altered by changing the
DNA/polycation ratio or the molecular weight of the polycation (the higher molecular
weight, the smaller the particle size) [94, 122]. But the ratio of DNA and polycation, and
therefore the rate of DNA condensation, has to be determined carefully. High excess of
positively charged macromolecules can improve the uptake and transfection efficacy by
enhanced electrostatic binding with the negatively charged membrane surface of the target
cell[86], but hinder efficient access to the introduced DNA. Additionally, high amounts of
polycations can protect its complexed cargo DNA against degradation by nucleases more
efficiently [75, 110].
Condensation analysis of DNA with linear PLL have shown a more efficient DNA
complexation and uptake in comparison with dendritic polypeptides [75, 123], but on the
other hand a less efficient gene expression assumably due to too tight interactions and
28
therefore low DNA release rates of the PLL carrier [90]. In contrast, no decrease in the
transcription rate of bound DNA could be observed when DNA was closely attached to PEI
[124].
1.1.2.7. Properties of polycations for lysosomal escape (proton sponge)
Uptake of PEI/DNA particles into endosomes in target cells occurs within 10‐20 minutes
[116, 120]. But in contrast to the particle uptake, lysosomal release is demonstrated to be
the rate limiting step in the cell transfection with PEI/DNA particles [124]. Entrapment and
degradation in the lysosomes of target cells highly limits the efficiency of gene delivery and
leads to a considerable decrease in the number of cells expressing the introduced gene
[116]. This data demonstrate that transfection efficiency is not only dependent on rate of
DNA uptake but also on the probability to escape from the endosomes [125].
Concerning cell transfection with polycations, several groups postulate the so‐called “proton
sponge hypothesis” observed in cell transfection approaches using PEI as DNA carrier. Unlike
PLL, PEI shows the capacity to buffer the acidic lysosomal pH, causing water influx by
osmotic forces leading to a burst of the vesicles [75, 94, 106, 124, 126‐128]. Probably, the
amino groups, which represent the main molecule group of PEI, are responsible for the pH
buffering ability [115].
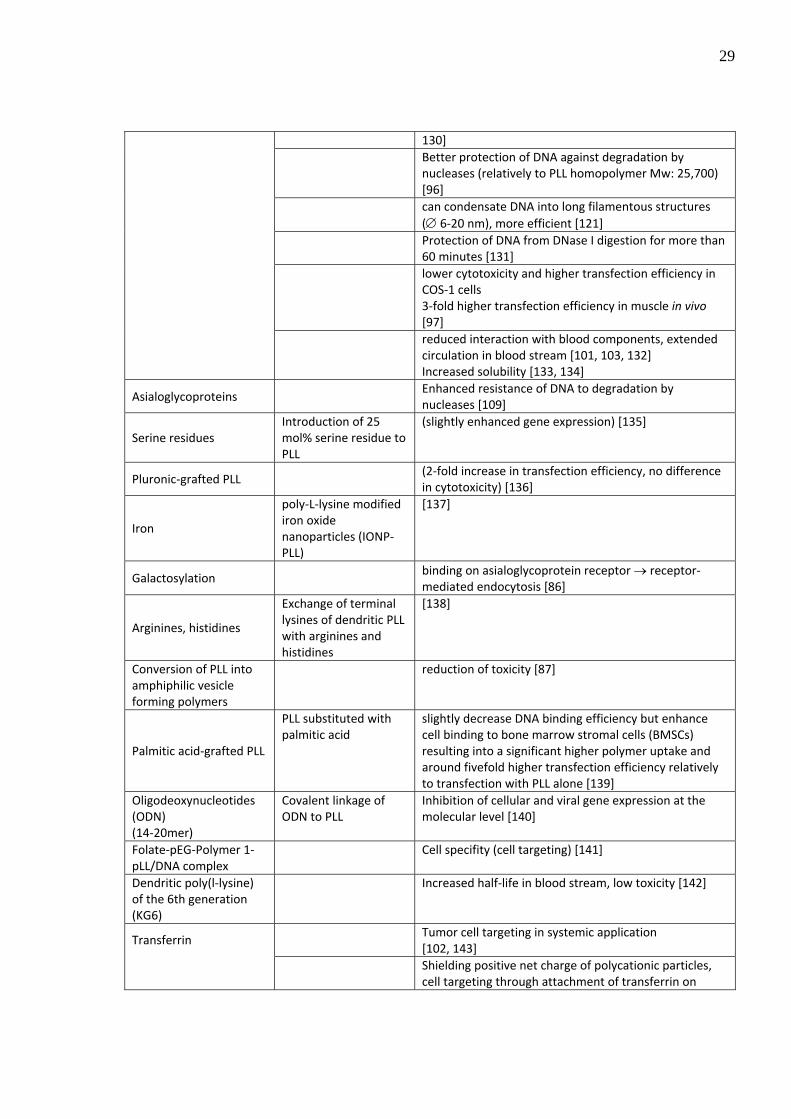
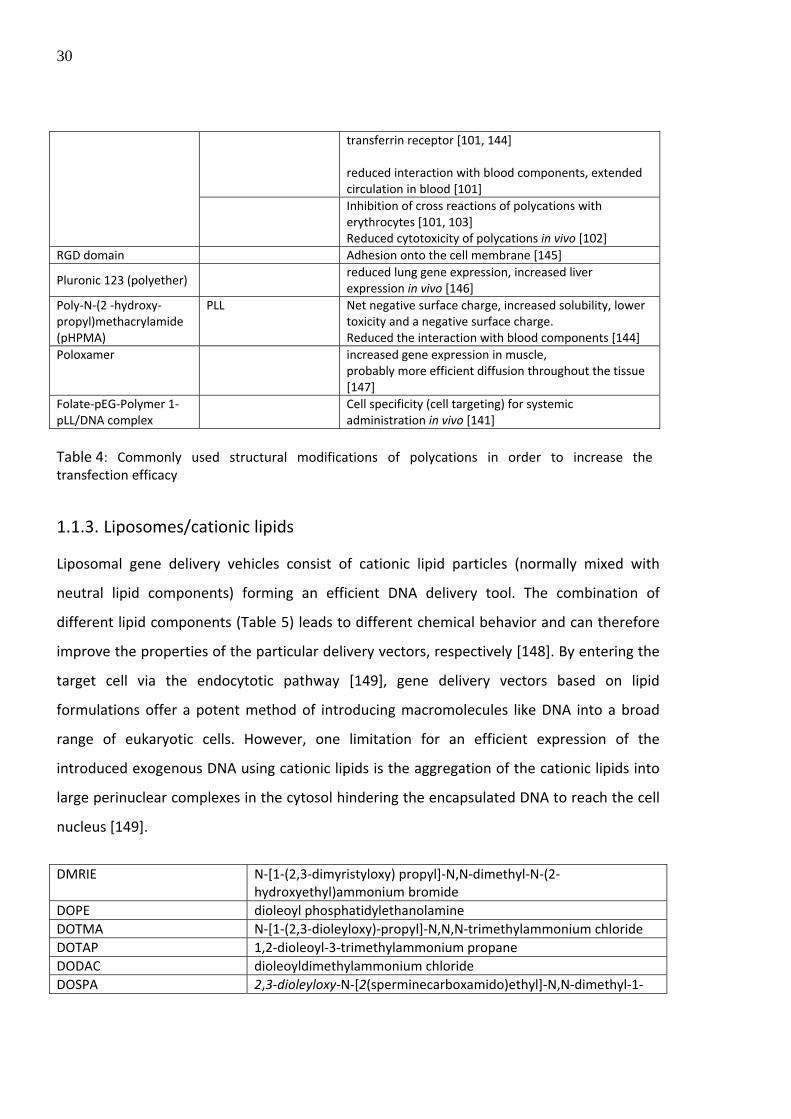
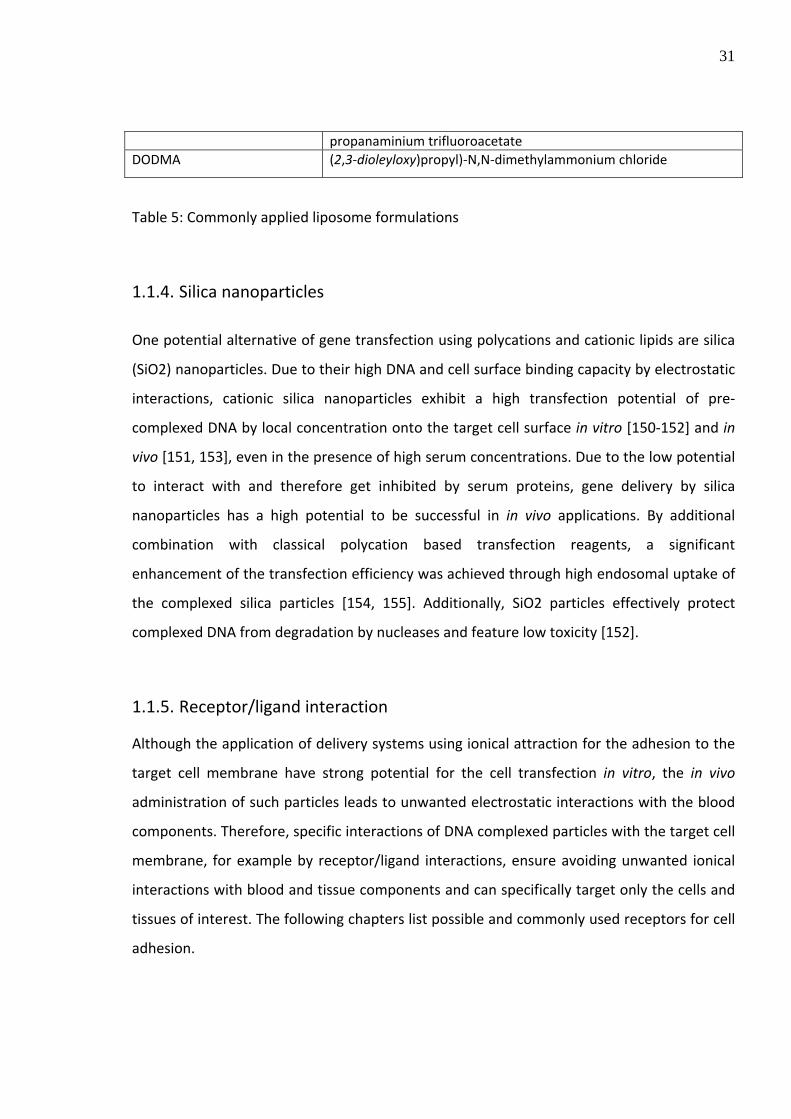
1.1.2.8. Modifications to enhance transfection
Transfection efficiency with DNA condensed by polycations is still poor due to the low
endosomal escape and access of complexed DNA, and additionally due to high cross
reactions with blood components [75]. To increase the efficacy, several modifications of
polycationic carriers have led to improved abilities of the DNA carrier (Table 4).
Modification Description Effect introduction of the hydrophilic polymer PEG, commonly used in in vivo applications
Sterical stabilization of the complex [75, 129, 130]
PEGylation
Decrease the toxic effect of the polymer complex (comparatively to PLL and PEI homopolymer) [95, 96,
29
130] Better protection of DNA against degradation by
nucleases (relatively to PLL homopolymer Mw: 25,700) [96]
can condensate DNA into long filamentous structures (∅ 6‐20 nm), more efficient [121]
Protection of DNA from DNase I digestion for more than 60 minutes [131]
lower cytotoxicity and higher transfection efficiency in COS‐1 cells 3‐fold higher transfection efficiency in muscle in vivo [97]
reduced interaction with blood components, extended circulation in blood stream [101, 103, 132] Increased solubility [133, 134]
Asialoglycoproteins Enhanced resistance of DNA to degradation by
nucleases [109]
Serine residues Introduction of 25 mol% serine residue to PLL
(slightly enhanced gene expression) [135]
Pluronic‐grafted PLL (2‐fold increase in transfection efficiency, no difference
in cytotoxicity) [136]
Iron
poly‐L‐lysine modified iron oxide nanoparticles (IONP‐PLL)
[137]
Galactosylation binding on asialoglycoprotein receptor → receptor‐
mediated endocytosis [86]
Arginines, histidines
Exchange of terminal lysines of dendritic PLL with arginines and histidines
[138]
Conversion of PLL into amphiphilic vesicle forming polymers
reduction of toxicity [87]
Palmitic acid‐grafted PLL
PLL substituted with palmitic acid
slightly decrease DNA binding efficiency but enhance cell binding to bone marrow stromal cells (BMSCs) resulting into a significant higher polymer uptake and around fivefold higher transfection efficiency relatively to transfection with PLL alone [139]
Oligodeoxynucleotides (ODN) (14‐20mer)
Covalent linkage of ODN to PLL
Inhibition of cellular and viral gene expression at the molecular level [140]
Folate‐pEG‐Polymer 1‐pLL/DNA complex
Cell specifity (cell targeting) [141]
Dendritic poly(l‐lysine) of the 6th generation (KG6)
Increased half‐life in blood stream, low toxicity [142]
Tumor cell targeting in systemic application [102, 143]
Transferrin
Shielding positive net charge of polycationic particles, cell targeting through attachment of transferrin on
30
transferrin receptor [101, 144] reduced interaction with blood components, extended circulation in blood [101]
Inhibition of cross reactions of polycations with erythrocytes [101, 103] Reduced cytotoxicity of polycations in vivo [102]
expression in vivo [146] Poly‐N‐(2 ‐hydroxy‐ propyl)methacrylamide (pHPMA)
PLL Net negative surface charge, increased solubility, lower toxicity and a negative surface charge. Reduced the interaction with blood components [144]
Poloxamer increased gene expression in muscle, probably more efficient diffusion throughout the tissue [147]
Folate‐pEG‐Polymer 1‐pLL/DNA complex
Cell specificity (cell targeting) for systemic administration in vivo [141]
Table 4: Commonly used structural modifications of polycations in order to increase the transfection efficacy
1.1.3. Liposomes/cationic lipids
Liposomal gene delivery vehicles consist of cationic lipid particles (normally mixed with
neutral lipid components) forming an efficient DNA delivery tool. The combination of
different lipid components (Table 5) leads to different chemical behavior and can therefore
improve the properties of the particular delivery vectors, respectively [148]. By entering the
target cell via the endocytotic pathway [149], gene delivery vectors based on lipid
formulations offer a potent method of introducing macromolecules like DNA into a broad
range of eukaryotic cells. However, one limitation for an efficient expression of the
introduced exogenous DNA using cationic lipids is the aggregation of the cationic lipids into
large perinuclear complexes in the cytosol hindering the encapsulated DNA to reach the cell
But in contrast, other observations showed no increase of NLS‐conjugated transfection by
using cationic lipids and polycations, respectively [303, 308, 309]. Direct introduction of
exogenous DNA by microinjection showed no nuclear detection of the DNA, neither with
linear DNA conjugated to NLS bearing peptides alone [309, 310] nor in combination with
cationic polymers [303, 311].
1.4. Aim in this work
The aim of this study was to overcome the lysosomal degradation of introduced therapeutic
DNA by disrupting the lysosomes of the eukaryotic target cells (principles described in
section 1.2.1.3). For this purpose, the bacterial hemolytic protein LLO was expressed in E.
coli und purified until homogeneity and applied directly to gene transfer systems to test the
possible enhancement of the delivery of macromolecules in mouse skeletal myoblast
precursor cells.
45
2. Materials and Methods
2.1. Materials
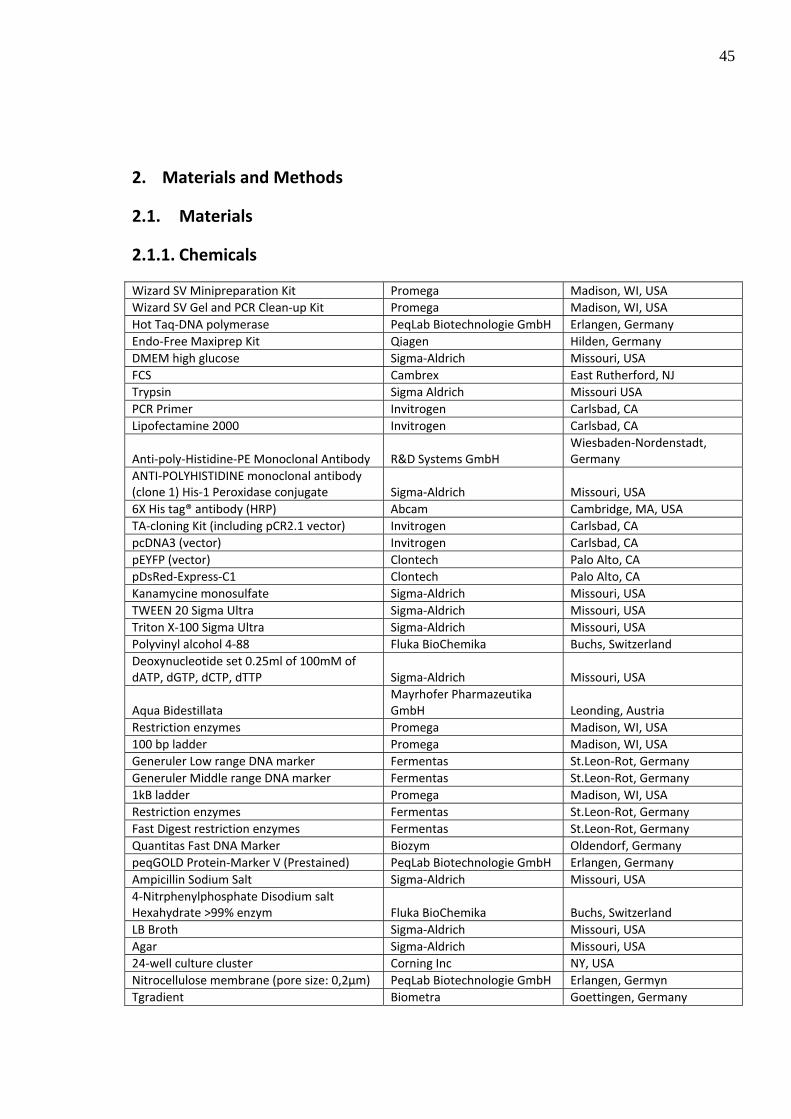
2.1.1. Chemicals
Wizard SV Minipreparation Kit Promega Madison, WI, USA Wizard SV Gel and PCR Clean‐up Kit Promega Madison, WI, USA Hot Taq‐DNA polymerase PeqLab Biotechnologie GmbH Erlangen, Germany Endo‐Free Maxiprep Kit Qiagen Hilden, Germany DMEM high glucose Sigma‐Aldrich Missouri, USA FCS Cambrex East Rutherford, NJ Trypsin Sigma Aldrich Missouri USA PCR Primer Invitrogen Carlsbad, CA Lipofectamine 2000 Invitrogen Carlsbad, CA
Anti‐poly‐Histidine‐PE Monoclonal Antibody R&D Systems GmbH Wiesbaden‐Nordenstadt, Germany
ANTI‐POLYHISTIDINE monoclonal antibody (clone 1) His‐1 Peroxidase conjugate Sigma‐Aldrich Missouri, USA 6X His tag® antibody (HRP) Abcam Cambridge, MA, USA TA‐cloning Kit (including pCR2.1 vector) Invitrogen Carlsbad, CA pcDNA3 (vector) Invitrogen Carlsbad, CA pEYFP (vector) Clontech Palo Alto, CA pDsRed‐Express‐C1 Clontech Palo Alto, CA Kanamycine monosulfate Sigma‐Aldrich Missouri, USA TWEEN 20 Sigma Ultra Sigma‐Aldrich Missouri, USA Triton X‐100 Sigma Ultra Sigma‐Aldrich Missouri, USA Polyvinyl alcohol 4‐88 Fluka BioChemika Buchs, Switzerland Deoxynucleotide set 0.25ml of 100mM of dATP, dGTP, dCTP, dTTP Sigma‐Aldrich Missouri, USA
Aqua Bidestillata Mayrhofer Pharmazeutika GmbH Leonding, Austria
Restriction enzymes Promega Madison, WI, USA 100 bp ladder Promega Madison, WI, USA Generuler Low range DNA marker Fermentas St.Leon‐Rot, Germany Generuler Middle range DNA marker Fermentas St.Leon‐Rot, Germany 1kB ladder Promega Madison, WI, USA Restriction enzymes Fermentas St.Leon‐Rot, Germany Fast Digest restriction enzymes Fermentas St.Leon‐Rot, Germany Quantitas Fast DNA Marker Biozym Oldendorf, Germany peqGOLD Protein‐Marker V (Prestained) PeqLab Biotechnologie GmbH Erlangen, Germany Ampicillin Sodium Salt Sigma‐Aldrich Missouri, USA 4‐Nitrphenylphosphate Disodium salt Hexahydrate >99% enzym Fluka BioChemika Buchs, Switzerland LB Broth Sigma‐Aldrich Missouri, USA Agar Sigma‐Aldrich Missouri, USA 24‐well culture cluster Corning Inc NY, USA Nitrocellulose membrane (pore size: 0,2µm) PeqLab Biotechnologie GmbH Erlangen, Germyn Tgradient Biometra Goettingen, Germany
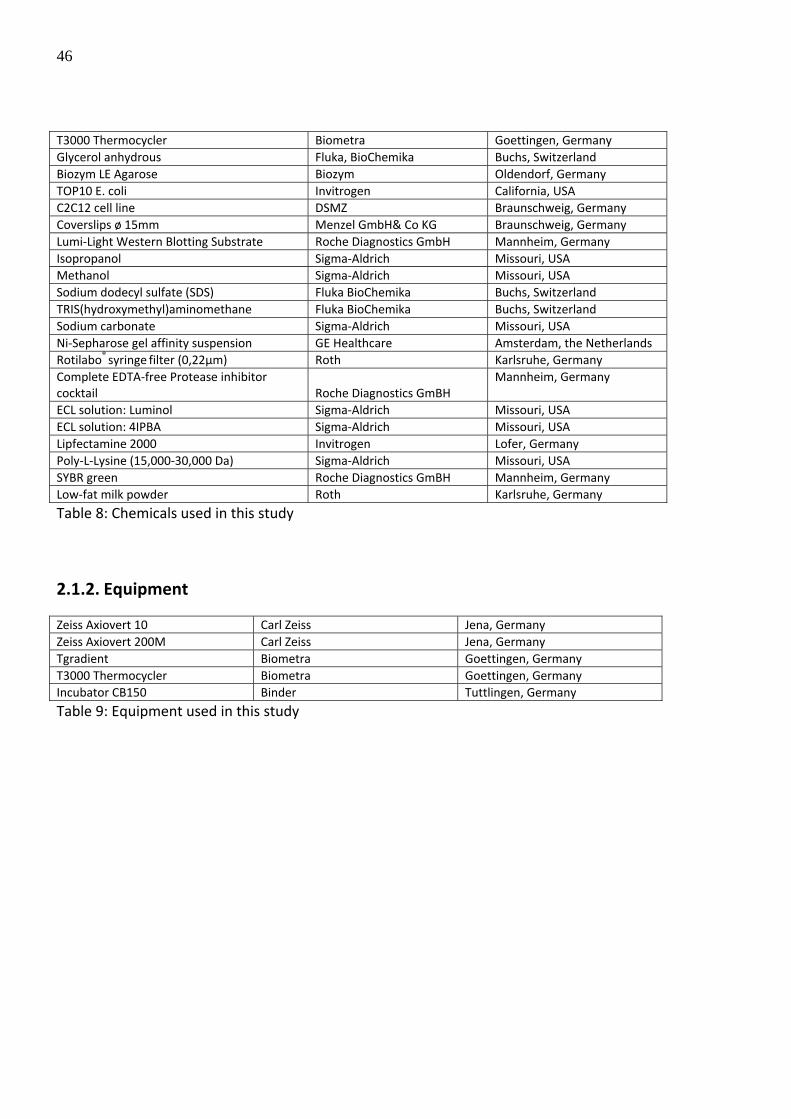
46
T3000 Thermocycler Biometra Goettingen, Germany Glycerol anhydrous Fluka, BioChemika Buchs, Switzerland Biozym LE Agarose Biozym Oldendorf, Germany TOP10 E. coli Invitrogen California, USA C2C12 cell line DSMZ Braunschweig, Germany Coverslips ø 15mm Menzel GmbH& Co KG Braunschweig, Germany Lumi‐Light Western Blotting Substrate Roche Diagnostics GmbH Mannheim, Germany Isopropanol Sigma‐Aldrich Missouri, USA Methanol Sigma‐Aldrich Missouri, USA Sodium dodecyl sulfate (SDS) Fluka BioChemika Buchs, Switzerland TRIS(hydroxymethyl)aminomethane Fluka BioChemika Buchs, Switzerland Sodium carbonate Sigma‐Aldrich Missouri, USA Ni‐Sepharose gel affinity suspension GE Healthcare Amsterdam, the Netherlands Rotilabo® syringe filter (0,22µm) Roth Karlsruhe, Germany Complete EDTA‐free Protease inhibitor cocktail Roche Diagnostics GmBH
Mannheim, Germany
ECL solution: Luminol Sigma‐Aldrich Missouri, USA ECL solution: 4IPBA Sigma‐Aldrich Missouri, USA Lipfectamine 2000 Invitrogen Lofer, Germany Poly‐L‐Lysine (15,000‐30,000 Da) Sigma‐Aldrich Missouri, USA SYBR green Roche Diagnostics GmBH Mannheim, Germany Low‐fat milk powder Roth Karlsruhe, Germany
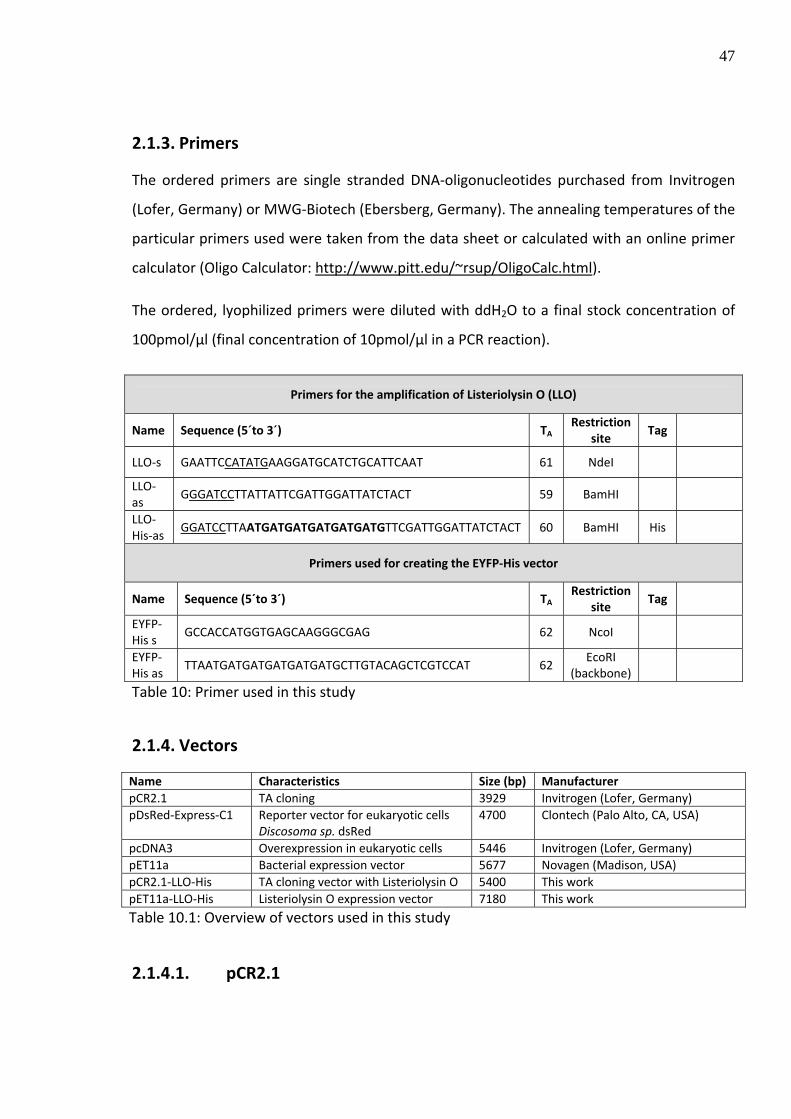
The ordered, lyophilized primers were diluted with ddH2O to a final stock concentration of
100pmol/µl (final concentration of 10pmol/µl in a PCR reaction).
Primers for the amplification of Listeriolysin O (LLO)
Name Sequence (5´to 3´) TA Restriction
site Tag
LLO‐s GAATTCCATATGAAGGATGCATCTGCATTCAAT 61 NdeI
LLO‐as
GGGATCCTTATTATTCGATTGGATTATCTACT 59 BamHI
LLO‐His‐as
GGATCCTTAATGATGATGATGATGATGTTCGATTGGATTATCTACT 60 BamHI His
Primers used for creating the EYFP‐His vector
Name Sequence (5´to 3´) TA Restriction
site Tag
EYFP‐His s
GCCACCATGGTGAGCAAGGGCGAG 62 NcoI
EYFP‐His as
TTAATGATGATGATGATGATGCTTGTACAGCTCGTCCAT 62 EcoRI
(backbone)
Table 10: Primer used in this study
2.1.4. Vectors
Name Characteristics Size (bp) Manufacturer pCR2.1 TA cloning 3929 Invitrogen (Lofer, Germany) pDsRed‐Express‐C1 Reporter vector for eukaryotic cells
Discosoma sp. dsRed 4700 Clontech (Palo Alto, CA, USA)
pcDNA3 Overexpression in eukaryotic cells 5446 Invitrogen (Lofer, Germany) pET11a Bacterial expression vector 5677 Novagen (Madison, USA) pCR2.1‐LLO‐His TA cloning vector with Listeriolysin O 5400 This work pET11a‐LLO‐His Listeriolysin O expression vector 7180 This work
Table 10.1: Overview of vectors used in this study
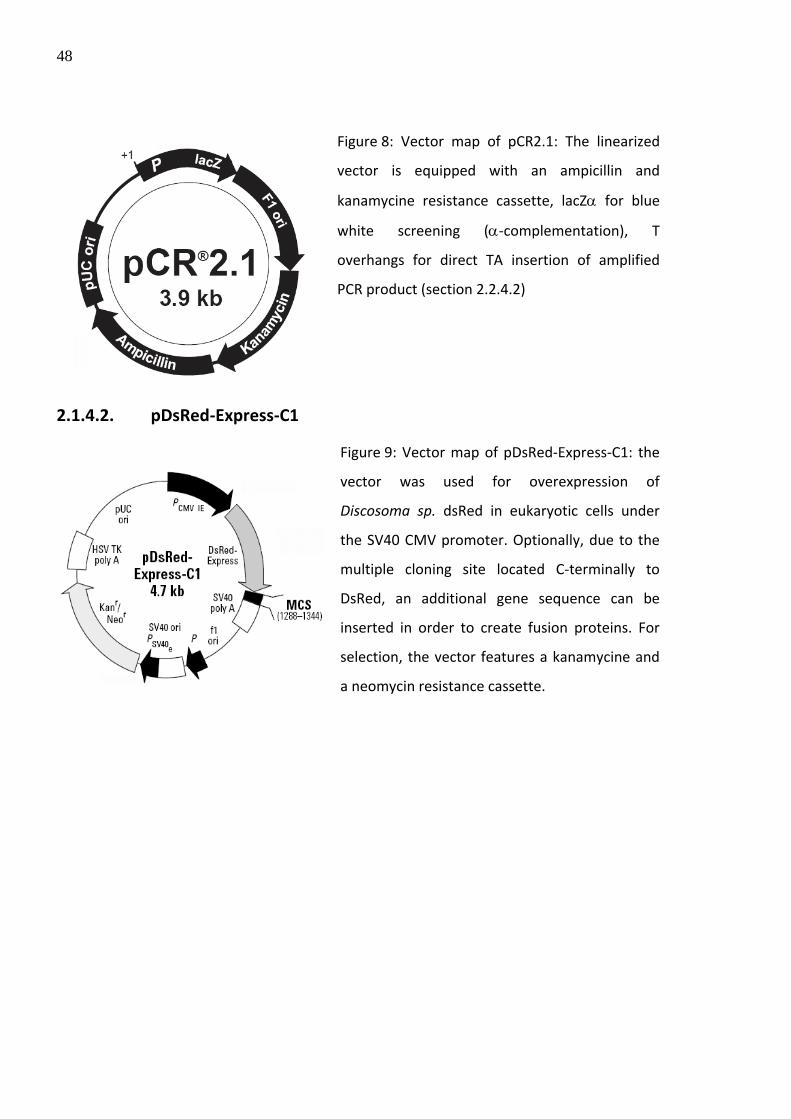
2.1.4.1. pCR2.1
48
Figure 8: Vector map of pCR2.1: The linearized
vector is equipped with an ampicillin and
kanamycine resistance cassette, lacZα for blue
white screening (α‐complementation), T
overhangs for direct TA insertion of amplified
PCR product (section 2.2.4.2)
2.1.4.2. pDsRed‐Express‐C1
Figure 9: Vector map of pDsRed‐Express‐C1: the
vector was used for overexpression of
Discosoma sp. dsRed in eukaryotic cells under
the SV40 CMV promoter. Optionally, due to the
multiple cloning site located C‐terminally to
DsRed, an additional gene sequence can be
inserted in order to create fusion proteins. For
selection, the vector features a kanamycine and
a neomycin resistance cassette.
49
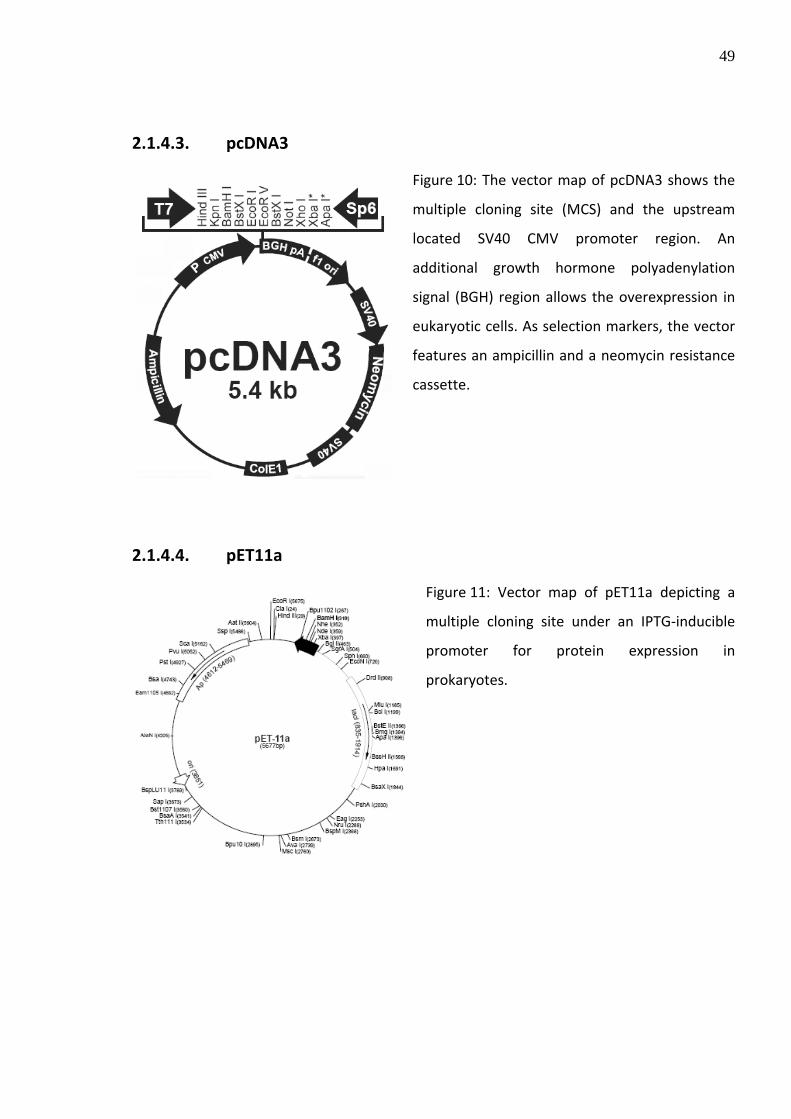
2.1.4.3. pcDNA3
Figure 10: The vector map of pcDNA3 shows the
multiple cloning site (MCS) and the upstream
located SV40 CMV promoter region. An
additional growth hormone polyadenylation
signal (BGH) region allows the overexpression in
eukaryotic cells. As selection markers, the vector
The TOP10 strain of E. coli was used for all cloning procedures, whereas the BL21 strain was
exclusively applied for protein expression approaches.
2.1.6. DNA polymerases
Name Characteristics Manufacturer Hot‐Taq Polymerase Standard polymerase PeqLab (Erlangen, Germany) Advantage‐High Fidelity Proofreading polymerase Clontech (Palo Alto, CA, USA)
Table 10.3: Polymerases used in this study
51
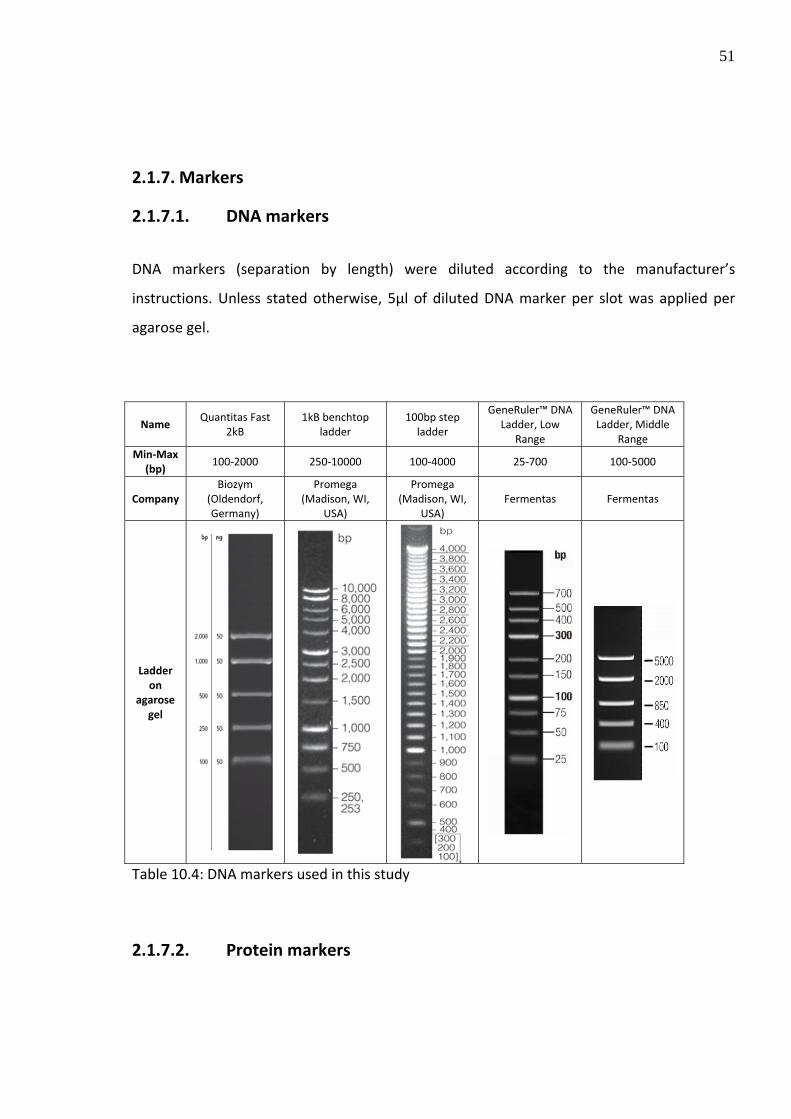
2.1.7. Markers
2.1.7.1. DNA markers
DNA markers (separation by length) were diluted according to the manufacturer’s
instructions. Unless stated otherwise, 5µl of diluted DNA marker per slot was applied per
agarose gel.
Name Quantitas Fast
2kB 1kB benchtop
ladder 100bp step ladder
GeneRuler™ DNA Ladder, Low
Range
GeneRuler™ DNA Ladder, Middle
Range Min‐Max
(bp) 100‐2000 250‐10000 100‐4000 25‐700 100‐5000
Company Biozym
(Oldendorf, Germany)
Promega (Madison, WI,
USA)
Promega (Madison, WI,
USA) Fermentas Fermentas
Ladder on
agarose gel
Table 10.4: DNA markers used in this study
2.1.7.2. Protein markers
52
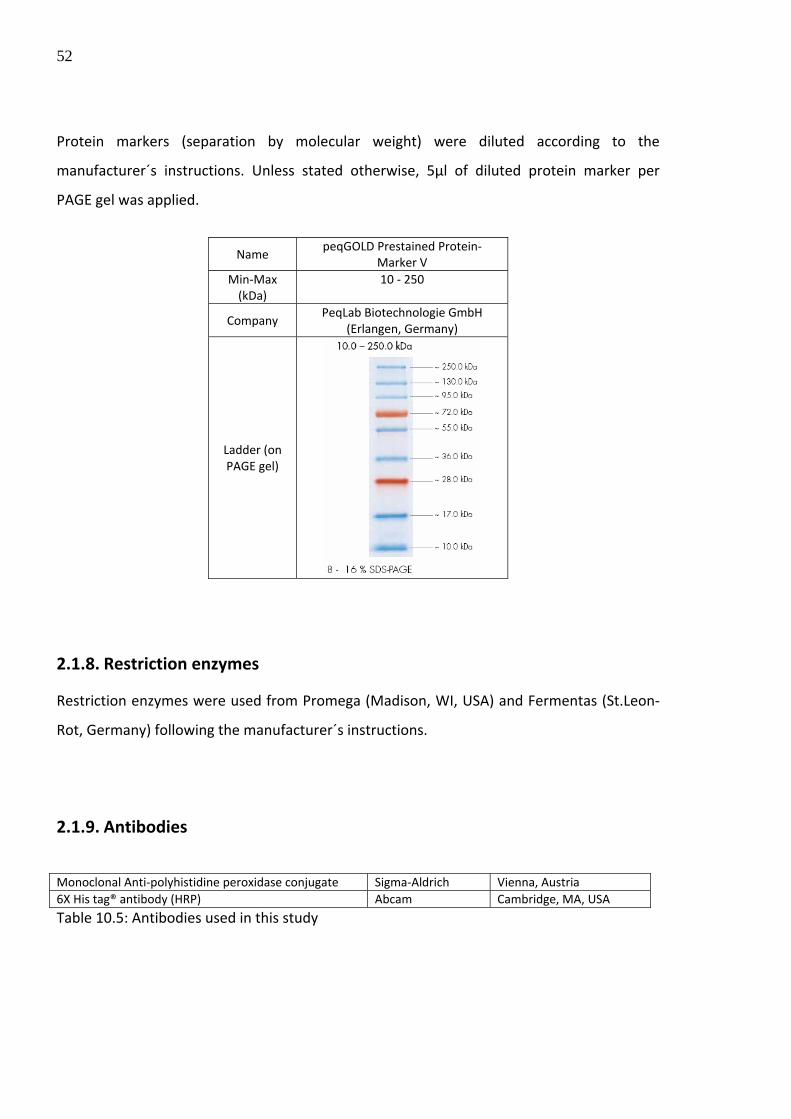
Protein markers (separation by molecular weight) were diluted according to the
manufacturer´s instructions. Unless stated otherwise, 5µl of diluted protein marker per
PAGE gel was applied.
Name
peqGOLD Prestained Protein‐Marker V
Min‐Max (kDa)
10 ‐ 250
Company PeqLab Biotechnologie GmbH
(Erlangen, Germany)
Ladder (on PAGE gel)
2.1.8. Restriction enzymes
Restriction enzymes were used from Promega (Madison, WI, USA) and Fermentas (St.Leon‐
Rot, Germany) following the manufacturer´s instructions.
2.1.9. Antibodies
Monoclonal Anti‐polyhistidine peroxidase conjugate Sigma‐Aldrich Vienna, Austria 6X His tag® antibody (HRP) Abcam Cambridge, MA, USA
Table 10.5: Antibodies used in this study
53
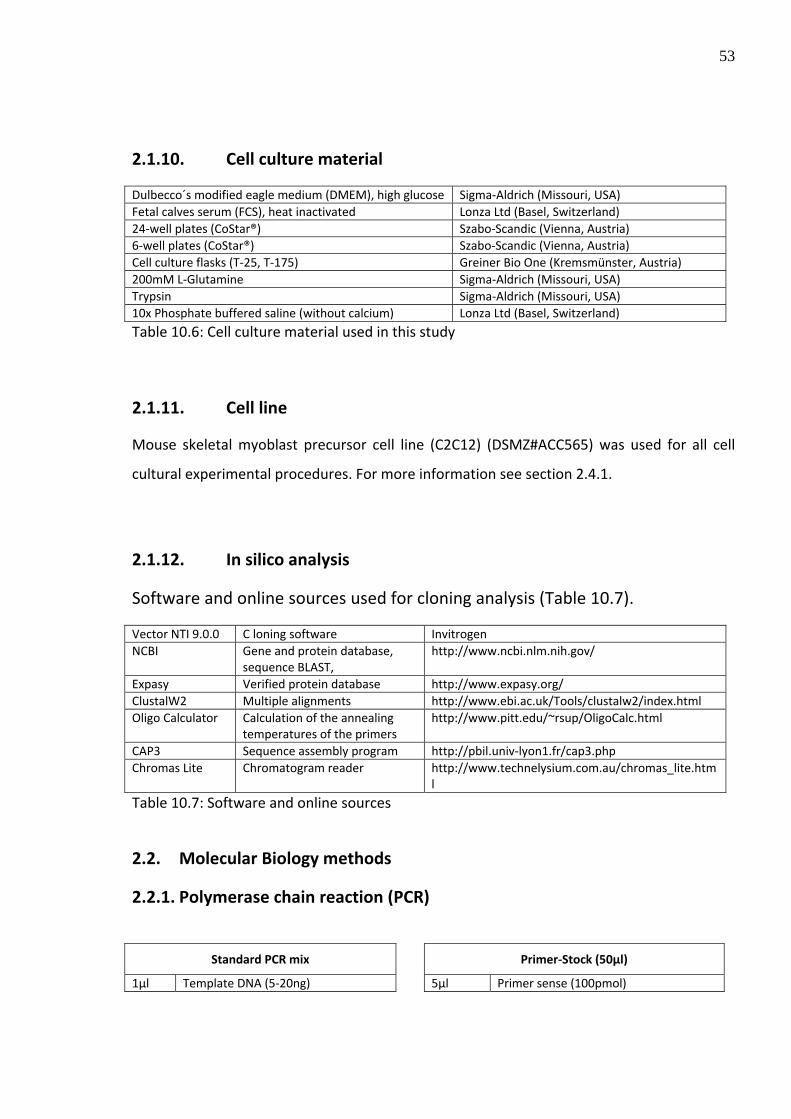
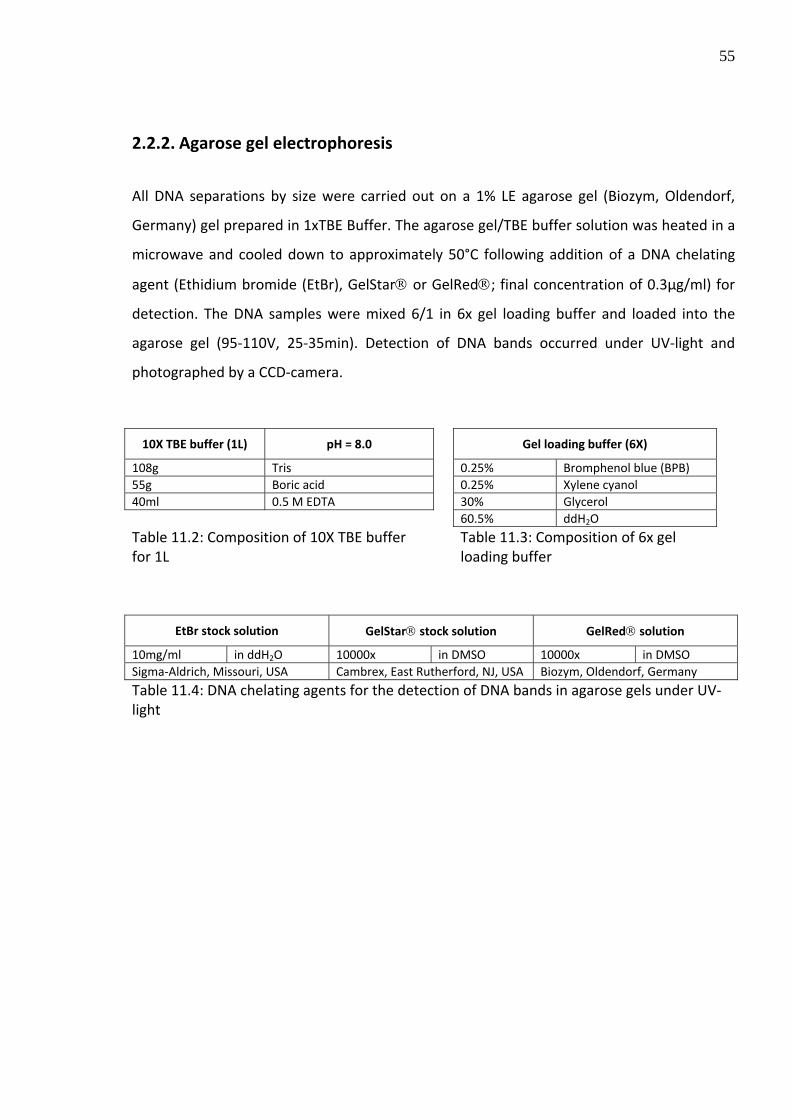
2.1.10. Cell culture material
Dulbecco´s modified eagle medium (DMEM), high glucose Sigma‐Aldrich (Missouri, USA) Fetal calves serum (FCS), heat inactivated Lonza Ltd (Basel, Switzerland) 24‐well plates (CoStar®) Szabo‐Scandic (Vienna, Austria) 6‐well plates (CoStar®) Szabo‐Scandic (Vienna, Austria) Cell culture flasks (T‐25, T‐175) Greiner Bio One (Kremsmünster, Austria) 200mM L‐Glutamine Sigma‐Aldrich (Missouri, USA) Trypsin Sigma‐Aldrich (Missouri, USA) 10x Phosphate buffered saline (without calcium) Lonza Ltd (Basel, Switzerland)
Table 10.6: Cell culture material used in this study
2.1.11. Cell line
Mouse skeletal myoblast precursor cell line (C2C12) (DSMZ#ACC565) was used for all cell
cultural experimental procedures. For more information see section 2.4.1.
2.1.12. In silico analysis
Software and online sources used for cloning analysis (Table 10.7).
Vector NTI 9.0.0 C loning software Invitrogen NCBI Gene and protein database,
sequence BLAST, http://www.ncbi.nlm.nih.gov/
Expasy Verified protein database http://www.expasy.org/ ClustalW2 Multiple alignments http://www.ebi.ac.uk/Tools/clustalw2/index.html Oligo Calculator Calculation of the annealing
temperatures of the primers http://www.pitt.edu/~rsup/OligoCalc.html
CAP3 Sequence assembly program http://pbil.univ‐lyon1.fr/cap3.php Chromas Lite Chromatogram reader http://www.technelysium.com.au/chromas_lite.htm
l
Table 10.7: Software and online sources
2.2. Molecular Biology methods
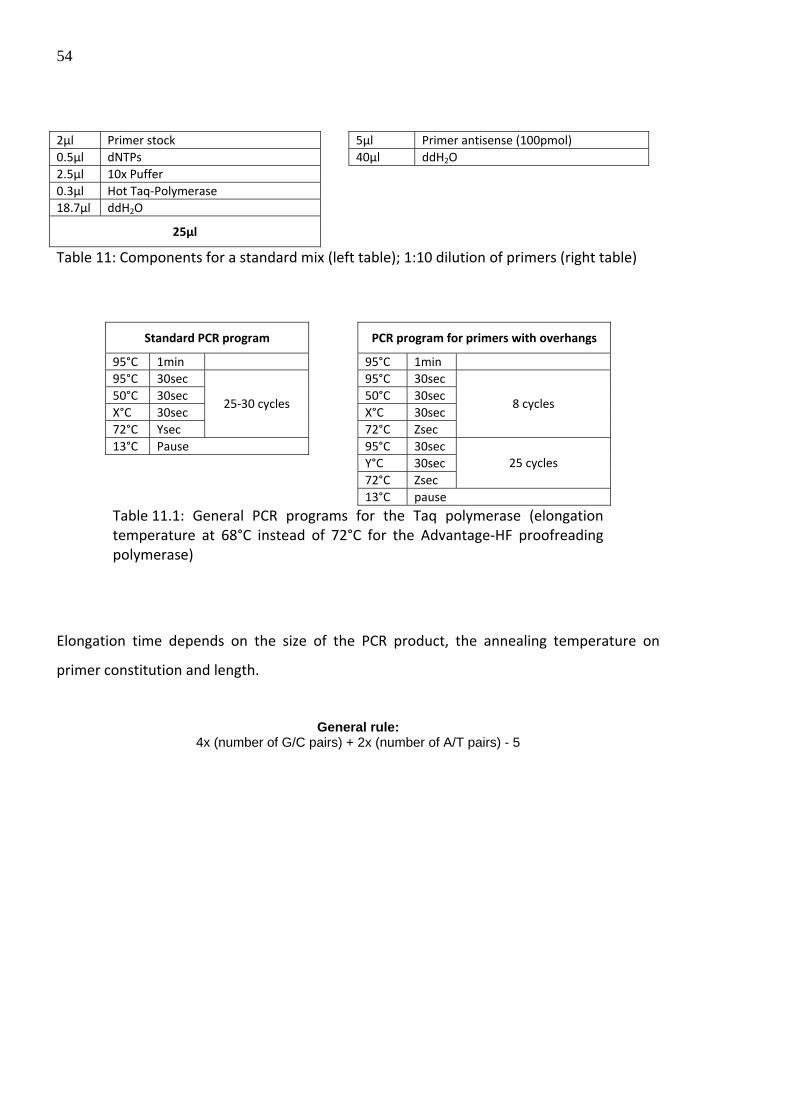
2.2.1. Polymerase chain reaction (PCR)
Standard PCR mix Primer‐Stock (50µl)
1µl Template DNA (5‐20ng) 5µl Primer sense (100pmol)
54
2µl Primer stock 5µl Primer antisense (100pmol) 0.5µl dNTPs 40µl ddH2O 2.5µl 10x Puffer 0.3µl Hot Taq‐Polymerase 18.7µl ddH2O
25µl
Table 11: Components for a standard mix (left table); 1:10 dilution of primers (right table)
Standard PCR program PCR program for primers with overhangs
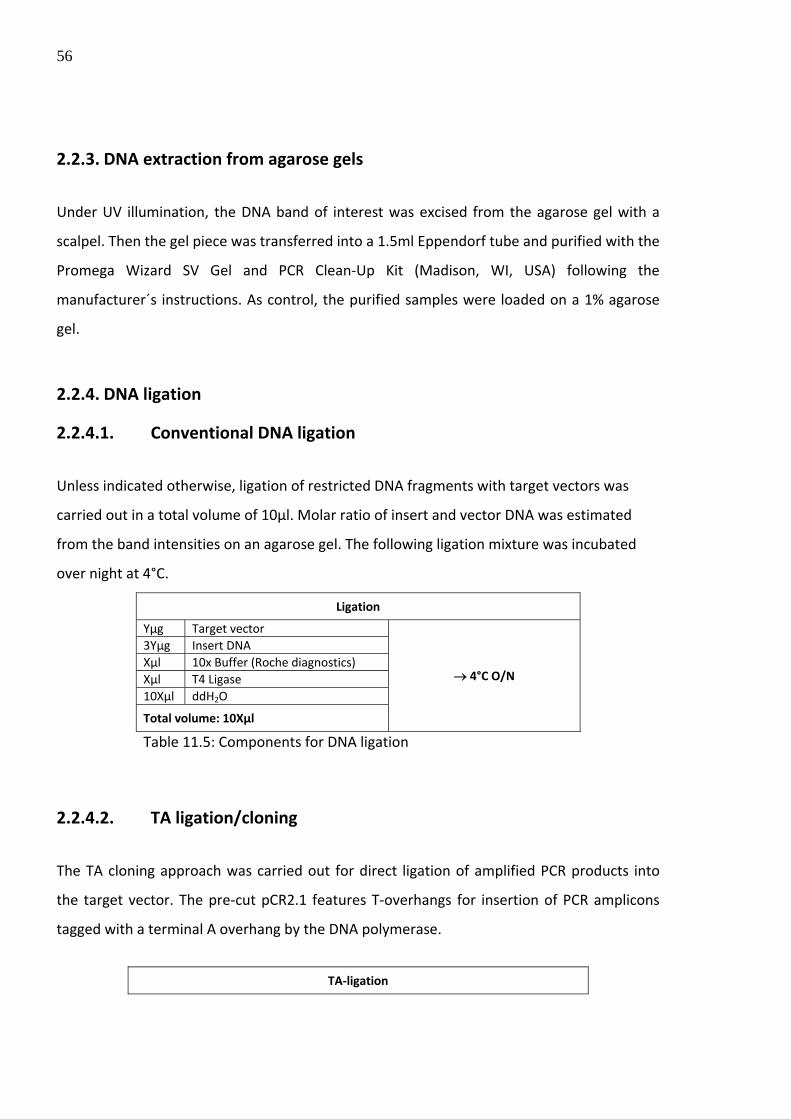
Table 11.6: Basic mixture of components for TA‐ligation
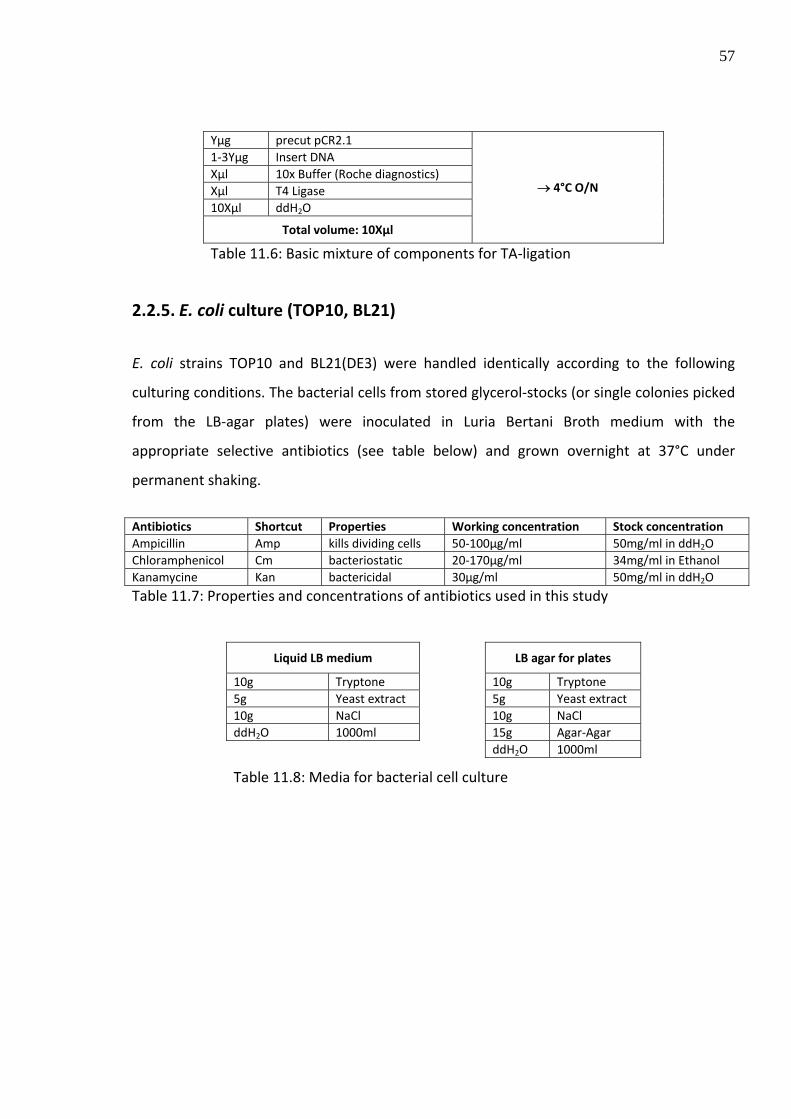
2.2.5. E. coli culture (TOP10, BL21)
E. coli strains TOP10 and BL21(DE3) were handled identically according to the following
culturing conditions. The bacterial cells from stored glycerol‐stocks (or single colonies picked
from the LB‐agar plates) were inoculated in Luria Bertani Broth medium with the
appropriate selective antibiotics (see table below) and grown overnight at 37°C under
permanent shaking.
Antibiotics Shortcut Properties Working concentration Stock concentration Ampicillin Amp kills dividing cells 50‐100µg/ml 50mg/ml in ddH2O Chloramphenicol Cm bacteriostatic 20‐170µg/ml 34mg/ml in Ethanol Kanamycine Kan bactericidal 30µg/ml 50mg/ml in ddH2O
Table 11.7: Properties and concentrations of antibiotics used in this study
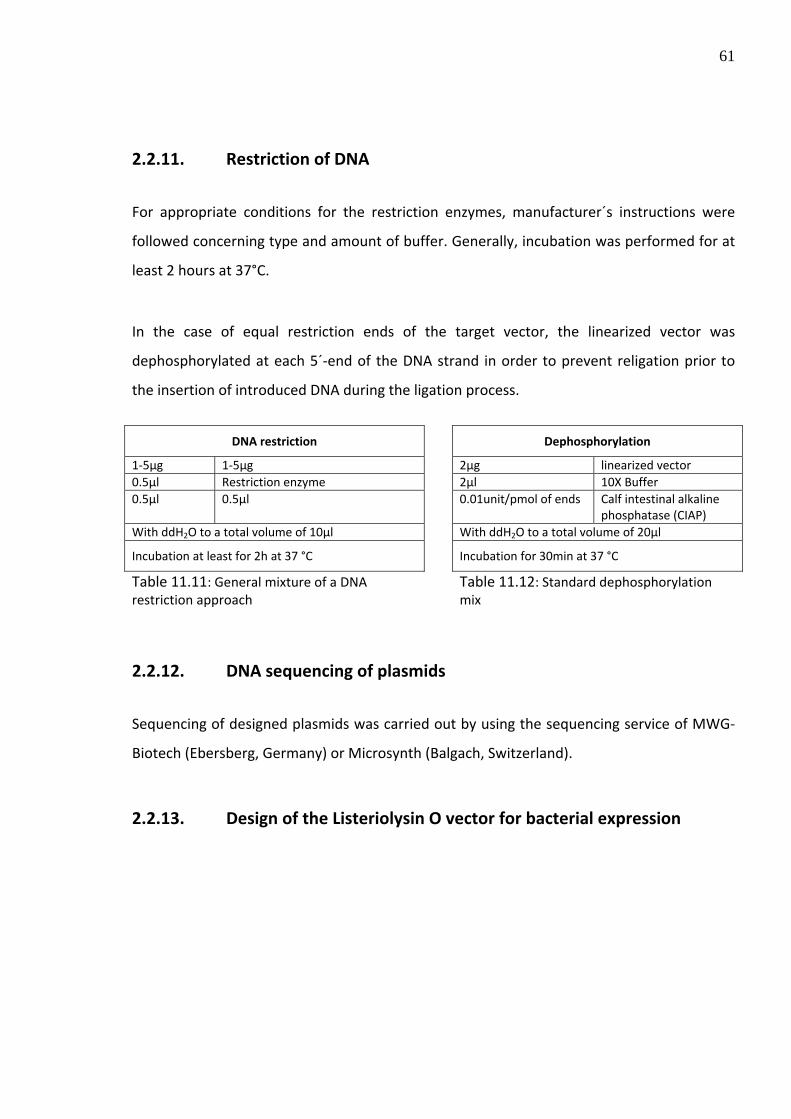
17.9g Tris 0.3g Tris 15g Tris 3.8g Tris‐HCl 7.5g Tris‐HCl 72g Glycine 0.4g SDS 0.4g SDS 5g SDS With ddH2O to 100ml With ddH2O to 100ml With ddH2O to 1000ml
In order to remove the leftovers of the solubilization buffer, the refolded LLO (by dilution)
was dialyzed in either PBS (pH = 7.4) or acidic buffer (pH = 5), respectively. The dialysis was
performed in two overnight steps. At first step, 25µg/µl LLO (total volume of 2ml) was
incubated over night in 50ml buffer at 4°C, following replacement of the buffer with further
50ml of buffer, incubating a second time at same conditions as above.
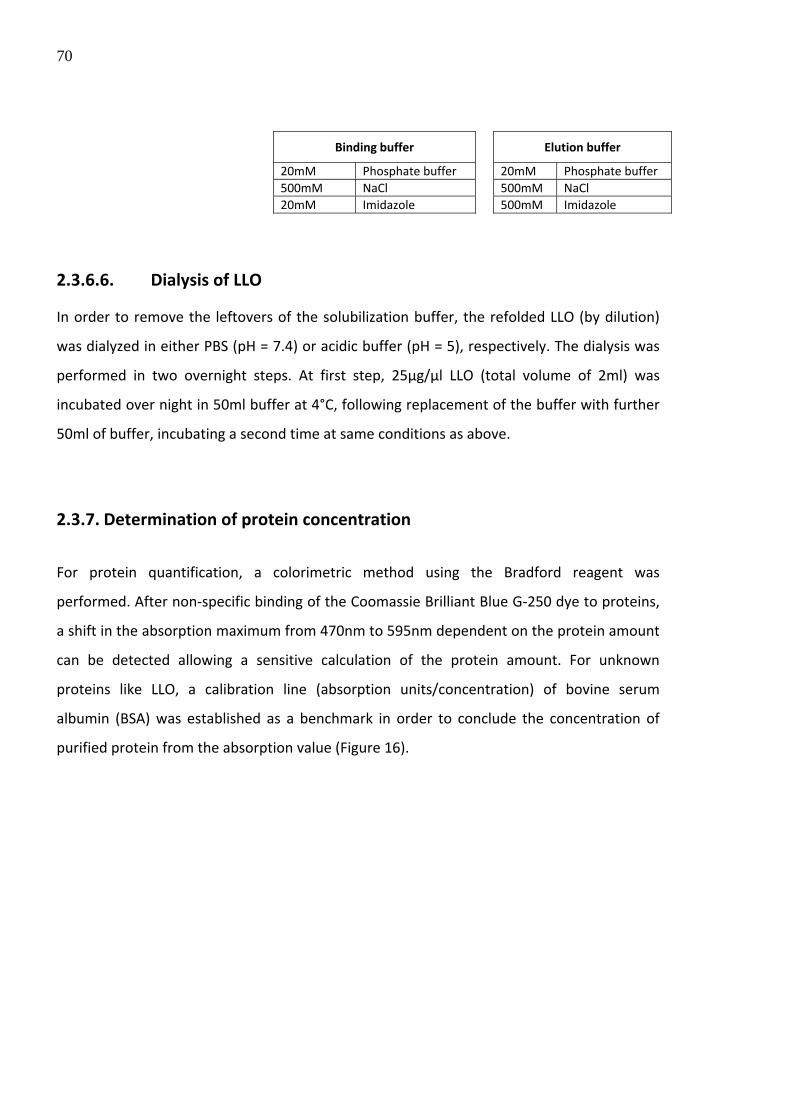
2.3.7. Determination of protein concentration
For protein quantification, a colorimetric method using the Bradford reagent was
performed. After non‐specific binding of the Coomassie Brilliant Blue G‐250 dye to proteins,
a shift in the absorption maximum from 470nm to 595nm dependent on the protein amount
can be detected allowing a sensitive calculation of the protein amount. For unknown
proteins like LLO, a calibration line (absorption units/concentration) of bovine serum
albumin (BSA) was established as a benchmark in order to conclude the concentration of
purified protein from the absorption value (Figure 16).
71
Figure 16: Calibration line of bovine serum albumin
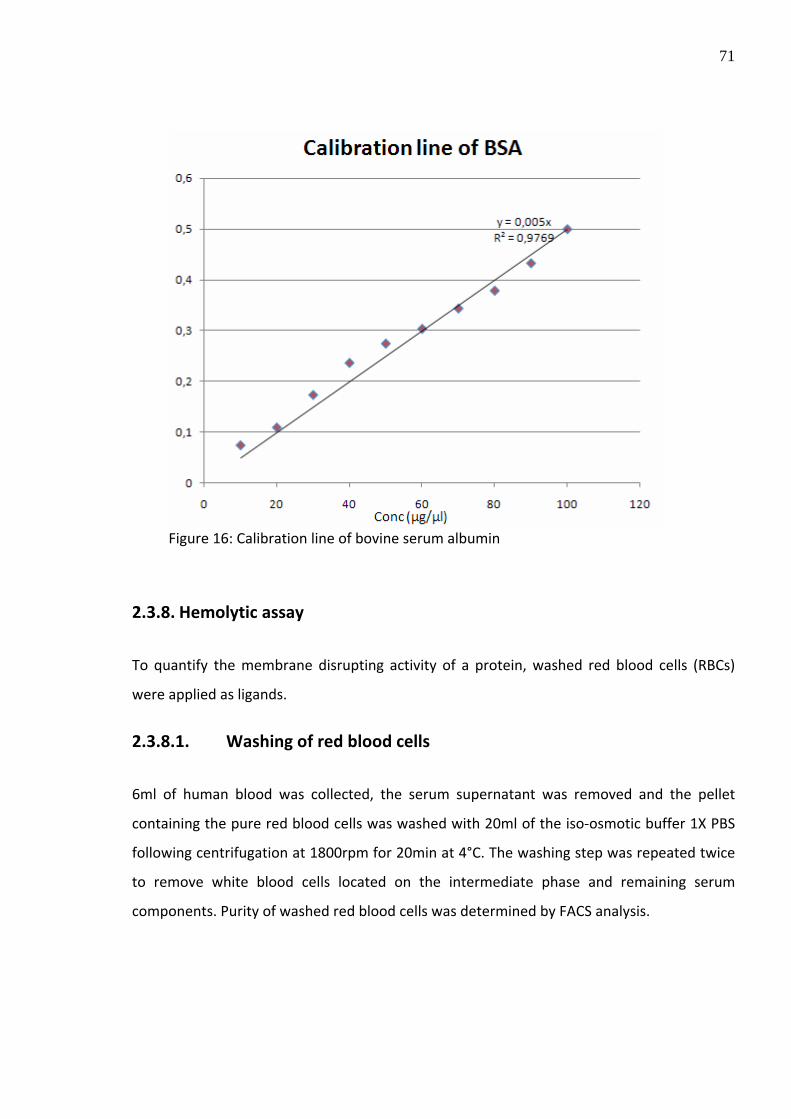
2.3.8. Hemolytic assay
To quantify the membrane disrupting activity of a protein, washed red blood cells (RBCs)
were applied as ligands.
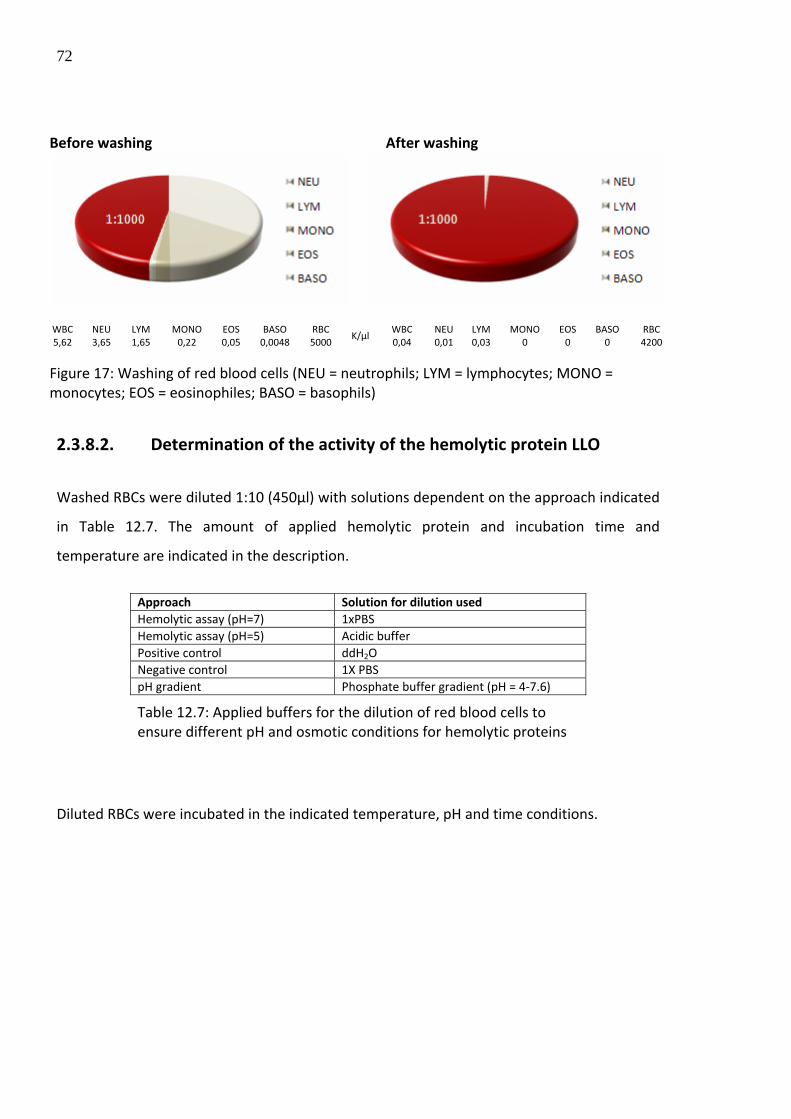
2.3.8.1. Washing of red blood cells
6ml of human blood was collected, the serum supernatant was removed and the pellet
containing the pure red blood cells was washed with 20ml of the iso‐osmotic buffer 1X PBS
following centrifugation at 1800rpm for 20min at 4°C. The washing step was repeated twice
to remove white blood cells located on the intermediate phase and remaining serum
components. Purity of washed red blood cells was determined by FACS analysis.
72
Before washing After washing
WBC NEU LYM MONO EOS BASO RBC WBC NEU LYM MONO EOS BASO RBC 5,62 3,65 1,65 0,22 0,05 0,0048 5000
K/µl 0,04 0,01 0,03 0 0 0 4200
Figure 17: Washing of red blood cells (NEU = neutrophils; LYM = lymphocytes; MONO = monocytes; EOS = eosinophiles; BASO = basophils)
2.3.8.2. Determination of the activity of the hemolytic protein LLO
Washed RBCs were diluted 1:10 (450µl) with solutions dependent on the approach indicated
in Table 12.7. The amount of applied hemolytic protein and incubation time and
temperature are indicated in the description.
Approach Solution for dilution used Hemolytic assay (pH=7) 1xPBS Hemolytic assay (pH=5) Acidic buffer Positive control ddH2O Negative control 1X PBS pH gradient Phosphate buffer gradient (pH = 4‐7.6)
Table 12.7: Applied buffers for the dilution of red blood cells to ensure different pH and osmotic conditions for hemolytic proteins
Diluted RBCs were incubated in the indicated temperature, pH and time conditions.
73
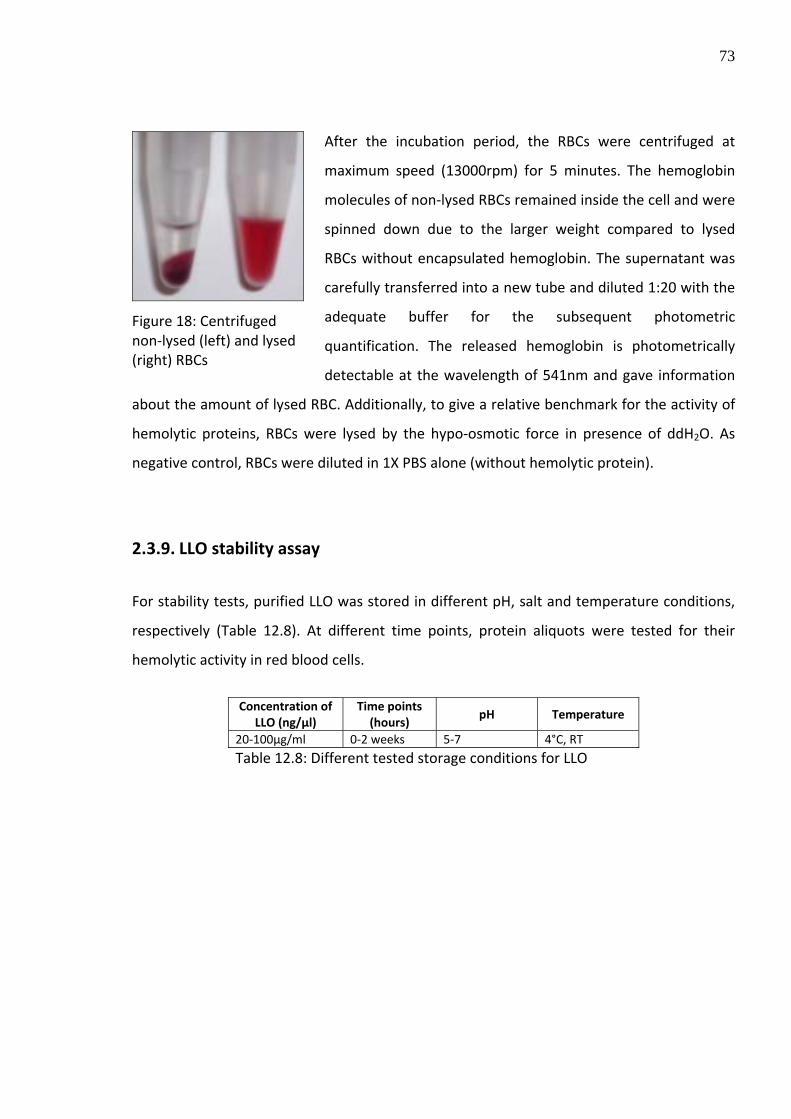
After the incubation period, the RBCs were centrifuged at
maximum speed (13000rpm) for 5 minutes. The hemoglobin
molecules of non‐lysed RBCs remained inside the cell and were
spinned down due to the larger weight compared to lysed
RBCs without encapsulated hemoglobin. The supernatant was
carefully transferred into a new tube and diluted 1:20 with the
adequate buffer for the subsequent photometric
quantification. The released hemoglobin is photometrically
detectable at the wavelength of 541nm and gave information
about the amount of lysed RBC. Additionally, to give a relative benchmark for the activity of
hemolytic proteins, RBCs were lysed by the hypo‐osmotic force in presence of ddH2O. As
negative control, RBCs were diluted in 1X PBS alone (without hemolytic protein).
2.3.9. LLO stability assay
For stability tests, purified LLO was stored in different pH, salt and temperature conditions,
respectively (Table 12.8). At different time points, protein aliquots were tested for their
hemolytic activity in red blood cells.
Concentration of
LLO (ng/µl) Time points (hours)
pH Temperature
20‐100µg/ml 0‐2 weeks 5‐7 4°C, RT
Table 12.8: Different tested storage conditions for LLO
Figure 18: Centrifuged non‐lysed (left) and lysed (right) RBCs
74
2.4. Cell biology methods
2.4.1. Culture of C2C12 mouse myoblast cell line
The mouse myocyte precursor cell line (DSMZ#ACC565) was purchased from the German
Collection of Microorganisms and Cell Cultures (DSMZ, Braunschweig, Germany). The cell
line was incubated at 37°C (5% CO2) in medium indicated in the table below. Passaging of
cells was carried out in order to obtain a maximal confluency of approximately 80‐90% (a
higher cell density leads to myogenic differentiation of the cells).
1% (2mM) L‐glutamine 5% Fetal calf serum (FCS) In DMEM high glucose
Table 12.9: Medium components for the culture of C2C12 cells
2.4.2. Storage of C2C12
One million of harbored cells (DMEM with 5% FCS) were mixed with DMSO (final
concentration of 10% v/v) and frozen in liquid nitrogen.
2.4.3. Lipofection of C2C12
For in vitro lipofection of C2C12 cells with endotoxin‐free plasmid DNA, liposomal
transfection reagent (Lipofectamine 2000) was obtained from Invitrogen (Lofer, Germany).
By providing a net positive charge, the cationic liposomal particles interact ionically with the
negatively charged DNA backbone forming microparticles. The complexed DNA/cationic
liposome particles are endocytosed by the target cells. In order to avoid cross reactions of
the cationic liposomes with serum components, the complexation reaction with the
endotoxin‐free DNA was carried out in serum‐free medium. Unless otherwise indicated, a
general molecular ratio of 1:1 (µg DNA : µl Lipofectamine 2000) with maximal amounts of
2µg DNA was applied per well in a 24‐well plate for this studies. After incubation at 37°C (5%
CO2) for 4 hours, the serum‐free medium was replaced by DMEM high glucose containing 5%
75
FCS to prevent cytotoxic effects of cationic liposomes. For positive control, the transfection
efficiency was tested using the fluorescence reporter vector pcDNA3‐EYFP‐His, encoding for
the enhanced yellow fluorescence protein (EYFP). The expressed reporter protein is
detectable after 12‐18 hours following transfection by fluorescence microscopy.
2.4.4. Transfection of C2C12 with PLL
C2C12 cells were grown at 37°C (5% CO2) to a confluence of 80% in DMEM high glucose with
1% L‐glutamine and 5% FCS. The pCDNA‐EYFPHis vector was complexed with PLL at different
molar ratios and incubated in 100µl serum‐free DMEM high glucose for 15 minutes following
transfer to the cells (24‐well plate). Detection by fluorescence microscopy was carried out 24
hours, 48 hours and 96 hours post‐transfection, respectively.
2.4.5. DNA condensation analysis with PLL
2.4.5.1. Electromobility shift assay (EMSA)
EMSA was used to detect DNA binding substances like PLL. The applied positively charged
PLLs were able to bind to the negatively charged DNA backbone via electrostatic
interactions. To show binding kinetics, double‐stranded circular DNA at different sizes was
incubated with PLL (15‐30kDa) at different molar ratios. By showing differences in the
migration velocity depending on the amount of complexation, the rate of condensation can
be relatively evaluated. Non‐bound DNA shows the highest migration velocity.
2.4.5.2. Condensation kinetics with fluorescence microscopy
DNA complexation velocities were demonstrated with fluorescence microscopy by the usage
of circular and linear DNA pre‐labeled with equimolar amounts of SYBR green. After the
addition of PLL to the labeled DNA (molar ratio of 1:30), fluorescence images were captured
every 10 seconds.
76
2.4.6. Uptake kinetics of PLL condensed DNA (and SYBR green) with and without LLO
For observing the uptake frequency of DNA/PLL particles, DNA was pre‐labeled with SYBR
green (Roche Diagnostics GmbH) in order to localize the microparticles under fluorescence
illumination. The fluorescence dye is binding to double‐stranded DNA molecules and
emitting light after excitation with fluorescence light (excitation at 494nm, emission at
521nm). The resulting labeled plasmid DNA was complexed with PLL at weight ratios ranging
from 1:10 to 1:30 for 10 minutes in 100µl of serum free medium or 1xPBS. Additionally, as
presumable transfection enhancer, LLO was pre‐incubated with PLL for 10 minutes prior to
the addition of labeled DNA. Complexed particles with and without LLO were then
transferred to 24‐well plates containing C2C12 cells with densities of up to 90% per well.
C2C12 cells were incubated for 15 minutes at 37°C (5% CO2) followed by detection under
fluorescence light.
2.4.7. Immunohistochemistry
Cellular localization of uptaken LLO was confirmed by direct immunohistochemistry.
Additionally, for testing the epitope specificity of the Anti‐His antibody, a control staining of
cells transfected with pcDNA3‐EYFP‐His was additionally carried out.
C2C12 cells were grown on poly‐L‐lysine coated coverslips (VWR International, West Chester,
PA, USA) in 24‐well plates for subsequent detection under confocal laser scanning
microscopy (CLSM).
77
In a laminar flow sterile workbench, coverslips (0.6cm) were washed with 70% ethanol
following an autoclave step for sterilization. Coverslips were incubated 1 hour at room
temperature in the poly‐L‐Lysine solution (Sigma‐Aldrich) prediluted 1:10 with ddH2O.
Coverslips were washed twice to remove additional non‐bound poly‐L‐Lysine and air‐dried
under UV for 30min. Coverslips were stored at 4°C maximal for 6 weeks. To maintain the
fluorescence activity of GFP, EYFP and DsRed, the conservation of the native conformation
was achieved by adopting a cell fixation protocol using methanol and formaldehyde. C2C12
cells grown on coverslips (24‐well plate) were washed once with 2ml 1X PBS following
fixation with 1ml 2% formaldehyde per well for 15minutes at 37°C. Then, wells were washed
three times with 1X PBS. For permeabilization of the cell membrane, each well was
incubated for 5minutes with 500µl methanol (‐20°C) on a cooled metal block (‐20°C).
followed by three additional washing steps with 1X PBS to remove the remaining methanol.
Blocking with 1ml 5% BSA in 1xPBS for 1 hour at room temperature was performed in order
to prevent non‐specific binding of the antibodies and therefore reduce the background
signal. The antibody was diluted in 200µl 1xPBS (Table 10.5) and added to the fixed cells. The
incubation in the dark was performed for 1 hour. Coverslips were washed three times for 5
minutes with 1xPBS and mounted onto superfrost slides. For a 100ml mowiol 4‐88 mounting
solution, 12g Glycerol were added to 4.8g mowiol 4‐88 and continuously stirred whilst
maintaining a constant temperature of 50°C in a water bath. The solution was diluted by the
addition of 12ml ddH2O following 24ml of 0.2M Tris‐HCl and continuing mixing and heating
until the mowiol was fully dissolved. The solution was then centrifuged at 8000rpm for
15min in order to achieve a clear solution. 100µl aliquots for the later usage were stored at ‐
20°C. 7‐10µl of the mowiol solution was prepared in drops on superfrost slides for each
coverslip. Coverslips with fixed cells were removed from the 24‐well plate and mounted
upside down onto the mowiol drop. The slides were dried overnight at room temperature
for subsequent analysis by CLSM.
78
3. Results
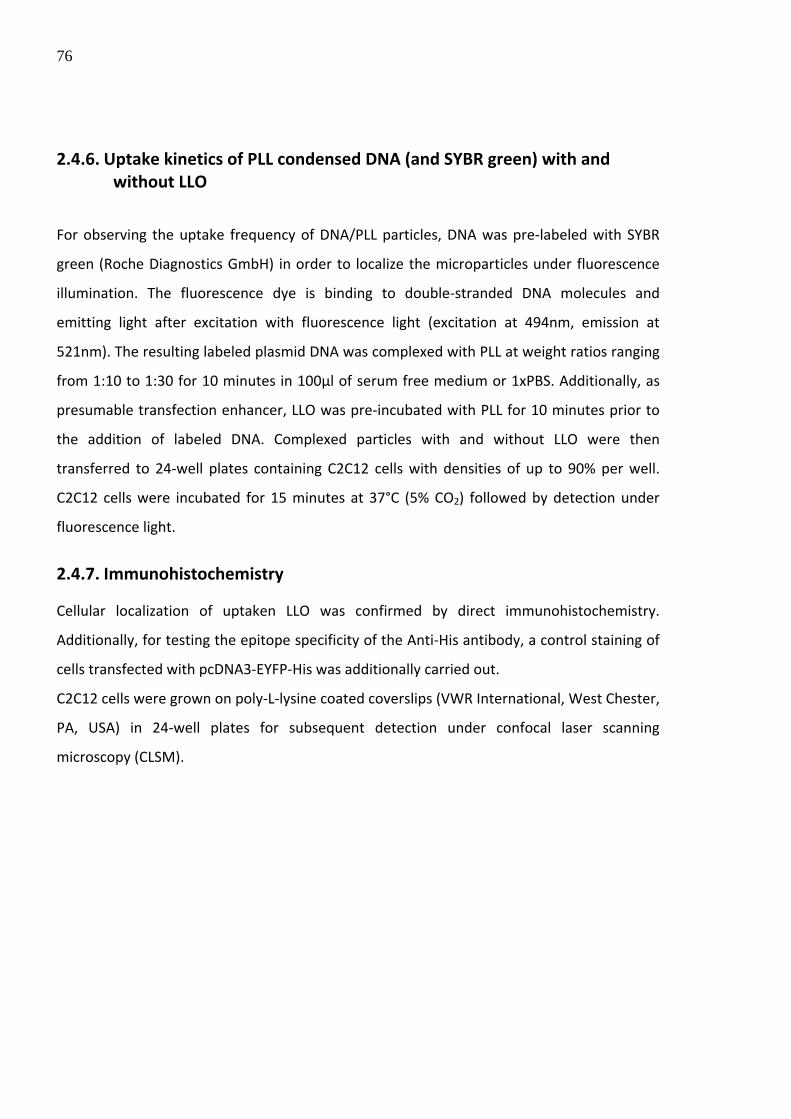
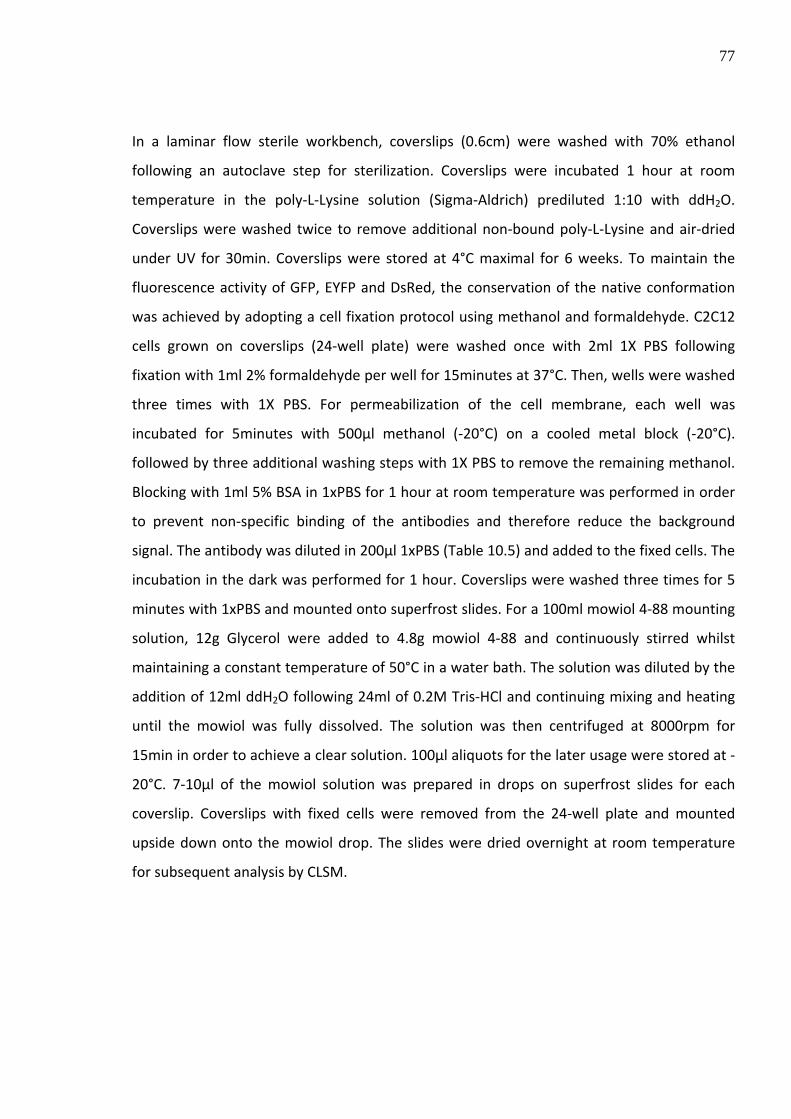
3.1. Cloning of recombinant Listeriolysin O
The LLO‐His fragment restricted from pCR2.1‐LLO‐His with NdeI and BamHI prior the insertion into a bacterial expression is shown in Figure 19. The schematic illustration of the subsequent restriction fragment is depicted in Figure 20.
Figure 19: LLO‐His fragment restricted from pCR2.1‐LLO‐His on a 1% agarose gel. Two restriction digests from starting vectors derived from different E. coli clones (clone 1 and clone 2).
Figure 20: Schematic illustration of LLO amplicon lacking the secretion signal and containing of a C‐terminal His‐tag.
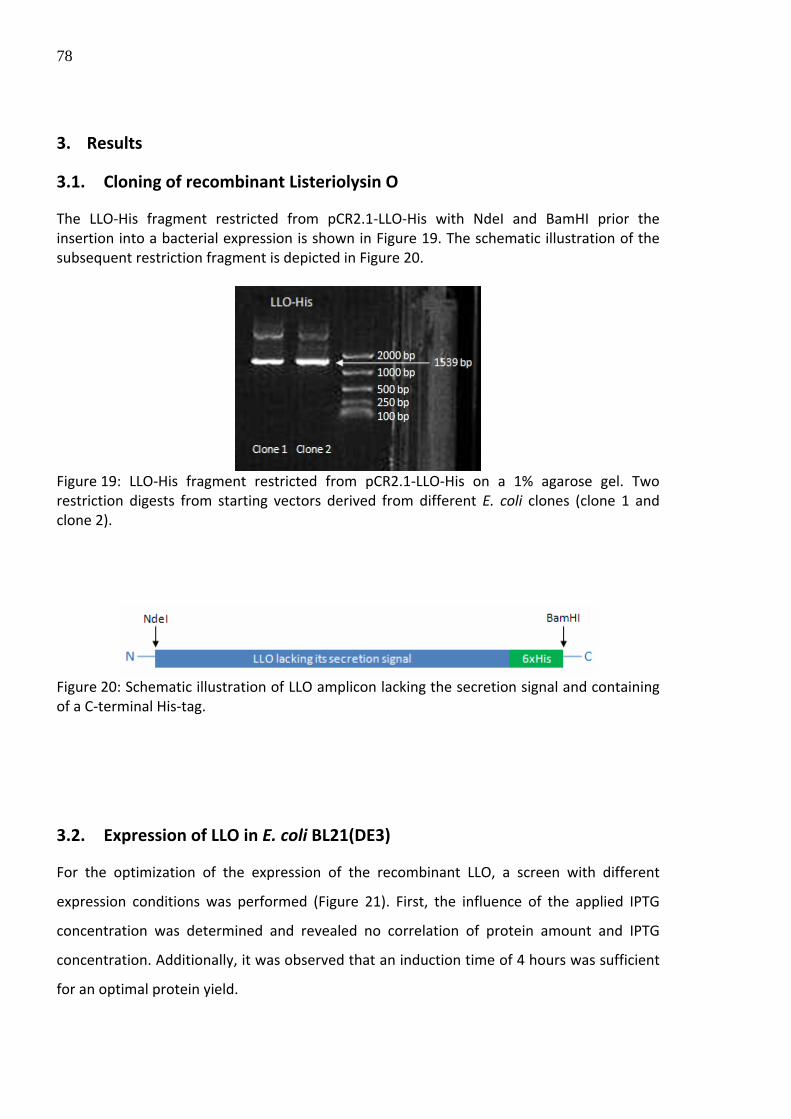
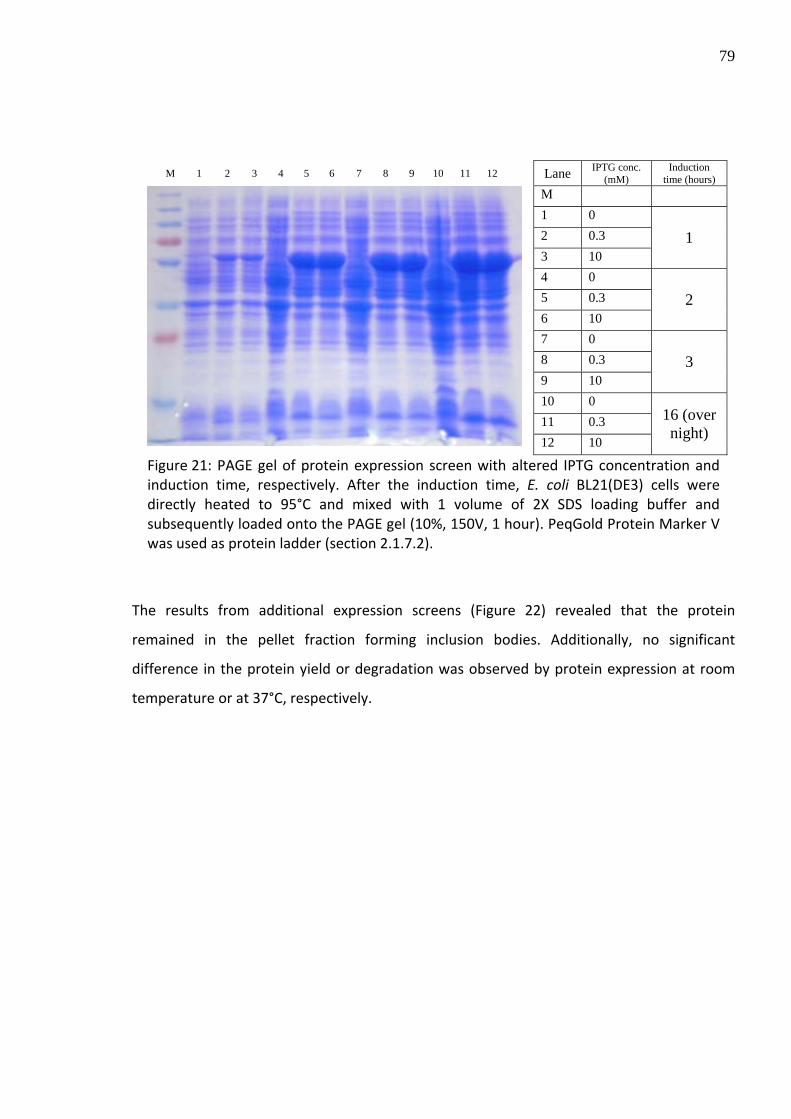
3.2. Expression of LLO in E. coli BL21(DE3)
For the optimization of the expression of the recombinant LLO, a screen with different
expression conditions was performed (Figure 21). First, the influence of the applied IPTG
concentration was determined and revealed no correlation of protein amount and IPTG
concentration. Additionally, it was observed that an induction time of 4 hours was sufficient
for an optimal protein yield.
79
M 1 2 3 4 5 6 7 8 9 10 11 12 Lane IPTG conc. (mM)
Induction time (hours)
M 1 0 2 0.3 3 10
1
4 0 5 0.3 6 10
2
7 0 8 0.3 9 10
3
10 0 11 0.3
12 10
16 (over night)
Figure 21: PAGE gel of protein expression screen with altered IPTG concentration and induction time, respectively. After the induction time, E. coli BL21(DE3) cells were directly heated to 95°C and mixed with 1 volume of 2X SDS loading buffer and subsequently loaded onto the PAGE gel (10%, 150V, 1 hour). PeqGold Protein Marker V was used as protein ladder (section 2.1.7.2).
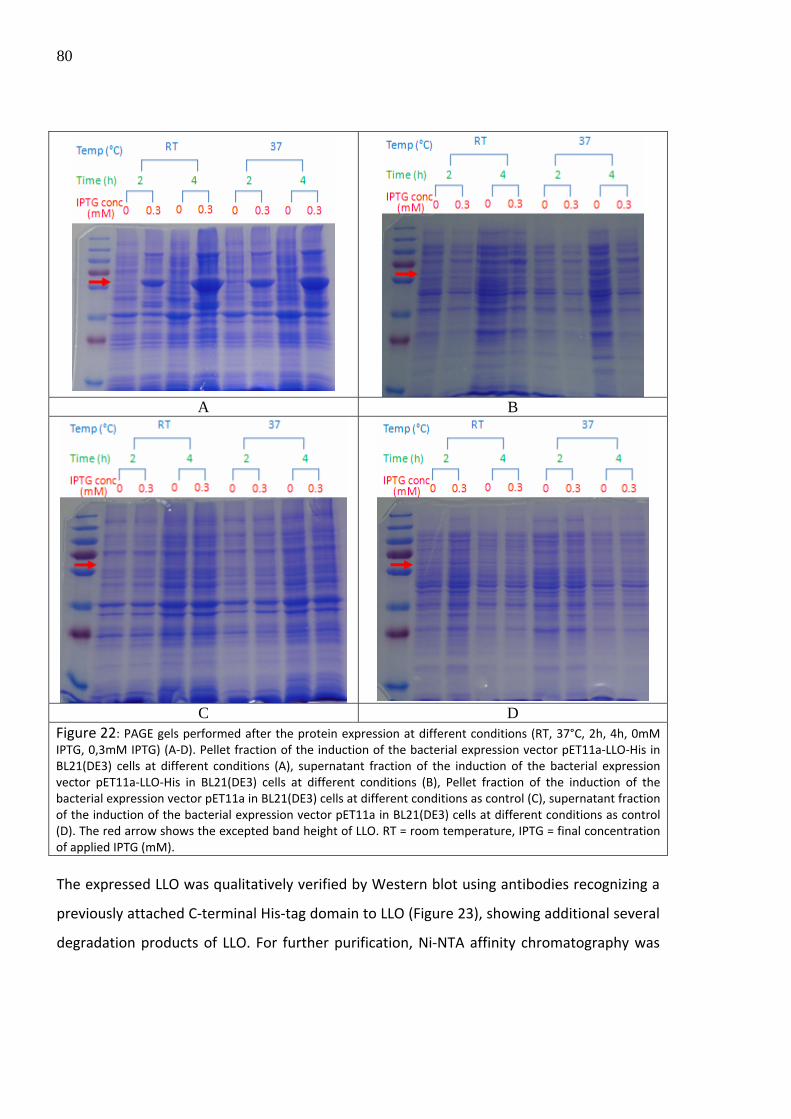
The results from additional expression screens (Figure 22) revealed that the protein
remained in the pellet fraction forming inclusion bodies. Additionally, no significant
difference in the protein yield or degradation was observed by protein expression at room
temperature or at 37°C, respectively.
80
A B
C D
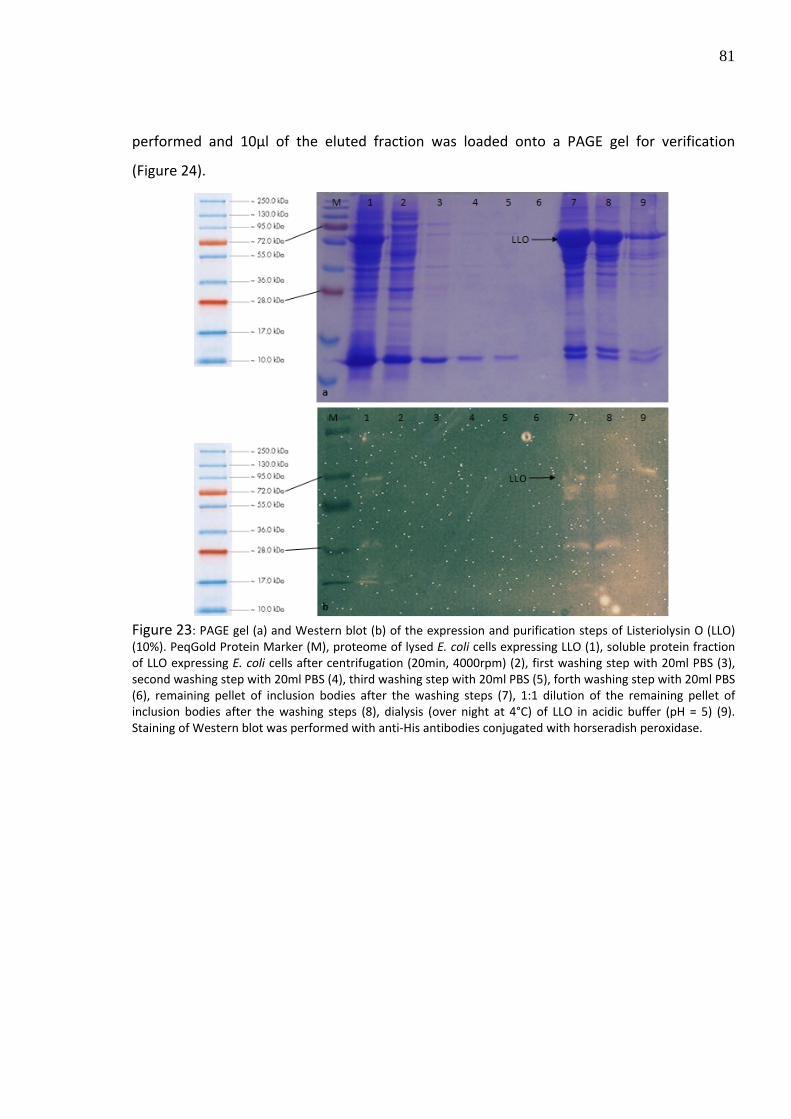
Figure 22: PAGE gels performed after the protein expression at different conditions (RT, 37°C, 2h, 4h, 0mM IPTG, 0,3mM IPTG) (A‐D). Pellet fraction of the induction of the bacterial expression vector pET11a‐LLO‐His in BL21(DE3) cells at different conditions (A), supernatant fraction of the induction of the bacterial expression vector pET11a‐LLO‐His in BL21(DE3) cells at different conditions (B), Pellet fraction of the induction of the bacterial expression vector pET11a in BL21(DE3) cells at different conditions as control (C), supernatant fraction of the induction of the bacterial expression vector pET11a in BL21(DE3) cells at different conditions as control (D). The red arrow shows the excepted band height of LLO. RT = room temperature, IPTG = final concentration of applied IPTG (mM). The expressed LLO was qualitatively verified by Western blot using antibodies recognizing a
previously attached C‐terminal His‐tag domain to LLO (Figure 23), showing additional several
degradation products of LLO. For further purification, Ni‐NTA affinity chromatography was
81
performed and 10µl of the eluted fraction was loaded onto a PAGE gel for verification
(Figure 24).
Figure 23: PAGE gel (a) and Western blot (b) of the expression and purification steps of Listeriolysin O (LLO) (10%). PeqGold Protein Marker (M), proteome of lysed E. coli cells expressing LLO (1), soluble protein fraction of LLO expressing E. coli cells after centrifugation (20min, 4000rpm) (2), first washing step with 20ml PBS (3), second washing step with 20ml PBS (4), third washing step with 20ml PBS (5), forth washing step with 20ml PBS (6), remaining pellet of inclusion bodies after the washing steps (7), 1:1 dilution of the remaining pellet of inclusion bodies after the washing steps (8), dialysis (over night at 4°C) of LLO in acidic buffer (pH = 5) (9). Staining of Western blot was performed with anti‐His antibodies conjugated with horseradish peroxidase.
82
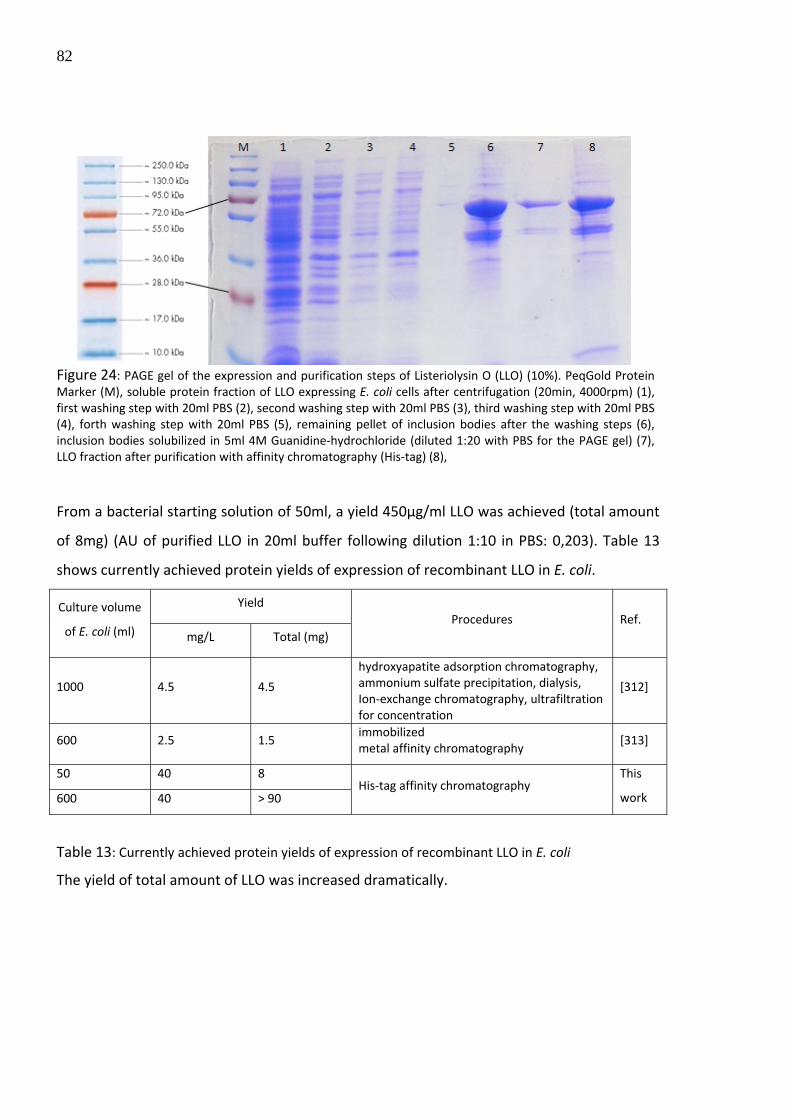
Figure 24: PAGE gel of the expression and purification steps of Listeriolysin O (LLO) (10%). PeqGold Protein Marker (M), soluble protein fraction of LLO expressing E. coli cells after centrifugation (20min, 4000rpm) (1), first washing step with 20ml PBS (2), second washing step with 20ml PBS (3), third washing step with 20ml PBS (4), forth washing step with 20ml PBS (5), remaining pellet of inclusion bodies after the washing steps (6), inclusion bodies solubilized in 5ml 4M Guanidine‐hydrochloride (diluted 1:20 with PBS for the PAGE gel) (7), LLO fraction after purification with affinity chromatography (His‐tag) (8), From a bacterial starting solution of 50ml, a yield 450µg/ml LLO was achieved (total amount
of 8mg) (AU of purified LLO in 20ml buffer following dilution 1:10 in PBS: 0,203). Table 13
shows currently achieved protein yields of expression of recombinant LLO in E. coli.
600 2.5 1.5 immobilized metal affinity chromatography
[313]
50 40 8
600 40 > 90 His‐tag affinity chromatography
This
work
Table 13: Currently achieved protein yields of expression of recombinant LLO in E. coli
The yield of total amount of LLO was increased dramatically.
83
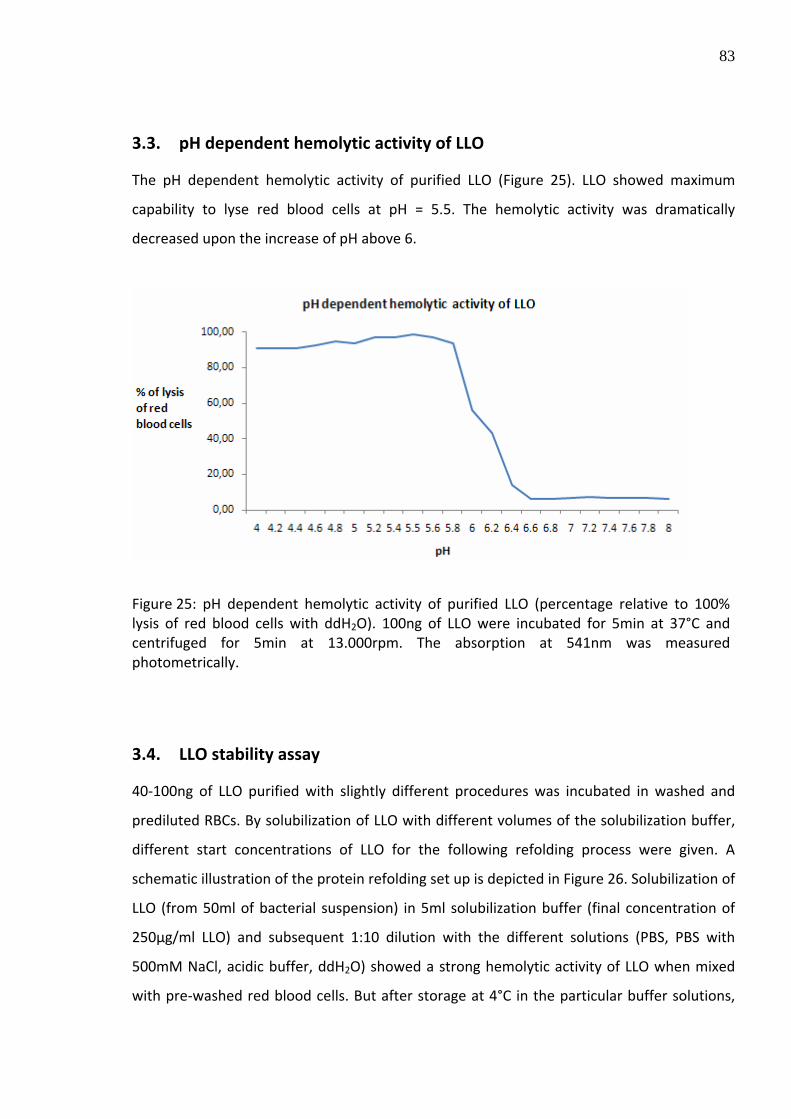
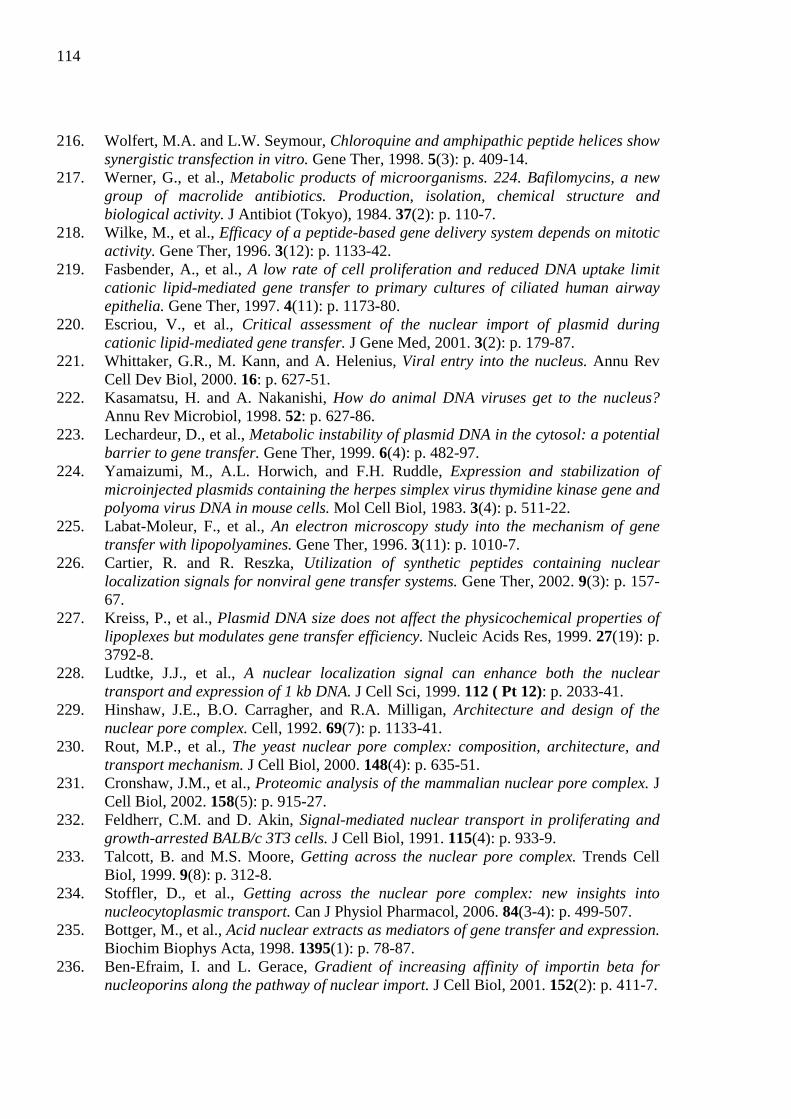
3.3. pH dependent hemolytic activity of LLO
The pH dependent hemolytic activity of purified LLO (Figure 25). LLO showed maximum
capability to lyse red blood cells at pH = 5.5. The hemolytic activity was dramatically
decreased upon the increase of pH above 6.
Figure 25: pH dependent hemolytic activity of purified LLO (percentage relative to 100% lysis of red blood cells with ddH2O). 100ng of LLO were incubated for 5min at 37°C and centrifuged for 5min at 13.000rpm. The absorption at 541nm was measured photometrically.
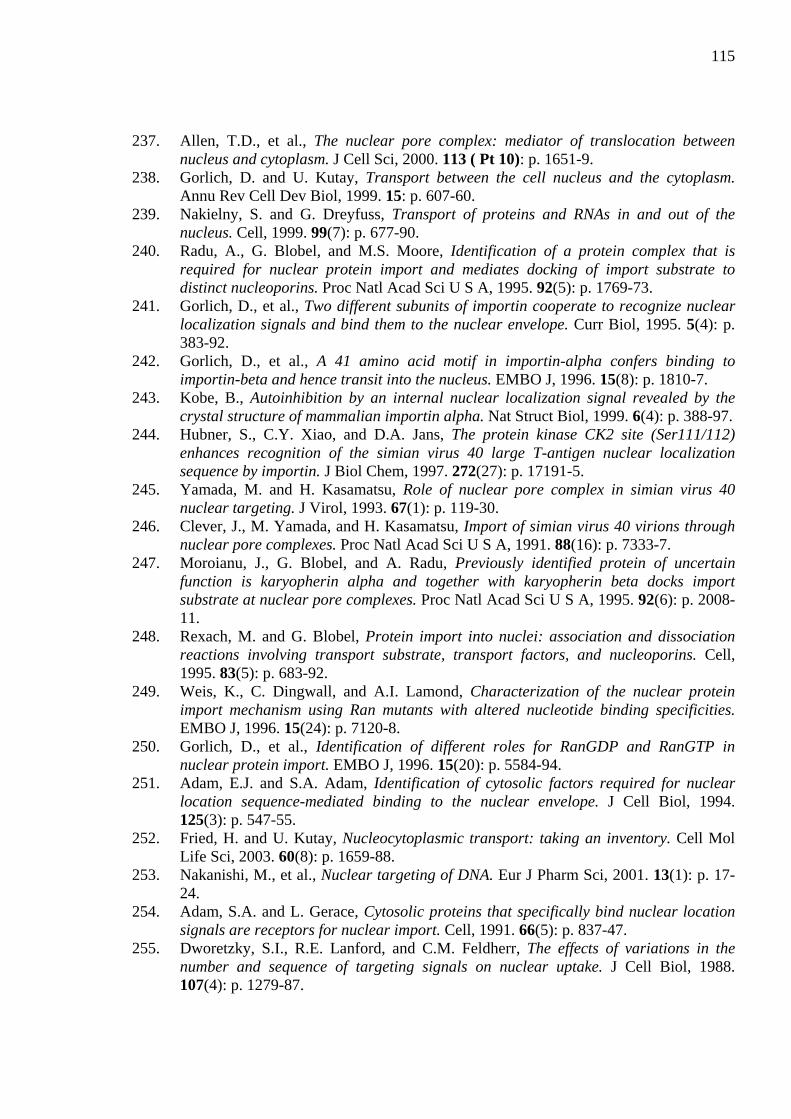
3.4. LLO stability assay
40‐100ng of LLO purified with slightly different procedures was incubated in washed and
prediluted RBCs. By solubilization of LLO with different volumes of the solubilization buffer,
different start concentrations of LLO for the following refolding process were given. A
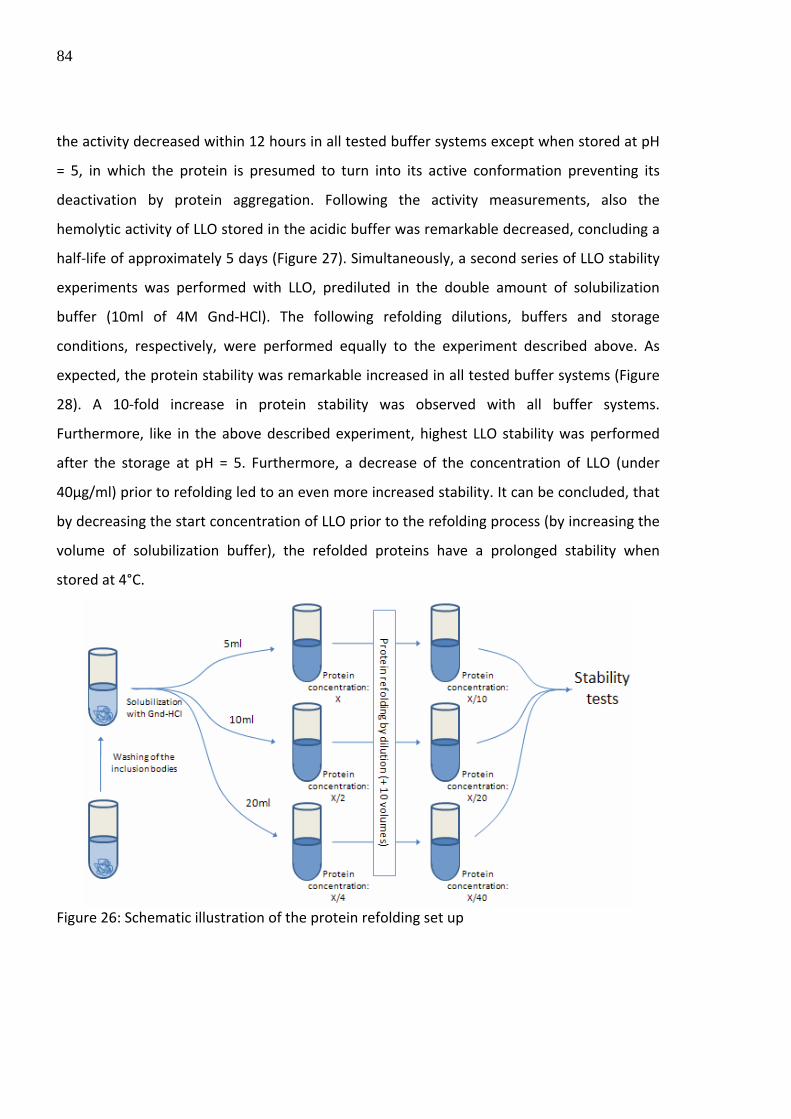
schematic illustration of the protein refolding set up is depicted in Figure 26. Solubilization of
LLO (from 50ml of bacterial suspension) in 5ml solubilization buffer (final concentration of
250µg/ml LLO) and subsequent 1:10 dilution with the different solutions (PBS, PBS with
500mM NaCl, acidic buffer, ddH2O) showed a strong hemolytic activity of LLO when mixed
with pre‐washed red blood cells. But after storage at 4°C in the particular buffer solutions,
84
the activity decreased within 12 hours in all tested buffer systems except when stored at pH
= 5, in which the protein is presumed to turn into its active conformation preventing its
deactivation by protein aggregation. Following the activity measurements, also the
hemolytic activity of LLO stored in the acidic buffer was remarkable decreased, concluding a
half‐life of approximately 5 days (Figure 27). Simultaneously, a second series of LLO stability
experiments was performed with LLO, prediluted in the double amount of solubilization
buffer (10ml of 4M Gnd‐HCl). The following refolding dilutions, buffers and storage
conditions, respectively, were performed equally to the experiment described above. As
expected, the protein stability was remarkable increased in all tested buffer systems (Figure
28). A 10‐fold increase in protein stability was observed with all buffer systems.
Furthermore, like in the above described experiment, highest LLO stability was performed
after the storage at pH = 5. Furthermore, a decrease of the concentration of LLO (under
40µg/ml) prior to refolding led to an even more increased stability. It can be concluded, that
by decreasing the start concentration of LLO prior to the refolding process (by increasing the
volume of solubilization buffer), the refolded proteins have a prolonged stability when
stored at 4°C.
Figure 26: Schematic illustration of the protein refolding set up
85
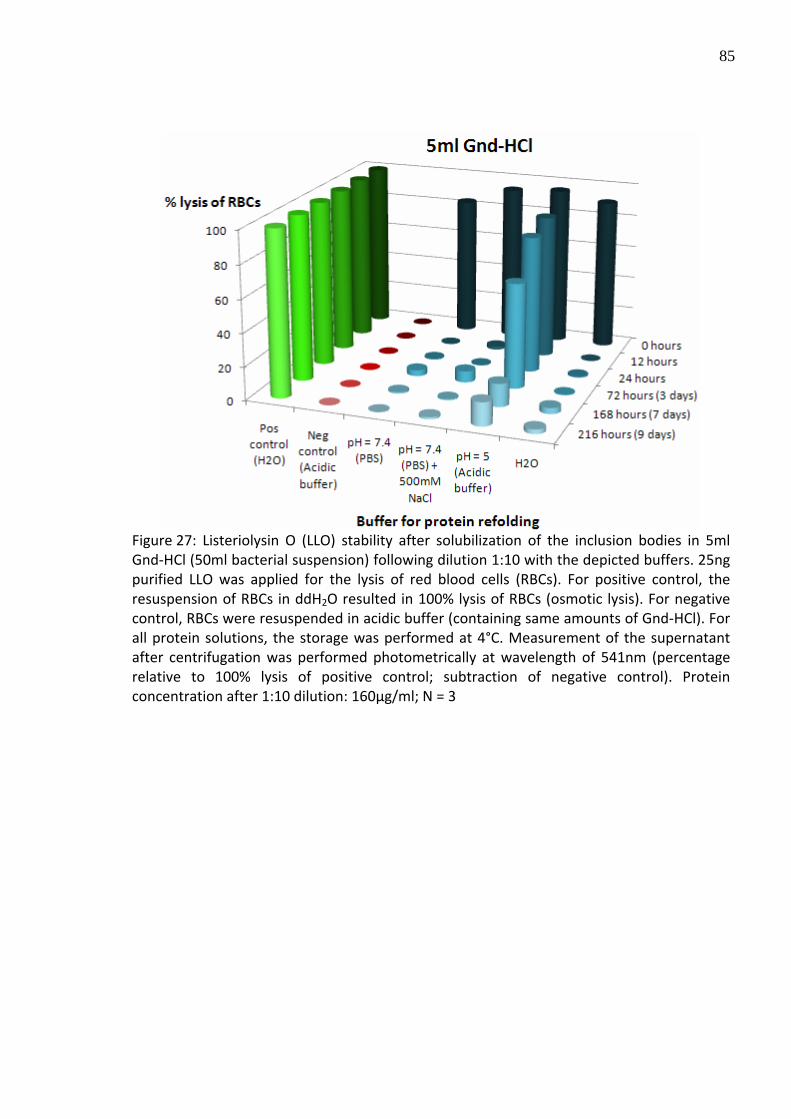
Figure 27: Listeriolysin O (LLO) stability after solubilization of the inclusion bodies in 5ml Gnd‐HCl (50ml bacterial suspension) following dilution 1:10 with the depicted buffers. 25ng purified LLO was applied for the lysis of red blood cells (RBCs). For positive control, the resuspension of RBCs in ddH2O resulted in 100% lysis of RBCs (osmotic lysis). For negative control, RBCs were resuspended in acidic buffer (containing same amounts of Gnd‐HCl). For all protein solutions, the storage was performed at 4°C. Measurement of the supernatant after centrifugation was performed photometrically at wavelength of 541nm (percentage relative to 100% lysis of positive control; subtraction of negative control). Protein concentration after 1:10 dilution: 160µg/ml; N = 3
86
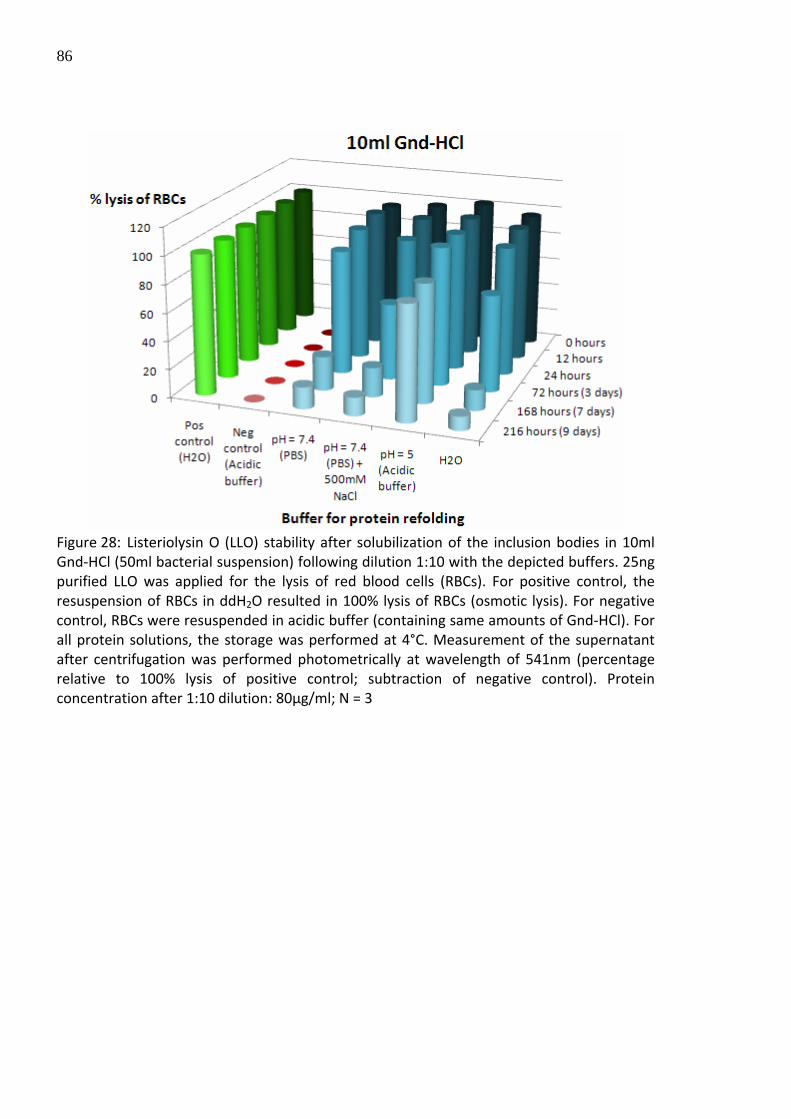
Figure 28: Listeriolysin O (LLO) stability after solubilization of the inclusion bodies in 10ml Gnd‐HCl (50ml bacterial suspension) following dilution 1:10 with the depicted buffers. 25ng purified LLO was applied for the lysis of red blood cells (RBCs). For positive control, the resuspension of RBCs in ddH2O resulted in 100% lysis of RBCs (osmotic lysis). For negative control, RBCs were resuspended in acidic buffer (containing same amounts of Gnd‐HCl). For all protein solutions, the storage was performed at 4°C. Measurement of the supernatant after centrifugation was performed photometrically at wavelength of 541nm (percentage relative to 100% lysis of positive control; subtraction of negative control). Protein concentration after 1:10 dilution: 80µg/ml; N = 3
87
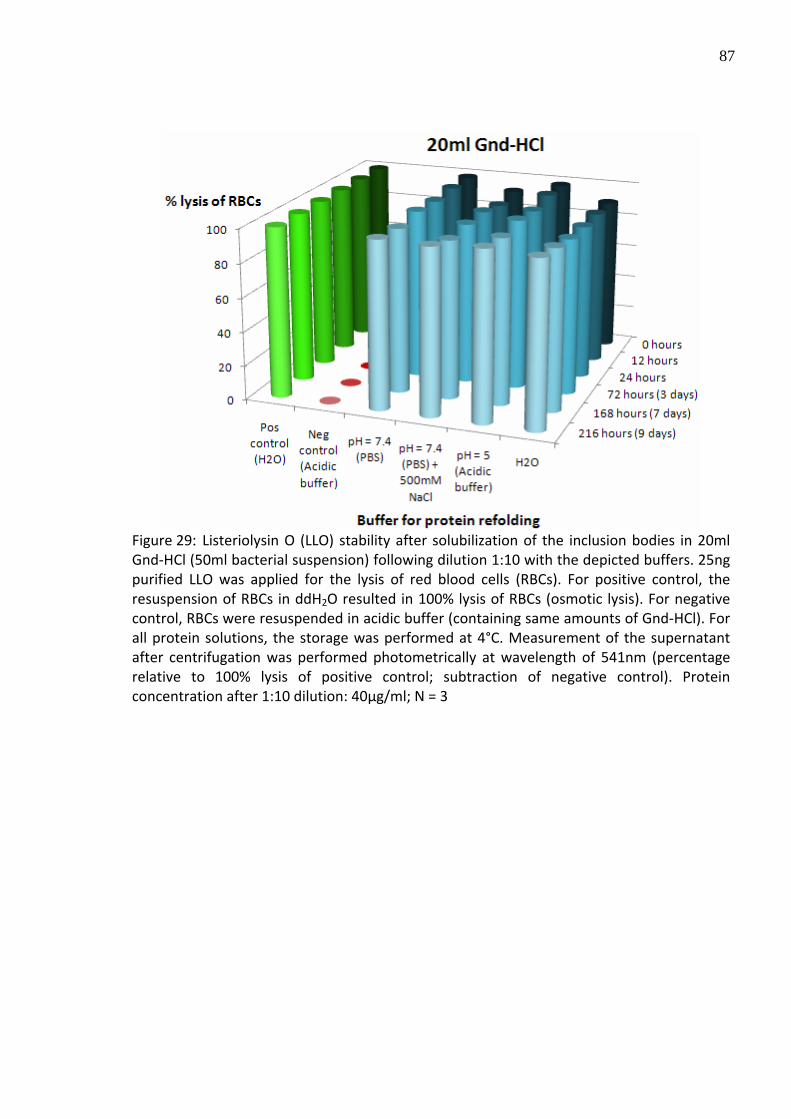
Figure 29: Listeriolysin O (LLO) stability after solubilization of the inclusion bodies in 20ml Gnd‐HCl (50ml bacterial suspension) following dilution 1:10 with the depicted buffers. 25ng purified LLO was applied for the lysis of red blood cells (RBCs). For positive control, the resuspension of RBCs in ddH2O resulted in 100% lysis of RBCs (osmotic lysis). For negative control, RBCs were resuspended in acidic buffer (containing same amounts of Gnd‐HCl). For all protein solutions, the storage was performed at 4°C. Measurement of the supernatant after centrifugation was performed photometrically at wavelength of 541nm (percentage relative to 100% lysis of positive control; subtraction of negative control). Protein concentration after 1:10 dilution: 40µg/ml; N = 3
88
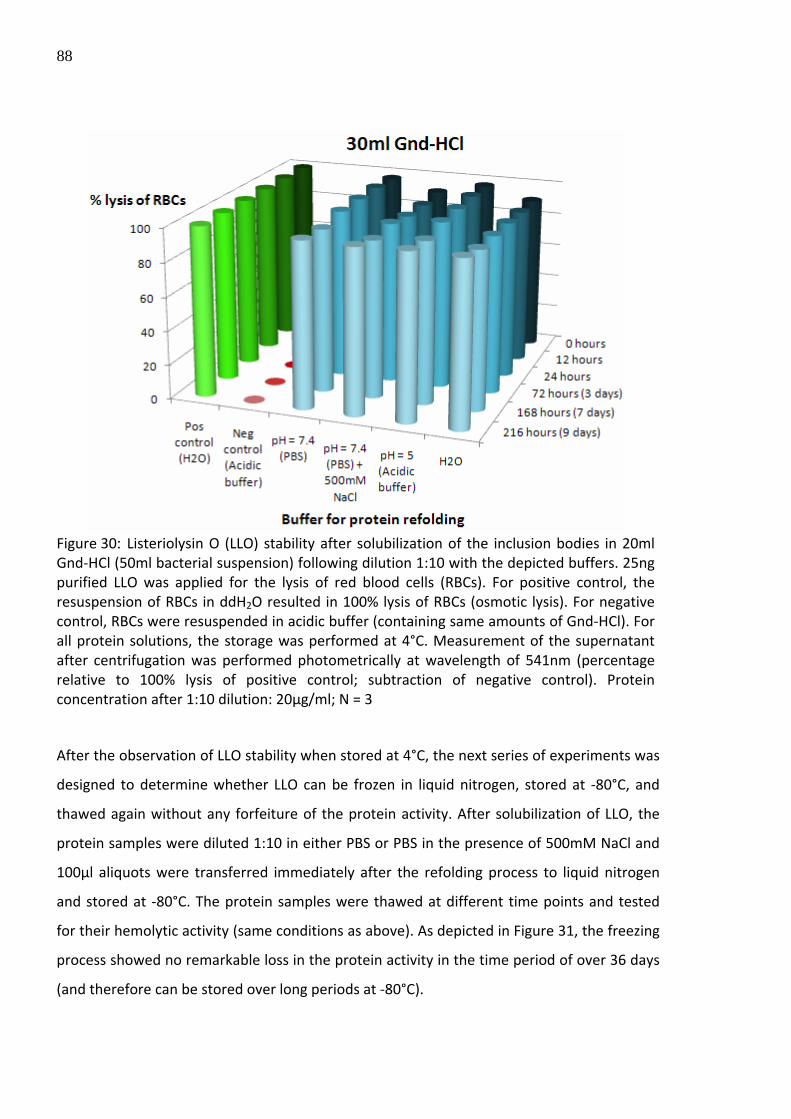
Figure 30: Listeriolysin O (LLO) stability after solubilization of the inclusion bodies in 20ml Gnd‐HCl (50ml bacterial suspension) following dilution 1:10 with the depicted buffers. 25ng purified LLO was applied for the lysis of red blood cells (RBCs). For positive control, the resuspension of RBCs in ddH2O resulted in 100% lysis of RBCs (osmotic lysis). For negative control, RBCs were resuspended in acidic buffer (containing same amounts of Gnd‐HCl). For all protein solutions, the storage was performed at 4°C. Measurement of the supernatant after centrifugation was performed photometrically at wavelength of 541nm (percentage relative to 100% lysis of positive control; subtraction of negative control). Protein concentration after 1:10 dilution: 20µg/ml; N = 3 After the observation of LLO stability when stored at 4°C, the next series of experiments was
designed to determine whether LLO can be frozen in liquid nitrogen, stored at ‐80°C, and
thawed again without any forfeiture of the protein activity. After solubilization of LLO, the
protein samples were diluted 1:10 in either PBS or PBS in the presence of 500mM NaCl and
100µl aliquots were transferred immediately after the refolding process to liquid nitrogen
and stored at ‐80°C. The protein samples were thawed at different time points and tested
for their hemolytic activity (same conditions as above). As depicted in Figure 31, the freezing
process showed no remarkable loss in the protein activity in the time period of over 36 days
(and therefore can be stored over long periods at ‐80°C).
89
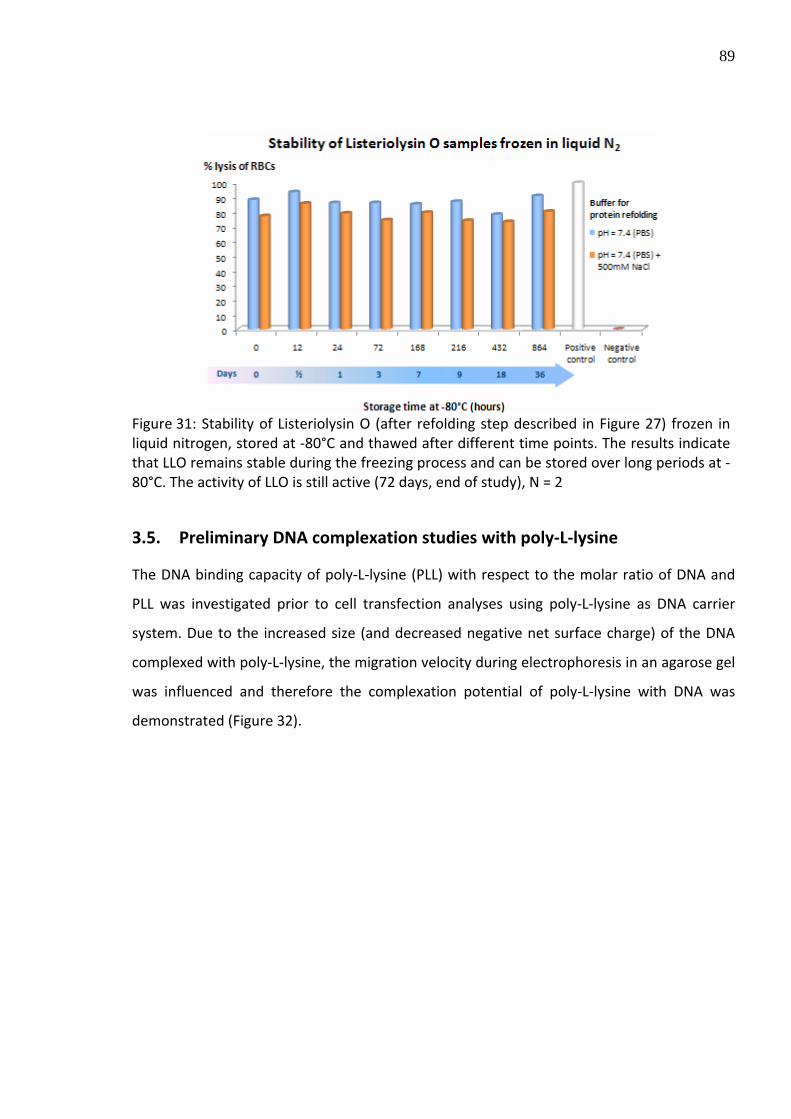
Figure 31: Stability of Listeriolysin O (after refolding step described in Figure 27) frozen in liquid nitrogen, stored at ‐80°C and thawed after different time points. The results indicate that LLO remains stable during the freezing process and can be stored over long periods at ‐80°C. The activity of LLO is still active (72 days, end of study), N = 2
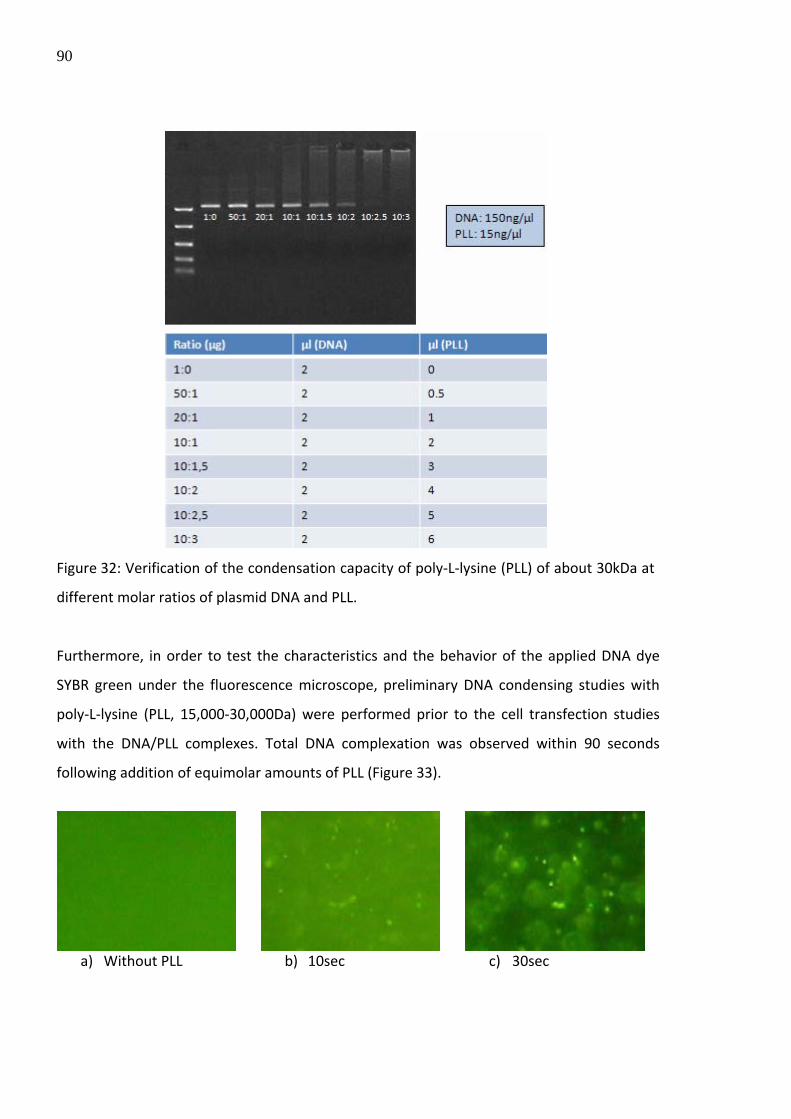
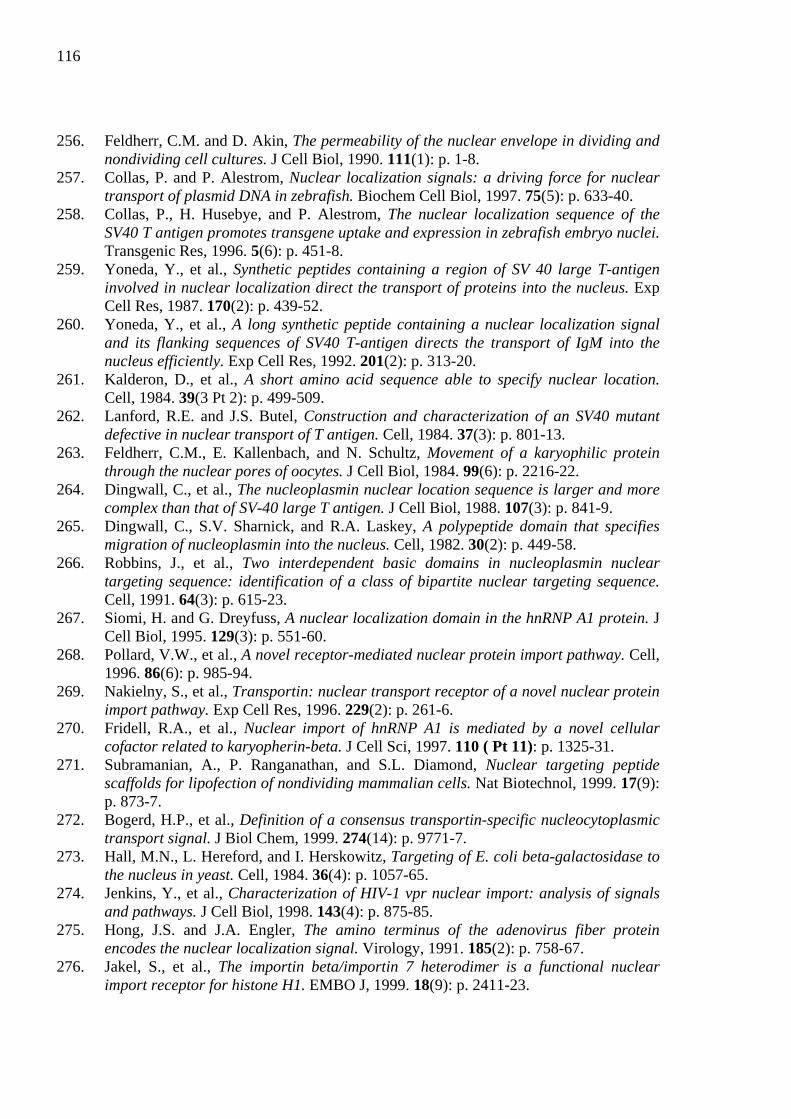
3.5. Preliminary DNA complexation studies with poly‐L‐lysine
The DNA binding capacity of poly‐L‐lysine (PLL) with respect to the molar ratio of DNA and
PLL was investigated prior to cell transfection analyses using poly‐L‐lysine as DNA carrier
system. Due to the increased size (and decreased negative net surface charge) of the DNA
complexed with poly‐L‐lysine, the migration velocity during electrophoresis in an agarose gel
was influenced and therefore the complexation potential of poly‐L‐lysine with DNA was
demonstrated (Figure 32).
90
Figure 32: Verification of the condensation capacity of poly‐L‐lysine (PLL) of about 30kDa at
different molar ratios of plasmid DNA and PLL.
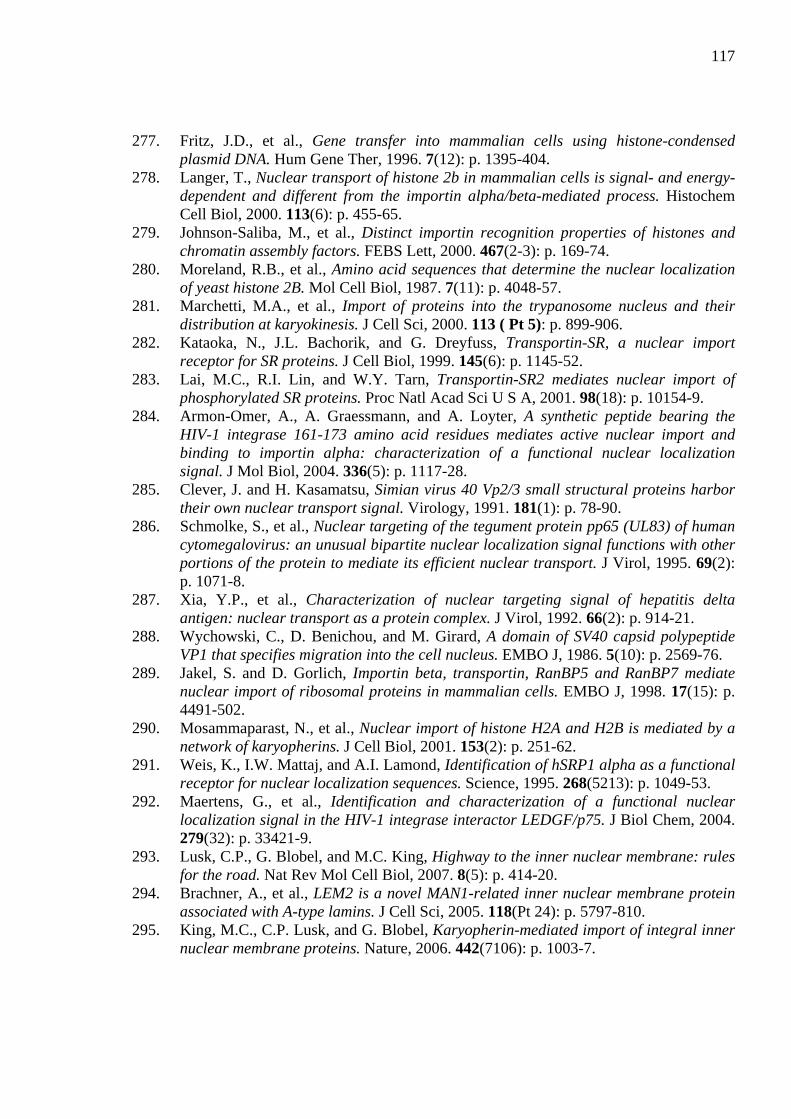
Furthermore, in order to test the characteristics and the behavior of the applied DNA dye
SYBR green under the fluorescence microscope, preliminary DNA condensing studies with
poly‐L‐lysine (PLL, 15,000‐30,000Da) were performed prior to the cell transfection studies
with the DNA/PLL complexes. Total DNA complexation was observed within 90 seconds
following addition of equimolar amounts of PLL (Figure 33).
a) Without PLL b) 10sec c) 30sec
91
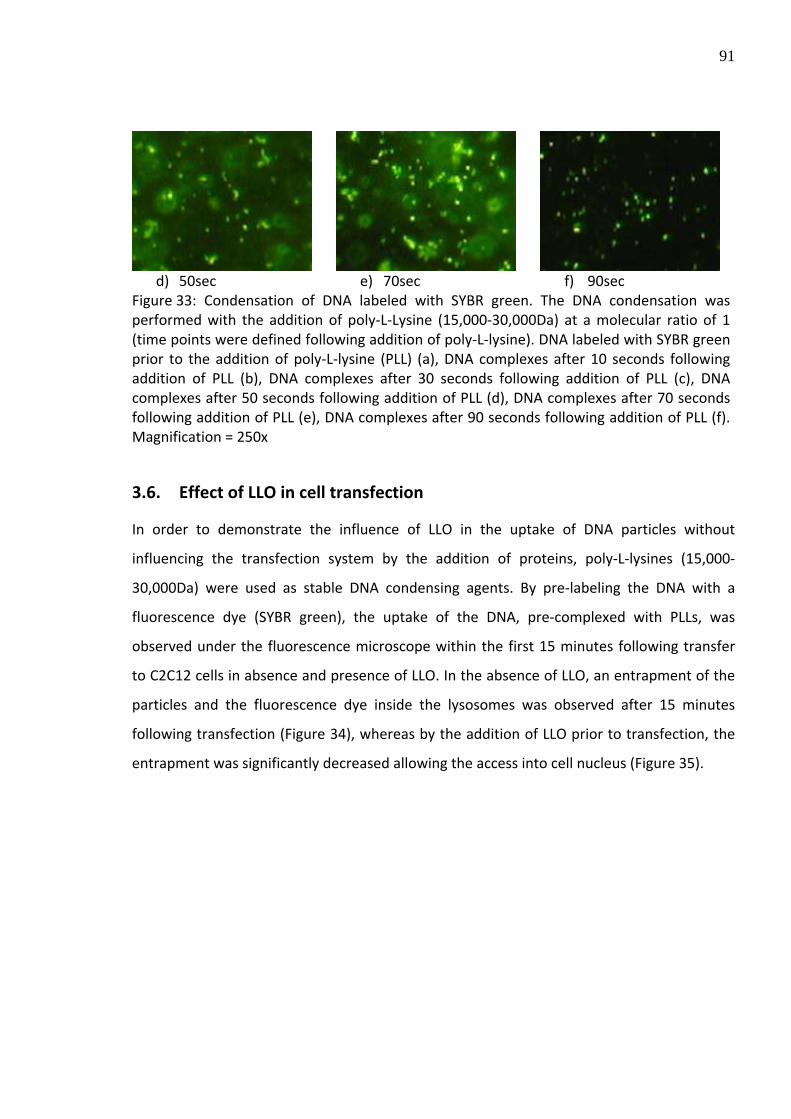
d) 50sec e) 70sec f) 90sec
Figure 33: Condensation of DNA labeled with SYBR green. The DNA condensation was performed with the addition of poly‐L‐Lysine (15,000‐30,000Da) at a molecular ratio of 1 (time points were defined following addition of poly‐L‐lysine). DNA labeled with SYBR green prior to the addition of poly‐L‐lysine (PLL) (a), DNA complexes after 10 seconds following addition of PLL (b), DNA complexes after 30 seconds following addition of PLL (c), DNA complexes after 50 seconds following addition of PLL (d), DNA complexes after 70 seconds following addition of PLL (e), DNA complexes after 90 seconds following addition of PLL (f). Magnification = 250x
3.6. Effect of LLO in cell transfection
In order to demonstrate the influence of LLO in the uptake of DNA particles without
influencing the transfection system by the addition of proteins, poly‐L‐lysines (15,000‐
30,000Da) were used as stable DNA condensing agents. By pre‐labeling the DNA with a
fluorescence dye (SYBR green), the uptake of the DNA, pre‐complexed with PLLs, was
observed under the fluorescence microscope within the first 15 minutes following transfer
to C2C12 cells in absence and presence of LLO. In the absence of LLO, an entrapment of the
particles and the fluorescence dye inside the lysosomes was observed after 15 minutes
following transfection (Figure 34), whereas by the addition of LLO prior to transfection, the
entrapment was significantly decreased allowing the access into cell nucleus (Figure 35).
92
Figure 34: C2C12 cells after the addition of the DNA labeled with SYBR green and complexed with equimolar amounts of poly‐L‐lysine. Fluorescence microscopy was performed 15 minutes following the addition of the complexes.
93
Figure 35: C2C12 cells after the addition of the DNA labeled with SYBR green and complexed with equimolar amounts of poly‐L‐lysine and 100ng of purified Listeriolysin O. Fluorescence microscopy was performed 15 minutes following the addition of the complexes.
94
4. Discussion
During the infection process, Listeria monocytogenes releases low levels of LLO causing the
burst of the lysosomes of target cells to gain access into the cytosol [197, 200]. In order to
use the hemolytic toxin as an auxiliary protein to avoid the lysosomal degradation of the
introduced DNA, sufficient amounts of pure LLO have to be produced. The results in this
work demonstrate that the purified LLO was able to enhance the delivery of macromolecules
into the cytosol of mouse skeletal myoblast precursor cells by disrupting the lysosomal
compartments. In comparison, enhanced delivery of liposomal content by the presence of
LLO [205] as well as the delivery of proteins using E. coli as LLO expressing shuttle vector
[207] was demonstrated using macrophages as the target cell system. In contrast to the fact
that L. monocytogenes naturally infects macrophages, this work has demonstrated, that the
hemolytic activity of LLO inside the lysosomes of target cells is not cell‐type specific and
therefore LLO can be used to burst the lysosomes in probably all cell types.
4.1. Expression of LLO in E. coli BL21(DE3) and stability assay
The expression of LLO in E. coli was performed described in section 2.3.5. In contrast to
other published results [312‐314], the expressed recombinant protein was assembled in
inclusion bodies during the protein expression in E. coli. The addition of triton X‐100 is
commonly used as an additional reagent for washing inclusion bodies. But due to the
hemolytic property of triton X‐100, washing of the inclusion bodies with triton X‐100 was
avoided in order not to influence the subsequent hemolytic assay. Additionally, because of
the aggregation of LLO after concentration, the subsequent His‐tag affinity chromatography
was not performed until its maximum loading capacity. Optionally, dialysis was performed
prior affinity chromatography in order to remove the leftovers of the solubilization buffer
after the refolding by dilution (section 2.3.6.6.).
95
4.2. LLO stability assay
Once, the lysosomal membrane is disrupted by LLO, the hemolytic protein has to be turned
off in order to prevent the subsequent lysis of the eukaryotic cell membrane. Therefore, LLO
undergoes a conformational change when exposed to physiological pH conditions leading to
intermolecular protein aggregation [201, 202]. This natural property of LLO has to be taken
into account during the discovery of ideal storage conditions giving rise to prolonged protein
stability. The results support the assumption, that the exposition of LLO to pH = 5 drives the
protein into its more stable active conformation, leading to an enhanced life‐span.
Additionally, the stability of LLO increased when the protein concentration was decreased.
Assumable, that by decreasing the concentration of LLO, the force for intermolecular protein
aggregation was also decreased.
In contrast, by exposing LLO to physiological pH conditions, the protein was deactivated. The
aggregation of LLO is commonly performed when the following physiological conditions
(temperature > 33°C, pH > 7) were given. Therefore, by changing only one environmental
parameter by decreasing the temperature to 4°C (storage condition), the proteins remained
active several days (Figure 28). By further decrease of the protein concentration prior the
refolding process, the stability of LLO was even more prolonged (documented for 9 days,
verified at least 2 months following the protein refolding, data not shown). The results
indicate, that the lower the protein concentration the lower the probability of protein
aggregation. Additionally, in contrast to the observations described in [203], no differences
in stability in the presence and absence of 500mM NaCl was observed. Contrary, LLO in the
presence of 500mM NaCl even showed a slightly lower hemolytic activity.
4.3. Effect of LLO during gene delivery into eukaryotic cells
To test the potential of LLO to enhance the probability of the delivery of complexed particles
by bursting the lysosomal compartments, C2C12 cells were transfected with different
transfection reagents in the presence and absence of LLO. It was not reproducible
demonstrating enhanced cell transfection with fluorescence vectors (pDsRed‐Express‐C1,
96
pCDNA3‐EYFPHis) in the presence of LLO by using commercially available transfection
reagents (Lipofectamine 2000, ExGen, TurboFect), due to the sensitivity of these cationic
lipids to other proteins present in the solution. As assumed, the presence of LLO decreased
the transfection efficiency of Lipofectamine 2000 (L2K) dramatically, and proportionally to
the applied protein concentration. In comparison, LLO replaced by bovine serum albumin
(BSA) showed nearly the same effects of hindering the cell transfection (data not shown).
Furthermore, due to significant changes in the efficacy of cell transfection even after small
alterations in the protein concentration and molecular weight, it was not reproducible to
compare the transfection efficiencies in presence of either LLO or BSA, even if the same
concentrations were applied. To date, no demonstration of the effect of LLO in enhancing
the expression of introduced exogenous DNA due to the higher transfection efficacy has
been demonstrated in the literature. Kyung‐Dall Lee et al. has shown the release of
fluorescence dye when packed in liposomes in the presence of LLO [205], and Higgins et al.
has shown similar lysosome disrupting effects of LLO in in vitro experiments. Additionally,
LLO was used to introduce a toxin for an effective anti‐tumor therapy [206].
Furthermore, it has to be mentioned, that SYBR green is a cell permeable fluorescence dye,
and therefore an influx of the dye into the cells was observed starting after 30 minutes. Due
to this reason, observations above 15 minutes would not lead to any reproducible results,
and therefore all observations were performed at most within 10‐15 minutes post‐
transfection. Moreover, the localization of the labeled exogenous DNA was hard to define
due to the leftovers of unbound SYBR green, transformed together with the labeled, PLL‐
complexed DNA. In fact, it is assumable, that this free SYBR green (or SYBR green dissolved
from the introduced DNA) was engulfed by the target cells and diffused into the cell nucleus
causing fluorescence labeling of the genomic DNA. Anyway, the uptake of the DNA/PLL
particles was observed within 15 minutes under light microscopy.
However, in order to test the potency of purified LLO to disrupt the lysosomes, a comparison
of the destiny of the fluorescent dye in the presence and absence of LLO was sufficient to
conclude the effects of LLO.
97
4.4. Possible applications
In vivo cell transfection methods are still inadequate due to several limiting factors like
inefficient cellular uptake, lysosomal degradation and nuclear import of introduced
therapeutic genes. By the adaption of bacterial or viral proteins helping to overcome specific
barriers, like the combination of LLO with other transfection methods lacking an efficient
mechanism to overcome the lysosmal degradation, the efficacy of the gene delivery could be
increased. In contrast to other synthetic or naturally derived hemolytic compounds, LLO has
the advantage of its pH dependent hemolytic activity displayed only inside the lysosomes
and its low cytotoxicity compared to other hemolytic proteins [190, 315]. Furthermore, LLO
is degraded when located inside the cytosol, therefore featuring an additional protection of
the cell membrane of the host cell [316], which makes the protein to an ideal candidate to
increase the efficacy of gene delivery applications.
98
99
5. Summary
In contrast to strategies based on the introduction of transgenic cells expressing growth
factors (ex vivo therapy), or the direct administration of recombinant growth factors into
target systems, in vivo gene therapy approaches (introduction of therapeutic plasmids
encoded for growth factors) provide a promising alternative associated with lower
manufacturing costs, higher safety and increased bioactivity of the produced proteins (due
to host‐specific post‐translational modifications and correct folding of the locally produced
growth factors). Utilizing viral particles for high transfection efficiencies (high efficiency for
DNA introduction into target cells in vivo) is unsuitable due to the high immunogenicity and
the nature of some viral vectors to manipulate the host genome.
On the other hand, non‐viral gene delivery methods provide high safety and low immune
response, but are limited in their transfection efficiency. Main reasons for impaired
transfection capacity are confined cellular uptake of the exogenous DNA, the lysosomal
degradation after uptake and the low efficiency of the introduced plasmid DNA to diffuse
into the cell nucleus.
This study was focused on the lysosomal degradation which highly limits the transfection
efficiency. In order to avoid the lysosomal degradation of introduced therapeutic DNA and
therefore to significantly increase the probability of the engulfed DNA to overcome the
lysosomal barrier, the influence of the hemolytic protein listeriolysin O, derived from the
intracellular bacteria Listeria monocytogenes, was tested in gene delivery approaches.
During the life cycle of Listeria monocytogenes, the hemolytic protein is secreted after the
engulfment of the bacteria in order to disrupt the lysosomes and to ensure the bacterial
entry into the cytosol of target cells. The main advantage of listeriolysin O is its hemolytic
activity to disrupt eukaryotic membranes restricted only under acidic conditions (below pH =
6) as given in the lysosomes. Due to this pH dependent activity of listeriolysin O, and the
subsequent deactivation by aggregation after exposition to physiological pH conditions (pH =
7), the subsequent disruption of the host cell membrane is avoided preventing the host cell
from lysis. Based on this, listeriolysin O is a promising auxiliary protein for the enhancement
of the transfection efficiency.
100
The hlyA gene, encoded for Listeriolysin O and lacking its secretion signal, was C‐terminally
linked to a polyhistidine tag and cloned into a bacterial expression vector following
expression in E. coli. Subsequent optimization of the protein purification was performed to
attain high yields of pure and bioactive LLO, extensively exceeding presently published
results concerning total yield of LLO and effort of the purification method. The influence of
the purified LLO in cell transfection approaches was tested in vitro. The DNA was prelabeled
with the fluorescence dye and complexed with the polycationic DNA carrier poly‐L‐lysine
(PLL). Particles were transferred to the cells and the uptake efficiency of the particles was
observed in the presence and absence of LLO after 15minutes under fluorescence excitation
to confirm the subsequent access of the DNA dye into the cell nucleus after lysosomal
disruption by LLO.
By comparing the uptake of the fluorescence labeled DNA microparticles, a remarkable
increase of the uptake was observed within the first 15 minutes under the fluorescence
microscope when LLO and the DNA microparticles were simultaneously transferred to the
cells. In contrast, transfection of cells in the absence of LLO showed an entrapment of the
microparticles inside the lysosomes within the same time period.
Zusammenfassung
Im Gegensatz zu Strategien basierend auf die Einführung von transgenenen Zellen, die
Wachstumsfaktoren exprimieren, oder die direkte Administration von rekombinanten
Wachstumsfaktoren in vivo, bietet die Gentherapie (Einführung von exogener DNA
kodierend für einen Wachstumsfaktor) eine einfach anzuwendende, kostengünstige
Alternative, verbunden mit erhöhter Bioaktivität der exprimierten Wachstumsfaktoren
(durch wirtszell‐spezifischer post‐translationaler Modifikation und korrekter Faltung der
lokal durch die Zielzellen produzierten Wachstumsfaktoren).
Jedoch ist der Einsatz von viralen Vektoren, die eine effiziente Einschleusung von Fremd‐
DNA in Zielzellen in vivo garantieren, wegen der Auslösung einer Immunantwort und das
Integrieren der Fremd‐DNA in das Genom der Zielzelle, ungeeignet.
Nicht‐virale Vektoren hingegen bieten eine hohe Sicherheit und erzeugen eine geringfügige
Immunantwort, sind jedoch in ihrer Fähigkeit Zielzellen in vivo zu transfizieren, beschränkt.
Die physische und chemische Barriere der Zellmembran, der lysosomale Abbau und die
101
geringe Effizienz der Diffusion der eingeführten DNA in den Zellkern limitiert die Wirksamkeit
der Transfektion erheblich.
Diese Arbeit war ausgerichtet, den lysosomalen Abbau eingeführter Makromoleküle wie
DNA zu verhindern um die Transfektionseffizienz zu erhöhen. Um den lysosomalen Abbau zu
vermeiden und dadurch die Wahrscheinlichkeit der Einführung therapeutischer DNA in das
Zytosol bzw. den Zellkern zu erhöhen, wurde versucht, mithilfe eines bakteriellen Proteins
(Listeriolysin O) die Lysosomen während der endozytischen Aufnahme der DNA zu zerstören.
Durch die pH‐abhängige Aktivierung der Hämolysins in der lysosomalen Umgebung werden
die Lysosomen zerstört und die endozytotisch aufgenommene therapeutische DNA ins
Zytosol freigesetzt.
Listeriolysin O wurde in E. coli exprimiert und anschließend biochemisch aufgereinigt, um
dessen Einfluss auf die DNA‐Transfektion in eukaryotischen Zellen zu ermitteln. Bei
Anwesenheit von Listeriolysin O zeigte sich eine erhöhte Präsenz von aufgenommenen
Molekülen (DNA, Farbstoff) im Zytosol der Zielzellen.
102
103
6. References
1. Miller, A.D., et al., Use of retroviral vectors for gene transfer and expression. Methods Enzymol, 1993. 217: p. 581-99.
2. Bordignon, C., et al., Retroviral vector-mediated high-efficiency expression of adenosine deaminase (ADA) in hematopoietic long-term cultures of ADA-deficient marrow cells. Proc Natl Acad Sci U S A, 1989. 86(17): p. 6748-52.
3. Berkner, K.L., Expression of heterologous sequences in adenoviral vectors. Curr Top Microbiol Immunol, 1992. 158: p. 39-66.
4. Muzyczka, N., Use of adeno-associated virus as a general transduction vector for mammalian cells. Curr Top Microbiol Immunol, 1992. 158: p. 97-129.
6. Carter, B.J., Adeno-associated virus vectors in clinical trials. Hum Gene Ther, 2005. 16(5): p. 541-50.
7. Flotte, T.R. and B.J. Carter, Adeno-associated virus vectors for gene therapy. Gene Ther, 1995. 2(6): p. 357-62.
8. Fink, D.J. and M. Mata, HSV gene transfer in the treatment of chronic pain. Sheng Li Xue Bao, 2008. 60(5): p. 610-6.
9. Naldini, L., et al., In vivo gene delivery and stable transduction of nondividing cells by a lentiviral vector. Science, 1996. 272(5259): p. 263-7.
10. Harada, Y., et al., Highly efficient suicide gene expression in hepatocellular carcinoma cells by epstein-barr virus-based plasmid vectors combined with polyamidoamine dendrimer. Cancer Gene Ther, 2000. 7(1): p. 27-36.
11. Margolskee, R.F., Epstein-Barr virus based expression vectors. Curr Top Microbiol Immunol, 1992. 158: p. 67-95.
12. Walker, W.E., D.J. Porteous, and A.C. Boyd, The effects of plasmid copy number and sequence context upon transfection efficiency. J Control Release, 2004. 94(1): p. 245-52.
13. Scherer, F., et al., Magnetofection: enhancing and targeting gene delivery by magnetic force in vitro and in vivo. Gene Ther, 2002. 9(2): p. 102-9.
14. Plank, C., et al., The magnetofection method: using magnetic force to enhance gene delivery. Biol Chem, 2003. 384(5): p. 737-47.
15. Plank, C., et al., Enhancing and targeting nucleic acid delivery by magnetic force. Expert Opin Biol Ther, 2003. 3(5): p. 745-58.
16. Mykhaylyk, O., et al., siRNA delivery by magnetofection. Curr Opin Mol Ther, 2008. 10(5): p. 493-505.
17. Yang, S.Y., et al., Ex vivo magnetofection with magnetic nanoparticles: a novel platform for nonviral tissue engineering. Artif Organs, 2008. 32(3): p. 195-204.
18. Sugar, I.P. and E. Neumann, Stochastic model for electric field-induced membrane pores. Electroporation. Biophys Chem, 1984. 19(3): p. 211-25.
19. Weaver, J.C., Electroporation theory. Concepts and mechanisms. Methods Mol Biol, 1995. 55: p. 3-28.
104
20. Baum, C., et al., An optimized electroporation protocol applicable to a wide range of cell lines. Biotechniques, 1994. 17(6): p. 1058-62.
21. Aihara, H. and J. Miyazaki, Gene transfer into muscle by electroporation in vivo. Nat Biotechnol, 1998. 16(9): p. 867-70.
22. Nishi, T., et al., High-efficiency in vivo gene transfer using intraarterial plasmid DNA injection following in vivo electroporation. Cancer Res, 1996. 56(5): p. 1050-5.
23. Judkewitz, B., et al., Targeted single-cell electroporation of mammalian neurons in vivo. Nat Protoc, 2009. 4(6): p. 862-9.
24. Yoon, C.S., et al., Comparison of the efficiency and toxicity of sonoporation with branched polyethylenimine-mediated gene transfection in various cultured cell lines. J Drug Target, 2008. 16(10): p. 773-9.
25. Ohta, S., et al., Gene transduction by sonoporation. Dev Growth Differ, 2008. 50(6): p. 517-20.
26. Postema, M. and O.H. Gilja, Ultrasound-directed drug delivery. Curr Pharm Biotechnol, 2007. 8(6): p. 355-61.
27. Li, Y.S., C.N. Reid, and A.P. McHale, Enhancing ultrasound-mediated cell membrane permeabilisation (sonoporation) using a high frequency pulse regime and implications for ultrasound-aided cancer chemotherapy. Cancer Lett, 2008. 266(2): p. 156-62.
28. Karshafian, R., et al., Sonoporation by ultrasound-activated microbubble contrast agents: effect of acoustic exposure parameters on cell membrane permeability and cell viability. Ultrasound Med Biol, 2009. 35(5): p. 847-60.
29. Miller, D.L. and C. Dou, Induction of apoptosis in sonoporation and ultrasonic gene transfer. Ultrasound Med Biol, 2009. 35(1): p. 144-54.
30. Ohta, S., et al., Microbubble-enhanced sonoporation: efficient gene transduction technique for chick embryos. Genesis, 2003. 37(2): p. 91-101.
31. Osawa, K., et al., Osteoinduction by microbubble-enhanced transcutaneous sonoporation of human bone morphogenetic protein-2. J Gene Med, 2009.
32. Yoon, C.S., et al., Sonoporation of the minicircle-VEGF(165) for wound healing of diabetic mice. Pharm Res, 2009. 26(4): p. 794-801.
33. Johnston, S.A., Biolistic transformation: microbes to mice. Nature, 1990. 346(6286): p. 776-7.
34. Furth, P.A., Gene transfer by biolistic process. Mol Biotechnol, 1997. 7(2): p. 139-43. 35. Klein, R.M., et al., High-velocity microprojectiles for delivering nucleic acids into
living cells. 1987. Biotechnology, 1992. 24: p. 384-6. 36. Klein, T.M., et al., Transfer of foreign genes into intact maize cells with high-velocity
microprojectiles. Proc Natl Acad Sci U S A, 1988. 85(12): p. 4305-4309. 37. Oard, J.H., et al., Transient Gene Expression in Maize, Rice, and Wheat Cells Using
an Airgun Apparatus. Plant Physiol, 1990. 92(2): p. 334-339. 38. Christou, P., D.E. McCabe, and W.F. Swain, Stable Transformation of Soybean Callus
by DNA-Coated Gold Particles. Plant Physiol, 1988. 87(3): p. 671-674. 39. Seki, M., A. Iida, and H. Morikawa, Transient expression of the beta-glucuronidase
gene in tissues of Arabidopsis thaliana by bombardment-mediated transformation. Mol Biotechnol, 1999. 11(3): p. 251-5.
40. Ueki, S., et al., Functional transient genetic transformation of Arabidopsis leaves by biolistic bombardment. Nat Protoc, 2009. 4(1): p. 71-7.
41. Sanford, J.C., F.D. Smith, and J.A. Russell, Optimizing the biolistic process for different biological applications. Methods Enzymol, 1993. 217: p. 483-509.
105
42. Klein, T.M., et al., Transformation of microbes, plants and animals by particle bombardment. Biotechnology (N Y), 1992. 10(3): p. 286-91.
43. Sautter, C., et al., Micro-targeting: high efficiency gene transfer using a novel approach for the acceleration of micro-projectiles. Biotechnology (N Y), 1991. 9(11): p. 1080-5.
44. Sun, W.H., et al., In vivo cytokine gene transfer by gene gun reduces tumor growth in mice. Proc Natl Acad Sci U S A, 1995. 92(7): p. 2889-93.
45. Rakhmilevich, A.L., et al., Cytokine gene therapy of cancer using gene gun technology: superior antitumor activity of interleukin-12. Hum Gene Ther, 1997. 8(11): p. 1303-11.
46. Oshikawa, K., et al., Particle-mediated gene transfer of murine interleukin-12 cDNA suppresses the growth of Lewis lung carcinoma. In Vivo, 1999. 13(5): p. 397-402.
47. Bennett, A.M., et al., Gene gun mediated vaccination is superior to manual delivery for immunisation with DNA vaccines expressing protective antigens from Yersinia pestis or Venezuelan Equine Encephalitis virus. Vaccine, 1999. 18(7-8): p. 588-96.
48. Chang, S.W., et al., A vector DNA vaccine encoding pseudorabies virus immediate early protein demonstrates partial protection in mice against lethal virus challenge. Viral Immunol, 1998. 11(1): p. 27-36.
49. Vanrompay, D., et al., Protection of turkeys against Chlamydia psittaci challenge by gene gun-based DNA immunizations. Vaccine, 1999. 17(20-21): p. 2628-35.
50. Lagerqvist, N., et al., Characterisation of immune responses and protective efficacy in mice after immunisation with Rift Valley Fever virus cDNA constructs. Virol J, 2009. 6: p. 6.
51. Wallmann, J., et al., A mimotope gene encoding the major IgE epitope of allergen Phl p 5 for epitope-specific immunization. Immunol Lett, 2009. 122(1): p. 68-75.
52. Goudy, K.S., B. Wang, and R. Tisch, Gene gun-mediated DNA vaccination enhances antigen-specific immunotherapy at a late preclinical stage of type 1 diabetes in nonobese diabetic mice. Clin Immunol, 2008. 129(1): p. 49-57.
53. Johnston, S.A., et al., Mitochondrial transformation in yeast by bombardment with microprojectiles. Science, 1988. 240(4858): p. 1538-41.
54. Yang, N.S., et al., In vivo and in vitro gene transfer to mammalian somatic cells by particle bombardment. Proc Natl Acad Sci U S A, 1990. 87(24): p. 9568-72.
55. Williams, R.S., et al., Introduction of foreign genes into tissues of living mice by DNA-coated microprojectiles. Proc Natl Acad Sci U S A, 1991. 88(7): p. 2726-30.
56. Belyantseva, I.A., Helios Gene Gun-mediated transfection of the inner ear sensory epithelium. Methods Mol Biol, 2009. 493: p. 103-23.
57. Woods, G. and K. Zito, Preparation of gene gun bullets and biolistic transfection of neurons in slice culture. J Vis Exp, 2008(12).
58. Baldarelli, R.M. and J.A. Lengyel, Transient expression of DNA after ballistic introduction into Drosophila embryos. Nucleic Acids Res, 1990. 18(19): p. 5903-4.
59. Jiao, S., et al., Particle bombardment-mediated gene transfer and expression in rat brain tissues. Biotechnology (N Y), 1993. 11(4): p. 497-502.
60. Wetterauer, B., et al., Efficient transformation of Dictyostelium discoideum with a particle inflow gun. Biochim Biophys Acta, 2000. 1499(1-2): p. 139-143.
61. Wilm, T., et al., Ballistic transformation of Caenorhabditis elegans. Gene, 1999. 229(1-2): p. 31-5.
106
62. Campbell, S.E., et al., Preliminary studies of particle-mediated gene delivery to the joints of dogs. Vet Rec, 2007. 160(14): p. 476-81.
63. Zagon, I.S., et al., Particle-mediated gene transfer of opioid growth factor receptor cDNA regulates cell proliferation of the corneal epithelium. Cornea, 2005. 24(5): p. 614-9.
64. Lu, W.N., et al., [Gene transfer into corneal endothelial cells by Helios gene gun]. Nippon Ganka Gakkai Zasshi, 2003. 107(4): p. 189-95.
65. Muangmoonchai, R., et al., Transfection of liver in vivo by biolistic particle delivery: its use in the investigation of cytochrome P450 gene regulation. Mol Biotechnol, 2002. 20(2): p. 145-51.
66. Zhang, G. and M.E. Selzer, In vivo transfection of lamprey brain neurons by gene gun delivery of DNA. Exp Neurol, 2001. 167(2): p. 304-11.
67. Shefi, O., et al., Localized RNAi and ectopic gene expression in the medicinal leech. J Vis Exp, 2008(14).
68. Joshi, P. and A. Dunaevsky, Gene-gun transfection of hippocampal neurons. J Vis Exp, 2006(1): p. 121.
69. O'Brien, J.A. and S.C. Lummis, Diolistic labeling of neuronal cultures and intact tissue using a hand-held gene gun. Nat Protoc, 2006. 1(3): p. 1517-21.
70. O'Brien, J. and N. Unwin, Organization of spines on the dendrites of Purkinje cells. Proc Natl Acad Sci U S A, 2006. 103(5): p. 1575-80.
71. O'Brien, J.A., et al., Modifications to the hand-held Gene Gun: improvements for in vitro biolistic transfection of organotypic neuronal tissue. J Neurosci Methods, 2001. 112(1): p. 57-64.
72. Mann, A., R. Richa, and M. Ganguli, DNA condensation by poly-L-lysine at the single molecule level: role of DNA concentration and polymer length. J Control Release, 2008. 125(3): p. 252-62.
73. Gebhart, C.L. and A.V. Kabanov, Evaluation of polyplexes as gene transfer agents. J Control Release, 2001. 73(2-3): p. 401-16.
74. Blum, J.S. and W.M. Saltzman, High loading efficiency and tunable release of plasmid DNA encapsulated in submicron particles fabricated from PLGA conjugated with poly-L-lysine. J Control Release, 2008. 129(1): p. 66-72.
75. Mannisto, M., et al., Structure-activity relationships of poly(L-lysines): effects of pegylation and molecular shape on physicochemical and biological properties in gene delivery. J Control Release, 2002. 83(1): p. 169-82.
76. Dunlap, D.D., et al., Nanoscopic structure of DNA condensed for gene delivery. Nucleic Acids Res, 1997. 25(15): p. 3095-101.
77. Goula, D., et al., Polyethylenimine-based intravenous delivery of transgenes to mouse lung. Gene Ther, 1998. 5(9): p. 1291-5.
78. Wightman, L., et al., Different behavior of branched and linear polyethylenimine for gene delivery in vitro and in vivo. J Gene Med, 2001. 3(4): p. 362-72.
79. Lukacs, G.L., et al., Size-dependent DNA mobility in cytoplasm and nucleus. J Biol Chem, 2000. 275(3): p. 1625-9.
80. Hsu, C.Y. and H. Uludag, Effects of size and topology of DNA molecules on intracellular delivery with non-viral gene carriers. BMC Biotechnol, 2008. 8: p. 23.
81. Bloomfield, V.A., DNA condensation. Curr Opin Struct Biol, 1996. 6(3): p. 334-41.
107
82. Vijayanathan, V., et al., Formation of DNA nanoparticles in the presence of novel polyamine analogues: a laser light scattering and atomic force microscopic study. Nucleic Acids Res, 2004. 32(1): p. 127-34.
83. Minagawa, K., et al., Direct observation of the biphasic conformational change of DNA induced by cationic polymers. FEBS Lett, 1991. 295(1-3): p. 67-9.
84. Kircheis, R., L. Wightman, and E. Wagner, Design and gene delivery activity of modified polyethylenimines. Adv Drug Deliv Rev, 2001. 53(3): p. 341-58.
85. Wadhwa, M.S., et al., Peptide-mediated gene delivery: influence of peptide structure on gene expression. Bioconjug Chem, 1997. 8(1): p. 81-8.
86. Molas, M., R. Bartrons, and J.C. Perales, Single-stranded DNA condensed with poly-L-lysine results in nanometric particles that are significantly smaller, more stable in physiological ionic strength fluids and afford higher efficiency of gene delivery than their double-stranded counterparts. Biochim Biophys Acta, 2002. 1572(1): p. 37-44.
87. Brown, M.D., et al., In vitro and in vivo gene transfer with poly(amino acid) vesicles. J Control Release, 2003. 93(2): p. 193-211.
88. Plank, C., et al., Activation of the complement system by synthetic DNA complexes: a potential barrier for intravenous gene delivery. Hum Gene Ther, 1996. 7(12): p. 1437-46.
89. Zelphati, O., et al., Effect of serum components on the physico-chemical properties of cationic lipid/oligonucleotide complexes and on their interactions with cells. Biochim Biophys Acta, 1998. 1390(2): p. 119-33.
90. Yamagata, M., et al., Structural advantage of dendritic poly(L-lysine) for gene delivery into cells. Bioorg Med Chem, 2007. 15(1): p. 526-32.
91. Fischer, D., et al., In vitro cytotoxicity testing of polycations: influence of polymer structure on cell viability and hemolysis. Biomaterials, 2003. 24(7): p. 1121-31.
92. Godbey, W.T., K.K. Wu, and A.G. Mikos, Poly(ethylenimine)-mediated gene delivery affects endothelial cell function and viability. Biomaterials, 2001. 22(5): p. 471-80.
93. Regnstrom, K., et al., PEI - a potent, but not harmless, mucosal immuno-stimulator of mixed T-helper cell response and FasL-mediated cell death in mice. Gene Ther, 2003. 10(18): p. 1575-83.
94. Lungwitz, U., et al., Polyethylenimine-based non-viral gene delivery systems. Eur J Pharm Biopharm, 2005. 60(2): p. 247-66.
95. Choi, Y.R., et al., Development of polymeric gene delivery carriers: PEGylated copolymers of L-lysine and L-phenylalanine. J Drug Target, 2007. 15(6): p. 391-8.
96. Ahn, C.H., et al., Synthesis of biodegradable multi-block copolymers of poly(L-lysine) and poly(ethylene glycol) as a non-viral gene carrier. J Control Release, 2004. 97(3): p. 567-74.
97. Hong, J.W., et al., PEGylated polyethylenimine for in vivo local gene delivery based on lipiodolized emulsion system. J Control Release, 2004. 99(1): p. 167-76.
98. Ferrari, S., et al., ExGen 500 is an efficient vector for gene delivery to lung epithelial cells in vitro and in vivo. Gene Ther, 1997. 4(10): p. 1100-6.
99. Boussif, O., M.A. Zanta, and J.P. Behr, Optimized galenics improve in vitro gene transfer with cationic molecules up to 1000-fold. Gene Ther, 1996. 3(12): p. 1074-80.
100. Chonn, A., S.C. Semple, and P.R. Cullis, Association of blood proteins with large unilamellar liposomes in vivo. Relation to circulation lifetimes. J Biol Chem, 1992. 267(26): p. 18759-65.
108
101. Ogris, M., et al., PEGylated DNA/transferrin-PEI complexes: reduced interaction with blood components, extended circulation in blood and potential for systemic gene delivery. Gene Ther, 1999. 6(4): p. 595-605.
102. Kircheis, R., et al., Polyethylenimine/DNA complexes shielded by transferrin target gene expression to tumors after systemic application. Gene Ther, 2001. 8(1): p. 28-40.
103. Kircheis, R., et al., Polycation-based DNA complexes for tumor-targeted gene delivery in vivo. J Gene Med, 1999. 1(2): p. 111-20.
104. Lee, R.J. and L. Huang, Folate-targeted, anionic liposome-entrapped polylysine-condensed DNA for tumor cell-specific gene transfer. J Biol Chem, 1996. 271(14): p. 8481-7.
105. Oh, Y.K., et al., Polyethylenimine-mediated cellular uptake, nucleus trafficking and expression of cytokine plasmid DNA. Gene Ther, 2002. 9(23): p. 1627-32.
106. Behr, J.P., Gene transfer with synthetic cationic amphiphiles: prospects for gene therapy. Bioconjug Chem, 1994. 5(5): p. 382-9.
107. Ramsay, E. and M. Gumbleton, Polylysine and polyornithine gene transfer complexes: a study of complex stability and cellular uptake as a basis for their differential in-vitro transfection efficiency. J Drug Target, 2002. 10(1): p. 1-9.
108. Pollard, H., et al., Ca2+-sensitive cytosolic nucleases prevent efficient delivery to the nucleus of injected plasmids. J Gene Med, 2001. 3(2): p. 153-64.
109. Chiou, H.C., et al., Enhanced resistance to nuclease degradation of nucleic acids complexed to asialoglycoprotein-polylysine carriers. Nucleic Acids Res, 1994. 22(24): p. 5439-46.
110. Golda, A., et al., Small poly-L-lysines improve cationic lipid-mediated gene transfer in vascular cells in vitro and in vivo. J Vasc Res, 2007. 44(4): p. 273-82.
111. Gao, X. and L. Huang, Potentiation of cationic liposome-mediated gene delivery by polycations. Biochemistry, 1996. 35(3): p. 1027-36.
112. Farrell, L.L., et al., A comparison of the effectiveness of cationic polymers poly-L-lysine (PLL) and polyethylenimine (PEI) for non-viral delivery of plasmid DNA to bone marrow stromal cells (BMSC). Eur J Pharm Biopharm, 2007. 65(3): p. 388-97.
113. Guerra-Crespo, M., et al., Polyethylenimine improves the transfection efficiency of primary cultures of post-mitotic rat fetal hypothalamic neurons. J Neurosci Methods, 2003. 127(2): p. 179-92.
114. Cristiano, R.J., et al., Hepatic gene therapy: efficient gene delivery and expression in primary hepatocytes utilizing a conjugated adenovirus-DNA complex. Proc Natl Acad Sci U S A, 1993. 90(24): p. 11548-52.
115. Boussif, O., et al., A versatile vector for gene and oligonucleotide transfer into cells in culture and in vivo: polyethylenimine. Proc Natl Acad Sci U S A, 1995. 92(16): p. 7297-301.
116. Remy-Kristensen, A., et al., Role of endocytosis in the transfection of L929 fibroblasts by polyethylenimine/DNA complexes. Biochim Biophys Acta, 2001. 1514(1): p. 21-32.
117. Felgner, J.H., et al., Enhanced gene delivery and mechanism studies with a novel series of cationic lipid formulations. J Biol Chem, 1994. 269(4): p. 2550-61.
118. Abdallah, B., et al., A powerful nonviral vector for in vivo gene transfer into the adult mammalian brain: polyethylenimine. Hum Gene Ther, 1996. 7(16): p. 1947-54.
119. Wiethoff, C.M., et al., The potential role of proteoglycans in cationic lipid-mediated gene delivery. Studies of the interaction of cationic lipid-DNA complexes with model glycosaminoglycans. J Biol Chem, 2001. 276(35): p. 32806-13.
109
120. Ogris, M., E. Wagner, and P. Steinlein, A versatile assay to study cellular uptake of gene transfer complexes by flow cytometry. Biochim Biophys Acta, 2000. 1474(2): p. 237-43.
121. Stanic, V., et al., Filamentous condensation of DNA induced by pegylated poly-L-lysine and transfection efficiency. Biomacromolecules, 2008. 9(7): p. 2048-55.
122. Kimura, T., et al., Structure/function relationship in the polyplexes containing cationic polypeptides for gene delivery. Nucleic Acids Res Suppl, 2001(1): p. 203-4.
123. Eom, K.D., et al., Dendritic alpha,epsilon-poly(L-lysine)s as delivery agents for antisense oligonucleotides. Pharm Res, 2007. 24(8): p. 1581-9.
124. Bieber, T., et al., Intracellular route and transcriptional competence of polyethylenimine-DNA complexes. J Control Release, 2002. 82(2-3): p. 441-54.
125. El Ouahabi, A., et al., The role of endosome destabilizing activity in the gene transfer process mediated by cationic lipids. FEBS Lett, 1997. 414(2): p. 187-92.
126. Neu, M., D. Fischer, and T. Kissel, Recent advances in rational gene transfer vector design based on poly(ethylene imine) and its derivatives. J Gene Med, 2005. 7(8): p. 992-1009.
127. Klemm, A.R., D. Young, and J.B. Lloyd, Effects of polyethyleneimine on endocytosis and lysosome stability. Biochem Pharmacol, 1998. 56(1): p. 41-6.
128. Akinc, A. and R. Langer, Measuring the pH environment of DNA delivered using nonviral vectors: implications for lysosomal trafficking. Biotechnol Bioeng, 2002. 78(5): p. 503-8.
129. Guo, Y., et al., Capillary electrophoresis analysis of poly(ethylene glycol) and ligand-modified polylysine gene delivery vectors. Anal Biochem, 2007. 363(2): p. 204-9.
130. Finsinger, D., et al., Protective copolymers for nonviral gene vectors: synthesis, vector characterization and application in gene delivery. Gene Ther, 2000. 7(14): p. 1183-92.
131. Lee, M., et al., Repression of GAD autoantigen expression in pancreas beta-Cells by delivery of antisense plasmid/PEG-g-PLL complex. Mol Ther, 2001. 4(4): p. 339-46.
132. Harada-Shiba, M., et al., Polyion complex micelles as vectors in gene therapy--pharmacokinetics and in vivo gene transfer. Gene Ther, 2002. 9(6): p. 407-14.
133. Wolfert, M.A., et al., Characterization of vectors for gene therapy formed by self-assembly of DNA with synthetic block co-polymers. Hum Gene Ther, 1996. 7(17): p. 2123-33.
134. Toncheva, V., et al., Novel vectors for gene delivery formed by self-assembly of DNA with poly(L-lysine) grafted with hydrophilic polymers. Biochim Biophys Acta, 1998. 1380(3): p. 354-68.
135. Kimura, T., et al., Effect of serine residue on the effectiveness of cationic polypeptide-based gene delivery. Nucleic Acids Symp Ser, 2000(44): p. 299-300.
136. Jeon, E., H.D. Kim, and J.S. Kim, Pluronic-grafted poly-(L)-lysine as a new synthetic gene carrier. J Biomed Mater Res A, 2003. 66(4): p. 854-9.
137. Xiang, J.J., et al., IONP-PLL: a novel non-viral vector for efficient gene delivery. J Gene Med, 2003. 5(9): p. 803-17.
138. Okuda, T., et al., Characters of dendritic poly(L-lysine) analogues with the terminal lysines replaced with arginines and histidines as gene carriers in vitro. Biomaterials, 2004. 25(3): p. 537-44.
110
139. Incani, V., et al., Palmitic acid substitution on cationic polymers for effective delivery of plasmid DNA to bone marrow stromal cells. J Biomed Mater Res A, 2007. 81(2): p. 493-504.
140. Wang, S., et al., Delivery of different length poly(L-lysine)-conjugated ODN to HepG2 cells using N-stearyllactobionamide-modified liposomes and their enhanced cellular biological effects. Int J Pharm, 2006. 311(1-2): p. 82-8.
141. Ward, C.M., et al., Modification of pLL/DNA complexes with a multivalent hydrophilic polymer permits folate-mediated targeting in vitro and prolonged plasma circulation in vivo. J Gene Med, 2002. 4(5): p. 536-47.
142. Kawano, T., et al., Long circulation of intravenously administered plasmid DNA delivered with dendritic poly(L-lysine) in the blood flow. J Control Release, 2004. 99(2): p. 329-37.
143. Ogris, M., et al., Tumor-targeted gene therapy: strategies for the preparation of ligand-polyethylene glycol-polyethylenimine/DNA complexes. J Control Release, 2003. 91(1-2): p. 173-81.
144. Dash, P.R., et al., Decreased binding to proteins and cells of polymeric gene delivery vectors surface modified with a multivalent hydrophilic polymer and retargeting through attachment of transferrin. J Biol Chem, 2000. 275(6): p. 3793-802.
145. Suh, W., et al., An angiogenic, endothelial-cell-targeted polymeric gene carrier. Mol Ther, 2002. 6(5): p. 664-72.
146. Nguyen, H.K., et al., Evaluation of polyether-polyethyleneimine graft copolymers as gene transfer agents. Gene Ther, 2000. 7(2): p. 126-38.
147. Lemieux, P., et al., A combination of poloxamers increases gene expression of plasmid DNA in skeletal muscle. Gene Ther, 2000. 7(11): p. 986-91.
148. Guy-Caffey, J.K., et al., Novel polyaminolipids enhance the cellular uptake of oligonucleotides. J Biol Chem, 1995. 270(52): p. 31391-6.
149. Zabner, J., et al., Cellular and molecular barriers to gene transfer by a cationic lipid. J Biol Chem, 1995. 270(32): p. 18997-9007.
150. Luo, D., et al., A self-assembled, modular DNA delivery system mediated by silica nanoparticles. J Control Release, 2004. 95(2): p. 333-41.
151. Ravi Kumar, M.N., et al., Cationic silica nanoparticles as gene carriers: synthesis, characterization and transfection efficiency in vitro and in vivo. J Nanosci Nanotechnol, 2004. 4(7): p. 876-81.
152. Roy, I., et al., Optical tracking of organically modified silica nanoparticles as DNA carriers: a nonviral, nanomedicine approach for gene delivery. Proc Natl Acad Sci U S A, 2005. 102(2): p. 279-84.
153. Bharali, D.J., et al., Organically modified silica nanoparticles: a nonviral vector for in vivo gene delivery and expression in the brain. Proc Natl Acad Sci U S A, 2005. 102(32): p. 11539-44.
154. Gemeinhart, R.A., D. Luo, and W.M. Saltzman, Cellular fate of a modular DNA delivery system mediated by silica nanoparticles. Biotechnol Prog, 2005. 21(2): p. 532-7.
155. Luo, D. and W.M. Saltzman, Nonviral gene delivery: thinking of silica. Gene Ther, 2006. 13(7): p. 585-6.
156. Yang, F., et al., Human transferrin: cDNA characterization and chromosomal localization. Proc Natl Acad Sci U S A, 1984. 81(9): p. 2752-6.
111
157. Cotten, M., E. Wagner, and M.L. Birnstiel, Receptor-mediated transport of DNA into eukaryotic cells. Methods Enzymol, 1993. 217: p. 618-44.
158. Tros de Ilarduya, C. and N. Duzgunes, Efficient gene transfer by transferrin lipoplexes in the presence of serum. Biochim Biophys Acta, 2000. 1463(2): p. 333-42.
159. Cardoso, A.L., et al., Tf-lipoplexes for neuronal siRNA delivery: A promising system to mediate gene silencing in the CNS. J Control Release, 2008.
160. Dersch, P. and R.R. Isberg, A region of the Yersinia pseudotuberculosis invasin protein enhances integrin-mediated uptake into mammalian cells and promotes self-association. EMBO J, 1999. 18(5): p. 1199-213.
161. Isberg, R.R., Mammalian cell adhesion functions and cellular penetration of enteropathogenic Yersinia species. Mol Microbiol, 1989. 3(10): p. 1449-53.
162. Marra, A. and R.R. Isberg, Invasin-dependent and invasin-independent pathways for translocation of Yersinia pseudotuberculosis across the Peyer's patch intestinal epithelium. Infect Immun, 1997. 65(8): p. 3412-21.
163. Isberg, R.R. and J.M. Leong, Multiple beta 1 chain integrins are receptors for invasin, a protein that promotes bacterial penetration into mammalian cells. Cell, 1990. 60(5): p. 861-71.
164. Leong, J.M., R.S. Fournier, and R.R. Isberg, Identification of the integrin binding domain of the Yersinia pseudotuberculosis invasin protein. EMBO J, 1990. 9(6): p. 1979-89.
165. Leong, J.M., et al., An aspartate residue of the Yersinia pseudotuberculosis invasin protein that is critical for integrin binding. EMBO J, 1995. 14(3): p. 422-31.
166. Luo, D. and W.M. Saltzman, Synthetic DNA delivery systems. Nat Biotechnol, 2000. 18(1): p. 33-7.
167. van Weert, A.W., et al., Transport from late endosomes to lysosomes, but not sorting of integral membrane proteins in endosomes, depends on the vacuolar proton pump. J Cell Biol, 1995. 130(4): p. 821-34.
168. Hogset, A., et al., Photochemical transfection: a technology for efficient light-directed gene delivery. Somat Cell Mol Genet, 2002. 27(1-6): p. 97-113.
169. Prasmickaite, L., et al., Role of endosomes in gene transfection mediated by photochemical internalisation (PCI). J Gene Med, 2000. 2(6): p. 477-88.
170. Berg, K., et al., Photochemical internalization: a novel technology for delivery of macromolecules into cytosol. Cancer Res, 1999. 59(6): p. 1180-3.
171. Hogset, A., et al., Photochemical transfection: a new technology for light-induced, site-directed gene delivery. Hum Gene Ther, 2000. 11(6): p. 869-80.
172. de Bruin, K.G., et al., Dynamics of photoinduced endosomal release of polyplexes. J Control Release, 2008. 130(2): p. 175-82.
173. Lee, H., J.H. Jeong, and T.G. Park, A new gene delivery formulation of polyethylenimine/DNA complexes coated with PEG conjugated fusogenic peptide. J Control Release, 2001. 76(1-2): p. 183-92.
174. Wagner, E., Application of membrane-active peptides for nonviral gene delivery. Adv Drug Deliv Rev, 1999. 38(3): p. 279-289.
175. Subbarao, N.K., et al., pH-dependent bilayer destabilization by an amphipathic peptide. Biochemistry, 1987. 26(11): p. 2964-72.
176. Parente, R.A., S. Nir, and F.C. Szoka, Jr., pH-dependent fusion of phosphatidylcholine small vesicles. Induction by a synthetic amphipathic peptide. J Biol Chem, 1988. 263(10): p. 4724-30.
112
177. Nicol, F., S. Nir, and F.C. Szoka, Jr., Orientation of the pore-forming peptide GALA in POPC vesicles determined by a BODIPY-avidin/biotin binding assay. Biophys J, 1999. 76(4): p. 2121-41.
178. Fattal, E., et al., Pore-forming peptides induce rapid phospholipid flip-flop in membranes. Biochemistry, 1994. 33(21): p. 6721-31.
179. Smith, R., et al., Structure and orientation of the pore-forming peptide, melittin, in lipid bilayers. J Mol Biol, 1994. 241(3): p. 456-66.
180. Habermann, E., Bee and wasp venoms. Science, 1972. 177(46): p. 314-22. 181. Lee, M.T., et al., Mechanism and kinetics of pore formation in membranes by water-
soluble amphipathic peptides. Proc Natl Acad Sci U S A, 2008. 105(13): p. 5087-92. 182. Tosteson, M.T. and D.C. Tosteson, The sting. Melittin forms channels in lipid
bilayers. Biophys J, 1981. 36(1): p. 109-16. 183. Terra, R.M., J.A. Guimaraes, and H. Verli, Structural and functional behavior of
biologically active monomeric melittin. J Mol Graph Model, 2007. 25(6): p. 767-72. 184. Dawson, C.R., et al., The interaction of bee melittin with lipid bilayer membranes.
Biochim Biophys Acta, 1978. 510(1): p. 75-86. 185. Terwilliger, T.C. and D. Eisenberg, The structure of melittin. I. Structure
determination and partial refinement. J Biol Chem, 1982. 257(11): p. 6010-5. 186. Drake, A.F. and R.C. Hider, The structure of melittin in lipid bilayer membranes.
Biochim Biophys Acta, 1979. 555(2): p. 371-3. 187. Vogel, H. and F. Jahnig, The structure of melittin in membranes. Biophys J, 1986.
50(4): p. 573-82. 188. Klocek, G., et al., Thermodynamics of Melittin Binding to Lipid Bilayers.
Aggregation/Pore Formation. Biochemistry, 2009. 189. Legendre, J.Y., et al., Dioleoylmelittin as a novel serum-insensitive reagent for
efficient transfection of mammalian cells. Bioconjug Chem, 1997. 8(1): p. 57-63. 190. Ogris, M., et al., Melittin enables efficient vesicular escape and enhanced nuclear
access of nonviral gene delivery vectors. J Biol Chem, 2001. 276(50): p. 47550-5. 191. Bettinger, T., et al., Peptide-mediated RNA delivery: a novel approach for enhanced
transfection of primary and post-mitotic cells. Nucleic Acids Res, 2001. 29(18): p. 3882-91.
192. Meyer, M., et al., A dimethylmaleic acid-melittin-polylysine conjugate with reduced toxicity, pH-triggered endosomolytic activity and enhanced gene transfer potential. J Gene Med, 2007. 9(9): p. 797-805.
193. Li, B., et al., Growth arrest and apoptosis of the human hepatocellular carcinoma cell line BEL-7402 induced by melittin. Onkologie, 2006. 29(8-9): p. 367-71.
194. Chen, C.P., et al., Gene transfer with poly-melittin peptides. Bioconjug Chem, 2006. 17(4): p. 1057-62.
195. Portnoy, D.A., V. Auerbuch, and I.J. Glomski, The cell biology of Listeria monocytogenes infection: the intersection of bacterial pathogenesis and cell-mediated immunity. J Cell Biol, 2002. 158(3): p. 409-14.
196. Portnoy, D.A. and S. Jones, The cell biology of Listeria monocytogenes infection (escape from a vacuole). Ann N Y Acad Sci, 1994. 730: p. 15-25.
197. Portnoy, D.A., P.S. Jacks, and D.J. Hinrichs, Role of hemolysin for the intracellular growth of Listeria monocytogenes. J Exp Med, 1988. 167(4): p. 1459-71.
113
198. Mengaud, J., et al., Expression in Escherichia coli and sequence analysis of the listeriolysin O determinant of Listeria monocytogenes. Infect Immun, 1988. 56(4): p. 766-72.
199. Gaillard, J.L., P. Berche, and P. Sansonetti, Transposon mutagenesis as a tool to study the role of hemolysin in the virulence of Listeria monocytogenes. Infect Immun, 1986. 52(1): p. 50-5.
200. Cossart, P., et al., Listeriolysin O is essential for virulence of Listeria monocytogenes: direct evidence obtained by gene complementation. Infect Immun, 1989. 57(11): p. 3629-36.
201. Portnoy, D.A., et al., Capacity of listeriolysin O, streptolysin O, and perfringolysin O to mediate growth of Bacillus subtilis within mammalian cells. Infect Immun, 1992. 60(7): p. 2710-7.
202. Beauregard, K.E., et al., pH-dependent perforation of macrophage phagosomes by listeriolysin O from Listeria monocytogenes. J Exp Med, 1997. 186(7): p. 1159-63.
203. Schuerch, D.W., E.M. Wilson-Kubalek, and R.K. Tweten, Molecular basis of listeriolysin O pH dependence. Proc Natl Acad Sci U S A, 2005. 102(35): p. 12537-42.
204. Glomski, I.J., et al., The Listeria monocytogenes hemolysin has an acidic pH optimum to compartmentalize activity and prevent damage to infected host cells. J Cell Biol, 2002. 156(6): p. 1029-38.
205. Lee, K.D., et al., Delivery of macromolecules into cytosol using liposomes containing hemolysin from Listeria monocytogenes. J Biol Chem, 1996. 271(13): p. 7249-52.
206. Provoda, C.J., E.M. Stier, and K.D. Lee, Tumor cell killing enabled by listeriolysin O-liposome-mediated delivery of the protein toxin gelonin. J Biol Chem, 2003. 278(37): p. 35102-8.
207. Higgins, D.E., N. Shastri, and D.A. Portnoy, Delivery of protein to the cytosol of macrophages using Escherichia coli K-12. Mol Microbiol, 1999. 31(6): p. 1631-41.
208. Sidorenko, Y. and U. Reichl, Structured model of influenza virus replication in MDCK cells. Biotechnol Bioeng, 2004. 88(1): p. 1-14.
209. Chu, V.C. and G.R. Whittaker, Influenza virus entry and infection require host cell N-linked glycoprotein. Proc Natl Acad Sci U S A, 2004. 101(52): p. 18153-8.
210. Plank, C., et al., Gene transfer into hepatocytes using asialoglycoprotein receptor mediated endocytosis of DNA complexed with an artificial tetra-antennary galactose ligand. Bioconjug Chem, 1992. 3(6): p. 533-9.
211. Martin, K. and A. Helenius, Transport of incoming influenza virus nucleocapsids into the nucleus. J Virol, 1991. 65(1): p. 232-44.
212. Moscona, A., Neuraminidase inhibitors for influenza. N Engl J Med, 2005. 353(13): p. 1363-73.
213. Murata, M., et al., pH-dependent membrane fusion and vesiculation of phospholipid large unilamellar vesicles induced by amphiphilic anionic and cationic peptides. Biochemistry, 1992. 31(7): p. 1986-92.
214. Lear, J.D. and W.F. DeGrado, Membrane binding and conformational properties of peptides representing the NH2 terminus of influenza HA-2. J Biol Chem, 1987. 262(14): p. 6500-5.
215. Plank, C., et al., The influence of endosome-disruptive peptides on gene transfer using synthetic virus-like gene transfer systems. J Biol Chem, 1994. 269(17): p. 12918-24.
114
216. Wolfert, M.A. and L.W. Seymour, Chloroquine and amphipathic peptide helices show synergistic transfection in vitro. Gene Ther, 1998. 5(3): p. 409-14.
217. Werner, G., et al., Metabolic products of microorganisms. 224. Bafilomycins, a new group of macrolide antibiotics. Production, isolation, chemical structure and biological activity. J Antibiot (Tokyo), 1984. 37(2): p. 110-7.
218. Wilke, M., et al., Efficacy of a peptide-based gene delivery system depends on mitotic activity. Gene Ther, 1996. 3(12): p. 1133-42.
219. Fasbender, A., et al., A low rate of cell proliferation and reduced DNA uptake limit cationic lipid-mediated gene transfer to primary cultures of ciliated human airway epithelia. Gene Ther, 1997. 4(11): p. 1173-80.
220. Escriou, V., et al., Critical assessment of the nuclear import of plasmid during cationic lipid-mediated gene transfer. J Gene Med, 2001. 3(2): p. 179-87.
221. Whittaker, G.R., M. Kann, and A. Helenius, Viral entry into the nucleus. Annu Rev Cell Dev Biol, 2000. 16: p. 627-51.
222. Kasamatsu, H. and A. Nakanishi, How do animal DNA viruses get to the nucleus? Annu Rev Microbiol, 1998. 52: p. 627-86.
223. Lechardeur, D., et al., Metabolic instability of plasmid DNA in the cytosol: a potential barrier to gene transfer. Gene Ther, 1999. 6(4): p. 482-97.
224. Yamaizumi, M., A.L. Horwich, and F.H. Ruddle, Expression and stabilization of microinjected plasmids containing the herpes simplex virus thymidine kinase gene and polyoma virus DNA in mouse cells. Mol Cell Biol, 1983. 3(4): p. 511-22.
225. Labat-Moleur, F., et al., An electron microscopy study into the mechanism of gene transfer with lipopolyamines. Gene Ther, 1996. 3(11): p. 1010-7.
226. Cartier, R. and R. Reszka, Utilization of synthetic peptides containing nuclear localization signals for nonviral gene transfer systems. Gene Ther, 2002. 9(3): p. 157-67.
227. Kreiss, P., et al., Plasmid DNA size does not affect the physicochemical properties of lipoplexes but modulates gene transfer efficiency. Nucleic Acids Res, 1999. 27(19): p. 3792-8.
228. Ludtke, J.J., et al., A nuclear localization signal can enhance both the nuclear transport and expression of 1 kb DNA. J Cell Sci, 1999. 112 ( Pt 12): p. 2033-41.
229. Hinshaw, J.E., B.O. Carragher, and R.A. Milligan, Architecture and design of the nuclear pore complex. Cell, 1992. 69(7): p. 1133-41.
230. Rout, M.P., et al., The yeast nuclear pore complex: composition, architecture, and transport mechanism. J Cell Biol, 2000. 148(4): p. 635-51.
231. Cronshaw, J.M., et al., Proteomic analysis of the mammalian nuclear pore complex. J Cell Biol, 2002. 158(5): p. 915-27.
232. Feldherr, C.M. and D. Akin, Signal-mediated nuclear transport in proliferating and growth-arrested BALB/c 3T3 cells. J Cell Biol, 1991. 115(4): p. 933-9.
233. Talcott, B. and M.S. Moore, Getting across the nuclear pore complex. Trends Cell Biol, 1999. 9(8): p. 312-8.
234. Stoffler, D., et al., Getting across the nuclear pore complex: new insights into nucleocytoplasmic transport. Can J Physiol Pharmacol, 2006. 84(3-4): p. 499-507.
235. Bottger, M., et al., Acid nuclear extracts as mediators of gene transfer and expression. Biochim Biophys Acta, 1998. 1395(1): p. 78-87.
236. Ben-Efraim, I. and L. Gerace, Gradient of increasing affinity of importin beta for nucleoporins along the pathway of nuclear import. J Cell Biol, 2001. 152(2): p. 411-7.
115
237. Allen, T.D., et al., The nuclear pore complex: mediator of translocation between nucleus and cytoplasm. J Cell Sci, 2000. 113 ( Pt 10): p. 1651-9.
238. Gorlich, D. and U. Kutay, Transport between the cell nucleus and the cytoplasm. Annu Rev Cell Dev Biol, 1999. 15: p. 607-60.
239. Nakielny, S. and G. Dreyfuss, Transport of proteins and RNAs in and out of the nucleus. Cell, 1999. 99(7): p. 677-90.
240. Radu, A., G. Blobel, and M.S. Moore, Identification of a protein complex that is required for nuclear protein import and mediates docking of import substrate to distinct nucleoporins. Proc Natl Acad Sci U S A, 1995. 92(5): p. 1769-73.
241. Gorlich, D., et al., Two different subunits of importin cooperate to recognize nuclear localization signals and bind them to the nuclear envelope. Curr Biol, 1995. 5(4): p. 383-92.
242. Gorlich, D., et al., A 41 amino acid motif in importin-alpha confers binding to importin-beta and hence transit into the nucleus. EMBO J, 1996. 15(8): p. 1810-7.
243. Kobe, B., Autoinhibition by an internal nuclear localization signal revealed by the crystal structure of mammalian importin alpha. Nat Struct Biol, 1999. 6(4): p. 388-97.
244. Hubner, S., C.Y. Xiao, and D.A. Jans, The protein kinase CK2 site (Ser111/112) enhances recognition of the simian virus 40 large T-antigen nuclear localization sequence by importin. J Biol Chem, 1997. 272(27): p. 17191-5.
245. Yamada, M. and H. Kasamatsu, Role of nuclear pore complex in simian virus 40 nuclear targeting. J Virol, 1993. 67(1): p. 119-30.
246. Clever, J., M. Yamada, and H. Kasamatsu, Import of simian virus 40 virions through nuclear pore complexes. Proc Natl Acad Sci U S A, 1991. 88(16): p. 7333-7.
247. Moroianu, J., G. Blobel, and A. Radu, Previously identified protein of uncertain function is karyopherin alpha and together with karyopherin beta docks import substrate at nuclear pore complexes. Proc Natl Acad Sci U S A, 1995. 92(6): p. 2008-11.
248. Rexach, M. and G. Blobel, Protein import into nuclei: association and dissociation reactions involving transport substrate, transport factors, and nucleoporins. Cell, 1995. 83(5): p. 683-92.
249. Weis, K., C. Dingwall, and A.I. Lamond, Characterization of the nuclear protein import mechanism using Ran mutants with altered nucleotide binding specificities. EMBO J, 1996. 15(24): p. 7120-8.
250. Gorlich, D., et al., Identification of different roles for RanGDP and RanGTP in nuclear protein import. EMBO J, 1996. 15(20): p. 5584-94.
251. Adam, E.J. and S.A. Adam, Identification of cytosolic factors required for nuclear location sequence-mediated binding to the nuclear envelope. J Cell Biol, 1994. 125(3): p. 547-55.
252. Fried, H. and U. Kutay, Nucleocytoplasmic transport: taking an inventory. Cell Mol Life Sci, 2003. 60(8): p. 1659-88.
253. Nakanishi, M., et al., Nuclear targeting of DNA. Eur J Pharm Sci, 2001. 13(1): p. 17-24.
254. Adam, S.A. and L. Gerace, Cytosolic proteins that specifically bind nuclear location signals are receptors for nuclear import. Cell, 1991. 66(5): p. 837-47.
255. Dworetzky, S.I., R.E. Lanford, and C.M. Feldherr, The effects of variations in the number and sequence of targeting signals on nuclear uptake. J Cell Biol, 1988. 107(4): p. 1279-87.
116
256. Feldherr, C.M. and D. Akin, The permeability of the nuclear envelope in dividing and nondividing cell cultures. J Cell Biol, 1990. 111(1): p. 1-8.
257. Collas, P. and P. Alestrom, Nuclear localization signals: a driving force for nuclear transport of plasmid DNA in zebrafish. Biochem Cell Biol, 1997. 75(5): p. 633-40.
258. Collas, P., H. Husebye, and P. Alestrom, The nuclear localization sequence of the SV40 T antigen promotes transgene uptake and expression in zebrafish embryo nuclei. Transgenic Res, 1996. 5(6): p. 451-8.
259. Yoneda, Y., et al., Synthetic peptides containing a region of SV 40 large T-antigen involved in nuclear localization direct the transport of proteins into the nucleus. Exp Cell Res, 1987. 170(2): p. 439-52.
260. Yoneda, Y., et al., A long synthetic peptide containing a nuclear localization signal and its flanking sequences of SV40 T-antigen directs the transport of IgM into the nucleus efficiently. Exp Cell Res, 1992. 201(2): p. 313-20.
261. Kalderon, D., et al., A short amino acid sequence able to specify nuclear location. Cell, 1984. 39(3 Pt 2): p. 499-509.
262. Lanford, R.E. and J.S. Butel, Construction and characterization of an SV40 mutant defective in nuclear transport of T antigen. Cell, 1984. 37(3): p. 801-13.
263. Feldherr, C.M., E. Kallenbach, and N. Schultz, Movement of a karyophilic protein through the nuclear pores of oocytes. J Cell Biol, 1984. 99(6): p. 2216-22.
264. Dingwall, C., et al., The nucleoplasmin nuclear location sequence is larger and more complex than that of SV-40 large T antigen. J Cell Biol, 1988. 107(3): p. 841-9.
265. Dingwall, C., S.V. Sharnick, and R.A. Laskey, A polypeptide domain that specifies migration of nucleoplasmin into the nucleus. Cell, 1982. 30(2): p. 449-58.
266. Robbins, J., et al., Two interdependent basic domains in nucleoplasmin nuclear targeting sequence: identification of a class of bipartite nuclear targeting sequence. Cell, 1991. 64(3): p. 615-23.
267. Siomi, H. and G. Dreyfuss, A nuclear localization domain in the hnRNP A1 protein. J Cell Biol, 1995. 129(3): p. 551-60.
268. Pollard, V.W., et al., A novel receptor-mediated nuclear protein import pathway. Cell, 1996. 86(6): p. 985-94.
269. Nakielny, S., et al., Transportin: nuclear transport receptor of a novel nuclear protein import pathway. Exp Cell Res, 1996. 229(2): p. 261-6.
270. Fridell, R.A., et al., Nuclear import of hnRNP A1 is mediated by a novel cellular cofactor related to karyopherin-beta. J Cell Sci, 1997. 110 ( Pt 11): p. 1325-31.
271. Subramanian, A., P. Ranganathan, and S.L. Diamond, Nuclear targeting peptide scaffolds for lipofection of nondividing mammalian cells. Nat Biotechnol, 1999. 17(9): p. 873-7.
272. Bogerd, H.P., et al., Definition of a consensus transportin-specific nucleocytoplasmic transport signal. J Biol Chem, 1999. 274(14): p. 9771-7.
273. Hall, M.N., L. Hereford, and I. Herskowitz, Targeting of E. coli beta-galactosidase to the nucleus in yeast. Cell, 1984. 36(4): p. 1057-65.
274. Jenkins, Y., et al., Characterization of HIV-1 vpr nuclear import: analysis of signals and pathways. J Cell Biol, 1998. 143(4): p. 875-85.
275. Hong, J.S. and J.A. Engler, The amino terminus of the adenovirus fiber protein encodes the nuclear localization signal. Virology, 1991. 185(2): p. 758-67.
276. Jakel, S., et al., The importin beta/importin 7 heterodimer is a functional nuclear import receptor for histone H1. EMBO J, 1999. 18(9): p. 2411-23.
117
277. Fritz, J.D., et al., Gene transfer into mammalian cells using histone-condensed plasmid DNA. Hum Gene Ther, 1996. 7(12): p. 1395-404.
278. Langer, T., Nuclear transport of histone 2b in mammalian cells is signal- and energy-dependent and different from the importin alpha/beta-mediated process. Histochem Cell Biol, 2000. 113(6): p. 455-65.
279. Johnson-Saliba, M., et al., Distinct importin recognition properties of histones and chromatin assembly factors. FEBS Lett, 2000. 467(2-3): p. 169-74.
280. Moreland, R.B., et al., Amino acid sequences that determine the nuclear localization of yeast histone 2B. Mol Cell Biol, 1987. 7(11): p. 4048-57.
281. Marchetti, M.A., et al., Import of proteins into the trypanosome nucleus and their distribution at karyokinesis. J Cell Sci, 2000. 113 ( Pt 5): p. 899-906.
282. Kataoka, N., J.L. Bachorik, and G. Dreyfuss, Transportin-SR, a nuclear import receptor for SR proteins. J Cell Biol, 1999. 145(6): p. 1145-52.
283. Lai, M.C., R.I. Lin, and W.Y. Tarn, Transportin-SR2 mediates nuclear import of phosphorylated SR proteins. Proc Natl Acad Sci U S A, 2001. 98(18): p. 10154-9.
284. Armon-Omer, A., A. Graessmann, and A. Loyter, A synthetic peptide bearing the HIV-1 integrase 161-173 amino acid residues mediates active nuclear import and binding to importin alpha: characterization of a functional nuclear localization signal. J Mol Biol, 2004. 336(5): p. 1117-28.
285. Clever, J. and H. Kasamatsu, Simian virus 40 Vp2/3 small structural proteins harbor their own nuclear transport signal. Virology, 1991. 181(1): p. 78-90.
286. Schmolke, S., et al., Nuclear targeting of the tegument protein pp65 (UL83) of human cytomegalovirus: an unusual bipartite nuclear localization signal functions with other portions of the protein to mediate its efficient nuclear transport. J Virol, 1995. 69(2): p. 1071-8.
287. Xia, Y.P., et al., Characterization of nuclear targeting signal of hepatitis delta antigen: nuclear transport as a protein complex. J Virol, 1992. 66(2): p. 914-21.
288. Wychowski, C., D. Benichou, and M. Girard, A domain of SV40 capsid polypeptide VP1 that specifies migration into the cell nucleus. EMBO J, 1986. 5(10): p. 2569-76.
289. Jakel, S. and D. Gorlich, Importin beta, transportin, RanBP5 and RanBP7 mediate nuclear import of ribosomal proteins in mammalian cells. EMBO J, 1998. 17(15): p. 4491-502.
290. Mosammaparast, N., et al., Nuclear import of histone H2A and H2B is mediated by a network of karyopherins. J Cell Biol, 2001. 153(2): p. 251-62.
291. Weis, K., I.W. Mattaj, and A.I. Lamond, Identification of hSRP1 alpha as a functional receptor for nuclear localization sequences. Science, 1995. 268(5213): p. 1049-53.
292. Maertens, G., et al., Identification and characterization of a functional nuclear localization signal in the HIV-1 integrase interactor LEDGF/p75. J Biol Chem, 2004. 279(32): p. 33421-9.
293. Lusk, C.P., G. Blobel, and M.C. King, Highway to the inner nuclear membrane: rules for the road. Nat Rev Mol Cell Biol, 2007. 8(5): p. 414-20.
294. Brachner, A., et al., LEM2 is a novel MAN1-related inner nuclear membrane protein associated with A-type lamins. J Cell Sci, 2005. 118(Pt 24): p. 5797-810.
295. King, M.C., C.P. Lusk, and G. Blobel, Karyopherin-mediated import of integral inner nuclear membrane proteins. Nature, 2006. 442(7106): p. 1003-7.
118
296. Zargari, A., et al., Inner nuclear membrane proteins Asi1, Asi2, and Asi3 function in concert to maintain the latent properties of transcription factors Stp1 and Stp2. J Biol Chem, 2007. 282(1): p. 594-605.
297. Santos-Rosa, H., et al., The yeast lipin Smp2 couples phospholipid biosynthesis to nuclear membrane growth. EMBO J, 2005. 24(11): p. 1931-41.
298. Jaspersen, S.L., et al., The Sad1-UNC-84 homology domain in Mps3 interacts with Mps2 to connect the spindle pole body with the nuclear envelope. J Cell Biol, 2006. 174(5): p. 665-75.
299. Beilharz, T., et al., Bipartite signals mediate subcellular targeting of tail-anchored membrane proteins in Saccharomyces cerevisiae. J Biol Chem, 2003. 278(10): p. 8219-23.
300. Hebert, E., Improvement of exogenous DNA nuclear importation by nuclear localization signal-bearing vectors: a promising way for non-viral gene therapy? Biol Cell, 2003. 95(2): p. 59-68.
301. Collas, P. and P. Alestrom, Nuclear localization signal of SV40 T antigen directs import of plasmid DNA into sea urchin male pronuclei in vitro. Mol Reprod Dev, 1996. 45(4): p. 431-8.
302. Sebestyen, M.G., et al., DNA vector chemistry: the covalent attachment of signal peptides to plasmid DNA. Nat Biotechnol, 1998. 16(1): p. 80-5.
303. Ciolina, C., et al., Coupling of nuclear localization signals to plasmid DNA and specific interaction of the conjugates with importin alpha. Bioconjug Chem, 1999. 10(1): p. 49-55.
304. Zanta, M.A., P. Belguise-Valladier, and J.P. Behr, Gene delivery: a single nuclear localization signal peptide is sufficient to carry DNA to the cell nucleus. Proc Natl Acad Sci U S A, 1999. 96(1): p. 91-6.
305. Aronsohn, A.I. and J.A. Hughes, Nuclear localization signal peptides enhance cationic liposome-mediated gene therapy. J Drug Target, 1998. 5(3): p. 163-9.
306. Branden, L.J., A.J. Mohamed, and C.I. Smith, A peptide nucleic acid-nuclear localization signal fusion that mediates nuclear transport of DNA. Nat Biotechnol, 1999. 17(8): p. 784-7.
307. Young, J.L., J.N. Benoit, and D.A. Dean, Effect of a DNA nuclear targeting sequence on gene transfer and expression of plasmids in the intact vasculature. Gene Ther, 2003. 10(17): p. 1465-70.
308. Schwartz, B., et al., Synthetic DNA-compacting peptides derived from human sequence enhance cationic lipid-mediated gene transfer in vitro and in vivo. Gene Ther, 1999. 6(2): p. 282-92.
309. Neves, C., et al., Intracellular fate and nuclear targeting of plasmid DNA. Cell Biol Toxicol, 1999. 15(3): p. 193-202.
310. Tanimoto, M., et al., No enhancement of nuclear entry by direct conjugation of a nuclear localization signal peptide to linearized DNA. Bioconjug Chem, 2003. 14(6): p. 1197-202.
311. van der Aa, M.A., et al., An NLS peptide covalently linked to linear DNA does not enhance transfection efficiency of cationic polymer based gene delivery systems. J Gene Med, 2005. 7(2): p. 208-17.
312. Giammarini, C., et al., High-level expression of the Listeria monocytogenes listeriolysin O in Escherichia coli and preliminary characterization of the purified protein. Protein Expr Purif, 2003. 28(1): p. 78-85.
119
313. Churchill, R.L., H. Lee, and J.C. Hall, Rapid purification of recombinant listeriolysin O (LLO) from Escherichia coli. J Ind Microbiol Biotechnol, 2005. 32(8): p. 355-63.
314. Giammarini, C., et al., Purification and characterization of a recombinant listeriolysin O expressed in Escherichia coli and possible diagnostic applications. J Biotechnol, 2004. 109(1-2): p. 13-20.
315. Jones, S. and D.A. Portnoy, Characterization of Listeria monocytogenes pathogenesis in a strain expressing perfringolysin O in place of listeriolysin O. Infect Immun, 1994. 62(12): p. 5608-13.
316. Villanueva, M.S., A.J. Sijts, and E.G. Pamer, Listeriolysin is processed efficiently into an MHC class I-associated epitope in Listeria monocytogenes-infected cells. J Immunol, 1995. 155(11): p. 5227-33.
Table 14: Nucleotide sequence of LLO lacking its secretion signal verified by DNA sequencing. C‐terminal His‐Tag (italic), flanked restriction sites NdeI and BamHI (underlined).
122
Curriculum vitae
Name Ara Hacobian Address Wacholderweg 17a 1210, Vienna Date of Birth 05.12.1981 in Vienna Age 27
1988‐1992 Elementary School in Vienna 1992‐2000 College Preparatory High School BRG Ödenburg,
Vienna 2001 to date Studies in Molecular Biology at the University of
Vienna, Campus Vienna BioCenter
Education
2006 First Degree (equal to Bachelor) in Molecular Biology at the University of Vienna
Military service
2000‐2001 in Wiener Neustadt
Work experience
May 2007 ‐ to date Master thesis at the Ludwig Boltzmann Institute for Experimental and Clinical Traumatology (Enhancement of non‐viral cell transfection)
Department of Pediatrics, Medical University of Vienna and Department of Neurology at Vienna General Hospital (Mass spectrometrical and computational analyses of alterations in the protein expression pattern after spinal cord injury in rats)
Mai‐August 2005 Brain Research Center, Vienna (RNA uptake and transport in neuronal cells)
June‐August 2004 Biomedical Research Center, Vienna General Hospital