30
slide 1 Der Beitrag der Industrie zur Versorgungssicherheit DI Thomas Briza, Siemens CEE, Sector Energy
slide 1
Der Beitrag der Industrie zur Versorgungssicherheit
DI Thomas Briza, Siemens CEE, Sector Energy

slide 2
• ... durch Invest in neue Kraftwerke
• ... durch Stromnetz Steiermark
• ... Strategien im Umweltbundesamt
• ... wird jährlich durch E-Control überprüft
• Versorgungssicherheit auch für Milchbauern...
• Atomkraftwerke bieten keine ... sagt Oeko News
• ... durch Tauerngasleitung erhöht
• ... rund um die Uhr durch Erdgas
• ... durch Energie auch im Engpassfall durch
Gas Clearing and Settlement AGCS ...
• Versorgung mit Postdiensten
In 8 von 10 Top-Ergebnissen geht
es um Energie in Form von
Strom und Gas.
148 Mio. Treffer für „security of supply“

slide 3
Demographic dynamics
Population growth:
7.5 bn in 2020 (+1.1 bn)
Power consumption:
+5.2% p.a. in emerging
regions and 1.4% in
developed world
Megacities (>10 million):
22 new megacities in 2015
Resource scarcity
Geopolitics:
70% of world oil and gas
supplies only in a few
countries
Fuel diversity:
increase in oil prices
accelerates shift to broader
fuel mix
Environmental focus
Global emissions:
40% increase in air pollu-
tion over past 20 years
Climate change:
Global warming “should
be” limited to an average
increase of
2 degrees Celsius
Energy supply in the future will place major
challenges on the infrastructure
Three global megatrends in the energy sector

slide 4
Financial crisis
The Gap gets bigger
Shut-downs are executed
New projects are
postponed
Investments in
Renewables are reduced
The Gap gets bigger
– security of supply
– CO2 reduction
-5,0%
-4,0%
-3,0%
-2,0%
-1,0%
0,0%
1,0%
2,0%
3,0%
4,0%
2006 2007 2008 2009 2010
-5,0%
-4,0%
-3,0%
-2,0%
-1,0%
0,0%
1,0%
2,0%
3,0%
4,0%
2006 2007 2008 2009 2010
-5,0%
-4,0%
-3,0%
-2,0%
-1,0%
0,0%
1,0%
2,0%
3,0%
4,0%
2006 2007 2008 2009 2010
FC Jän. 08
FC Apr. 08
FC Aug. 08
FC Okt. 08
FC Nov. 08
FC Dez. 08
FC Jän. 09
FC Feb. 09
FC Apr. 09
FC Mai 09
FC Juli 09
-5,0%
-4,0%
-3,0%
-2,0%
-1,0%
0,0%
1,0%
2,0%
3,0%
4,0%
2006 2007 2008 2009 2010
-5,0%
-4,0%
-3,0%
-2,0%
-1,0%
0,0%
1,0%
2,0%
3,0%
4,0%
2006 2007 2008 2009 2010
-5,0%
-4,0%
-3,0%
-2,0%
-1,0%
0,0%
1,0%
2,0%
3,0%
4,0%
2006 2007 2008 2009 2010
FC Jän. 08
FC Apr. 08
FC Aug. 08
FC Okt. 08
FC Nov. 08
FC Dez. 08
FC Jän. 09
FC Feb. 09
FC Apr. 09
FC Mai 09
FC Juli 09
2008 2009 2010
GDP Forecast
slide 5
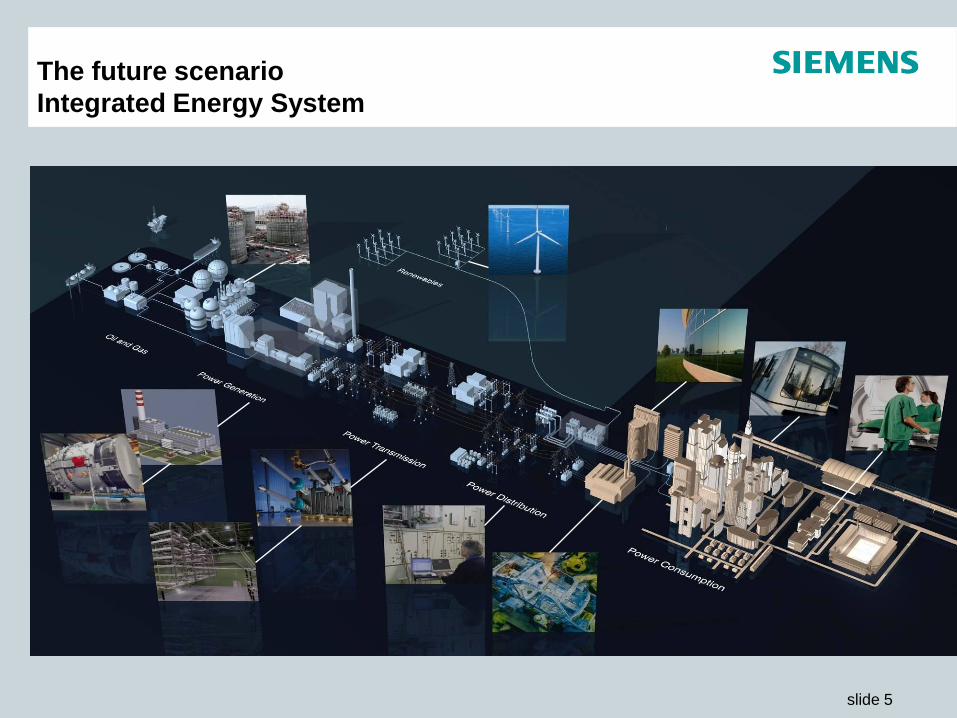
The future scenario
Integrated Energy System

slide 6
Our focus on energy saving and
environmental care
All renewables qualify
Examples:
Wind power
Grid access for wind power
Steam turbines for solar
thermal power
RenewablesEnvironmental technology
Energy efficiency
All environmental technology
qualifies
Examples:
Water technologies
Air pollution control
Products and solutions with
exceptional energy efficiency
qualify
Examples:
Combined-cycle power plants
High Voltage Direct Current
power transmission
Efficient lighting

slide 7
Worldwide first floating wind farm
Siemens and Norwegian power company
Hydro (StatoilHydro) cooperate in
developing floating wind farms
Worldwide first „floating wind farm“
in Norway in 220 m water depth
Wind turbine with 2,3 MW
(82 m rotor diameter)
Reduced visual impact and increased power production due to strong and stable wind conditions
slide 8
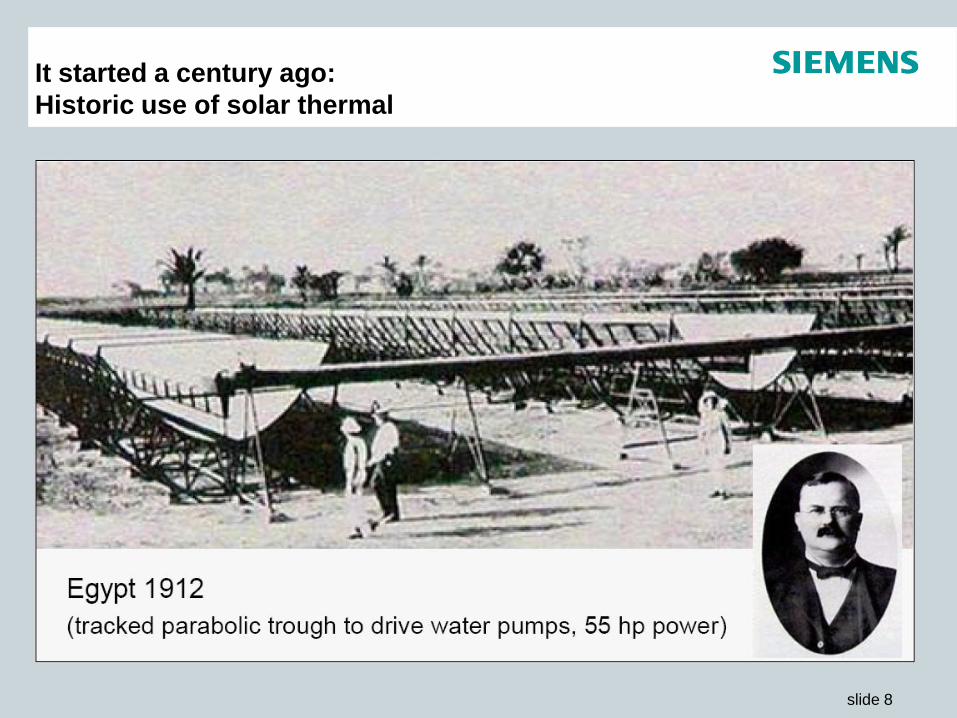
It started a century ago:
Historic use of solar thermal
slide 9
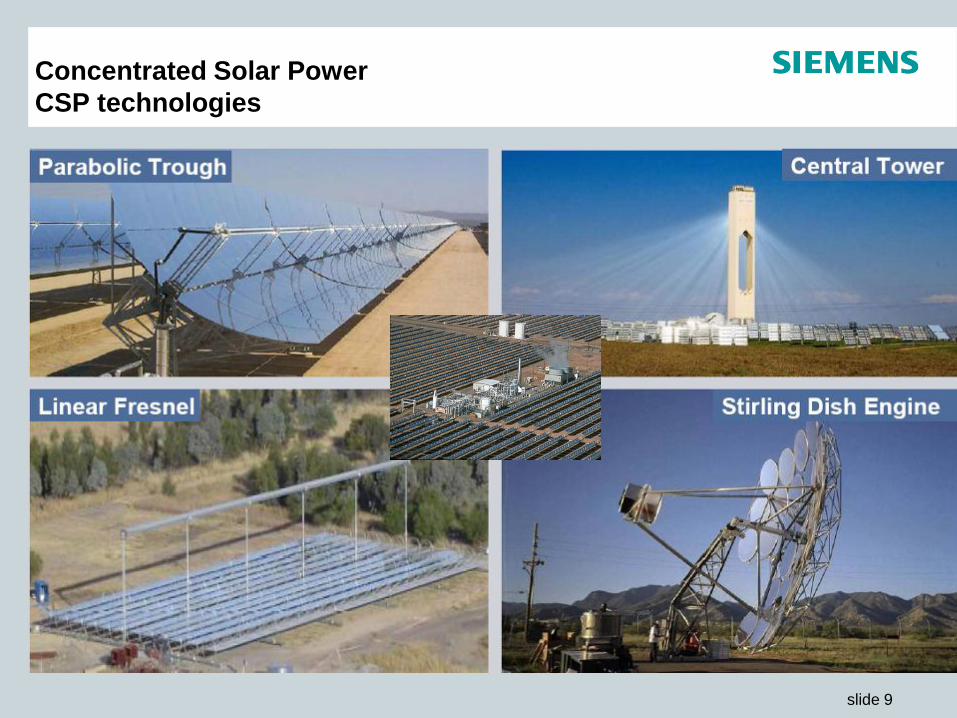
Concentrated Solar Power
CSP technologies

slide 10
Photovoltaics
in industrial dimensions
From MWatt(20MWp Benaixama)
to GWatt
to FacadesFrom Roofs

slide 11
Gas Turbine SGT5-8000H
Medium Gas, Oil
Performance 340 MW
Heat rate 39 %
Weight 444 t
CCP-Plant SCC5-8000H
Performance 530 MW
Heat Rate 60 %
SGT5-8000H
Siemens latest gas turbine -
largest in the world.
Efficiency
Most-efficient Gas Turbine

slide 12
Efficiency improvement
Advantages
• Turbine efficiency increase by 30 MW
• Reduction of CO2-emissions
up to 200.000 t/a
• Reduction of coal consumption
up to 80.000 t/a
• Saving potential
up to 7 Mio €/a
Modernization of Turbines
• New rotor with 3DS blades
• New grid blades and inner casing
• Strenghtening the control system
Mehrum – Modernization of Steam Turbine

slide 13
CO2
capture and storage
Siemens Fuel Gasifier Siemens IGCC in Puertollano (E) Siemens scrubbing
process test lab
Post-Combustion carbon capture
plant design
Pre-combustion carbon capture
Gasification technology with multi-fuel capability
for new power plants
Technology “ready for implementation”
Alternative route for chemical / fuel production,
hydrogen economy
Post-Combustion carbon capture
Scalable market introduction, demo plants with
slipstreams, minimize upgrade risk in process
trains
Enhancement potential for solvents, scrubbing
process and for integration into the power plants
Worldwide development activities with different
solvents and related processes under way
For retrofit and new coal-fired power plants
slide 14
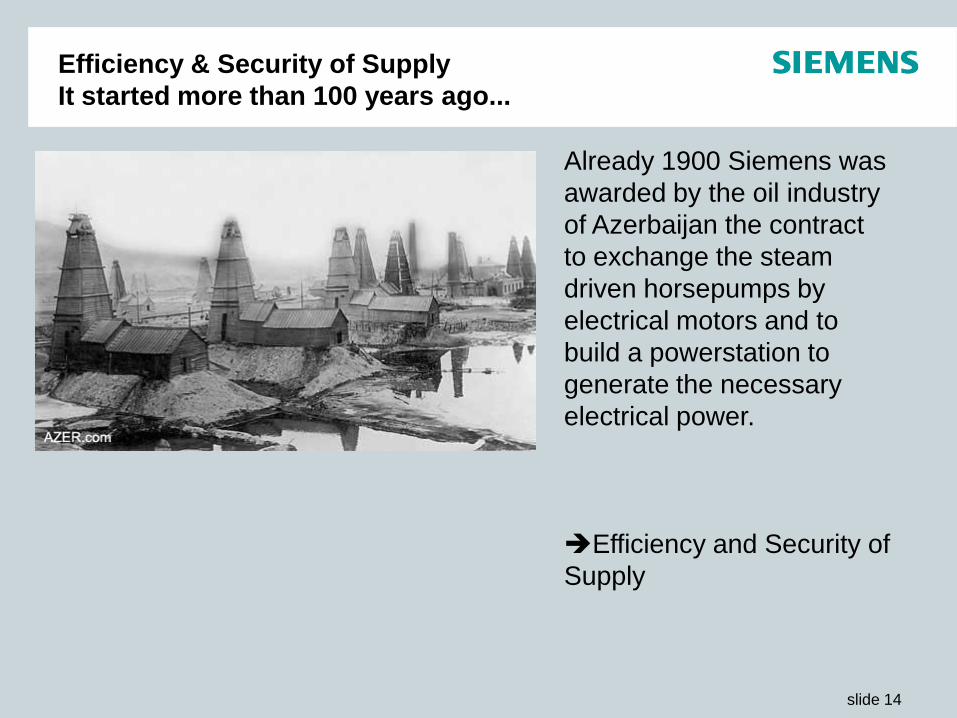
Efficiency & Security of Supply
It started more than 100 years ago...
Already 1900 Siemens was
awarded by the oil industry
of Azerbaijan the contract
to exchange the steam
driven horsepumps by
electrical motors and to
build a powerstation to
generate the necessary
electrical power.
Efficiency and Security of
Supply

slide 16
OPEX expense breakdown in Refining
Source Solomon Associates
T/A *) T/A – “turn around”- shut down time
The Energy Efficiency challenge of Refineries
Catalysts &Catalyst Additives
4%Non-Maintenance staff
Energy
59%T/A *) maintenance 7%
Chemicals
Non-T/A maintenance 7%
All Other fixed Costs 1%
8%
Other volume related costs
3% 11%
Breakdown indicates the need to focus on energy
slide 17
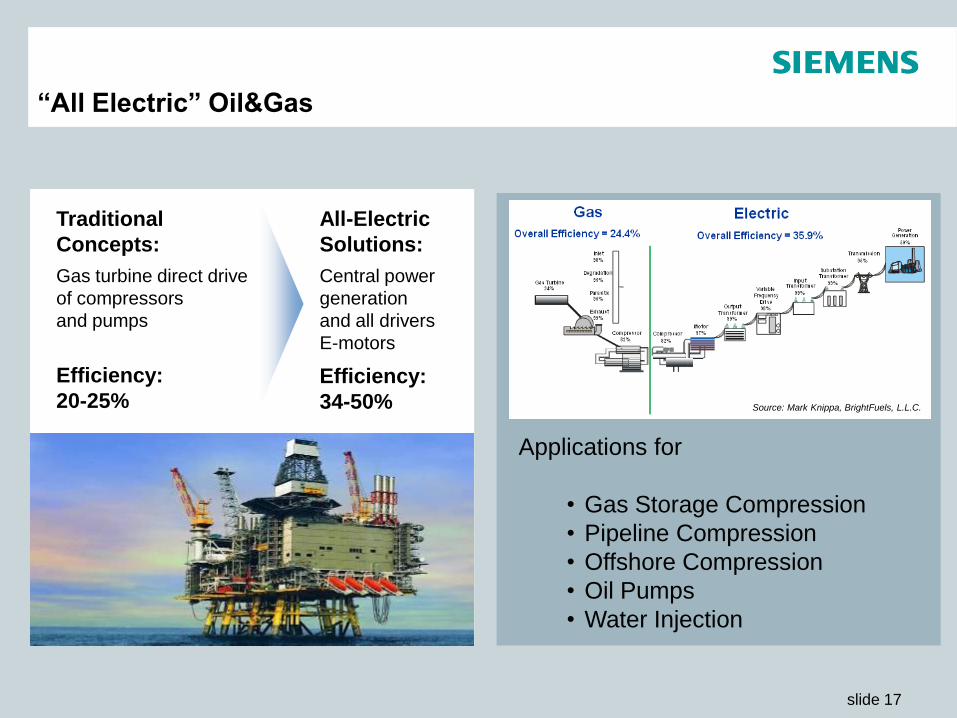
“All Electric” Oil&Gas
Traditional
Concepts:
Gas turbine direct drive
of compressors
and pumps
Efficiency:
20-25%
All-Electric
Solutions:
Central power
generation
and all drivers
E-motors
Efficiency:
34-50%
Applications for
• Gas Storage Compression
• Pipeline Compression
• Offshore Compression
• Oil Pumps
• Water Injection
Source: Mark Knippa, BrightFuels, L.L.C.

slide 18
Electrical Power versus Gas

slide 19
A Strategy shall comprise all measures that lead to energy efficiency and emission reduction
www.energie-management.info; Siemens;
1. Visualize – (show energy flows and demand, see current situation, know changes)
2. Read, understand, evaluate – (analyze processes, detect energy dissipaters)
3. Calculate – (saving potentials, consider new technologies)
4. Decide – (economical decision, decrease life cycle cost, justification of investment or measures)
5. Realize – (system integration of appropriate components and machinery to the installation)
6. Adapt with further improvements – (targets, monitoring, report, incentives, education, proceed…).
Strategy for an enhanced energy efficiency
Energy Management Systems
Development and integration of
system for collection, analysis,
documentation and visualization of
energy data as well as regulation
and controlling of energy
consumption in plants and
buildings.
Energy Services
Services for optimization along
the whole energy production value
chain, e.g. process engineering
optimization or load management,
as well as consulting and
contracting.
Reducing energy losses by using
highly efficient systems and
technologies.
Energy efficiency means reducing
energy consumption without
having to reduce the use of
energy-consuming plants and
equipment.
Energy Efficiency

slide 20
Our portfolio provides offers for core and support processes with focus on energy flow and product supply
Energy
Flow
Customer
Needs
Energy
Generation
Energy
Distribution
Usage
BuildingsProduction
New CoGen and Combined Cycle Power Plants to save fuel
Click text in matrix to receive further information
Products
and
Solutions
Software and
Systems
Solutions
Services,
Concepts and
Implementation
Extensive competences
to develop strategies for a
reliable energy supply to
safe benefits and
environment
Extensive competences to
develop customer-tailored
measures
to ensure reliable
power supply
to ensure availability
to optimize utilization
Energy Efficiency
Optimization (“Consulting”)
for single and plant-wide
drive-systems
• to evaluate saving
potentials
• to develop optimization
measures for cost saving
Energy Efficiency
Consulting and Services for
Buildings
• to reduce costs
• to improve energy
efficiency
Cost Saving through
Energy Performance
Contracting
Integrated Energy Management System for a maximum of transparency and reliability
Integrated Power Management System for energy supply protection and risk management
Energy Management Systems
for process optimization
Building Management
Systems for
• Controlling and
management of building
equipment and
to identify saving potentials
• to save energy costs
• to secure energy supply User-friendly reporting of
energy saving potential
Distribution networks
components
• to ensure efficient and
reliable power
• to every point in the
process chain
Robust emergency power to
protect the environment
Energy Efficient Motors
and Drives
• to reduce energy
consumption
Energy-saving equipment of
buildings regarding
• Power Supply
Process-aligned Chemical
Compressors and Blowers for
a minimum energy use
• Room Climate and
• LightingRotating equipment with
leading-edge technology
Optimizing Compressor
applications
Liquid natural Gas station

slide 21
Unique Portfolio allows critical combination of Technologies and Products to Systems and Solutions
Nr 1 market position
in electric drive
systems in Oil & Gas
Industry
Others:
Depletion compression
Electrical FPSO
Efficiency (CO2)
Remote / unmanned operation
High availability
Harsh environment
One-stop shop “Power to Compression & Pumping” only by Siemens
Strength
Unique-
ness
Challenges and customer requests to be addressed with cross group solutions:
Subsea
E-LNG
Toxic gases (H2S)
Value
Power
Generation
Power
Distribution
VFD-Motor
Systems
Com-
pressionAutomation
Water Treatment
Siemens
GE - partly -
ABB - - -
Strong electrical and
I&C system integration
capabililities
Nr 2 player in power
generation and
compression
Nr. 1 / 2 player in
power transmission
and distribution
Energy

slide 22
Our Proposition –Offers for products and solutions for chemical plant production
Energy Efficient Motors and Drives
Variable speed drives, including electronic energy recovery of brake energy
0,12-250 kW110-600 V
MICROMASTER
0,15-max.70MW2,3-14,4 kV
75-1500 kW380-690 V
Sinamics G150 Sinamics GM Perfect Harmony
Up to 50% energy saving and a payback period of less than 2 years
Energy saving motors with 42% less power dissipation
NS-Torquemotors HT-directNS-Transnormmotors HS-Motors H compact plus
Energy Efficient Motors
M
~~
Products
and
Solutions
Software and
Systems
Solutions
Analysis
Measure
Development
Implementation
Energy
Generation
Energy
Distribution
Usage
BuildingsProduction
Customer
Needs-
Matrix
Click text to return
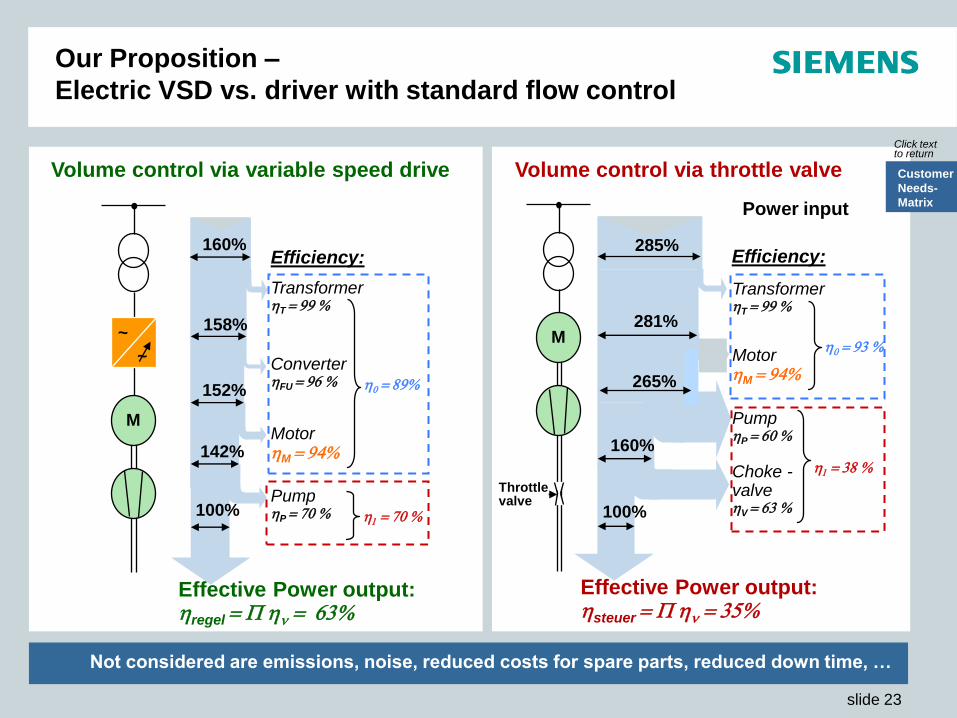
slide 23
Not considered are emissions, noise, reduced costs for spare parts, reduced down time, …
Volume control via variable speed drive
TransformerhT = 99 %
M
~
~ ConverterhFU = 96 %
PumphP = 70 %
MotorhM = 94%
Effective Power output:hregel = P hn = 63%
100%
158%
160%
152%
142%
Efficiency:
h0 = 89%
h1 = 70 %
Volume control via throttle valve
Power input
TransformerhT = 99 %
MotorhM = 94%
PumphP = 60 %
Choke -valvehV = 63 %
Effective Power output:hsteuer = P hn = 35%
Efficiency:
M
100%
160%
281%
285%
h0 = 93 %
h1 = 38 %
265%
Our Proposition –
Electric VSD vs. driver with standard flow control
Throttlevalve
Customer
Needs-
Matrix
Click text to return
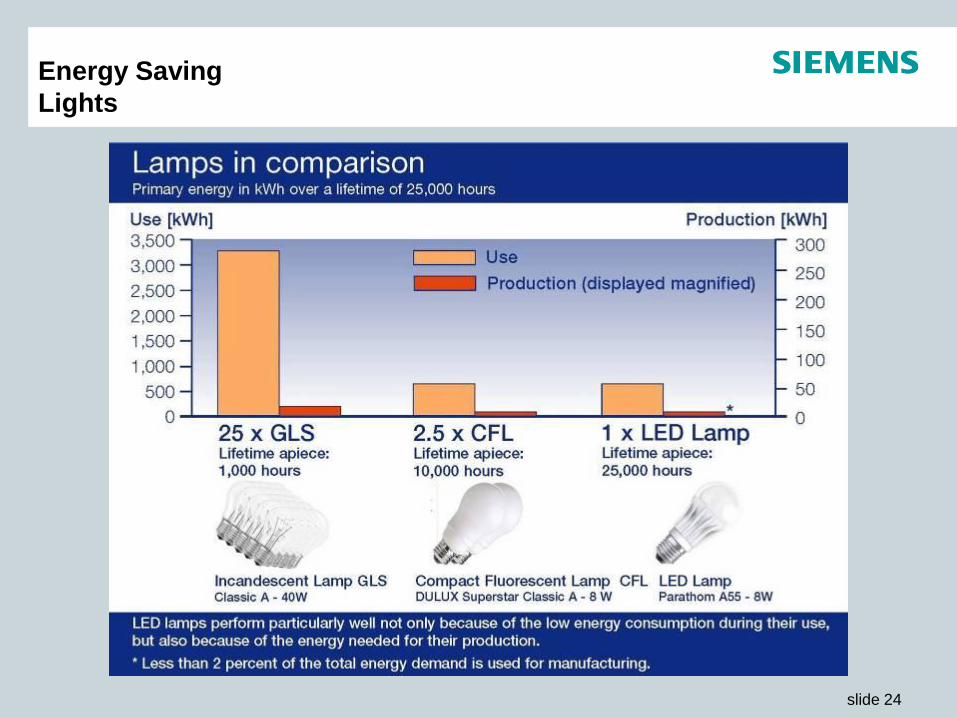
slide 24
Energy Saving
Lights

slide 25
Smart Metering
Automated Metering and Information System AMIS
Automation of metering processes
Automation of the distribution network
including transformer stations
Meters and data concentrators are
open for existing/future communication
standards
Additional services (integration of
meters of other media, home
automation)
Basis for Smart Grid concepts

slide 26
„Smart Grid“ –
Link for sustainable energy supply
Integration of wind and solar farm
Efficiency use of power plants
Specific demand side management
Reduced risk of blackouts
Energy trading
Integration of renewable energies
Demand side management
Automated grid operation
Power supply security
Smart meter as basis for
intelligent building and demand
management
Free energy trading down to the
consumer
Precondition: Consistent communication and new grid intelligence.

slide 27
E-Mobility
slide 28
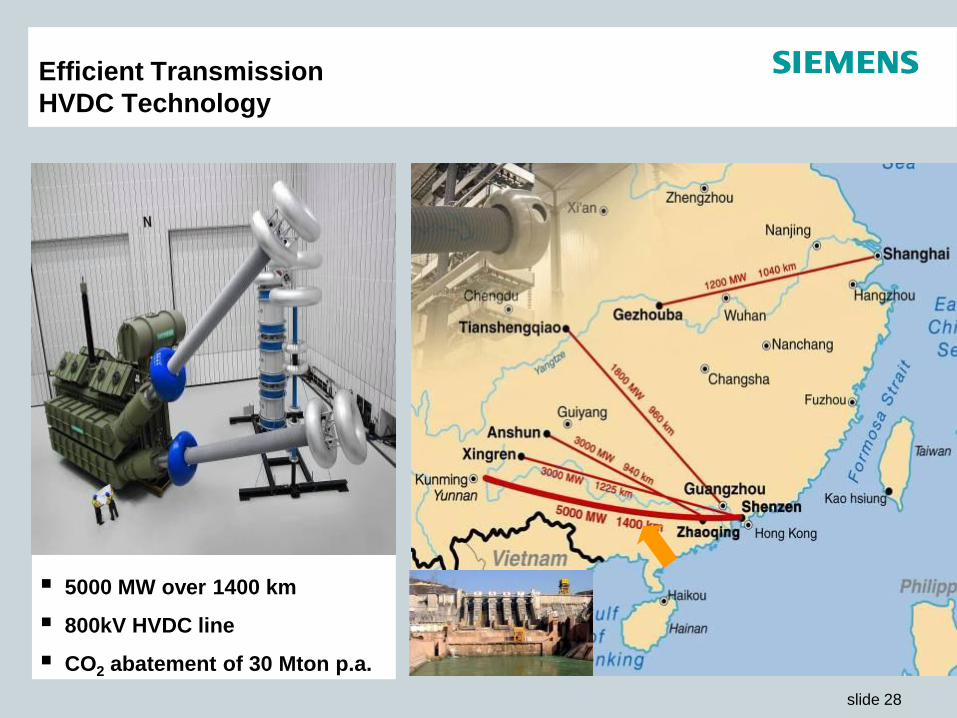
Efficient Transmission
HVDC Technology
5000 MW over 1400 km
800kV HVDC line
CO2 abatement of 30 Mton p.a.
slide 29
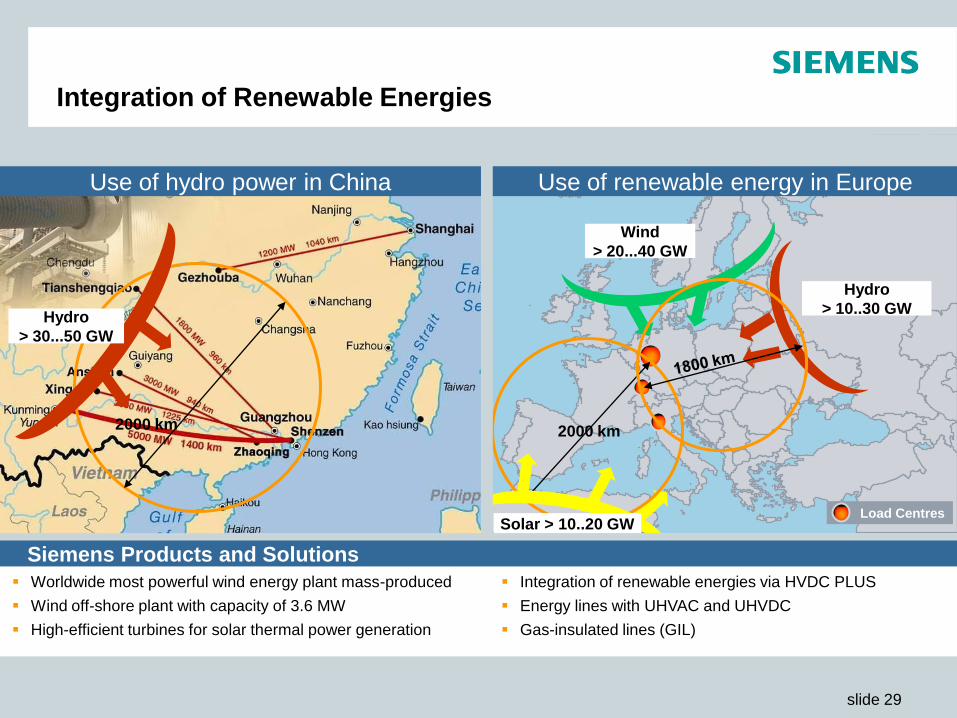
Wind
> 20...40 GW
Hydro
> 10..30 GW
2000 km
Load CentresSolar > 10..20 GW
2000 km
Hydro
> 30...50 GW
Integration of Renewable Energies
Worldwide most powerful wind energy plant mass-produced
Wind off-shore plant with capacity of 3.6 MW
High-efficient turbines for solar thermal power generation
Siemens Products and Solutions
Integration of renewable energies via HVDC PLUS
Energy lines with UHVAC and UHVDC
Gas-insulated lines (GIL)
Use of hydro power in China Use of renewable energy in Europe

slide 30
DESERTEC
A Vision of a future electricity supply system in Europe
Dipl.-Ing. Gunter Kappacher Slide 31
Thank you!


