C O V E R S H E E T SEC Registration Number 1 6 3 4 2 C O M P A N Y N A M E S M I N V E S T M E N T S C O R P O R A T I O N A N D S U B S I D I A R I E S PRINCIPAL OFFICE( No. / Street / Barangay / City / Town / Province ) 1 0 t h F l o o r , O n e E - C o m C e n t e r , H a r b o r D r i v e , M a l l o f A s i a C o m p l e x , C B P - 1 A , P a s a y C i t y 1 3 0 0 Form Type Department requiring the report Secondary License Type, If Applicable 1 7 - Q C O M P A N Y I N F O R M A T I O N Company’s Email Address Company’s Telephone Number Mobile Number – 8857-0100 – No. of Stockholders Annual Meeting (Month / Day) Fiscal Year (Month / Day) 1,260 03/31 CONTACT PERSON INFORMATION The designated contact person MUST be an Officer of the Corporation Name of Contact Person Email Address Telephone Number/s Mobile Number Mr. Franklin C. Gomez – 8857-0100 – CONTACT PERSON’s ADDRESS 10 th Floor, One E-Com Center, Harbor Drive, Mall of Asia Complex, CBP-1A, Pasay City 1300 NOTE 1 : In case of death, resignation or cessation of office of the officer designated as contact person, such incident shall be reported to the Commission within thirty (30) calendar days from the occurrence thereof with information and complete contact details of the new contact person designated. 2 : All Boxes must be properly and completely filled-up. Failure to do so shall cause the delay in updating the corporation’s records with the Commission and/or non-receipt of Notice of Deficiencies. Further, non-receipt of Notice of Deficiencies shall not excuse the corporation from liability for its deficiencies.
Transcript
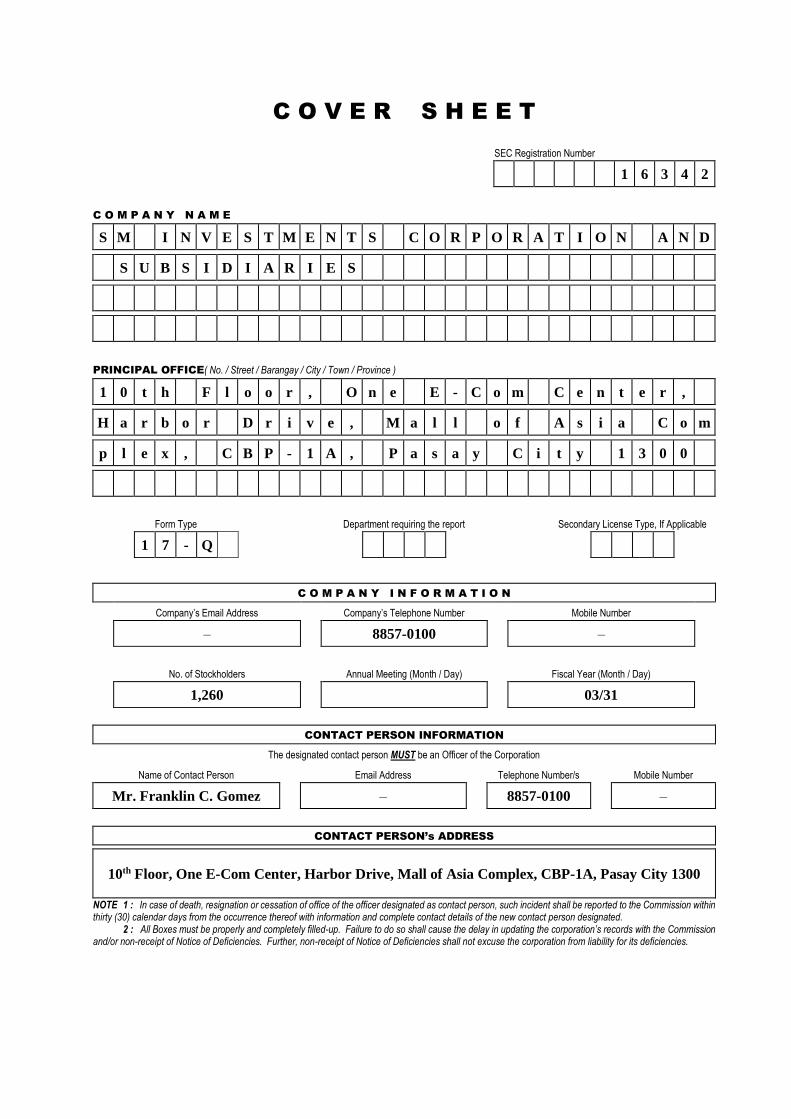
C O V E R S H E E T
SEC Registration Number
1 6 3 4 2
C O M P A N Y N A M E
S M I N V E S T M E N T S C O R P O R A T I O N A N D
S U B S I D I A R I E S
PRINCIPAL OFFICE( No. / Street / Barangay / City / Town / Province )
1 0 t h F l o o r , O n e E - C o m C e n t e r ,
H a r b o r D r i v e , M a l l o f A s i a C o m
p l e x , C B P - 1 A , P a s a y C i t y 1 3 0 0
Form Type Department requiring the report Secondary License Type, If Applicable
1 7 - Q
C O M P A N Y I N F O R M A T I O N
Company’s Email Address Company’s Telephone Number Mobile Number
– 8857-0100 –
No. of Stockholders Annual Meeting (Month / Day) Fiscal Year (Month / Day)
1,260 03/31
CONTACT PERSON INFORMATION
The designated contact person MUST be an Officer of the Corporation
Name of Contact Person Email Address Telephone Number/s Mobile Number
Mr. Franklin C. Gomez – 8857-0100 –
CONTACT PERSON’s ADDRESS
10th Floor, One E-Com Center, Harbor Drive, Mall of Asia Complex, CBP-1A, Pasay City 1300
NOTE 1 : In case of death, resignation or cessation of office of the officer designated as contact person, such incident shall be reported to the Commission within thirty (30) calendar days from the occurrence thereof with information and complete contact details of the new contact person designated. 2 : All Boxes must be properly and completely filled-up. Failure to do so shall cause the delay in updating the corporation’s records with the Commission and/or non-receipt of Notice of Deficiencies. Further, non-receipt of Notice of Deficiencies shall not excuse the corporation from liability for its deficiencies.
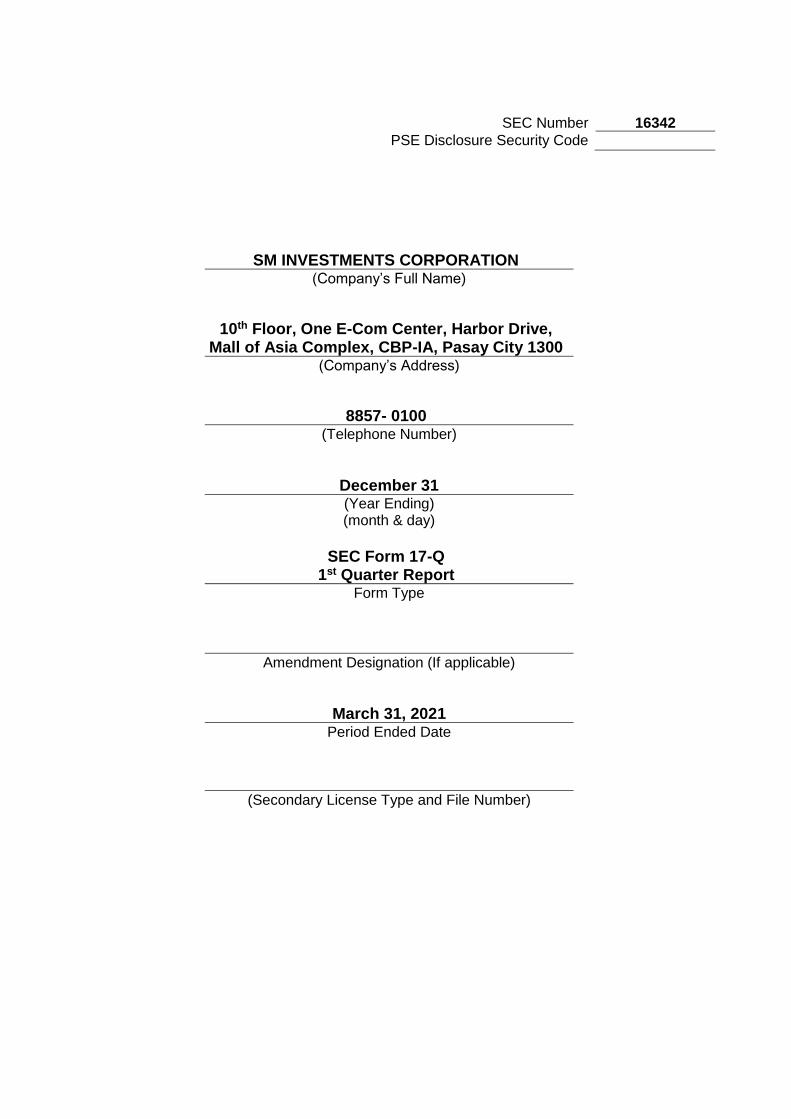
SEC Number 16342
PSE Disclosure Security Code
SM INVESTMENTS CORPORATION (Company’s Full Name)
10th Floor, One E-Com Center, Harbor Drive, Mall of Asia Complex, CBP-IA, Pasay City 1300
(Company’s Address)
8857- 0100 (Telephone Number)
December 31 (Year Ending) (month & day)
SEC Form 17-Q
1st Quarter Report Form Type
Amendment Designation (If applicable)
March 31, 2021 Period Ended Date
(Secondary License Type and File Number)
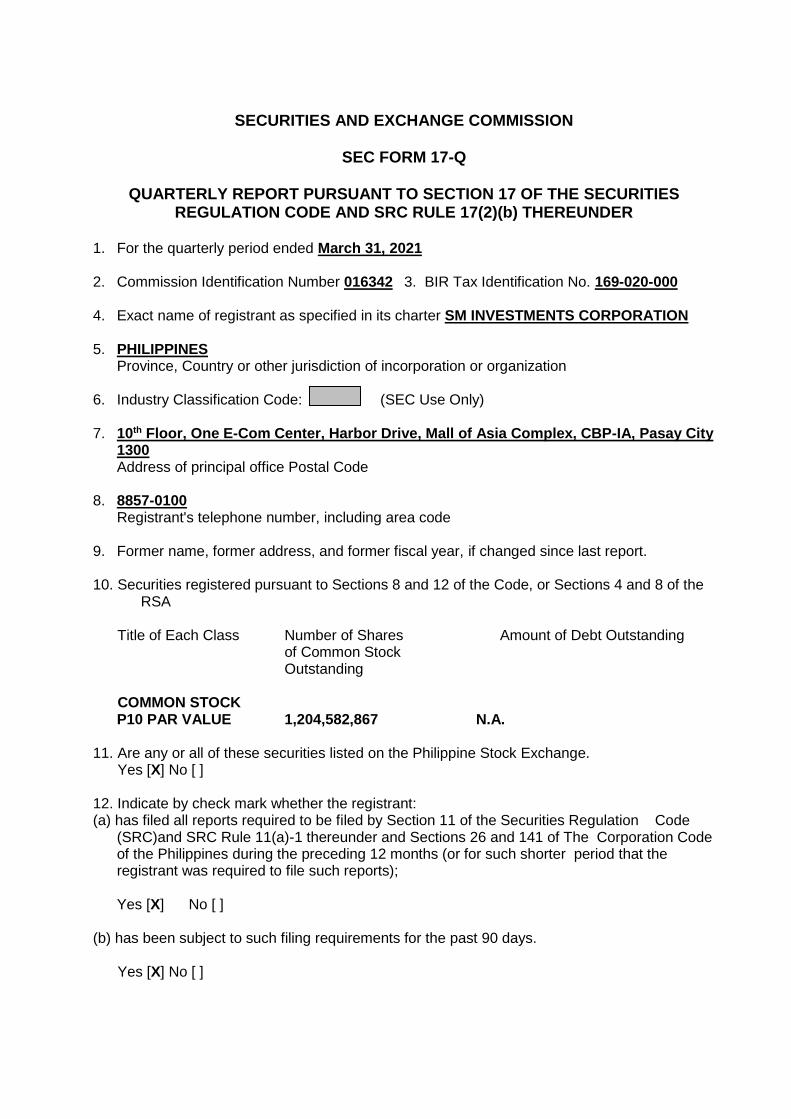
SECURITIES AND EXCHANGE COMMISSION
SEC FORM 17-Q
QUARTERLY REPORT PURSUANT TO SECTION 17 OF THE SECURITIES REGULATION CODE AND SRC RULE 17(2)(b) THEREUNDER
1. For the quarterly period ended March 31, 2021 2. Commission Identification Number 016342 3. BIR Tax Identification No. 169-020-000 4. Exact name of registrant as specified in its charter SM INVESTMENTS CORPORATION 5. PHILIPPINES Province, Country or other jurisdiction of incorporation or organization 6. Industry Classification Code: (SEC Use Only) 7. 10th Floor, One E-Com Center, Harbor Drive, Mall of Asia Complex, CBP-IA, Pasay City
1300 Address of principal office Postal Code 8. 8857-0100 Registrant's telephone number, including area code 9. Former name, former address, and former fiscal year, if changed since last report. 10. Securities registered pursuant to Sections 8 and 12 of the Code, or Sections 4 and 8 of the
RSA Title of Each Class Number of Shares Amount of Debt Outstanding of Common Stock Outstanding COMMON STOCK P10 PAR VALUE 1,204,582,867 N.A. 11. Are any or all of these securities listed on the Philippine Stock Exchange. Yes [X] No [ ] 12. Indicate by check mark whether the registrant: (a) has filed all reports required to be filed by Section 11 of the Securities Regulation Code
(SRC)and SRC Rule 11(a)-1 thereunder and Sections 26 and 141 of The Corporation Code of the Philippines during the preceding 12 months (or for such shorter period that the registrant was required to file such reports);
Yes [X] No [ ] (b) has been subject to such filing requirements for the past 90 days. Yes [X] No [ ]
TABLE OF CONTENTS PART I – FINANCIAL INFORMATION Item 1. Interim Condensed Consolidated Financial Statements
Interim Consolidated Balance Sheets as at March 31, 2021 (Unaudited),
December 31, 2020 (Audited)
Interim Consolidated Statements of Income for the Three-Month Periods Ended
March 31, 2021 and 2020 (Unaudited)
Interim Consolidated Statements of Changes in Stockholders’ Equity for the
Three-Month Periods Ended March 31, 2021 and 2020 (Unaudited)
Interim Consolidated Statements of Cash Flows for the Three-Month Periods Ended
March 31, 2021 and 2020 (Unaudited)
Notes to Interim Condensed Consolidated Financial Statements Item 2. Management’s Discussion and Analysis of Financial Condition as at March 31, 2021 and December 31, 2020 and Result of Operations for the Three-
Month Periods Ended March 31, 2021 and 2020 Item 3. Aging of Accounts Receivable - Trade as at March 31, 2021 PART II – SIGNATURE
Cash in banks earn interest at the respective bank deposit rates. Temporary investments are made for
varying periods of up to three months depending on the immediate cash requirements of the Group.
These investments earn interest at prevailing rates.
6. Time Deposits
This account consists of time deposits as follows:
March 31,
2021
(Unaudited)
December 31,
2020
(Audited)
(In Thousands)
Current P=1,003 P=31,012
Noncurrent 1,604,447 1,356,442
P=1,605,450 P=1,387,454
The time deposits bear interest ranging from 0.3% to 3.8% in 2021 and 0.5% to 1.6% in 2020.
Time deposits with various maturities within one year were used as collateral for some credit lines.
- 6 -
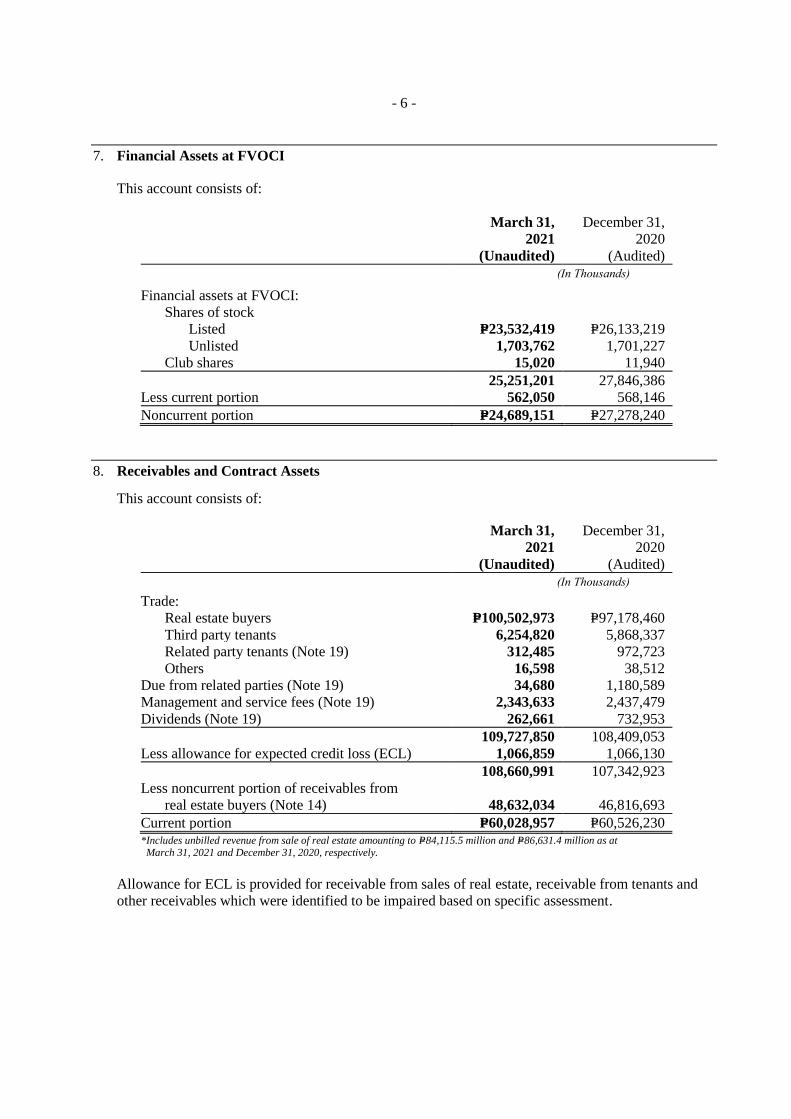
7. Financial Assets at FVOCI
This account consists of:
March 31,
2021
(Unaudited)
December 31,
2020
(Audited)
(In Thousands)
Financial assets at FVOCI: Shares of stock
Listed P=23,532,419 P=26,133,219
Unlisted 1,703,762 1,701,227
Club shares 15,020 11,940
25,251,201 27,846,386
Less current portion 562,050 568,146
Noncurrent portion P=24,689,151 P=27,278,240
8. Receivables and Contract Assets
This account consists of:
March 31,
2021
(Unaudited)
December 31,
2020
(Audited)
(In Thousands)
Trade:
Real estate buyers P=100,502,973 P=97,178,460
Third party tenants 6,254,820 5,868,337
Related party tenants (Note 19) 312,485 972,723
Others 16,598 38,512
Due from related parties (Note 19) 34,680 1,180,589
Management and service fees (Note 19) 2,343,633 2,437,479
Dividends (Note 19) 262,661 732,953
109,727,850 108,409,053
Less allowance for expected credit loss (ECL) 1,066,859 1,066,130
108,660,991 107,342,923
Less noncurrent portion of receivables from
real estate buyers (Note 14) 48,632,034 46,816,693
Current portion P=60,028,957 P=60,526,230 *Includes unbilled revenue from sale of real estate amounting to P=84,115.5 million and P=86,631.4 million as at March 31, 2021 and December 31, 2020, respectively.
Allowance for ECL is provided for receivable from sales of real estate, receivable from tenants and
other receivables which were identified to be impaired based on specific assessment.
- 7 -
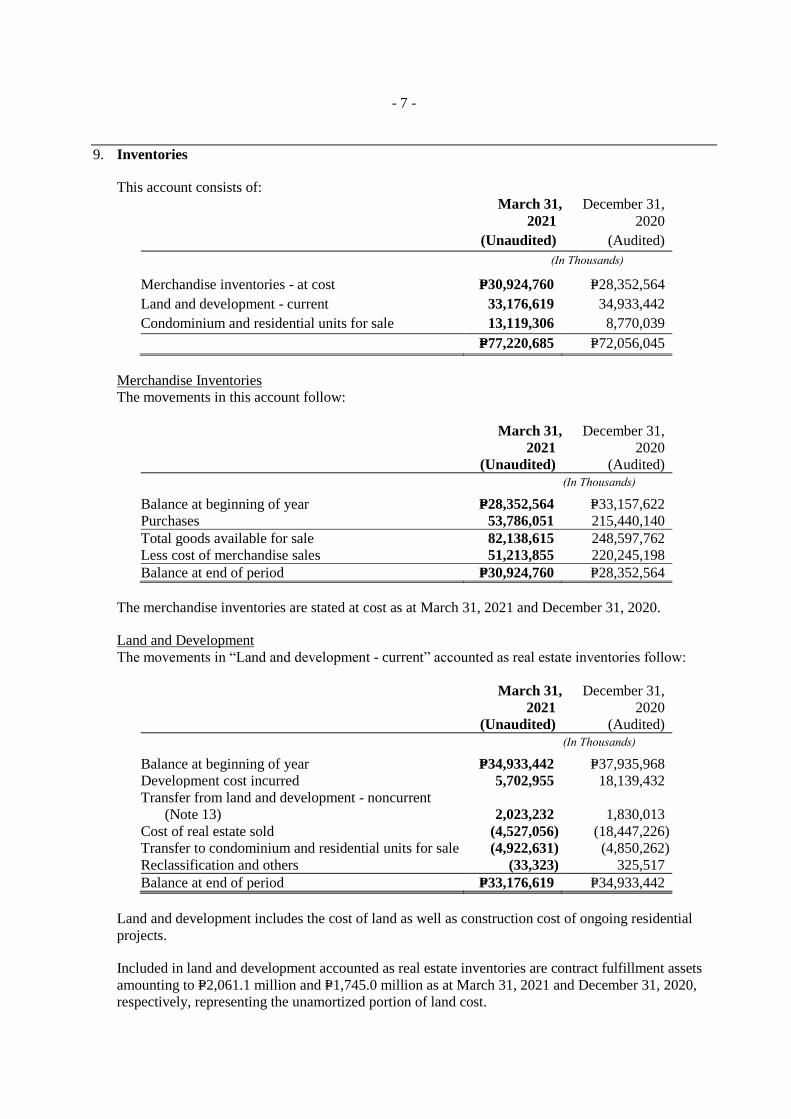
9. Inventories
This account consists of:
March 31,
2021
(Unaudited)
December 31,
2020
(Audited)
(In Thousands)
Merchandise inventories - at cost P=30,924,760 P=28,352,564
Land and development - current 33,176,619 34,933,442
Condominium and residential units for sale 13,119,306 8,770,039
P=77,220,685 P=72,056,045
Merchandise Inventories
The movements in this account follow:
March 31,
2021
(Unaudited)
December 31,
2020
(Audited)
(In Thousands)
Balance at beginning of year P=28,352,564 P=33,157,622
Purchases 53,786,051 215,440,140
Total goods available for sale 82,138,615 248,597,762
Less cost of merchandise sales 51,213,855 220,245,198
Balance at end of period P=30,924,760 P=28,352,564
The merchandise inventories are stated at cost as at March 31, 2021 and December 31, 2020.
Land and Development
The movements in “Land and development - current” accounted as real estate inventories follow:
March 31,
2021
(Unaudited)
December 31,
2020
(Audited)
(In Thousands)
Balance at beginning of year P=34,933,442 P=37,935,968
Development cost incurred 5,702,955 18,139,432
Transfer from land and development - noncurrent
(Note 13) 2,023,232 1,830,013
Cost of real estate sold (4,527,056) (18,447,226)
Transfer to condominium and residential units for sale (4,922,631) (4,850,262)
Reclassification and others (33,323) 325,517
Balance at end of period P=33,176,619 P=34,933,442
Land and development includes the cost of land as well as construction cost of ongoing residential
projects.
Included in land and development accounted as real estate inventories are contract fulfillment assets
amounting to P=2,061.1 million and P=1,745.0 million as at March 31, 2021 and December 31, 2020,
respectively, representing the unamortized portion of land cost.
- 8 -
The estimated cost to complete the projects amounted to P=108,743.3 million and P=106,678.6 million
as at March 31, 2021 and December 31, 2020, respectively.
Land and development is stated at cost. There is no allowance for inventory writedown as at March
31, 2021 and December 31, 2020.
Condominium and Residential Units for Sale
The movements in this account follow:
March 31,
2021
(Unaudited)
December 31,
2020
(Audited)
(In Thousands)
Balance at beginning of year P=8,770,039 P=6,026,426
Transfer from land and development 4,922,631 4,850,262
Cost of real estate sold (605,338) (2,136,756)
Repossessed inventories and others 31,974 30,107
Balance at end of period P=13,119,306 P=8,770,039
The condominium and residential units for sale are stated at cost as at March 31, 2021 and December
31, 2020.
10. Other Current Assets
This account consists of:
March 31,
2021
(Unaudited)
December 31,
2020
(Audited)
(In Thousands)
Prepaid taxes and other prepayments P=15,680,227 P=14,249,890
As at March 31, 2021 P=– P=2,679,926 P=69,976,250 P=30,134,467 P=– P=102,790,643
Net Book Value As at March 31, 2021 P=75,657,063 P=75,358,813 P=200,516,376 P=15,601,245 P=73,399,436 P=440,532,933
As at December 31, 2020 75,622,199 75,298,417 198,078,180 15,506,994 70,960,934 435,466,724
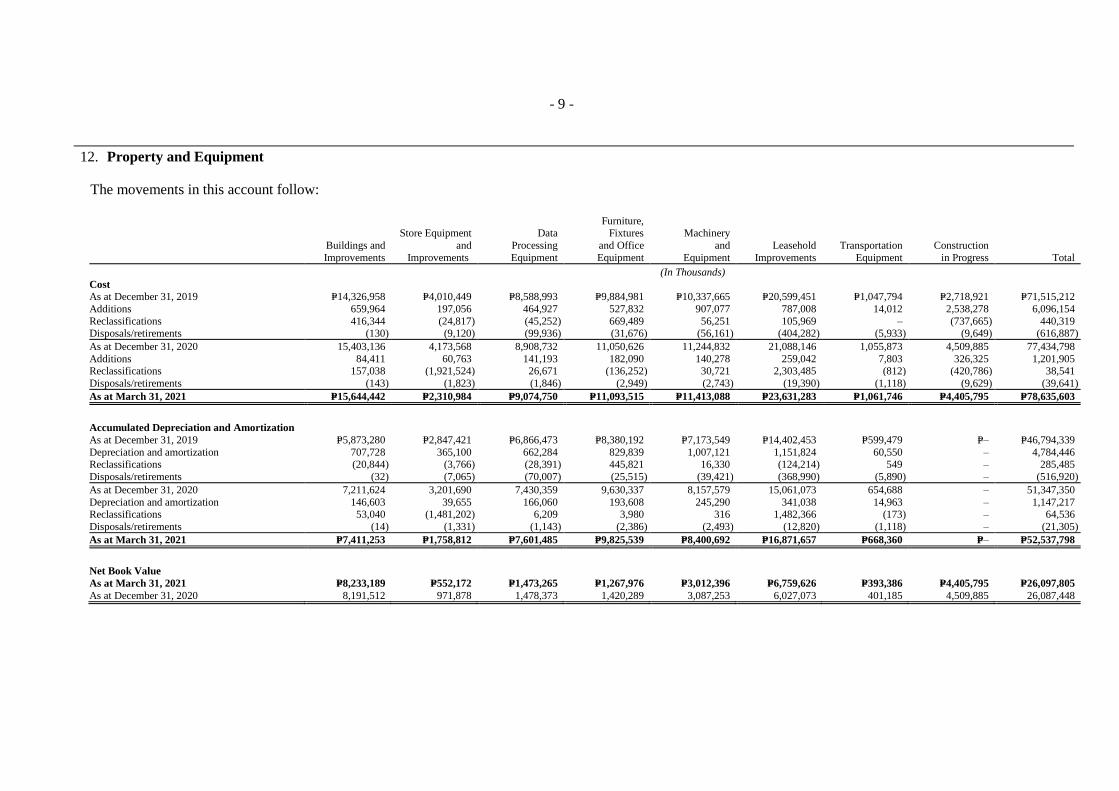
Construction in progress includes construction costs incurred for new shopping malls, commercial
building and redevelopment of existing malls amounting to P=71,206.3 million and P=70,277.9 million
as at March 31, 2021 and December 31, 2020, respectively.
Interest capitalized to investment properties amounted to P=1,327.5 million and P=3,539.8 million as at
March 31, 2021 and December 31, 2020, respectively. Capitalization rates used range from 3.9% to
4.6% in 2021 and 2.4% to 4.7% in 2020.
The fair value of investment properties is categorized under Level 3 since valuation is based on
unobservable inputs.
The fair value of substantially all investment properties amounting to P=1,350.8 million was
determined by accredited independent appraisers with appropriate qualifications and experience in the
valuation of similar properties in the relevant locations. The fair value represents the price that would
be received to sell the investment properties in an orderly transaction between market participants at
the measurement date.
Management believes that the impact of COVID-19 on the fair value measurement of investment
properties is short-term and temporary.
- 11 -
The Company has no restriction on the realizability of its investment properties and no obligation to
purchase, construct or develop, repair, maintain and/or enhance any of these properties.
14. Intangibles and Other Noncurrent Assets
Intangible Assets
This account consists of:
March 31,
2021
(Unaudited)
December 31,
2020
(Audited)
(In Thousands)
Goodwill P=17,456,168 P=17,456,385
Less accumulated impairment loss 91,620 91,620
Net book value 17,364,548 17,364,765
Trademarks and brand names 7,163,470 7,223,738
P=24,528,018 P=24,588,503
Other Noncurrent Assets
This account consists of:
March 31,
2021
(Unaudited)
December 31,
2020
(Audited)
(In Thousands)
Bonds and deposits P=56,825,719 P=56,259,937
Receivables from real estate buyers (Note 8) 48,632,034 46,816,693
Long-term notes (Notes 19 and 23) 5,066,434 4,999,359
Deferred input VAT 1,878,747 1,804,670
Derivative assets (Note 23) 167,985 –
Land use rights 358,372 353,217
Escrow fund (Note 19) 132,460 132,460
Defined benefit asset 530,990 546,515
Others 1,570,422 1,405,799
P=115,163,163 P=112,318,650
15. Bank Loans
This account consists of Philippine peso and China yuan renminbi denominated loans of Subsidiaries
amounting to P18,512.6 million as at March 31, 2021 and P24,126.0 million as at December 31,
2020. The loans bear fixed interest ranging from 3.1% to 4.0% in 2021 and 2.8% to 5.3% in 2020.
- 12 -
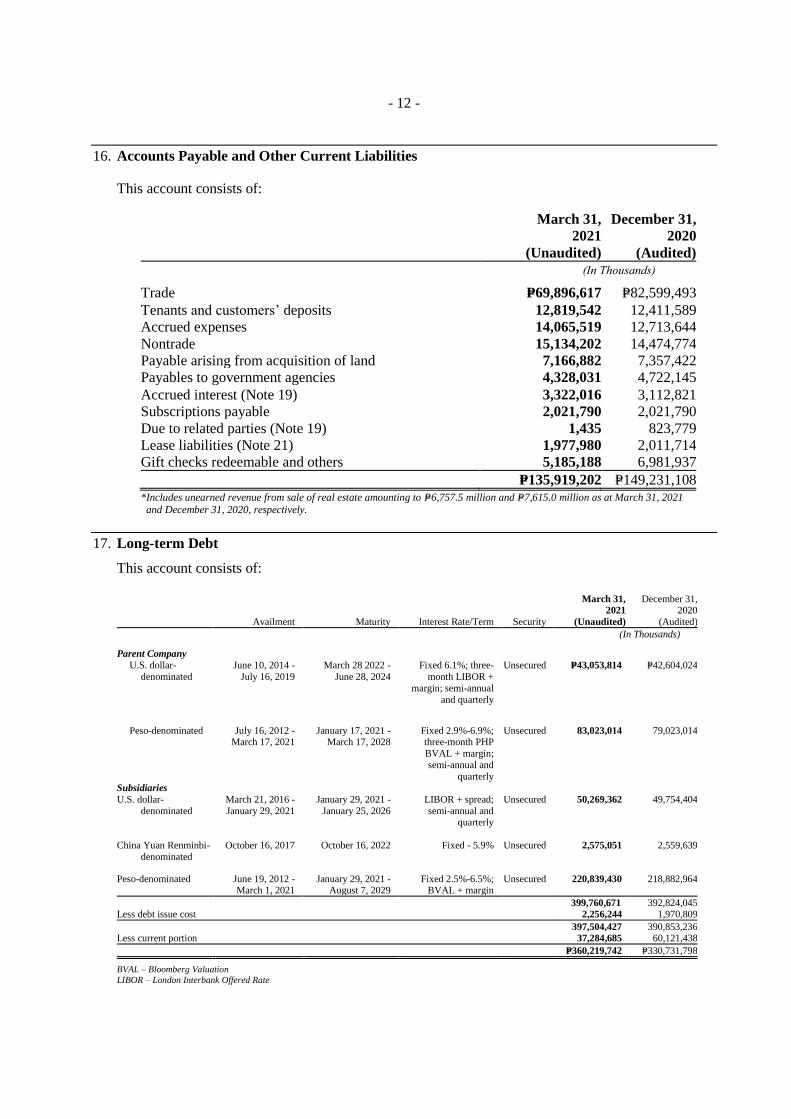
16. Accounts Payable and Other Current Liabilities
This account consists of:
March 31,
2021
(Unaudited)
December 31,
2020
(Audited)
(In Thousands)
Trade P=69,896,617 P=82,599,493
Tenants and customers’ deposits 12,819,542 12,411,589
Accrued expenses 14,065,519 12,713,644
Nontrade 15,134,202 14,474,774
Payable arising from acquisition of land 7,166,882 7,357,422
Payables to government agencies 4,328,031 4,722,145
Accrued interest (Note 19) 3,322,016 3,112,821
Subscriptions payable 2,021,790 2,021,790
Due to related parties (Note 19) 1,435 823,779
Lease liabilities (Note 21) 1,977,980 2,011,714
Gift checks redeemable and others 5,185,188 6,981,937
P=135,919,202 P=149,231,108 *Includes unearned revenue from sale of real estate amounting to P=6,757.5 million and P=7,615.0 million as at March 31, 2021
and December 31, 2020, respectively.
17. Long-term Debt
This account consists of:
Availment Maturity Interest Rate/Term Security
March 31,
2021
(Unaudited)
December 31, 2020
(Audited)
(In Thousands)
Parent Company
U.S. dollar-
denominated
June 10, 2014 -
July 16, 2019
March 28 2022 -
June 28, 2024
Fixed 6.1%; three-
month LIBOR +
margin; semi-annual
and quarterly
Unsecured P=43,053,814
P=42,604,024
Peso-denominated July 16, 2012 - March 17, 2021
January 17, 2021 - March 17, 2028
Fixed 2.9%-6.9%; three-month PHP
BVAL + margin;
semi-annual and
quarterly
Unsecured 83,023,014 79,023,014
Subsidiaries
U.S. dollar-
denominated
March 21, 2016 -
January 29, 2021
January 29, 2021 -
January 25, 2026
LIBOR + spread;
semi-annual and quarterly
Unsecured 50,269,362 49,754,404
China Yuan Renminbi-
denominated
October 16, 2017 October 16, 2022 Fixed - 5.9%
Unsecured 2,575,051 2,559,639
Peso-denominated June 19, 2012 - March 1, 2021
January 29, 2021 - August 7, 2029
Fixed 2.5%-6.5%; BVAL + margin
Unsecured 220,839,430 218,882,964
399,760,671 392,824,045 Less debt issue cost 2,256,244 1,970,809
397,504,427 390,853,236 Less current portion 37,284,685 60,121,438
P=360,219,742 P=330,731,798
BVAL – Bloomberg Valuation
LIBOR – London Interbank Offered Rate
- 13 -
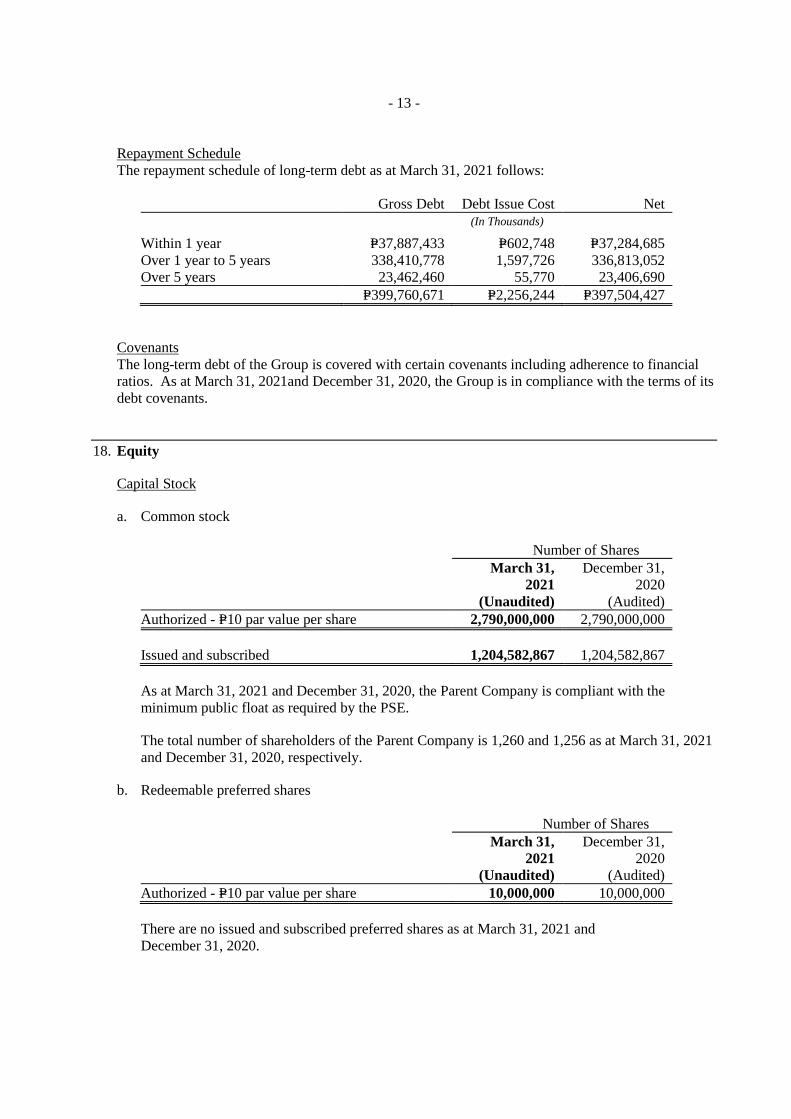
Repayment Schedule
The repayment schedule of long-term debt as at March 31, 2021 follows:
Gross Debt Debt Issue Cost Net
(In Thousands)
Within 1 year P=37,887,433 P=602,748 P=37,284,685
Over 1 year to 5 years 338,410,778 1,597,726 336,813,052
Over 5 years 23,462,460 55,770 23,406,690
P=399,760,671 P=2,256,244 P=397,504,427
Covenants
The long-term debt of the Group is covered with certain covenants including adherence to financial
ratios. As at March 31, 2021and December 31, 2020, the Group is in compliance with the terms of its
debt covenants.
18. Equity
Capital Stock
a. Common stock
Number of Shares
March 31,
2021
(Unaudited)
December 31,
2020
(Audited)
Authorized - P=10 par value per share 2,790,000,000 2,790,000,000
Issued and subscribed 1,204,582,867 1,204,582,867
As at March 31, 2021 and December 31, 2020, the Parent Company is compliant with the
minimum public float as required by the PSE.
The total number of shareholders of the Parent Company is 1,260 and 1,256 as at March 31, 2021
and December 31, 2020, respectively.
b. Redeemable preferred shares
Number of Shares
March 31,
2021
(Unaudited)
December 31,
2020
(Audited)
Authorized - P=10 par value per share 10,000,000 10,000,000
There are no issued and subscribed preferred shares as at March 31, 2021 and
December 31, 2020.
- 14 -
Retained Earnings
▪ Appropriated
Retained earnings appropriated as at March 31, 2021 is intended for the payment of certain long-
term debts and new investments as follows:
Timeline Amount
(In Thousands)
Debt service 2020 - 2023 P=27,000,000
Investments 2020 - 2021 10,000,000
P=37,000,000
▪ Unappropriated
The Parent Company’s cash dividend declaration in 2021 follows:
Declaration Date Record Date Payment Date Per Share Total
(In Thousands)
April 28, 2021 May 13, 2021 May 27, 2021 P=4.25 P=5,119,477
Unappropriated retained earnings include the accumulated equity in net earnings of subsidiaries,
associates and joint ventures amounting to P=264,139.4 million and P=254,371.2 million as at March
31, 2021 and December 31, 2020, respectively, that is not available for distribution until such time
that the Parent Company receives the dividends from the respective subsidiaries, associates and
joint ventures.
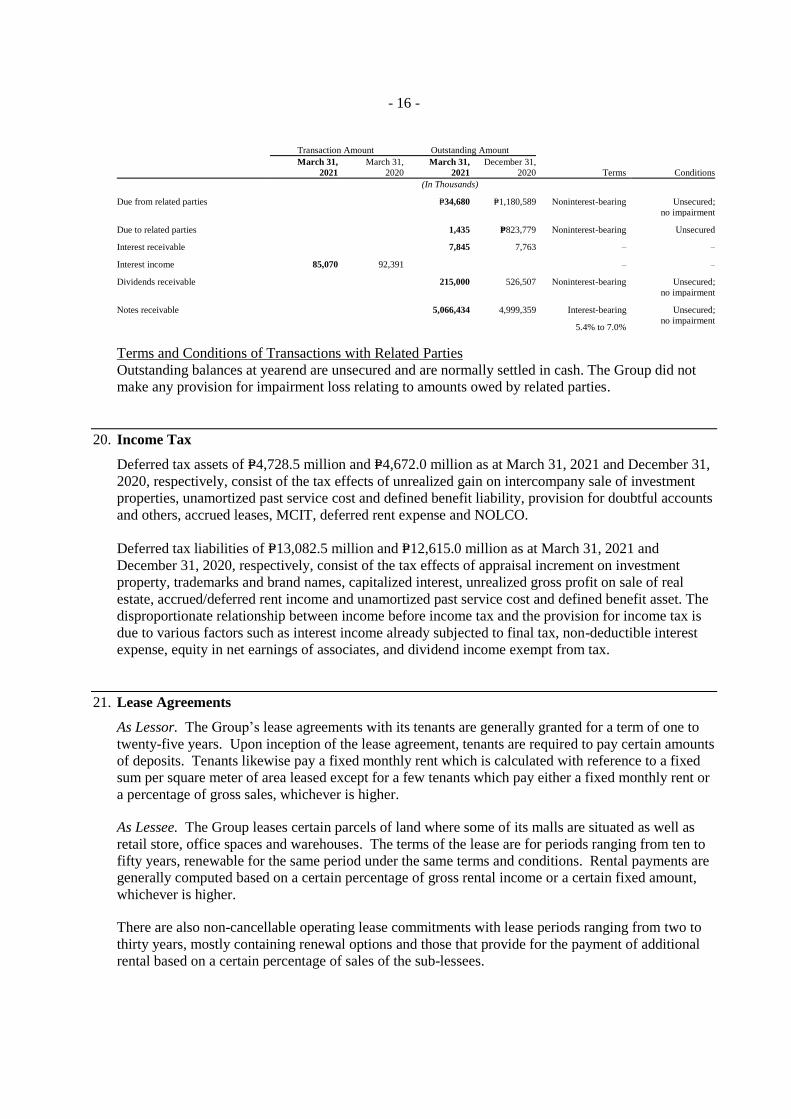
19. Related Party Disclosures
Parties are considered to be related if one party has the ability, directly and indirectly, to control the
other party or exercise significant influence over the other party in making financial and operating
decisions. Parties are also considered to be related if they are subject to common control.
The significant transactions with related parties follow:
▪ Rent
The Group has existing lease agreements for office and commercial spaces with related
companies (retail and banking group and other related parties under common stockholders).
▪ Royalty, Management and Service Fees
The Parent Company and SM Retail receive management and service fees from retail entities
under common stockholders for management, consultancy, manpower and other services. In
addition to management and service fees, the Parent Company also receives royalty fees from
certain related parties.
- 15 -
▪ Dividend Income
The Group earns dividend income from certain related parties under common stockholders.
▪ Cash Placements and Loans
The Group has certain bank accounts and cash placements as well as bank loans and debts with
BDO and China Bank. Such accounts earn interest at prevailing market rates.
▪ Notes Receivable
The Group has certain notes receivable from Carmen Copper Corporation (see Notes 14 and 22).
▪ Others
The Group, in the normal course of business, has outstanding receivables from and payables to
related companies which are unsecured and normally settled in cash.
The related party transactions and outstanding balances follow:
As the terms of the swaps have been negotiated to match the terms of the hedged loans and advances,
the hedges are assessed to be highly effective.
24. EPS Computation
March 31,
2021
(Unaudited)
March 31,
2020
(Unaudited)
(In Thousands Except Per Share Data)
Net income attributable to owners of the Parent (a) P=9,470,213 P=9,007,277
Weighted average number of common shares outstanding (b) 1,204,583 1,204,583
EPS (a/b) P=7.86 P=7.48
- 23 -
PART 1 FINANCIAL INFORMATION
Management’s Discussion and Analysis or Plan of Operation
Results of Operation
For the Three Months Ended March 31, 2021 and 2020
(amounts in billion pesos)
Ytd
March
2021
(Unaudited)
Ytd
March
2020
(Unaudited)
%
Change
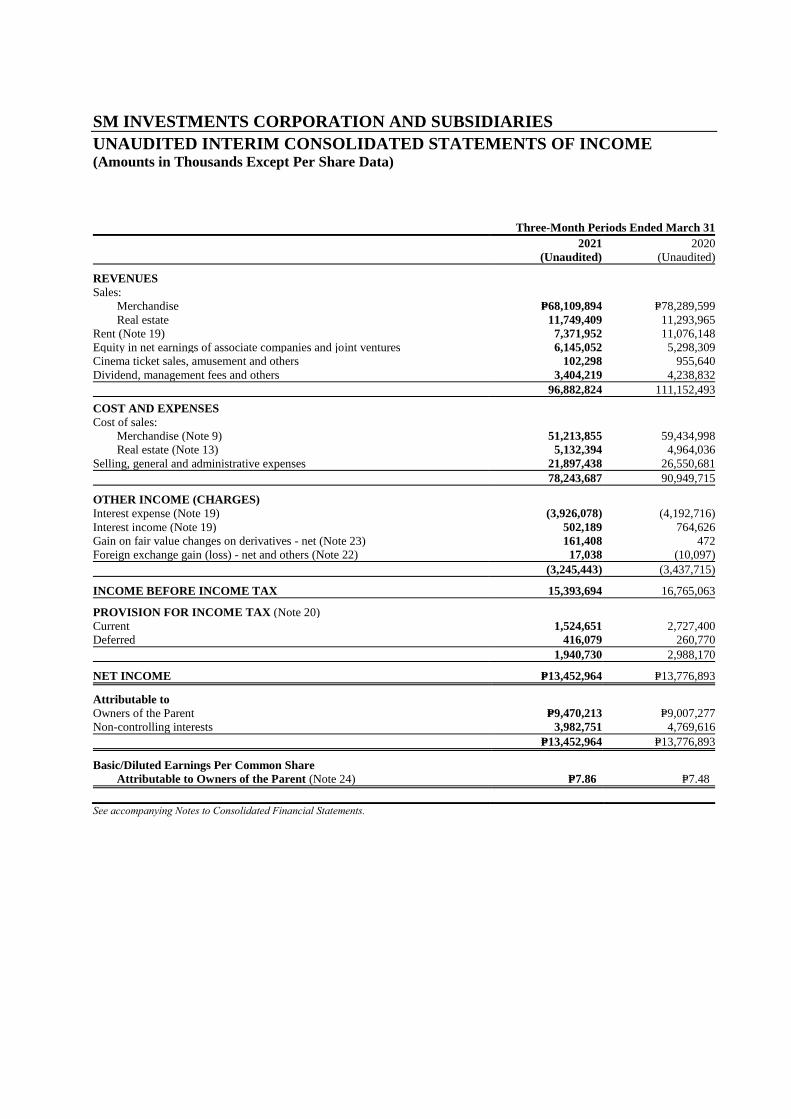
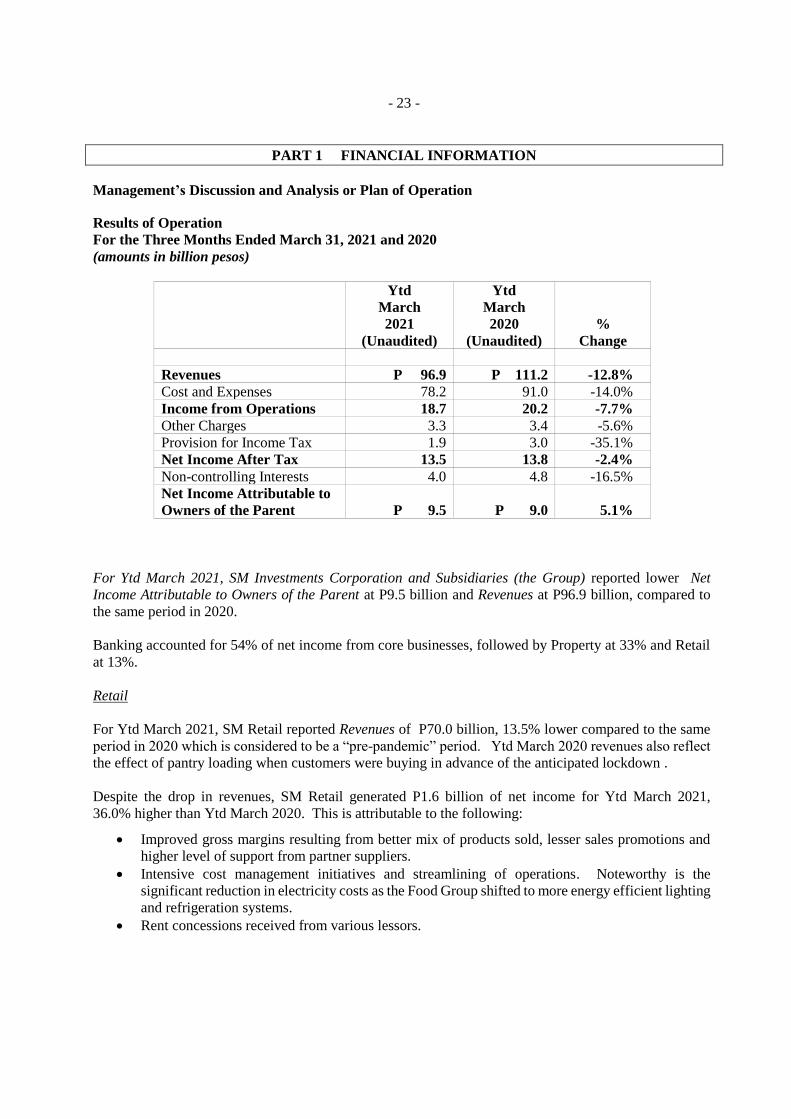
Revenues P 96.9 P 111.2 -12.8%
Cost and Expenses 78.2 91.0 -14.0%
Income from Operations 18.7 20.2 -7.7%
Other Charges 3.3 3.4 -5.6%
Provision for Income Tax 1.9 3.0 -35.1%
Net Income After Tax 13.5 13.8 -2.4%
Non-controlling Interests 4.0 4.8 -16.5%
Net Income Attributable to
Owners of the Parent
P 9.5
P 9.0
5.1%
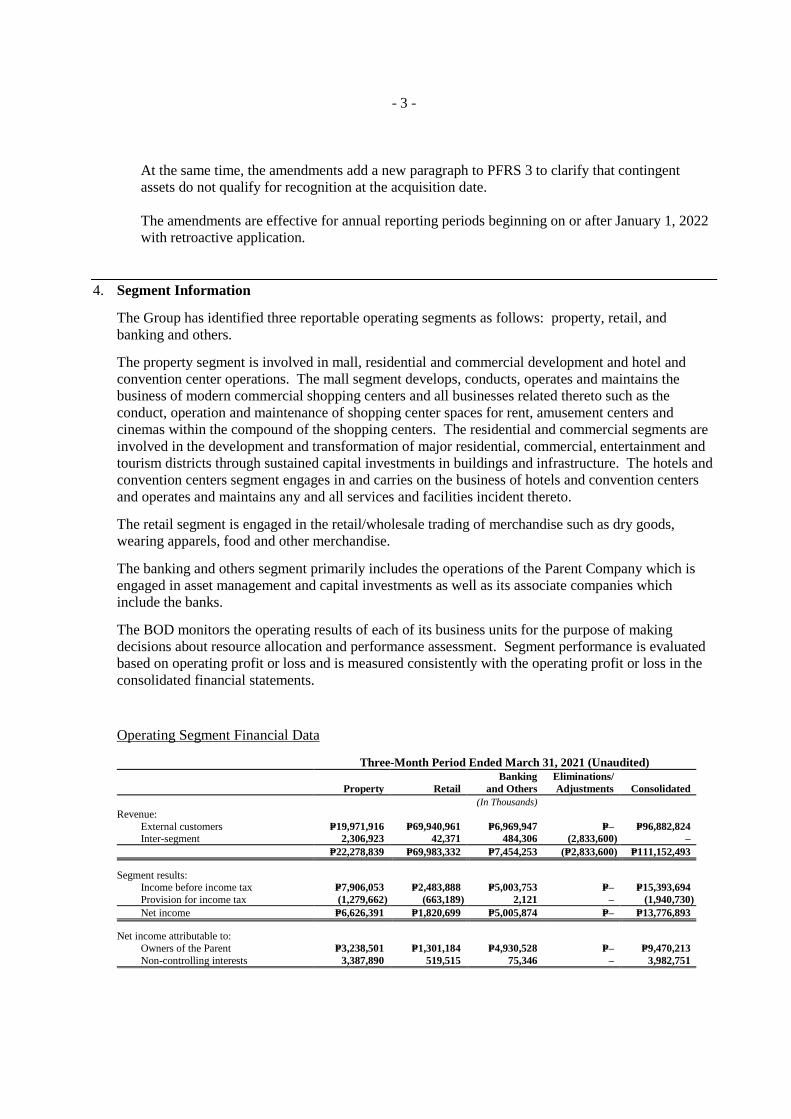
For Ytd March 2021, SM Investments Corporation and Subsidiaries (the Group) reported lower Net
Income Attributable to Owners of the Parent at P9.5 billion and Revenues at P96.9 billion, compared to
the same period in 2020.
Banking accounted for 54% of net income from core businesses, followed by Property at 33% and Retail
at 13%.
Retail
For Ytd March 2021, SM Retail reported Revenues of P70.0 billion, 13.5% lower compared to the same
period in 2020 which is considered to be a “pre-pandemic” period. Ytd March 2020 revenues also reflect
the effect of pantry loading when customers were buying in advance of the anticipated lockdown .
Despite the drop in revenues, SM Retail generated P1.6 billion of net income for Ytd March 2021,
36.0% higher than Ytd March 2020. This is attributable to the following:
• Improved gross margins resulting from better mix of products sold, lesser sales promotions and
higher level of support from partner suppliers.
• Intensive cost management initiatives and streamlining of operations. Noteworthy is the
significant reduction in electricity costs as the Food Group shifted to more energy efficient lighting
and refrigeration systems.
• Rent concessions received from various lessors.
- 24 -
Property
For Ytd March 2021, SM Prime reported lower Revenues of P20.8 billion Net income of P6.5 billion,
19% and 22% lower compared to the same period in 2020, respectively.
SM Prime’s Philippine malls business reported Revenues of P5.9 billion, 10% higher than Ytd March 2020,
with Rent income growing 14% to P5.6 billion. SM Prime continues to grant rent concessions to its
tenants in the first three months of 2021.
SM Prime’s residential business, led by SM Development Corporation (SMDC), reported a 5% growth in
Revenues for Ytd March 2021 to P11.9 billion and 31% growth in reservation sales to P32.4 billion relative
to the multiple projects that were launched in 2021.
Banking
For Ytd March 2021, BDO reported a Net income of P10.4 billion, 19% higher compared to the same
period in 2020. This is primarily due to the robust performance of its service fee businesses that
compensated for the weak demands for loans.
In the same period, China Bank reported a Net income of P3.6 billion at 61% growth. Net interest income
grew 16% to P9.2 billion due to the 52% drop in interest expense reflecting lower cost of funding. This
was supplemented by the three-fold growth in fee-based income to P3.6 billion, driven by strong trading
and securities gains of P2.2 billion.
Profit & Loss Statement - Account Analysis
Merchandise Sales, which decreased by 13.0% to P68.1 billion from P78.3 billion in 2020, accounted for
70% of total revenues in 2021. Ytd March 2020 Revenues reflect the abnormally high purchase volumes
by customers in the last two weeks of March relative to the scheduled community lockdowns in the
succeeding months whereas Ytd March 2021 revenues reflect normal pandemic purchase volumes as the
customers have already adjusted to the norms of a pandemic environment.
As of March 31, 2021, SM Retail had 3,035 stores in operation. Its stores portfolio include 66 SM Stores,
59 SM Supermarkets, 213 Savemore stores, 52 SM Hypermarkets, 71 WalterMart stores, 1,044 Alfamart
stores, and 1,530 Specialty stores.
Real Estate Sales increased by 4.0% to P11.7 billion from P11.3 billion in 2020. The increase is attributable
to sales take-up and construction accomplishments of ongoing projects including Shore 3, Bloom, Vine,
Fame, Style and Glam as well as various Ready-For-Occupancy (RFO) projects, particularly those located
in Mandaluyong and Pasay. Revenues are recognized based on percentage of completion.
Rent Revenue, derived mainly from the mall operations of SM Prime, decreased by 33.4% to P7.4 billion
from P11.1 billion in 2020. The decrease is due to lesser mall tenants in operation in 2021 than in 2020
which was for the most part, operating on pre-pandemic terms.
- 25 -
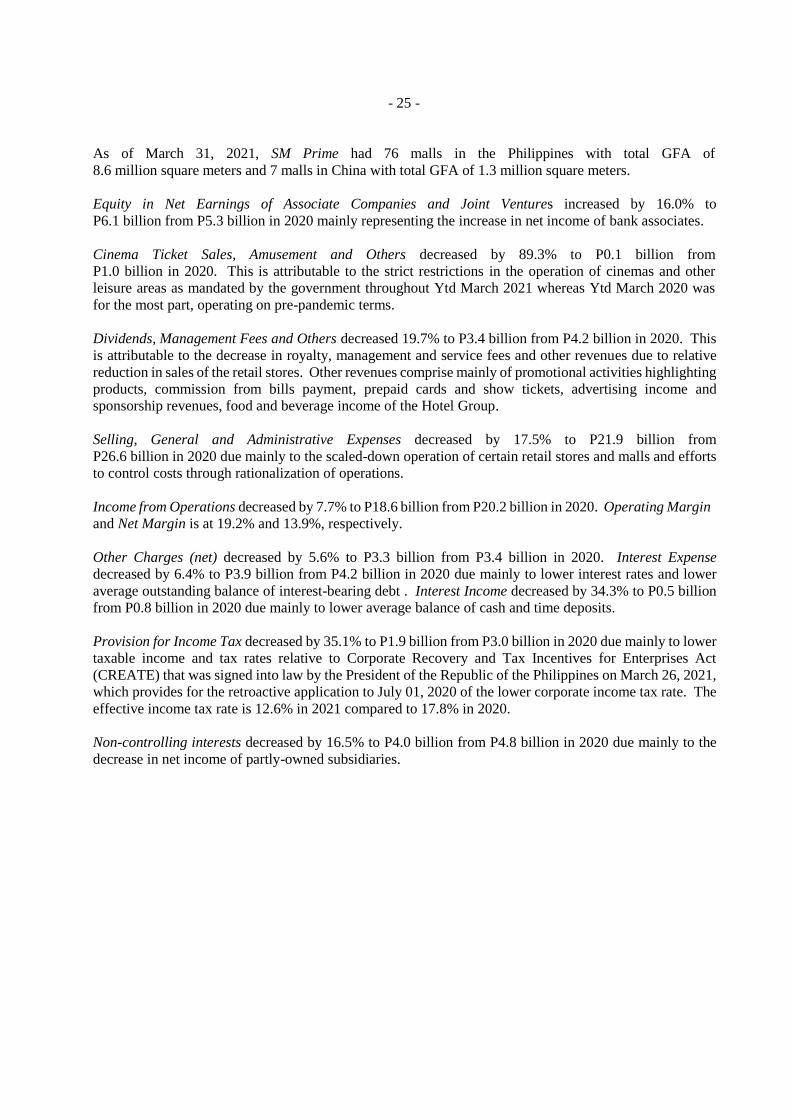
As of March 31, 2021, SM Prime had 76 malls in the Philippines with total GFA of
8.6 million square meters and 7 malls in China with total GFA of 1.3 million square meters.
Equity in Net Earnings of Associate Companies and Joint Ventures increased by 16.0% to
P6.1 billion from P5.3 billion in 2020 mainly representing the increase in net income of bank associates.
Cinema Ticket Sales, Amusement and Others decreased by 89.3% to P0.1 billion from
P1.0 billion in 2020. This is attributable to the strict restrictions in the operation of cinemas and other
leisure areas as mandated by the government throughout Ytd March 2021 whereas Ytd March 2020 was
for the most part, operating on pre-pandemic terms.
Dividends, Management Fees and Others decreased 19.7% to P3.4 billion from P4.2 billion in 2020. This
is attributable to the decrease in royalty, management and service fees and other revenues due to relative
reduction in sales of the retail stores. Other revenues comprise mainly of promotional activities highlighting
products, commission from bills payment, prepaid cards and show tickets, advertising income and
sponsorship revenues, food and beverage income of the Hotel Group.
Selling, General and Administrative Expenses decreased by 17.5% to P21.9 billion from
P26.6 billion in 2020 due mainly to the scaled-down operation of certain retail stores and malls and efforts
to control costs through rationalization of operations.
Income from Operations decreased by 7.7% to P18.6 billion from P20.2 billion in 2020. Operating Margin
and Net Margin is at 19.2% and 13.9%, respectively.
Other Charges (net) decreased by 5.6% to P3.3 billion from P3.4 billion in 2020. Interest Expense
decreased by 6.4% to P3.9 billion from P4.2 billion in 2020 due mainly to lower interest rates and lower
average outstanding balance of interest-bearing debt . Interest Income decreased by 34.3% to P0.5 billion
from P0.8 billion in 2020 due mainly to lower average balance of cash and time deposits.
Provision for Income Tax decreased by 35.1% to P1.9 billion from P3.0 billion in 2020 due mainly to lower
taxable income and tax rates relative to Corporate Recovery and Tax Incentives for Enterprises Act
(CREATE) that was signed into law by the President of the Republic of the Philippines on March 26, 2021,
which provides for the retroactive application to July 01, 2020 of the lower corporate income tax rate. The
effective income tax rate is 12.6% in 2021 compared to 17.8% in 2020.
Non-controlling interests decreased by 16.5% to P4.0 billion from P4.8 billion in 2020 due mainly to the
decrease in net income of partly-owned subsidiaries.
- 26 -
Financial Position
As at March 31, 2021 and December 31, 2020
(amounts in billion pesos)
03 / 31 / 2021
(Unaudited)
12 / 31 / 2020
(Unaudited)
% Change
Current Assets P 242.4 P 254.5 -4.7%
Noncurrent Assets 978.7 970.0 0.9%
Total Assets P 1,221.1 P 1,224.5 -0.3%
Current Liabilities P 198.2 P 240.0 -17.4%
Noncurrent Liabilities 448.2 419.8 6.7%
Total Liabilities 646.4 659.8 -2.0%
Total Equity 574.7 564.7 1.8%
Total Liabilities and
Equity
P 1,221.1
P 1,224.5
-0.3%
Total Assets decreased by 0.3% to P1,221.1 billion from P1,224.5 billion in 2020. Likewise, total Liabilities
decreased by 2.0% to P646.4 billion from P659.8 billion in 2020.
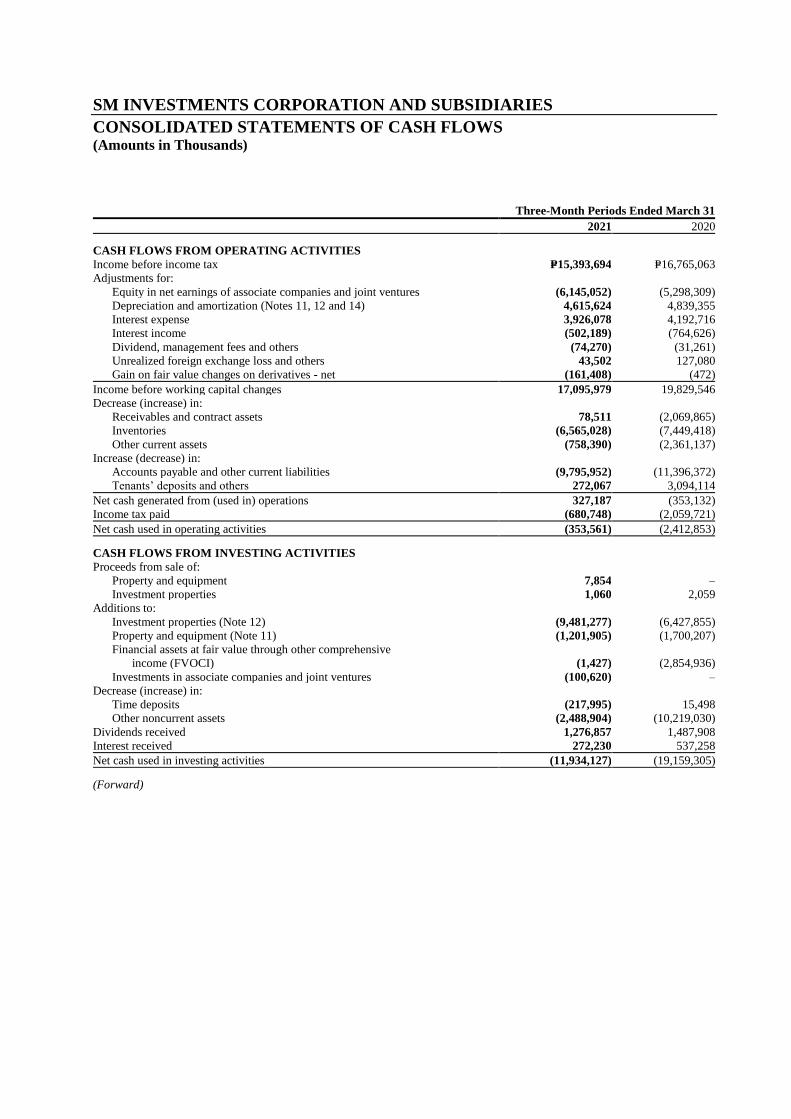
Current Assets
Current Assets decreased by 4.7% to P242.4 billion from P254.5 billion in 2020.
Cash and Cash Equivalents decreased by 22.7% to P60.4 billion from P78.2 billion in 2020 due mainly to
payments for trade, investments, capital expenditures and debt servicing.
Inventories increased by 7.2% to P77.2 billion from P72.1 billion resulting from the
P2.6 billion increase in merchandise inventory and P4.3 billion increase in condominium and residential
units for sale partly offset by the P1.8 billion decrease in land and development - current. The net increase
in real estate inventories is attributable to construction accomplishments during the period, net of cost of
sold units.
Other Current Assets increased by 2.4% to P44.2 billion from P43.2 billion in 2020 due mainly to higher
prepaid taxes.
Noncurrent Assets
Noncurrent Assets increased by 0.9% to P978.7 billion from P970.0 billion in 2020.
Financial assets at FVOCI - net of current portion decreased by 9.5% to P24.7 billion from P27.3 billion
due mainly to lower market values in 2021.
Investments in Associate Companies and Joint Ventures increased by 1.2% to
P299.8 billion from P296.3 billion in 2020. The increase mainly represents the equity in net earnings of
the Group’s associate companies of P6.1 billion, particularly from banking, partly offset by P0.7 billion
dividends and P2.0 billion share in the comprehensive income of its associate companies.
- 27 -
Investment Properties increased by 1.2% to P440.5 billion from P435.5 billion in 2020 due mainly to land
banking and ongoing new mall projects and commercial building construction as well as the redevelopment
of SM Mall of Asia and other existing malls.
Other Noncurrent Assets increased by 2.5% to P115.2 billion from P112.3 billion in 2020 due mainly to the
increase in receivable from real estate buyers.
Liabilities
Interest-bearing debt Bank Loans remained relatively flat at P416 billion from P415 billion in 2020.
Accounts Payable and Other Current Liabilities decreased by 8.9% to P135.9 billion from
P149.2 billion in 2020 due mainly to settlement of trade payables.
Dividends Payable decreased by 21.5% to P3.0 billion from P3.8 billion in 2020. This represents dividends
due to minority stockholders of certain subsidiaries.
Deferred tax liabilities increased by 3.7% to P13.1 billion from P12.6 billion in 2020 due mainly to
unrealized gross profit on sale of real estate for income tax purposes.
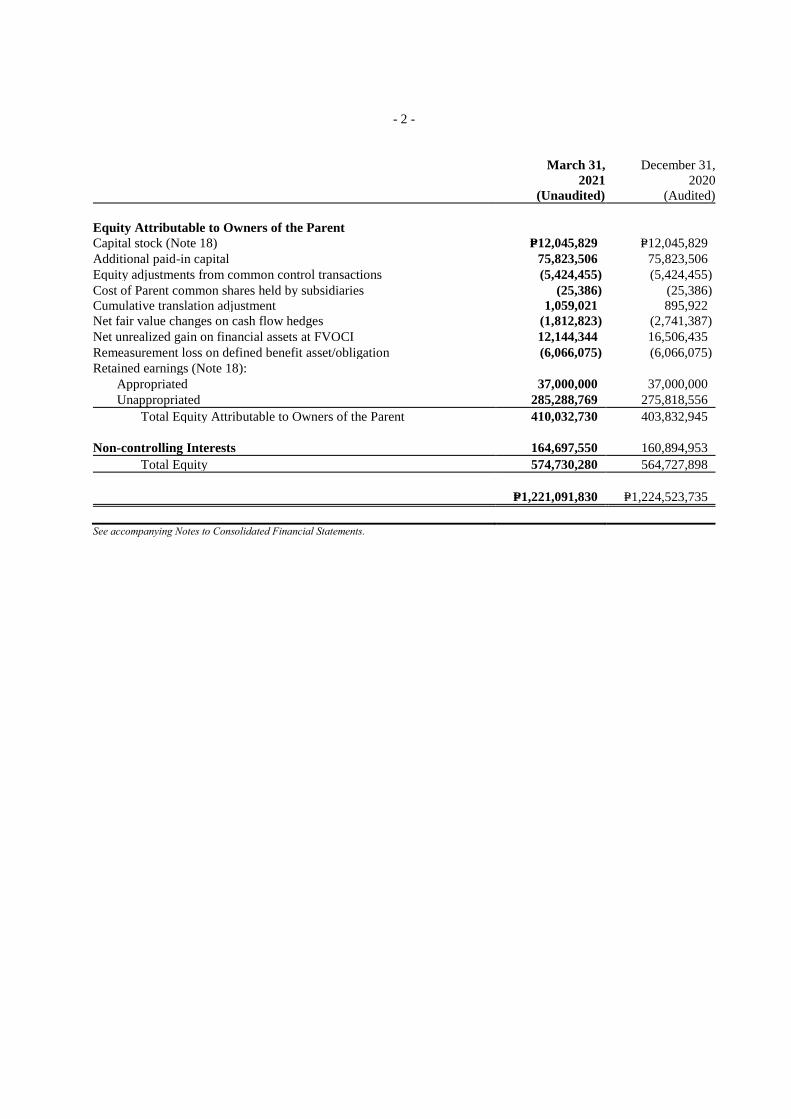
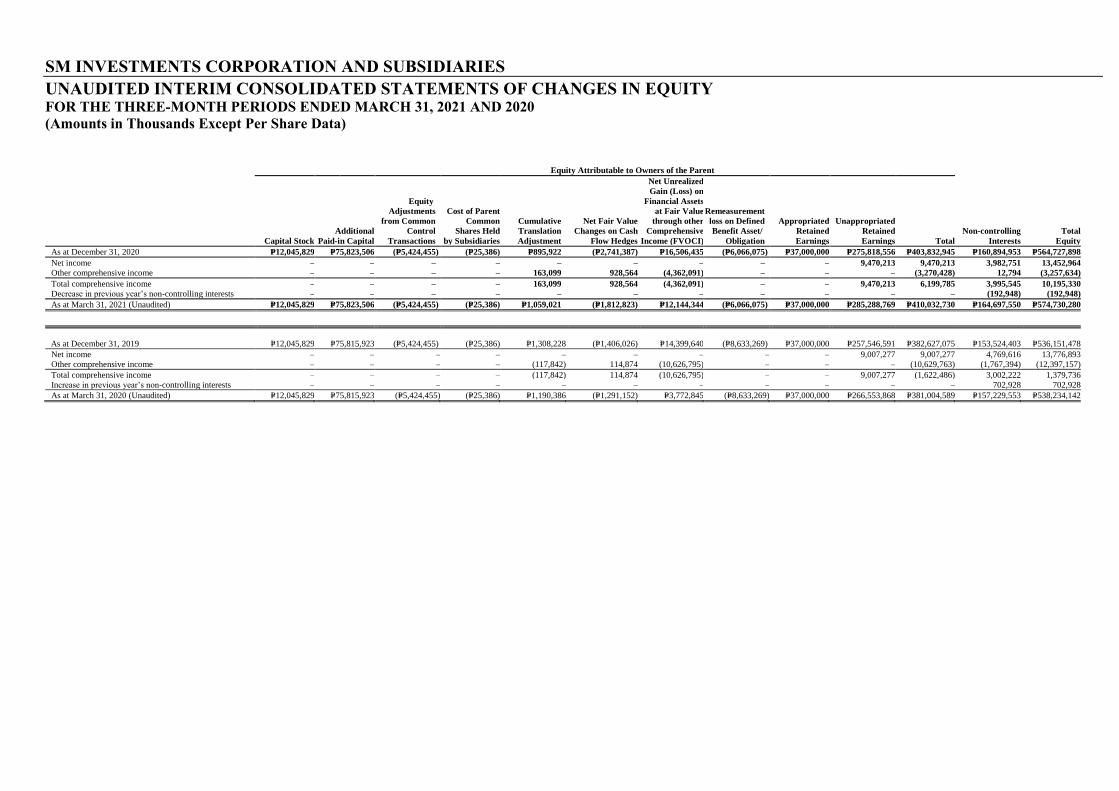
Equity
Total Equity increased by 1.8% to P574.7 billion from P564.7 billion in 2020.
Equity Attributable to Owners of the Parent increased by 1.5% to P410.0 billion from
P403.8 billion in 2020. This increase resulted mainly from the P9.5 billion net income for Ytd March 2021
reflected in Retained earnings and Net Fair value Changes on Cash Flow Hedges which decreased to
P1.8 billion from P2.7 billion in 2020. These were partly offset by the 26.4% decrease in Net Unrealized
Gain on Financial Assets to P12.1 billion from P16.5 billion in 2020 due to lower market valuation of
certain investments.
Non-controlling Interests increased by 2.4% to P164.7 billion from P160.9 billion in 2020 due mainly to
the increase in net assets of subsidiaries that are not wholly owned.
- 28 -
Impact of COVID-19 to the Group’s operations
Ytd March 2021 is a full quarter reflecting pandemic business conditions whereas Ytd March 2020 is
considered to be a pre-pandemic period considering that the first community quarantine was imposed in the
2nd half of March 2020.
For Ytd March 2021, there was a lower number of mall tenants in operation and generally lower sales
generated by the Retail Group stores. SM Prime also granted rent concessions for all three months of 2021.
COVID-19 did not have any significant impact on SM Prime’s offices business since its primary tenants
are business process outsourcing (BPO) offices which were allowed by the Philippine’s Inter-Agency Task
Force (IATF) to continue to have normal operations throughout the quarantine period.
SM Prime’s residential business has made adjustments to its construction and sales operations to align with
the pandemic related restrictions that allowed it to report higher real estate sales and reservation sales in
2021. The credit quality of receivables is maintained and remain within reasonable levels.
The operations of SM Prime’s hotel business continue to be at reduced levels.
BDO and China Bank both reported growth in earnings in Ytd March 2021 which is for the most part
attributable to lower interest expense and higher income from fee-based services, despite booking of higher
loan provisions compared to Ytd March 2020.
- 29 -
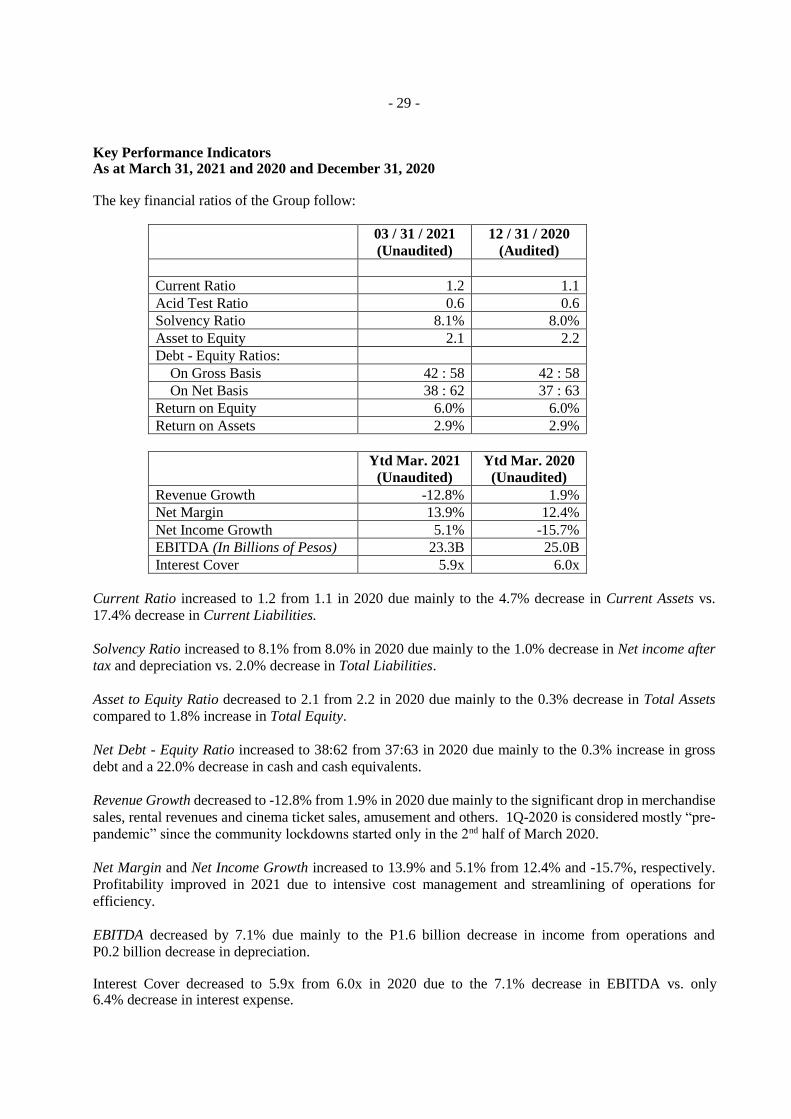
Key Performance Indicators As at March 31, 2021 and 2020 and December 31, 2020 The key financial ratios of the Group follow:
03 / 31 / 2021
(Unaudited)
12 / 31 / 2020
(Audited)
Current Ratio 1.2 1.1
Acid Test Ratio 0.6 0.6
Solvency Ratio 8.1% 8.0%
Asset to Equity 2.1 2.2
Debt - Equity Ratios:
On Gross Basis 42 : 58 42 : 58
On Net Basis 38 : 62 37 : 63
Return on Equity 6.0% 6.0%
Return on Assets 2.9% 2.9%
Ytd Mar. 2021
(Unaudited)
Ytd Mar. 2020
(Unaudited)
Revenue Growth -12.8% 1.9%
Net Margin 13.9% 12.4%
Net Income Growth 5.1% -15.7%
EBITDA (In Billions of Pesos) 23.3B 25.0B
Interest Cover 5.9x 6.0x
Current Ratio increased to 1.2 from 1.1 in 2020 due mainly to the 4.7% decrease in Current Assets vs.
17.4% decrease in Current Liabilities.
Solvency Ratio increased to 8.1% from 8.0% in 2020 due mainly to the 1.0% decrease in Net income after
tax and depreciation vs. 2.0% decrease in Total Liabilities.
Asset to Equity Ratio decreased to 2.1 from 2.2 in 2020 due mainly to the 0.3% decrease in Total Assets
compared to 1.8% increase in Total Equity.
Net Debt - Equity Ratio increased to 38:62 from 37:63 in 2020 due mainly to the 0.3% increase in gross
debt and a 22.0% decrease in cash and cash equivalents.
Revenue Growth decreased to -12.8% from 1.9% in 2020 due mainly to the significant drop in merchandise
sales, rental revenues and cinema ticket sales, amusement and others. 1Q-2020 is considered mostly “pre-
pandemic” since the community lockdowns started only in the 2nd half of March 2020.
Net Margin and Net Income Growth increased to 13.9% and 5.1% from 12.4% and -15.7%, respectively.
Profitability improved in 2021 due to intensive cost management and streamlining of operations for
efficiency.
EBITDA decreased by 7.1% due mainly to the P1.6 billion decrease in income from operations and
P0.2 billion decrease in depreciation. Interest Cover decreased to 5.9x from 6.0x in 2020 due to the 7.1% decrease in EBITDA vs. only 6.4% decrease in interest expense.
- 30 -
The manner by which the Group calculates the foregoing indicators is as follows: 1. Current Ratio Current Assets
Current Liabilities
2. Acid Test Ratio Current Assets less Inventories and Other Current Assets Current Liabilities
3. Solvency Ratio Net Income After Tax + Depreciation and Amortization
Total Liabilities
4. Asset to Equity Ratio Total Assets Total Equity
5. Debt – Equity Ratio
a. Gross Basis Total Interest-bearing Debt
Total Equity + Total Interest-bearing Debt
b. Net Basis Total Interest-bearing Debt less Cash and Cash Equivalents (excluding Cash on Hand), Time Deposits, Investment in Bonds Total Equity + Total Interest-bearing Debt less Cash and Cash Equivalents (excluding Cash on Hand), Time Deposits, Investments in Bonds
6. Revenue Growth Total Revenues (Current Period) - 1 Total Revenues (Prior Period)
7. Net Margin Net Income After Tax
Total Revenues
8. Net Income Growth Net Income Attributable to Owners of the Parent (Current Period) - 1 Net Income Attributable to Owners of the Parent (Prior Period)
9. Return on Equity Net Income Attributable to Owners of the Parent Average Equity Attributable to Owners of the Parent
10. Return on Assets Net Income after Tax
Total Assets
11. EBITDA Income from Operations + Depreciation & Amortization
12. Interest Cover EBITDA
Interest Expense
- 31 -
Expansion Plans / Prospects in 2021
For the rest of 2021, expansion and construction of malls, residential and commercial properties will
continue.
We plan to open new retail stores across our various formats mainly in the Food Group, and selectively in
the Non-Food Group.
We will pursue investments in new ventures as opportunities arise.
- 32 -
PART I FINANCIAL INFORMATION
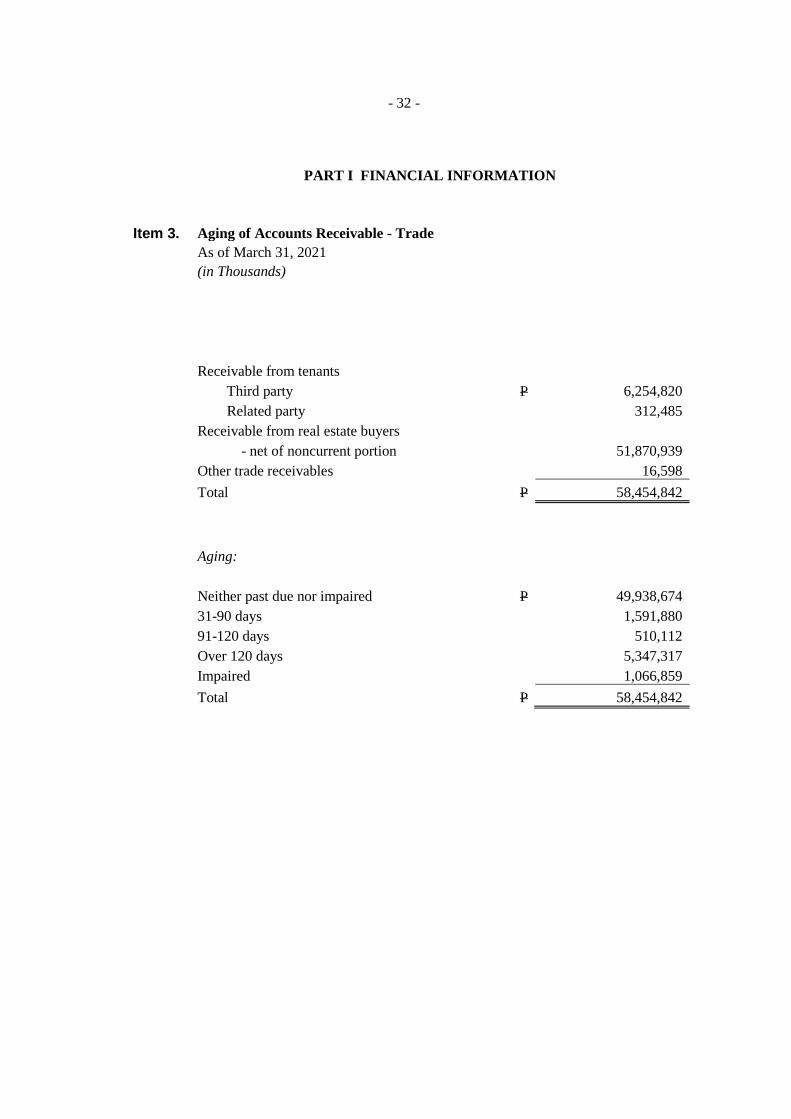
Item 3. Aging of Accounts Receivable - Trade
As of March 31, 2021
(in Thousands)
Receivable from tenants
Third party P 6,254,820
Related party 312,485
Receivable from real estate buyers
- net of noncurrent portion 51,870,939
Other trade receivables 16,598
Total P 58,454,842
Aging:
Neither past due nor impaired P 49,938,674
31-90 days 1,591,880
91-120 days 510,112
Over 120 days 5,347,317
Impaired 1,066,859
Total P 58,454,842
- 33 -
PART II - SIGNATURE
Pursuant to the requirements of the Securities Regulation Code, the issuer has duly caused this report to be
signed on its behalf by the undersigned thereunto duly authorized.
Registrant: SM INVESTMENTS CORPORATION
__________________________ Date: ____________ Franklin C. Gomez Senior Vice President – Finance Corporate Information Officer