

Structural Evolution of Ammonium Paratungstate During Thermal Decomposition
vorgelegt von Diplom-Chemikerin
Olga Kirilenko aus Weissrussland
Fakultät II - Mathematik und Naturwissenschaften
der Technischen Universität Berlin zur Erlangung des akademischen Grades
Doktor der Naturwissenschaften - Dr. rer.nat. -
genehmigte Dissertation
Promotionsausschuss: Vorsitzender: Prof. Dr. P. Hildebrandt Berichter/Gutachter: Prof. Dr. M. Lerch Berichter/Gutachter: Priv.-Doz. Dr. T. Ressler
Tag der wissenschaftlichen Aussprache: 4. Februar 2005
Berlin 2005
D 83

Table of contents
Zusammenfassung…………………………………………………………... 4 Abstract……………………………………………………………………… 5 Danksagung…………………………………………………………………. 6 1 Introduction…………………………………………………………………. 7 1.1 Motivation and strategy…………………………………………………….. 7 1.2 Chemistry of tungsten………………………………………………………. 111.2.1 Tungsten…………………………………………………………………….. 111.2.2 Tungsten oxide……………………………………………………………… 111.2.3 Tungsten bronzes…………………………………………………………… 131.2.4 Ammonium paratungstate (APT)………………………………………….. 151.2.5 Heteropolytungstate………………………………………………………… 161.3 The results of the study of APT decomposition from selected
publications…………………………………………………………………… 17
1.4 The investigation of WO3 with respect to its catalytic properties………... 18 2 Theoretical and Experimental Details……………………………………… 202.1 Introduction………………………………………………………………….. 202.2 X-ray Diffraction (XRD)…………………………………………………….. 202.2.1 Theory of XRD……………………………………………………………….. 202.2.2 XRD measurements………………………………………………………….. 212.2.3 Data evaluation………………………………………………………………. 222.3 X-ray absorption spectroscopy (XANES and EXAFS)……………………. 222.3.1 Theory of XANES and EXAFS……………………………………………… 222.3.2 XAS measurements…………………………………………………………... 262.3.3 Data evaluation………………………………………………………………. 282.4 Additional methods of characterization……………………………………. 292.4.1 TG/DSC………………………………………………………………………. 292.4.1a Theory of TG/DSC…………………………………………………………… 292.4.1b TG/DSC measurements……………………………………………………… 292.5 Electron microscopy…………………………………………………………. 30 3 Results………………………………………………………………………… 313.1 Characterization of ammonium paratungstate…………………………….. 313.2 Thermal decomposition of ammonium paratungstate (TG/DSC)………… 343.3 Thermal decomposition of ammonium paratungstate (in situ XRD and
XAS)…………………………………………………………………………… 37
3.3.1 Decomposition of APT in 20%oxygen………………………………………. 383.3.2 Decomposition of APT in reducing atmospheres…………………………... 403.3.3 Decomposition of APT in air (static conditions)……………………………. 413.4 Characterization of the decomposition intermediates and products……… 42 4 Discussion……………………………………………………………………… 53
2
4.1 Thermal decomposition of ammonium paratungstate……………………... 534.2 Decomposition of APT under partial oxidation reaction conditions………. 554.3 Comparison of the decomposition of APT and polyoxomolybdates………. 56 5 Conclusions…………………………………………………………………… 60 Ausblick………………………………………………………………………… 62 Index of figures………………………………………………………………… 63 Index of tables………………………………………………………………….. 66 Publication Index……………………………………………………………… 67 Lebenslauf……………………………………………………………………… 68 List of abbreviation and symbols……………………………………………... 69 References……………………………………………………………………… 71
3

„Die Strukturevolution von Ammoniumparawolframat während der thermischen Zersetzung“ Dissertation vorgelegt von Olga Kirilenko
Zusammenfassung
In der vorliegenden Arbeit werden Untersuchungen an Ammoniumparawolframat
(APW) vorgestellt. Die Zersetzung von Ammoniumparawolframat wurde mittels in situ
Röntgenabsorptionspektroskopie (XAS), in situ Röntgenbeugung (XRD) und
Thermogravimetrie (TG/DSC) untersucht. Beide in situ Methoden sind unter
Reaktionsbedingungen (katalytisch, oxidierend, reduzierend, inert) und mit simultaner
Analyse der Gasphase, durchgeführt worden. Von 300 K bis 650 K ist die Zersetzung von
APW von der Atmosphäre unabhängig. Während unter oxidierenden Bedingungen bei
773 K hauptsächlich als Produkt kristallines triklines WO3 erhalten wurde, bilden sich
unter mild-reduzierenden Bedingungen (Propen, Propen und Sauerstoff, und Helium)
teilweise reduzierte und stark ungeordnete Wolframbronzen. Es wurde keine weitere
Reduktion in Propen oder Helium beobachtet, was darauf hinweist, dass es starke
gehinderte Beweglichkeit von Sauerstoff in dem Kristallgitter von Wolframoxid gibt. In
H2-Atmospäre wurde WO2 und schließlich metallisches W als Endprodukt erhalten.
Während der thermischen Zersetzung von Ammoniumparawolframat finden die
hauptsächlichen Veränderungen bei ungefähr 500 K statt, verbunden mit kompletter
Strukturreorganisation, der Zerstörung des Polyoxowolframation von APW und der
Bildung von Wolframbronzen. Die relativ niedrige Temperatur der Bildung des
dreidimensional Gitter von WO3 im Vergleich zur thermischen Behandlung von
Polyoxomolybdaten deutet auf eine besondere strukturelle Stabilität in der Anordnung
der eckenverknüpten WO6 – Einheiten in WO3 und Wolframbronzen hin. Wolfram ist ein
potenzieller Struktur- und elektronischer Promotor in den Katalysatoren auf
Molybdänoxidbasis, muss allerdings bereits in einer fruehren Stufen der
Katalysatorpräparation in die geordnete Molybdänoxid Struktur inkorporiert werden.
4

„Structural Evolution of Ammonium Paratungstate During Thermal Decomposition“ dissertation by Olga Kirilenko
Abstract
In this work investigations on ammonium paratungstate (APT) are presented.
The bulk structural evolution during the decomposition of ammonium paratungstate in
various oxidizing and reducing atmospheres was elucidated by the complementary
techniques in situ XAS, in situ XRD, and TG/DSC combined with mass spectrometry. In
the temperature range from 300 K to 650 K, the decomposition of APT proceeds nearly
independent of the atmosphere employed. At higher temperature an oxidizing atmosphere
results in the formation of crystalline triclinic WO3 as the majority phase at 773 K while
mildly reducing atmospheres (propene, propene and oxygen, and helium) result in the
formation of partially reduced and highly disordered tungsten bronzes. No further
reduction is observed in propene or helium, indicating a strongly hindered oxygen
mobility in the tungsten oxide lattice in the temperature range employed. The
decomposition of APT in hydrogen results in the formation of WO2 and, eventually,
tungsten metal.
During the thermal treatment of APT, major changes occur at ~ 500 K where a
complete structural rearrangement takes place resulting in the destruction of the
polyoxotungstate ion of APT and the formation of a tungsten oxide bronze. The rather
low temperature for the formation of a three-dimensional lattice compared to the thermal
treatment of common polyoxomolybdate precursors indicates the lower stability of the
precursor and intermediates as ligands are removed. For tungsten to act as a potential
structural or electronic promoter in molybdenum oxide based catalysts, tungsten needs to
be incorporated in regular molybdenum oxide structures already at a very early stage of
the catalyst preparation.
5

Danksagung Diese Arbeit habe ich im Zeitraum Oktober 2001 bis November 2004 in der Abteilung
Anorganische Chemie des Fritz-Haber-Institut der Max-Planck-Gesellschaft in der
Arbeitsgruppe „Geometric Structure“ unter der Leitung von Dr. T. Ressler angefertigt.
Zuerst danke ich dem Leiter der Abteilung Anorganische Chemie, Hr. Prof. Dr. Robert
Schlögl, der die Arbeit durch viele Diskussionen und Anregungen unterstützt hat.
Mein besonderer Dank gilt Hr. Dr. Thorsten Ressler, der mich mit allen Methoden (XAS,
XRD, TG/DSC) vertraut machte und mit unermüdlicher Geduld die Entwicklung dieser
Arbeit begleitet hat. Dank ihm habe ich viele Geheimnisse der Chemie verstanden. Ich
danke ihm nicht nur für die grosse Hilfe in der Wissenschaft, sondern auch für „ständige
menschliche Unterstützung“. Er versteht immer, gute Ratschläge in vielen
Lebenssituationen zugeben. Während dieser drei Jahren habe ich nicht nur viel in Chemie
gelernt, sondern auch viel Lebenserfahrung gesammelt.
Herrn Prof. Dr. Martin Lerch danke ich für die Übernahme des Zweitgutachtens für diese
Arbeit.
Den Mitgliedern meiner Arbeitsgrupppe Dr. Frank Girgsdies, Dr. Rolf E. Jentoft, Edith
Kitzelmann, Benjamin Kniep, Alexandra Szizybalski, Eva Rödel, Jürgen Osswald danke
ich für die Hilfsbereitschaft und freundschaftliche Atmosphäre.
Die ehemalige Mitarbeiterin unserer Arbeitsgruppe Dr. Julia Wienold sei für ständige
Unterstützung herzlich gedankt.
Ich danke auch allen Mitarbeitern des Fritz-Haber-Instituts für die angenehme und
kollegiale Atmosphäre.
Ich danke auch ganz herzlich meinen Eltern und dem Bruder, da ihre Liebe mir immer
viel Kraft gegeben hat, um meine Ziele zu verwirklichen.
6

1 Introduction
1.1 Motivation and strategy
Catalytic processes posses a prominent role in the society. The majority of all
chemicals and fuels produced in the chemical industry were in contact with one or more
catalysts. Catalysis becomes also progressively more important in environmental
pollution control. Stoichiometric processes, which generate waste problems, are more and
more replaced by selective catalytic routes.
Heterogeneous catalysis is a mixture of engineering and science. In fact, much of
the catalyst development since the beginning of this century has used a catalyst screening
process, where literally thousand of catalyst were evaluated for their activity and
selectivity.
Van Santen [1] identifies three levels of research in catalysis. The macroscopic
level is the world of reaction engineering, test reactors and catalysts beds. Questions
concerning the catalyst deal with such aspects as activity per unit volume and mechanical
strength. The mesoscopic level consists of kinetic studies, activity per unit surface area,
and the relation between the composition and structure of a catalyst versus in catalytic
behavior. Many investigations belong to this category. Finally, the microscopic level is
that of fundamental studies and deals with the details of adsorption on surfaces, reaction
mechanisms, theoretical modeling and surface science.
Almost without exception, the solid state catalysts used industrially exhibit
surface area that are seldom less than 10 and occasionally more than 300 m2/g. In
general, catalysts are microcrystalline and are often multicomponent. Some important
catalysts consist of several distinct phases, and in such materials one can find many
different elements in various states of oxidation and combination.
Several approaches can be adopted to investigate fundamental relations between
the state of a catalyst and its catalytic properties. One would be to model the catalytic
surface with that of single crystal. By using the appropriate combination of surface
spectroscopies, the desired characterization on the atomic scale is certainly possible in
favorable cases. The disadvantage, however, is that although one may be able to study the
catalytic properties of such samples under realistic conditions (pressures of 1 bar or
7
higher), most of the characterization is necessarily carried out in UHV, and not under
reaction conditions. The other approach is to study real catalysts with in situ techniques
such as IR and Mössbauer spectroscopy, EXAFS and XRD, either under reaction
conditions, or under a controlled environment after quenching the reaction. The catalytic
properties of a surface are determined by its composition and structure on the atomic
scale. Thus, it is not sufficient to know that a surface consists of a metal and a promoter,
but it is essential to know the exact structure of the catalytically active surface, including
defects, steps, etc. as well as the exact location of the promoter atoms. Hence, from a
fundamental point of view, the ultimate goal of catalyst characterization is to look at the
surface of atomic scale under reaction conditions, i.e. in situ. [2]
Selective heterogeneous oxidation catalysis is of vital importance to the well
being of society, since it produces about 25 % of the most important industrial organic
chemicals and intermediates used in the manufacture of industrial products and consumer
goods. The products include such intermediates as acrolein, acrylic acid, acrylonitril,
methacrylic acid, maleic anhydride, phtalic anhydride, ethylene and propylene oxide.
Thus, it is highly important to further develop not only the performance of such industrial
processes but also the fundamental understanding of such multielement and multiphase
catalysts, e.g. the role of each phase and their interaction under catalytic action. This
information is prerequisite for future material science tailoring of molecularly defined
selective catalysts.
Molybdenum oxide based catalysts are extensively employed for the partial
oxidation of light alkanes and alkenes. [3, 4, 5, 6, 7, 8] Binary molybdenum oxides have a
limited catalytic applicability, mostly because of their tendency to readily transform into
less active molybdenum trioxide, MoO3, under reaction conditions. Thus, in order to
prevent the decomposition and deactivation of particularly active binary molybdenum
oxides, it would be desirable to stabilize the active nanostructure with the substitution of
some of the molybdenum by additional metal centres such as vanadium, niobium, or
tungsten. These MoVW mixed oxide catalysts have been improved over the years by
adding more and more promoters. [9, 10, 11, 12, 13, 14, 15, 16, 17, 18, 19] In these
works different oxide species are reported to be part of the active phase system in these
catalysts. Andrushkevich [13] revealed MoO3 and V2O4 as major components of the V-
8
Mo-O-catalysts and reported that the catalytic activity is related to the content of V4+.
Tichy et al. [12] identified VMo3O11, whereas Adams et al. [18] concluded that the
presence of hexagonal (V, Mo)O3 is important for the formation of active phases, but
concerning the low selectivity and activity of the examined vanadium molybdenum oxide
system. A third metal component is necessary for an efficient catalyst. (MoVW)5O14 with
Mo5O14 like structure is proposed as active phase in [16, 17]. The structure of this oxide
is built up by pentagonal bipyramids and octahedrally coordinated metal centers. [20] At
the same time binary molybdenum-based oxides doped with different elements such as
Nb, W and Ta have been synthesized and their structures have been identified as those of
the Mo5O14 type. [21] These phases were found to be stable at a wide temperature range
and a broad variation of the element ratios.
The Mars-van Krevelen mechanism is proposed for selective partial oxidation
reactions and describes the role of the so-called, active “lattice” oxygen for selective
partial oxidations. [22] The real metal-oxygen stoichiometry and defect structure of
molybdenum oxides thus may play an important role in selective partial oxidation
reactions. Because since the redox activity of the catalyst requires metal centers in
intermediate oxidation states during the turnover, and the activity of a metal-oxo site is
high only at high oxidation states of the metal site, it is evident that the successful
catalyst must either exhibit different surface sites performing different parts of the
reaction network or that each site must be flexible in its electronic structure without being
geometrically destabilized. [53]
In particular, V and W are known to stabilize Mo5O14 type structures, which are
likely candidates for the active phase in mixed molybdenum oxide catalysts (e.g.
MoVNbTeOx catalysts), while V can exhibit multiple valence states and may participate
in the active site of the partial oxidation catalyst (electronic promoter), W is believed to
be a structural promoter stabilizing particular molybdenum oxide structures. Mixed
molybdenum oxide catalysts are commonly prepared by chemically or physically mixing
suitable catalyst precursors. In order to prepare and stabilize the appropriate
molybdenum oxide phase, the behaviour of the catalyst precursors during thermal
treatment needs to be elucidated. As a common precursor for the preparation of
molybdenum oxides, AHM exhibits a rich dependence of the decomposition
9

intermediates and products on the treatment conditions (i.e. atmosphere, flow rate, and
heating rate). This enables a knowledge-based preparation of particular molybdenum
oxide materials by selecting an appropriate calcinations procedure.
Ammonium paratungstate (APT) is a common precursor for the preparation of
(Mo, W) mixed oxides. Because of their reduced complexity compared to the industrially
employed catalysts, these oxides constitutes suitable model systems that can reveal the
structure-activity relationships of mixed oxides under reaction conditions and, moreover,
the dependence of the microstructure of the active catalyst on the various preparation
conditions. [23] The structural evolution of ammonium heptamolybdate (AHM) [24] and
heteropolyoxomolybdates [25] during thermal activation has been thoroughly
investigated. Therefore, investigations of the decomposition of APT are required to
identify and quantify tungsten oxide phases and their formation under various
atmospheres, and to reveal correlations between catalytic activity and the structural
evolution of APT.
In this work the decomposition of APT is studied with in situ X-ray diffraction
(XRD) and in situ X-ray absorption spectroscopy (XAS) to reveal the influence of
different treatment parameters on the decomposition process, and to provide a detailed
analysis of the short-and long-range structure evolution during the treatments. The
decomposition of APT is studied in various oxidative and reductive atmospheres
(oxygen, propene and oxygen, helium, propene and hydrogen) and the structural changes
detected are discussed and compared with the mechanism of the decomposition of
common polyoxomolybdates.
10

1.2 Chemistry of the tungsten
1.2.1 Tungsten
The electronic configuration of the element W: [Xe]4f145d46s2.
Tungsten has the highest mp (melting point) of all metals (3410°C) – indeed, of
all elements except carbon. For this reason, metallic W is fabricated by the techniques of
powder metallurgy.
Tungsten occurs in the form of the tungstates, scheelite, CaWO4, and wolframite
(Fe,Mn)WO4. [26]
Preparation: 1) CaWO4 + 2HCl Ø CaCl2 + WO3 * H2O
600°C
(NH4)10H2W12O42 * 4H2O → WO3
800° C
2) WO3 + 3H2 Ø W + 3H2O
1.2.2 Tungsten oxides
WO3 is known in different polymorphic forms, but above 900°C, the cubic WO3
structure is that of ReO3. The structures of the other polymorphs are distortions of the
ReO3 structure. ReO3 is made up of [ReO6] octahedra that are linked together via their
corners. Within the layer, any octahedron is linked to four other; it is also linked, via its
upper and lower corners, to octahedra in the layers above and below. As six oxygens
surround each W the overall formula is WO3 (see Figure1.1). The melting point of WO3 is
1473°C. The sequence of temperature phase transition for WO3 is given in Table 1: [27].
11

Figure 1.1 The overview of the structure of triclinic tungsten trioxide.
Table 1.1 The phase diagram of WO3.
Phase T, K a, Å b, Å c, Å α β γ
monoclinic 130-220 5.15 5.05 7.63 90.0 92.6 90.0
monoclinic 290-600 7.30 7.49 7.32 89.8 90.1 90.0
triclinic 280-870 7.18 7.36 7.63 88.0 90.5 90.4
tetragonal 870-1100 5.31 5.31 3.91 90.0 90.0 90.0
Tungsten trioxide is acidic and dissolves in aqueous alkali and forms the WO42-
ion. WO3 is insoluble in water, has no appreciable oxidizing properties, and constitutes
the final product of the oxidation of the metal. Tungsten dioxide WO2 (brown), possessed
the rutile structure, is formed by reduction of the trioxide with hydrogen.
Thermal treatment of WO3 causes disproportionation:
3WO2 → W+ 2WO3
If WO3 is heated in vacuo or is heated with the powdered metal, reduction occurs until
eventually WO2 with a distorted rutile structure is formed. Between WO3 and WO2,
however, lies a variety of intensely colored (usually violet or blue) phases whose
structural complexity has excited great interest over many years. Following the pioneer
work of the Swedish chemist A Magneli in the late 1940s these materials, which were
originally thought to consist of a comparatively small number of rather grossly
nonstoichiometric phases, are now know to be composed of a much larger number of
12
distinct and accurately stoichiometric phases with formulae such as W18O49 and W20O58.
[28] As oxygen is progressively eliminated, a whole series of WnO3n-1 stoichiometries is
feasible between the WO3 structure containing corner-shared WO6 octahedra and the
rutile structure consisting of edge-shared WO6 octahedra. These are produced as slabs of
corner-shared octahedra move so as to share edges with the octahedra of identical
adjacent slabs. This is phenomenon of crystallographic shear and occurs in an ordered
fashion throughout the solid. The reason for the formation of these intermediate phases is
by no means fully understood but, although their “nonstoichiometric” M : O ratios imply
mixed valence compounds, their largely metallic conductivities suggest that the electron
released as oxygen is removed are in fact delocalized within a conduction band
permeating the whole lattice.
1.2.3 Tungsten bronzes
The term bronze is applied to metallic oxides that have a deep color, metallic
luster, and are either metallic conductors or semiconductors. The sodium-tungsten
bronzes, NaxWO3, have colors that range from yellow to red and deep purple, depending
on the value of x. WO3 has the rhenium oxide (ReO3) structure, with WO6 octahedra
joined through the corners. The structure contains a three-dimensional network of
channels throughout the structure and it has been found that alkali metals can be
incorporated into the structure in these channels. The resultant crystal structure depends
on the proportion of alkali metal in the particular compound. The structures are based on
three main types: cubic phases where the alkali metal occupies the centre of the unit cell
(similar to perovskite) and tetragonal and hexagonal phases. An overview of the structure
of hexagonal ammonium bronze (N H4)0.25WO3 is presented in Figure 1.2.
13
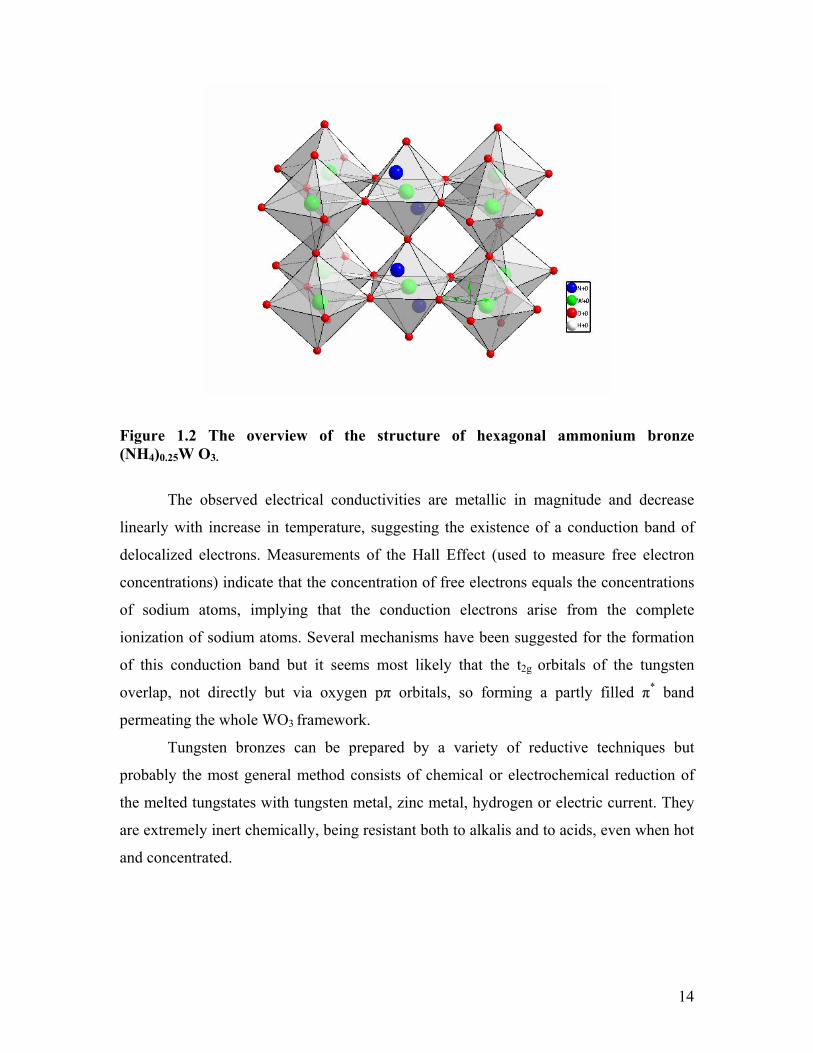
Figure 1.2 The overview of the structure of hexagonal ammonium bronze (NH4)0.25W O3.
The observed electrical conductivities are metallic in magnitude and decrease
linearly with increase in temperature, suggesting the existence of a conduction band of
delocalized electrons. Measurements of the Hall Effect (used to measure free electron
concentrations) indicate that the concentration of free electrons equals the concentrations
of sodium atoms, implying that the conduction electrons arise from the complete
ionization of sodium atoms. Several mechanisms have been suggested for the formation
of this conduction band but it seems most likely that the t2g orbitals of the tungsten
overlap, not directly but via oxygen pπ orbitals, so forming a partly filled π* band
permeating the whole WO3 framework.
Tungsten bronzes can be prepared by a variety of reductive techniques but
probably the most general method consists of chemical or electrochemical reduction of
the melted tungstates with tungsten metal, zinc metal, hydrogen or electric current. They
are extremely inert chemically, being resistant both to alkalis and to acids, even when hot
and concentrated.
14
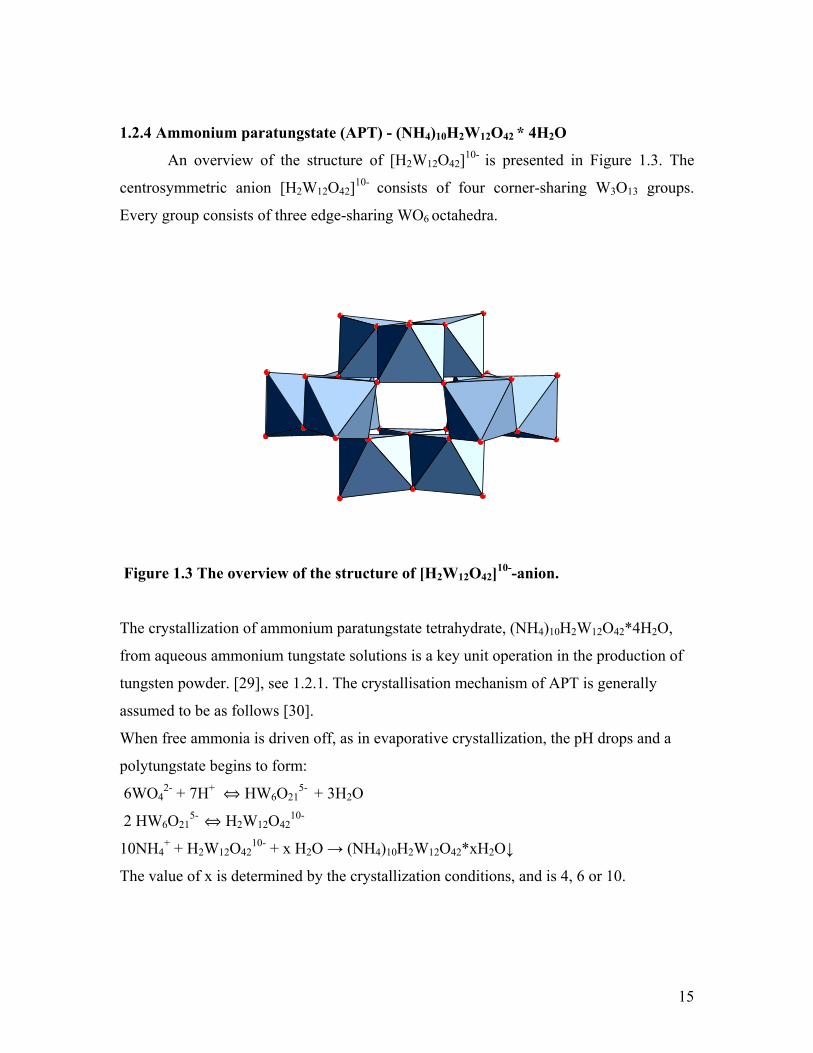
1.2.4 Ammonium paratungstate (APT) - (NH4)10H2W12O42 * 4H2O
An overview of the structure of [H2W12O42]10- is presented in Figure 1.3. The
centrosymmetric anion [H2W12O42]10- consists of four corner-sharing W3O13 groups.
Every group consists of three edge-sharing WO6 octahedra.
Figure 1.3 The overview of the structure of [H2W12O42]10--anion.
The crystallization of ammonium paratungstate tetrahydrate, (NH4)10H2W12O42*4H2O,
from aqueous ammonium tungstate solutions is a key unit operation in the production of
tungsten powder. [29], see 1.2.1. The crystallisation mechanism of APT is generally
assumed to be as follows [30].
When free ammonia is driven off, as in evaporative crystallization, the pH drops and a
polytungstate begins to form:
6WO42- + 7H+ ‹ HW6O21
5- + 3H2O
2 HW6O215- ‹ H2W12O42
10-
10NH4+ + H2W12O42
10- + x H2O → (NH4)10H2W12O42*xH2O↓
The value of x is determined by the crystallization conditions, and is 4, 6 or 10.
15
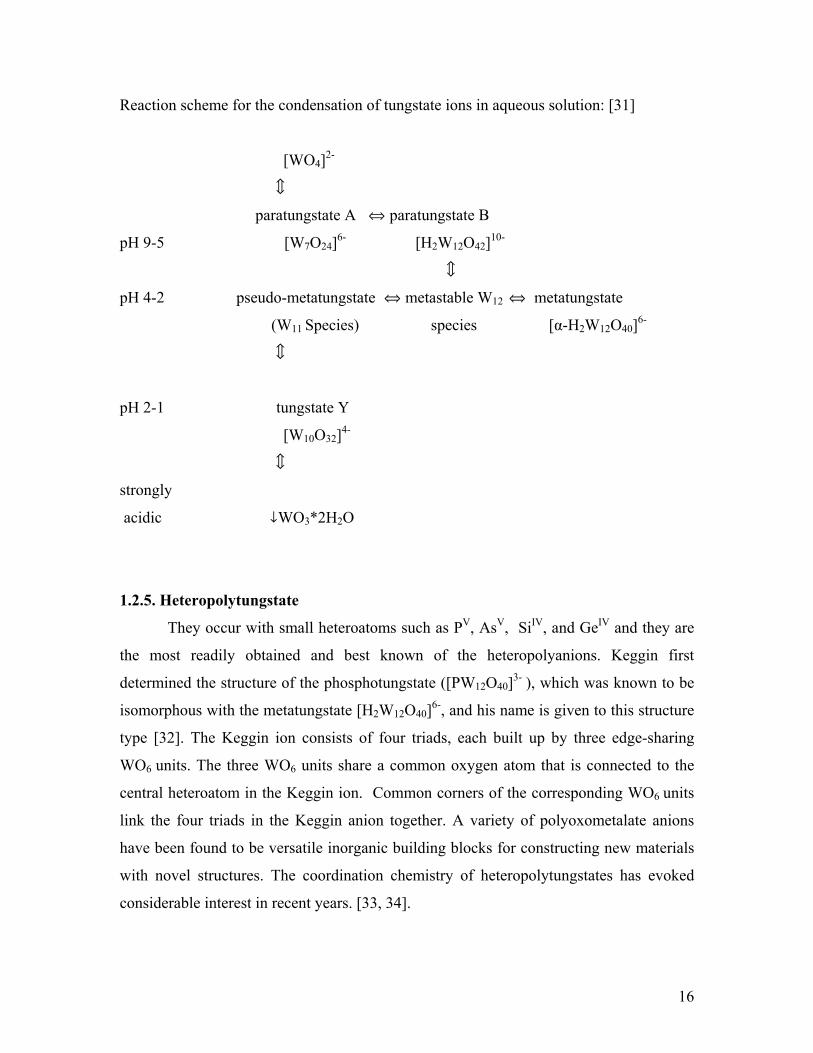
Reaction scheme for the condensation of tungstate ions in aqueous solution: [31]
[WO4]2-
ë
paratungstate A ‹ paratungstate B
pH 9-5 [W7O24]6- [H2W12O42]10-
ë
pH 4-2 pseudo-metatungstate ‹ metastable W12 ‹ metatungstate
(W11 Species) species [α-H2W12O40]6-
ë
pH 2-1 tungstate Y
[W10O32]4-
ë
strongly
acidic ∞WO3*2H2O
1.2.5. Heteropolytungstate
They occur with small heteroatoms such as PV, AsV, SiIV, and GeIV and they are
the most readily obtained and best known of the heteropolyanions. Keggin first
determined the structure of the phosphotungstate ([PW12O40]3- ), which was known to be
isomorphous with the metatungstate [H2W12O40]6-, and his name is given to this structure
type [32]. The Keggin ion consists of four triads, each built up by three edge-sharing
WO6 units. The three WO6 units share a common oxygen atom that is connected to the
central heteroatom in the Keggin ion. Common corners of the corresponding WO6 units
link the four triads in the Keggin anion together. A variety of polyoxometalate anions
have been found to be versatile inorganic building blocks for constructing new materials
with novel structures. The coordination chemistry of heteropolytungstates has evoked
considerable interest in recent years. [33, 34].
16

1.3 The results of the study of APT decomposition from selected publications
The thermal decomposition of APT (NH4)10H2W12O42 * 4H2O has been
investigated by numerous authors employing a variety of methods. [35, 36, 37, 38, 39,
40, 41, 42, 43, 44, 45, 46, 47, 48]. Thermal analysis studies [44] combined with in situ
Fourier transform infrared (FT-IR) spectroscopy [43] identified WO3 as the product of
decomposition at temperatures above ~ 650 K. The mechanism of thermal decomposition
of APT in air has been studied by X-ray diffractometry, thermogravimetry, and infrared
and UV-Vis diffuse reflectance spectroscopies. [45] Ammonium tungsten bronze,
(NH4)0.33WO3, and hexagonal WO3, were identified in the calcination product of APT at
673 K for 2 h in a static atmosphere of air. On heating up to 770 K, the bronze together
with hexagonal WO3 transformed completely into triclinic tungsten trioxide.
In more detail, the decomposition of APT in air has been studied by in situ Laser
Raman spectroscopy (LRS) combined with thermal gravimetric analysis (TG),
differential thermal analysis (DTA), and X-ray diffraction (XRD). [46] It was found that
the decomposition in air proceeds through three steps in the temperature ranges of 300 -
473 K, 473 - 623 K and 623 - 773 K. The formation of WO3 was detected at temperatures
above 623 K. Besides studies in air, the thermal decomposition of APT was also
investigated in hydrogen. [47], [48] In the temperature range from 470 to 520 K, APT
was found to decompose into (NH4)0.33WO3. (NH4)0.33WO3 is stable in the temperature
range from 520 to 840 K, and is subsequently reduced to a mixture of WO2 and tungsten
metal at 870 K, while complete reduction to tungsten metal is achieved at about 1000 K.
In total, although the decomposition of APT has been investigated before, several open
questions remain as to the sequence of the formation of intermediates, their
characterization, and the dependence of the decomposition pathways on the reaction
atmospheres for catalytically relevant gas phases (e.g. propene, and propene and oxygen).
17

1.4. The investigation of WO3 with respect to its catalytic properties
Molybdenum oxide-based catalysts are extensively employed for the partial
oxidation of alkenes. A comprehensive review on selective oxidation on metal oxide
catalysts including molybdenum oxides and molybdenum-containing binary oxides was
recently published by Grzybowska-Swierkosz [49] and refers to a number of other review
articles on the same subject. [50, 51] At least seven fundamental principles important to
selective heterogeneous oxidation catalysis can be enumerated. These seven principles
encompass the importance played in selective heterogeneous oxidation catalysts by lattice
oxygen, metal-oxygen bond strength, host structure, redox, multifunctionality of active
sites, site isolation, and phase cooperation. Grasselli has referred to these principles on
occasion as the “seven pillars” of selective heterogeneous oxidation catalysis. [52]
According to R. Schlögl, multifunctionality refers to the ability of a catalyst to chemisorb
and activate a hydrocarbon molecule that is often unfunctionalized and its concomitant
ability to abstract hydrogen and add or insert oxygen or nitrogen atoms into the activated
molecule. [53]
There has recently been much discussion about the role, which crystallographic
shear (CS) planes may play, in the catalytic behaviour of certain oxides. [54, 55]
O’Keeffe has suggested that CS planes may greatly facilitate the transport of oxygen
through the lattice. [60] Metal oxide lattices containing cations from groups IV, V, VI,
which are able to form CS structures, possess the ability to switch readily from a corner-
to an edge-sharing or an edge- to face-sharing linkage of metal oxygen polyhedra, thus
making an oxygen atom available for reaction. Calculations on the stability and formation
energy of CS planes in WO3 –like structures have been made by Iguchi and Tilley. [56,
57] They have shown that an important factor in determining the stability of one
particular CS plane geometry over another is the elastic strain in the crystal.
Tungsten trioxide, WO3, has been investigated with respect to its catalytic
properties in a variety of reactions. [58, 59, 60, 61, 62, 63, 64] The selective oxidation of
propene to acrolein has been studied on two series of mixed molybdenum tungsten oxide
catalysts. [63, 64] The first series of oxides exhibits the typical WO3 type structure
consisting of corner-sharing WO6 units and the general formula MoxW1-xO3 (x = 0.4 -
0.9). The second series, with a general formula (MoxW1-x)nO3n-1 (x = 0.4 - 0.9; n = 8-14),
18

possesses crystallographic shear structures. Members of the latter series showed a higher
conversion and selectivity than the corresponding members of the first series. Selectivity
was found to decrease as the tungsten content increased and as the density of
crystallographic shear planes decreased. In situ oxidation of the reduced molybdenum
oxide series of catalysts (MoxW1-x)nO3n-1 resulted in little change in selectivity but a
significant decrease in conversion.
19

2 Theoretical and experimental details
2.1 Introduction
The temperature programmed decomposition of ammonium paratungstate was
studied by in situ X-ray diffraction (XRD), X-ray absorption spectroscopy (XAS) and
thermal analysis (TG/DTA). The structure of the resulting materials, the morphology, and
the size of the particles were determined by scanning electron microscopy (SEM) and by
high-resolution transmission electron microscopy (HRTEM).
X-ray diffraction (XRD) and X-ray absorption spectroscopy (XAS) can be used to
provide bulk structural information of systems. The combination of both experimental
techniques offers the advantage of probing the bulk structure on two different length
scales i.e. long-range (50 Ǻ - 1000 Ǻ) and short range-order (< 6 Ǻ). In that respect both
methods complement each other as XRD gives crystallographic information and the unit
cell parameters, whereas XAS gives information of the coordination sphere of next
nearest neighbor around an absorbing atom. While XRD is applicable for investigating
crystalline solids, XAS is also applicable for investigating amorphous materials that
exhibit no long-range order.
2.2 X-ray Diffraction (XRD)
2.2.1 Theory of XRD
The periodic three dimensional arrays of atoms in a crystal solid scatters X-rays
coherently leading to a constructive interference at specific angles (i.e. diffraction in
analogy to optics). The first description of the diffraction of X-rays by crystals was
developed by Max von Laue. [65] In 1913 W.H. Bragg and his son developed a simpler
way of predicting diffraction phenomena in crystals assuming reflection of X-rays from
crystallographic planes. The scattered X-rays of each lattice planes interfere
constructively with each other if the path difference ∆l is a multiple integer of the
wavelength. This is described by the Bragg equation: [66]
∆l = 2 · dhkl · sin θhkl = n · λ
20

It relates the spacing between the crystal planes, dhkl, to the particular Bragg
angle, θhkl, at which reflections from these planes are observed. In Figure 2.1 a simple
crystal is depicted. The path difference between the waves scattered by atoms from
adjacent (hkl) lattice planes of spacing dhkl is given by the sum of AB and BC.
With X-ray diffraction the reflection only occurs when the conditions for
constructive interference are fulfilled. A finely ground crystalline powder contains a very
large number of small crystallites, which are oriented randomly to one another. If such a
sample is placed in the path of a monochromatic X-ray beam, diffraction will occur from
planes in those crystallites which happen to be oriented at the correct angle to fulfill the
Bragg condition. The diffracted beams make an angle of 2θ with the incident beam. In
practice, the sample is rotated to bring as many planes as possible into the diffracting
condition.
Figure 2.1 The reflectance of the X-rays at the lattice planes of the crystal Bragg equation: AB = BC = dhkl sinθ
2.2.2 XRD measurements
In situ XRD studies were performed with a STOE Bragg-Brentano diffractometer
(Ge secondary monochromator, Cu Kα radiation), equipped with a Bühler HDK S1 high
temperature cell (400 ml) (Figure 2.2). The product composition in the gas phase was
continuously monitored using a mass spectrometer in a multiple ion detection mode
21

(QMS 200 from Pfeiffer). XRD measurements were conducted in a temperature range
from 323 K to 773 K with an effective heating rate of 0.1 K/min. Diffraction patterns
were recorded every 25 K in a two theta range from 5 to 50°.
B A
Figure 2.2 The schematic setup of a STOE Bragg-Brentano diffractometer equipped with a Bühler HDK S1 high temperature cell (A) and the detail view of the high-temperature cell (B).
2.2.3 Data evaluation
Analysis of experimental diffraction patterns was performed using the software
TOPAS (Bruker AXS) Version 2.1. The ICDD-PDF (International centre for diffraction
data) database [67] and the ICSD (Inorganic crystal structure database) [68] were used
for phase analysis and structure refinement. Crystallite sizes were estimated by using the
Scherrer equation. [69]
2.3 X-ray absorption spectroscopy (XANES and EXAFS)
2.3.1 Theory of XANES and EXAFS
X-ray absorption spectroscopy (XAS) is a powerful technique that provides
element specific structural information. [70] XAS probes the local order and, hence, can
be applied to structurally disordered and ordered solids. Similar to XRD, X-ray
22

absorption spectroscopy in the hard X-ray regime (5.0 keV to 40 keV) can be performed
in situ under working conditions (p ≥ 1 bar, T = 293-573 K).
In the absorption of X-rays by matter the following basic model can be applied.
When the energy of the incoming photons is high enough to excite an electron from a
deeper core level to a vacant excited state or to the continuum a sharp increase in the
absorption coefficient µ (E), known as the absorption edge, occurs. X-ray absorption
spectra exhibit a smooth decreasing intensity towards higher energy. When the electrons
are in the most tightly bound n = 1 shell the edge is called the K-edge. For the next most
tightly bound shell of atoms the corresponding edges are named the L-edges.
X-ray absorption spectra are commonly separated into several parts according to
the spectral region. The so-called “X-ray absorption near edge structure“ (XANES),
refers to a region that begins before the absorption threshold E0 and extends to about 40
eV. The “Extended X-ray absorption fine structure“ (EXAFS) exhibits a modulation in
total absorption with the energy of the incident photon which extends to several hundred
eV above the absorption edge. EXAFS contains information on the atomic surroundings
of the center atom. X-ray absorption in the photon energy range up to 40 keV, the range
of most importance for EXAFS, is dominated by photoelectron absorption where the
photon is completely absorbed, transferring its energy to excite a photoelectron and
leaving behind a core hole in the atom. Assuming that all the absorbed photon energy
goes into exciting a single core electron, the kinetic energy of the excited photoelectron is
given by the difference between the photon energy and the electrons binding energy in
the atom. When the photoelectron has about 15 eV or greater kinetic energy (i.e., for
photon energies of 15 eV or more above the edge), this energy is large compared with its
interaction energy with the surrounding atoms (~3 eV). In that case the interaction with
the surrounding medium can be treated as a perturbation about an isolated atom.
Obviously, only the final state of the photoelectron is perturbed by the surroundings. A
deep core level, the initial state, is unaffected to a very good approximation.
For an isolated atom the photoelectron can be represented as an outgoing wave.
The surrounding atoms will scatter the outgoing waves. The final state is the
superposition of the outgoing and scattered waves. The absorption of the rays is given
quantum mechanically by a matrix element between the initial and final states. In this
23

case the initial state is the electron in the atomic core and the final state is the electron
excited to the escaping photoelectron.
As aforementioned, for higher kinetic energies of the ejected photoelectron, scattering by
neighboring atoms occurs (EXAFS-region). The outgoing wave is spherical, and is
scattered by all atoms surrounding the absorbing atom (the absorber). Both destructive
and constructive interference processes occurs between the wave function of the outgoing
electron and its scattered parts, leading to a modulation of the absorption coefficient. The
position of maxima and minima in the resulting interference is energy dependent. As a
consequence, there is a relation between the energy of the ejected electron and the
distance between absorber and scatterer. The interference pattern varies between
construction or destruction as determined by the path length of both waves which itself is
a function of the distance of two neighboring atoms. Therefore the oscillatory part of the
EXAFS contains information about the local structure around the absorbing atom.
The EXAFS function χ(k) is defined as the relative difference between the
measured absorption µ (k) and the atomic absorption µo (k):
µ(k) - µo(k)
χ(k) =
µo(k)
The EXAFS equation in the single scattering, plane wave approximation can be written
as: [71]
χ(k) = ΣNjSi(k)Fj(k)
Nj-number of atoms in the jth sh
Si-amplitude reduction factor;
Fj(k)-the magnitude of the back
σj2- relative mean square disor
factor);
-2σj2k2
e
ell;
scattering a
der betwee
-2rj/λj(k)
emplitude of
n the abso
sin(2krj+φij(k))
the jth neighbour;
rber and an atom (Debye Waller
24
krj2
k- the photoelectron wavenumber;
λ-mean free path of the photoelectron;
φij(k)-phase shift due to the atomic potentials.
r-distance
A Fourier transform (FT) of the EXAFS with respect to the photoelectron
wavenumber peaks at distances corresponding to the nearest-neighbor coordination shells
of atoms. The conventional analysis of the EXAFS modulations contains several well-
documented steps. For disordered materials the Debye-Waller factor takes into account
the fact that a spread in distance exists in the material due to thermal and structural
disorder. The thermal disorder is induced due to the thermal lattice vibrations of the
atoms at higher temperature. Static disorder of the solid is encountered if atoms of the
same coordination shell have slightly different distances to the central atom.
A major improvement of analyzing the X-ray absorption spectra has been
achieved by ab initio calculations of multiple scattering processes. [72] The consideration
of multiple scattering processes is essential beyond the first shell for the determination of
the local structure. Using theoretical backscattering phases and amplitude calculated with
the ab initio code FEFF [73] the EXAFS analysis can by reliably carried out to 6 Å.
Hence, EXAFS analysis is no longer restricted to the first shell and the use of reference
compounds.
The XANES part of the spectrum is characterized by electron transitions and
multiple-scattering events. The fine structure in the XANES is sensitive to changes in the
local density of states and the spatial arrangement of scatters around the absorber, hence,
the edge region can provide information on the geometry of scatterers. A complete
analysis of all multiple scattering paths that contribute to this fine structure yields the
geometry of the scatters around the absorber. [74] In addition, XANES analysis can
provide information of the average valence of the catalyst system investigated due to the
energy shift of the edge energy which proves useful in characterizing catalysts under
reducing or oxidizing atmospheres. Furthermore, it is possible to simulate the near edge
part of the absorption spectrum with a linear combination of the XANES of reference
compounds. It is assumed that the absorbance in a set of spectra can be modeled as linear
25

sum of individual components. A principal component algorithm (PCA) can be used to
determine the number and type of probable species yielding a quantification of phase
mixture. Moreover, the available time-resolution for XAS experiments in the quick-
scanning EXAFS modes (QEXAFS) makes dynamical structural investigations (e.g.
kinetic studies) of solid state processes feasible. [75]
In summary X-ray absorption spectroscopy (XAS) is very well suited to study
catalysts and probing the local structure around a particular element at temperature and
pressure. The information on the short and medium order range obtained by XAS (e.g.
type and number of neighbors, distance between atoms, and disorder) together with the
long-range order (e.g. crystallite size and microstrain) determined by XRD enables a
more detailed description of the bulk structure of a "real" catalyst system.
2.3.2 XAS measurements
X-ray absorption experiments can be carried out in different experimental set-up
using synchrotron radiation. The XAS experiments described in this work were
performed in the transmission geometry at the Hamburger Synchrotronstrahlungslabor,
HASYLAB. A schematic set-up of a typical beamline is depicted in Figure 2.3.
DORISwhit
e_sli
tref
l_slit
exit_
slit
plane mirror
IC1 IC2 IC3
Figure 2.3 The schematic setup of a typical beamline.
Different optical elements are required to obtain a monochromatic and focused X-
ray beam. In transmission experiments, the intensity of the incident beam I0 and the
26

transmitted I1 beam are measured by an ionization chamber. A reference sample (usually
metal foils of the elements investigated), placed between the second and the third
ionization chamber (I3) is used as an internal standard for energy calibration. The
absorption is calculated from:
µdsample = ln ( I0/ I1)
Transmission X-ray absorption spectra were measured in situ with the sample
pellet in a flow reactor (4 ml total volume) under a controlled reactant atmosphere. [76]
In situ XAS experiments were performed at the W LIII edge (10.204 keV) (HASYLAB,
beamline X1), using a Si (311) double crystal monochromator. Temperature
programmed decomposition of APT was conducted at temperatures between 293 and 773
K in helium, 5% hydrogen in helium, 20% oxygen in helium, 10% propene in helium,
and 10% propene and 10% oxygen in helium. For the in situ XAS measurements 4 mg
APT were mixed with 30 mg boron nitride and pressed into pellets of 5 mm in diameter
(edge jump of ~ ∆µx ≈ 1.5 at the W LIII edge). The gas phase composition was
continuously monitored using a mass spectrometer in a multiple ion detection mode.
(Omnistar, Pfeiffer).
A schematic setup of the in situ XAS-cell operated in the transmission geometry
is depicted in figure 2.4.
Figure 2.4 The schematic setup of the in situ geometry (A) and the photographic view of transmission geometry (B).
Al-windowAl-window
Gas flow controlle
M
Exhaust
ThermocoupleA
Heating wireSample
X-ray
B
XAS-cell operated in transmission the in situ XAS-cell operated in
27

2.3.3 Data evaluation
Data analysis of the XAFS spectra was performed using the software WinXAS
3.0. [77] The spectra were energy calibrated with respect to a tungsten metal foil
reference spectrum. For background subtraction and normalization first order
polynomials were refined to the pre-edge and EXAFS region. Spectra were converted to
k space using an E0 defined as the first inflection point in the W LIII edge. Atomic
absorption, µo, fitting was performed using a cubic spline with 7 knots to minimize peaks
at low R values (< 1 Å) in the Fourier transformed EXAFS χ (k).
The pseudo radial distribution function FT(χ(k)*k3) was calculated by Fourier
transforming the k3-weighted experimental χ(k) function, multiplied by a Bessel window,
into the R space. EXAFS data analysis was performed using theoretical backscattering
phases and amplitudes calculated with the ab-initio multiple-scattering code FEFF7. [73]
Single scattering and multiple scattering paths in monoclinic APT, hexagonal
(NH4)0.25WO3 (intermediate), and triclinic WO3 (decomposition product) were calculated
up to 6.0 Å with a lower limit of 8.0 % in amplitude with respect to the strongest
backscattering path. EXAFS refinements were performed in R space simultaneously to
magnitude and imaginary part of a Fourier transformed k3-weighted and k1-weighted
experimental χ(k) using the standard EXAFS formula. [73] Structural parameters that are
determined by a least–squares EXAFS refinement of a model structure to the
experimental spectra are (i) one overall E0 shift, (ii) Debye-Waller factors for single-
scattering paths, and (iii) distances of single-scattering paths. Coordination numbers (CN)
and S02 were kept invariant in the refinement.
28
2.4 Additional methods of characterization
2.4.1 Thermal analysis (TG and DSC)
2.4.1a Theory of TG/DSC
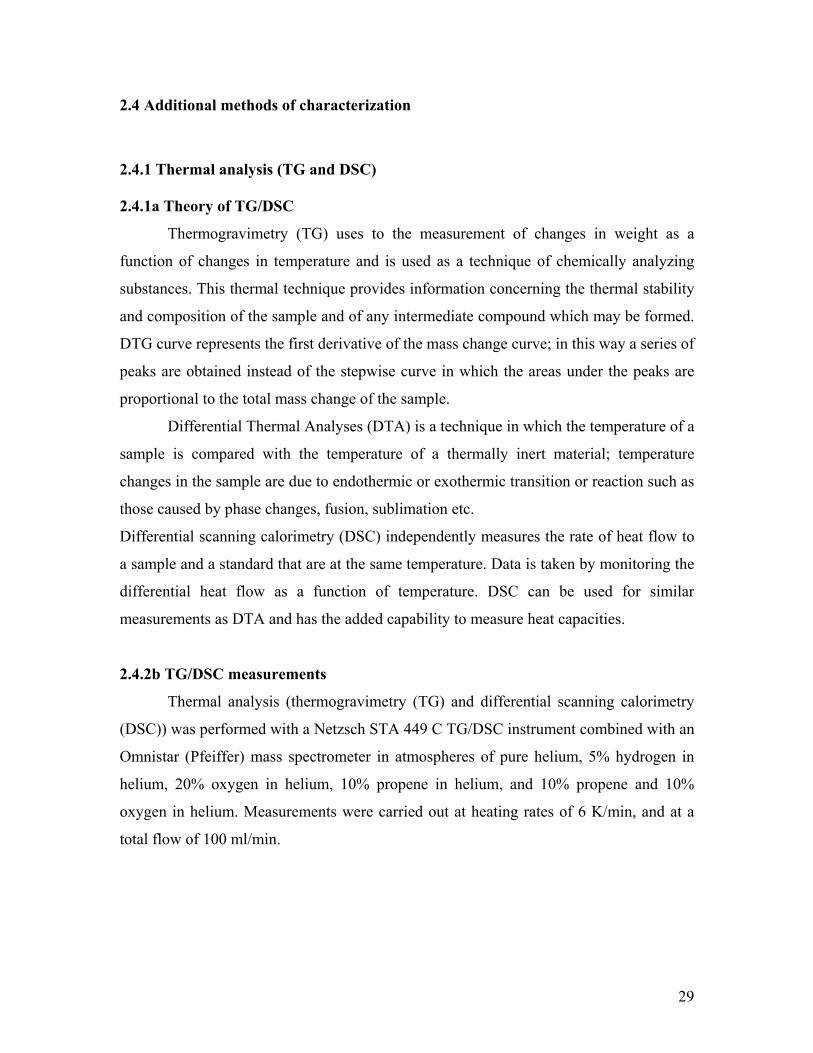
Thermogravimetry (TG) uses to the measurement of changes in weight as a
function of changes in temperature and is used as a technique of chemically analyzing
substances. This thermal technique provides information concerning the thermal stability
and composition of the sample and of any intermediate compound which may be formed.
DTG curve represents the first derivative of the mass change curve; in this way a series of
peaks are obtained instead of the stepwise curve in which the areas under the peaks are
proportional to the total mass change of the sample.
Differential Thermal Analyses (DTA) is a technique in which the temperature of a
sample is compared with the temperature of a thermally inert material; temperature
changes in the sample are due to endothermic or exothermic transition or reaction such as
those caused by phase changes, fusion, sublimation etc.
Differential scanning calorimetry (DSC) independently measures the rate of heat flow to
a sample and a standard that are at the same temperature. Data is taken by monitoring the
differential heat flow as a function of temperature. DSC can be used for similar
measurements as DTA and has the added capability to measure heat capacities.
2.4.2b TG/DSC measurements
Thermal analysis (thermogravimetry (TG) and differential scanning calorimetry
(DSC)) was performed with a Netzsch STA 449 C TG/DSC instrument combined with an
Omnistar (Pfeiffer) mass spectrometer in atmospheres of pure helium, 5% hydrogen in
helium, 20% oxygen in helium, 10% propene in helium, and 10% propene and 10%
oxygen in helium. Measurements were carried out at heating rates of 6 K/min, and at a
total flow of 100 ml/min.
29

2.5 Electron microscopy
Scanning electron microscopy (SEM) was conducted on S 4000 FEG microscope
(Hitachi). The acceleration voltage was set at 10 kV, the objective aperture was 30 mm,
and the working distance was 10 mm. High-resolution transmission electron microscopy
(HRTEM) analysis was carried out on a CM 200 electron microscope (Philips) (point
resolution of 0.2 nm and acceleration voltage of 200 kV) equipped with an EDX system.
30
3 Results
3.1 Characterization of ammonium paratungstate
Ammonium paratungstate tetrahydrate, APT, (NH4)10H2W12O42 * 4H2O, was used
as purchased (Osram). For the investigations described here a sieved fraction with
particles in the size range from 100 to 200 µm was employed.
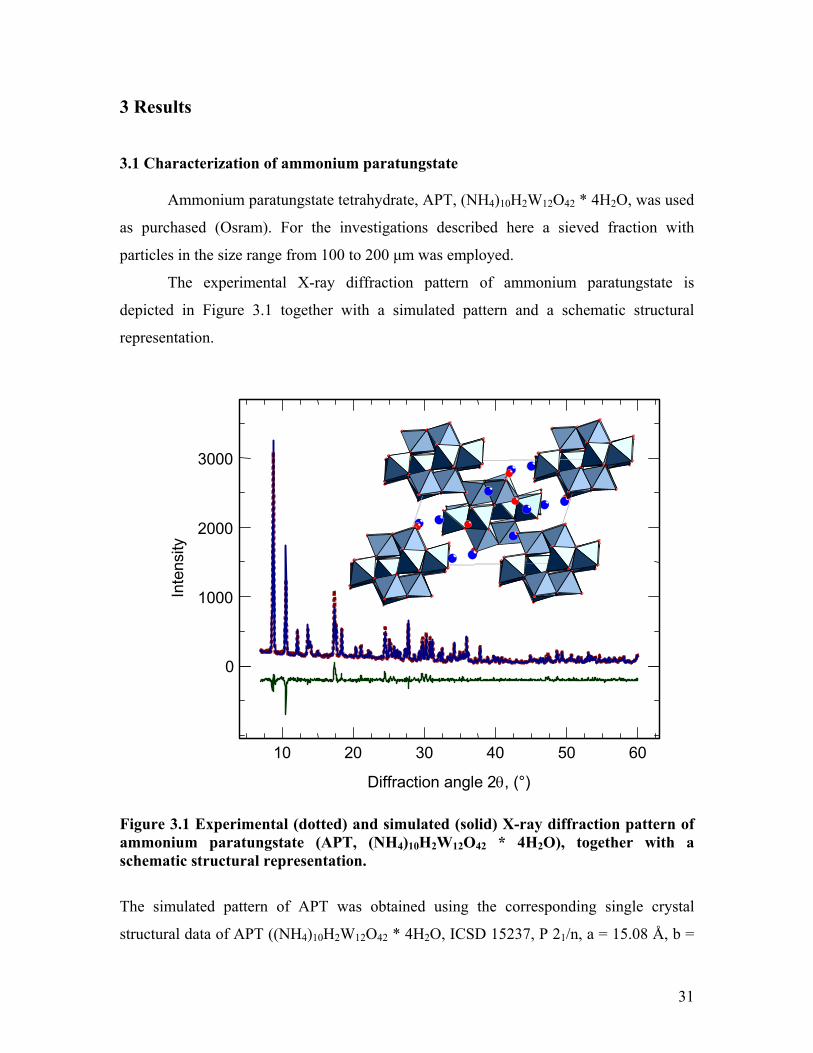
The experimental X-ray diffraction pattern of ammonium paratungstate is
depicted in Figure 3.1 together with a simulated pattern and a schematic structural
representation.
1000
2000
3000
0
10 20 30 40 50 60
Inte
nsity
Diffraction angle 2θ, (°)
Figure 3.1 Experimental (dotted) and simulated (solid) X-ray diffraction pattern of ammonium paratungstate (APT, (NH4)10H2W12O42 * 4H2O), together with a schematic structural representation.
The simulated pattern of APT was obtained using the corresponding single crystal
structural data of APT ((NH4)10H2W12O42 * 4H2O, ICSD 15237, P 21/n, a = 15.08 Å, b =
31

14.45 Å, c = 11.00 Ǻ, β = 109.4). The refined lattice constants determined are a = 15.04
Å, b = 14.46 Å, c = 10.95 Ǻ, and β = 109.1 in good agreement with the single crystal
data. The crystallite size calculated from XRD peak broadening amounted to about 600
nm. No further crystalline phases were detectable in the experimental pattern of APT.
Figure 3.2 shows the scanning electron micrographs of ammonium paratungstate with
particles in the size range from 100 to 200 µm.
Figure 3.2 Scanning electron micrographs of a sieved fraction of as-purchased
ammonium paratungstate with particles inFigure 3.3A shows the experimen
FT(χ(k)*k3) of APT. The corresponding di
from the XAS refinement are given in Table
the W centers in the polyoxotungstate ion
EXAFS spectrum (Figure 3.3B). The good a
data (XRD, XAS, TG) and the experime
paratungstate tetrahydrate used does indeed
(ICSD 15237) and excludes the presence of
amorphous.
~100µm
~500µmthe size range from 100 to 200 µm.
tal and theoretical W LIII edge EXAFS
stances and Debye-Waller factors obtained
3.1. The model of the local structure around
of APT is adequate to simulate the W LIII
greement between the theoretical structural
ntal data, confirms that the ammonium
correspond to (NH4)10H2W12O42 * 4H2O,
major impurity phases, either crystalline or
32

0.025
0.05
0.0
-0.025
-0.05 0 1 2 3
FT(χ
(k)*
k3 )
R, (Å)
Experimental Refinement
Figure 3.3A Experimental (dotted) and theoretical (solid) W LIII XAFS FT(χ(k)*k3) of ammonium paratungstate ((NH4)10H2W12O42 * 4H2O).
Figure 3.3B Schematic representation of the polyoxotungstate ion (W12O42
12-) of APT in two different viewing directions.
33

Table 3.1 Structural parameters (type of pairs and number (N) of nearest neighbors at distance R) obtained from a refinement of the ammonium paratungstate model structure (based on ICSD 15237) to the experimental XAFS functions χ(k) of APT (Figure 3.3A) at the W LIII edge (Nind = 23, Nfree = 14, 12 single scattering paths and 29 multiple scattering paths, R range from 0.8 to 4.4 Å, k range from 1.8 to 13.4 Å-1, E0 = 7.6 eV, S0
2 = 0.9).
Type N Rmodel, (Å) R, (Å) σ2, (Å2)
W - O 1 1.72 1.70 0.0020
W - O 2 1.84 1.83 0.0021
W - O 1 1.92 1.96 0.0021
W - O 1 2.02 2.13 0.0022
W - O 1 2.30 2.26 0.0023
W - W 2 3.33 3.27 0.0035
W - W 2 3.70 3.67 0.0035
W - W 1 3.84 3.84 0.0036
3.2 Thermal decomposition of ammonium paratungstate (TG/DSC)
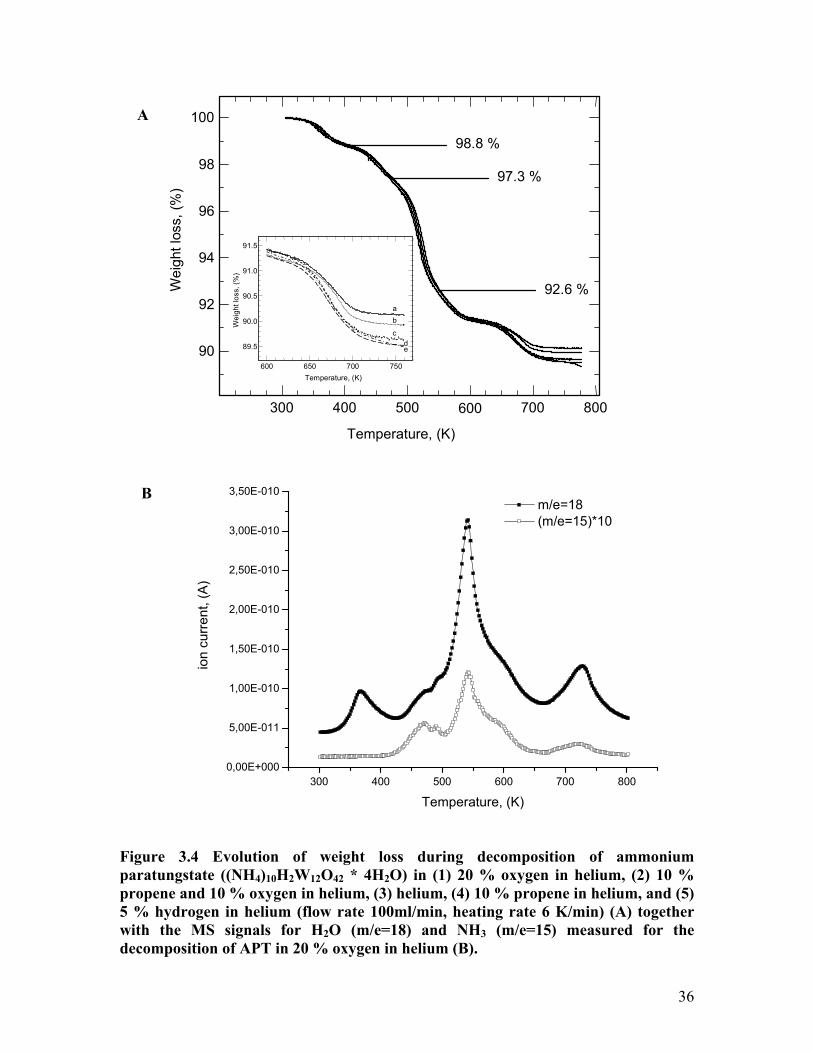
The evolution of the mass loss during thermogravimetry measurements (TG) of
APT in various atmospheres (helium, 5 % hydrogen in helium, 20% oxygen in helium,
10% propene in helium, and 10% propene and 10% oxygen in helium) is shown in Figure
3.4. The measurements were conducted with a heating rate of 6 K/min and a total gas
flow of 100 ml/min. Additionally, the evolution of the MS signals for water (m/e = 18)
and ammonia (m/e = 15) measured during the decomposition of APT in 20 % oxygen are
depicted in Figure 3.4.
The gas phase product composition is nearly identical for decomposition in
oxygen, helium and hydrogen, even during the last step of the decomposition. In addition
to the signals for water and ammonia, signals for m/e = 30 and m/e = 44 were also
detected. These signals could be attributable to NO and N2O, however the intensity of
these signals follows the intensity of the signal for ammonia throughout the
decomposition, and they may be artifacts formed in the MS.
34

In the temperature range from 300 K to 650 K the evolution of the mass loss from
APT during thermal decomposition are nearly independent of the gas atmosphere. Four
decomposition steps at 370 K, 450 K, 500 K, and 650 K can be distinguished in the TG
and MS traces measured. The decomposition steps at 450 K, 500 K, and 650 K are
accompanied by the evolution of water and ammonia, whereas for the decomposition
steps at 370 K only water is detectable in the gas phase. The weight loss after the first
decomposition step at 370 K amounts to 1.2 % and corresponds to a loss of two
molecules of crystal water (1.1 %). Apparently, the treatment in helium performed prior
to the TG/DSC measurements to remove adsorbed water, already reduced the number of
crystal water molecules from the initial four to two. The major mass loss of 8.8 % at
about 500 K is accompanied by the largest signals in the water and ammonia MS traces.
The total weight loss after the forth decomposition step at 650 K depends on the
atmosphere used and amounts to 9.9 % in oxygen, 10.1 % in propene and oxygen, 10.4 %
in helium, 10.5 % in propene, and 10.8 % in hydrogen. Because the decomposition in
oxygen resulted in WO3, the other weight losses indicate the formation of partially
reduced tungsten oxide species in reducing atmospheres. Assuming that the initial
material is identical, or alternatively, that the intermediates at 400 K are identical in
composition, then the amount of reduction of the tungsten oxide at the end of the
decomposition can be calculated. For the hydrogen containing atmosphere, this partial
reduction results in an oxide formula of about WO2.85. The difference between a
theoretical mass change when decomposing APT to WO3 of 11.2 % and the loss of 9.9 %
measured here during the decomposition in oxygen is accounted for by the above-
mentioned loss of two molecules of crystal water before the start of the TG experiments.
35
90
92
94
96
98
100
300 400 500 600 700 800
Wei
ght l
oss,
(%)
Temperature, (K)
89.5
90.0
90.5
91.0
91.5
600 650 700 750
Wei
ght l
oss,
(%)
Temperature, (K)
a b
c d e
98.8 %
97.3 %
92.6 %
A
B
300 400 500 600 700 8000,00E+000
5,00E-011
1,00E-010
1,50E-010
2,00E-010
2,50E-010
3,00E-010
3,50E-010 m/e=18 (m/e=15)*10
ion
curr
ent,
(A)
Temperature, (K)
Figure 3.4 Evolution of weight loss during decomposition of ammonium paratungstate ((NH4)10H2W12O42 * 4H2O) in (1) 20 % oxygen in helium, (2) 10 % propene and 10 % oxygen in helium, (3) helium, (4) 10 % propene in helium, and (5) 5 % hydrogen in helium (flow rate 100ml/min, heating rate 6 K/min) (A) together with the MS signals for H2O (m/e=18) and NH3 (m/e=15) measured for the decomposition of APT in 20 % oxygen in helium (B).
36

The differential scanning calorimetry traces measured during the decomposition
of APT in various atmospheres are depicted in Figure 3.5. Independent of the gas phase
composition, each of the first three mass losses shows one or more endothermic signals,
the strongest endothermic signal accompanies the third decomposition step at about 500
K. The DSC measurements indicate an endothermic decomposition step at 700 K in
reducing atmospheres. However, a strong exothermic signal is observed at 700 K during
the decomposition of APT in oxygen. Because the gas phase products are nearly identical
in both the oxygen and the helium decomposition, the exothermic signal must be due
either to a phase change, or to a reaction such as the re-oxidation of a somewhat reduced
tungsten oxide, which would give no gas phase products.
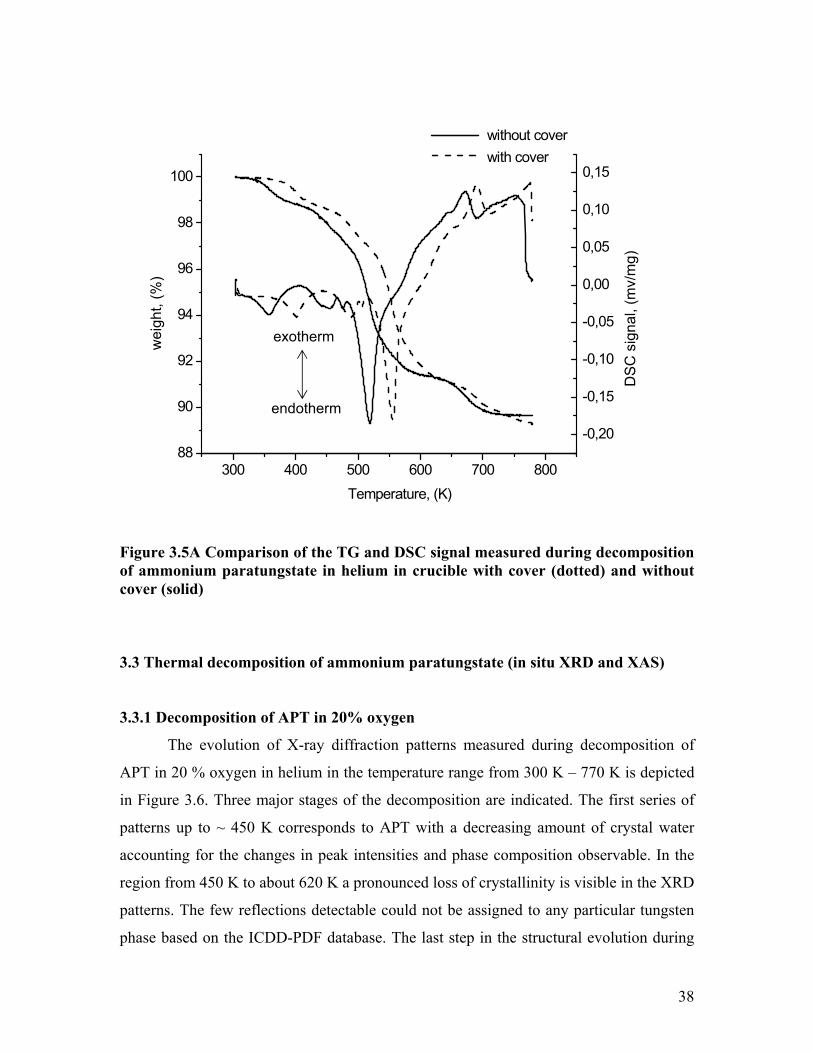
Figure 3.5A presents the progression of the TG (DSC) curve during the
decomposition of APT in helium, with cover and without cover.
0,25
Figure 3.5 Comparison of the DSC signal measured during decomposition of ammonium paratungstate ((NH4)10H2W12O42 * 4H2O) in helium (solid), 20 % oxygen in helium (dashed), 5% hydrogen in helium (dotted), and 10% propene in helium (dash-dotted) (for the corresponding weight loss evolution see Figure 3.4(A)).
300 400 500 600 700 800 -0,30 -0,25 -0,20 -0,15 -0,10 -0,05 0,00 0,05 0,10 0,15 0,20
He 20 % O2 in He 5 % H2 in He
DS
C s
igna
l, (m
v/m
g)
10% propene in He
endotherm
exotherm
Temperature, (K)
37
300 400 500 600 700 80088
90
92
94
96
98
100
DS
C s
igna
l, (m
v/m
g)
wei
ght,
(%)
Temperature, (K)
without cover
-0,20
-0,15
-0,10
-0,05
0,00
0,05
0,10
0,15with cover
exotherm
endotherm
Figure 3.5A Comparison of the TG and DSC signal measured during decomposition of ammonium paratungstate in helium in crucible with cover (dotted) and without cover (solid)
3.3 Thermal decomposition of ammonium paratungstate (in situ XRD and XAS)
3.3.1 Decomposition of APT in 20% oxygen
The evolution of X-ray diffraction patterns measured during decomposition of
APT in 20 % oxygen in helium in the temperature range from 300 K – 770 K is depicted
in Figure 3.6. Three major stages of the decomposition are indicated. The first series of
patterns up to ~ 450 K corresponds to APT with a decreasing amount of crystal water
accounting for the changes in peak intensities and phase composition observable. In the
region from 450 K to about 620 K a pronounced loss of crystallinity is visible in the XRD
patterns. The few reflections detectable could not be assigned to any particular tungsten
phase based on the ICDD-PDF database. The last step in the structural evolution during
38
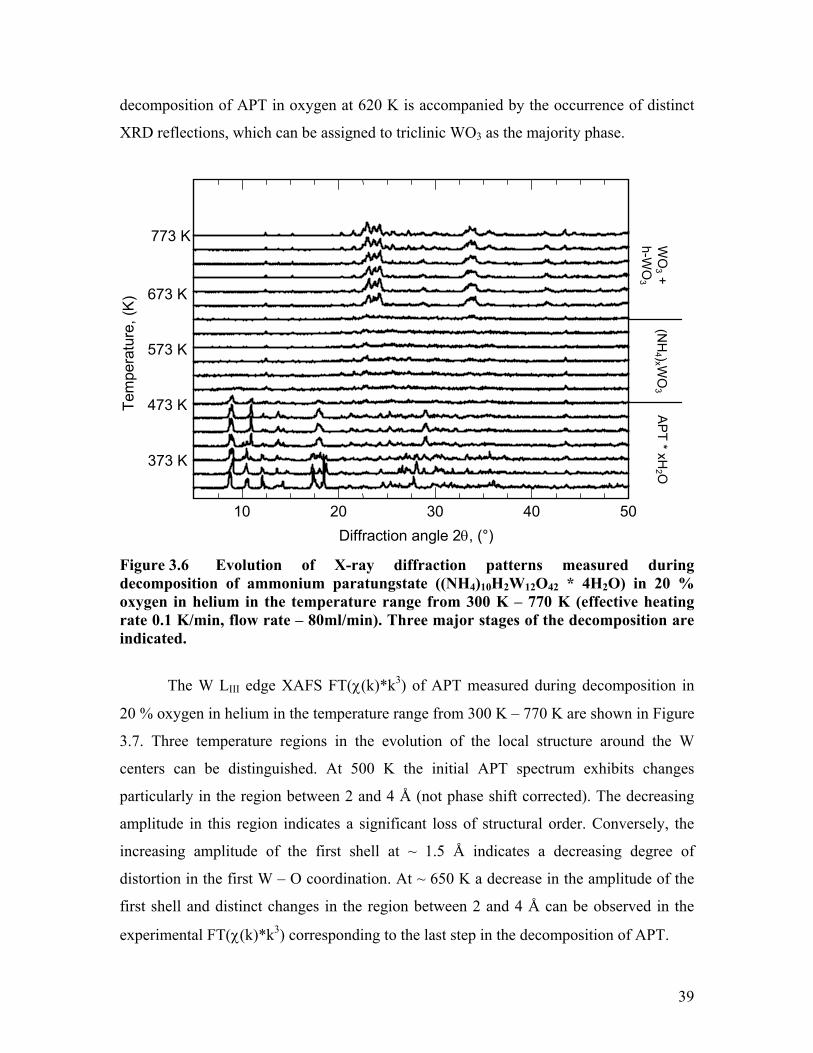
decomposition of APT in oxygen at 620 K is accompanied by the occurrence of distinct
XRD reflections, which can be assigned to triclinic WO3 as the majority phase.
10 20 30 40 50
373 K
Diffraction angle 2θ, (°)
473 K
573 K
673 K
773 K
Tem
pera
ture
, (K
) W
O3 +
h-WO
3
(NH
4 )x WO
3 A
PT * xH
2 O
Figure 3.6 Evolution of X-ray diffraction patterns measured during decomposition of ammonium paratungstate ((NH4)10H2W12O42 * 4H2O) in 20 % oxygen in helium in the temperature range from 300 K – 770 K (effective heating rate 0.1 K/min, flow rate – 80ml/min). Three major stages of the decomposition are indicated.
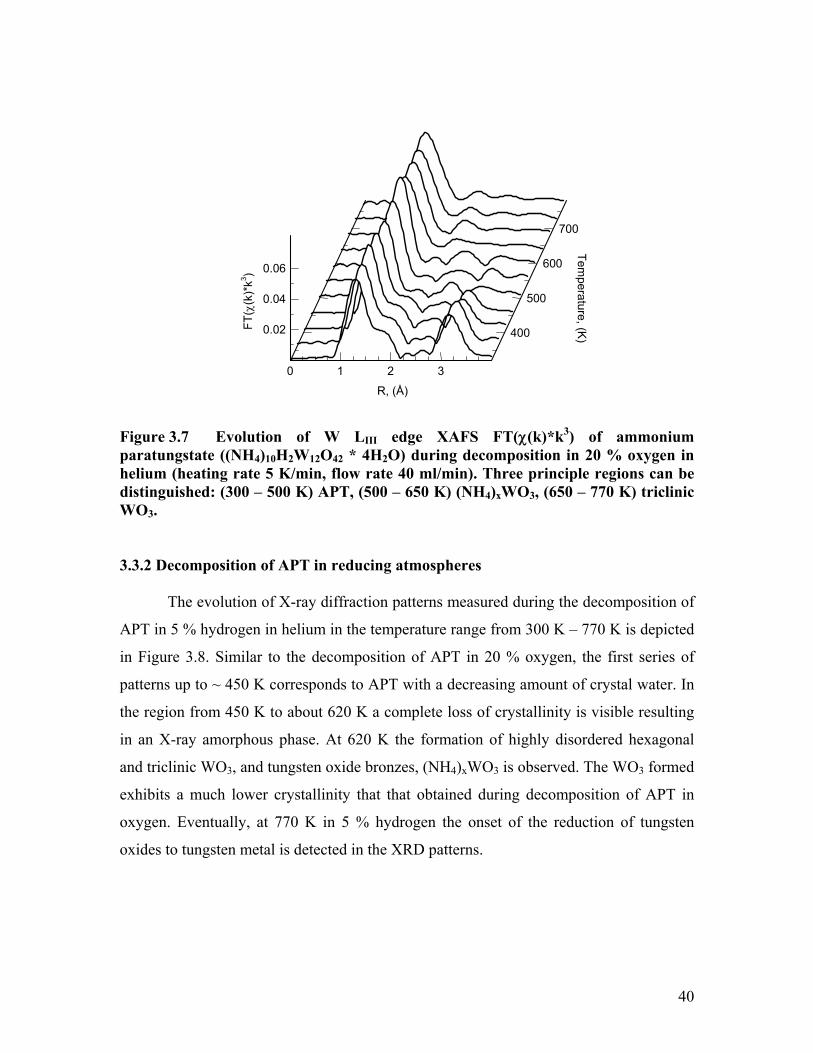
The W LIII edge XAFS FT(χ(k)*k3) of APT measured during decomposition in
20 % oxygen in helium in the temperature range from 300 K – 770 K are shown in Figure
3.7. Three temperature regions in the evolution of the local structure around the W
centers can be distinguished. At 500 K the initial APT spectrum exhibits changes
particularly in the region between 2 and 4 Å (not phase shift corrected). The decreasing
amplitude in this region indicates a significant loss of structural order. Conversely, the
increasing amplitude of the first shell at ~ 1.5 Å indicates a decreasing degree of
distortion in the first W – O coordination. At ~ 650 K a decrease in the amplitude of the
first shell and distinct changes in the region between 2 and 4 Å can be observed in the
experimental FT(χ(k)*k3) corresponding to the last step in the decomposition of APT.
39
0.02
0.04
0.06
0 1 2 3
400
500
600
700 FT
(χ(k
)*k3 )
R, (Å)
Temperature, (K
)
Figure 3.7 Evolution of W LIII edge XAFS FT(χ(k)*k3) of ammonium paratungstate ((NH4)10H2W12O42 * 4H2O) during decomposition in 20 % oxygen in helium (heating rate 5 K/min, flow rate 40 ml/min). Three principle regions can be distinguished: (300 – 500 K) APT, (500 – 650 K) (NH4)xWO3, (650 – 770 K) triclinic WO3.
3.3.2 Decomposition of APT in reducing atmospheres
The evolution of X-ray diffraction patterns measured during the decomposition of
APT in 5 % hydrogen in helium in the temperature range from 300 K – 770 K is depicted
in Figure 3.8. Similar to the decomposition of APT in 20 % oxygen, the first series of
patterns up to ~ 450 K corresponds to APT with a decreasing amount of crystal water. In
the region from 450 K to about 620 K a complete loss of crystallinity is visible resulting
in an X-ray amorphous phase. At 620 K the formation of highly disordered hexagonal
and triclinic WO3, and tungsten oxide bronzes, (NH4)xWO3 is observed. The WO3 formed
exhibits a much lower crystallinity that that obtained during decomposition of APT in
oxygen. Eventually, at 770 K in 5 % hydrogen the onset of the reduction of tungsten
oxides to tungsten metal is detected in the XRD patterns.
40

10 20 30 40 50
373 K
Diffraction angle 2θ, (°)
473 K
573 K
673 K
773 K Te
mpe
ratu
re, (
K)
W metal
WO
3 + (N
H4 )0.33 W
O3
amorphous
AP
T * xH2 O
Figure 3.8 Evolution of X-ray diffraction patterns measured during decomposition of ammonium paratungstate ((NH4)10H2W12O42 * 4H2O) in 5 % hydrogen in helium in the temperature range from 300 K – 770 K (effective heating rate 0.1 K/min, flow rate – 80ml/min). Three major stages of the decomposition are indicated.
The evolution of the W LIII edge FT(χ(k)*k3) measured during decomposition of APT in
the reducing atmospheres studied (i.e. propene, hydrogen, helium, propene and oxygen)
is very similar to that of the decomposition in oxygen.
3.3.3 Decomposition of APT in air (static conditions)
The evolution of X-ray diffraction patterns measured during the decomposition of
APT in static air in the temperature range from 300 K – 770 K is shown in Figure 3.9.
Similar to the decomposition of APT in oxygen, three major stages can be distinguished.
The first series of patterns up to ~ 470 K corresponds to APT with a decreasing amount
of crystal water. In the region from 470 K to about 550 K the formation of an X-ray
41
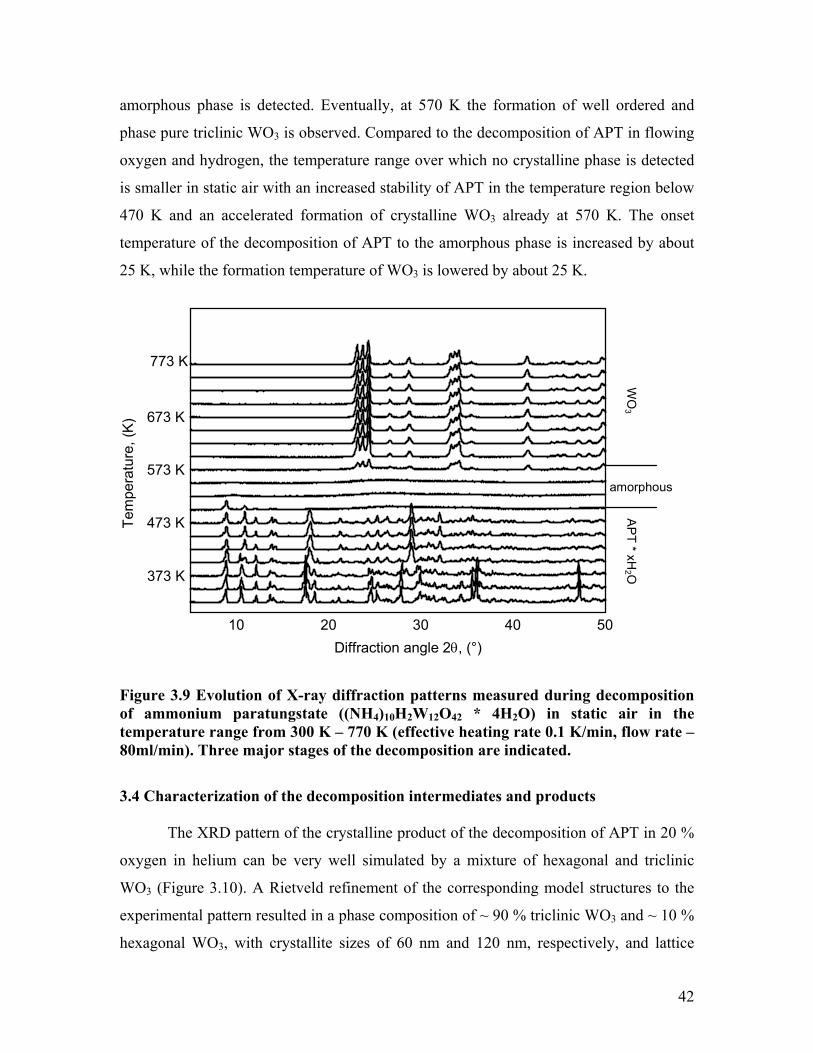
amorphous phase is detected. Eventually, at 570 K the formation of well ordered and
phase pure triclinic WO3 is observed. Compared to the decomposition of APT in flowing
oxygen and hydrogen, the temperature range over which no crystalline phase is detected
is smaller in static air with an increased stability of APT in the temperature region below
470 K and an accelerated formation of crystalline WO3 already at 570 K. The onset
temperature of the decomposition of APT to the amorphous phase is increased by about
25 K, while the formation temperature of WO3 is lowered by about 25 K.
10 20 30 40 50
373 K
Diffraction angle 2θ, (°)
473 K
573 K
673 K
773 K
Tem
pera
ture
, (K
)
WO
3
amorphous
AP
T * xH2 O
Figure 3.9 Evolution of X-ray diffraction patterns measured during decomposition of ammonium paratungstate ((NH4)10H2W12O42 * 4H2O) in static air in the temperature range from 300 K – 770 K (effective heating rate 0.1 K/min, flow rate – 80ml/min). Three major stages of the decomposition are indicated.
3.4 Characterization of the decomposition intermediates and products
The XRD pattern of the crystalline product of the decomposition of APT in 20 %
oxygen in helium can be very well simulated by a mixture of hexagonal and triclinic
WO3 (Figure 3.10). A Rietveld refinement of the corresponding model structures to the
experimental pattern resulted in a phase composition of ~ 90 % triclinic WO3 and ~ 10 %
hexagonal WO3, with crystallite sizes of 60 nm and 120 nm, respectively, and lattice
42

constants in good agreement with the single crystal data (triclinic WO3 [ICSD 1620,
a=7.31 Å, b=7.52 Å, c=7.68 Å, α=88.8 °, β = γ = 90.9°] a=7.34 Å, b= 7.53 Å, c=7.69 Å,
α= 89.6 °, β = γ = 90.5 °). A schematic representation of the structure of triclinic WO3 is
depicted in Figure 3.10. The nearest-neighbour distances in triclinic WO3 are given in
Table 3.2. The structure is related to the ReO3 structure and consists of edge-sharing WO6
units with W – O distances ranging from 1.8 to 2.2 Å. Compared to the ReO3 structure,
the WO6 units in triclinic WO3 are strongly tilted with respect to each other resulting in a
triclinic unit cell.
500
1000
1500
0.0
10 20 30 40 50 60 70 80 90
Inte
nsity
Diffraction angle 2θ, (°)
Figure 3.10 Experimental (dotted) and simulated (solid) X-ray diffraction pattern of the product of the decomposition of ammonium paratungstate ((NH4)10H2W12O42 * 4H2O) in 20 % oxygen in helium (300 K – 770 K), together with a schematic structural representation of the corresponding triclinic WO3 phase.
43
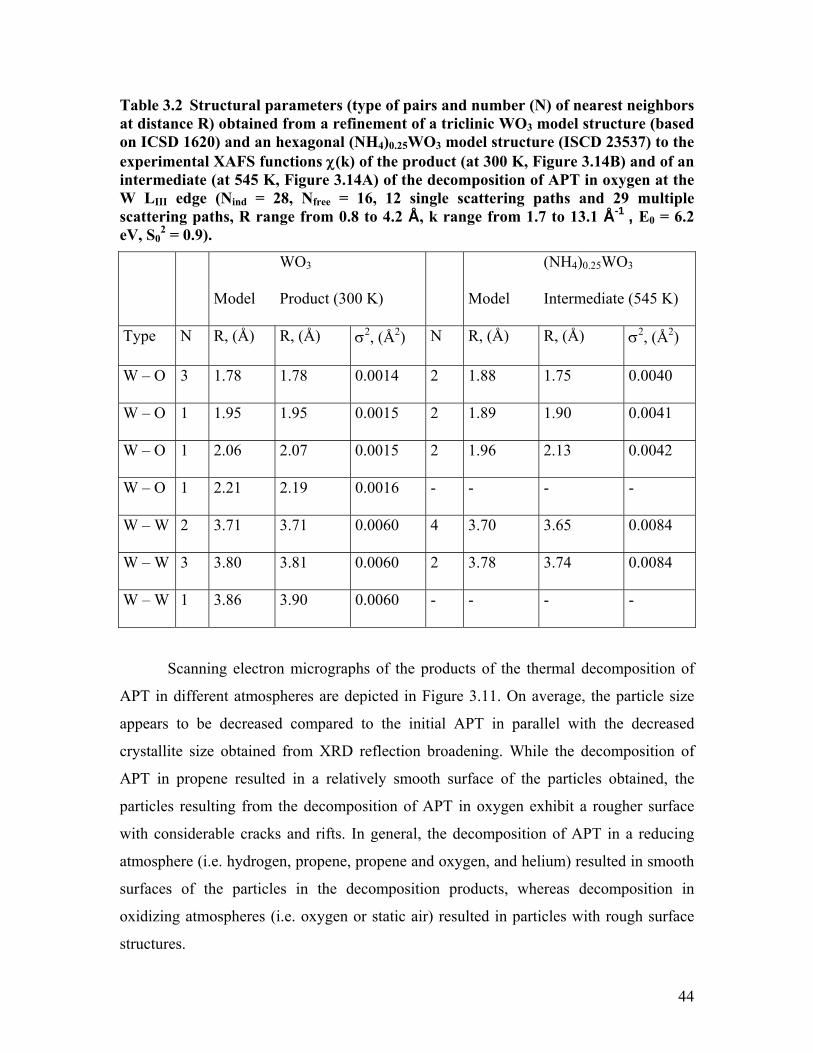
Table 3.2 Structural parameters (type of pairs and number (N) of nearest neighbors at distance R) obtained from a refinement of a triclinic WO3 model structure (based on ICSD 1620) and an hexagonal (NH4)0.25WO3 model structure (ISCD 23537) to the experimental XAFS functions χ(k) of the product (at 300 K, Figure 3.14B) and of an intermediate (at 545 K, Figure 3.14A) of the decomposition of APT in oxygen at the W LIII edge (Nind = 28, Nfree = 16, 12 single scattering paths and 29 multiple scattering paths, R range from 0.8 to 4.2 Å, k range from 1.7 to 13.1 Å-1 , E0 = 6.2 eV, S0
2 = 0.9).
Model
WO3
Product (300 K)
Model
(NH4)0.25WO3
Intermediate (545 K)
Type N R, (Å) R, (Å) σ2, (Å2) N R, (Å) R, (Å) σ2, (Å2)
W – O 3 1.78 1.78 0.0014 2 1.88 1.75 0.0040
W – O 1 1.95 1.95 0.0015 2 1.89 1.90 0.0041
W – O 1 2.06 2.07 0.0015 2 1.96 2.13 0.0042
W – O 1 2.21 2.19 0.0016 - - - -
W – W 2 3.71 3.71 0.0060 4 3.70 3.65 0.0084
W – W 3 3.80 3.81 0.0060 2 3.78 3.74 0.0084
W – W 1 3.86 3.90 0.0060 - - - -
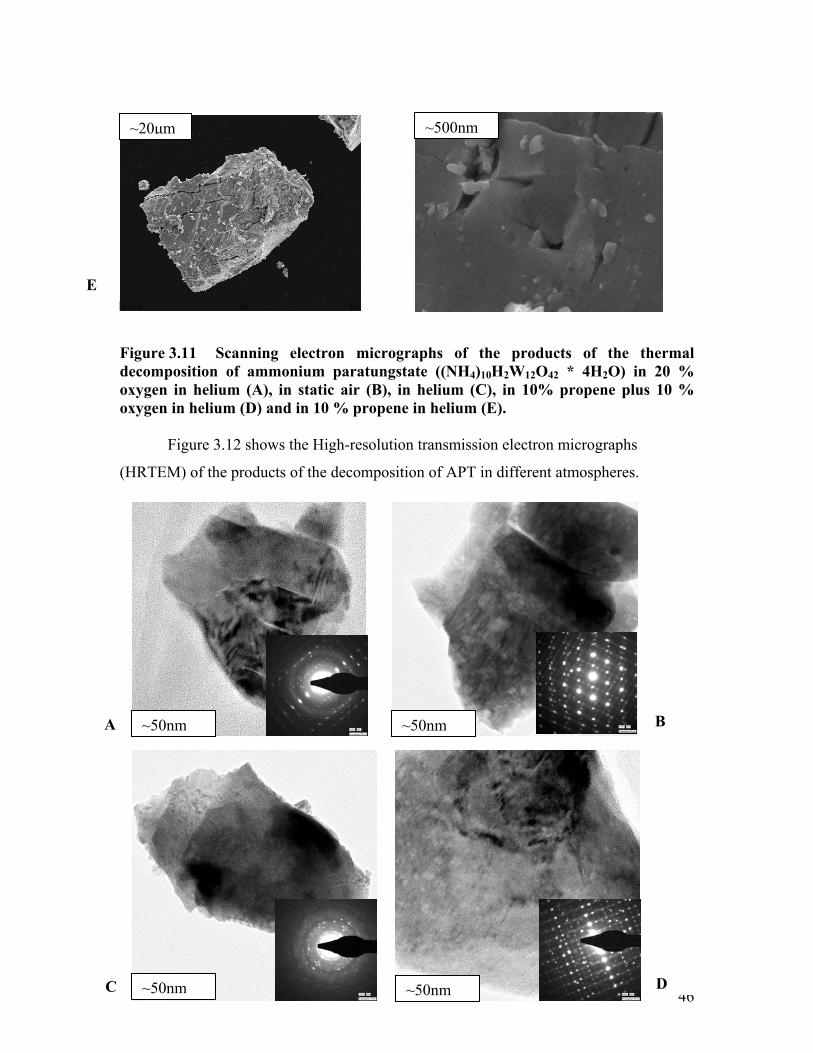
Scanning electron micrographs of the products of the thermal decomposition of
APT in different atmospheres are depicted in Figure 3.11. On average, the particle size
appears to be decreased compared to the initial APT in parallel with the decreased
crystallite size obtained from XRD reflection broadening. While the decomposition of
APT in propene resulted in a relatively smooth surface of the particles obtained, the
particles resulting from the decomposition of APT in oxygen exhibit a rougher surface
with considerable cracks and rifts. In general, the decomposition of APT in a reducing
atmosphere (i.e. hydrogen, propene, propene and oxygen, and helium) resulted in smooth
surfaces of the particles in the decomposition products, whereas decomposition in
oxidizing atmospheres (i.e. oxygen or static air) resulted in particles with rough surface
structures.
44

C
D
B
A
m
031415 SE HV 10kV
m
m
~20µm
~500nm
~500n
m
~500n ~20µm~500n
~500n
~20µm
~20µm
45
E
Figure 3.11 Scanning electron microgra
(HRTE
decomposition of ammonium paratungstatoxygen in helium (A), in static air (B), in oxygen in helium (D) and in 10 % propene i
Figure 3.12 shows the High-resolution
M) of the products of the decompositio
~50nm ~5
m
~50nm
~50nm
~5
~5
031430 SE HV 10kV031430 SE kV
~500nphs of the products of the thermal
ectron micrographs
e ((NH4)10H2W12O42 * 4H2O) in 20 % helium (C), in 10% propene plus 10 % n helium (E).
transmission el
n of APT in different atmospheres.
0nm0nm
A0nm
B
D
C~20µm~20µm
46

Figure 3.12 High resolutiothe thermal decompositionin 20 % oxygen in helium 10 % oxygen in helium (D)
TEM did not indic
micrographs and diffraction
particles and amorphous ran
larger than that of the cryst
similar elemental compositi
m
polycrystalline particles of
propene and propene/oxygen
in helium is lower in compar
3.13 shows FFTs (Fast Fou
thermal decomposition of
different atmospheres. The c
~50n
E47
n transmission electron micrographs of the products of of ammonium paratungstate ((NH4)10H2W12O42 * 4H2O) (A), in static air (B), in helium (C), in 10% propene plus and in 10 % propene in helium (E).
ate the presence of well-crystallized particles. Electron
patterns display the presence of the aggregates of crystalline
ges. The relative amount of the amorphous ranges is much
alline particles. The results of EDX measurements display
ons for all investigated particles of the oxide sample. The
of the decomposition of APT in oxygen, air,
ystallinity. The crystallinity of the product
e products obtained in other atmospheres. Figure
ms) of HRTEM images of the products of the
paratungstate ((NH4)10H2W12O42 * 4H2O) in
particles are predominantly of the WO3-like type.
the products
are different in cr
ison with th
rier Transfor
ammonium
rystalline

A
B48

C
D49
Figure
e the 20 %
0 % o
prese
ries w
ages o
he co
cal st
e tric
e inte
thin1
re
se
st
interme
the dec
T
lo
th
th
E
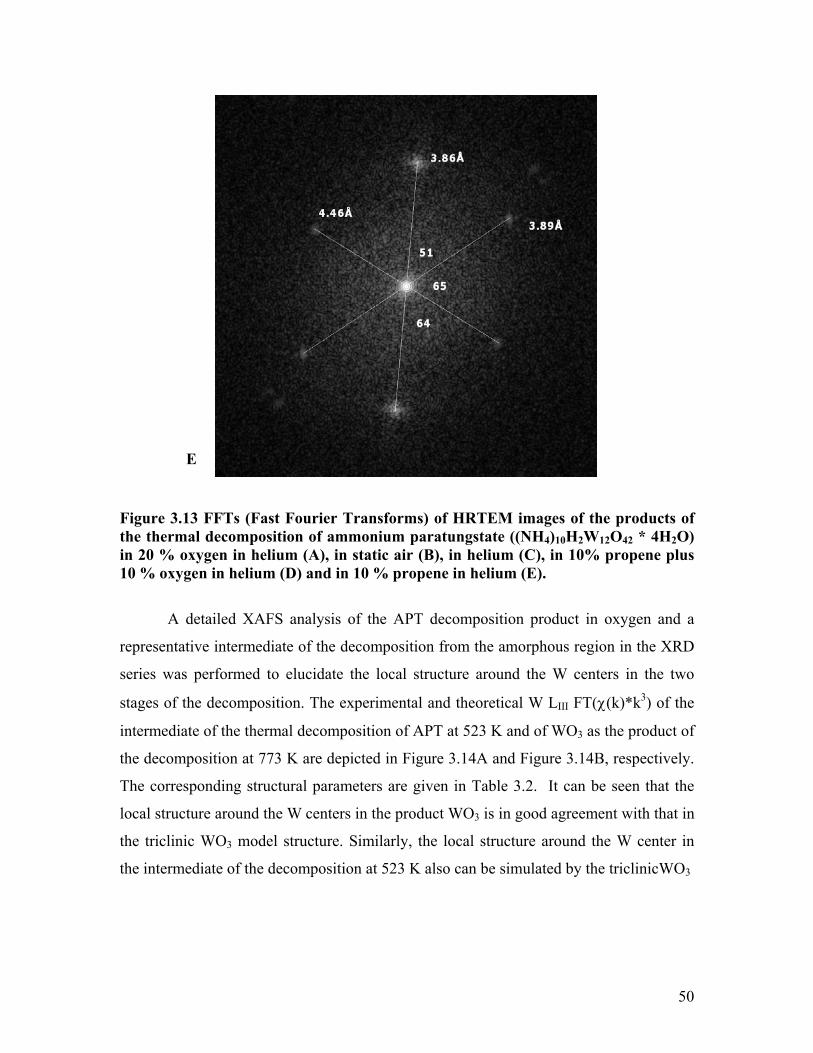
3.13 FFTs (Fast Fourier Transforms) of HRTEM images of the products of rmal decomposition of ammonium paratungstate ((NH4)10H2W12O42 * 4H2O)
gen in helium (A), in static air (B), in helium (C), in 10% propene plus xyge 10 % propene in helium (E).
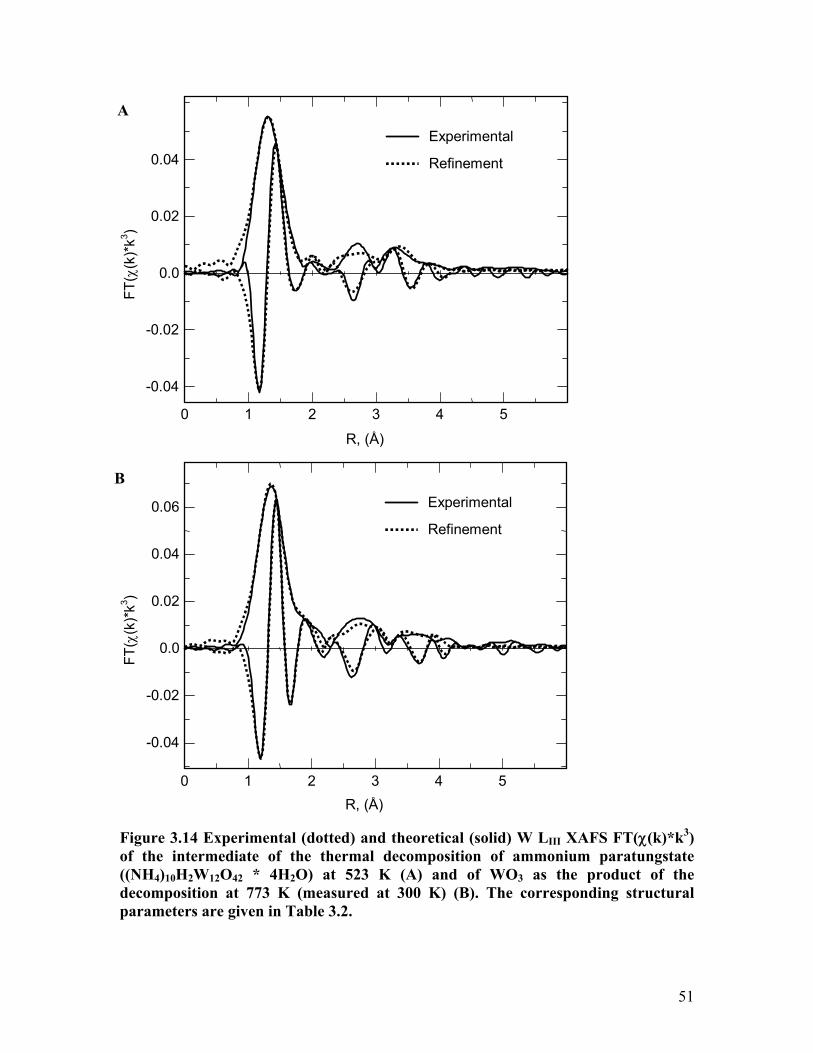
A detailed XAFS analysis of the APT decomposition product in oxygen and a
ntative intermediate of the decomposition from the amorphous region in the XRD
as pe centers in the two
f the decomposition. The experimental and theoretical W LIII FT(χ(k)*k3) of the
he thermal decomposition of APT at 523 K and of WO3 as the product of
at 773 K are depicted in Figure 3.14A and Figure 3.14B, respectively.
rresponding structural parameters are given in Table 3.2. It can be seen that the
ructure around the W centers in the product WO3 is in good agreement with that in
linic WO3 model structure. Similarly, the local structure around the W center in
rmediate of the decomposition at 523 K also can be simulated by the triclinicWO3
oxyn in helium (D) and in
rformed to elucidate the local structure around the W
diate of t
omposition
50
0.02
0.04
0.0
-0.02
-0.04 0 1 2 3 4 5
)*k3 )
( χ(k
FT
R, (Å)
Experimental
Refinement
A
B
0.02
0.04
0.06
0.0
-0.02
-0.04
0 1 2 3 4 5
FT( χ
(k)*
k3 )
Experimental
Refinement
R, (Å) Figure 3.14 Experimental (dotted) and theoretical (solid) W LIII XAFS FT(χ(k)*k3) of the intermediate of the thermal decomposition of ammonium paratungstate ((NH4)10H2W12O42 * 4H2O) at 523 K (A) and of WO3 as the product of the decomposition at 773 K (measured at 300 K) (B). The corresponding structural parameters are given in Table 3.2.
51
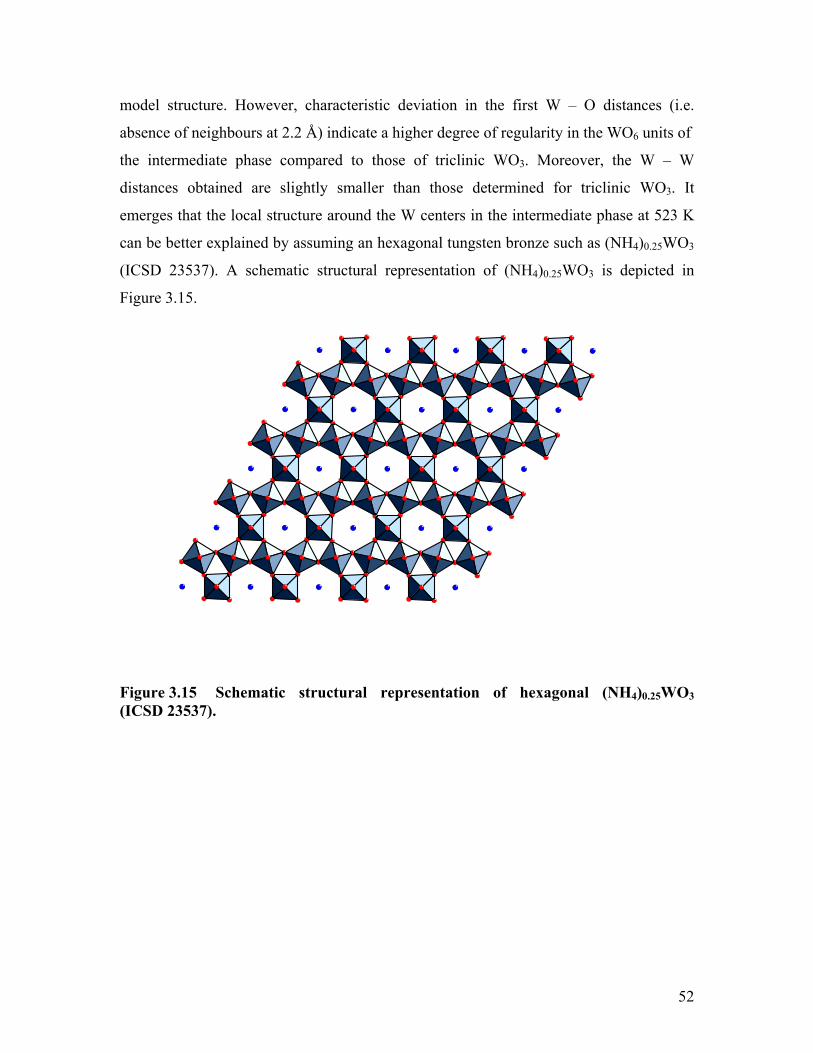
model structure. However, characteristic deviation in the first W – O distances (i.e.
absence of neighbours at 2.2 Å) indicate a higher degree of regularity in the WO6 units of
the intermediate phase compared to those of triclinic WO3. Moreover, the W – W
tances obtained are slightly smaller than those determined for triclinic WO3. It
emerges that the local structure around the W centers in the intermediate phase at 523 K
can be better explained by assuming an hexagonal tungsten bronze such as (NH4)0.25WO3
(ICSD 23537). A schematic structural representation of (NH4)0.25WO3 is depicted in
Figure 3.15.
Figure 3.15 Schematic structural representation of hexagonal (NH4)0.25WO3 (ICSD 23537).
dis
52

4 Discussion
In situ X-ray diffraction and in situ X-ray absorption spectroscopy were employed
ence, the comprehensive decomposition pathways determined, reveal the dependence of
position of APT on the gas phase composition particularly in comparison to the
ecomposition schemes of related polyoxometalates.
.1 Thermal decomposition of ammonium paratungstate
The thermal analysis data shown in Figure 3.4 and Figure 3.5 for the
position of APT in the various atmospheres employed indicate, that up to a
temperature of ~ 650 K the decomposition proceeds largely independent of the gas
tmosphere. This is corroborated by the XRD data presented in Figure 3.6, Figure 3.8,
nd Figure 3.9, which exhibit a series of patterns corresponding to a loss of crystal water
ation into a poorly crystalline or amorphous phase persisting up to
~ 650 K. At temperatures above 650 K, the product of the decomposition depends on the
as phase composition. This holds for both the phase composition and the crystallinity of
oxidizing atmospheres triclinic WO3 is formed as the majority phase,
[78,79] the decomposition in reducing atmospheres results in the formation of partially
reduced tungsten bronzes. [80] However, reduction of the WO3-x formed at 650 K in
reducing atmospheres (i.e. helium, propene, and hydrogen) to WO2 or tungsten metal is
detected during the decomposition of APT in hydrogen only. [81] Apparently, propene is
not capable of further reducing WO3 in the temperature range employed. This difference
to elucidate the thermal decomposition of ammonium paratungstate. The combination of
the two complementary methods with gas phase analysis by mass spectrometry and
corroborated by thermal analysis permits monitoring the evolution of the short-range and
long-range structure during the decomposition of APT in various reducing (propene,
hydrogen, helium, and propene and oxygen) and oxidizing (flowing oxygen and static air)
atmospheres. While XRD is used to identify the crystalline phases formed, highly
disordered or amorphous phases, which are frequently encountered during the
decomposition of polyoxometalates, can by analyzed by X-ray absorption spectroscopy.
H
the decom
d
4
decom
a
a
up to 470 K, transform
g
the products obtained.
While in
53
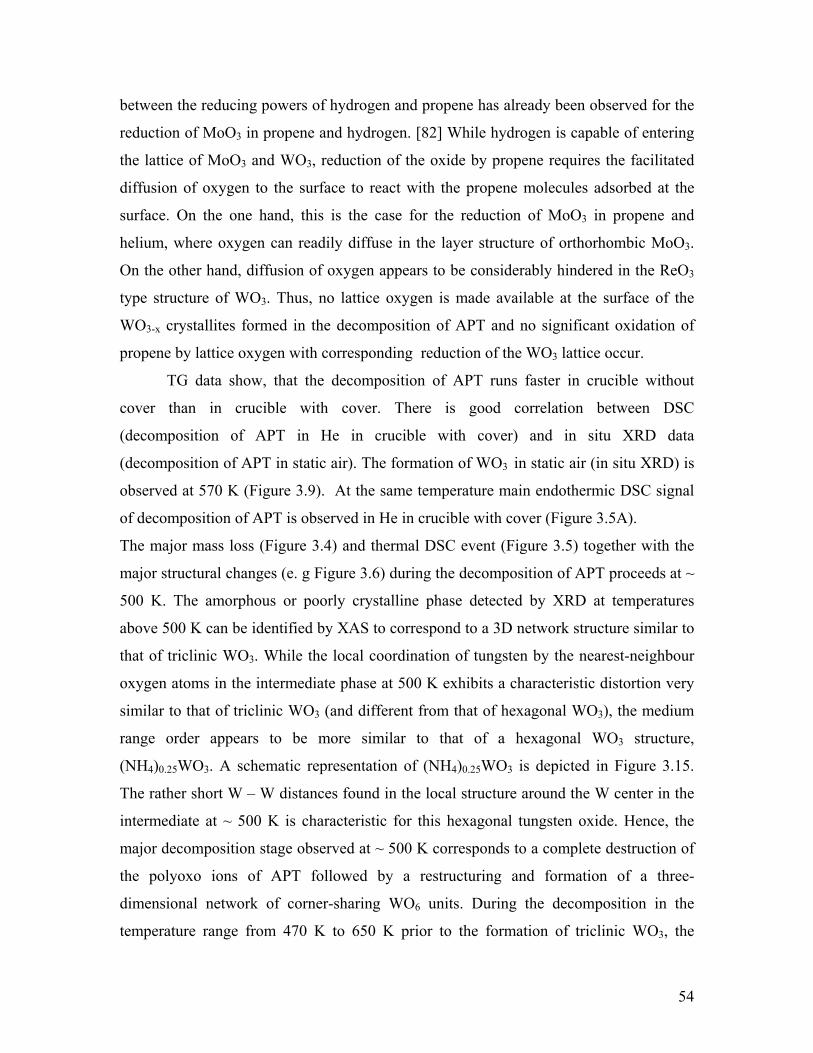
between the reducing powers of hydrogen and propene has already been observed for the
reduction of MoO in propene and hydrogen. [82] While hydrogen is capable of entering
the lattic
3 in static air (in situ XRD) is
e temperature main endothermic DSC signal
The ma
atic representation of (NH4)0.25WO3 is depicted in Figure 3.15.
The rat
3
e of MoO3 and WO3, reduction of the oxide by propene requires the facilitated
diffusion of oxygen to the surface to react with the propene molecules adsorbed at the
surface. On the one hand, this is the case for the reduction of MoO3 in propene and
helium, where oxygen can readily diffuse in the layer structure of orthorhombic MoO3.
On the other hand, diffusion of oxygen appears to be considerably hindered in the ReO3
type structure of WO3. Thus, no lattice oxygen is made available at the surface of the
WO3-x crystallites formed in the decomposition of APT and no significant oxidation of
propene by lattice oxygen with corresponding reduction of the WO3 lattice occur.
TG data show, that the decomposition of APT runs faster in crucible without
cover than in crucible with cover. There is good correlation between DSC
(decomposition of APT in He in crucible with cover) and in situ XRD data
(decomposition of APT in static air). The formation of WO
observed at 570 K (Figure 3.9). At the sam
of decomposition of APT is observed in He in crucible with cover (Figure 3.5A).
jor mass loss (Figure 3.4) and thermal DSC event (Figure 3.5) together with the
major structural changes (e. g Figure 3.6) during the decomposition of APT proceeds at ~
500 K. The amorphous or poorly crystalline phase detected by XRD at temperatures
above 500 K can be identified by XAS to correspond to a 3D network structure similar to
that of triclinic WO3. While the local coordination of tungsten by the nearest-neighbour
oxygen atoms in the intermediate phase at 500 K exhibits a characteristic distortion very
similar to that of triclinic WO3 (and different from that of hexagonal WO3), the medium
range order appears to be more similar to that of a hexagonal WO3 structure,
(NH4)0.25WO3. A schem
her short W – W distances found in the local structure around the W center in the
intermediate at ~ 500 K is characteristic for this hexagonal tungsten oxide. Hence, the
major decomposition stage observed at ~ 500 K corresponds to a complete destruction of
the polyoxo ions of APT followed by a restructuring and formation of a three-
dimensional network of corner-sharing WO6 units. During the decomposition in the
temperature range from 470 K to 650 K prior to the formation of triclinic WO3, the
54
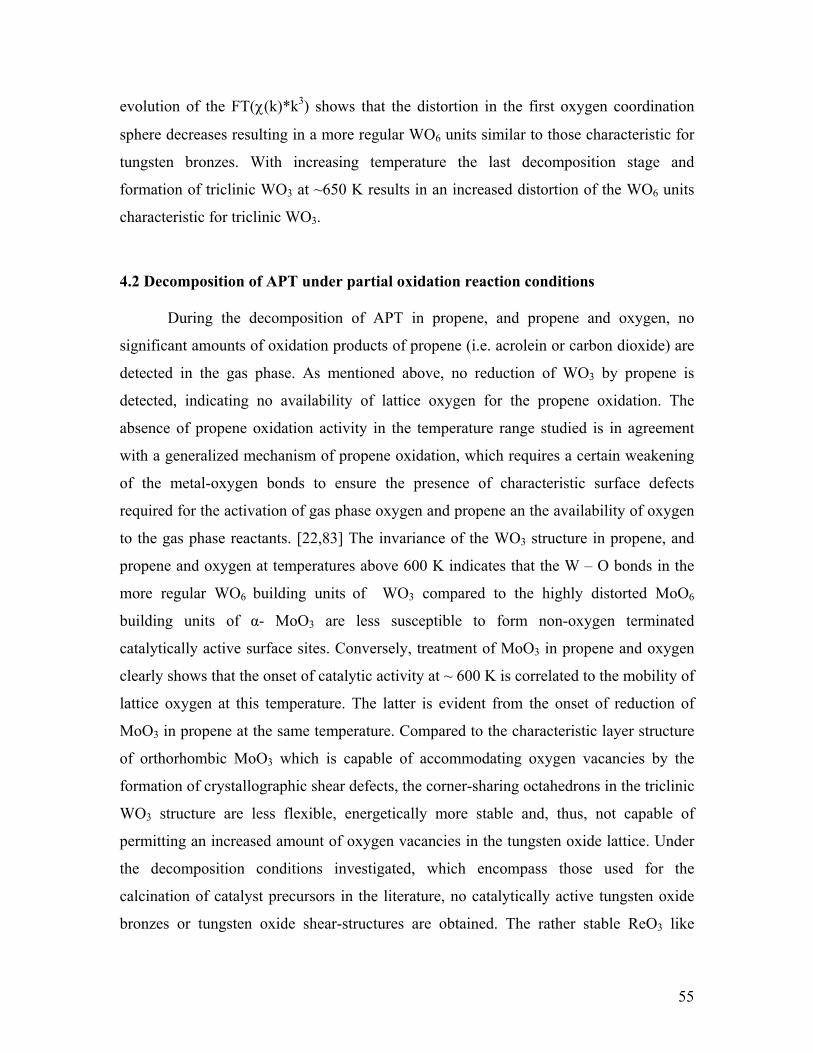
evolution of the FT(χ(k)*k3) shows that the distortion in the first oxygen coordination
sphere decreases resulting in a more regular WO6 units similar to those characteristic for
tungsten bronzes. With increasing temperature the last decomposition stage and
formation of triclinic WO3 at ~650 K results in an increased distortion of the WO6 units
characteristic for triclinic WO3.
4.2 Decomposition of APT under partial oxidation reaction conditions
During the decomposition of APT in propene, and propene and oxygen, no
significant amounts of oxidation products of propene (i.e. acrolein or carbon dioxide) are
detecte
oxygen
d in the gas phase. As mentioned above, no reduction of WO3 by propene is
detected, indicating no availability of lattice oxygen for the propene oxidation. The
absence of propene oxidation activity in the temperature range studied is in agreement
with a generalized mechanism of propene oxidation, which requires a certain weakening
of the metal-oxygen bonds to ensure the presence of characteristic surface defects
required for the activation of gas phase oxygen and propene an the availability of
to the gas phase reactants. [22,83] The invariance of the WO3 structure in propene, and
propene and oxygen at temperatures above 600 K indicates that the W – O bonds in the
more regular WO6 building units of WO3 compared to the highly distorted MoO6
building units of α- MoO3 are less susceptible to form non-oxygen terminated
catalytically active surface sites. Conversely, treatment of MoO3 in propene and oxygen
clearly shows that the onset of catalytic activity at ~ 600 K is correlated to the mobility of
lattice oxygen at this temperature. The latter is evident from the onset of reduction of
MoO3 in propene at the same temperature. Compared to the characteristic layer structure
of orthorhombic MoO3 which is capable of accommodating oxygen vacancies by the
formation of crystallographic shear defects, the corner-sharing octahedrons in the triclinic
WO3 structure are less flexible, energetically more stable and, thus, not capable of
permitting an increased amount of oxygen vacancies in the tungsten oxide lattice. Under
the decomposition conditions investigated, which encompass those used for the
calcination of catalyst precursors in the literature, no catalytically active tungsten oxide
bronzes or tungsten oxide shear-structures are obtained. The rather stable ReO3 like
55
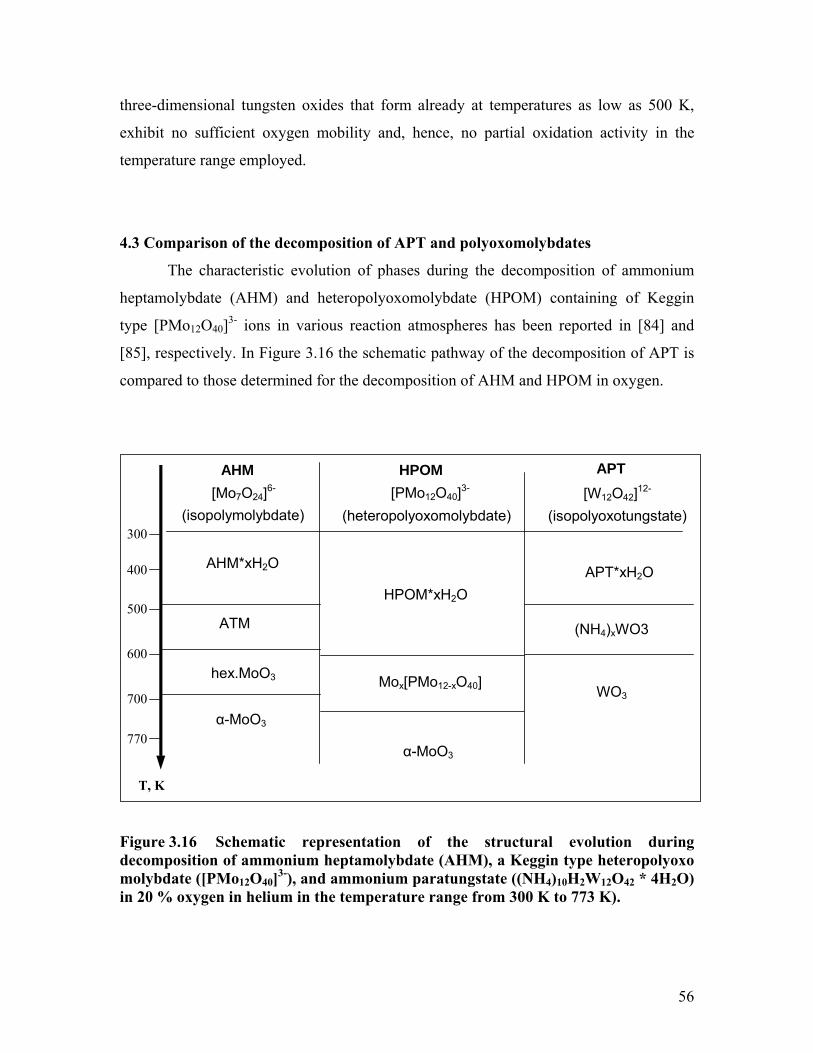
three-dimensional tungsten oxides that form already at temperatures as low as 500 K,
exhibit no sufficient oxygen mobility and, hence, no partial oxidation activity in the
temperature range employed.
4.3 Comparison of the decomposition of APT and polyoxomolybdates
of ammonium
heptamolybdate (AHM) and heteropolyoxomolybdate (HPOM) containing of Keggin
type [P
The characteristic evolution of phases during the decomposition
Mo12O40]3- ions in various reaction atmospheres has been reported in [84] and
[85], respectively. In Figure 3.16 the schematic pathway of the decomposition of APT is
compared to those determined for the decomposition of AHM and HPOM in oxygen.
AHM AHM*xH2O hex.MoO3
α-MoO3
HPOM
[PMo12O40]3-
(heteropolyoxomolybdate) α-MoO3
HPOM*xH2O
Mox[PMo12-xO40]
APT
(isopolyoxotungstate)[W12O42]12-
APT*xH2O
(NH4)xWO3
WO3
300
400
500
600
700
770
T, K
ATM
[Mo7O24]6-
(isopolymolybdate)
Figure 3.16 Schematic representation of the structural evolution during decomposition of ammonium heptamolybdate (AHM), a Keggin type heteropolyoxo molybdate ([PMo12O40]3-), and ammonium paratungstate ((NH4)10H2W12O42 * 4H2O) in 20 % oxygen in helium in the temperature range from 300 K to 773 K).
56
In all three cases, the decomposition starts with the loss of crystal water, present
in varying amounts in the three materials. The decomposition of the relatively small
Anderson type polyoxomolybdate ions of AHM proceeds according to a series of
olycondensation steps resulting in an increasing dimensionality of the structure of the
ecomposition intermediates. The X-ray amorphous phase that forms at ~ 500 K during
as ammonium
tetramo
ly.
contrast to the decomposition of APT, the products obtained from the decomposition
f AHM depend strongly on the gas atmosphere employed. During decomposition in
hydrogen a peculiar preferred orientation in the hexagonal MoO3 is detected followed by
a reduction of the MoO3 formed to nd, eventually, to Mo metal. In propene at 700
K and in helium at 773 K, MoO2 is eventually obtained from the reduction of the MoO3
formed. While hydrogen appears to be able to penetrate both the MoO3 and the MoO2
structure resulting in the reduction of the oxides to the metal, for the reduction of the
molybdenum oxides in propene and in helium mobility of oxygen in the lattice structure
is required. The latter seems to be sufficient in the orthorhombic layer structure of MoO3
in contrast to MoO2 where no further reduction to the metal is observed.
The products of the decom rhombic MoO3 and
triclinic WO3, respectively. MoO3 xhibits a layer structure. The subunits of this structure
are built from chains consisting of edge-sharing distorted Mo-O octahedra. WO3 exhibits
a distorted ReO3 structure, that co sists of [ReO6] octahedra that are linked together via
their corners. With no outer 4d electrons, MoVI ions do not participate in Mo-Mo
onding. The oxide chemistry of MoVI is varied and important because the π-bond
rge MoVI-
ion displacement toward one O2- ion, the π-bonding electrons are polarized strongly
p
d
the decomposition of AHM in flowing reactants could be identified
lybdate possessing a 1D chain structure. A three-dimensional lattice structure
(hexagonal MoO3) forms at ~ 600 K and is eventually transformed into orthorhombic
MoO3 at ~ 700 K. Evidently, the thermal decomposition of both APT and AHM proceeds
through the formation of an ammonium and water containing hexagonal phase which
eventually decomposes into mainly triclinic WO3 and orthorhombic MoO3, respective
In
o
MoO2 a
position of AHM and APT are ortho
e
n
b
component of the MoVI – O bond stabilizes MoVI in the several coordinations. [86]
Ferroelectric displacement polarizes the outer p6 electron cloud at an anion into the
shorter Mo-X bond and away from the longer Mo-X bond. In the limit of a la
57
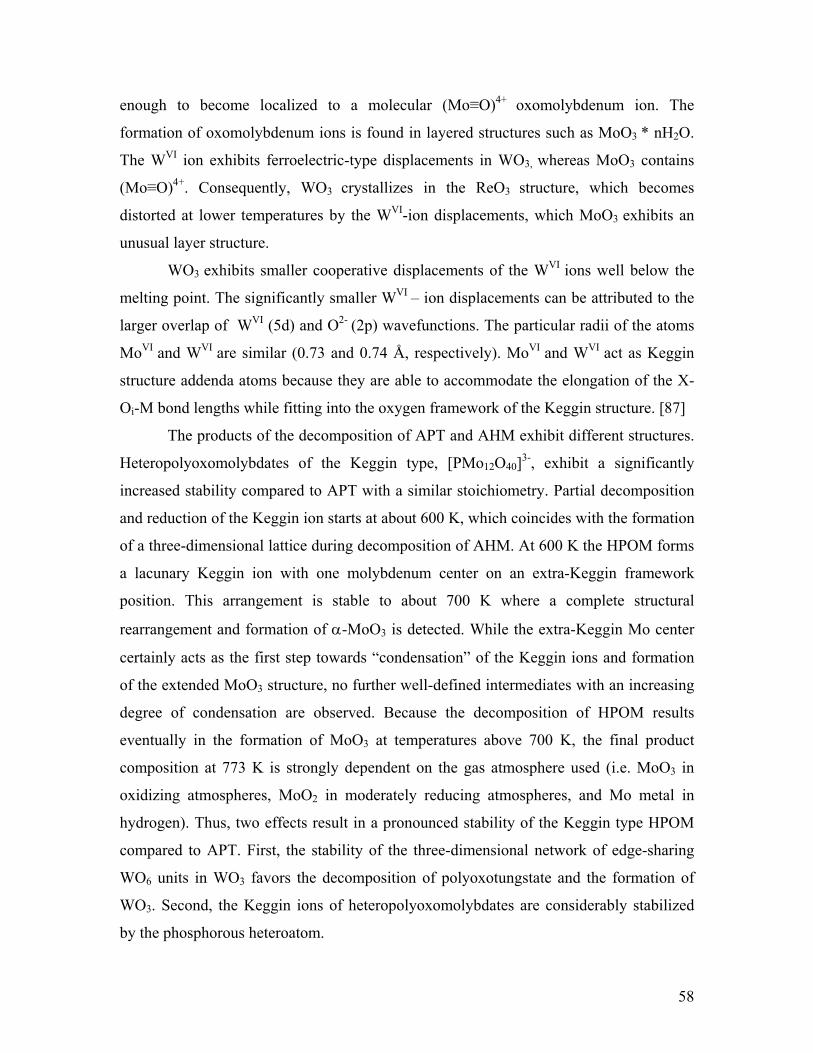
enough
s and formation
to become localized to a molecular (Mo≡O)4+ oxomolybdenum ion. The
formation of oxomolybdenum ions is found in layered structures such as MoO3 * nH2O.
The WVI ion exhibits ferroelectric-type displacements in WO3, whereas MoO3 contains
(Mo≡O)4+. Consequently, WO3 crystallizes in the ReO3 structure, which becomes
distorted at lower temperatures by the WVI-ion displacements, which MoO3 exhibits an
unusual layer structure.
WO3 exhibits smaller cooperative displacements of the WVI ions well below the
melting point. The significantly smaller WVI – ion displacements can be attributed to the
larger overlap of WVI (5d) and O2- (2p) wavefunctions. The particular radii of the atoms
MoVI and WVI are similar (0.73 and 0.74 Å, respectively). MoVI and WVI act as Keggin
structure addenda atoms because they are able to accommodate the elongation of the X-
Oi-M bond lengths while fitting into the oxygen framework of the Keggin structure. [87]
The products of the decomposition of APT and AHM exhibit different structures.
Heteropolyoxomolybdates of the Keggin type, [PMo12O40]3-, exhibit a significantly
increased stability compared to APT with a similar stoichiometry. Partial decomposition
and reduction of the Keggin ion starts at about 600 K, which coincides with the formation
of a three-dimensional lattice during decomposition of AHM. At 600 K the HPOM forms
a lacunary Keggin ion with one molybdenum center on an extra-Keggin framework
position. This arrangement is stable to about 700 K where a complete structural
rearrangement and formation of α-MoO3 is detected. While the extra-Keggin Mo center
certainly acts as the first step towards “condensation” of the Keggin ion
of the extended MoO3 structure, no further well-defined intermediates with an increasing
degree of condensation are observed. Because the decomposition of HPOM results
eventually in the formation of MoO3 at temperatures above 700 K, the final product
composition at 773 K is strongly dependent on the gas atmosphere used (i.e. MoO3 in
oxidizing atmospheres, MoO2 in moderately reducing atmospheres, and Mo metal in
hydrogen). Thus, two effects result in a pronounced stability of the Keggin type HPOM
compared to APT. First, the stability of the three-dimensional network of edge-sharing
WO6 units in WO3 favors the decomposition of polyoxotungstate and the formation of
WO3. Second, the Keggin ions of heteropolyoxomolybdates are considerably stabilized
by the phosphorous heteroatom.
58

With respect to the preparation of tungsten containing mixed metal oxide, the
differences in the decomposition schemes revealed for ammonium paratungstate
compared to other common catalyst precursors like ammonium heptamolybdate and
heteropolyoxomolybdates indicate certain prerequisites for suitable preparation routes.
Mo5O14 tolerates the incorporation of considerable amounts of V and W [88]. Thus,
mixed MoVW oxides are formed from MoO3, WO3, and V2O5 at high temperatures with
crystal
-t
o5
In addi
structures resembling that of Mo5O14 [89] The incorporation of W, especially,
seems to favour the formation of Mo5O14 ype oxides and can be compared with the
results on Ta and Nb incorporation. [90] Hence, it may be concluded that the
incorporation of about 8 at. % W into the investigated mixed M O14-type oxide leads to
its stabilization. Vanadium appears to be statistically incorporated into Mo5O14 [91],
although it seems to prefer octahedral sites close to a metal-metal bond (Mo5+/4+ centers).
tion, Mo5O14 seems to tolerate large variation in the V content up to 30 at.%.
Because of the low formation temperature of stable 3D lattice structure during
decomposition of APT, precursor mixtures with APT as a separate phase will most likely
result in oxide mixtures containing catalytically less interesting triclinic or hexagonal
tungsten oxides. Hence, in order to use the structure promoting and stabilizing effect of
W centers in mixed molybdenum oxide catalysts, tungsten has to be incorporated into the
Mo precursors to ensure presence of W in the final catalyst and stabilizing and promoting
properties.
59

Concl
en
iate
n.
During the thermal treatment of APT, major changes occur at ~ 500 K where a
complete structural rearrangement takes place resulting in the destruction of the
polyoxotungstate ion of APT and the formation of a tungsten oxide bronze. The
formation of three-dimensional structure consisting of corner-shared WO6 units takes
place at rather low temperature compared to the thermal treatment of common
polyoxomolybdate.
(MoVW)5O14-type oxides are promising candidates for the active and selective
phase in partial oxidation reactions. These oxides are complex systems containing several
minorities species besides the Mo5O14-type phase, which is highly variable in its
chemical composition and oxidation state. Ammonium paratungstate (APT) is used as
usions The results obtained from bulk structural studies on the thermal decomposition of
APT are present in this work. Temperature programmed decomposition was performed
at temperatures between 293 K to 773 K in various atmospheres (helium, 5 % hydrog
in He, 20 % oxygen in He, 10 % propene in He, and 10 % propene and 10 % oxygen in
He). The decomposition of APT was investigated by the complementary techniques in
situ XAS, in situ XRD, and TG/DSC combined with mass spectrometry.
From 300 K to 650 K the decomposition of APT is independent of the
atmosphere. Oxidizing atmosphere results in the formation of crystalline triclinic WO3 as
the majority phase at 773 K. The decomposition of APT in mildly reducing atmospheres
(propene, propene and oxygen and helium) results in the formation of partially reduced
and highly disordered tungsten bronzes. The decomposition in hydrogen results in
reduced tungsten oxides and, eventually, in the complete reduction of the intermed
tungsten oxides to W metal. During the decomposition of APT in propene and propene
and oxygen, no oxidation products of propene were detected in the gas phase. Reduction
of WO3 to W metal takes place during the decomposition of APT in hydrogen, whereas
no reduction of the resulting WO3 is detected in propene and in propene and oxygen. This
is in contrast to the reactivity of MoO3 in the same temperature range, where the onset of
reduction and catalytic activity at ~ 620 K is correlated to the onset of the mobility of
lattice oxyge
60

precursor for the production of tungsten trioxide (WO3) and for the synthesis of
(MoVW
a multi-element
selectiv
)5O14-type oxides. Tungsten plays an important role as a structural or electronic
promoter in the formation and stabilization of these oxides. WO6 octahedra will stabilise
the corner-sharing connectivity due to electrostatic interaction of the metal centers and so
prevent agglomeration of the cluster units. Tungsten needs to be incorporated in regular
molybdenum oxide structures already at a very early stage of the catalyst preparation.
The above finding allows discussing part of the mode of action of
e oxidation catalyst.
61
Ausblick
In der vorliegenden Arbeit liegen Ergebnisse zur Zersetzung von
Ammoniumparawolframat vor. Diese Ergebnisse bilden die Grundlage für die
Untersuchung von Systemen, in denen neben Ammoniumparafolframat auch andere
Substanzen als Präkursoren zum Einsatz kommen. Eine genau Kenntnis der Reaktionen,
die während der thermischen Zersetzung der Prekursoren ablaufen, und die Genese der
verschiedenen polykondensierten dreidimensionalen Mischoxide ist erforderlich, wenn
zielgerichtet verschiedene Mischoxidsysteme als Modellkatalysatoren hergestellt werden
sollen. Die Kombination von in situ XAS und in situ XRD Studien mit simultaner
Messung der Gasphase in Kombination mit einer Analyse der Kinetik mittels TG/DSC
wurde als Methode zur Bestimmung des Zersetzungsschemas vorgeschlagen.
Die durchgeführten Analysen der EXAFS-Spektren zeigen deutlich das Potential,
dass diese Methode in der in situ Charakterisierung von strukturellen Änderungen der
Nahordnung zukommt. Dies bietet einen Ausgangspunkt, die hier eingesetzten Verfahren
auch auf andere Systeme und andere Fragestellungen anzuwenden.
Die Bildung von Wolframoxide und ihre Charakterisierung bezüglich der
katalytischen Aktivität bieten die Grundlage für weitere Untersuchungen der
Partialoxidation von leichten Alkenen und andere Partialoxidationsreaktionen.
62

Index of figures igure
perated in
tr
Figure
gure 3.3A Experimental (dotted) and theoretical (solid) W LIII XAFS FT(χ(k)*k3) of
ammonium paratungstate ((NH4)10H2W12O42 * 4H2O). Structural parameters are
given in Table 3.1.
Figure 3.3B Schematic representation of the polyoxotungstate ion (W12O4212-) of APT in
two different viewing directions.
Figure 3.4 Evolution of weight loss during decomposition of ammonium paratungstate
((NH4)10H2W12O42 * 4H2O) in (1) 20 % oxygen in helium, (2) 10 % propene and 10
% oxygen in helium, (3) helium, (4) 10 % propene in helium, and (5) 5 % hydrogen
in helium (flow rate 100 ml/min, heating rate 6 K/min) (A) together with the MS
signals for H2O (m/e=18) and NH3 (m/e=15) measured for the decomposition of
APT in 20 % oxygen in helium (B).
Figure 3.5 Comparison of the DSC signal measured during decomposition of ammonium
paratungstate ((NH4)10H2W12O42 * 4H2O) in helium (solid), 20 % oxygen in helium
F 1.1 The overview of the structure of triclinic tungsten trioxide.
Figure 1.2 The overview of the structure of hexagonal ammonium bronze.
Figure 1.3 The overview of the structure of [H2W12O42]10--anion.
Figure 2.1 The reflectance of the X-rays of the lattice planes of the crystal.
Figure 2.2 The schematic setup of a STOE Bragg-Brentano diffractometer equipped
with a Bühler HDK S1 high temperature cell (A) and the detail view of high-
temperature cell (B).
Figure 2.3 The schematic setup of a typical beamline.
Figure 2.4 The schematic setup of the in situ XAS-cell operated in transmission
geometry (A) and the photographic view of the in situ XAS-cell o
ansmission geometry (B).
Figure 3.1 Experimental (dotted) and simulated (solid) X-ray diffraction pattern of
ammonium paratungstate (APT, (NH4)10H2W12O42 * 4H2O), together with a
schematic structural representation.
3.2 Scanning electron micrographs of a sieved fraction of as-purchased
ammonium paratungstate ((NH4)10H2W12O42 * 4H2O) with particles in the size
range from 100 to 200 µm.
Fi
63

(dashed), 5% hydrogen in helium (dotted), and 10% propene in helium (dash-
(A)).
mposition of
(dotted) and without
from 300 K – 770 K (effective heating rate 0.1 K/min, flow
osition are indicated.
w rate 40 ml/min). Three principle regions can be
Figu patterns measured during decomposition of
r stages of the decomposition are indicated.
770 K (effective heating rate 0.1 K/min, flow rate 80 ml/min).
Figu simulated (solid) X-ray diffraction pattern of the
Figu
in 10% propene plus 10 % oxygen in helium
dotted) (for the corresponding weight loss evolution see Figure 3.4
Figure 3.5A Comparison of the TG and DSC signal measured during deco
ammonium paratungstate in helium in crucible with cover
cover (solid).
Figure 3.6 Evolution of X-ray diffraction patterns measured during decomposition of
ammonium paratungstate ((NH4)10H2W12O42 * 4H2O) in 20 % oxygen in helium in
the temperature range
rate 80 ml/min). Three major stages of the decomp
Figure 3.7 Evolution of W LIII edge XAFS FT(χ(k)*k3) of ammonium paratungstate
((NH4)10H2W12O42 * 4H2O) during decomposition in 20 % oxygen in helium
(heating rate 5 K/min, flo
distinguished: (300 – 500 K) APT, (500 – 650 K) (NH4)xWO3, (650 – 770 K)
triclinic WO3.
re 3.8 Evolution of X-ray diffraction
ammonium paratungstate ((NH4)10H2W12O42 * 4H2O) in 5 % hydrogen in helium in
the temperature range from 300 K – 770 K (effective heating rate 0.1 K/min, flow
rate 80 ml/min). Three majo
Figure 3.9 Evolution of X-ray diffraction patterns measured during decomposition of
ammonium paratungstate ((NH4)10H2W12O42 * 4H2O) in static air in the temperature
range from 300 K –
Three major stages of the decomposition are indicated.
re 3.10 Experimental (dotted) and
product of the decomposition of ammonium paratungstate ((NH4)10H2W12O42 *
4H2O) in 20 % oxygen in helium (300 K – 770 K), together with a schematic
structural representation of the corresponding triclinic WO3 phase.
re 3.11 Scanning electron micrographs of the products of the thermal decomposition
of ammonium paratungstate ((NH4)10H2W12O42 * 4H2O) in 20 % oxygen in helium
(A), in static air (B), in helium (C),
(D) and in 10 % propene in helium (E).
64
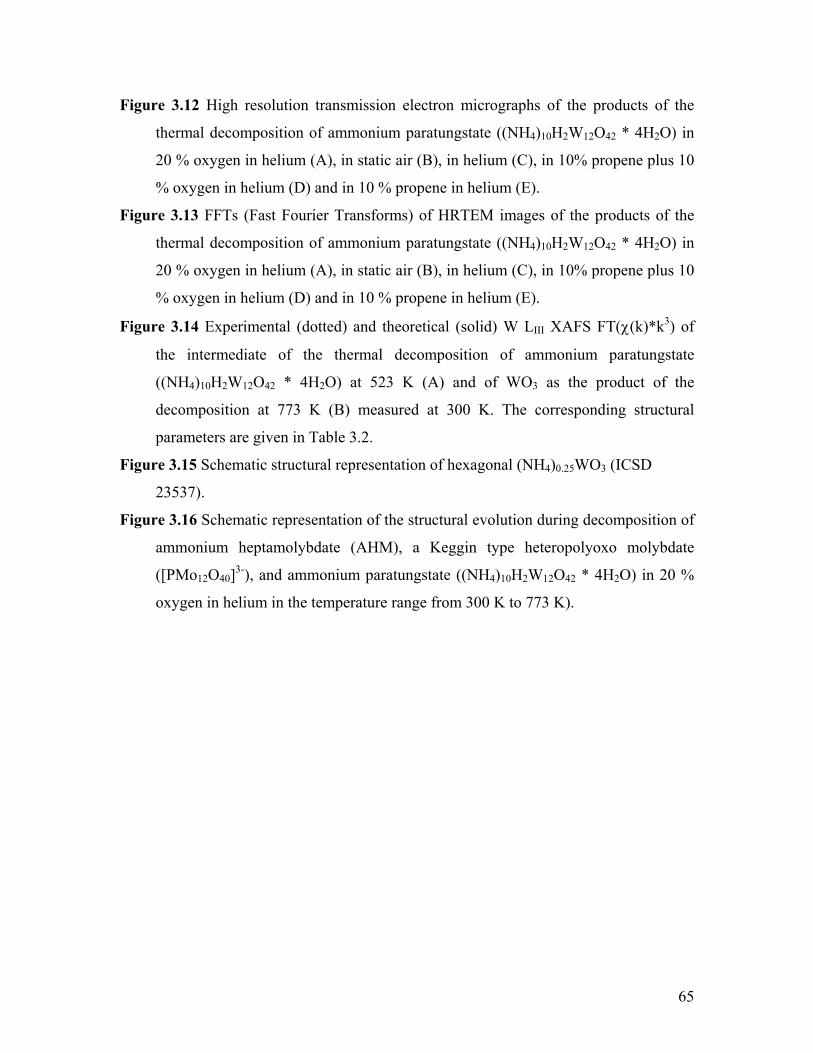
Figur
4H2O) in
Figur Fast Fourier Transforms) of HRTEM images of the products of the
Figu χ(k)*k3) of
Figur esentation of hexagonal (NH4)0.25WO3 (ICSD
Figu
e 3.12 High resolution transmission electron micrographs of the products of the
thermal decomposition of ammonium paratungstate ((NH4)10H2W12O42 *
20 % oxygen in helium (A), in static air (B), in helium (C), in 10% propene plus 10
% oxygen in helium (D) and in 10 % propene in helium (E).
e 3.13 FFTs (
thermal decomposition of ammonium paratungstate ((NH4)10H2W12O42 * 4H2O) in
20 % oxygen in helium (A), in static air (B), in helium (C), in 10% propene plus 10
% oxygen in helium (D) and in 10 % propene in helium (E).
re 3.14 Experimental (dotted) and theoretical (solid) W LIII XAFS FT(
the intermediate of the thermal decomposition of ammonium paratungstate
((NH4)10H2W12O42 * 4H2O) at 523 K (A) and of WO3 as the product of the
decomposition at 773 K (B) measured at 300 K. The corresponding structural
parameters are given in Table 3.2.
e 3.15 Schematic structural repr
23537).
re 3.16 Schematic representation of the structural evolution during decomposition of
ammonium heptamolybdate (AHM), a Keggin type heteropolyoxo molybdate
([PMo12O40]3-), and ammonium paratungstate ((NH4)10H2W12O42 * 4H2O) in 20 %
oxygen in helium in the temperature range from 300 K to 773 K).
65
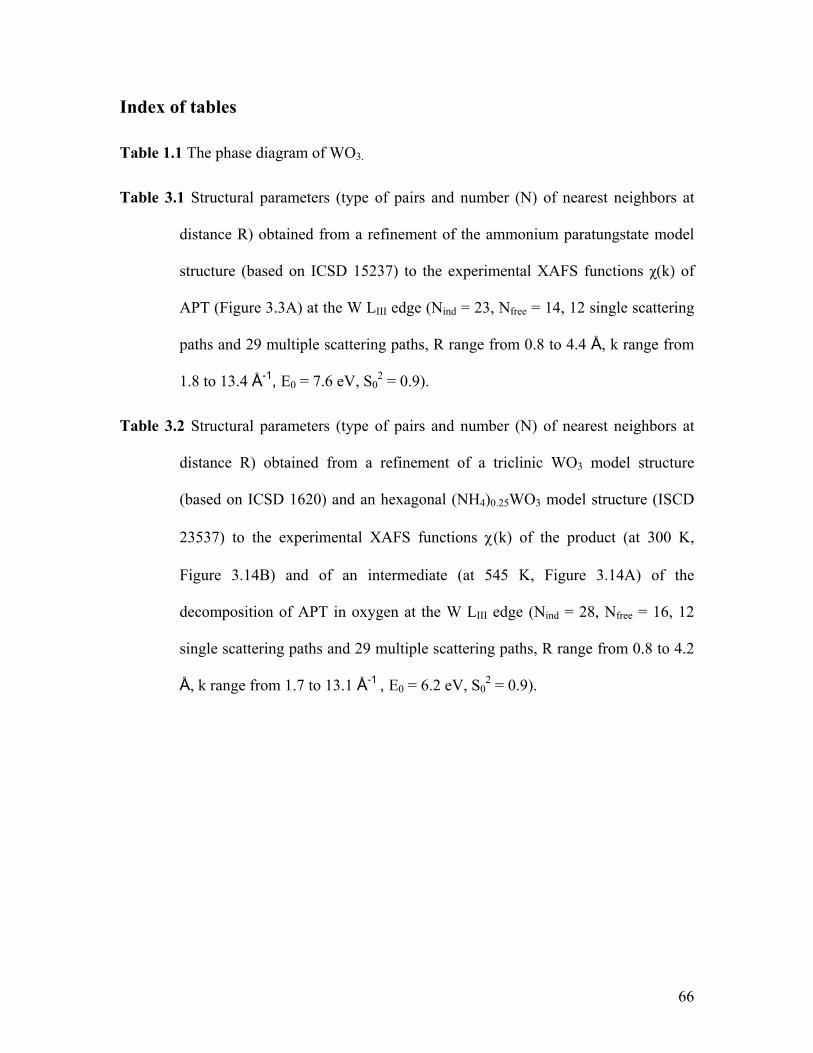
Index of tables
e 1.1 The phase diagram of WO3.
e 3.1 Structural parameters (type of pairs and number (N) o
Tabl
Tabl f nearest neighbors at
III ind free 4, 12 single scattering
Table 3.2 f pairs and number (N) of nearest neighbors at
ture
d on ICSD 1620) and an hexagonal (NH4)0.25WO3 model structure (ISCD
8, Nfree = 16, 12
single scattering paths and 29 multiple scattering paths, R range from 0.8 to 4.2
Å, k range from 1.7 to 13.1 Å-1 , E0 = 6.2 eV, S02 = 0.9).
distance R) obtained from a refinement of the ammonium paratungstate model
structure (based on ICSD 15237) to the experimental XAFS functions χ(k) of
APT (Figure 3.3A) at the W L edge (N = 23, N = 1
paths and 29 multiple scattering paths, R range from 0.8 to 4.4 Å, k range from
1.8 to 13.4 Å-1, E0 = 7.6 eV, S02 = 0.9).
Structural parameters (type o
distance R) obtained from a refinement of a triclinic WO3 model struc
(base
23537) to the experimental XAFS functions χ(k) of the product (at 300 K,
Figure 3.14B) and of an intermediate (at 545 K, Figure 3.14A) of the
decomposition of APT in oxygen at the W LIII edge (Nind = 2
66

Publication Index
tural evolution of Ammonium Paratungstate
during thermal decomposition
submitted
Structura
O. Kirile
Annual R
In-situ XA
O. Kirilenko, F. Girgsdies, R. E. Jentoft, T. Ressler
Annual Report HASYLAB 2003
In-situ XAS Study on the Decomposition of Ammonium Paratungstate in Various
Atmosph
O. Kirile
Annual R
In situ XAS and XRD study on the struc
O. Kirilenko, F. Girgsdies, R. E. Jentoft, T. Ressler
to: European Journal of Inorganic Chemistry
l evolution of Ammonium Paratungstate during thermal decomposition
nko, F. Girgsdies, R. E. Jentoft, T. Ressler
eport HASYLAB 2004
S Study on the Thermal Decomposition of Ammonium Paratungstate
eres
nko, F. Girgsdies, R. E. Jentoft, J. Wienold, T. Ressler
eport HASYLAB 2002
67
Lebenslauf Olga Kirilenko
geboren am 10.12.1972 in Minsk, Belarus (Weissrussland)
chulbesuch
k
Abschluss: Abitur
ochschulstudium
tät
chen Staatlichen Universität in
Minsk
Abschluss: Diplom Chemie-Ingenieurin, Chemie-
Lehrerin
keit
ssenschaften von
Weissrussland in Minsk als Wissenschaftliche
Assistentin
Promotion
2001-2004 Synthese und Festkörperdynamik komplexer Molybdate
Fritz-Haber-Institut der Max-Planck-Gesellschaft,
Abteilung Anorganische Chemie, Prof. Dr. R. Schlögl,
Arbeitsgruppe Geometric Structure unter der Leitung
von Dr. T. Ressler
Staatsangehörigkeit: weissrussisch
Familienstand: ledig, keine Kinder
S
1980-1983 Grundschule Minsk
1983-1990 Gesamtschule Mins
H
1990-1995 Studium der Chemie an der Chemischen Fakul
an der Weissrussis
Erwerbstätig
1995-2001 Arbeit in der Akademie der Wi
68

List of abbreviation and symbols
Abbreviations:
CN Coordination numbers
Ammonium heptamolybdate
Ammonium paratungstate
TM Ammonium tetramolybdate
TA Differential Thermal Analyse
Differential scanning calorimetry
sorption fine structure
rm
RTEM High-resolution transmission electron microscopy
International Centre for Diffraction Data
MS
PDF Powder Diffraction File
RDF
RT Room temperature
SEM Scanning electron microscope
Transmission electron microscope
XANES
XAS X-ray absorption spectroscopy
RD X-ray diffraction
Symbols:
AHM
APT
A
D
DSC
EM Electron micrograph
EXAFS Extended X-ray ab
FT Fourier transfo
H
ICDD
ICSD Inorganic Crystal Structure Database
Mass spectrometry
Radial distribution function
TEM
TG Thermogravimetry
X-ray absorption near edge structure
X
χ (k)
hkl Miller’sche Indices
a, b, c, α, β, γ Lattice parameter
EXAFS function
69
dhkl Spacing between the crystal planes
Binding energy of the photoelectron
ion)
toelectron
E0
h Plancks constant
k Photoelectron wavenumber
∆l Path difference (Bragg equat
λ Wavelength
m Photoelectron mass
p Momentum of the pho
PCA Principal Component Algorithm
R Distance
S02 Amplitude reduction factor
ν Frequency
φij(k) Phase shift due to the atomic potentials
∆µx Edge jump
σ2j Debye Waller factor
µ (k) Measured absorption
µo (k) Atomic absorption
θhkl Particular Bragg angle
70
References
1] R. A. van Santen, Theoretical Heterogeneous Catalysis, World Scientific Singapore,
.
k, 1991.
8, 30, 249-280.
115-135.
sselli, J. D. Burrington, A
et. Catal.
ak, Czech. Nauk. Politech.
213.
, Appl. Catal A 1996, 81,
134.
[15] H. Werner, O.Timpe, D. Herein, Y. Uchida, N. Pfänder, U. Wild, R. Schlögl, Catal.
Lett. 1997, 44, 153-163.
[16] Y. Uchida, G. Mestl, O. Ovsitser, J. Jäger, A. Blume, R. Schlögl, J. of Mol. Catal.
A: Chemical 2002, 187, 247-257.
[17] S. Knobl, G.A. Zenkovets, G. N. Kryukova, O. Ovsitser, D. Niemeyer, R. Schlögl,
G. Mestl, J. of Catal., 2003, 215, 177-187.
[18] A. H. Adams, F. Haass, T. Buhrmester, J. Kunert, J. Ott, H. Vogel, H. Fuess, J. of
Mol. Catal. A: Chemical, 2004.
[19] J. Kunert, A. Drochner, J. Ott, H. Vogel, H. Fuess, Appl. Catal. A: General, 2004,
269, 53-61.
[20] L. Kihlborg, Ark Kemi 1963, 21, 427.
[
1991.
[2] R. Burch, In situ Methods in Catalysis, Catalysis Today, 1991, 9
[3] A. Bielanski, J. Haber, Oxygen in Catalysis, Marsel Dekker, New Yor
[4] J. S. Lee, S. T. Oyama, Catal. Rev.-Sci. Eng. 198
[5] F. Cavani, F. Trifiro, Catal. Today 1995, 24, 307-313.
[6] E. Bordes, R. M. Contractor, Topics Catal. 1996, 3, 365-375.
[7] E. A. Mamedov, C. Corberan, Appl. Catal. A 1995, 127, 1-40.
[8] F. Cavani, F. Trifiro, Appl. Catal. A 1992, 88,
[9] R. K. Gra dv. Catal., 1981, 30, 133.
[10] M. Ai, Appl. Catal. 1986, 27, 167.
[11] L. M. Plysova, L. P. Soloveva, G. N. Kryukova, T. V. Andrushkevich, Kin
1990, 31, 1253.
[12] J. Tichy, J. Svachula, J. Farbotko, J. Goralski, T. Paryjc
Lodz. Chem. 1991, 616, 95-105.
[13] T. V. Andrushkevich, Catal. Rev.-Sci. Eng. 1993, 35,
[14] S. Breiter, M. Estenfelder, H.-G. Lintz, A. Tenten, H.Hibst
71

] T. Ekström, M. Nygren, Acta Chem. Scand. 1972, 26, 1827-1835.
[22] P. Mars, D. W. van Krevelen, Chem. Ing. Sci. 1954, 3, 41-52.
[24 mpe, T. Ressler, Eur. J. Inorg. Chem. 2003, 1058-1071.
17.
Phys. Condens. Matter. 2004,
econd edition,
v. Press, Delft, 1991.
van Rosmalen, Hydrometallurgy 1993, 34, 187-
[31 emistry of the Elements. Second edition, Butterworth-Heinemann,
[32 4, 144, 75-100.
g. Chem. 2003, 629,
[34 rewes, E.M. Limanski, M. Piepenbrink, B. Krebs, Z. Anorg. Allg. Chem. 2004,
[35] E himica Acta 2000, 343, 139-143.
[37] assegues, B. Gerand, M. Figlarz, J. Solid State
[38 n Rosmalen, Hydrometallurgy 1993, 187-
[39 State Chem. 1994, 110, 187-189.
stal Growth 1996, 169, 727-733.
[21
[23] J. Haber, E. Lalik, Catal. Today 1997, 30, 119-137.
] J. Wienold, O. Ti
[25] J. Wienold, O. Timpe, T. Ressler, Chem. Eur. J. 2003, 9, 6007-60
[26] A. F. Holleman, Lehrbuch der anorganischen Chemie, Berlin; New York: de
Gruyter, 1995, 1457-1478.
[27] A.D. Walkingshaw, N.A. Spaldin, and E. Artacho, J.
2, 2335.
[28] L. Smart, E. Moore, Solid State Chemistry. An introduction. S
Chapman and Hall, 1995, 198-201.
[29] J.W. Van Put, Ph. D. Thesis, Delft Univ. Technol., Delft Uni
[30] J.W. Van Put, G.J. Witkamp, G.M.
201.
] Greenwood, Ch
1997, 1030-1031.
] J. F. Keggin, Proc.Roy.Soc.A 193
[33] W.-B. Yang, C.-Z. Lu, X. Lin, H.-H. Zhuang, Z. Anorg. All
2046-2052.
] D. D
630, 58-62.
. Lassner, W. Schubert, Thermoc
[36] B. Gerand, G. Nowogrocki, M. Figlarz, J. Solid State Chem. 1981, 38, 312-320.
M. F. Daniel, B. Desbat, J. C. L
Chem. 1987, 67, 235-247.
] John W. van Put., G. J. Witkamp, G. M. va
201.
] Y. Zhu, A. Manthiram, J. Solid
[40] J. Pfeifer, E. Badaljan, P. Tekula-Buxbaum, T. Kovacs, O. Geszti, A. L. Toth, H.-J.
Lunk, J. Cry
72

1994, 239, 137-
, 167, 425-434.
1, 56-61.
72, 1025-1028.
Appl.
86.
[48 ula-Buxbaum, K. Vadasdi, J. Solid State Chem.
[50 . Grasselli, Catal Today 1999, 49, 141
[52 op. Catal. 2002, 21, 1-3, 79-88.
1-4.
5,
[56 . J. D. Tilley, Phil. Trans. Roy. Soc. A 1977, 286, 55.
o, J.
[59] os, F. Verpoort, P. Jacobs, Catal. Today 2000, 60, 209-
[60 ’Keeffe, Fast Ion Transport in Solids. Solid state batteries and devices,
[41] N. E. Fouad, A. K. H. Nohman, M. J. Zaki, Thermochimica Acta
145.
[42] M. Boulowa, G. Lucazeau, J. Solid State Chem. 2002
[43] C. Li, H. Zhang, K. Wang, Y. Miao, Q. Xin, Appl. Spectroscopy 1993, 47,
[44] I. K. Bhantagar, D. K. Chakrabarty, A. B. Biswas, Indian J. Chem. 19
[45] N. E. Fouad, A. K. H. Nohman, M. A. Mohamed., M. J. Zaki, J. Anal. and
Pyrolysis 2000, 56, 23-31.
[46] X. S. Li, B. Z. Zhu, L. Wang, Y. F. Miao, Q. Xin, Chin. Chem. Letters 1995, 6,
1085-10
[47] N. E. Fouad, A. K. H. Nohman., Thermochimica Acta 2000, 343, 139-143.
] J. Pfeifer, E. G. Badaljan, P. Tek
1993, 105, 588-594.
[49] B. Grzybowska-Swierkosz, Top. Catal. 2000, 11/12, 23-42.
] R. K
[51] J.Haber, E. Lalik, Catal. Today 1997, 33, 119
] R. K. Grasselli, T
[53] R. K. Grasselli, R. Schlögl, Top. Catal. 2003, 23,
[54] J. Haber, W. Marrczewski, J. Stoch, L. Ungier, Ber. Bunsenges. Phys. Chem. 197
79, 970.
[55] F. S. Stone, J. Solid State Chem., 1975, 12, 271
] E. Iguchi, R
[57] E. Iguchi, R. J. D. Tilley, J. State Chem. 1981, 37, 112.
[58] I. Rodriguez-Ramos, A. Guerro-Ruiz, N. Homs, R. de la Piscina, J. L. G. Fierr
Mol. Catal. 1995, 95, 147-156.
D. Hoegaets, B. Sels, D. F
218.
] M. O
Elsevier, New York, 1973, 233-247.
[61] A. Cimino, F.S. Stone, Adv. Catal. 2002, 47, 141-306.
73

03.
[66] Proc. Roy. Soc. London (A) 1913, 88, 428.
1 ulevard, Newtown Square, PA 19073-3273 U.S.A., www.ICDD.com.
[62] S. De Rossi, I. Igughi, M. Schiavello, R. J. D. Tilley, Z. Phys. Chem. 1976, 103, 193-
202.
[63] J. Haber, I. Janas, M. Schiavello, R. J. D. Tilley, J. Catal. 1983, 395-4
[64] S. Barber, J. Booth, D. R. Pyke, R. Reid, R. J. D. Tilley, J. Catal. 1982, 77, 180-
191.
[65] M. Laue, Physik Z. 1913, 14, 1075.
W. H. Bragg, W.L. Bragg,
[67] Powder Diffraction File 2 (PDF 2) from International Centre for Diffraction Data,
2 Campus Bo
Z) [68] Inorganic Crystal Structure Database (ICSD); Fachinformationszentrum (FI
Karlsruhe, www.fiz-Karlsruhe.de.
[69] veld Method, Oxford, 1996.
amaker, Topics Catal.
ysics 2000, 72 (3), 621-654.
hem. B 1999, 103, 6407.
Rev. B. 1994, 49, 12347.
, Wiley-VCH, 1997.
. M. Günter. Topics Catal. 2002,
nce, in a collaborative effort
[77] 1998, 5, 118.
[79 eifer, E. G. Badaljan, P. Tekula-Buxbaum, K. Vadasdi, J. Solid State Chem.
[80] . Miao, Q. Xin, Chin. Chem. Letters 1995, 6,
[81] N. E. Fouad, A. K. H. Nohman., Thermochimica Acta 2000, 343, 139-143.
R. A.Young, The Riet
[70] D. C. Koningsberger , B.L. Mojet, G. E. van Dorssen, D. E. R
2000, 143, 10.
[71] J. J. Rehr, R. C. Albers, Reviews in Modern Ph
[72] T. Ressler, S.L. Brock, J. Wong, S.L. Suib, Phys. C
[73] J. J. Rehr, C. H. Booth, F. Bridges, S.I. Zabinsky, Phys.
[74] M. Vaarkamp, D. C. Koningsberger, Handbook of Heterogeneous Catalysis,
Weinheim
[75] T.Ressler, J.Wienold, R. E. Jentoft, T. Neisius, M
18 (1-2), 45-52.
[76] Designed by M. Hagelstein, T. Neisius, et al., ESRF, Fra
with the Fritz-Haber-Institut, Berlin, Germany, 1997.
T. Ressler, J. Synchrotron Rad.
[78] I. K. Bhantagar, D. K. Chakrabarty, A. B. Biswas, Indian J. Chem. 1972, 1025-1028.
] J. Pf
1993, 105, 588-594.
X. S. Li, B. Z. Zhu, L. Wang, Y. F
1085-1086.
74

[83] sler, J. Wienold, R. E. Jentoft, F. Girgsdies, Eur. J. Inorg. Chem. 2003, 301-
[85] J old, O. Timpe, T. Ressler, Chem. Eur. J. 2003, 9, 1-12.
Int. Conf. on the Chemistry and Uses of
, Y.
tal. A: Chemical 2000, 162, 463-492.
66.
[82] T. Ressler, R.E. Jentoft, J. Wienold, T. Neisius, J. Catal. 2002, 210, 67 – 83.
T. Res
312.
[84] J. Wienold, R. E. Jentoft, T. Ressler, Eur. J. Inorg.Chem. 2003, 1058-1071.
. Wien
[86] I. B. Goodenough, Proc. Climax 4th
Molybdenum, Climax Molybdenum Comp., Ann Arbor, MI, 1982, 1.
[87] N. Ohler, Chem. Eng.245: Catalysis, Spring 2002.
[88] L. Kihlborg, Acta Chem. Scand. 1969, 23, 1834.
[89] G. Mestl, Ch. Linsmeier, R. Gottschall, M. Dieterle, J. Find, D. Herein, J. Jäger
Uchida, R. Schlögl, J. of Mol. Ca
[90] N. Yamazoe, L. Kihlborg, Acta Cryst. 1975, B31, 16
[91] T. Ekström, Acta Chem. Scand. 1972, 26, 3381.
75


