

SECTORAL ANALYSIS: Dairy, Tomato, Cereal, Poultry AERI
i
SECTORAL ANALYSIS:
DAIRY, TOMATO, CEREAL, POULTRY
Editors
Ġlkay DELLAL
Agricultural Economics Research Institute, Turkey, (AERI)
Siemen van BERKUM
Agricultural Economics Research Institute, The Netherlands, (LEI)
ANKARA
March 2009

SECTORAL ANALYSIS: Dairy, Tomato, Cereal, Poultry AERI
ii
PUBLICATION NUMBER: 171
ISBN 978–975–407–268–6
Copyright 2009 by Agricultural Economics Research Institute.
Authors are responsible for opinions expressed in the report.
All rights reserved.
No part of this report may be reproduced or stored in any form or by
any means mechanical, electronic, photocopy, magnetic, tape or
otherwise, without permission in writing from Agricultural Economics
Research Institute.
This study was carried out within the context of EU Impact Analysis studies of
Agricultural Economics Research Institute (AERI) and in cooperation with
Agricultural Economics Research Institute of the Netherlands (LEI).
SECTORAL ANALYSIS: Dairy, Tomato, Cereal, Poultry AERI
iii
CONTENTS
Agricultural Sector Analysis in Turkey and Integration to the EU : Dairy, Tomato, Cereals,
Poultry, İ. Dellal, S. van Berkum ................................................................................................... 1
Turkish Dairy Sector Analysis, K. Taşdan, S. İriboy, A. Çeliker, U.Gül, Y. İçöz, S. van Berkum .... 9
Turkish Tomato Sector Analysis, G. Keskin, T. Özüdoğru, C. Nazlı, S.van Berkum ..................... 58
Turkish Cereal Sector Analysis, H. Ege, D.Dönmez, N.Yılmaz, John Belt ................................... 89
Turkish Poultry Meat Sector Analysis, H.Çınar, A.Demir, Ş.Kalanlar,B.Taşkaya, S. van Berkum
................................................................................................................................................ 124


SECTORAL ANALYSIS: Dairy, Tomato, Cereal, Poultry AERI
1
Agricultural Sector Analysis in Turkey and Integration to the EU :
Dairy, Tomato, Cereals, Poultry
Ġlkay DELLAL Siemen van BERKUM
AERI LEI
1. INTRODUCTION
Turkey has a long history in its way of becoming a member of the European Union (EU). This
history started in 1959 with Turkey‟s application to the then one year old European Economic
Community. In 1963 Turkey and the EEC signed the Ankara Agreement, an association
agreement covering the liberalisation of markets for goods and financial aid. Turkey applied
for membership of the European Community in 1987 and in 1996 the Turkey-EU Customs
Union took effect. Agricultural products were not included in the Customs Union, although a
significant part of agricultural trade takes place under preferential agreements. Turkey
achieved candidate status at the 1999 Helsinki Summit but only in 2004, the EU declared that
Turkey had made enough progress to begin talks that should result into membership of the
Union. This process of accession negotiations – which is basically a negotiation on the
duration and content of a transition period Turkey would need before the country would fully
comply with all criteria and conditions of an EU membership - still continues in 2009. In this
long history many changes have happened in agriculture, agricultural markets and policies at
both sides.
In the 1950s agricultural policy in Western Europe centered around subsidizing farmers to
provide enough food for Europe after war-induced shortages. Once EU self-sufficiency
was reached from the 1980s onwards, the policy led to almost permanent surpluses of basic
farm commodities ('butter mountains', 'wine lakes', etc.). The CAP was
subsequently increasingly used for export and storage subsidies. A series of reforms have
taken place over the past two decades to remedy the surplus problem and take account of the
environmental sustainability of agriculture (1).

SECTORAL ANALYSIS: Dairy, Tomato, Cereal, Poultry AERI
2
The first major reform of the CAP was implemented in 1992, to limit rising production, while
at the same time adjust to the trend towards freer agricultural markets. The reform also
created 'set-aside' payments to withdraw land from production, limit stock levels and
introduce measures to encourage retirement and forestation (1).
The second major CAP reform was adopted as part of the Agenda 2000 package in March
1999, which divided the CAP into two 'pillars': production support and rural development, the
latter including issues such as trade, tourism, environmental protection and biodiversity (1).
The biggest reform so far was launched in 2003 and featured a 'decoupling' of agricultural
production from subsidy payments to prevent over-production and waste. The new system
involves a Single Payment Scheme (SPS), in which subsidies are allocated according to
indicators such as land size rather than production volume (1).
Cross-compliance measures, whereby farmers are required to meet certain environmental,
food safety and animal welfare standards, were also introduced as a pre-condition for
receiving payments under the SPS. The reform also featured a shift or so-called
'modulation' of monies from the first pillar of the CAP (direct aid and market support) to its
second pillar, rural development (1).
The 2003 reform was agreed upon just before the eastward enlargement of the bloc in 2004.
The extension of the CAP to the new Eastern and Central European countries would have
increased its budgetary burden to an unsustainable level. Indeed, the EU's
enlargement doubled the agricultural labour force and the arable area of the EU, and added
over 100 million food consumers to the internal market. Poland and Romania combined have
almost as many farmers as the entire EU before enlargement (1).
The latest policy review, dubbed the CAP Health Check and launched in 2008, aimed to
further modernise the policy and assess whether adjustments are needed to ensure that it is
still relevant for new challenges, such as climate change. The EU 27 also agreed to further cut
direct subsidies to farmers, for the benefit of rural development policy, and to abolish milk
production quotas (2).
At the beginning the number of countries in union was only six. The union has grown in size
through the accession of new countries and recently reached 27 members. Agriculture has
been its core aim operated by a system of subsidies and market intervention by CAP during

SECTORAL ANALYSIS: Dairy, Tomato, Cereal, Poultry AERI
3
this period. The CAP currently represents some 45% of the EU's long term budget for 2007-
2013, compared to nearly 70% in the 1970s (3).
Although there is a common policy for agriculture across the EU-27, this does not mean that
the agricultural sectors in the individual Member States are all similar. Due to varying
physical, climatic and socio-economic conditions in the EU Member States, agriculture has
evolved from a wide range of different circumstances. In some Member States the emphasis is
on dairy or livestock production whilst others focus more on arable crop production or
horticulture. In some countries the average farm size is over 40 ha, whereas in others it is less
than 10 ha. In addition, in some countries the share of total employment within the
agricultural sector is now very small, whereas in other places – especially in the new Member
States – the share is still over 10%. Also, in some areas agriculture is under pressure due to
high population density and urban expansion whilst in other parts of Europe it operates in the
context of continued population decline and progressive land abandonment (2).
Turkey, a country with characteristics such as its huge size in terms of EU‟s average, has also
transformed its agriculture during this period. Agriculture was the main sector in 1950‟s. Of
the total GDP, employment and export, 34% of GDP, 75% of employment, 77% of export
was originated from agriculture (4). Although the shares have gone down gradually over
time, agriculture is still an important sector in the Turkish economy (in 2008 8% of GDP,
26% of employment, 8% of export) (5) and therefore needs special attention in the pre-
accession process. The competitiveness of the Turkish agriculture and the food industries as
well as the economic sustainability of the rural areas will be major political and economic
challenges in the future.
The aim of this study is to analyze of the present situation in the agrifood sector in Turkey.
This is essential for identifying development needs of the Turkish agri-food and rural sectors.
Such sector analyses therefore may guide government staff as well as those in the agricultural
business sector itself to formulate proper policies addressing these needs. The options open
for government to intervene in improving the sector‟s competitiveness should be compatible
with EU rules and regulations, as laid down in the acquis communautaire.
SECTORAL ANALYSIS: Dairy, Tomato, Cereal, Poultry AERI
4
2. MATERIAL AND METHOD
Reaching the aim of the study four sub-sectors - dairy, tomato, cereals, and poultry - were
selected in terms of importance and need of study.
Firstly, to conduct a sub-sector study relevant data were gathered for each sector from
national institutions for a statistical analysis, supplemented with literature review. Secondly,
representatives of selected institutions and experts were interviewed and some field visits
were conducted to identify the sector‟s problems and get a thorough insight into the structure
and performance of the sub-sector. Based on the analysis and interviews a SWOT analysis
was drafted for each group. Thirdly, a full report was drafted and distributed to each sectors‟
related stakeholders. Then, a stakeholders meeting was held to listen to their opinions and to
take their comments on the draft report. In those meetings stakeholders‟ opinions about the
problems of sector were gathered and discussed Finally, the draft report was revised, taking
the stakeholders‟ comments into consideration. Thus, the reports which includes a
comprehensive analysis of studied Sub-Sectors, aim to introduce the situation and
performance of the sector, therefore to identify the constraints weakening the competitiveness
and to suggest policy recommendations which help to enhance the competitiveness of the
sector.
3. RESULTS
Full reports of four sub-sector studies can be found in the following chapters. Below the
major findings of these reports are summarized.
Dairy
Subsistence and semi-subsistence is a main characteristic of dairy farming in Turkey. There
are over 2 million agricultural holdings producing cow milk, the overwhelming part with less
than 5 cows. Larger scale of dairy farmer is in the western part of the country, where Turkey‟s
milk production is concentrated. There are more than 2000 dairy processing units, most of
them operating at (very) small scale and seasonal basis.
Only an estimated 50% (out of about 11 million tones) of cow milk production is being
processed by the industry, while 20% of it is utilised on-farm, and the other 30% by direct

SECTORAL ANALYSIS: Dairy, Tomato, Cereal, Poultry AERI
5
sales (mainly on street markets). The latter is largely unregistered and unregulated,
contributing to the informal economy and jeopardising public health as raw milk is being sold
under doubtful hygienic circumstances and without cooling.
Except for the 10% larger and/or more modern equipped farms, the Turkish dairy sector
suffers from low quality of milk and low yields per cow. Seasonality of production is high as
most farmers lack the means to buy compound feed to supplement own cultivated winter
silage.
Like the dairy farm sector the milk processing is divided into a modern processing industry
and traditional processing (informal sector). The modern processing companies have an
extensive network for milk collection from farms directly and through dairy cooperatives
while some of them operate their own collection centers at village level. There is a strong
competition among the modern dairies as processing capacity with most dairies is much
higher than the milk they handle. Much attention is being paid to milk sourcing. Supply
contracts are generally only valid for a 3 months period. Modern dairy processors provide
coops and farmers additional benefits through offering training programs at own training
farms and through advice staff coming around at farms. Improvement of milk quality is an
important issue in the training.
The majority of the dairy farmers is however not connected to the industry and use their milk
on-farm or sell milk and milk products on street markets, or only very loosely to so-called
mandiras, which are seasonally, generally small-scale operating processors.
Due to an increasing (young) population and growing income levels the sector has good
prospects of increasing sales in the years to come. At the same time, there is an urgent need
for modernization of the dairy industry to deliver efficiently the high quality and
differentiated products consumers increasingly want.
Tomato
Turkey is among the countries producing various kind of vegetable at high production level
due to suitable ecological conditions. However it can not use that production advantage for
export sufficiently. The figures on production, utilization in industry and domestic
consumption and export are taken into consideration the most important product is tomato for
Turkey. As tomato comprises the half of protected vegetable production it is the primary

SECTORAL ANALYSIS: Dairy, Tomato, Cereal, Poultry AERI
6
product of protected agriculture. Some of the most important problems in the sector are: the
complexity of marketing channels, insufficient effectiveness of producer in marketing
channels, land segmentation, big production losses, the lack of enough storage and protection
facilities, the low capacity usage for processing industry, the shortness of processing period
because of difficulties in fresh material supply. In addition more progress are also needed in
the areas of good agriculture practices (GAP) whose importance increasing recently for
competitiveness, traceability and food safety.
All stages from production to industry and consumption at farmer level have been tried to
explain generally by this study and finally strengths and weaknesses have been tried to
determine by making swot analysis comparing the current state with EU countries.
Cereal
The cereal sector is the largest agricultural sector in Turkey: almost 70% of all farms produce
a type of grain. Wheat is the most important crop with 67% of total grain production,
followed by barley accounting for 26% of total cereal production in 2007.
The main problem of wheat production is that it predominantly takes place in dry and
marginal areas. As a result the yields are only 2.3 ton/ha, relatively low compared to average
EU-levels. Yet, yields have increased in recent years, which is said to be due to an increased
the use of certificated wheat seeds. Wheat is mainly (95% out of 20 million ton) used for
human consumption, while barley is used for fodder (90% of 9 million ton). Barley yields
have fluctuated between 2.1 and 2.6 ton/ha in recent years. Yields of maize, the third
important cereal in Turkey (3-4 million ton) have increased strongly over the last ten years,
also due to the use of improved seeds.
At farm level the sector is characterised by numerous fragmented holdings with very small
plots or medium sized land areas. The dysfunctional land registration system makes it difficult
for farmers to obtain credit, as land cannot be used as collateral. Important input items such as
fertilizers are expensive because of imported raw material (phosphate, nitrogen).
About half of the production of cereals is marketed and sold to processing plants, at wholesale
markets, to private traders and to the Turkish Grain Board. The rest is being used on-farm to
meet own consumption needs and as seed for the next growing season.
SECTORAL ANALYSIS: Dairy, Tomato, Cereal, Poultry AERI
7
Due to its strategic importance the cereal sector is being protected by relatively high tariff
rates. As a result the Turkish prices are well above international (world) market prices (and
higher than EU levels). TMO (Turkish Grain Board) may affect the market prices
significantly by it‟s cereals purchases that follow from considerations of market balance (and
stable prices) and for strategic stock building. Further, cereal producers are supported by
direct income payments and input subsidies. Yet, the profitability of wheat production is
relatively low, mainly due to the high costs of production and the low yields.
All grain processors in Turkey are private companies; most of them own small or medium
sized factories. One of the characteristics of the industry is that their capacity utilization is
generally low: 2005 figures indicate that only 36% of the processing capacity had been
utilized in the wheat flour industry, 50% in the pasta industry, 58% in the biscuit industry and
44% in the starch-based sweetener industry. High prices for the raw material (cereals) and
irrational investment decisions are the main reasons for these low percentages. Many
companies operating in the grain processing industry, especially in the flour industry, are not
profitable. On the other hand, Turkey‟s pasta and wheat flour exports have been increasing
continuously in recent years.
Poultry
The poultry meat sector consists of production on farm level and the processing industry of
broiler, turkey, duck and goose ready for consumption. In Turkey, 93% of poultry meat
production is from integrations (vertically integrated poultry meat producers, including input
suppliers, farms and processing units) today. The organisational form of integrations came up
in the poultry sector during the 1970s. Especially after investments in infrastructure in the
1980s (connecting regions and thus markets), the sector could respond to increasing demand
for animal products because of population and income growth. Furthermore, poultry meat is
considered healthier than beef meat and red meat prices are higher than for poultry meat, two
additional reasons why demand for poultry meat increased significantly in the last decades.
Yet, per capita consumption in Turkey is still much below the average consumption levels in
many European Union member states and other developed countries.
Avian Influenza (AI), an animal disease carried by wild birds, was seen in Turkey like many
countries. Until the first AI plague in Turkey, that appeared especially in backyard poultry

SECTORAL ANALYSIS: Dairy, Tomato, Cereal, Poultry AERI
8
during the last months of year 2005, it was a common and legal practice to slaughter the spent
hens from layer flocks, and subsequently to sell backyard poultry in open markets. This
practice was forbidden and left, and it was decided to slaughter spent hens in separate
slaughterhouses and to ban backyard poultry to be sold in open markets in an attempt to
further reduce the possibility of AI spreading.
Poultry meat production is largely marketed at the domestic market; export is not a major part
of the sector‟s production. Most important export markets are the Caucasian and Balkan
countries, China and Hong Kong. Germany and France are small export markets for frozen
birds. Due to AI outbreaks EU authorities carefully inspect Turkish slaughter houses and
laboratories frequently.
Taking into account the main technical performance parameters (mortality rate, feed
conversion rates and live weight at slaughter), Turkish poultry meat producers show better
results than those in neighbouring countries such as Romania, Bulgaria and Iran. In its
comparison with the chicken meat sector in the Netherlands it occurs that Turkish feed costs
per kg live weight are significant higher, caused by the relative high prices paid in Turkey for
compound feed. The sector is depended on imports of protein feed, breeding stocks and
vaccines. Relative strengths of the sector are their modern state of art (partly), the integrated
structure with large scale integrators and good technical efficiency indicators.
REFERENCES
1. David; Robert Whaples (eds) (22 June 2007). "Common Agricultural Policy". EH.Net
Encyclopedia. http://eh.net/encyclopedia/article/Stead.CAP. Retrieved on 30 August 2007.
2. EU Commission 2007 Communication from the Commission to the European Parliament
and the Council Preparing for the "Health Check" of the CAP reform, Brussels, 20.11.2007
COM(2007) 722 final.
3. Eurostat 2008. www.ec.europa.eu/eurostat
4. TURKSTAT 2005. www.tuik.gov.tr
5. TURKSTAT 2008. www.tuik.gov.tr

SECTORAL ANALYSIS: Dairy, Tomato, Cereals, Poultry AERI
9
Turkish Dairy Sector Analysis
Kemalettin TAġDAN Sevgi ĠRĠBOY S.Ahmet ÇELĠKER
Umut GÜL Yıldırım ĠÇÖZ Siemen van BERKUM
1. INTRODUCTION
Background and approach of the study
The aim of this report is to describe and to estimate the state and performance of the dairy
sector in Turkey. The report aims to judge the competitiveness of the Turkish dairy sector, to
identify key constraints to competitiveness and to develop policy interventions to improve the
competitive position of the sector.
The common methodology established is based upon internationally accepted definitions of
competitiveness, which focus on the ability of individual industries to “profitably maintain or
increase market share” in either domestic or international export markets. Structure, conduct,
and performance concepts are combined with resource analyses in judging the
competitiveness of the Turkish dairy chain, to identify key constraints to competitiveness and
to develop policy interventions to improve competitiveness. The study considers the entire
dairy chain from small-scale milk production at the farm level through to processing and
retailing activities.
This sector report covers the following issues:
a description of the sub-sector based upon secondary data covering among others trends in
production, consumption and trade, yields, prices, concentration of production, capacity
utilization, and a description of the linkages within the food chain;
primary data collection using case-studies to illustrate key activities in the dairy sector and
identify lessons for the sector‟s development;
an identification of key-constraints limiting the competitiveness and development of the
sector;
and an identification of policy options.

SECTORAL ANALYSIS: Dairy, Tomato, Cereal, Poultry AERI
10
The structure of the report is as follows. After this brief introduction, an overview of the
present situation and conditions in milk production and processing in Turkey is provided in
Chapter 2. Chapter 3 further elaborates on the issue by evaluating factors, which influence the
competitiveness and efficiency of the milk chain. Based on these analyses, the sector‟s
Strengths and Weaknesses, Opportunities and Threats are identified in Chapter 4. Such a
SWOT analysis gives the possibility to define prerequisites and directions for the sector‟s
future development. The recognition of key constraints leads to a series of ideas for policies
that may address the obstacles to further development and help reduce the inefficiencies
identified. Chapter 5 drafts policy options in as much detail as is possible at this stage.
2. OVERVIEW OF TURKISH DAIRY SECTOR
2.1. Sector definition
Subsistence and semi-subsistence is a main characteristic of agriculture in Turkey and so it is
in dairy farming. There are over 2 millions agricultural holdings producing milk, mainly
concentrated in western parts. East and Southeast Regions perform livestock production for
local consumption or with breeding aim. Besides, the dry and (in summer) hot climate in the
south-east causes the region's share in milk production to be low.
There are more than 2000 enterprisers in the milk processing industry. Yet, according to
SETBIR, which most of the firms in the industry are members of, 6 big scaled enterprises
produce 41% of the milk in the milk processing industry (FAO, 2007).
Beyond the processing sector, the most effective distribution of processed milk and dairy
products involves private specialized markets, private wholesalers and the distribution
networks of retail chains. The latter is a rapidly increasing market channel for food in Turkey.
2.2. Production and Value Added
There is an increasing trend in milk production according to 2000-2006 data. (Table 1). Milk
production value increased from 2,239 million YTL to 8,634 million YTL. The biggest
increase was in 2002 with a rate of 63%.

SECTORAL ANALYSIS: Dairy, Tomato, Cereal, Poultry AERI
11
40-45 % of total livestock production value is generated by milk production which indicates
that milk has a significant place in livestock production. The share of milk production value in
total agricultural production value is 8-9 %.
Table 1. Share of milk production in Agricultural and Animal Production Value (GAO),
1995-2004
Production value
(million YTL)
2000 2001 2002 2003 2004 2005 2006
Agricultural production 26,724 34,389 52,135 68,393 79,649 88,365 96,357
Animal products 5,152 6,069 9,400 13,443 15,574 16,506 18,898
Milk production value 2,239 2,883 3,524 5,753 6,595 7,169 8,634
Increase rate of milk
production value (%)
-
28.8
22.2
63.3
14.6
8.7
20.4
Share of milk in aggregate
livestock prod. output (%)
43.5
47.5
37.5
42.8
42.3
43.4
45.7
* Except live animals
Source: Turkstat, Different Years
Table 2 indicates that the industry generated 7,923 million YTL of Gross Value Added
(GVA) in 2005, 15% of it came from milk and the milk products industry. It was 13.6% in
2000. Although it is not high, it shows that the milk sector has become more important within
the food industry.
Table 2. Share of value added of the milk industry in total value added in the food industry,
1999-2005
2000 2001 2002 2003 2004 2005
Total value added in food industry
(million YTL)
6,682 6,400 6,692 7,032 7,500 7,923
Value added of milk sector industry
(million YTL)
907 915 964 1,040 1,108 1,187
Increase rate of value added of milk industry
(%)
0.9 5.4 7.9 6.5 7.2
Share of value added of the milk sub-sector
industry in total value added (%)
13.6 14.3 14.4 14.8 14.8 15.0
Source: SPO, 2007
2.3. Marketing Channels
All the milk supplied to the market comes from domestic production. Most of the imported
milk products are processed products, notably milk powder.
Milk production in Turkey was 12.0 million tons in 2006 of which 10.9 million tons (90.8%)
was obtained from cows. According to results of the last Agricultural Cencus, there were
SECTORAL ANALYSIS: Dairy, Tomato, Cereal, Poultry AERI
12
2.147 million holdings performing livestock production in 2001. There were approximately
4.2 million cows in livestock farms (TURKSTAT, 2007, TURKSTAT. 2008a,b) and in the
same year the production was nearly 132.6 million tons in EU-27 (EUROSTAT, 2008).
Turkey is much like France and Germany in terms of number of animals but the milk
production of Turkey is very low when compared with these countries. The main reason of
this situation is the high levels of yield per head in EU countries.
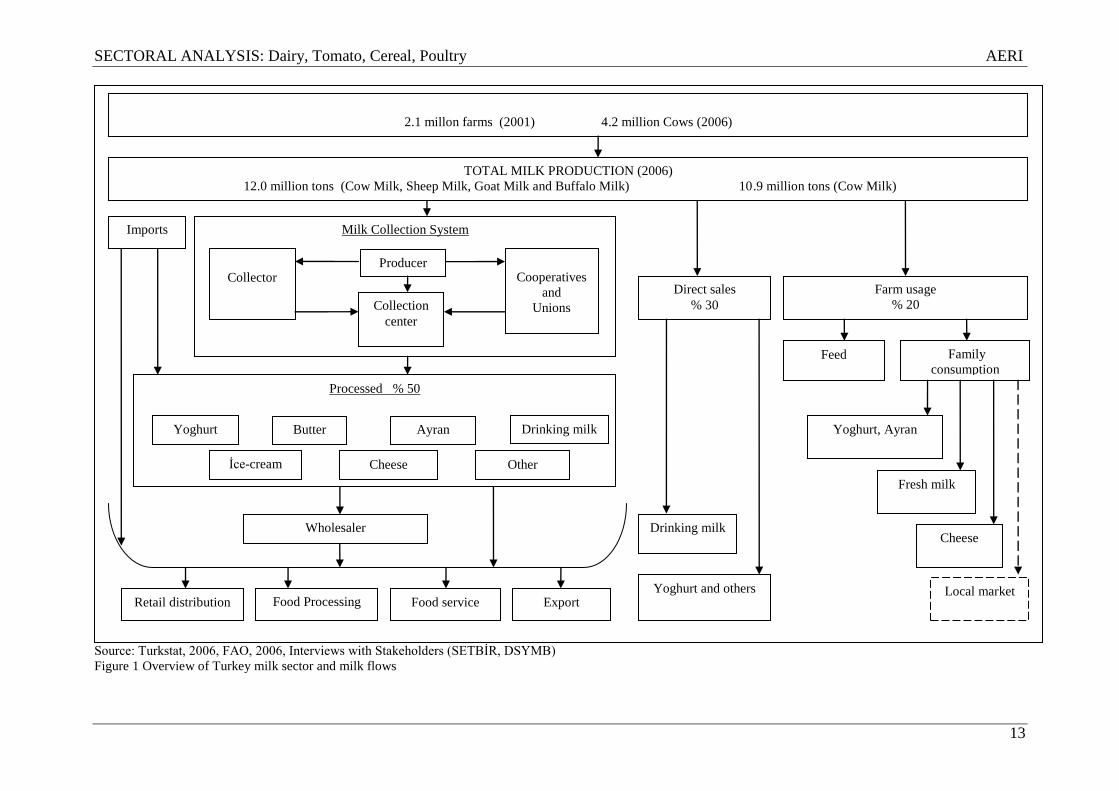
Milk and milk products get to the market through three channels. These are:
1. Processing industry ( 50% of total production)
2. Direct sales, street milk etc.
3. Usage within the holding
However, there is a serious problem of displaying the flows within the chain due to the
incompleteness of statistical data. Some values in the flow charts are based on former studies
and interviews with stakeholders.
There are different kinds of mediators in the milk collecting system, such as producers,
municipalities, village cooperatives/unions and wholesalers. In the collecting system, milk is
carried to the small collecting units called village centres by the producers, and then it is
transported to the big collecting centres or processing units by mediators such as collectors,
buyer firms or unions.
SECTORAL ANALYSIS: Dairy, Tomato, Cereal, Poultry AERI
13
Source: Turkstat, 2006, FAO, 2006, Interviews with Stakeholders (SETBĠR, DSYMB) Figure 1 Overview of Turkey milk sector and milk flows
2.1 millon farms (2001) 4.2 million Cows (2006)
TOTAL MILK PRODUCTION (2006)
12.0 million tons (Cow Milk, Sheep Milk, Goat Milk and Buffalo Milk) 10.9 million tons (Cow Milk)
Milk Collection System
Processed % 50
Drinking milk
Cheese Ġce-cream
Yoghurt Butter Ayran
Imports
Retail distribution Food Processing Food service Export
Other
Farm usage
% 20
Direct sales
% 30
Drinking milk
Yoghurt and others
Feed Family
consumption
Fresh milk
Cheese
Yoghurt, Ayran
Local market
Collector Producer
Cooperatives
and
Unions
Collection
center
Wholesaler

SECTORAL ANALYSIS: Dairy, Tomato, Cereals, Poultry AERI
14
A big portion of the milk supplied for processing, almost half, is utilized in cheese production
while the rest is utilized in yoghurt, ice cream, butter and ayran, milk powder respectively.
Some of it is sold as liquid milk. Processed milk products reaches the final consumer through
processing units or allocation channels owned by wholesalers as well as the other small
manufactory holdings such as pastry shops after turning the raw material into an intermediate
good. A minor part of it is exported.
A considerable amount of milk is processed by small-scale, labour intensive processing units
called “mandira”. They usually do not possess a milk collection and distribution system and
they mainly concentrate on production. Moreover a significant number of mandiras are run
seasonally and unregistered. Yet, the position of mandiras is strong in the market due to low
prices and the familiar taste of their products. They have important advantages considering
their potential to grow into big enterprises. SütaĢ and Yörsan are good cases as they made the
right investments and have a considerable share in the market today (CEEC, 2006; FAO,
2007).
These so-called mandıras would process between 18% and 35% of the milk produced
according to several sources. Also the estimate of the milk production, which is not
processed, is subject to a high degree of variation. Farm family consumption is estimated in
the range between 15% and 40%, including milk fed to farm animals.
Direct sales, which means that a producer or collector sells directly to the final consumer,
have a share of 30% of the milk production. Direct sales are performed in two ways: as fresh
milk (drinking milk) and as yoghurt and other milk products. Street milk which is listed under
direct sales is a marketing issue highly focused on.
The street milk seller may produce his/her own milk and sell or buy the milk from milk
collectors or directly from a producer. This situation indicates a very serious problem
regarding the food safety as raw milk is sold mostly under doubtful hygienic circumstances,
without packaging and cooling. Moreover the origin of street milk (i.e. from which animals,
or farmers) is usually unknown, as it relates to milk from unregistered cows and/or dairy
farms. Therefore, unregulated sales on street markets with respect to legal framework and
control mechanisms could easily jeopardise public health. Even though this risky position is
known by consumers, many prefer to consume street milk in order to make yoghurt, desserts,

SECTORAL ANALYSIS: Dairy, Tomato, Cereals, Poultry AERI
15
etc. by traditional methods. Moreover, the miss-belief that street milk is of better quality and
fresher than pasteurized milk is another reason for people to prefer street milk (FAO, 2006).
Considering these consumer choices, a marketing network (like performed in certain
countries) which enables street milk to be collected and packaged in 1-3-5 liter plastic or
paper containers and then sold may increase the number of registered holdings and provide
healthier products for the consumers.
Usage within the holdings - nearly 20% of total milk production - is for calf feed and home
consumption in particular. The significant level of farm usage and direct sales is a
consequence of several factors including the small-scale structure of production which is
unable to operate with commercial aims, subsistent or semi-subsistent livestock farming, lack
of commercial solidarity among many producers and an underdeveloped milk collection
system.
Box 1. Union of Dairy, Beef, Food Industrialists and Producers of Turkey (SETBİR)
SETBIR, which is centred in Ankara, was established in 1976 by leading industrialists and producers
engaged in the Turkish livestock sector. Its primary goal is to raise public awareness on common
problems facing the industry and initiate joint efforts to deal with such problems. It has many activities
aiming to upgrade the technological level of the processing plants by modernizing them in parallel
with European Union standards.
SETBIR worked in cooperation with FAO in writing the sectorial report on dairy for Turkey for
making up the IPARD plan. According to these works, there is a considerable difference between the
official data and the real indicators when the working groups visited the field. They visited many
provinces of Turkey including Bursa, Thrace, Ġzmir etc. They made an extensive investigation on the
sector in Konya.
SETBIR estimates that 20% of the milk produced is utilized on the farm, 20% street milk, 33% in
mandıras or in middle medium holdings, and 27% of it in big companies. It was also told that Turkey
may have a comparative advantage in the production of goat and sheep milk.
SETBIR has an optimistic view of the future. According to SETBĠR there are two main problems. One
is the milk produced below the international quality standards and the other is the high production and
transport costs. It was specified that the enforcement of the law on hygienic standards and food safety
in small dairies was very unsatisfactory. SETBĠR thinks that if programs are initiated to improve the
raw milk quality and decrease the cost, than Turkey will be able to meet the demand by its own milk
produced in the country instead of importing. It was also added that the dairy sector became very
popular among the entrepreneurs and now many industrialists would like to invest in the livestock
sector. The increase in investments in the sector shows this.

SECTORAL ANALYSIS: Dairy, Tomato, Cereals, Poultry AERI
16
2.4. Chain analysis
2.4.1. Farm structures
Number of Animals
The number of animals (cattle) and cows considerably declined in Turkey between 1991 and
2006. Animal numbers declined by 9%, from 12 million to 10.9 million while the number of
cows dramatically decreased by 32% from 6.1 million to 4.2 million between 1991 and 2006
(TURKSTAT, 2008b). The unused meadows in East and Eastern Anatolian Regions due to
security reasons and the producers that quit livestock production during the economic crisis
that broke out in the early 2000's may cause this depletion (TÜSĠAD, 2008). Furthermore, the
rise in feed prices caused by the increase in food prices due to drought and the increase in bio
fuel production affected livestock production negatively.
According to the 2001 Agriculture Survey, the number of holdings performing only animal
farming including stock farming was 73 thousand head. There were 2.9 million animals; of
which 384 thousand were bovines in particular. Animal and plant production are practised in
about 2 million holdings. The numbers of bovines found in these holdings was about 11
million (TURKSTAT, 2004). However, not all of these holdings produce milk commercially.
The important thing regarding dairy industry is to define the dairy farm and therefore
determine the number of these holdings.
Number of animals by region shows that 15.3% of the animals are found in Northeast
Anatolia in 2006. Aegean (14.3%) and West Blacksea Region (13.7%) follow it. The number
of dairy cattle (cows) which makes 38.5% of all animals sets a similar situation. 13.9% of
dairy cattle are found in Aegean while 13.3% of them are in Northeast Anatolia and 13% in
West Blacksea (Table 4). There is a concentration among three regions with respect to the
numbers of animals and dairy cattle.
In terms of herd composition, 43% of animals and dairy cattle are composed of cross breeds
whereas 26% is pure bred which has a high productivity.
Holdings by size
It is obvious that the holding structure is inadequate for intensive production since most of the
holdings (85%) own herds with less than 9 animals. The share of animals owned by these
holdings is 57% in total number of animals (Table 3). The share of holdings possessing herds

SECTORAL ANALYSIS: Dairy, Tomato, Cereals, Poultry AERI
17
with more than 50 animals is 3.6%. Average animal number, or herd size per holding is 5.7
heads.
97.7% of animals in holdings producing milk had between 1 and 25 head in 2005 while
0.02% of them had more than 100. Average herd size per holding was 4.4 (TÜSĠAD, 2008).
Table 3. Number of Holdings and Animals by size
Holding Size
(head)
Number of holdings Number of animals
Number % Number % Average
1-4 1,043,022 59.7 2,763,708 27.7 2.6
5-9 447,078 25.6 2,884,064 28.9 6.5
10-19 196,193 11.2 2,509,716 25.2 12.8
20-49 55,598 3.2 1,463,583 14.7 26.3
50-149 4,936 0.3 319,650 3.2 64.8
150-299 76 0.0 16,349 0.2 215.1
300+ 24 0.0 17,615 0.2 734.0
Total 1,746,927 100.0 9,974,685 100.0 5.7
Source: TURKSTAT, 2004.
*All animals including cattle and buffalo in every age, except for fattening
As the holdings are very small and scattered the cost of collection and transport of milk is
relatively high. This raises the cost of processing and makes it difficult for the processors to
find raw milk for processing, which becomes an obstacle for obtaining raw milk consistently.
One of most effective ways of diminishing these problems is the cooperatives and producers
organisations. They can provide marketing services such as common milking units and
transportation. Moreover, creating an livestock region is important with respect to solving
structural problems.
Insufficient areas of grassland and pastures and transportation problems are natural causes
that constrain the development of the sector. And financial problems stem from lack of capital
and technology with high investment cost.

SECTORAL ANALYSIS: Dairy, Tomato, Cereals, Poultry AERI
18
Table 4. Animal Numbers in Total (Bovine) and Milking Cows by Regions and by Breed (2006)
Animal Numbers Milking Cows
Pure
breed
Cross
Breed
Dom.
Breed Total Pure breed Cross Breed
Dom.
Breed Total
000 % 000 % 000 % 000 % 000 % 000 % 000 % 000 %
TR1 Ġstanbul 10 0.4 43 0.9 3 0.1 57 0.5 5 0.4 22 1.2 1 0.1 28 0.7
TR2 West Marmora 535 19.3 276 5.9 46 1.4 857 7.9 226 20.4 120 6.7 20 1.5 365 8.7
TR3 Aegean 665 24.0 672 14.3 221 6.5 1,558 14.3 261 23.6 242 13.4 78 6.1 581 13.9
TR4 East Marmora 236 8.5 316 6.7 101 3.0 654 6.0 95 8.5 113 6.3 36 2.8 244 5.8
TR5 West Anatolian 191 6.9 252 5.4 140 4.1 582 5.4 75 6.8 91 5.0 48 3.7 214 5.1
TR6 Mediterenean 268 9.7 486 10.4 94 2.8 848 7.8 115 10.4 208 11.5 36 2.8 358 8.6
TR7 Middle Anatolian 249 9.0 535 11.4 243 7.1 1,028 9.5 98 8.9 216 12.0 84 6.6 398 9.5
TR8 West Blacksea 234 8.5 675 14.4 578 17.0 1,487 13.7 79 7.2 245 13.6 221 17.2 545 13.0
TR9 East Blacksea 67 2.4 294 6.3 213 6.2 573 5.3 26 2.4 137 7.6 99 7.7 262 6.3
TRA Northeast Anatolian 92 3.3 696 14.8 872 25.6 1,660 15.3 31 2.8 234 13.0 292 22.7 557 13.3
TRB Middle east
Anatolian 162 5.8 273 5.8 468 13.8 903 8.3 73 6.6 114 6.3 188 14.7 375 9.0
TRC Southeast Anatolian 63 2.3 177 3.8 425 12.5 665 6.1 22 2.0 58 3.2 179 14.0 260 6.2
Total 2,772 25.5 4,694 43.2 3,405 31.3 10,871 100.0 1,107 26.4 1,799 43.0 1.282 30.6 4,188 100.0
Milking Cows / Total 39.9 38.3 37.6 38.5
Source: TURKSTAT, 2008b
SECTORAL ANALYSIS: Dairy, Tomato, Cereals, Poultry AERI
19
Small and scattered holdings generally achieve low labour and land productivity and produce
against high costs. Moreover, dairy farming is not performed as an economic profession, but
as subsistence farming, which is important from a social and food security point of view.
When these producers quit production they intend to move to big cities which cause may
imply serious social problems when the manufacturing and service sector can not employ
people coming from rural areas. In respect to aforementioned issues, small producers should
not quit production but they should be encouraged to seek ways for more productive and
profitable production via producer organisations.
Box 2. Livestock Cooperative Unions: Köy-Koop and Hay-Koop
There are two important cooperative unions in Turkey: Village Development and Other
Agricultural Cooperative Unions (Köy-Koop) founded in 1971 and Turkish Livestock
Cooperative Central Union (Hay- Koop) founded in 2003. The two collect about 2-3 million
tons milk and provide raw material for processing industry (FAO, 2007).
Köy-Koop, with its 21 members, is active in fruits and vegetables, and cereals as well as in
livestock production. Sub-unions operate the activities regarding milk collection, cooling, and
quality check, and sales. They run the collecting centres where above mentioned activities
take place. Milk is brought to collecting centres by producers or collectors. A large amount of
the milk is sold to big companies in particular, which operate at a national level. Seasonal
excess milk is distributed to mandiras mainly. Milk prices are determined by three months
tenders organised by the union.
Hay-Koop supports livestock farming as well as poultry and bee keeping. Like Koöy-Koop,
Hay-Koop also operates through sub-unions. It performs on areas such as breed improvement,
natural and artificial insemination, embryo transplant, genetic cloning, breeds Registration. It
also provides inputs or equipment including animal feed, agricultural machines, tanks etc. for
its members.

SECTORAL ANALYSIS: Dairy, Tomato, Cereal, Poultry AERI
20
2.4.2. Production, consumption and trade developments
2.4.2.1. Production
The number of animals milked and the milk production trend were usually parallel to
each other for a ten year period until 2003. Afterwards, while there was a decline in
animal numbers, milk production increased. This displays that there has been an
increasing trend in the productivity of holdings in recent years.
Cow number was 3.9 million in 2004 in Turkey. It increased to 4.2 million in 2006 while
milk production was 9.6 and 10.9 million, respectively (Table 5).
Milk production in EU was 141.3 million tons in 2004, whilst the number of cows was
23.4 million (EU, 2006). Milk production in Germany and France, countries with
approximately the same number of cows as Turkey, was 28.2 and 24.3 million tons. This
indicates that there is a considerable gap in productivity between Turkey and EU
countries.
Table 5 Trends in total (cow milk) production
2000 2001 2002 2003 2004 2005 2006
Number of animals
(000 cows)
5,280 5,086 4,393 5,040 3,876 3,998 4,188
Total cow milk production
(000 tons)
8,732 8,489 7,491 9,514 9,609 10,026 10,867
Source: TURKSTAT, 2008b
Three regions: Aegean, West Blacksea, and West Marmora; provide 40% of the national
milk production (Table 6). With respect to breed distribution, 45% of the animals are
cross bred, while 26% of them are pure bred with a share of 40% in production. This
indicates that the productivity of pure bred animals is high. Newly established firms in the
livestock sector which utlise pure bred animals for production, and applied improvements
in feeding and caring facilities are promising in terms of production increase in the future.
In Turkey, milk producers and holdings can be categorized into 4 classess (FAO, 2007):
1. Self-sufficient producers: they usually have 1-2 cows. They also produce cereals,
animal feed, and fruit and vegetables. The quality of milk is generally low and
consumed inside the holding, or sold in the domestic market.

SECTORAL ANALYSIS: Dairy, Tomato, Cereal, Poultry AERI
21
2. Small producers with 3 to 10 cows: They are hardly above the self-sufficiency
level. They can sell to the consumers who are close to them in terms of area. Some
part of the milk is transferred to the collecting center, mandira, or another milk
processing unit. Milk is usually of low quality. Other products are also produced.
In certain occasions, farming is a part-time job for the producers in this category.
3. Professional milk producers with 10-50 cows: they are middle firms in size and
expertise in milk production. In addition, they are relatively younger, and perform
dairy farming commercially. They sell their milk to the processors.
4. Professional producers with 100 and more cows: Private and state farms are
included in this category. They have expertise in milk production and sell their
products to large scale milk factories. Milk quality is usually fine.
Development of the sector is restrained as the milk producers are usually in the 1st and
2nd group. Therefore, due to above mentioned reasons these holdings should sustain
while the number of holdings in 3rd and 4 th groups increase significantly. (See. 2.4.1.
Holding Structure).
Table 6. Cow milk production by region and by Breed (2006)
Pure breed Cross breed Dom. breed Total
000 ton % 000 ton % 000 ton % 000 t %
TR1 Ġstanbul 19 0.4 57 1.2 2 0.1 77 0.7
TR2 West Marmara 891 20.7 327 6.7 25 1.5 1,243 11.4
TR3 Aegean 1,029 23.9 659 13.5 102 6.1 1,790 16.5
TR4 East Marmara 368 8.6 303 6.2 48 2.9 719 6.6
TR5 West Anatolian 298 6.9 243 5.0 63 3.7 604 5.6
TR6 Mediterranean 445 10.4 558 11.4 45 2.7 1,049 9.6
TR7 Middle Anatolian 378 8.8 590 12.1 114 6.7 1,082 10.0
TR8 West Blacksea 307 7.1 657 13.4 292 17.3 1,256 11.6
TR9 East Blacksea 98 2.3 376 7.7 132 7.8 606 5.6
TRA Northeast Anatolian 116 2.7 660 13.5 386 22.9 1,163 10.7
TRB Middleast Anatolian 263 6.1 300 6.1 250 14.8 813 7.5
TRC Southeast Anatolian 83 1.9 155 3.2 228 13.5 466 4.3
Total 4,295 39.5 4,885 44.9 1,687 15.5 10,867 100.0 Source: TURKSTAT, 2008b.

SECTORAL ANALYSIS: Dairy, Tomato, Cereal, Poultry AERI
22
Seasonal factors in milk production
Milk production increases from February, peaks in May and gradually decreases
afterwards (Figure 2). We see that there is a considerable seasonal fluctuation referring to
average annual milk production. Main reason of the fluctuations is periodical
concentration of births. Besides, quality and amount of fodder used in winter may
influence milk production.
This fluctuating trend in milk production causes problems in the processing sector and
makes pressure on the price. However, the milk powder diminishes the price effect of the
fluctuations in milk production and becomes an important actor in balancing the supply
and demand.
Increase in artificial insemination and its planning can decrease the problems regarding
milk production considerably. Artificial insemination performed increased between 2001
and 2006. Accordingly, the number of artificial insemination increased from 622
thousand to 2.6 million in 2006 (Figure 3). The reason of this increase is the support
given to the veterinarians per artificial insemination they performed. 62.7% of the dairy
animals were inseminated artificially in 2006, which indicates an improvement on the
matter.
Source: Calculated by the data of artificial insemination by AERI through the data obtained from
TURKSTAT and TIGEM however, there is a serious problem with updating the data, in interviews with
stakeholders, it is understood that not much changed.
Figure 2. Milk production per month

SECTORAL ANALYSIS: Dairy, Tomato, Cereal, Poultry AERI
23
Source: DG-Agricultural Production and Improvement, 2008b
Figure 3. Number of artificial inseminations
Milk Quality
Quality is perceived as the most important problem of the sector. Main indicators for the
quality of milk are regulated with the declaration on Row Milk and Heated Drinking Milk
under the Turkish Food Codex. The criteria are in line with the
EU-criteria. (DG- Protect and Control, 2008).
The composition of the milk shall be:
Turkey EU
Protein, at least (%) 2.8 2.9
Fat, at least (%) 3.5 3.5
Fat free dry material (%) 8.5 8.5
The standards during milk collection shall be;
Turkey EU
Number of bacteria in total 30o C (per ml) < 100,000 < 100,000
Number of somatic cells (per ml) < 500,000 < 400,000
The most significant indicators that show the insufficient milk quality in Turkey are the
high number of bacteria and somatic cells. According to the FAO report, the number of

SECTORAL ANALYSIS: Dairy, Tomato, Cereal, Poultry AERI
24
bacteria in milk is over 1 million while the number of somatic cells is about 700 thousand
(FAO, 2007).
The most important reasons for inadequate milk quality are as the problems in farm
structure, insufficient caring facilities, lack of a well-organised cold chain, and substances
such as water or residues of animal medicines found in milk.
Quality checks cannot be conducted efficiently by authorised inspection bodies -
considering inadequacy of personnel and technical issues- due to high numbers of
holdings and structural problems in Turkey. Inadequacy of technical circumstances such
as laboratory conditions makes the problem worse. Another factor that makes it difficult
to increase the milk quality is the fact that the poor quality milk can easily be
sold in the market.
Factors that may increase the quality can be:
- To generalise price differentiation based on quality- which is widely used by the big
companies during purchasing raw material,
- To improve organisational activities,
- To increase extension services which provide awareness and training,
- Technological improvement,
- To increase modern processing units or improve the current ones.

SECTORAL ANALYSIS: Dairy, Tomato, Cereal, Poultry AERI
25
Box 3. Sheep and Goat Milk
It is very difficult to collect information about the sheep and goat milk sector in Turkey.
Absence of specialised professional institutions and firms increase this difficulty (FAO,
2007). There were 25.6 million sheep in 2006 in Turkey and 97% of them were of
domestic breed. The number of goats in the same year was 6.6 million and 97% of them
were kıl goat. Production of sheep and goat milk were 795 and 254 thousand tons,
respectively.
Sheep and Goat Numbers and Milk Production in Turkey
The most important problems of sheep and goat milk production are the low level of
productivity and seasonal variations. Milk derived from sheep and goast is mainly used
for making white/pheta cheese. Milk production remains at low levels as a system for
collection, processing and marketing of the milk does not exist. Accordingly, with a
congruous production and marketing plan, the consumption of sheep and goat milk and its
products can be raised. Sheep and goat feeding has a considerable advantage as it is
performed in mountainous and arid areas where cattle feeding can not be performed.
Consequently, an increase in investment together with an increase in support to these
regions may improve sheep and goat farming.
It is suggested that Turkey has important advantages in sheep and goat production in
terms of competitiveness in the livestock sector with its possible membership to the EU.
Furthermore, countries with a high consumption of goat cheese, such as France, offers
noteworthy advantages regarding export opportunities. Traditional products derived from
goat and sheep milk may have several advantages in external markets.
2004 2005 2006
Number of animals (1000)
Sheep 25,201 25,304 25,616
Domestic 24,438 24,552 24,801
Merinos 763 752 815
Goat 6,610 6,517 6,643
Kıl 6,380 6,284 6,433
Tiftik(angora) 230 233 210
Milk production (1000 ton)
Sheep 772 790 795
Goat 260 254 254
Source:TURKSTAT, 2008b
SECTORAL ANALYSIS: Dairy, Tomato, Cereal, Poultry AERI
26
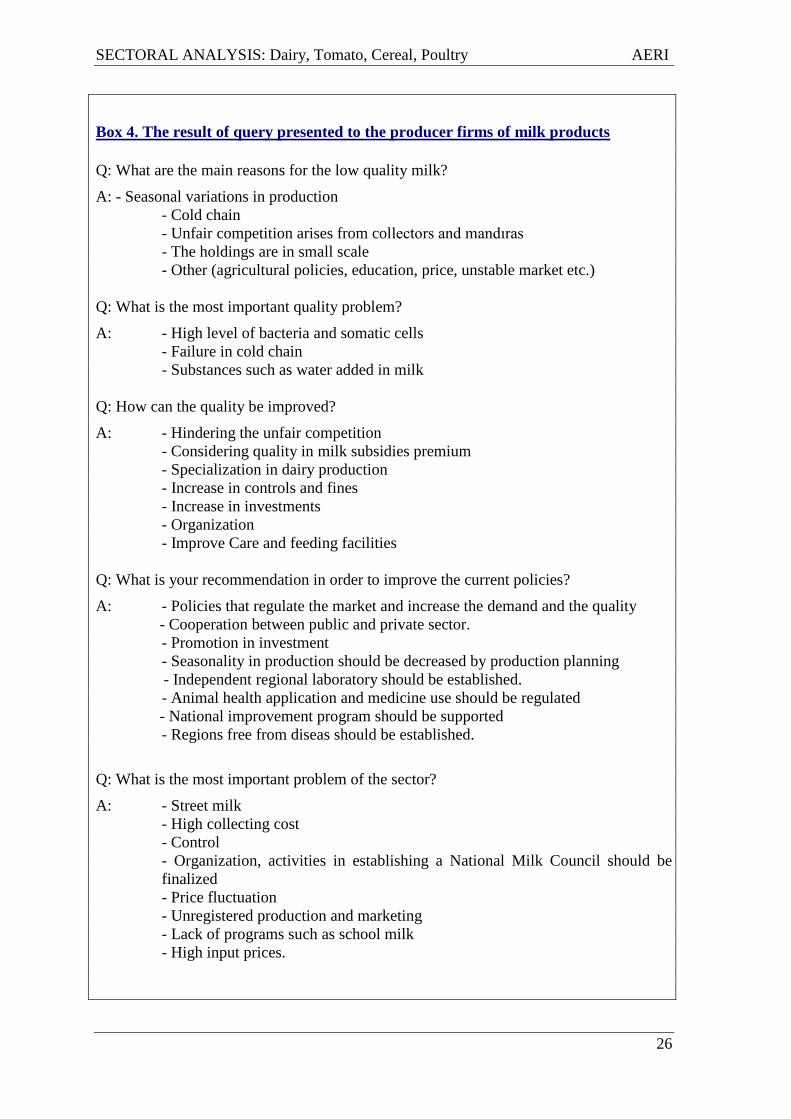
Box 4. The result of query presented to the producer firms of milk products
Q: What are the main reasons for the low quality milk?
A: - Seasonal variations in production
- Cold chain
- Unfair competition arises from collectors and mandıras
- The holdings are in small scale
- Other (agricultural policies, education, price, unstable market etc.)
Q: What is the most important quality problem?
A: - High level of bacteria and somatic cells
- Failure in cold chain
- Substances such as water added in milk
Q: How can the quality be improved?
A: - Hindering the unfair competition
- Considering quality in milk subsidies premium
- Specialization in dairy production
- Increase in controls and fines
- Increase in investments
- Organization
- Improve Care and feeding facilities
Q: What is your recommendation in order to improve the current policies?
A: - Policies that regulate the market and increase the demand and the quality
- Cooperation between public and private sector.
- Promotion in investment
- Seasonality in production should be decreased by production planning
- Independent regional laboratory should be established.
- Animal health application and medicine use should be regulated
- National improvement program should be supported
- Regions free from diseas should be established.
Q: What is the most important problem of the sector?
A: - Street milk
- High collecting cost
- Control
- Organization, activities in establishing a National Milk Council should be
finalized
- Price fluctuation
- Unregistered production and marketing
- Lack of programs such as school milk
- High input prices.

SECTORAL ANALYSIS: Dairy, Tomato, Cereal, Poultry AERI
27
2.4.2.2. Milk supply / disappearance and consumption per capita
Total supply of milk increased gradually between 2004 and 2008. It is estimated that milk
supply increased from 12.4 million ton to 13.9 million which means an increase of 12.1%
between the above-mentioned periods (Table 7).
Production was estimated to rise by 7% and rose to 12.2 million tons. We see that almost
the entire supply is met by domestic production. The self-sufficiency rate of milk and
milk products is about 100%. The sector is not open to external trade and consumption
per head is low compared to developed countries. The export ratio, which is between
0.1% and 0.3%, indicates that pratically all production is consumed domestically. It is
understood that milk production is considerably dependent on the domestic market
conditions.
Table 7. Milk Supply and Disappearance in Turkey
2004 2005 2006 2007 (d) 2008 (e)
SUPPLY Ton
Beginning stocks 990,172 1,217,614 1,267,640 1,238,105 1,172,581
Production (a) 11,438,141 11,686,319 11,903,957 12,087,531 12,217,108
Fluid milk and other use 1,467,197 1,489,500 1,509,449 1,524,543 1,539,789
Milk products (b) 9,970,944 10,196,819 10,394,508 10,562,988 10,677,319
Import (c) 202 160 52 62 78
Total supply 12,428,515 12,904,092 13,171,649 13,325,698 13,389,767
DISAPPEARANCE Ton
Total domestic disappearance 11,207,985 11,632,286 11,931,839 12,151,252 12,284,916
Export (c) 2916 4166 1706 1865 1,954
Total disappearance 11,210,901 11,636,452 11,933,545 12,153,117 12,286,870
Ending stocks 1,217,614 1,267,640 1,238,105 1,172,581 1,102,897
Stocks / use ratio (%) 10.9 10.9 10.4 9.7 9.0
Self-sufficiency ratio (f) (%) 98.0 99.5 100.2 100.5 100.6
(a) figures refer to cow and sheep milk together
(b), (c) every kind of cheese, yoghurt/ayran, butter, ice-cream and milk powder (milk equivalence)
(d) Estimation
(e) Projected*
(f) Self sufficiency ratio = production/ total supply
Source: AERI, 2007
In 2008, 87 % of total supply is processed into milk products while 13 % is utilized as
drinking milk or other (Table 8). The figures demonstrate a slighly increased share of the
processed products in total dairy supplied, with cheese and yoghurt as main products.

SECTORAL ANALYSIS: Dairy, Tomato, Cereal, Poultry AERI
28
Table 8. Milk products supply (thousand ton)
2004 2005 2006 2007(a) 2008 (b)
Cheese 6,954.5 7,031.6 7,276.4 7,397.8 7,527.7
Yoghurt 2,297.9 2,268.9 2,281.0 2,295.7 2,317.7
Butter 1,337.2 1,476.4 1,527.1 1,554.9 1,566.5
Other 1,838.9 2,127.2 2,087.1 2,077.3 1,977.9
(a) Estimate
(b) Projection
Source: AERI, 2007.
Table 9. Consumption per capita*
2002 2003 2004 2005 (a) 2006 (b)
Kg/yr % kg/yr % kg/yr % kg/yr % kg/yr %
Drinking Milk 21.0 12.8 21.0 11.9 21.0 12.7 21.0 12.7 21.0 12.5
Cheese 89.0 54.3 93.0 53.0 92.0 55.7 91.7 55.3 93.6 55.6
Yoghurt/Buttermilk 32.5 19.8 38.9 22.2 32.4 19.6 31.6 19.0 31.0 18.4
Butter 17.8 10.9 18.2 10.4 16.0 9.7 18.0 10.8 19.1 11.3
Milk powder 2.5 1.5 3.4 1.9 2.8 1.7 2.7 1.6 2.6 1.6
Ice Cream 1.0 0.7 1.0 0.6 1.0 0.6 1.0 0.6 1.0 0.6
Total Milk (c) 163.8 100.0 175.5 100.0 165.2 100.0 166.0 100.0 168.3 100.0
*Milk equivalent
(a) Estimated.
(b) Forecast.
(c) All milk and milk products including drinking milk.
Source: Calculated by AERI based on TURKSTAT statistics. b All milk and milk products including drinking milk.
Source: MARA
Average total milk consumption per capita in milk equivalents is 165 kg/year and a
considerable share of this is consumed as cheese. The share of cheese in total
consumption and consumption of cheese per capita was 55% or 91.7 kg/year in milk
equivalents, respectively in 2006 (Table 9). Yoghurt and ayran with values of 32.4 kg
(19.6%) and 21 kg (12.7%) follow cheese respectively.
While the consumption of fresh milk and milk products (liquid milk, yoghurt etc.) per
capita is 36 kg/year in Turkey, it is 50 kg/year in the Netherlands, 27 kg/year in France
and 7 kg/year in Italy. Consumption of cheese per capita is 26 kg/year in Greece, 20
kg/year in Germany and 10 kg/year in the U. K., whilst it is 9 kg/year in our country
(FAO, 2006). According to these data, the consumption of fresh products is higher that
the EU averages, but the cheese consumption in Turkey is not. Especially the younger and
well educated part of the population consume the greater part of animal products, milk
and milk products in particular. However, unequal income distribution, high prices and

SECTORAL ANALYSIS: Dairy, Tomato, Cereal, Poultry AERI
29
despite the relative self-sufficiency the insufficient supplies hampers the potential level of
milk consumption per capita.
In order to ensure that the product range extends, consumption habits of milk should be
given to children and young people by projects like school milk, and measures should be
taken that will encourage the investors for development of the milk processing industry.
2.4.2.3. Trade
The amount of export is not high as the products are not competitive in price or quality.
Still, there is an increasing trend of export and import in all the dairy products.
Export of milk and milk products rose to 52 thousand tons in 2006 from 28 thousand tons
in 2004 (Table 10). Cheese has the biggest share with 38% in export volume terms
followed by whey and cream. Like the ranking by volume, the biggest share in export
value terms is cheese, accounting for US$ 43 million, followed by milk with US$ 13
million and cream with US$ 10 million. This indicates that although the volume of whey
is high, it generates relatively low value. Further the price per unit of the product group of
milk and cream is higher than for whey. Similarly, ice-cream exports also increased in
recent years and the contribution of foreign investment to this increase is considerable
(CEEC AgriPolicy, 2006).

SECTORAL ANALYSIS: Dairy, Tomato, Cereal, Poultry AERI
30
Box 5 EU Dairy Policy
EU Dairy Policy, covering plenty of products which are defined in Art.1 Regulation No
1255/19991, operates in internal market, trade and direct payments to farmers. Its instruments
involve decoupled payments, intervention price, import quotas, export subsidies, domestic
production and consumption subsidies, as well as domestic production quotas. These instruments
are operated by Common Market Organisation (CMO) which was established in 1968 under the
Common Agricultural Policy (CAP). The CMO mainly seeks to balance supply of and demand
for dairy products2 (fact sheet). However, the 2003 CAP reform and the ongoing WTO
negotiations led the EU to liberalize its dairy policy to a certain extent; the aim of keeping supply-
demand balance stayed the same.
Today, the EU supports its dairy sector in internal market through (safety-net) intervention,
disposal of dairy products, private storage aid and (Domestic) Milk quotas. After the 2003 CAP
Reform the levels of support for Dairy Sector were altered. With the 2003 reform, the intervention
price for butter was reduced by 25%, beginning on 1 July 2004 for a four-year period (fact sheet).
Besides, the intervention threshold for butter was reduced for the previous years and it will be in
subsequent years. The dairy premium paid in order to compensate the cuts in intervention price
turned to „Single Payment Scheme‟ (SPS), which was first introduced by the 2003 CAP Reform.
It is a decoupled payment and conditional on the fulfillment of „Cross Compliance‟. When it
comes to trade, the EU subsidized its dairy market as the price of milk was higher than the world
price. However, after the Uruguay round these subsidies are restricted. The EU protects its dairy
market through high tariff rates. Import of butter is performed under the Tariff Rate Quotas
(TRQ).
Following the 2003 CAP reform, the EU initiated the “Health Check” in November 2007 which
envisages a set of changes aiming to simplify Single Payment Scheme; to adjust market support
instruments including an increase in the quota amounts of the countries till 2015, the quota
abolish date; and searching procedures to challenge the changing conditions such as climate
change, or benefit the opportunities. It will affect the Dairy Sector, as well. The abolition of the
quota regime in 2015 is one the subjects that is being mainly considered in the EU. A soft landing
is proposed under the health check. Within this prospect and due to the increasing demand for
dairy and dairy products both within the European Union and on global markets, the EU
Commission recommended increasing domestic quotas with 2 %, beginning on April 2008. 3. This
proposal has been approved on 17 March 2008.
1 The basic regulation in the milk sector on the Common Market Orginisation for Milk and Milk Products.
2 EU Commission, DG-Agriculture and Rural Development, “Milk and Milk Products in the European Union”, Fact
Sheet, August 2006 3 http://europa.eu/rapid/pressReleasesAction
SECTORAL ANALYSIS: Dairy, Tomato, Cereal, Poultry AERI
31
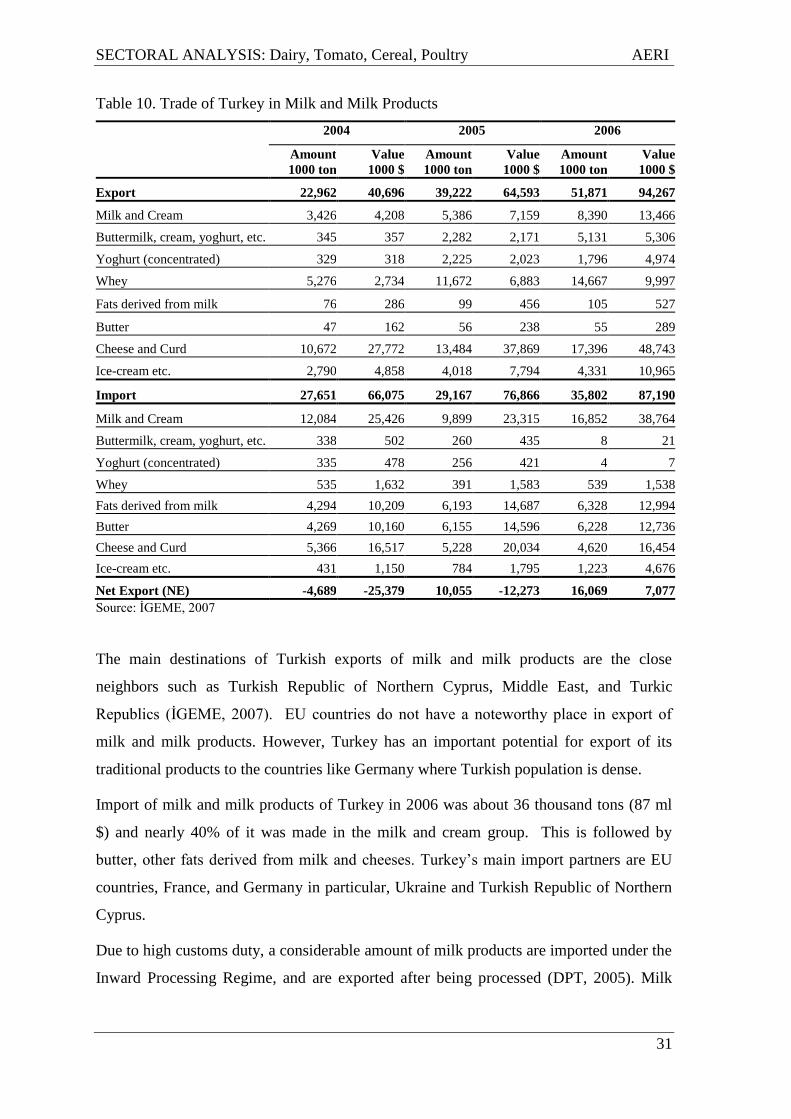
Table 10. Trade of Turkey in Milk and Milk Products
2004 2005 2006
Amount
1000 ton
Value
1000 $
Amount
1000 ton
Value
1000 $
Amount
1000 ton
Value
1000 $
Export 22,962 40,696 39,222 64,593 51,871 94,267
Milk and Cream 3,426 4,208 5,386 7,159 8,390 13,466
Buttermilk, cream, yoghurt, etc. 345 357 2,282 2,171 5,131 5,306
Yoghurt (concentrated) 329 318 2,225 2,023 1,796 4,974
Whey 5,276 2,734 11,672 6,883 14,667 9,997
Fats derived from milk 76 286 99 456 105 527
Butter 47 162 56 238 55 289
Cheese and Curd 10,672 27,772 13,484 37,869 17,396 48,743
Ice-cream etc. 2,790 4,858 4,018 7,794 4,331 10,965
Import 27,651 66,075 29,167 76,866 35,802 87,190
Milk and Cream 12,084 25,426 9,899 23,315 16,852 38,764
Buttermilk, cream, yoghurt, etc. 338 502 260 435 8 21
Yoghurt (concentrated) 335 478 256 421 4 7
Whey 535 1,632 391 1,583 539 1,538
Fats derived from milk 4,294 10,209 6,193 14,687 6,328 12,994
Butter 4,269 10,160 6,155 14,596 6,228 12,736
Cheese and Curd 5,366 16,517 5,228 20,034 4,620 16,454
Ice-cream etc. 431 1,150 784 1,795 1,223 4,676
Net Export (NE) -4,689 -25,379 10,055 -12,273 16,069 7,077
Source: ĠGEME, 2007
The main destinations of Turkish exports of milk and milk products are the close
neighbors such as Turkish Republic of Northern Cyprus, Middle East, and Turkic
Republics (ĠGEME, 2007). EU countries do not have a noteworthy place in export of
milk and milk products. However, Turkey has an important potential for export of its
traditional products to the countries like Germany where Turkish population is dense.
Import of milk and milk products of Turkey in 2006 was about 36 thousand tons (87 ml
$) and nearly 40% of it was made in the milk and cream group. This is followed by
butter, other fats derived from milk and cheeses. Turkey‟s main import partners are EU
countries, France, and Germany in particular, Ukraine and Turkish Republic of Northern
Cyprus.
Due to high customs duty, a considerable amount of milk products are imported under the
Inward Processing Regime, and are exported after being processed (DPT, 2005). Milk

SECTORAL ANALYSIS: Dairy, Tomato, Cereal, Poultry AERI
32
powder is a very good example because it is imported in order to produce the products to
be exported.
The net export will be affected by EU-Accession. Trade liberalization with the EU will
enhance imports more than exports, especially in livestock products, though Turkey could
still be a significant net exporter of agricultural products. With no trade restriction with
the EU, livestock imports will increase considerably. Livestock production will decline as
the largest price falls following trade harmonization will be experienced in the livestock
sector (CEEC, 2006).
Instead of focusing on the Imports & Exports, Turkey should be better advised to focus
on its own domestic market (FAO, 2006).
2.4.2.4. Government Policies
There are several support tools that aim to increase the milk production directly or
indirectly. The most important one among these is the milk subsidy. Milk subsidy (base
support), initiated in 1987, was 3 ykr/lt in 2007 (i.e. 6 to 7% of average price, see table
11). Since premium payments support the production directly and are given only to the
processing sector, the informal sector declines while the production is increasing.
In addition to the premium implementation, some other support measures aiming at
supporting cattle farming and the related amount of payments are illustrated in Table 9.
Table 11 Certain supports for cattle farming (2005)
Source: DG-Agricultural Production and Improvement, 2008a
Subject of the Support Amount
Dairy Support (Base) 3,0 Ykr /lt
Producer- if member of an organisation 5,5 Ykr/lt
Additional support to farmers contributing to the Ministry‟s
improvement activity by registering their animals
1,5 Ykr/head
Additional support if advisor (Agricultural Engineer, and
Veterinarian) is employed in producer organisation
1,5 Ykr/head
Artificial Insemination
Priority provinces subject to development 36,0 YTL/head
Other Provinces 26,0 YTL/head

SECTORAL ANALYSIS: Dairy, Tomato, Cereal, Poultry AERI
33
Feeding crops support had the biggest portion among the livestock support in 2005 with a
ratio of 24%. This is followed by milk subsidies and market organization. Breeding with
licensed stud/animal, and milking hygiene and milk quality payments have the smallest
shares with 0.8% and 1% respectively.
As it is displayed in the table, there are many different supports aiming to promote the
livestock sector. High numbers of these tools disperse the system and create enforcement
problems. A single support system replacing these tools prevents the difficulties that
emerges from the system itself and dissipation of sources.
The dairy industry in the EU is heavily supported and milk producers in Turkey will
benefit of these supports in a possible membership.
Table 12 Dairy Farming Support (2007)
Subject of the Support Value
(thousand YTL)
Share in total
animal support (%)
Stud with license 2,475 0.3
Artificial Insemination Support 25,572 3.5
Calf born by artificial insemination 25,731 3.6
Plant for feed 412,589 57.1
Milking hygiene and milk quality support 5,767 0.8
Milk Subsidy 177,487 24.6
Holdings Free from Animal disease 11,540 1.6
Combat with diseases 2,374 0.3
Food safety 1,136 0.2
Animal Identification System 2,135 0.3
Genetic animal sources 3,006 0.4
Source: DG-Agricultural Production and Improvement, 2008b
3. COMPETITION ANALYSIS
3.1. Quantitative measures of competitiveness at the macro level
espite the increase in agricultural support in recent years, a reasonable level of production
still cannot be achieved in Turkey. Yet, the increase in different products such as maize
and milk is significant.
The effect of government support measures on competitiveness is an important issue to be
concentrated on. “Single Commodity Transfer (SCT)” and “Nominal Protection Ratio

SECTORAL ANALYSIS: Dairy, Tomato, Cereal, Poultry AERI
34
(NPR)” are two of the criteria, calculated for consumers and producers separately,
displaying these effects. Producer SCT was 1,181 million YTL while consumer SCT was
1,276 million YTL in 2006, in Turkey (Table 13), which indicates that the transfers from
consumers to dairy farmers (because consumer prices are higher than they would have
been without government policies) are higher than the government support of producers.
Furthermore, it displays that milk producers in Turkey generate a considerable amount of
their income from supports, market-price support in particular. In EU-25, producer SCT
was 9,958 million €. (OECD, 2007). The latter indicates that 23.1% EU‟s dairy farmers‟
gross receipts were linked to government support transfers. In Turkey, this share was
22.7%, which indicates that the two are similar considering the producers transfers.
The NPR in 2006 for milk producers was 1.35, whilst it was 1.31 for consumers. These
figures indicate that the milk prices in Turkey were 31-35 % higher than the reference
price or international prices. Figures for the EU were 1.31 and 1.29 respectively (OECD,
2007).
Net Trade Position (NTP), denoting the difference between export and import, is also an
important indicator regarding measuring the competitiveness. Table 13 indicates that
Turkey was a net dairy exporter in volume terms in 2005 and 2006 and a net importer
except the year 2006 in value terms (see Table 10). However, one may not forget that
Turkey has been developing according to domestic market conditions. Possible
membership of Turkey to EU may cause significant disadvantages in terms of NTP.
Table 13. Competitiveness Indicators for Milk Sub-Sector
2004 2005 2006
Producer SCT (million YTL) 1,746 1,449 1,181
% SCT 31.8 25.8 22.7
Consumer SCT (million YTL) -1,939 -1,640 -1,206
Producer NPR 1.56 1.45 1.35
Consumer NPR 1.54 1.42 1.31
NTP (million YTL) -25 -12 7
Openness to external competition 0,0003 0,0004 0,0002 Source: OECD, 2007; TEAE calculations

SECTORAL ANALYSIS: Dairy, Tomato, Cereal, Poultry AERI
35
Coefficient of openness to external trade is considerably low in milk sector. This indicates
that milk and milk products sector is not open to external markets enough and amount of
import can be negligible within the domestic demand.
3.2. Farm level competitiveness
3.2.1. Average yields per cows
There has been a significant increase since 2004 in the yield per cow while the number of
animals decreased in recent years. The yield in 2003 was nearly1.9 ton/head/year and
increased to 2.5 tons/head in 2004 and 2005 (Table 14). The average yield in EU is over 5
tons/head/year (EU, 2008).
The yield difference between Turkey and the EU is still far too large and demonstrates
that Turkey is not able to compete with the EU in the current situation. Thus, measures
should be taken in order to achieve at least the EU production level.
The factors that raise the yield are livestock support besides the improvement of cattle
farming. However, the high share of animals with domestic breed in total animal number
negatively influences the success of these activities. Accordingly, activities towards
raising the yield, notably the breed improvements, should steadily continue. Another
factor that is embarrassing the improvement of the sector is the significant differences
among the regions and firms. Besides, it affects the average milk yield considerably
negative.
The yield is high or even very close to the EU members and other developed countries‟
average in modern companies and western regions where cattle farming is intensively
performed, whilst it is too low in eastern regions and in firms producing with traditional
methods. For instance, the average yield of holdings registered to DSYB is 6 tons/year,
while the average yield of Turkey is 2.5 tons/year. The main reason for the above
mentioned difference is that the herd structure in the holdings, except the modern ones, is
mainly composed of domestic breed and the care conditions are not good enough.
Another problem regarding milk production and productivity is the regional disparities
and differences between the species. For instance, annual average milk yield is 2.6
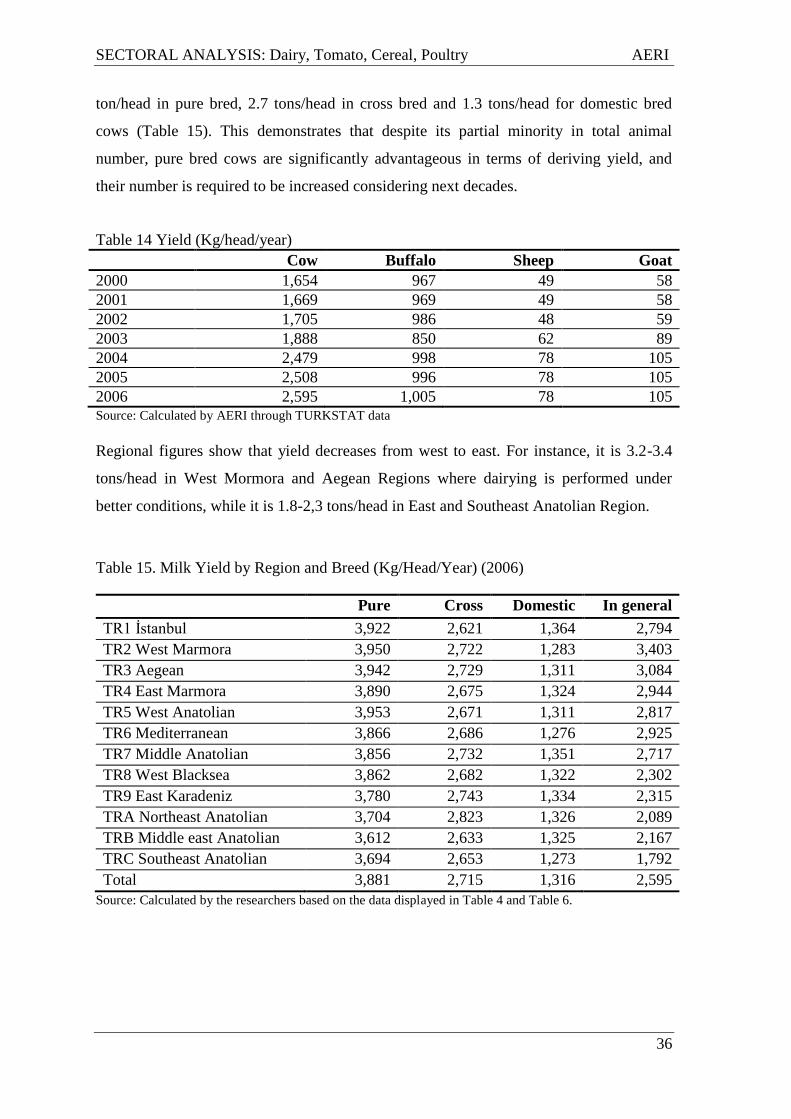
SECTORAL ANALYSIS: Dairy, Tomato, Cereal, Poultry AERI
36
ton/head in pure bred, 2.7 tons/head in cross bred and 1.3 tons/head for domestic bred
cows (Table 15). This demonstrates that despite its partial minority in total animal
number, pure bred cows are significantly advantageous in terms of deriving yield, and
their number is required to be increased considering next decades.
Table 14 Yield (Kg/head/year)
Cow Buffalo Sheep Goat
2000 1,654 967 49 58
2001 1,669 969 49 58
2002 1,705 986 48 59
2003 1,888 850 62 89
2004 2,479 998 78 105
2005 2,508 996 78 105
2006 2,595 1,005 78 105 Source: Calculated by AERI through TURKSTAT data
Regional figures show that yield decreases from west to east. For instance, it is 3.2-3.4
tons/head in West Mormora and Aegean Regions where dairying is performed under
better conditions, while it is 1.8-2,3 tons/head in East and Southeast Anatolian Region.
Table 15. Milk Yield by Region and Breed (Kg/Head/Year) (2006)
Pure Cross Domestic In general
TR1 Ġstanbul 3,922 2,621 1,364 2,794
TR2 West Marmora 3,950 2,722 1,283 3,403
TR3 Aegean 3,942 2,729 1,311 3,084
TR4 East Marmora 3,890 2,675 1,324 2,944
TR5 West Anatolian 3,953 2,671 1,311 2,817
TR6 Mediterranean 3,866 2,686 1,276 2,925
TR7 Middle Anatolian 3,856 2,732 1,351 2,717
TR8 West Blacksea 3,862 2,682 1,322 2,302
TR9 East Karadeniz 3,780 2,743 1,334 2,315
TRA Northeast Anatolian 3,704 2,823 1,326 2,089
TRB Middle east Anatolian 3,612 2,633 1,325 2,167
TRC Southeast Anatolian 3,694 2,653 1,273 1,792
Total 3,881 2,715 1,316 2,595
Source: Calculated by the researchers based on the data displayed in Table 4 and Table 6.
SECTORAL ANALYSIS: Dairy, Tomato, Cereal, Poultry AERI
37
3.2.2. Milk prices and gross margins at the farm level
Indicators illustrating prices and quality of products, costs of production and gross
margins are important for evaluating competitiveness of the sector.
Evolution of production and consumption price trend
Price developments between 2001 and 2006 show that producer price increased by 30%
and consumer price increased by 25.4% on an annual basis (Turkstat, 2008c). The reason
of this considerable increase was the decline in milk yields, difficulties in usage of feed
related to price conditions and drought. Furthermore, increase of consumption of milk
products despite the high prices of milk powder and limited world supply caused prices to
rise (TZOB, 2008)
Another interesting issue regarding the price trend since 2006 is the relatively constant
producer price over most of the period 2006 and 2007 while consumer prices show an
increasing trend since the end of 2006 to (at least) November 2007 (Figure 4). Producer
prices only went up in the second half of 2007. Further, these data indicate that consumer
prices are more fluctuating than procer prices and at a (much) higher level than the
producer price.
Tenders under free market conditions determine the reference milk price in Turkey.
These tenders are held in Burdur, Çanakkale (Biga) and Balıkesir (Gönen) as the milk
industry is mainly concentrated in west Marmora and Aegean Region, and production
among the region is usually performed for the industry.

SECTORAL ANALYSIS: Dairy, Tomato, Cereal, Poultry AERI
38
Source: TURKSTAT, 2008c
Figure 4 Evolution of producer and consumer prices of milk (Januari 2006-March 2008)
At the tenders, producer organisations (representing farmers) and (mainly large scale)
purchasing firms gather and negotiate about the price and the volume. Written contracts
settle the deal. These prices set are accepted by other farmers and firms in the country as
reference prices. However, price disparities among the regions arise because the industry
is concentrated in particular regions, and remote producers can not transfer their products
to them. Hence, producers market their milk in closer areas even if milk prices offered by
the nearest dairy plant is (much) lower than the reference price. Still, organisations such
as cooperatives and extension of industry in other regions may lead to an enhanced
bargaining position of farmers that may result in higher producer prices.
However, producer price differentiation according to quality, which is part of the EU
pricing mechanism, is used by certain industrial firms in Turkey Rarity in usage of this
tool limits the increment of the producer income and the improvement of production in
terms of both quality and quantity. Measures that can be effective in eliminating negative
impacts on price may be establishing an intervention mechanism like in the EU, applying
a support system that promotes productive and quality milk production and encouraging
milk production as the main economic activity.

SECTORAL ANALYSIS: Dairy, Tomato, Cereal, Poultry AERI
39
Price Differentiation
In the EU, price differentiation based on quality was set as obligatory under the regulation
1971/1411. However, this obligation was abolished as it became common practice. Such
an application does not exist in the Turkish legislative system. On the other hand, certain
firms apply price differentiation based on quality, or specific criteria which can be
categorised into four:
1. Absence of differentiation based on quality: Domestic or mainly regional
processing firms prefer this highly common application however; it is known that
certain national processors also use it.
2. Practice of premium based only on quantity of the milk: Beside domestic and
regional firms, national ones may also pay premia. The practice includes
subsidising the producers who produce at the amount determined by the firm, or
above it. It helps processing firms to reduce their milk collection expenses.
Furthermore, technical equipment including cooling tanks or milking machines
can be provided by the buyer firms to whom perform milk production in high
amount. Producers who can produce milk on large scale already have these
facilities as they have scale advantages. Consequently, quality of the milk
produced by these producers is higher than the rest.
3. Practice of premium based on biological and chemical quality, beside quantity of
the milk: It is a system which is usually used by firms performing at national
level. Premium is given not only according to biological quality of the mik but
also chemical characteristics such as fat, or protein. Premium system under that
category fully rewards the production of quality milk. Accordingly, producers
endeavour to improve the quality of their milk in order to benefit from the
practice. Producers in Tekirdağ and Kırklareli are good cases to that.
4. Practice of premium covering the structural features of the holding: Premium is
given not only according to the quality of the milk but also certain features of
holdings depending on its possession of a cooling tank or a related investment;
freeness from diseases; or practicing registration in line with the Regulation of
253/2004/EC and 254/2004/EC. It is applied by certain firms produce at national
level.

SECTORAL ANALYSIS: Dairy, Tomato, Cereal, Poultry AERI
40
Box 6. Pricing Practice of Firm A Based on Quality
Below is the pricing practice of Firm A based on quality, which performs in milk
products sector:
Fat: On the basis of the ratios 3.6% for winter and 3.5% for summer, premium is
allocated under or above the figures. (0.005 YTL/lt)
Protein: On the basis of the ratios 3.4% for winter and 3.3% for summer, premium is
allocated under or above the figures. (0.005 YTL/lt)
Number of bacteria: Fine is taken for above 100 thousand bacteria, and premium is given
under 100 bacteria on the basis of Food Codex. (0.025 YTL/lt)
Number of somatic cells: Fine is taken for above 400 thousand bacteria, and premium is
given under 400 bacteria on the basis of Food Codex. (0.025 YTL/lt) Freeness from
diseases and registry certification: registration and Certification Premium is given to
producers who document that their holding is free from diseases stressed in Turkish Food
Codex, tuberculosis and brucella, and keep record in line with the regulations
853/2004/EC and 854/2004/EC. (0.025 YTL/lt)
Standardisation: Standardisation premium is given to producers who transform the
environment of the cooling tank into the conditions in line with the food codex. (0.010
YTL/lt)
Quantity: Quantity premium is given in order to encourage milk amount per holding.
(0.020 – 0.150 Ytl/lt)
Cooling: A premium is given to producers who possess their own cooling tank in order to
support the producers for cooling tank investment. (0.010 YTL/lt)

SECTORAL ANALYSIS: Dairy, Tomato, Cereal, Poultry AERI
41
Box 7 Cattle Breeders’ Central Association (CBCA)
Cattle Breeders‟ Central Association (CBCA) has been founded in 1998 as a superior board to the
unions which were established in 1995. 69 unions are members of CBCA and employ around 300
veterinaries, experts and 300 administrative personnel.
Approximately 5.5 million cattle are registered to CBCA (1.3 million in herdbook, more than 4
million in pre-herdbook). Farmers with 5 pure bred cows or more are registered in the herdbook,
but most small breeders are not registered. In total 52,000 farmers are registered in the herdbook.
They have 620,000 milking cows and in total own 1.3 million animals. Each cow‟s milk yield is
registered but no information on fat and protein. There are around 100,000 dairy farmers with 5
cows or more.
Main aims of CBCA are to increase the contribution of cattle breeding activities to the national
economy and the profit of livestock activities, and to improve the knowledge base and skills of
farmers to increase produce both in quantity and quality.
Activities of CBCA are composing the heardbook of cattle, registration of cattle, control of
registry, artificial insemination, consultancy, sale and buying of the animals and marketing of
their products, providing of animal health services, representation of the members in national and
international arena, education and publishing.
Incomes of CBCA comes from entrance fees, membership fees (once in a year) and charge of
services (for per animal) and these are equal to 50 kg/year milk value. CBCA plays role in
transferring governmental subsidies for the dairy sector to the farmers who are registered in the
herdbook.
In 2007 CBCA started a project to collect milk prices and production costs from its members in
cooperation with IFCN (International Farm Comparison Network).
In the interview at CBCA headquarters, it was indicated that the price of milk was determined by
tender which was organized by unions in Marmora. But this price is not for whole country and
there are big differences among regions or cities. For example, milk price can be 0.50 YTL/kg in
Marmora, but the price for the same item can be 0.33 YTL/kg in another region. Besides, some
firms offer a cooling premium.
In the dairy market, industrialists are more powerful than the farmers. The way of increasing the
bargaining power of farmers is to be organized and to own processing units.
The main factors that can develop milk and milk products market are the constitution of the price
according to the quality, enhancing producer organization, and establishing big enterprises which
have competition power.

SECTORAL ANALYSIS: Dairy, Tomato, Cereal, Poultry AERI
42
Milk / feed ratio
The milk/feed ratio should be at 1.5 to catch up the breakeven point according to
stakeholders. In other words, 1 kg milk should be able to purchase 1.5 kg compound feed.
The ratio peaked at 1.7 in 2001, and fell to 1.2 in 2006 and rose to 1.3 in 2007 again in
connection with the rise in milk price (Figure 5).
The most important reason of the decline in the parity was the rise in feed price due to the
rise in exchange rate which was affected by the crises experienced. However, today, the
reason is the increase in usage of the maize as biofuel due to drought and the rise in price
of raw material of the feed in international markets in connection with the increase of
animal production. This is very important considering the fact that the import of raw
material for the feed is high in Turkey which directly affects the milk/feed ratio.
Source: Calculated by AERI through TURKSTAT data.
Figure 5 Development in Milk/Feed Ratio
Gross margin
Profitability is one of the most important criteria in terms of evaluating the activity of
milk production. Gross margin calculation is widely used in order to indicate profitability.
At this level of the report, gross margin results are calculated by the average efficiency of
dairy holdings producing with modern methods which are registered by DSYB. These

SECTORAL ANALYSIS: Dairy, Tomato, Cereal, Poultry AERI
43
calculations are compared with those for Turkish average milk yields. Gross margin of
production activity in the holdings of DSYB members is 30.1 Ykr/lt while gross margin
per cow is 1,808 YTL/head, according to the calculation (Table 16).
Table 16 Gross Margin in Milk Production Activity (2007)
DSYB avr. Turkey avr. Turkey avr.**
Milk yield (lt/yıl) (1) 6,009 2,508 2,508
Milk price (YTL/lt) (2) 0.42 0.42 0.35
Milk support(YTL/lt) (3) 0.07 0.07 0.07
Revenue (YTL)
Milk sale (1 x 2) 2,523.6 1,053.36 877.80
Milk support (1 x 3) 420.6 175.56 175.56
Calf 300.0 300.0 200.0
Fertilizer 24.0 10.0 10.0
Total revenue (4) 3,268.1 1,538.92 1,263.36
Variable expenditure (YTL)
Feed expenditure 1,238.0 506.0 506.0
Roughage 18.0 18.0 18.0
Compound feed 1,220.0 488.0 488.0
Veterinary and medicine
expenditure
43.3 43.3 43.3
Artificial insemination 25.5 25.5 25.5
Water and electricity 149.4 149.4 149.4
Tools and machinery expenditure 4.7 4.7 4.7
Total variable expenditure (5) 1,460.9 728.90 728.90
Gross margin calculation
A. milk revenue per 1 lt (4 / 1) 0.54 0.61 0.50
B. variable cost of milk per 1 lt (5 /
1)
0.24 0.29 0.29
C. gross margin of milk production
1 lt (A-B)
0.30 0.32 0.21
D. gross margin per cow 1,807.22 810.02 534.46
* Figures were calculated per head referring to the holdings that have 5 animals registered to breed file by
2006 ** Calculation based on the assumption that differences in milk quality, and price of calf and milk.
Source: CBA; AERI, 1999; KKGM (DG-Protect and Control of MARA), 2007.
The average milk yield for Turkey is nearly 2,508 while it is 6,009 lt/year/head for the
holdings that make a base for these calculations. In consequence, gross margin rises to
32,3 Ykr/lt while gross margin per cow considerably decreases to 810 YTL/head in
connection with yield considering Turkey average.
It is assumed that calf price is the same in both calculations besides milk quality and
price. Yet, there are considerable differences between animals with high yields and the
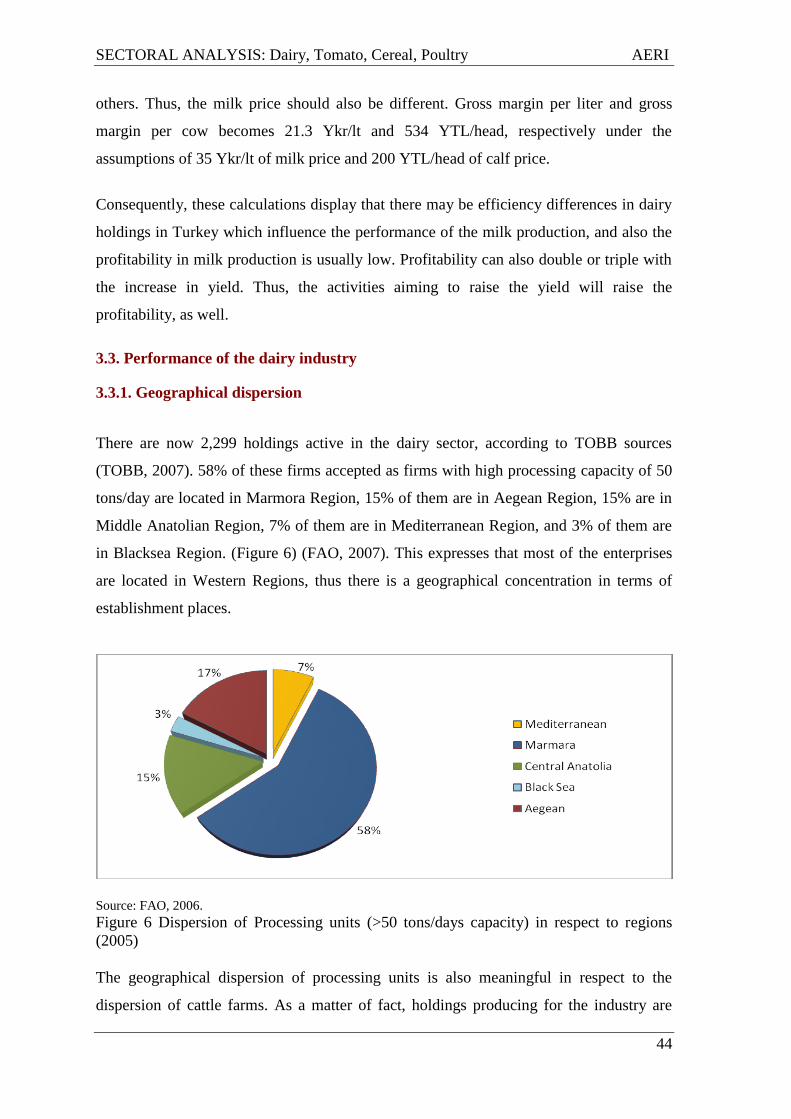
SECTORAL ANALYSIS: Dairy, Tomato, Cereal, Poultry AERI
44
others. Thus, the milk price should also be different. Gross margin per liter and gross
margin per cow becomes 21.3 Ykr/lt and 534 YTL/head, respectively under the
assumptions of 35 Ykr/lt of milk price and 200 YTL/head of calf price.
Consequently, these calculations display that there may be efficiency differences in dairy
holdings in Turkey which influence the performance of the milk production, and also the
profitability in milk production is usually low. Profitability can also double or triple with
the increase in yield. Thus, the activities aiming to raise the yield will raise the
profitability, as well.
3.3. Performance of the dairy industry
3.3.1. Geographical dispersion
There are now 2,299 holdings active in the dairy sector, according to TOBB sources
(TOBB, 2007). 58% of these firms accepted as firms with high processing capacity of 50
tons/day are located in Marmora Region, 15% of them are in Aegean Region, 15% are in
Middle Anatolian Region, 7% of them are in Mediterranean Region, and 3% of them are
in Blacksea Region. (Figure 6) (FAO, 2007). This expresses that most of the enterprises
are located in Western Regions, thus there is a geographical concentration in terms of
establishment places.
Source: FAO, 2006.
Figure 6 Dispersion of Processing units (>50 tons/days capacity) in respect to regions
(2005)
The geographical dispersion of processing units is also meaningful in respect to the
dispersion of cattle farms. As a matter of fact, holdings producing for the industry are

SECTORAL ANALYSIS: Dairy, Tomato, Cereal, Poultry AERI
45
mainly located in Aegean, Marmora and Thrace Region. Potential in the production of
milk and milk products in east and southeast region, where livestock activities can be
performed in a wide area, can not be utilized enough due to the very limited presence of
processing units. However, factors such as the low quality and productivity of milk or
widely performed goat or sheep farming make new processing units to be established
difficult. Furthermore, establishment of milk processing industry formations in provinces
of East and Southeast Regions are positive improvements in terms of the sector‟s future
and utilizing its current potential.
3.3.2. Capacity Utilization
There is a concentration in allocation of processing units of milk and milk products
referring to their capacities. Accordingly, most of the holdings are middle scaled while a
small number of them are big scaled integrated ones that produce in significant amounts
and provide a considerable part of the production.
Low capacity utilisation is one of the most important problems of the sector. For instance:
capacity utlisation ratio is 15% for processed drinking milk, while it is 25% for white and
kaĢar cheese (DPT, 2007). Insufficiency of raw material due to seasonal variations, and
problems with the quality of the raw material are the main reasons of the problem. In
addition, the abundance in the number of holdings may cause low capacity utilisation.
As the biggest part of the sector consists of small and medium firms, high operation and
product cost problems arise, besides technological inadequacies. Accordingly, price of
milk and milk products fall down depending on the increase of the current processing
capacities or increasing the number of big companies and this may provide the demand
for milk and milk products to rise. With respect to increasing capacity utilization rate,
investments in processing industry besides contracted production may be effective.
3.3.3. Employment
As the size of the majority of the processing units are small and medium, the employment
rate in dairy sector is also low. For instance, there are less than 10 people working in 77%
of the holdings, whilst only 1% of the holdings employee more than 100 people (Table
17).

SECTORAL ANALYSIS: Dairy, Tomato, Cereal, Poultry AERI
46
Table 17. Distribution of dairy industry by size, in number of employees
Numbers of employees Number of enterprise Ratio in all enterprises (%)
1-4 694 30.2
5-9 1,072 46.6
10-19 311 13.5
20-49 157 6.9
50-99 26 1.1
101-841 39 1.7
Total 2,299 127.0
Source: TOBB, 2007
3.3.4. Product prices and value added in the processing industry
A value added is created when an agricultural product, as a raw material, is turned into
processed products. Thus, after the milk is processed into products such as cheese,
yoghurt or butter milk, a value is added to the milk.
The average price of the raw material bought from the producer is 0.45 YTL/Kg referring
to interviews with stakeholders. Prices of the processed milk vary according to its kind.
For example, the price of the pasteurized milk is 0.76 Ytl/Kg, whilst the prices of the
yoghurt and cashar are 1.22 Ytl/Kg and 6.29 Ytl/Kg, respectively. As shown, a significant
amount of value added on milk by processing is created which is varying related to its
kind. Furthermore, the firm sells its products with 10-15% profit. However, it is also
specified that bigger firms sell their products with a profit margin that ranges between 25
and 30%.
3.3.5. Investment
Low consumption level in the country increases the interest of both domestic and foreign
investors to the milk processing industry. On the other hand, structural problems of the
sector such as seasonal variations in production and high production cost restrain the
investments. Still, the number of domestic and foreign investments in dairy farming and
milk products industry gradually increased.
However, major part of the foreign investors in the sector concentrates on ice cream
production. There are investments also majoring in the production of other milk products
SECTORAL ANALYSIS: Dairy, Tomato, Cereal, Poultry AERI
47
and livestock sector. Foreign firms prefer partnership mainly with domestic firms as they
have investment facilities and distribution channels.
3.4. Concluding remarks on competitiveness of the Turkish dairy industry
Although, some portion of the enterpreneurs producing milk has the ability to compete
with the EU, yet big part of the enterpreneurs has many disadvantages. Most of the cattle
farms producing milk are very small. Another disadvantage is the production which is
unfruitfully maintained with domestic or cross breed bred. This weakens the producers‟
position in the market.
The competitive position of small and medium size processors is not strong compared to
big ones. This also negatively influences the competition structure of the market.
Furthermore, factors such as street milk, food safety and unregistered production is
embarrassing the competition in the market.
Yield and milk quality should be improved for abolishment of above mentioned
disadvantages regarding competitiveness. Other factors that can enhance the competition
structure are a better planning of supply which may lead to provide a more stable
production of milk throughout the year, establishing a price system promoting milk
production with high quality under hygienic conditions, diminishing structural problems
of holdings performing milk production, raising capacity utilization ratio to 70-80%,
encouraging consumption of quality milk, economising on costs, notably feed, and
ensuring the rise of production for export.
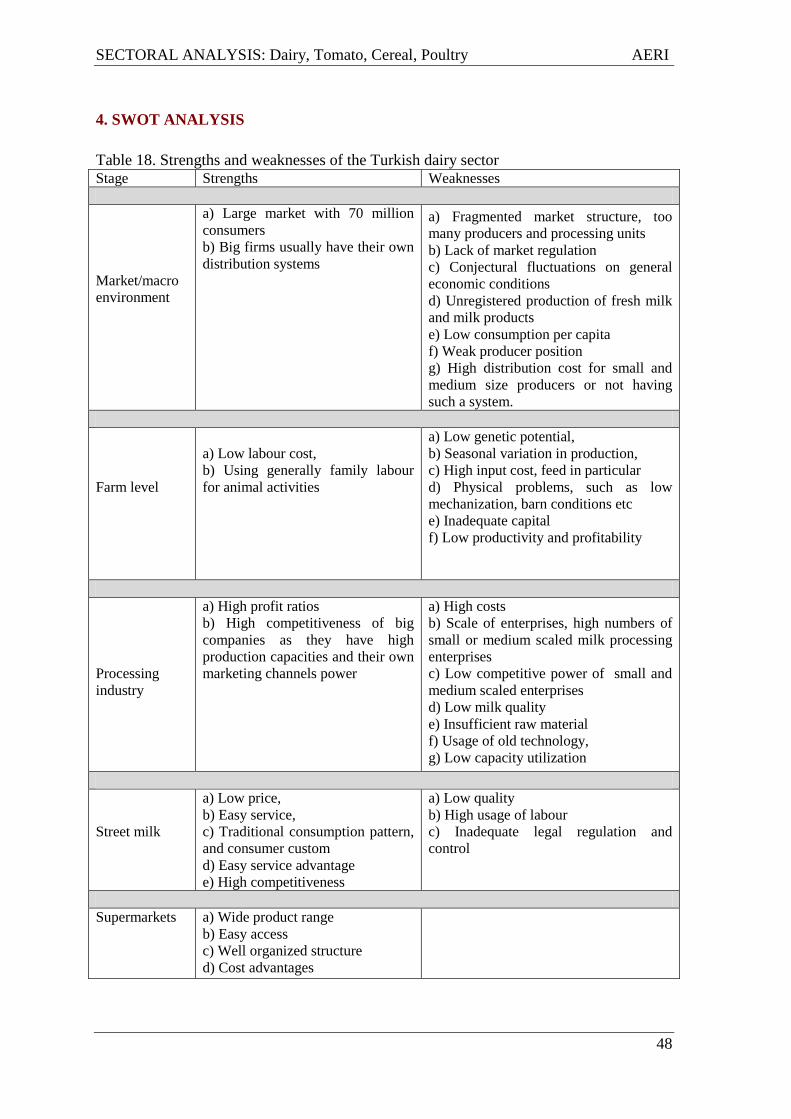
SECTORAL ANALYSIS: Dairy, Tomato, Cereal, Poultry AERI
48
4. SWOT ANALYSIS
Table 18. Strengths and weaknesses of the Turkish dairy sector Stage Strengths Weaknesses
Market/macro
environment
a) Large market with 70 million
consumers
b) Big firms usually have their own
distribution systems
a) Fragmented market structure, too
many producers and processing units
b) Lack of market regulation
c) Conjectural fluctuations on general
economic conditions
d) Unregistered production of fresh milk
and milk products
e) Low consumption per capita
f) Weak producer position
g) High distribution cost for small and
medium size producers or not having
such a system.
Farm level
a) Low labour cost,
b) Using generally family labour
for animal activities
a) Low genetic potential,
b) Seasonal variation in production,
c) High input cost, feed in particular
d) Physical problems, such as low
mechanization, barn conditions etc
e) Inadequate capital
f) Low productivity and profitability
Processing
industry
a) High profit ratios
b) High competitiveness of big
companies as they have high
production capacities and their own
marketing channels power
a) High costs
b) Scale of enterprises, high numbers of
small or medium scaled milk processing
enterprises
c) Low competitive power of small and
medium scaled enterprises
d) Low milk quality
e) Insufficient raw material
f) Usage of old technology,
g) Low capacity utilization
Street milk
a) Low price,
b) Easy service,
c) Traditional consumption pattern,
and consumer custom
d) Easy service advantage
e) High competitiveness
a) Low quality
b) High usage of labour
c) Inadequate legal regulation and
control
Supermarkets a) Wide product range
b) Easy access
c) Well organized structure
d) Cost advantages

SECTORAL ANALYSIS: Dairy, Tomato, Cereal, Poultry AERI
49
Table 19 Opportunities and threats of the Turkish dairy sector
Opportunities Threats
Market
a) Increasing population and high
share of young people in population
b)Willingness to pay for milk
products and other animal products
c) Income increase
a) Low purchase power of consumers
b) Poor awareness of consumers
Farm level
a) Increasing direct or indirect
support for livestock sector
b) Improvement in quality of milk
and yield
c) Increasing willingness to
livestock investment
d) Increase in milk collection
centres
e) Price differentiation
a) Low productivity and profitability
b) Possible EU membership (regarding
competition)
c) Insufficient activities towards
improving genetic capacity
Processing
level
a)Unutilised export possibilities,
b) R&D Activities
c) Possible EU membership
(considering the new markets)
d) Rise in income in connection to
demand increase
a) Imported milk powder
b) Taking poor quality raw material
b) Fluctuations in economy
c)Possible EU membership (regarding
competition)

SECTORAL ANALYSIS: Dairy, Tomato, Cereal, Poultry AERI
50
5. PRIORITY OF OBJECTIVES AND POLICY OPTIONS
The Turkish dairy sector is experiencing serious problems due to low productivity, lack of
competition, weak market organization, inefficient legal regulations, high cost, instable
prices, low profitability, scattered and fragmented market structure, decreasing
effectiveness of support due to its multilayered structure etc. which hamper the
development of the sector possessing a growth potential.
One of the fundamental factors that can improve the sector is an increased consumption
of animal products in line with an increase in consumer income. However, uneven
income distribution is a constraint to consumption increase.
Problems of the milk processing industry such as scale, cost and milk quality weakens the
farmers‟ position in the market, its competitiveness in particular, in addition to
effectiveness of marketing system.
All these factors and other findings derived from the study emphasise the importance of
prioritising policy objectives and activities that may help to enable further development of
sector in order to strengthen its competitive position. In this part, the study presents a
hierarchy of policies and policy recommendations based on the interviews done with
stakeholders and previous studies.
Sufficient and Quality Milk Production
Before all else, a solution of structural and economic problems is needed in order to
provide sufficient quality milk production which is utilised as raw material for the
industry. Some of these problems are the multi-scattered structure of holdings, the
sector‟s low level of technology utilisation, equipment in particular, poor physical
conditions of barns, or collection system, and production for self-consumption. However,
a solution of these farm level problems is very hard and possible only at middle-long
term. Main factor for the solution may be measures to increase producer income. Then,
producers can perform livestock production under better conditions and at a level which
enables them to produce in good quality via the aforementioned solutions for the
problems. Accordingly, at the first place, practices such as support measures aiming to

SECTORAL ANALYSIS: Dairy, Tomato, Cereal, Poultry AERI
51
increase farm income of dairy farmers, or increased efforts to apply price differentiation
based on quality should be put on the agenda.
Other factors that may be effective in increasing milk quality and quantity may be
establishing organised industry areas or raising production via contracting which will be
performed by producer organisations, in regions where livestock farming is intensively
performed or posseses significant potential. This type of projects or practices may enable
improved technical and economic conditions of livestock farming, and dairy farming in
particular. Adding to that, extension of processing firms among the country may provide
important advantages to East and Southeast Regions where dairy farming was not
developed enough.
It is very important that a legal framework for street milk is established in terms of public
health and to avoid unregistered production. Marketing strategies and networks can be
formatted concerning traditional consumption habits in co-operation with structures
similar to producer organisations or institutions such as municipalities.
Productivity increase is the most effective factor in increasing production. Genetic
improvement projects including artificial insemination considering seasonal production,
embryo transfer, and improvement of domestic breed are significantly important.
However, these projects cannot be performed by the producers. Thus, producers union,
government, universities and private sector should conduct collective projects.
Increase of consumption and production of sheep and goat milk and their products is very
important in terms of raising Turkey‟s competitiveness during the EU membership
regarding livestock sector. Therefore, projects including rural development support that
aim to improve sheep and goat dairying in places where dairy cattling cannot be
performed or would have any potential.
Organisation
One of Turkish main agricultural problems is the lack or inadequacy of producer
organisation. It is not different for milk producers. Many cooperatives or unions such as
Damızlık Sığır YetiĢtiricileri Merkez Birliği, Köy-Koop ve Hay-Koop operate currently.
However, high numbers of unions and cooperatives show that they are not able to operate

SECTORAL ANALYSIS: Dairy, Tomato, Cereal, Poultry AERI
52
effectively. In contrary, it demonstrates the abundance in the sector. For the solution of
this problem, at least the unions or cooperatives should have a wide ability of
representation.
The processing sector is much better organised than than the farmers are in producer
organisations. SETBĠR is the most important union of the sector and the shares of the
member firms are significant.
An important step towards solving problems of the sector including the organisation issue
is the establishment of a “National Milk Council” covering all the stakeholders that can
be effective during decision taking process and guiding.
A Better Support System
Animal support system is a highly controversial subject among the milk sector. Below are
the recommendations that may increase the efficiency or contribution to production:
1. Supports towards production, not to ownership of land and/or animals
2. Additional premium for contracted production under animal support systems
3. Supporting organisational activities such as collective milking, caring or
marketing with an additional premium system
4. Planning the support system at the regional level and in long term considering the
demand improvements and productivity which enable sustainability in animal
production
5. Generalise investment subsidies on R&D and a laboratory system that backs
animal production and food safety
6. Private sector, as well as government, should also contribute in providing
technical services, training and equipment, and support producers on the subjects
such as technological development.

SECTORAL ANALYSIS: Dairy, Tomato, Cereal, Poultry AERI
53
Benefiting advantages of economies of scale
Many disadvantages, high cost in particular, arise due to the smallness or mediumness of
dairy cattle farms. An increase in the scale of holdings which can be followed by the
number of animals may lead to an increase in producer‟s income.
Production quantity and product quantity may be improved in holdings performing milk
production commercially as the scale increases. However, one may not forget that
increase in scale may lead to problems concerning holding management. Therefore, it is
recommended that commercial dairy holdings reach an optimal level which ensures them
possessing both a certain income and production level, and avoid them from management
and financial problems. Efficient methods to be utilised with this aim may be credits with
suitable term and interest rates, and producer organisations.
Another factor that enables the holdings to reach to an optimum level is the change of
subsistence or semi-subsistence structure of milk production. A big part of the holdings
perform animal farming as an addition to plant production under current circumstances.
The holdings which are in regions with a high potential for livestock production should be
encouraged to transform into optimum scaled animal holdings. On the other hand, to
sustain subsistence and semi-subsistence farming is very important in terms of social
policies and food safety.
As emphasised in the study, most of the holdings active in the milk processing sector,
mandıras in particular, are small or medium scaled in Turkey. Moreover, big companies
provide a considerable part of the production, which demonstrates that size is important
regarding the positioning in the sector. Accordingly, practices such as tax, investment
subsidy, credit facility, etc. which aim to increase foreign investment on processing sector
may be effective in terms of increasing holding size.
Improving marketing services
Marketing of agricultural goods in Turkey is an important problem. Scattered and small
structure of farms aggravates the situation. In milk sector, defects in collection and
distribution services are the main problems concerning subject of marketing. The large
number of the holdings producing milk and lack of equipment (i.e. cooling tank) makes
marketing of the milk difficult. Practices such as village oriented investment projects, or
establishing a collective milking unit, and cooling tank via producer organisation may

SECTORAL ANALYSIS: Dairy, Tomato, Cereal, Poultry AERI
54
improve marketing services at the level of producers. However, regulations that enable
producers unions being more efficient are required. Unless mentioned activities are
realised, weak producer position in the market is very difficult to be improved.
With respect to the processing industry, small and medium scale holdings that are active
on regional or domestic markets make it difficult to create a marketing and distribution
network. Investment subsidies, marketing support, and establishing national collective
distribution network, may improve the marketing services within the processing industry.
One of the preconditions of an efficient marketing system is the formation of information
network enabling communication at national and international level. For the improvement
of a milk marketing system, a “Milk Registering System” that will enable production
planning, guiding, and tracking of the market, and establishing an information network,
beside the co-operation of stakeholders in the dairy sector, are vital.
Pricing System – Price Differentiation
Improvement of a pricing system and differentiation based on quality of the milk can be
used as an efficient way both for raising producer income and quality of raw material and
products. In order to achieve that, the market price of raw milk and supports should be
determined considering certain quality criteria. Within the pricing mechanism, increasing
efficiency of producer organisation may strengthen the position of producers in the
market.

SECTORAL ANALYSIS: Dairy, Tomato, Cereal, Poultry AERI
55
Workshop 1. Sufficient Quality Milk Problem Tree
EF
FE
CT
S
CA
US
ES
MAIN PROBLEM: QUALITY MILK IN SUFFICIENT AMOUNT
Not performing livestock in commercial
means
Small-scaled holdings
Poor feed
quality and
low
quantantity
High
cost
Abundancy in numbers of
holdings (scattered structure)
Inadequacy of
milk
collecting
system
Support Sytem
Training
and
Extention
Poor
awareness
Poor
producer
organisation
(Production,
technology,
collection,)
Unregistered
production
Insufficient control
Domestic
races with
low
productivity
Poor
improvement
and artificial
insemination
activities
Poor caring condition
Inadequacy of
price
differeantiation
and support
system
Poor quality of processed
products
Food Safety
Risk in public
health
Low export
chance
Decrease in
potential of
getting national
income
Import risk
Poor
competitiveness
Restrain of development
of food industry and milk
sub-sector
Increase in
low
producer
income

SECTORAL ANALYSIS: Dairy, Tomato, Cereal, Poultry AERI
56
Workshop 2. Milk Sector-Target Tree
MAIN OBJECTIVE: ENSURING SUFFICIENT QUALITY MILK
PRODUCTION
FA
CT
OR
S
CO
NS
EQ
UA
NC
ES
Establishing Professional
Milk Production Holdings
Cost decline Productivity
increase
Improve in milk
collection system
Establishing
effective
control
system
Technologic
improvement
Support
Price and
support
formation
based on
quality
Training
and
Extention
Counciousness
Organisation
Increase in
producer
income
Processed products increase
in amount and quality with
the development of food
industry and milk sub-
industry
Food safety
Public health
High competitiveness
Low import risk
High export
chance

SECTORAL ANALYSIS: Dairy, Tomato, Cereal, Poultry AERI
57
REFERENCES
CEEC, 2006. Structure and Competitiveness of the Milk and Dairy Supply Chain in
Turkey, Agro Economis Policy Analysis of the new Member States, the Candidate States
and the Countries of the Western Balkans Project, D12-3 Third 6 monthly Report,
http://www.euroqualityfiles.net
DPT, 2007. 9. BeĢ Yıllık Kalkınma Planı Gıda Sanayi Özel Ġhtisas Komisyon Raporu,
Yayın No: DPT: 2720 – ÖĠK:673, Ankara. http://www.dpt.gov.tr
EU, 2008. EUROSTAT Veritabanı, http://epp.eurostat.ec.europa.eu
FAO, 2006. Overview of the Turkish Dairy Sector Within the Framework of EU-
Accession, Draft Report.
FAO, 2007. AB GiriĢ Süreci Çerçevesinde Türkiye‟de Süt ve Süt Ürünleri Sektörüne
Genel BakıĢ, http://www.tarim.gov.tr
ĠGEME, 2007. Süt Ürünleri Sektör Raporu, http://www.igeme.org.tr
KKGM, 2008. Türk Gıda Kodeksi, Çiğ Süt ve Isıl ĠĢlem GörmüĢ Ġçme Sütleri Tebliği
(2000/6 – Resmi Gazete Tarihi, 14.02.2000), http://www.kkgm.gov.tr
OECD, 2007. Agricultural Policies in OECD Countries Monitoring and Evaluation 2007,
Paris.
TEAE, 1999. Tarımsal Ürünler Ġçin Maliyet Hesaplama Metodolojisi ve Veri Tabanı
Rehberi, TEAE Yayın No: 37, Ankara.
TEAE, 2007. Süt ve Süt Ürünleri Durum ve Tahmin 2007/2008, TEAE Yayın No: 159,
Ankara.
TOBB, 2007. Türkiye Odalar ve Borsalar Birliği Kayıtları.
TÜGEM, 2008a. Tarımsal Destekler, Tarımsal Üretim ve GeliĢtirme Genel Müdürlüğü
Ġnternet Sitesi, http://www.tugem.gov.tr
TÜGEM, 2008b. Tarımsal Üretim ve GeliĢtirme Genel Müdürlüğü Kayıtları.
TÜĠK, ÇeĢitli Yıllar. Tarımsal Yapı, TÜĠK Yayınları, Ankara
TÜĠK, 2004. 2001 Genel Tarım Sayımı Tarımsal ĠĢletmeler, Ankara.
TÜĠK, 2007. Türkiye Ġstatistik Yıllığı, Ankara
TÜĠK, 2008a. Tarım Ġstatistikleri Özeti 1987-2006, Ankara
TÜĠK, 2008b. Hayvancılık Ġstatistikleri, http://www.tuik.gov.tr
TÜĠK, 2008c. Üretici ve Tüketici Fiyat Ġndeksleri Veritabanı, http://www.tuik.gov.tr
TÜSĠAD, 2008. Türkiye‟de Tarım ve Gıda: GeliĢmeler, Politikalar ve Öneriler,
http://www.tusiad.org.tr
TZOB, 2008. Türkiye‟de Süt Sektörünün Değerlendirilmesi, 2008 Yılı ve Sonrası
Beklentiler, Ankara, http://www.tzob.org.tr
SECTORAL ANALYSIS: Dairy, Tomato, Cereal, Poultry AERI
58
Turkish Tomato Sector Analysis
GülĢen KESKĠN Tijen ÖZÜDOĞRU Cihan NAZLI Siemen van BERKUM
1. INTRODUCTION
Background and approach of the study
The aim of this study is to describe the state of the tomato subsector and to estimate its
performance in Turkey. For this purpose the report evaluates key constraints in the
sector‟s economic development and identifies some governmental policy priorities that
may help to enhance the Turkish tomato subsector‟s future perspectivess.
This sector report covers the following issues:
a description of the sub-sector based on secondary data including among others trends
in production, consumption and trade, yields, prices, concentration of production,
capacity utilization and a description of marketing channels within the supply chain,
primary data collection using case-studies to illustrate bottlenecks or opportunities to
the sector‟s development and to identify key activities in the tomato sector
identification of key constraints limiting the competitiveness and development of the
sector.
The content of this chapter is as follows. After this brief introduction, the sector‟s general
situation is evaluated in section 2. In section 3 and section 4 the production value and
marketing channels are introduced and analysed. Sector features and a number of
indicators of competitiveness are presented and analysed in section 5 and 6. Based on
these analyses, a SWOT, which includes the sector‟s strengths and weaknesses as well as
opportunities and threats, is drafted in section 7. Finally, suggestions for a few key policy
interventions are given in the last chapter.
2. OVERVIEW OF THE TOMATO SECTOR
3% of world‟s total vegetable output is produced in Turkey. The country is one of the
most important vegetable growing countries where many kinds of vegetables are grown

SECTORAL ANALYSIS: Dairy, Tomato, Cereal, Poultry AERI
59
due to the country‟s most suitable ecological conditions. According to 2007 data, Turkey
produced 25.6 million ton of vegetables, while the country is a world top-3 producer of
watermelons, cucumbers and tomatoes. 3 % of the cultivated area in Turkey is used for
vegetables production. Main outlet is the domestic market; only 2% of the vegetable
production is exported (Keskin and Çakaryıldırım 2005; www.fao.org).
Next to open field production, vegetable production in Turkey takes place under glas
and/or plastic. Vegetables account for 96% of the total cultivation under glass/plastic;
fruits and ornamental plants propagation constitutes the rest (TZOB, 2007). Among the
main vegetables produced in greenhouses are tomato, cucumber, pepper, melon,
watermelon and pumpkin. Tomato is produced in half of all greenhouses. Protected
cultivation is a profitable activity as it is concentrated in a period in which vegetables are
not grown in open field. Greenhouse production of vegetables is concentrated in the
Mediterranean Region.
Total vegetable production varies from year to year in Turkey. However, on average
tomato constitutes 36-40% of the country‟s total vegetable production and 50% of total
vegetable exports. The tomato is the most processed vegetable in Turkey and is used as
fresh, preserved and processed in all sub-branches of the food sector such as the vegetable
and fruit canned food industry, fruit juice industry, frozen vegetable and fruit industry,
dried fruit and vegetable industry (Keskin ve Gül, 2004). Yet, tomato processing
companies mostly display export activities because Turkish people prefer home-made
instead of processed products (Keskin ve Çakaryıldırım 2003).
Tomato production in Turkey has several advantages thanks to very suitable ecological
conditions, a strong domestic consumption of fresh vegetables and a young rapidly
growing population. But the country has some important problems too, such as structural
matters faced in production, inadequate organization, little compliance of the cultivation
methods to the rules of good agriculture practices (GAP)4, the complexity of marketing
channels for vegetable and high post-harvest production losses. All these aspects result
into low incomes of producers and low foreign trade shares.
4 Problems faced with respect to food safety became more important around the world in recent years.
Therefore it has been compulsory to produce a product according to quality and food standards desired and
to ensure accountability. Turkey has adopted some legal arrangements showing the required susceptibility
on GAP and food safety in the light of both EU alignment and international developments.
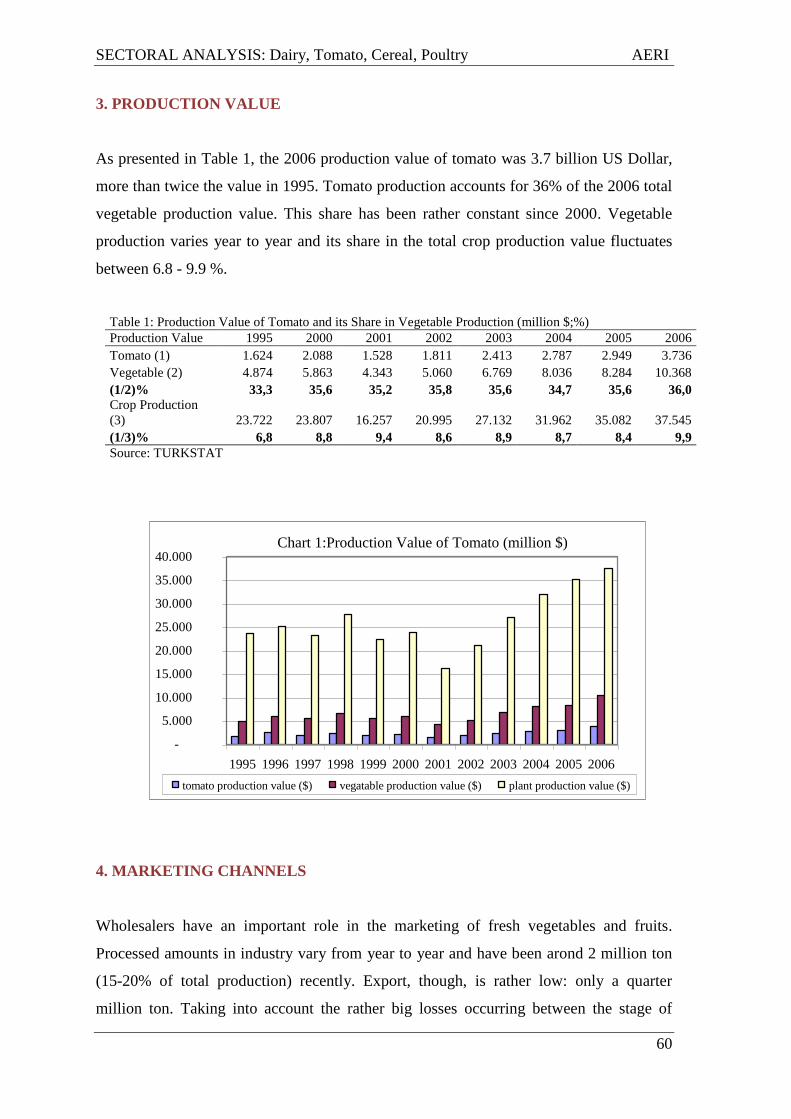
SECTORAL ANALYSIS: Dairy, Tomato, Cereal, Poultry AERI
60
3. PRODUCTION VALUE
As presented in Table 1, the 2006 production value of tomato was 3.7 billion US Dollar,
more than twice the value in 1995. Tomato production accounts for 36% of the 2006 total
vegetable production value. This share has been rather constant since 2000. Vegetable
production varies year to year and its share in the total crop production value fluctuates
between 6.8 - 9.9 %.
4. MARKETING CHANNELS
Wholesalers have an important role in the marketing of fresh vegetables and fruits.
Processed amounts in industry vary from year to year and have been arond 2 million ton
(15-20% of total production) recently. Export, though, is rather low: only a quarter
million ton. Taking into account the rather big losses occurring between the stage of
Table 1: Production Value of Tomato and its Share in Vegetable Production (million $;%)
Production Value 1995 2000 2001 2002 2003 2004 2005 2006
Tomato (1) 1.624 2.088 1.528 1.811 2.413 2.787 2.949 3.736
Vegetable (2) 4.874 5.863 4.343 5.060 6.769 8.036 8.284 10.368
(1/2)% 33,3 35,6 35,2 35,8 35,6 34,7 35,6 36,0 Crop Production
(3) 23.722 23.807 16.257 20.995 27.132 31.962 35.082 37.545
(1/3)% 6,8 8,8 9,4 8,6 8,9 8,7 8,4 9,9
Source: TURKSTAT
Chart 1:Production Value of Tomato (million $)
-
5.000
10.000
15.000
20.000
25.000
30.000
35.000
40.000
1995 1996 1997 1998 1999 2000 2001 2002 2003 2004 2005 2006
tomato production value ($) vegatable production value ($) plant production value ($)

SECTORAL ANALYSIS: Dairy, Tomato, Cereal, Poultry AERI
61
production and the consumer (approximately 20-40% of production does not reach the
consumer), an estimated 4-6 million ton fresh tomato has been available at the domestic
market in the last 10 years. Sales in domestic market are mostly performed by
wholesalers and persons called trader-wholesaler. The domestic trade in vegetables is
characterised by the (long) length of the marketing channel, the highly perishable nature
of vegetables, being a product ready to eat, and the inefficiency of producer unions to act
as a marketing organization.
Chart 2: Marketing Channel
Big supermarkets have entered the marketing channel for fresh vegetables and fruits in
recent years. They generally work together with a broker in wholesale markets and
products are purchased directly without entering the market physically. The share of
supermarket chains in fresh vegetable and fruit marketing is not known but is increasing
and may be considered substantial.
Producer unions play an important role in the marketing system of fruit and vegetables in
EU. The share of these unions varies per county, yet an estimated 50% of the total
production is sold through 1400 producer unions. (TKB, 2006a). Agricultural
cooperatives as well as producer unions have gained importance in recent years in
Turkey. Legal arrangements about producer unions exist in Turkey, yet the opportunities
PR
OD
UC
ER
Stallholder
Exporter
Wholesale
Markets (in
producer
region)
Manufacturer
CO
NS
UM
ER
TÜ
KE
TĠC
Ġ
Processed product
Retailer Wholesale
markets (in
consumer
region)
Trader

SECTORAL ANALYSIS: Dairy, Tomato, Cereal, Poultry AERI
62
from these arrangements to improve the farmers‟ market positions have not (yet) been
implemented efficiently.
The establishment and development of (non profit-driven) agricultural producer unions to
serve producers from production to marketing are included in the government‟s
agricultural strategy plan. The plan argues that as most agricultural holdings have small
sizes, producers have problems taking up new technologies and integrating with markets
and industry. Producer unions could be instrumental to improve the farmers‟ position
(SPO, 2008).
Producers display fragmented and weak structure against other actors involved in the
marketing channel because small family holdings dominate in Turkey. Cooperatives have
not developed sufficiently into economical organizations. That situation can be seen at all
stages from production to marketing. Consequently, it is very hard to assess the effect of
the establishment of producer organisations on the position of the producers in the
marketing stage of the supply chain.
Tüzel et al.(2005) estimates that 85% of the vegetables produced in greenhouses are sold
in wholesale markets and only 3% in local markets. The rest 12% is being sold directly to
consumers by farmers from their holdings.
SECTORAL ANALYSIS: Dairy, Tomato, Cereal, Poultry AERI
63
Box 1: Turkish Fresh Vegetable- Fruit and Agents Federation (TÜSEMKOM)
Tüsemkom was founded by vegetable and fruit agents operating at wholesale
markets in 2002. The information obtained from interviews by TÜSEMKOM is
summarized below.
Wholesale markets work like a stock exchange for the fresh vegetable and fruit
chain. Producer unions, wholesalers and traders have operations in wholesale
markets. Wholesale traders appear to work most efficient because producers have
limited possibilities for trading (little time, poor knowledge, etc.) and trading by
producer unions is weakly organised. The marketing of fresh vegetable and fruit to
consumption places and buyer groups are mostly executed by wholesalers.
Wholesalers receive 8% commission for their marketing service according to the
Markets Law regulating the marketing of fresh vegetable and fruit. The share of total
production entered into markets in the last three years was 25 % according to
TUSEMKOM. Ġt is stated that 90% of the products offered at markets are traded by
wholesalers.
Ġt is stated that 50% of products marketed by wholesalers are sold in market places.
The share of wholesalers in the retail sector is around 25%. The remaining part is
directed to export and industry for processing. Many wholesalers are producers as
well and sell their goods and products at places rented in the market. Great part of
wholesalers sell products in agreement with producers.
Ġt is expected that EU membership will provide a huge stimulus to producers‟efforts
to comply with quality standards and tracebility requirements, and invest in the
organization of producers and the infrastructure of producer unions.

SECTORAL ANALYSIS: Dairy, Tomato, Cereal, Poultry AERI
64
Box 2: Some important recent changes in the fresh fruit and vegetable market in
Turkey (Koç, 2006)
- Since the end of the 1990s many wholesalers operating in big provinces
entered production regions such as Antalya, Mersin, etc.
- Many wholesalers started to organize offering credits, consultancy,
transport services, etc. to producers.
- Many wholesalers have entered into production.
- Wholesalers became more interested in quality and sanitary standards
- The demand of importing countries for product quality and sanitary
standards also affects the quality offered at the domestic market.
- Changes in trade between regions occurred: for instance traders from
the Mersin Province (Mediterrenean region) send products to Ankara,
while those from the Agean and the Marmara region started shipments
to Eastern and Southeastern provinces.
- Supermarket chains establish their supply chain and work together with
one or a few (specialized) wholesalers.
- Supermarkets set up relations with big producers and cooperatives
directly (for example Metro)
- The number of wholesale markets increased rapidly especially in
regions, towns and districts producing vegetables and fruits
- Producers increasingly complaint about the margin between producer
and retail prices.
- Big firms are increasingly involved in wholesale trading (Metro, Gros
Market, Unifruits)
- The marketing chain becomes more complex.
5. SECTOR ANALYSIS
5.1. The Structure of the Tomato Processing Industry
The tomato processing industry is concentrated in the Marmara and Agean Region. The
industry is located in or close to the major tomato production areas.. 15-20 % of the
tomatoes grown are processed by the industry. 80-90% of the processed tomato is used in
tomato sauce industry annually. Tomato sauce as well as other products of canned
industry is produced by some 100 holdings and facilities.
Tomato are processed by factories and facilities established by the private sector.
Employee numbers and production amounts of manufacturing industry are registered
statistically for companies providing employment of 10 persons or more. These firms
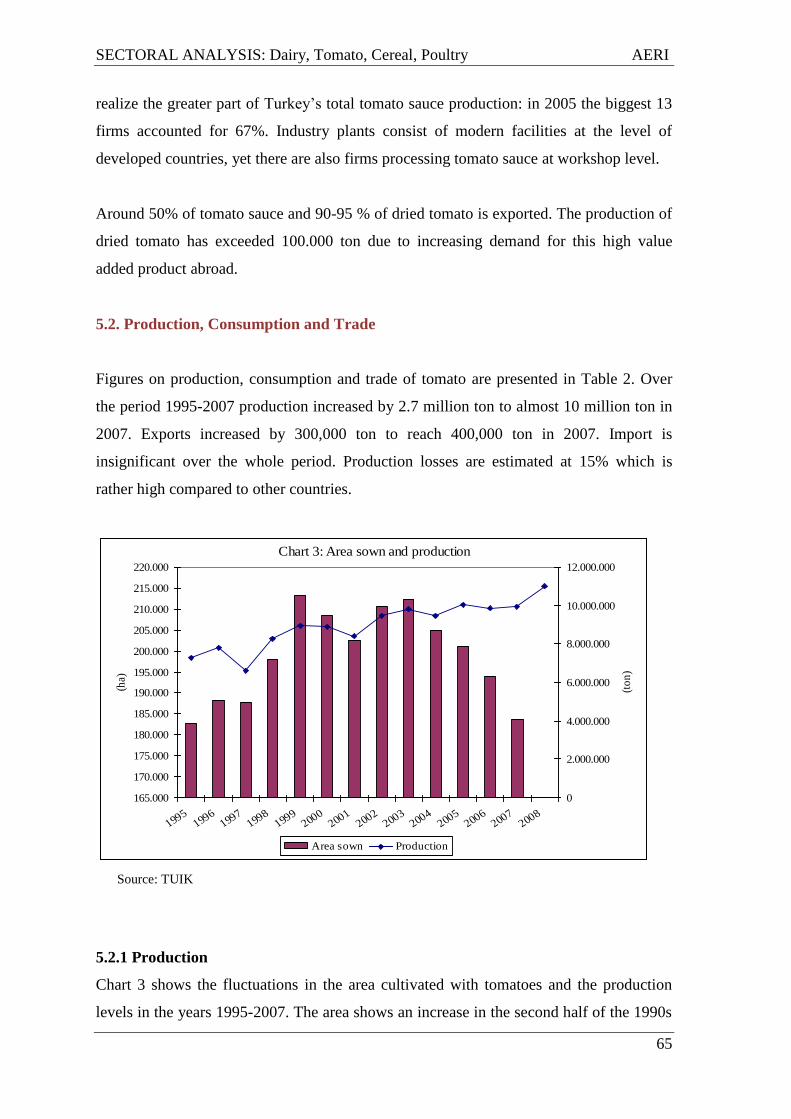
SECTORAL ANALYSIS: Dairy, Tomato, Cereal, Poultry AERI
65
realize the greater part of Turkey‟s total tomato sauce production: in 2005 the biggest 13
firms accounted for 67%. Industry plants consist of modern facilities at the level of
developed countries, yet there are also firms processing tomato sauce at workshop level.
Around 50% of tomato sauce and 90-95 % of dried tomato is exported. The production of
dried tomato has exceeded 100.000 ton due to increasing demand for this high value
added product abroad.
5.2. Production, Consumption and Trade
Figures on production, consumption and trade of tomato are presented in Table 2. Over
the period 1995-2007 production increased by 2.7 million ton to almost 10 million ton in
2007. Exports increased by 300,000 ton to reach 400,000 ton in 2007. Import is
insignificant over the whole period. Production losses are estimated at 15% which is
rather high compared to other countries.
5.2.1 Production
Chart 3 shows the fluctuations in the area cultivated with tomatoes and the production
levels in the years 1995-2007. The area shows an increase in the second half of the 1990s
Chart 3: Area sown and production
165.000
170.000
175.000
180.000
185.000
190.000
195.000
200.000
205.000
210.000
215.000
220.000
19951996
19971998
19992000
20012002
20032004
20052006
20072008
(ha)
0
2.000.000
4.000.000
6.000.000
8.000.000
10.000.000
12.000.000
(to
n)
Area sown Production
Source: TUIK

SECTORAL ANALYSIS: Dairy, Tomato, Cereal, Poultry AERI
66
but has declined again since 2004 to reach a similar number of hectares in 2007 as in
1995. The increase in productivity and the production area under glass and plastic has
been responsible for the increase in Turkey‟s tomato production. Production under
protected circumstances (either in a plastc tunnel or a glasshouse) was 874,000 ton in
1995 and reached 2.5 million ton in 2007, a 181% increase. The increase in open field
production in the years above mentioned was only 17%. The increase of the production
per hectare in open field and protected cultivation has been 23% and 17% respectively.
Out of 9.9 million ton production in 2007, 30% has been sold as industry tomato.
Greenhouse tomato production was implemented at 9,000 ha in 1995. This area increased
117% and reached 19,900 ha. in 2007. The plastic greenhouse is the most important
greenhouse system: 57% of the 2007 tomato production from protected cultivation in
Turkey is from plastic greenhouses, 32% is from glass greenhouses, 8% from high
tunnels and 3% from low tunnels.
Source: TUIK
Chart 4: Tomato production by provinces
0
200
400
600
800
1000
1200
1400
1600
1800
An
taly
a
Bu
rsa
Mer
sin
Izm
ir
Man
isa
To
kat
Can
akk
ale
Mu
gla
Bal
ikes
ir
Ko
ny
a(000 ton)0
20
40
60
80
100
120
(%)
production fresh tomato production
Chart 5: Greenhouse Tomato Production (ton)
-
200.000
400.000
600.000
800.000
1.000.000
1.200.000
1.400.000
1.600.000
1995 1996 1997 1998 1999 2000 2001 2002 2003 2004 2005 2006 2007
low tunnel glass greenhouse plastic greenhouse high tunnel
Source: TUIK

SECTORAL ANALYSIS: Dairy, Tomato, Cereal, Poultry AERI
67
Table 2: Supply and Demand of Tomato
1995 1996 1997 1998 1999 2000 2001 2002 2003 2004 2005 2006 2007
Cultivation area (ha) 182.699 188.082 187.625 197.888 213.255 208.410 202.468 210.630 212.285 204.889 201.116 193.909 183.703
Yields (kg/ha) 39,7 41,5 35,2 41,9 42,0 42,7 41,6 44,9 46,3 46,1 50,0 50,8 54,1
Production (ton) 7.250.000 7.800.000 6.600.000 8.290.000 8.956.000 8.890.000 8.425.000 9.450.000 9.820.000 9.440.000 10.050.000 9.854.877 9.945.043
Industry tomato (ton) 1.920.000 1.775.000 1.145.000 1.790.000 1.750.000 1.700.000 1.500.000 1.700.000 2.050.000 1.889.754 2.983.000 2.942.132 2.973.393
Loss (15%) 1.087.500 1.170.000 990.000 1.243.500 1.343.400 1.333.500 1.263.750 1.417.500 1.473.000 1.416.000 1.507.500 1.478.232 1.491.756
Net fresh production (ton) 4.242.500 4.855.000 4.465.000 5.256.500 5.862.600 5.856.500 5.661.250 6.332.500 6.297.000 6.134.246 5.559.500 5.434.513 5.479.894
Import (ton) 0 93 30 82 67 - 55 74 11 40 40 - -
Fresh consumption (ton) 4.143.973 4.735.956 4.324.190 5.112.688 5.762.648 5.736.601 5.470.537 6.079.085 6.068.234 5.898.922 5.309.358 5.130.316 5.085.659
Export (ton) 98.527 119.137 140.840 143.894 100.019 119.899 190.768 253.489 228.777 235.364 250.182 304.197 394.235 Source:TURKSTAT, FAO, AEU, USDA and SPO
Chart 6: Production and Consumption of Tomato (ton)
0
2.000.000
4.000.000
6.000.000
8.000.000
10.000.000
12.000.000
1995 1996 1997 1998 1999 2000 2001 2002 2003 2004 2005 2006 2007
production fresh consumption industrial tomato
Source: tuik.gov.tr
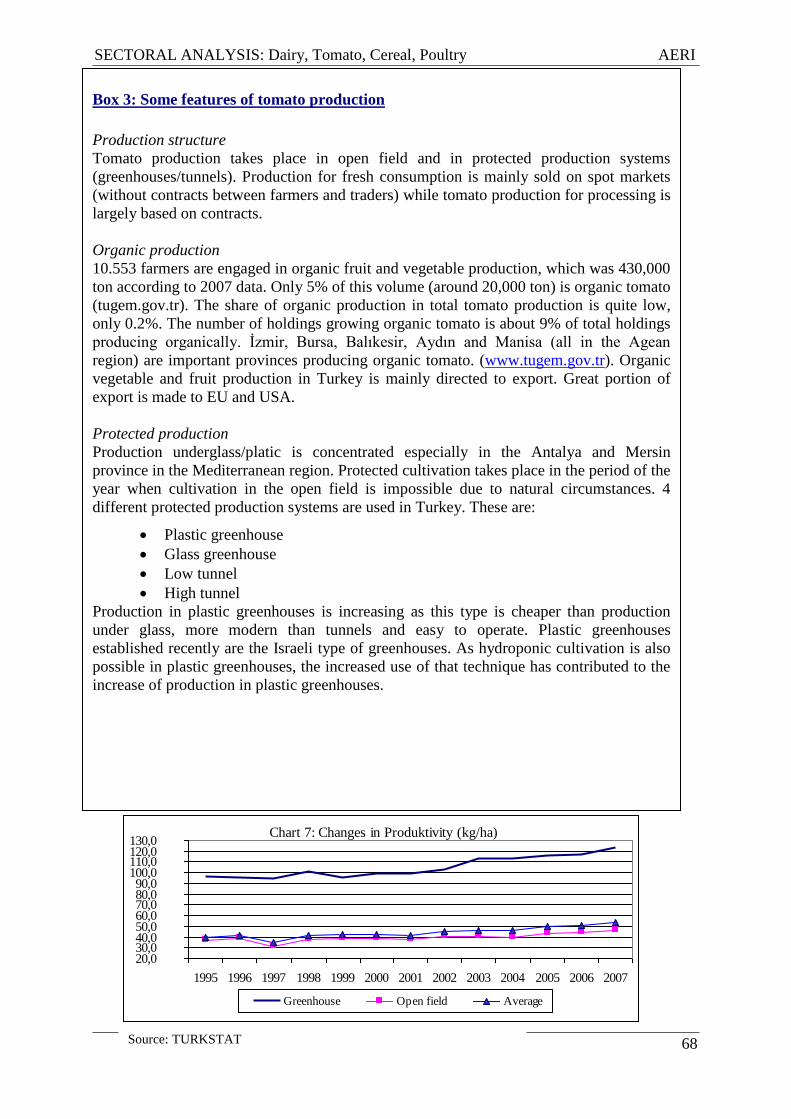
SECTORAL ANALYSIS: Dairy, Tomato, Cereal, Poultry AERI
68
Box 3: Some features of tomato production
Production structure
Tomato production takes place in open field and in protected production systems
(greenhouses/tunnels). Production for fresh consumption is mainly sold on spot markets
(without contracts between farmers and traders) while tomato production for processing is
largely based on contracts.
Organic production
10.553 farmers are engaged in organic fruit and vegetable production, which was 430,000
ton according to 2007 data. Only 5% of this volume (around 20,000 ton) is organic tomato
(tugem.gov.tr). The share of organic production in total tomato production is quite low,
only 0.2%. The number of holdings growing organic tomato is about 9% of total holdings
producing organically. Ġzmir, Bursa, Balıkesir, Aydın and Manisa (all in the Agean
region) are important provinces producing organic tomato. (www.tugem.gov.tr). Organic
vegetable and fruit production in Turkey is mainly directed to export. Great portion of
export is made to EU and USA.
Protected production
Production underglass/platic is concentrated especially in the Antalya and Mersin
province in the Mediterranean region. Protected cultivation takes place in the period of the
year when cultivation in the open field is impossible due to natural circumstances. 4
different protected production systems are used in Turkey. These are:
Plastic greenhouse
Glass greenhouse
Low tunnel
High tunnel
Production in plastic greenhouses is increasing as this type is cheaper than production
under glass, more modern than tunnels and easy to operate. Plastic greenhouses
established recently are the Israeli type of greenhouses. As hydroponic cultivation is also
possible in plastic greenhouses, the increased use of that technique has contributed to the
increase of production in plastic greenhouses.
Chart 7: Changes in Produktivity (kg/ha)
20,0 30,0 40,0 50,0 60,0 70,0 80,0 90,0
100,0 110,0 120,0 130,0
1995 1996 1997 1998 1999 2000 2001 2002 2003 2004 2005 2006 2007
Greenhouse Open field Average
Source: TURKSTAT
SECTORAL ANALYSIS: Dairy, Tomato, Cereal, Poultry AERI
69
Box 4: Interviews with farmers producing tomato under glass/plastic in Antalya
Production
Tomato production under glass or plastic is made in a single or dual cultivation system. In
a single product system, the same product is cultivated in the greenhouse during the
growing season, while in a dual product system, two products are grown in the
greenhouse between August/September and January. The growing season can, however,
continue till June/July.
The average cultivation area in glass and plastic greenhouses is generally between 1-6
decar and productivity per ha varies between 140-200 ton tomatoes. Coal and wood is
used for heating. Chinese coal is used in recent years, although it depresses productivity.
Farmers interviewed indicated to face problems in marketing and export because of
oversupply.
Marketing
Producers bring their products to market and local markets where wholesalers sell
products on behalf of them. Wholesalers classify products based on their quality feature.
First quality products are sold to exporters, while the second quality products are
presented to the domestic market. Some farmers expressed that they request directing
their products to export directly but as they are not willing to take high risks, they sell
their produce to wholesalers. In addition, farmers claim that products can not be exported
directly as producer unions are not efficient in their marketing activities. Some farmers
said they sell their products compulsory to wholesalers because some inputs such as
fertilizers and pesticides are provided by them.
Producer unions
Producers consider producer unions to operate inefficiently and being unable to get the
best price for the farmers. Although they would like to sell their products via producer
unions they do not approach them positively due to a lack of confidence in their
operations. Main reasons mentioned by the farmers for this are the unions‟ inadequate
infrastructure and the incapable management.
Expectations from EU membership
Farmers producing tomato under glass/plastic think that membership of the EU will
increase their sale/export and product prices and therefore will have positive effects for
them. They envisage increased production under glass/plastic as well as positive effects
on product quality.
Consultancy Services
Producers said they take consultancy services from pesticide distributors but acknowledge
that it would be better to take such service by a professional consultancy with more
adequate technical knowledge.
The demand and supply balance for Turkish tomato sauce is presented in Table 3. Imports are
negligible. The production season of tomato sauce starts in September and finishes at the end
of August the following year. Around 45-55% of the production was exported between 2000-
2007.

SECTORAL ANALYSIS: Dairy, Tomato, Cereal, Poultry AERI
70
As tomato contains mostly water and it is not an easy product to store it should be processed
instantly after harvest. Therefore the industry‟s capacity usage during the campaign period is
around 50%.
Table 3. Supply and Demand of Tomato Sauce in Turkey (ton) 2000/2001 2001/2002 2002/2003 2003/2004 2004/2005 2005/2006
Industry Tomato 1.700.000 1.500.000 1.700.000 2.050.000 1.889.754 2.983.000
Processed for t. sauce 1.560.000 1.440.000 1.590.000 1.920.000 1.620.000 1.590.000
Production 260.000 240.000 265.000 320.000 270.000 265.000*
Iımport 2.040 721 242 569 695 308
Beginning stock 3.121 5.290 4.369 40.810 25.000
Export 129.054 113.454 143.347 177.028 167.691 165.000
Domestic use 108.000 125.098 122.816 107.100 118.814 121.552
Finish stock 3.121 5.290 4.369 40.810 25.000 3.756 Source: TURKSTAT, FAO, AEU, USDA and SPO *www.gıdasanayii.com
5.2.2 Consumption
Although tomato consumption per capita varies from year to year it has decreased after 2002
(see Chart 8). While fresh tomato consumption was 67 kg/capita in 1995, it increased to 80-90
kg/capita in the years before and after 2000, yet declined in recent years to reached 72
kg/capita in 2007. Consumption also decreased due to a decline in production in 1997, 2001
and 2004. The decrease in recent years is assumed to be the result of an increase in the share
of tomato production used for processing into tomato sauce.
Chart 8: Fresh tomato consumption per capita (kg/year)
60
65
70
75
80
85
90
1995 1996 1997 1998 1999 2000 2001 2002 2003 2004 2005 2006 2007
Source: TEAE
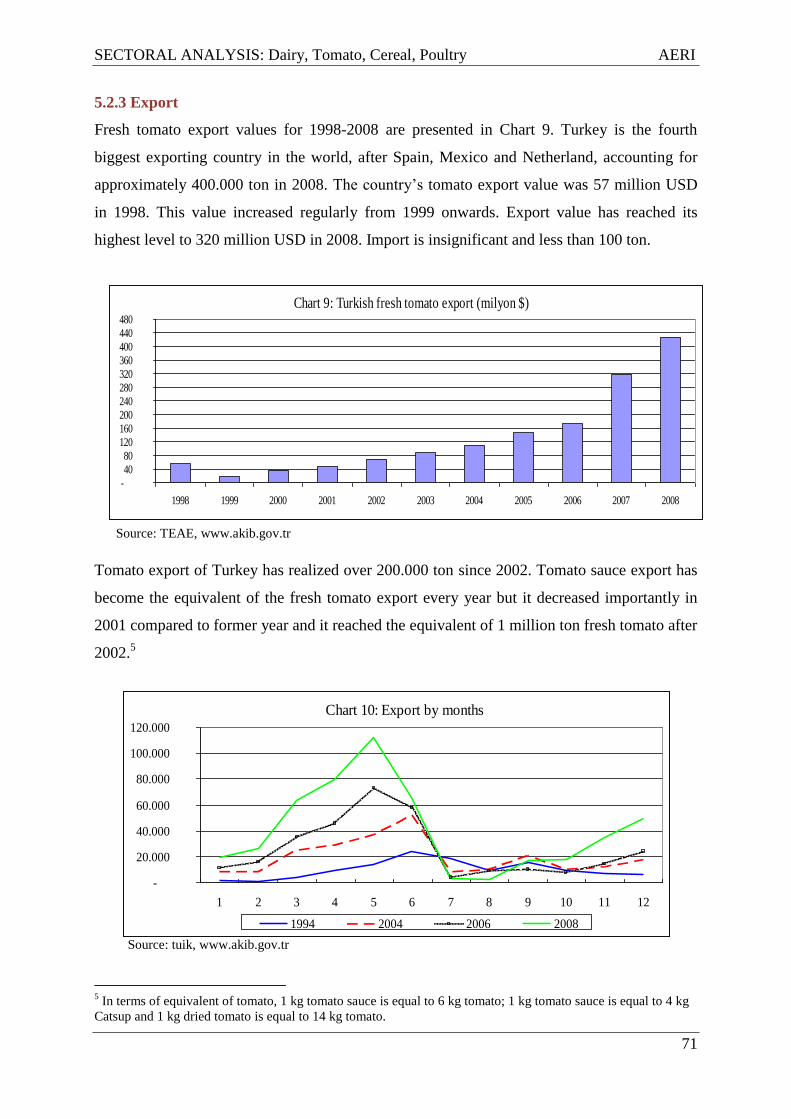
SECTORAL ANALYSIS: Dairy, Tomato, Cereal, Poultry AERI
71
5.2.3 Export
Fresh tomato export values for 1998-2008 are presented in Chart 9. Turkey is the fourth
biggest exporting country in the world, after Spain, Mexico and Netherland, accounting for
approximately 400.000 ton in 2008. The country‟s tomato export value was 57 million USD
in 1998. This value increased regularly from 1999 onwards. Export value has reached its
highest level to 320 million USD in 2008. Import is insignificant and less than 100 ton.
Tomato export of Turkey has realized over 200.000 ton since 2002. Tomato sauce export has
become the equivalent of the fresh tomato export every year but it decreased importantly in
2001 compared to former year and it reached the equivalent of 1 million ton fresh tomato after
2002.5
5 In terms of equivalent of tomato, 1 kg tomato sauce is equal to 6 kg tomato; 1 kg tomato sauce is equal to 4 kg
Catsup and 1 kg dried tomato is equal to 14 kg tomato.
Source: TEAE, www.akib.gov.tr
Chart 9: Turkish fresh tomato export (milyon $)
-
40
80
120
160
200
240
280
320
360
400
440
480
1998 1999 2000 2001 2002 2003 2004 2005 2006 2007 2008
Kaynak: TEAE
Chart 10: Export by months
-
20.000
40.000
60.000
80.000
100.000
120.000
1 2 3 4 5 6 7 8 9 10 11 12
1994 2004 2006 2008
Source: tuik, www.akib.gov.tr
SECTORAL ANALYSIS: Dairy, Tomato, Cereal, Poultry AERI
72
Box 5: Good Agriculture Practices and Standards
Food control services in Turkey are carried out by General Directorate of Protection and
Control (KKGM) within Ministry of Agriculture and Rural Affairs. Some duties of
KKGM within the scope of these services are:
To coordinate audits and controls for all stages of the food production chain according to
the Law No: 5179, to provide safety food supply by establishing an efficient control
system within the context of EU alignment and for this purpose to implement the concepts
of Hazard Analysis and Critic Control Points (HACCP) and Good Hygiene Applications
at all stages of the food production chain, to provide tracebility of food and effect auditing
by establishing a control system based on risk assessment; to follow and evaluate results
coming from provinces by preparing annual auditing program; to arrange Food
Safety/Health Certificate after making necessary examinations, to assign, direct and
coordinate affiliated provincial organizations to take necessary measures for export
products rejected, to plan, coordinate studies on additives, pesticide traces and
contaminants and assign provincial organizations to carry out these studies, to take
required measures providing technical and scientific support at emergency states relating
to food safety and to provide implementation of these measures by provincial
organizations without any delay; to prepare and implement projects on nutrition, to assist
and follow the preparation of development plans and implementation plans.
(kkgm.gov.tr).
The regulation on Good Agriculture Practices
This regulation was put into effect after publishing the Official Gazete No: 25577 of
08.09.2004. The regulation has been prepared to prevent agricultural production from
harming the environment, human and animal health, to protect natural resources and
provide tracebility and food safety for agricultural products. Every kind of control and
certification implemented for fresh vegetable and fruit production activity will be made by
institutions authorized by the Ministry of Agriculture and Rural Affairs.
(www.tarim.gov.tr).
Standards
The tomato standard presented to market fresh tomatoes is the TOMATO TS-794
standard of TSE (Turkish Standards Institute). The defininiton of that standard tomato
depends on the classification and characteristics, sampling, examinations and supply to
market. According to the Decree Law on “Arrangement of Fresh Vegetable and Fruit
Trade and Wholesale Markets” standards regarding goods subject to wholesale trade and
treated in wholesale markets may be put into effect necessarily within the context of
related legislation by taking the view of the Ministry of Industry. Additionally the Tomato
TS-794 standard is a mandatory stardard implemented in export according to the
declaration on Standardization at Foreign Trade No:2004/28.
Standards related to tomato sauce are the TS 1466 Tomato Sauce Standard of TSE for
domestic production and the TS 11600 standard relating to the General Assembly of
Tomato Sauce Factories.
SECTORAL ANALYSIS: Dairy, Tomato, Cereal, Poultry AERI
73
Tomato exports of Turkey is highly seasonal and generally takes place between February and
June (see Chart 10). Over the year export reaches the lowest level in July when production in
open field is bottoms out. Exports are low between July and November and show an incresing
tendency in the months onwards to reach the highest level between May-June.
Next to demand, trade is directed by applying rules on quality and food safety standards. 11
private organizations have been authorized to control and certify products according to the
arrangements regarding good agriculture practices which importance is continuously
increasing. Certification related to GAP has started by EUREGAP and the number of
producers having EUREPGAP certification reached 3,222 in 2006. As the majority of small
holdings and producers does not show enough awareness of GAP requirements there are
important duties to be done by public institutions and main retail organizations.
(www.tarim.gov.tr).
Main regulations in Turkey are the decree law on Arrangement of Fresh Vegetable and Fruit
Trade and Wholesale Markets and the law No: 5652 making modifications to that decree.
TSE (Turkish Standards Institute), KKGM (General Directorate of Protection and Control)
and Undersecretariat of Foreign Trade are related institutions for standards and their
implementations.
SECTORAL ANALYSIS: Dairy, Tomato, Cereal, Poultry AERI
74
Box 6: Provincial Control Laboratories accredited by TÜRKAK (Turkish
Accreditation Authority),
Ankara Provincial Control Laboratory,
Ġzmir Provincial Control Laboratory,
Ġstanbul Provincial Control Laboratory,
Mersin Provincial Control Laboratory,
Samsun Provincial Control Laboratory,
Ordu Provincial Control Laboratory,
Antalya Provincial Control Laboratory,
Giresun Provincial Control Laboratory,
Konya Provincial Control Laboratory,
Gaziantep Provincial Control Laboratory,
Trabzon Provincial Control Laboratory,
Tekirdağ Provincial Control Laboratory,
Kocaeli Provincial Control Laboratory,
Adana Provincial Control Laboratory,
Bursa Central Food Control and Research Institute.
Out of these provincial laboratories, accreditation transactions of Bolu, Kayseri, Hatay
and Denizli provincial laboratories continue.
Besides, 37 private food control laboratories taking permit from Ministry of Agriculture
and Rural Affairs display activity.
Audits at every stage of the food chain are executed based on the annual audit and
monitoring program prepared by the Ministry on the basis of product and its risk in
addition to routine food audit programs performed at provincial level by 81 Provincial
directorates according to the law on adoption by changing the decree law on Production,
Consumption and Control of Foods No: 5179
For this purpose, the Audit and Monitoring Program on the basis of risk for 27 different
products was implemented in 2007. 15,921 samples were analyzed for pea, pepper, wheat,
stfreshberry, tomato, bread, apple, plum, grapefruit, carrot, cucumber, pumpkin, cauli,
onion, fresh bean, melon, apricot, cherry, lemon, mandarin, lettuce, banan, potato,
aubergine, rice, orange, orange juice and grape. A negative result was taken for 1.7% on
Pesticide Residues.
Controls made for fresh vegetable and fruit among food controls increased from 0.006%
to 3.8 % between 2002-2007. The control number for fresh vegetable and fruit being 254
in 2002 became 3489 in 2007. Control rates for processed vegetable and fruit increased
from 4% to 6% in the same years too. (www.kkgm.gov.tr).
SECTORAL ANALYSIS: Dairy, Tomato, Cereal, Poultry AERI
75
6. COMPETITIVE ANALYSIS
6.1 Cultivation Area and Average Holding Size
The 2007 cultivation area under tomatoes in Turkey is around 184,000 ha.. In Italy and Spain,
being important producer countries in the EU, the area is 118,000 ha. and 56,000 ha.
respectively (www.lfl.bayern.de). The cultivation area of Turkey is equal to 64% of the total
cultivation area under tomatoes of the 7 most important tomato producing EU countries. The
average size of an agricultural holding in Turkey is 6 ha., according to the 2001 agricultural
census. Holdings growing tomatoes have an average land area of 0.72 ha. Tomato is grown at
around 9 % (282,690) of 3 million agriculture holdings.
There are 556,700 holdings growing vegetable, melon/water melon and berries in EU-15,
according to a 2003 agricultural structure questionnaire. These holdings produce on around
1.3 million ha.. The average size of the holdings is around 2.4 ha. Most of these holdings can
be found in Italy (31%), Spain (30%() and Greece (11%). Main vegetable producers in the EU
are Italy, Spain, and France.
All tomato production in the Netherlands is cultivated under glass. The Netherlands is one of
the major tomato producing countries in the EU. Although the number of tomato producing
holdings fell to 489 from 937 in 1995, production increases were realized over the same
period (Productschap Tuinbouw, 2006).
6.2 Average Yield of Tomato Production
With a share of 28% tomato holds the first place among all vegetables produced in the EU.
Approximately 60% of harvested tomato is used for processing purposes (lfl, 2006), while in
Turkey this share is about one third. Italy is the most important tomato producing country in
EU, producing 6-7 million ton in recent years (against 10 million in Turkey). Annual
consumption per capita in Italy is around 66 kg. Average consumption per capita for EU is
around 29 kg (TKB, 2006), compared to 72 kg/capita in Turkey.
.

SECTORAL ANALYSIS: Dairy, Tomato, Cereal, Poultry AERI
76
Tomato production and yields in the EU and Turkey are presented in Table 4. Turkey
accounts for more than half of the total tomato production of the EU27. But Turkish yield per
ha is about 10% lower than the EU25 average. Production technology is also important and
the higher yields obtained from hydroponic cultivation techniques compared to conventional
production methods play a significant role in explaining differences in yields.
Approximately 15 % of tomato production is lost during harvest. These losses are between 4-
10% in the major producing countries of the EU (table 4).
6.3 Tomato Prices
Prices of fresh vegetables may fluctuate heavily. Fluctuations in supply and product
characteristics such as its easy degradation and perishability are major causes of price
variability. Therefore, it is remarkable that the difference between maximum and minimum
tomato price paid to the farmer has decrease since 2001 (see Chart 11): the difference between
maximum and minimum prices decreased from around 0.20 $/kg in the second half of the
1990s to less than 0.10 $/kg in the years up to 2007. The 2008 observations, however, indicate
again an increase of the tomato price fluctuations as illustrated by a widening gap between the
maximum and minimum prices during the year.
Table 4: Production and Productivity of Tomato in EU and Turkey
Countries
Production (1000 ton) Yield (ton/ha) Loss (%)
2003 2004 2005 2006 2007 2004 2005 2006 2007
EU25 17.332 17.665 15.524 15.075 55,8 60,1 59,8 61,2 -
EU27 18.900 18.418 16.572 15.764 49,5 53,3 52,4 52,4 -
Spain 4.383 4.810 3.679 3.615 62,7 66,5 64,2 65,0 9,1
Italy 7.683 7.187 6.351 6.025 52,9 51,8 51,9 50,9 3,8
Portugal 1.201 1.085 983 1.000 85,6 79,3 75,5 80,0 10,3
Greece 2.030 1.707 1.568 1.450 51,8 47,9 46,7 54,7 10,1
Turkey 9.440 10.050 9.855 9.945 46,1 49,9 50,8 54,1 15,0
Turkey (%) 49,9 54,6 59,5 63,1 93,1 93,6 96,9 103,2 - Source:tuik.gov.tr, fao.org.tr

SECTORAL ANALYSIS: Dairy, Tomato, Cereal, Poultry AERI
77
As can be read from chart 12 the increase in consumer prices for tomatoes has been show
stronger than the increase of the average tomato producer prices from 2001 onwards. The
difference between average producer and consumer prices have gone up from 0.33 $/kg to
0.43 $/kg between 1995 and 2008.
Chart 13 shows that producer prices in Turkey were lower compared to other important
producer countries except for Poland. The highest producer prices were registered in Spain.
Chart 11: Maximum and Minimum Price ($/kg)
-
0,10
0,20
0,30
0,40
0,50
0,60
0,70
0,80
1995 1996 1997 1998 1999 2000 2001 2002 2003 2004 2005 2006 2007 2008
minimum price maximum price
Source: TURKSTAT
Source: TURKSTAT
Chart 12: Average price ($/kg)
-
0,20
0,40
0,60
0,80
1,00
1,20
1995 1996 1997 1998 1999 2000 2001 2002 2003 2004 2005 2006 2007 2008
Producer price Consumer price

SECTORAL ANALYSIS: Dairy, Tomato, Cereal, Poultry AERI
78
Turkey‟s export prices were lower compared to those of other Mediterranean countries, yet
close to those of Greece (Chart 14). Turkey‟s most important export markets are Russia and
Saudi Arabia, while the Mediterranean EU countries exporting mainly to other EU countries.
A Customs Union Agreement between Turkey and EU has been established by the association
council decision no:1/95, yet excluding agricultural products. Many important fresh fruits and
vegetables including tomato are subject to the EU entry price system following the
association council decision No:1/98 expanding the preferential (concessional) regime
between Turkey and EU. While the implementation of the entry price system varies per
product the system is applied to tomato all year around (www.tarim.gov.tr).
Chart 13: Producer price ($/ton)
-
200
400
600
800
1.000
1995 1996 1997 1998 1999 2000 2001 2002 2003 2004 2005 2006
Italy Poland Romania Spain Turkey Greece
Source: TURKSTAT, fao.org
Chart 14: Export Unit Price by Countries ($/ton)
-
500
1.000
1.500
2.000
2.500
1998 1999 2000 2001 2002 2003 2004 2005 2006
Turkey Spain Italy Greece Portugal
Source: Keskin vd. 2005, www.fao.org
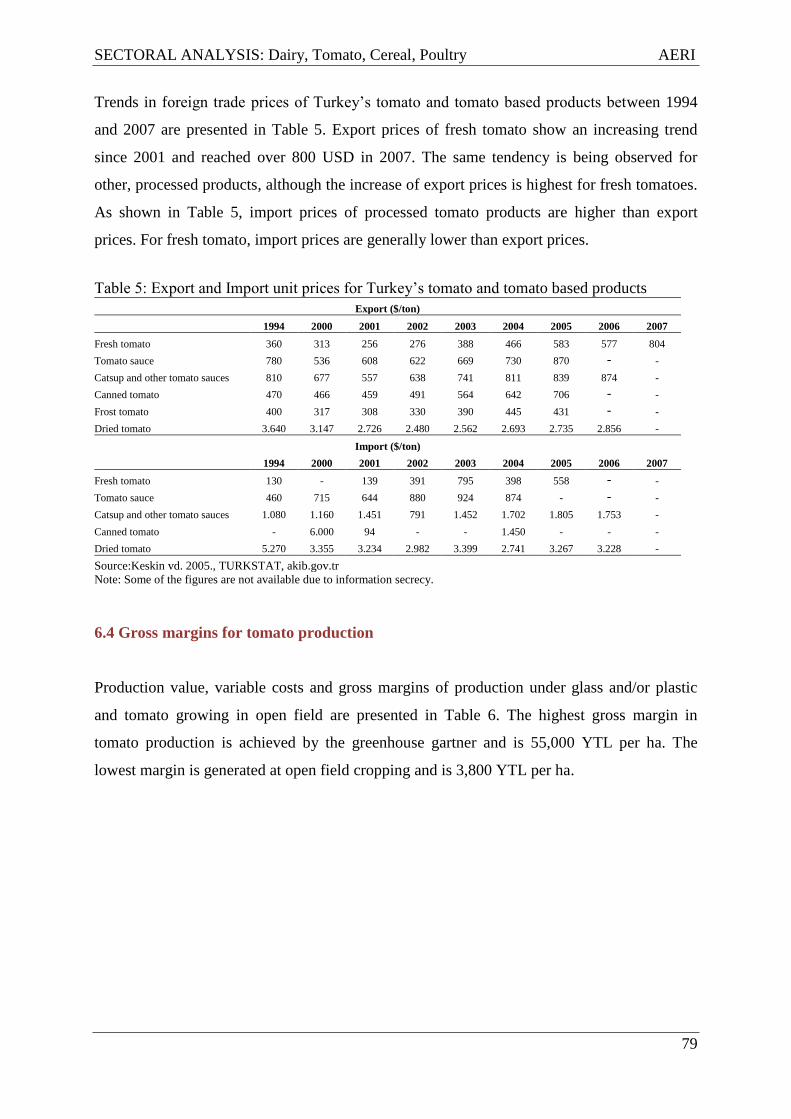
SECTORAL ANALYSIS: Dairy, Tomato, Cereal, Poultry AERI
79
Trends in foreign trade prices of Turkey‟s tomato and tomato based products between 1994
and 2007 are presented in Table 5. Export prices of fresh tomato show an increasing trend
since 2001 and reached over 800 USD in 2007. The same tendency is being observed for
other, processed products, although the increase of export prices is highest for fresh tomatoes.
As shown in Table 5, import prices of processed tomato products are higher than export
prices. For fresh tomato, import prices are generally lower than export prices.
Table 5: Export and Import unit prices for Turkey‟s tomato and tomato based products
Export ($/ton)
1994 2000 2001 2002 2003 2004 2005 2006 2007
Fresh tomato 360 313 256 276 388 466 583 577 804
Tomato sauce 780 536 608 622 669 730 870 - -
Catsup and other tomato sauces 810 677 557 638 741 811 839 874 -
Canned tomato 470 466 459 491 564 642 706 - -
Frost tomato 400 317 308 330 390 445 431 - -
Dried tomato 3.640 3.147 2.726 2.480 2.562 2.693 2.735 2.856 -
Import ($/ton)
1994 2000 2001 2002 2003 2004 2005 2006 2007
Fresh tomato 130 - 139 391 795 398 558 - -
Tomato sauce 460 715 644 880 924 874 - - -
Catsup and other tomato sauces 1.080 1.160 1.451 791 1.452 1.702 1.805 1.753 -
Canned tomato - 6.000 94 - - 1.450 - - -
Dried tomato 5.270 3.355 3.234 2.982 3.399 2.741 3.267 3.228 -
Source:Keskin vd. 2005., TURKSTAT, akib.gov.tr
Note: Some of the figures are not available due to information secrecy.
6.4 Gross margins for tomato production
Production value, variable costs and gross margins of production under glass and/or plastic
and tomato growing in open field are presented in Table 6. The highest gross margin in
tomato production is achieved by the greenhouse gartner and is 55,000 YTL per ha. The
lowest margin is generated at open field cropping and is 3,800 YTL per ha.
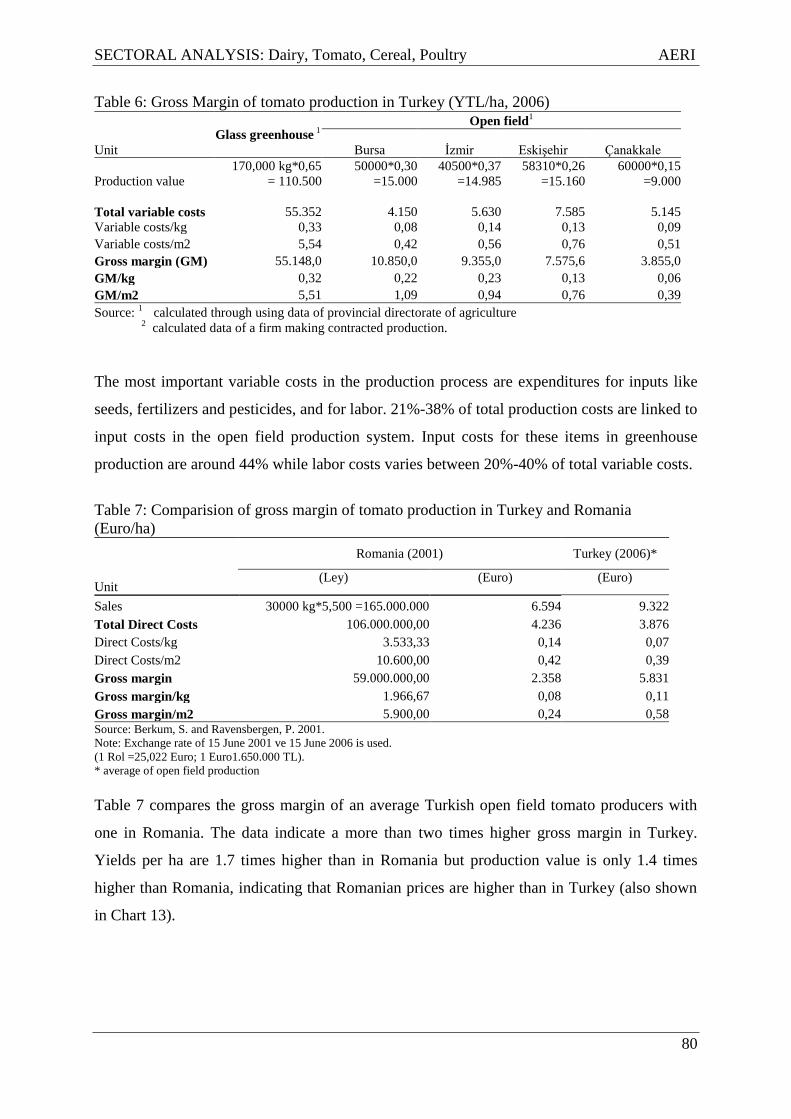
SECTORAL ANALYSIS: Dairy, Tomato, Cereal, Poultry AERI
80
Table 6: Gross Margin of tomato production in Turkey (YTL/ha, 2006)
Unit
Glass greenhouse 1
Open field1
Bursa Ġzmir EskiĢehir Çanakkale
Production value
170,000 kg*0,65
= 110.500
50000*0,30
=15.000
40500*0,37
=14.985
58310*0,26
=15.160
60000*0,15
=9.000
Total variable costs
55.352 4.150 5.630 7.585 5.145
Variable costs/kg 0,33 0,08 0,14 0,13 0,09
Variable costs/m2 5,54 0,42 0,56 0,76 0,51
Gross margin (GM) 55.148,0 10.850,0 9.355,0 7.575,6 3.855,0
GM/kg 0,32 0,22 0,23 0,13 0,06
GM/m2 5,51 1,09 0,94 0,76 0,39
Source: 1
calculated through using data of provincial directorate of agriculture
2 calculated data of a firm making contracted production.
The most important variable costs in the production process are expenditures for inputs like
seeds, fertilizers and pesticides, and for labor. 21%-38% of total production costs are linked to
input costs in the open field production system. Input costs for these items in greenhouse
production are around 44% while labor costs varies between 20%-40% of total variable costs.
Table 7: Comparision of gross margin of tomato production in Turkey and Romania
(Euro/ha)
Unit
Romania (2001) Turkey (2006)*
(Ley) (Euro) (Euro)
Sales 30000 kg*5,500 =165.000.000 6.594 9.322
Total Direct Costs 106.000.000,00 4.236 3.876
Direct Costs/kg 3.533,33 0,14 0,07
Direct Costs/m2 10.600,00 0,42 0,39
Gross margin 59.000.000,00 2.358 5.831
Gross margin/kg 1.966,67 0,08 0,11
Gross margin/m2 5.900,00 0,24 0,58 Source: Berkum, S. and Ravensbergen, P. 2001.
Note: Exchange rate of 15 June 2001 ve 15 June 2006 is used.
(1 Rol =25,022 Euro; 1 Euro1.650.000 TL).
* average of open field production
Table 7 compares the gross margin of an average Turkish open field tomato producers with
one in Romania. The data indicate a more than two times higher gross margin in Turkey.
Yields per ha are 1.7 times higher than in Romania but production value is only 1.4 times
higher than Romania, indicating that Romanian prices are higher than in Turkey (also shown
in Chart 13).
SECTORAL ANALYSIS: Dairy, Tomato, Cereal, Poultry AERI
81
7. SWOT ANALYSIS
Developments in production, consumption and competiveness are determined by external
influences as well as internal dynamics. Today it is necessary to direct production to demand
and to take into account especially the EU internal market rules and international agreements.
Therefore, it is essential for the Turkey‟s tomato sector to be aware of its strong and weak
sides and the threats caused by external influences and transforming them into opportunities.
Major structural problems are the sector‟s small-scale production structure, the inadequacy of
farmers organization especially in relation to the marketing of their produce, the lack of
storage facilities causing high production lossess, and the slow improvements at farm level to
comply with requirements of good agriculture practices and in the supply chain to comply
with internationally acceopted standards of quality and food safety.

SECTORAL ANALYSIS: Dairy, Tomato, Cereal, Poultry AERI
82
Strenghts and Weaknesses:
Strengths Weaknesses P
rod
uct
ion
Suitable natural conditions for tomato
growing and the fact that tomato can be
grown in every region
Structural problems
The low productivity in
comparision with EU countries
Small and fragmented land
structure and small holding size
Big production losses from producer to
consumer
A production made as per natural
condition at great level and its
susceptibility to seasonal changes
Lack of a definite supporting policy
Tra
de Natural conditions provide possibility
for more production
Being easily degradable product
Complexity of marketing structure
(long marketing chain and activity of
many actors)
Inefficiency of producers in marketing
channel (inefficient study of producer
unions and cooperatives)
Need for more progress on tracebility
and standards
Lack of storage units
Pro
cess
ing I
nd
ust
ry modern facilities and production
oriented at export.
Low capacity usage rate
Shortness of processing period because
of difficulties in fresh material supply
Increased demand of industry type of
tomato sauce
Difficulties experienced in suitable
amount and quality product during
processing period
Production increase in various
processed products as a response to
increased foreign demand
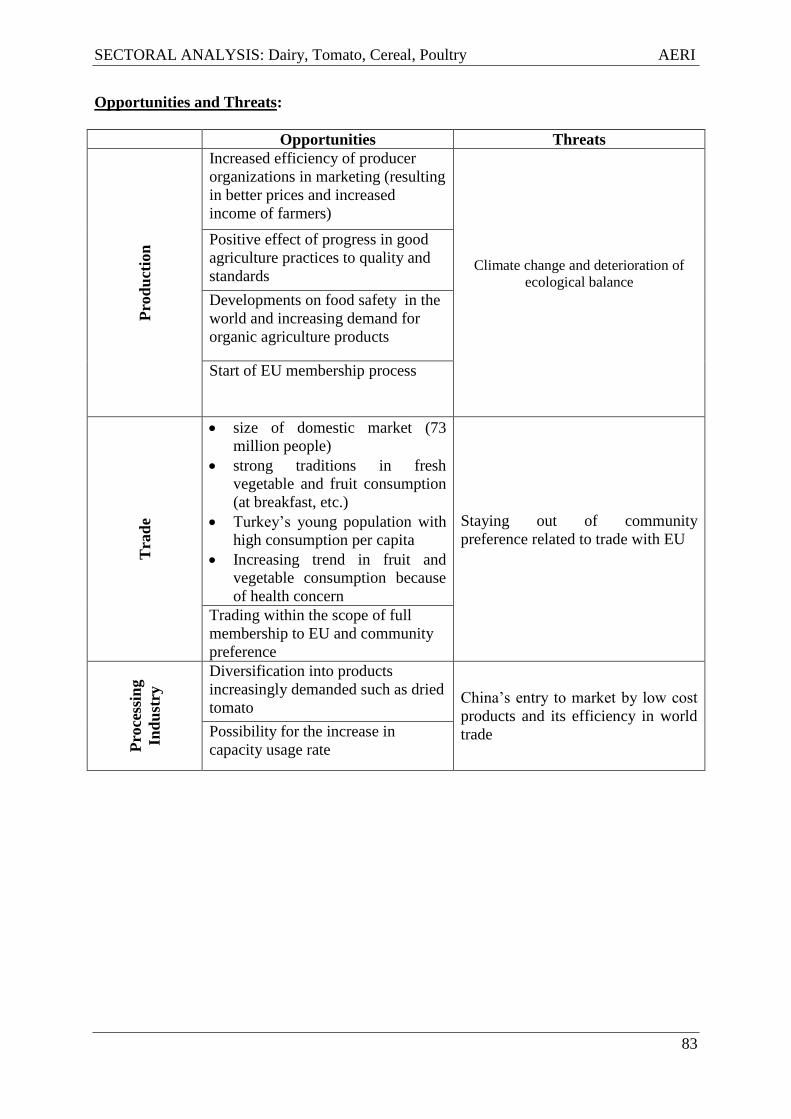
SECTORAL ANALYSIS: Dairy, Tomato, Cereal, Poultry AERI
83
Opportunities and Threats:
Opportunities Threats P
rod
uct
ion
Increased efficiency of producer
organizations in marketing (resulting
in better prices and increased
income of farmers)
Climate change and deterioration of
ecological balance
Positive effect of progress in good
agriculture practices to quality and
standards
Developments on food safety in the
world and increasing demand for
organic agriculture products
Start of EU membership process
Tra
de
size of domestic market (73
million people)
strong traditions in fresh
vegetable and fruit consumption
(at breakfast, etc.)
Turkey‟s young population with
high consumption per capita
Increasing trend in fruit and
vegetable consumption because
of health concern
Staying out of community
preference related to trade with EU
Trading within the scope of full
membership to EU and community
preference
Pro
cess
ing
Ind
ust
ry
Diversification into products
increasingly demanded such as dried
tomato China‟s entry to market by low cost
products and its efficiency in world
trade Possibility for the increase in
capacity usage rate

SECTORAL ANALYSIS: Dairy, Tomato, Cereal, Poultry AERI
84
8. PRIORITY POLICY OBJECTIVES
Main problems of the agriculture sector stem from an inadequate economic organization of
the supply chain from producer up to the consumer. Both Agricultural Cooperatives with their
long historical background and Producer Unions based on the Law No: 5200 in 2004 have not
developed satisfactorily. Nevertheless, small size agriculture holdings are prevalent in Turkey
using traditional technology while their capital base is insufficient to modernise, to increase
their scale of production and to increase labor and land productivity. In the vegetable
subsector, with its perishible and therefore easily degradable products, an efficient
organization of the marketing of the produce is very important, to produce and sell quality
products for (to the farmers) profitable yet to the consumers reasonable prices..
Therefore, providing an organization of producers which removes drawbacks of the small-
scale agriculture holdings and maintain the economic sustainability of holdings should be a
priority objective of the agricultural support policy. By establishing effectively and
efficiently operating farmers organisations the following matters would be possible (see also
the Target Tree below designed after a brainstorm session on 1) identifying the main causes
and effects of a problem [Problem Tree] and 2) identifying main factors/aspects to would
contribute to solving that problem):
Supply of inputs from reasonable price
Decrease of production costs
Increase of opportunities to get credit
Smoothly align with quality and food safety standards
Increase in competitiveness
Enhance producers‟ options for storing, packaging, processing and refrigirated
transport facilities
Increased efficiency of producers in the marketing channel
Increase in producer welfare
Besides, contributions described at producer level will lead to increase in production value
and export incomes at macro level too.
The tomato yield per hectare is higher than the EU27-average but harvest losses are relatively
high. Annual losses in tomato production of Turkey are equal to the volume used for
processing tomato sauce. Lack of storage facilities, the length of the marketing channel and
lack of transport facilities are factors causing these losses. This leads to a suboptimal

SECTORAL ANALYSIS: Dairy, Tomato, Cereal, Poultry AERI
85
exploitation of market opportunities both in the domestic and in the export market. Therefore,
to facilitate the sector‟s activities to decrease harvest losses would be another priority
objective of government policies to enhance the sector‟s competitiveness.

SECTORAL ANALYSIS: Dairy, Tomato, Cereal, Poultry AERI
86
Low education level Inefficiency of
extension studies
lack of successful
models
Lack of awareness,
not sensing
importance of
small farmers
Lack of leadership
Inactivities of
women for
works at the
out of holding
Perception of a different
image (political interest, etc.)
Lack of
confidency
MAIN PROBLEM: INADEQUACY IN PRODUCER ORGANIZATION
EF
FE
CT
S
CA
US
ES
Weak
communication
Inadequate
publicizing and
information
PROBLEM TREE :
INADEQUACY OF PRODUCER IN ECONOMICAL ORGANIZATION
Inadequate
finance
Inadequacies in
transport and storage
facilities
Losses are
increasing
Inadequate
information on
agricultural
and
technological
developments
and using them
(GAP,
accountability,
inaccurate
usage of
fertilizers,
pesticides etc)
Consultancy service
are not taken
Quality
decreases
Low
prices
increasing
costs
Low profit
margin
High input costs
Export
possibility is
decreasing
Solely marketing facilities of
farmers are decreasing
increase in
the number of
middlemen
producer
income is
decreasing

SECTORAL ANALYSIS: Dairy, Tomato, Cereal, Poultry AERI
87
MAIN OBJECTIVE: PROVIDING OF PRODUCER ORGANIZATION
RE
SU
LT
S
FA
CT
OR
S TARGET TREE :
PROVIDING ECONOMICAL ORGANIZATION OF PRODUCERS
Urging of organization
Eficient training and
extension studies
Active
participation of
women to
activities
Technical and kegal support,
consultancy services
Awarding successful
models
Providing financial
support in the beginning
maintenance of
organization awareness
Strong financial structure
Establishment of
storage, transport,
packing and processing
facilities
Easiness of GAP,
tracebility and
alignment with EU
Decrease in
losses
increase in
competitiveness
increase in
quality and
standards
increase in export
possibility
High price
increase in producer income
Decrease in
costs
Efficiency in
marketing
Supply of
inputs from
fair prices
Decreasing
intermediaries
Market based
production

SECTORAL ANALYSIS: Dairy, Tomato, Cereal, Poultry AERI
88
REFERENCES
TZOB, 2007. Zirai ve Ġktisadi Rapor 2003–2006, TZOB Yayınları, Yayın No: 265, Ankara.
TKB, 2006. Belirli Tarım Ürünleri Ġçin Sektör Analizi Raporlarının Hazırlanması (Meyve ve
Sebze, Et), EuropeAid Çerçeve SözleĢme LOT 1. Kırsal Kalkınma ve Gıda Güvenliği Talep
No: TURKEY- Altun/sapard/Tr 0406.01/FWC/022, Taslak Nihai Rapor, Türkiye Eylül 2006.
TKB, 2006a. Ortak Piyasa Düzenleri Alt ÇalıĢma Grup Raporları, YaĢ Meyve ve Sebze Alt
ÇalıĢma Grubu, Tarım ve KöyiĢleri Bakanlığı Strateji GeliĢtirme BaĢkanlığı, Cilt 3, s.78-128.
Berkum, S.,Ravensbergen, P. 2001. Fruit and Vegetables Sector Analysis, page 149, Ministry
of Agriculture, Forest; Water and Environment,Bucharest, 2003.
DPT,2008. Tarım Stratejisi 2006-2010, www.dpt.gov.tr (26.07.008).
Koç, A. 2006.Türkiye‟de Gıda Perakende Sektöründe DeğiĢim Süreci ve YaĢ Meyve Sebze
Sektörü, 23 Kasım 2006, Antalya.
Koç, D., 2003. Ġhracatta Pratik Bilgiler- YaĢ Meyve Sebze Sektörü- , Ġgeme Yayınları, 2003.
Sarısaçlı, Ġ.E., 2006. Salça, igeme.gov.tr.
Keskin, G., Çakaryıldırım, N., 2005. Türkiye‟nin Sebze Üretimi ve DıĢ Ticareti, TEAE BakıĢ,
Sayı 8, Nüsha 8, Aralık- 2005, Ankara.
Keskin, G., Çakaryıldırım, N., Dölekoğlu, C., 2005. Domates ve Domates Salçası Durum -
Tahmin :2005/2006, TEAE Yayın no: 140, Ankara.
Keskin, G., Gül, U., 2004. Domates, TEAE BakıĢ, Sayı 5, Nüsha 13, Nisan- 2004, Ankara.
Keskin, G., Çakaryıldırım, N., 2003. Örtüaltı Sebze YetiĢtiriciliği, TEAE BakıĢ, Sayı 4,
Nüsha 8, Eylül- 2003, Ankara.
Productschap Tuinbouw, 2006 (www.tuinbouw.nl).
Rother, B., 2003. Qualitaetsmanagement- und Qualitaetsicherungssysteme in der Land-und
Ernaehrungswirtschaft, Bayerische Landesanstalt für Landwirtscahft, Institut Für
Ernaehrungswirtschaft und Markt, München
(www.lfl.bayern.de/iem/qualitaetssicherung/06203/linkurl_0_17.pdf)
Sayın, C., Mencet, M.N., TaĢçıoğlu, Y., 2004. Avrupa Birliği‟nde EUREPGAP Uygulamaları
ve YaĢ Meyve ve Sebze Ġhracatımıza Olası Etkileri, Türkiye VI. Tarım Ekonomisi Kongresi
16-18 Eylül 2004, Tokat.
Tüzel, Y., Gül, A., DaĢgan, H.Y., Özgür, M., Özçelik, N., Boyacı, H.F., Ersoy, A., 2005.
Örtüaltı YetiĢtiriciliğinde GeliĢmeler, Türkiye Ziraat Mühendisliği VI. Teknik Kongresi,
Bildiriler, Cilt; 551-563, 3-7 Ocak, 2005, Ankara.
www.lfl.bayern.de
www.tuik.gov.tr
www.fao.org
www.soel.de
www.kkgm.gov.tr
www.fas.usda.gov
www.aib.gov.tr

SECTORAL ANALYSIS: Dairy, Tomato, Cereal, Poultry AERI
89
Turkish Cereal Sector Analysis
Hüsnü EGE Deniz DÖNMEZ Neslihan YILMAZ John BELT
1. OVERVIEW of the TURKISH CEREAL SECTOR
1.1. Sector Definition
The grain sector in Turkey is a large sector: almost seventy percent of all farms in Turkey
produce grain. The sector involves input supply, production, marketing and processing of
wheat, barley, maize, paddy rice, oat and millet.
1.2. Production Value
Grain production contributes with 21% to total crop production value and 12% of total
agricultural production value (figures for 2006). Although the share of grain production value
in crop production and total agricultural production value gradually increased in the years up
to 2004, the share declined somewhat since then (see Table 1).
Table 1. Total Agricultural Production Value and Percentages of Cereals
Year
Total
Agricultural
Production
Value
(million TL)
Total Crop
Production
Value (million
TL)
Total Field
Crops Value
(million TL)
Total Cereals
production
Value (million
TL)
Share of Cereals
in Total Crop
Production
Value (%)
Share of
Cereals in
Total
Agricultural
Production
Value (%)
2000 26.724 14.920 6.601 3.093 21 12
2001 34.389 20.017 8.903 4.386 22 13
2002 52.135 31.768 14.405 7.029 22 13
2003 68.393 40.706 18.042 9.463 23 14
2004 79.649 45.680 21.474 11.740 26 15
2005 88.365 50.940 21.523 12.399 24 14
2006 96.357 54.515 20.077 11.712 21 12 Source: TURKSTAT
Grain is produced on almost 72% of the total planted area in Turkey. Wheat is the most
important crop with a 67% share of total grain production, barley production is second in
importance with 26% and maize production follows with 4%.

SECTORAL ANALYSIS: Dairy, Tomato, Cereal, Poultry AERI
90
Table 2. Cereal Industry Production Value
2000 2001 2002 2003 2004 2005
Total value added in food industry
(million YTL, real prices of 1998) 6.682.262 6.399.766 6.691.849 7.031.629 7.496.129 7..923.269
Share of Cereals and starch
industry in total value added 2.592.462 2.640.893 2.687.430 2.788.291 2.885.010 2.992.304
Share of Cereals and starch
Industry in total value added (%) 38.8 41.3 40.2 39.7 38.5 37.8 Source: SPO
The share of the grain industry in the total value added of the food industry is high: in the
range of 38-41% between 1999 and 2005. Although there has been a continuous decreasing
trend since 2001, grain products still play an important role in Turkish food industry (See
Table 2).
1.3. Production, Consumption and Trade
1.3.1. Wheat
There has been no significant change in the area under wheat over the last 10 years, ranging
between 9.2 and 9.4 million hectare, yet „only‟ 8.5 million hectare in 2006. During the last 3
years wheat production fluctuated between 19 and 20 million ton. There has been an increase
in wheat yields over the last 5 years: in 2005 wheat yield reached 2.324 ton/ha, an increase of
12% compared to 2002.
Table 3. Wheat Production Area, Yield and Production
1996 1997 1998 1999 2000 2001 2002 2003 2004 2005 2006
Production Area ( 000 ha) 9.350 9.340 9.400 9.380 9.400 9.350 9.300 9.100 9.300 9.250 8.490
Yield (ton/ha) 1.979 1.997 2.234 1.919 2.234 2.032 2.097 2.088 2.258 2.324 2..356
Production ( 000 ton) 18.500 18.650 21.000 18.000 21.000 19.000 19.500 19.000 21.000 21.500 20.010
Source: TURKSTAT
Wheat production predominantly takes place in dry and marginal areas, which may affect
yields negatively. Using certificated wheat seed is one of the most important factors to
increase wheat yield. The yield rise over the last years is a result of the increased use of
certificated seed.

SECTORAL ANALYSIS: Dairy, Tomato, Cereal, Poultry AERI
91
Table 4. Certificated Seed Usage
ind
Estimated
Seed Need
According To
Renewal
Time (Ton) Distributed Amount (Ton)
Average Distribution
Amount In The Last
Three Years (Ton)
Distribution
ratio meeting
need in
2006(%) 2004 2005 2006 2004-2006 (Average)
Wheat 616.667 229.029 173.386 204.526 202.314 33
Barley 243.334 18.499 21.643 25.106 21.749 9
Hybrid Maize 18.000 13.762 18.588 15.103 15.818 100
Paddy Rice 8.500 1.297 1.289 1.722 1.436 17 Source: MARA
Wheat is mainly used for human consumption in Turkey. Beside this, nearly 1 million ton of
low quality wheat is used for livestock feed (table 5).
Table 5. Wheat Supply and Use in Turkey (1000 Ton)
1997/98 1998/99 1999/00 2000/01 2001/02 2002/03 2003/04 2004/05 2005/06 2006/07
SUPPLY
Production 18.650 21.000 18.000 21.000 19.000 19.500 19.000 21.000 21.500 20.010
Net Production 15.484 17.577 15.066 17.577 15.903 16.321 16.815 19.320 19.780 18.409
Imports (1) 1.675 2.002 1.472 500 850 1.505 1.500 527 36 715
Beginning Stocks 3.204 3.205 4.217 2.397 2.465 1.713 1.856 2.702 2.734 2.424
Total Supply 20.363 22.784 20.755 20.474 19.218 19.539 20.171 22.549 22.550 21.548
DISAPPEARANCE
Total Domestic Use 15.627 15.818 16.008 16.309 16.605 16.694 16.764 17.595 17.297 17.502
Food 12.835 13.026 13.220 13.417 13.617 13.820 14.026 17.235 14.447 14.662
Seed 1.692 1.692 1.688 1.692 1.688 1.674 1.638 1.860 1.850 1.840
Feed 1.100 1.100 1.100 1.200 1.300 1.200 1.100 1.500 1.000 1.000
Exports(1) 1.531 2.749 2.350 1.700 900 989 1.030 2.221 2.829 1.306
Total Disappearance 17.158 18.567 18.358 18.009 17.505 17.683 17.794 19.816 20.126 18.808
Total Ending Stocks 3.205 4.217 2.397 2.465 1.713 1.856 2.378 2.734 2.424 2.740
Source: AERI calculations from TURKSTAT, TMO data
(1) Wheat equivalence
In Turkey, wheat import generally takes place when the domestcally produced wheat is of low
volume and/or quality. In addition, imports occur when external prices are lower than
domestic prices. There has been a significant decrease in imports over the last few years
because quality of domestic wheat has improved significantly.
Recently, there has been an increase in the consumption of processed grain products
following increasing population growth. In 2005 annual consumption per capita reached 9.1
kg for rice, 65.2 kg for bread, 6.0 kg for pasta. The highest increase was for pasta
consumption which increased with 54% between 1994 and 2005. In Turkey, bread has the
highest share in total food expenditures.
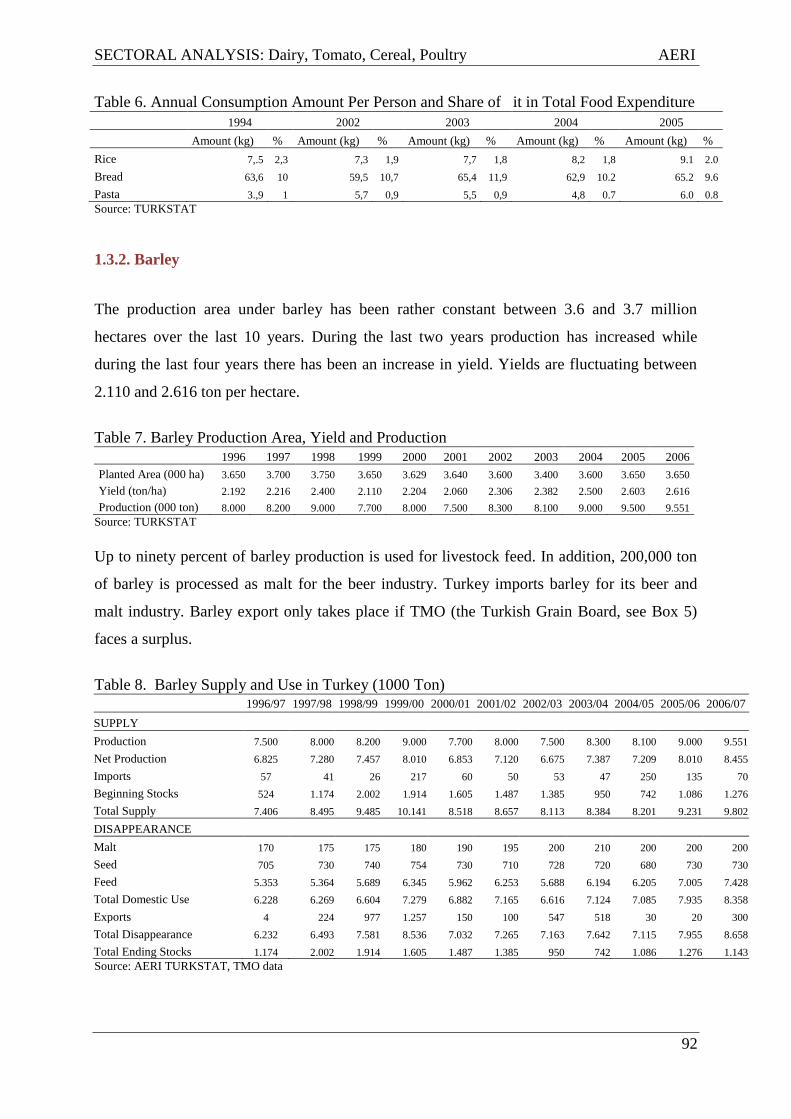
SECTORAL ANALYSIS: Dairy, Tomato, Cereal, Poultry AERI
92
Table 6. Annual Consumption Amount Per Person and Share of it in Total Food Expenditure
1994 2002 2003 2004 2005
Amount (kg) % Amount (kg) % Amount (kg) % Amount (kg) % Amount (kg) %
Rice 7,.5 2,3 7,3 1,9 7,7 1,8 8,2 1,8 9.1 2.0
Bread 63,6 10 59,5 10,7 65,4 11,9 62,9 10.2 65.2 9.6
Pasta 3.,9 1 5,7 0,9 5,5 0,9 4,8 0.7 6.0 0.8
Source: TURKSTAT
1.3.2. Barley
The production area under barley has been rather constant between 3.6 and 3.7 million
hectares over the last 10 years. During the last two years production has increased while
during the last four years there has been an increase in yield. Yields are fluctuating between
2.110 and 2.616 ton per hectare.
Table 7. Barley Production Area, Yield and Production
1996 1997 1998 1999 2000 2001 2002 2003 2004 2005 2006
Planted Area (000 ha) 3.650 3.700 3.750 3.650 3.629 3.640 3.600 3.400 3.600 3.650 3.650
Yield (ton/ha) 2.192 2.216 2.400 2.110 2.204 2.060 2.306 2.382 2.500 2.603 2.616
Production (000 ton) 8.000 8.200 9.000 7.700 8.000 7.500 8.300 8.100 9.000 9.500 9.551
Source: TURKSTAT
Up to ninety percent of barley production is used for livestock feed. In addition, 200,000 ton
of barley is processed as malt for the beer industry. Turkey imports barley for its beer and
malt industry. Barley export only takes place if TMO (the Turkish Grain Board, see Box 5)
faces a surplus.
Table 8. Barley Supply and Use in Turkey (1000 Ton)
1996/97 1997/98 1998/99 1999/00 2000/01 2001/02 2002/03 2003/04 2004/05 2005/06 2006/07
SUPPLY
Production 7.500 8.000 8.200 9.000 7.700 8.000 7.500 8.300 8.100 9.000 9.551
Net Production 6.825 7.280 7.457 8.010 6.853 7.120 6.675 7.387 7.209 8.010 8.455
Imports 57 41 26 217 60 50 53 47 250 135 70
Beginning Stocks 524 1.174 2.002 1.914 1.605 1.487 1.385 950 742 1.086 1.276
Total Supply 7.406 8.495 9.485 10.141 8.518 8.657 8.113 8.384 8.201 9.231 9.802
DISAPPEARANCE
Malt 170 175 175 180 190 195 200 210 200 200 200
Seed 705 730 740 754 730 710 728 720 680 730 730
Feed 5.353 5.364 5.689 6.345 5.962 6.253 5.688 6.194 6.205 7.005 7.428
Total Domestic Use 6.228 6.269 6.604 7.279 6.882 7.165 6.616 7.124 7.085 7.935 8.358
Exports 4 224 977 1.257 150 100 547 518 30 20 300
Total Disappearance 6.232 6.493 7.581 8.536 7.032 7.265 7.163 7.642 7.115 7.955 8.658
Total Ending Stocks 1.174 2.002 1.914 1.605 1.487 1.385 950 742 1.086 1.276 1.143
Source: AERI TURKSTAT, TMO data

SECTORAL ANALYSIS: Dairy, Tomato, Cereal, Poultry AERI
93
1.3.3. Maize
Over the last ten years maize area changed from 550,000 to 536,000 hectares. Because of the
increase in output prices and the increase in the use of hybrid seeds, production and yield
significantly increased. Yields rose from 4 ton/ha in 2001 to 7 ton/ha in 2005 while
production augmented from 2.2 million ton to 4.2 million tonnes.
Table 9. Corn Production Area, Yield and Production (1996-2006)
1996 1997 1998 1999 2000 2001 2002 2003 2004 2005 2006
Planted Area (000 ha) 550 545 550 518 555 550 500 560 545 600 536
Yield (ton/ha) 3.636 3.817 4.182 4.434 4.144 4.000 4.200 5.000 5.505 7.000 7.110
Production (000 ton) 2.000 2.080 2.300 2.297 2.300 2.200 2.100 2.800 3.000 4.200 3.811
Source: TURKSTAT
Around 60% of the maize production is used in the fodder industry, 20% for on-farm
consumption and 20% by the starch industry. Turkey has significantly decreased its maize
imports since 2003/04 when imports were up to 1.4 million ton of maize (tabel 10).
Table 10. Turkey Corn Supply and Use (1000 Ton)
1996/97 1997/98 1998/99 1999/00 2000/01 2001/02 2002/03 2003/04 2004/05 2005/06 2006/07
SUPPLY
Production 1.900 2.000 2.080 2.300 2.300 2.300 2.200 2.100 2.800 3.000 4.200
Net Production 1.805 1.900 1.976 2.185 2.185 2.185 2.090 1.995 2.660 2.850 3.990
Imports 1.106 846 755 981 1.309 672 1.223 1.411 1.165 480 80
Beginning Stocks 96 554 573 397 412 741 116 559 478 670 263
Total Supply 3.007 3.300 3.304 3.563 3.906 3.598 3.429 3.965 4.303 4.000 4.333
DISAPPEARANCE
Seed 13 14 14 14 13 14 4 15 23 27 15
Feed 1.480 1.658 1.799 1.975 2.030 2.200 1.700 2.300 2.450 2.550 2.550
Food 957 1.045 1.087 1.136 1.114 1.260 1.150 1.150 1.150 1.150 1.150
Total Domestic Use 2.450 2.717 2.900 3.125 3.157 3.474 2.854 3.465 3.623 3.727 3.715
Exports 3 10 7 26 8 8 16 22 10 10 150
Total Disappearance 2.453 2.727 2.907 3.151 3.165 3.482 2.870 3.487 3.633 3.737 3.865
Total Ending Stocks 554 573 397 412 741 116 559 478 670 263 468
Source: AERI TURKSTAT, TMO data
1.3.4. Rice
Paddy production has been intensified in some regions such as Marmara. During the last ten
years the rice area has increased from 55,000 in 1995 to 99,000 hectares in 2005. Following
the increase in the planted area, the production volume increased too. Rice production has
grown from 168,000 ton in 1995 to 360,000 tonnes in 2005.
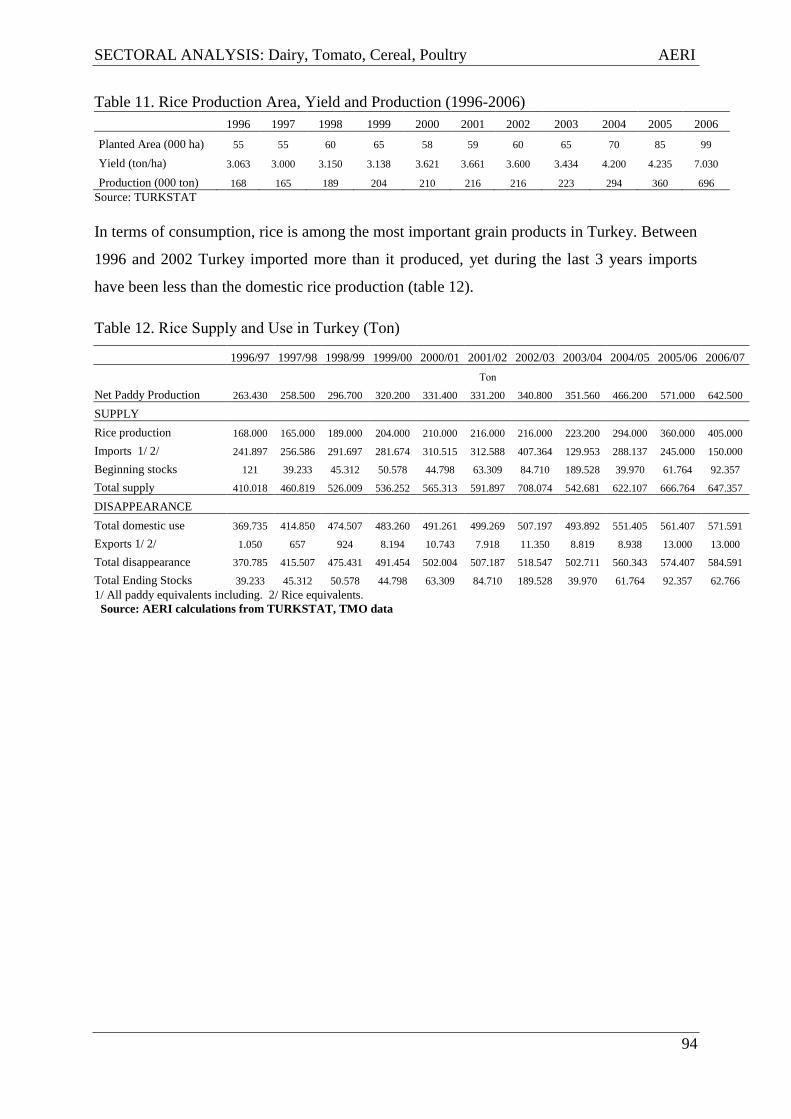
SECTORAL ANALYSIS: Dairy, Tomato, Cereal, Poultry AERI
94
Table 11. Rice Production Area, Yield and Production (1996-2006)
1996 1997 1998 1999 2000 2001 2002 2003 2004 2005 2006
Planted Area (000 ha) 55 55 60 65 58 59 60 65 70 85 99
Yield (ton/ha) 3.063 3.000 3.150 3.138 3.621 3.661 3.600 3.434 4.200 4.235 7.030
Production (000 ton) 168 165 189 204 210 216 216 223 294 360 696
Source: TURKSTAT
In terms of consumption, rice is among the most important grain products in Turkey. Between
1996 and 2002 Turkey imported more than it produced, yet during the last 3 years imports
have been less than the domestic rice production (table 12).
Table 12. Rice Supply and Use in Turkey (Ton)
1/ All paddy equivalents including. 2/ Rice equivalents.
Source: AERI calculations from TURKSTAT, TMO data
1996/97 1997/98 1998/99 1999/00 2000/01 2001/02 2002/03 2003/04 2004/05 2005/06 2006/07
Ton
Net Paddy Production 263.430 258.500 296.700 320.200 331.400 331.200 340.800 351.560 466.200 571.000 642.500
SUPPLY
Rice production 168.000 165.000 189.000 204.000 210.000 216.000 216.000 223.200 294.000 360.000 405.000
Imports 1/ 2/ 241.897 256.586 291.697 281.674 310.515 312.588 407.364 129.953 288.137 245.000 150.000
Beginning stocks 121 39.233 45.312 50.578 44.798 63.309 84.710 189.528 39.970 61.764 92.357
Total supply 410.018 460.819 526.009 536.252 565.313 591.897 708.074 542.681 622.107 666.764 647.357
DISAPPEARANCE
Total domestic use 369.735 414.850 474.507 483.260 491.261 499.269 507.197 493.892 551.405 561.407 571.591
Exports 1/ 2/ 1.050 657 924 8.194 10.743 7.918 11.350 8.819 8.938 13.000 13.000
Total disappearance 370.785 415.507 475.431 491.454 502.004 507.187 518.547 502.711 560.343 574.407 584.591
Total Ending Stocks 39.233 45.312 50.578 44.798 63.309 84.710 189.528 39.970 61.764 92.357 62.766

SECTORAL ANALYSIS: Dairy, Tomato, Cereal, Poultry AERI
95
BOX 1
Cereal Area, Yield and Production for Provinces
Adana Province Corn Area, Yield and Production
1995 1996 1997 1998 1999 2000 2001 2002 2003 2004
Area (ha) 58.658 100.620 78.960 91.502 84.655 84.617 86.595 78.807 105.482 98.948
Yield(kg/ha) 7.249 5.641 6.416 6.568 7.028 6.550 5.546 6.582 7.162 7.301
Production(ton) 425.194 567.600 506.750 600.952 594.987 554.256 480.256 518.728 755.428 722.394
Wheat Area, Yield and Production (2003)
Area(ha) Yield(kg/ha) Production(ton)
Konya 720.440 2.006 1.406.003
Ankara 511.595 2.168 1.108.416
Adana 308.843 3.421 1.056.415
Sanlıurfa 364.483 2.539 925.412
Dıyarbakır 303.183 2.302 697.577
Tekırdag 189.474 3.057 579.235
Barley Area, Yield and Production (2003)
Area (ha) Yield (kg/ha)
Production
(ton)
Konya 361.349 2.256 810.469
Ankara 260.502 2.505 646.607
Sanlıurfa 247.763 2.479 614.149
Afyon 152.098 2.836 431.326
Dıyarbakır 142.952 2.672 381.811
Eskısehır 125.243 2.608 322.926
Maize Area, Yield and Production (2003)
Area (ha) Yield
(kg/ha)
Production
(ton)
Adana 105.482 7.162 755.428
Sakarya 45.164 6.074 274.320
Içel 36.324 7.320 262.678
Osmanıye 27.710 5.646 156.445
Rice Area, Yield and Production (2003)
Area (ha) Yield (kg/ha)
Production
(ton)
Edirne 26 390 3 349 88 392
Samsun 8 172 3 558 29 079
Çorum 6 725 4 231 28 453
Balıkesir 7 082 3 309 23 437
Çanakkale 2 267 4 318 9 790
Sinop 2 695 3 773 10 167
Source: TUĠK

SECTORAL ANALYSIS: Dairy, Tomato, Cereal, Poultry AERI
96
1.4. Structure of Grain Sector
The first stage of the grain sector - the farm level - is characterised by numerous fragmented
areas consisting of small or medium sized land holdings (see also table 13). Most wheat and
barley production takes place in regions with little rainfall. The dysfunctional land registration
system makes it difficult for farmers to obtain credit. Important ınputs are expensive because
of imported raw material and farmers without sufficient income have difficulties to obtain
ınputs.
It is notable that there are a few organized farmer groups which limits the possibilities for
farmers to store their production.
BOX 2. HERITAGE LAW
A law aiming to make changes in soil protection and area usage has been in force since
09.02.2007 following an official newspaper publication.
According article 8 of this law carrying the topic of classifying agricultural areas and
determining an area parcel size, an indicated area size will be accepted as indivisible.
Mentioned indivisible characteristic will be recorded in deed office.
An indicated minimum size will be 2 hectare for peremptory agricultural lands and special
crop lands, 0.5 hectare for sewed agricultural lands, 0.3 hectare for agricultural lands under
cover and 2 hectare for marginal agricultural lands. Agricultural land can not be divided
into smaller parcels than the sizes indicated. However, because of land necessities in
regions which include greenhouses and the special soil and climate conditions needed
crops such as tea, hazelnut and olive planting areas, smaller parcels can occur with the
permission of the ministry. If indivisible size of agricultural area is subject to heritage or to
common possession, the area can not be divided, sold to a third person, delivered or put
into pledge.
By the change in the law, village legal institutions, municipalities, cooperatives and unions
and public institutions have a chance to aggregate land.
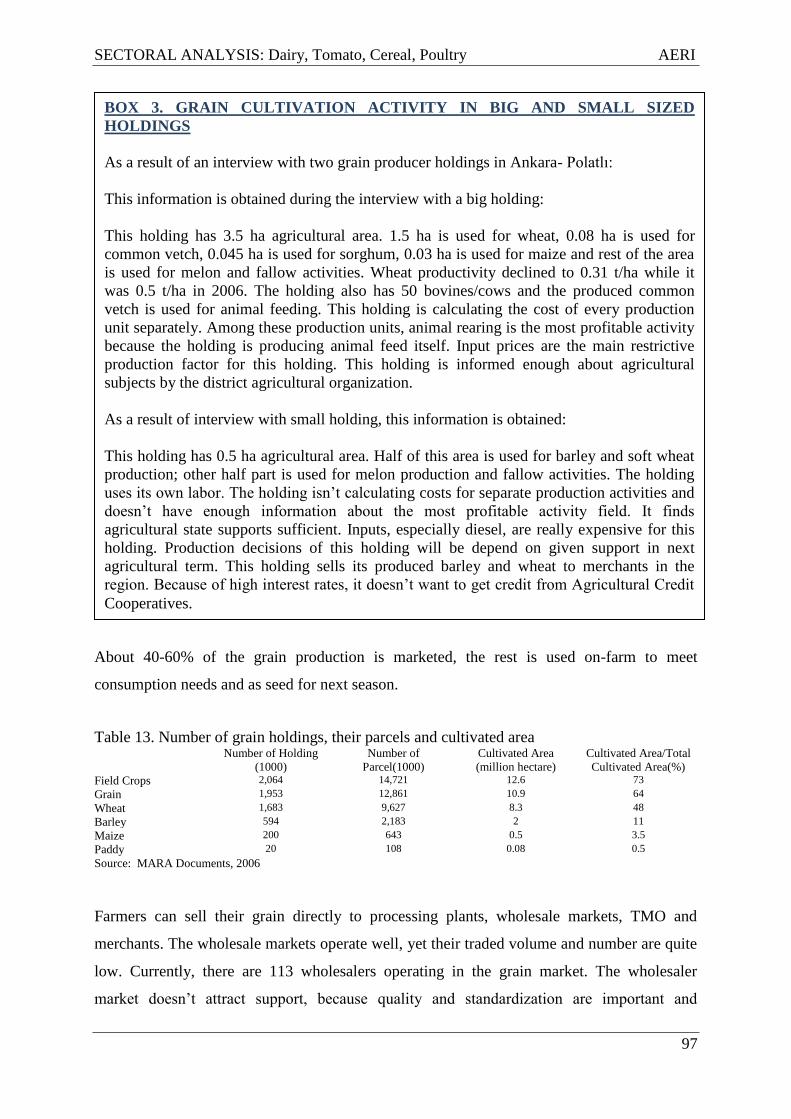
SECTORAL ANALYSIS: Dairy, Tomato, Cereal, Poultry AERI
97
About 40-60% of the grain production is marketed, the rest is used on-farm to meet
consumption needs and as seed for next season.
Table 13. Number of grain holdings, their parcels and cultivated area Number of Holding
(1000)
Number of
Parcel(1000)
Cultivated Area
(million hectare)
Cultivated Area/Total
Cultivated Area(%)
Field Crops 2,064 14,721 12.6 73
Grain 1,953 12,861 10.9 64
Wheat 1,683 9,627 8.3 48
Barley 594 2,183 2 11
Maize 200 643 0.5 3.5
Paddy 20 108 0.08 0.5
Source: MARA Documents, 2006
Farmers can sell their grain directly to processing plants, wholesale markets, TMO and
merchants. The wholesale markets operate well, yet their traded volume and number are quite
low. Currently, there are 113 wholesalers operating in the grain market. The wholesaler
market doesn‟t attract support, because quality and standardization are important and
BOX 3. GRAIN CULTIVATION ACTIVITY IN BIG AND SMALL SIZED
HOLDINGS
As a result of an interview with two grain producer holdings in Ankara- Polatlı:
This information is obtained during the interview with a big holding:
This holding has 3.5 ha agricultural area. 1.5 ha is used for wheat, 0.08 ha is used for
common vetch, 0.045 ha is used for sorghum, 0.03 ha is used for maize and rest of the area
is used for melon and fallow activities. Wheat productivity declined to 0.31 t/ha while it
was 0.5 t/ha in 2006. The holding also has 50 bovines/cows and the produced common
vetch is used for animal feeding. This holding is calculating the cost of every production
unit separately. Among these production units, animal rearing is the most profitable activity
because the holding is producing animal feed itself. Input prices are the main restrictive
production factor for this holding. This holding is informed enough about agricultural
subjects by the district agricultural organization.
As a result of interview with small holding, this information is obtained:
This holding has 0.5 ha agricultural area. Half of this area is used for barley and soft wheat
production; other half part is used for melon production and fallow activities. The holding
uses its own labor. The holding isn‟t calculating costs for separate production activities and
doesn‟t have enough information about the most profitable activity field. It finds
agricultural state supports sufficient. Inputs, especially diesel, are really expensive for this
holding. Production decisions of this holding will be depend on given support in next
agricultural term. This holding sells its produced barley and wheat to merchants in the
region. Because of high interest rates, it doesn‟t want to get credit from Agricultural Credit
Cooperatives.

SECTORAL ANALYSIS: Dairy, Tomato, Cereal, Poultry AERI
98
producers must pay a fee to trade their product in the wholesale market. In addition, there is
no future market which could reduce the farmers‟ risk
Graphic1. Organisation of Barley, Maize, Wheat and Paddy Rice Market Chains
* starch, feed (barley, maize), malt (barley), food (maize, wheat, rice)
** starch-based products, beer
It is estimated that the number of industrial food processors has grown from 25 to 40
thousands and that the grain processing industry represents 65.5% of total number of
companies in the food industries in 2007.
Producer
Trader TMO
Processing Industry *
Export Other processing industry **
Processing Industry Wholesaler
Retailer
Consumer
Only wheat
and barley
Auto consumption
Spot Market

SECTORAL ANALYSIS: Dairy, Tomato, Cereal, Poultry AERI
99
The establised grain processing capacity is sufficient to process home-grown and imported
grain. There is an oligopolistic market structure in the production of starch and beer
considering that four large companies have 96% of the starch market while another four
companies dominate 76% of the beer and malt market (MARA 2006).
Table 14. Number of Grain Processing Industry Holdings
Kind of Plant Plant Number
Flour Plants 1,091
Feed Plants 468
Pasta Plants 24
Boiled and Pounded Wheat Plants 72
Biscuit Plants 22
Semolina Plants 5
Beer Plants 5
Paddy Plants 100
Starch-Glucose Plants 5
Source: DPT
There is an oligopolistic market structure in the agricultural input industry too. This explains,
next to high prices of imported raw material, the high input prices in Turkey. Because of their
low income farmers have limited access to the formal credit system to buy inputs; this
hampers an increase in yields.
Fertiliser consumption data in E.U. countries and Turkey are presented in Table 15.
According to this table, Bulgaria, Romania, Estonia and Latvia use less fertiliser per hectare
than Turkey. Compared to Turkey, Ireland uses seven times more fertiliser per hectare, United
Kingdom five times and Greece two times.
BOX 4. FLOUR PLANT ACTIVITIES
This flour plant operates with 60 tonnes of production capacity a day, although its real
capacity is 250 tonnes of production a day. Wheat is purchased from state agricultural
holdings, merchants and sometimes directly from producers. To obtain qualified wheat
which has not been affected by insects or diseases is the main problem of the plant.
Because qualified wheat is expensive the plant sometimes mixes wheat of less quality
with high quality wheat. Produced flour is sold to bread factories, especially Istanbul
Public Bread Factory. Because of the excessive amount of flour factories operating at the
market (see table 14) and expensive input prices, this wheat flour factory faces decreasing
profits.

SECTORAL ANALYSIS: Dairy, Tomato, Cereal, Poultry AERI
100
Table 15. Chemical Fertilizer Consumption (Ton) (2002)
Source: FAO, TURKSTAT
1.5. Pricing
In Turkey grain prices are determined by market forces: prices are mainly determined by
quality and the balance of supply and demand. Grain trade is dominated by TMO (the Turkish
Grain Board) and wholesalers. Farmers see TMO is as a guaranteed selling place. Next to
TMO, merchants and industry buy grain both from farmers and wholesalers. After 2001 TMO
purchase prices have been equal to domestic price levels. Contractual production activity is
conducted very rarely.
World and domestic grain prices are shown in Table 16. The difference between domestic and
world market prices is determined by the customs tariff. Customs tariffs, as approved by
WTO, are shown in the Table 17.
Total
fertiliser Nitrogenous Phosphate Potash
Production
Area (000ha)
Consumption
per unit area
Bulgaria 165.943 152.127 12.410 1.406 3.331 50
Czech Republic 368.844 289.098 49.146 30.600 2.775 133
Denmark 297.001 201.559 33.000 62.442 2.479 120
Germany 2.594.327 1.787.654 327.000 479.673 11.791 220
Estonia 27.007 16.700 4.015 6.292 613 44
Ireland 587.000 360.000 97.000 130.000 1.177 499
Greece 405.000 253.000 107.000 45.000 2.764 147
Spain 2.159.700 1.070.100 601.300 488.300 12.893 168
France 3.968.000 2.279.000 729.000 960.000 18.318 217
Italy 1.432.642 785.314 372.026 275.302 8.241 174
Cyprus 15.406 8.064 5.685 1.657 87 177
Latvia 50.029 34.316 5.708 10.005 973 51
Lithuania 194.000 115.000 35.000 44.000 1.639 118
Hungary 501.321 365.000 68.000 68.321 4.959 101
Malta 700 300 200 200 9 78
Netherlands 336.000 284.000 52.000 1.011 332
Austria 208.300 118.000 47.000 43.300 1.378 151
Poland 1.511.699 831.660 302.590 377.449 13.038 116
Portugal 207.000 101.000 58.000 48.000 1.589 130
Romania 326.123 239.071 72.996 14.056 9.376 35
Slovenia 69.887 33.338 15.794 20.755 168 416
Slovakia 124.384 88.260 18.526 17.598 1.377 90
Finland 293.000 162.000 52.000 79.000 2.217 132
Sweden 268.000 189.000 37.000 42.000 2.654 101
Uni.Kingdom 1.801.000 1.142.000 283.000 376.000 4.495 401
Turkey 1.743.173 1.195.190 474.417 73.566 23.830 73
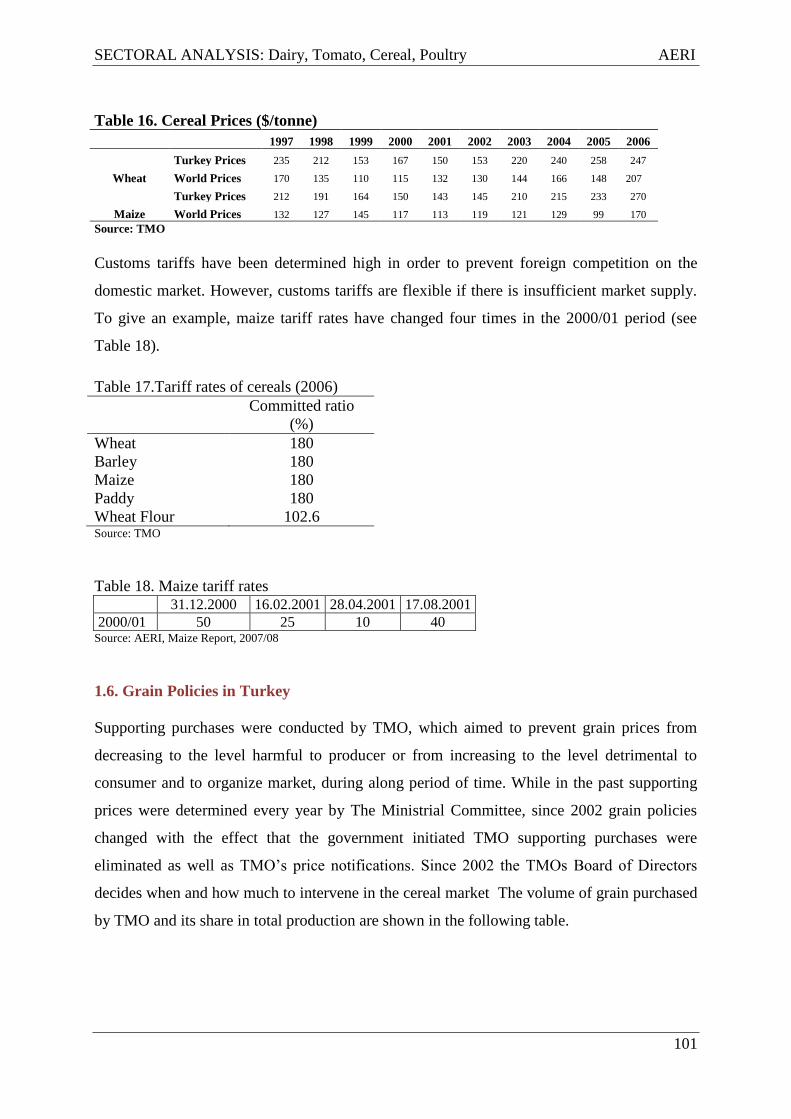
SECTORAL ANALYSIS: Dairy, Tomato, Cereal, Poultry AERI
101
Table 16. Cereal Prices ($/tonne)
1997 1998 1999 2000 2001 2002 2003 2004 2005 2006
Wheat
Turkey Prices 235 212 153 167 150 153 220 240 258 247
World Prices 170 135 110 115 132 130 144 166 148 207
Maize
Turkey Prices 212 191 164 150 143 145 210 215 233 270
World Prices 132 127 145 117 113 119 121 129 99 170
Source: TMO
Customs tariffs have been determined high in order to prevent foreign competition on the
domestic market. However, customs tariffs are flexible if there is insufficient market supply.
To give an example, maize tariff rates have changed four times in the 2000/01 period (see
Table 18).
Table 17.Tariff rates of cereals (2006)
Committed ratio
(%)
Wheat 180
Barley 180
Maize 180
Paddy 180
Wheat Flour 102.6 Source: TMO
Table 18. Maize tariff rates 31.12.2000 16.02.2001 28.04.2001 17.08.2001
2000/01 50 25 10 40 Source: AERI, Maize Report, 2007/08
1.6. Grain Policies in Turkey
Supporting purchases were conducted by TMO, which aimed to prevent grain prices from
decreasing to the level harmful to producer or from increasing to the level detrimental to
consumer and to organize market, during along period of time. While in the past supporting
prices were determined every year by The Ministrial Committee, since 2002 grain policies
changed with the effect that the government initiated TMO supporting purchases were
eliminated as well as TMO‟s price notifications. Since 2002 the TMOs Board of Directors
decides when and how much to intervene in the cereal market The volume of grain purchased
by TMO and its share in total production are shown in the following table.

SECTORAL ANALYSIS: Dairy, Tomato, Cereal, Poultry AERI
102
Table 19. TMO Amounts of Grain Purchases, Share of Production and Purchase Price
Wheat Barley Maize Rice
Year
Purchase
Amount
(Ton)
Share in
Production
(%)
Purchase
Amount
(Ton)
Share in
Production
(%)
Purchase
Amount
(Ton)
Share in
Production
(%)
Purchase
Amount
(Ton)
Share in
Production
(%)
2000 2.959.105 14 508.715 6 28.509 1 40.763
2001 1.459.434 8 951.837 13 ** - 19.079
2002 332.811 2 379.655 5 78.596 4 59.231
2003 544.508 3 27.345 0 381.193 14 130.362
2004 2.023.401 10 3.423 0 474.302 16 14.855
2005 4.171.303 19 796.027 8 660.985 16 11.899
2006 1.456.571 7 724.586 8 0 0 87.212
Source: TMO, **: Only 9 tonnes of maize purchase
As seen in the table, TMO purchases declined from 2000 tot 2003 but realised more purchases
than normal in 2004 and 2005 when production was high.
TMO bought grain from farmers who were recorded in ÇKS (Farmer Registration System) in
2006/07 and from cooperatives in which grain producer farmers were partners. As an
exception, a production licence is enough to sell paddy rice to TMO. However, registration to
ÇKS is a condition to benefit from other governmental supports. So, paddy farmers who have
only paddy production licence can not benefit from those other support means (see table 20
for the supprt instruments).
Additionally, TMO can borrow grain from farmers. In exchange, farmers obtain a receipt
paper. The farmers can have a credit using this paper. In addition to this credit facility,
according to 2006/10506 Ministrial committee decision, TMO has a competence to pay paddy
producers in advance when they lend TMO paddy rice. The advanced amount is determined
within the rules of TMO. In 2006/07 period, 255,548 tonnes of wheat, 5,644 tonnes of paddy
and 24,830 tonnes of barley were lend to TMO. There was no maize lending to TMO during
the period mentioned.
Support to the grain sector included the following measures: Direct Income Payment,
subsidies for diesel and chemical fertiliser, seed support and premium support.
The Direct Income Payments (DGD) measure was used as 10 YTL/dekkar for the first time in
2001. The amount was the same during 2006 and 2007.

SECTORAL ANALYSIS: Dairy, Tomato, Cereal, Poultry AERI
103
For 2007 grain farmers received a support of 2.13 YTL/dekkar for fertiliser and 2.88
YTL/dekkar for diesel.
In 2007 the support for using certified seed was 5 YTL/dekkar for wheat, 8 YTL/dekkar for
paddy and 5 YTL/dekkar for barley whereas there was no support given to certified maize
seed.
In 2006 the premium support was 0.035YTL/kg for wheat, 0.067 YTL/kg for maize,
0.025YTL/kg for barley and 0.06YTL/kg.
Table 20. Grain Supports (YTL/Da)
SUPPORT KIND 2001 2002 2003 2004(1) 2005(2) 2006(3) 2007(4)
Direct Support Income 10 13.5 16 16 10 10 10
Diesel Support - - 3.9 - 2.4 2.88 2.88
Certificated Seed Support - - - - 3 5 5
Chemical Fertilizer
Support - - - - 1.6 2.13 2.13
Energy Support in
Irrigation(Ykr/KWh) - - - - 1.7 1.7 1.7
1- 0.025 YTL/Kg premium support was given for maize.
2- 0,05 YTL/Kg premium support for maize, 0.03 YTL/Kg premium support for wheat and
paddy, 0.02 YTL/Kg premium support for barley, rye and oat were given.
3- 0.035 YTL/Kg. premium support for wheat,0.067 YTL/Kg. premium support for maize,
0.025 YTL/Kg premium support for barley, rye and oat were given in 2006.
4- 0.045 YTL/Kg. premium support for wheat, 0.035 YTL/Kg premium support for barley,
rye and oat were given.
Kaynak: TMO

SECTORAL ANALYSIS: Dairy, Tomato, Cereal, Poultry AERI
104
BOX 5. TMO
Turkish Grain Board is a State Economic Enterprise as related establishment of MARA, which all
its capital belongs to the State and its liability is limited with its capital, having legal personality
and autonomy in its activities. TMO consist of general directorate and regional organizations.
Regional offices are made up from 203 branches. Intervention purchases are made both from
producers and wholesalers. Additionally, TMO stores grain giving receipt to producers at storage
receipt system without taking any payment. Wheat, barley, maize, oat, rye, paddy rice are subject
to TMO intervention purchase. Besides the competence to rent storages, TMO has nearly 4.5
million tonnes storage capacity. TMO storages are near to ports and to the places where grain
production or consumption activity is intensive.
In the Article 4 of the Main Status of Turkish Grain Board, the purpose and the activity subjects
of the enterprise is indicated as following:
“Preventing falling the grain prices in country below the normal level in point of producers view
and preventing its increase abnormally against the consumer public, taking regularization
measures for the market of these products and carrying out the mission to be given by the Decree
of the Council of Ministers when required as related to the pulses and oily seed other than grain,
carrying out the state monopoly imposed on the opium and narcotic substances, selling and
buying these products, providing the required stocks and their protection”.
For fulfillment of the purpose of its establishment, Turkish Grain Board carries out the following
missions; By buying and selling the products, which are included in its activity area, on the prices
to be determined according to their kind, type and places and providing their required stock and
protection, provide stabilization of these products at the market, To purchase from foreign market
the products, which are included in its activity area, and their manufactured items when required,
To carry out every kind of processes for providing rapid sale of the products and their
manufactured items purchased from domestic market at the foreign markets and sell these items
to foreign market when required, To buy the wheat at the prices to be declared according to the
quality groups determined beforehand within the framework of the mission assigned by the
Council of Ministers, To make the protection, drying, cleaning, spraying with chemical substance
and calibration processes of the products included in its activity scope, To make general
storekeeping activities, To run the silos or other storing institutions present and to be
commissioned later, To make the investment, etude, investigation, feasibility, projects,
engineering and advisory services related to the its activity matters and/or have them made, To
establish storage facilities when required to store the products included in its activity matters and
the manufactured items to be obtained from them, To make available the spare parts, vehicle and
machinery necessary for maintenance and repair of the institutions established, establish work
shops for this purpose if required and manufacture or purchase the machinery and equipment
required for them from domestic or foreign markets, To make useful the excess capacity of the
established institutions and present material, machinery and equipment, To monitor, asset the
world grain production activities and prices, make every kind of notification related to the activity
matters To establish firms and cooperatives for every kind of purchase, selling, transportation,
production, storage and protection works as to be based on the related activity matters either in
the country or abroad and join in the partnerships established for this purpose.

SECTORAL ANALYSIS: Dairy, Tomato, Cereal, Poultry AERI
105
BOX 6. LICENCED STORING ACTIVITY
Licensed storing activity has taken a place in trade system of almost all developed countries
especially in USA. In this system, product stock markets, which are conducting spot
procedures, turn into future markets. Because products aren‟t used as guarantee means in
Turkey, products are sold at the term when the prices are low and supply is intensive. The
mentioned situation leads to producer losses. Besides these factors, insufficiency in
laboratories which check quality standarts and in the mentioned standarts of supplied products
affects prices of the products too.
In Turkey, licenced storing system is realized with the help of Industry and Trade Ministry
coordination.
Licenced storing law for agricultural products, published in official journal, has been in force
since 17 February 2005. First and second legislations related to implementation of licensed
storing system completed on 2 August 2006. Aim of this law is determining the basis and
rules which are related to the establishment, operation and control of licenced storing system
to make the trade of agricultural products easier, to establish a common system for storing, to
provide the security and quality protection of the owners‟ products, to provide the
determination of product degree and class by competent authorities, to guarantee the
acceptation of agricultural products by licenced storing place owners without any
discrimination among people, to prepaire product bill which represents ownership of the product and
provides sales, financing and delivery of the product, to improve trade of agricultural products which
have determined standarts.
There is a grain, leguminosae and oilseeds licenced storage regulation aiming to make the trade of
these products easier, to establish a common system for storing of the products, to provide the security
and quality protection of the owners‟ products, to guarantee the acceptation of these agricultural
products by licenced storing place owners without any discrimination among people, to prepaire a
product bill which represents ownership of the products and provides sales, delivery of the
product and can be given as an assurance, to organize the rules, related to the establishment,
operation and control of licenced storing places of grain, leguminosae and oil seeds which
have determined standards.

SECTORAL ANALYSIS: Dairy, Tomato, Cereal, Poultry AERI
106
2. COMPETITION ANALYSIS
2.1. Competition in holding scale
2.1.1. Planted Area
Turkey has reached nearly the limit in utilising its available arable land. On the one hand, it is
difficult to increase the size of wheat and barley area, since it has already extended to
marginal areas. On the other hand, the maize and rice area can only be increased when
conditions for irrigation are favourable and the area is extended at the cost of alternative
crops.
2.1.2. Production and Yield Comparison
Although Turkey has been seen self-sufficient in wheat and barley, it has not produced
enough to reach self-sufficiency for maize and rice. Especially for rice, Turkey continues to
BOX 7. SUMMARY OF E.U GRAIN POLICIES
The EU aricultural budget (FEOGA) finances intervention purchases of the member
countries. The EU intervention prices used to be (much) higher than world prices and
excess supply was exported with the help of export subsidies. The EU was forced to
reform this system following the WTO Uruguay Round. In the 1994 reform of the
Common Agricultural Policy (CAP) the intervention prices were decreased gradually
while the income loss of the producers was compensated by direct payments.
Intervention purchases, storage, external and internal sales are conducted by EU paying
agencies. These agencies buy wheat, durum wheat, barley, maize, sorghum that is
produced in the EU and meet indicated quality and quantity conditions. Purchases are
based on the intervention prices.
Because there are high quality private storage facilities in the EU, intervention agencies
prefer to use private warehouses. The costs related to loading, quality control and
unloading are paid by FEOGA. The warehouses are continuously checked by the
intervention agencies. EU regulations define intervention period, operation of intervention
centres, the products included in intervention operations, minimum quality and quantity
requirements, price scales, rules to be implemented for storage and selling of the
intervention stocks. Grain intervention purchases occur in these periods: 1 August – 30
April (for Italy, Spain, Greece and Portugal), 1 December – 30 June (for Sweden) and 1
November – 31 May for the other member states. Paddy intervention purchases are from 1
April – 31 July.

SECTORAL ANALYSIS: Dairy, Tomato, Cereal, Poultry AERI
107
be dependent on imports. Premium and certificated seed supports have increased maize
production and supported the efforts of providing self-sufficiency in recent years.
Table 21. Cereal Self Sufficiency (%) (2002/03)
Total Wheat Corn (grain) Barley
EU-25 107 109 100 113
EU-15 108 109 95.947 115
Belgium 47 51 30 50
Romania 124* 143* 114* 167*
Bulgaria 135 140 100 186
Czech Republic 106 108 103* 161*
Denmark 105* 106* 0 107*
Germany 129* 148* 80* 128*
Estonia 91* 86* 0 105*
Greece 72* 71* 79* 41*
Spain 72 48 57 93
France 213* 215* 223* 266*
Italy 87* 80* 96 50*
Latvia 107* 127* 0 94*
Lithuania 126* 156* 6* 119*
Luxembourg 94 104* 27* 92*
Hungary 211* 250* 210* 156*
Malta 0 0 0 0
Netherlands 22* 29* 9* 33*
Ireland 83* 73* 45* 106*
Austria 104* 149* 86* 98*
Poland 113* 119* 103* 103*
Portugal 27* 15* 38* 7*
Slovenia 58 68 63 34
Slovakia 126 109 145* 127*
Finland 116 99* 0 105*
Sweden 127* 122* 0 149*
United Kingdom 106* 111* 0 126*
Turkey (2002–03) 105 116 61 104
Turkey (2005–06) 109 114 113 101 Source: Eurostat, AERI Reports
*: 2004 Data
Average wheat and barley yields in Turkey are half as low as those of the EU (see table 22
and 23).
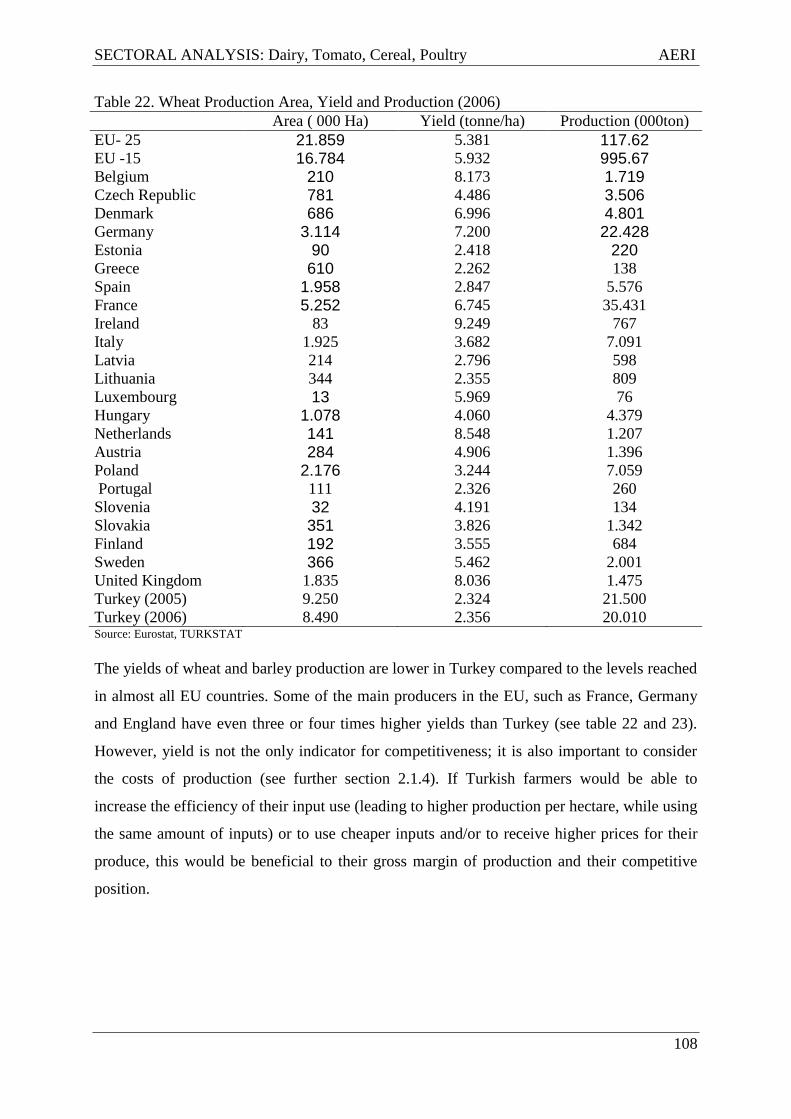
SECTORAL ANALYSIS: Dairy, Tomato, Cereal, Poultry AERI
108
Table 22. Wheat Production Area, Yield and Production (2006)
Area ( 000 Ha) Yield (tonne/ha) Production (000ton)
EU- 25 21.859 5.381 117.62 EU -15 16.784 5.932 995.67 Belgium 210 8.173 1.719 Czech Republic 781 4.486 3.506 Denmark 686 6.996 4.801 Germany 3.114 7.200 22.428 Estonia 90 2.418 220 Greece 610 2.262 138
Spain 1.958 2.847 5.576
France 5.252 6.745 35.431
Ireland 83 9.249 767
Italy 1.925 3.682 7.091
Latvia 214 2.796 598
Lithuania 344 2.355 809
Luxembourg 13 5.969 76
Hungary 1.078 4.060 4.379
Netherlands 141 8.548 1.207
Austria 284 4.906 1.396
Poland 2.176 3.244 7.059
Portugal 111 2.326 260
Slovenia 32 4.191 134
Slovakia 351 3.826 1.342
Finland 192 3.555 684
Sweden 366 5.462 2.001
United Kingdom 1.835 8.036 1.475
Turkey (2005) 9.250 2.324 21.500
Turkey (2006) 8.490 2.356 20.010 Source: Eurostat, TURKSTAT
The yields of wheat and barley production are lower in Turkey compared to the levels reached
in almost all EU countries. Some of the main producers in the EU, such as France, Germany
and England have even three or four times higher yields than Turkey (see table 22 and 23).
However, yield is not the only indicator for competitiveness; it is also important to consider
the costs of production (see further section 2.1.4). If Turkish farmers would be able to
increase the efficiency of their input use (leading to higher production per hectare, while using
the same amount of inputs) or to use cheaper inputs and/or to receive higher prices for their
produce, this would be beneficial to their gross margin of production and their competitive
position.

SECTORAL ANALYSIS: Dairy, Tomato, Cereal, Poultry AERI
109
Table 23. Barley Production Area, Yield and Production (2006)
Area ( 000 Ha) Yield (tonne/ha) Production( 000ton)
EU -25 13.261 4.131 54.791
EU -15 10.285 4.525 46.543
Belgium 49 7.495 367
Czech Republic 528 3.593 1.897
Denmark 679 4.815 3.270
Germany 2.025 5.908 11.966
Estonia 142 2.130 303
Greece 75 2..500 187
Spain 3.233 2.573 8.318
France 1.670 6.229 10.404
Ireland 164 6.685 1.096
Italy 330 3.877 1.282
Latvia 152 2.021 307
Lithuania 382 1.942 742
Luxembourg 9 5.263 50
Hungary 293 3.682 1.081
Netherlands 45 6.028 269
Austria 206 4.427 914
Poland 1.221 2.589 3.161
Portugal 45 2.107 94
Slovenia 17 3.615 62
Slovakia 185 3.465 642
Finland 564 3.494 1.972
Sweden 307 3.6 1.112
United Kingdom 882 5..939 5.239
Turkey (2005) 3.650 2.603 9.500
Turkey (2006) 3.650 2.616 9.551 Source: Eurostat ,TURKSTAT
Turkey‟s maize yield amounted to 7 tonnes per hectare in 2005. This figure has approached
European Union‟s average maize yield which was 8.4 ton per hectare in 2004 (see table 24).

SECTORAL ANALYSIS: Dairy, Tomato, Cereal, Poultry AERI
110
Table 24. Corn Production Area, Yield and Production (2006)
Area( 000 ha) Yield (tonne/ha) Production(000ton)
EU- 25 5.708 8.414* 50.984*
EU -15 3.891 8.954* 37.855*
Belgium 56 10.193 576
Czech Republic 90 6.753 606
Germany 401 8.031 3.220
Greece 190 9.000 1.710
Spain 354 9.787 3.461
France 1.503 8.553 12.853
Italy 1.108 8.728 9.671
Lithuania 2 2.350 5
Luxembourg 0.288 6.510 2
Hungary 1.229 6.867 8.441
Netherlands 20 12.200* 253*
Austria 159 9.237 1.472
Poland 303 4.161 1.261
Portugal 100 5.371 536
Slovenia 40 6.930 276
Slovakia 153 5.469 838
Turkey (2005) 600 7.000 4.200
Turkey (2006) 536 7.110 3.811 Source: Eurostat ,TURKSTAT
*: 2005 data
Looking at production area and yields, it is expected that wheat and barley areas and yields
can be increased somewhat more as compared to the present situation. Also it seems feasible
to increase maize areas and also maize yields, leading to an increase in production volume.
Current maize yield is nearly equal to that of the EU at those regions in the country where the
crop is produced intensively. On the one hand, the European Union, not permitting genetically
modified import, will inhibit maize imports into Turkey from USA and Argentina and on the
other hand, maize import from USA, financed with credit will be ended. At the end of these
events, there will be higher costs in feed and poultry sectors.
Turkey‟s rice production does not satisfy domestic consumption; consumption needs are met
through imports. Within the EU Spain, Greece and France produce rice where Spain is the
largest producer with 746,000 tonnes. Turkey‟s paddy yield was 7.0 t/ha in 2006 whereas
EU‟s average yield was 6.8 t/ha (see table 25).

SECTORAL ANALYSIS: Dairy, Tomato, Cereal, Poultry AERI
111
Table 25. Rice Production Area , Yield and Production (2006)
Area ( 000 ha)
Yield (tonne/ha)* Production(000ton)
EU- 25 401 6.840 2.745
EU -15 399 6.858 2.736
Greece 23 7.870 181
Spain 106 7.012 746
France 17 5.476 95
Italy 228 6.855 1.564
Hungary 2 3.927 10
Portugal 24 6.225 150
Turkey (2005) 85 7.058 360
Turkey (2006) 99 7.030 696 * Paddy Yield
Source: Eurostat, TURKSTAT
Although the difference between Turkey‟s and EU‟s wheat, barley and maize yields is related
to ecological and climate conditions, it is worrisome that Turkey‟s average yield for these
crops is also under average world yields. Although among the grains paddy is in the most
advantageous situation in terms of yields, production area and amount are still inadequate.
Paddy law, aiming to organize water and to prevent malaria, restricts paddy planting area.
2.1.3 Grain Prices
In Turkey grain prices are higher than intervention prices in the EU. An overview of
developments in wheat prices is given in Graph 2. Except for the 2001 – 2002 crisis, in
Turkey the wheat price was generally about two times higher than the EU price.
Graphic 2:Turkey and EU Wheat Prices (YTL/Kg)
0,000 0,050 0,100
0,150 0,200 0,250 0,300
0,350 0,400
2001 2002 2003 2004 2005 2006
YTL
EU Intervention Price Turkey Intervention Price

SECTORAL ANALYSIS: Dairy, Tomato, Cereal, Poultry AERI
112
Graphic 3:Turkey and EU Barley Prices (YTL/Kg)
Graphic 4:Turkey and EU Maize Prices (YTL/Kg)
0,000
0,050
0,100
0,150
0,200
0,250
0,300
2001 2002 2003 2004 2005 2006
YTL
EU Intervention Price Turkey Intervention Price
0,000
0,050
0,100
0,150
0,200
0,250
0,300
0,350
2001 2002 2003 2004 2005 2006
YTL
EU Intervention Price Turkey Intervention Price

SECTORAL ANALYSIS: Dairy, Tomato, Cereal, Poultry AERI
113
Graphic 5:Turkey and EU Paddy Rice Prices (YTL/Kg)
2.1.4. Gross Margins and Costs
Profit is a major indicator of the success and competitiveness of the grain sector. There are
different grain producing regions in Turkey; each has different production costs. In this study
the national average is taken for production costs and gross margins are calculated.
As can be seen in Table 26, in Turkey paddy rice has the highest gross margin per hectare,
followed by maize.
Table 26. Gross Margins (YTL/ha) (2005)
Wheat Maize Barley Rice
Gross Production Value 1.117 2.620 825 5.505
Variable Costs 804 1.730 715 2.960
Gross Margin 313 890 110 2.545 Source: TEAE Calculations Using Data of Ministry of Agriculture and Rural Affairs
Additionally, a comparison is made in terms of the average costs and gross margins of
Turkish wheat production with the figures for Romania and England.
0,000 0,100 0,200 0,300 0,400
0,500 0,600 0,700 0,800
2001 2002 2003 2004 2005 2006
YTL
EU Intervention Price Turkey Intervention Price

SECTORAL ANALYSIS: Dairy, Tomato, Cereal, Poultry AERI
114
Table 27. Gross Margin And Cost Comparison For Wheat (2003)
Romania Turkey UK
Gross Production Value($/ha) 280 772 705
Support Amount ($) 31 48 305
Yield (tonne/ha) 3,5 2,5 7,5
Total Income ($/ha) 311 820 1,010
Seed 43 58 75
Fertilizer 58 80 130
Pesticide 35 20 120
Other - 237 20
Total Variable Costs ($/ha) 136 395 335
Gross Margin ($/ha) 175 425 665
Variable Cost per Unit ($/tonne) 39 158 44
Field Rent 68
General Cost 14
Amortization, Insurance 3
Fixed Cost ($/ha) 98 85 250
Total Cost ($/ha) 234 480 584
Total Cost Per Unit ($/tonne) 67 192 78
Net Margin($/ha) 77 340 415 Source: The Romanian Agrifood Chain: On the Road to Accession, SGB, TEAE Calculations
In Turkey, the average gross margin for wheat is 425$ per hectare. Yields are nearly 2.5
tonnes/ha whereas the variable costs amount to 158$ per ton. In Romania variable cost per
hectare for wheat is 39$ per tonne while in England it is 44$. Looking at the net margin for
wheat production, it appears that Turkey outperforms Romania (340$/ha versus 77$).
However, net margins in England are substantially higher (415 $ per hectare). Also the total
cost per tonne is relatively high in Turkey when compared to Romania and England
(192$/tonne versus 67$ and 78$ respectively).
It can be concluded that profitability of wheat production in Turkey is relatively low, mainly
due to the high cost of production, which is negatively influencing the competitiveness of the
sector.

SECTORAL ANALYSIS: Dairy, Tomato, Cereal, Poultry AERI
115
2.2. Processing Industry Performance
All grain processors in Turkey belong to the private sector. In general, the factories are small
or medium in size. It is difficult to obtain detailed information about their functioning and
competitiveness. Data on capacity utilization are available (See table 28); these provide an
idea about the profitability of the industry. In 2005 the capacity utilisation rate of the wheat
flour industry was 36%. This figure was 50% for the pasta industry, 58% for biscuit industry
and 44% for starch-based sweetener industry. Capacity utilization rate for the Fodder industry
was nearly 45%.
Main reasons of the low rates in capacity utilisation are the high price of raw materials,
irrational investment decisions and the national economic crisis. Many companies operating
in the grain processing industry, especially in the flour industry, work inefficiently and are not
profitable.
Table 28.Capacity Utilization (2005)
%
Wheat flour 36
Pasta 50
Biscuits 58
Starch 61
Starch Based Sweetener 44
Fodder Industry 45 Source : SPO
Table 29 shows that the production of processed grain commodities has been increasing year
by year.
Table 29. Manufacturing of Cereal Products (000 Ton)
Source: TURKSTAT, Manufacturing Industry Statistics
Additionally, exports of grain products are presented in Table 30.
1999 2000 2001 2002 2003 2004 2005
Flour 10.450 10.710 10.670 10.622 11.450 11.800 12.500
Pasta 372 373 383 422 438 512 566
Biscuits etc. 425 420 456 475 485 550 580
Mixed Feed 6.046 6.662 5.178 5.176 5.853 6.905 6.834
Beer (million liter) 715 763 744 754 801 877 918
Starch 58 64 62 66 75 91 98

SECTORAL ANALYSIS: Dairy, Tomato, Cereal, Poultry AERI
116
Table 30. Export of Cereal Products (000 Ton)
Flour Pasta
Quantity(ton) Value(000 $) Quantity(ton) Value (000 $)
1996 551.355 166.808 108.894 58.106
1997 844.110 253.628 135.989 70.129
1998 345.704 90.338 90.949 45.199
1999 219.801 40.374 23.987 9.984
2000 354.858 64.142 25.515 9.683
2001 171.841 30.887 34.284 11.586
2002 230.317 42.342 49.372 16.752
2003 593.264 111.462 69.071 26.848
2004 786.054 197.487 125.999 50.263
2005 1.958.534 421.197 164.256 65.450
2006 815.000 163.000 69.000 32.000 Source: IGEME
The table shows that Turkey‟s pasta and wheat flour exports have been increasing
continuously. The main factor determining competitiveness is the price level of the raw
materials. When the industry would be able to source grain at a lower price, it would be able
to better utilize its processing capapcity and hence enhance its competitive position.
Table 31. Share of Turkey Grain Products in World Wheat Flour and Pasta Exports
Wheat Flour Pasta
Turkey Wheat Turkey Wheat
1000 ton
(1)
1000 ton
(2) (1)/(2)
1000 ton
(1)
1000 ton
(2) (1)/(2)
2002 230 8.726 2.63580 49 2216 2.211191
2003 593 8.828 6.71726 69 2268 3.042328
2004 786 7.464 10.53055 126 2367 5.323194 Source: FAO
World and Turkey total amount of wheat flour and pasta exports are presented in Table 31.
Turkey wheat flour and pasta exports have been increasing over the last years.

SECTORAL ANALYSIS: Dairy, Tomato, Cereal, Poultry AERI
117
3. SWOT ANALYSIS
Strengths:
Abundant arable area available for cropping
Large processing capacity installed for cereals
Farmers benefit from a wide range of market outlets
Weaknesses:
The parcel size of the cereal farms is generally small and they are unevenly distributed
Ineffective laws which should prevent further fragmentation of production
Limited use of certified seeds
Farmers‟ technical and business skills
Farmers‟ financial situation
Malfunctioning market channels and limited available market infrastructure. such as
transport and storage
Farmers. traders and processors use little risk management tools
Reluctance of sectoral actors and producers to cooperate for development of their market
power and bargaining power to purchase inputs
Expensive inputs
Unfair competition created by unregistered processors and producers
Lack of training activities and little market information
Low capacity usage (capacity surplus) in processing
Insufficient procurement of raw material
Limited storage facilities
Low competitiveness because of high cost
Opportunities:
Potential for improving cereal yield and quality (by using certificated seed)
Improvement in the warehouse(wholesale trade) receipt system (licensed storage system)
Accession into EU
Organic agriculture
Good strategic position in the global market (accessible markets in the East, Middle East
and in the West)
SECTORAL ANALYSIS: Dairy, Tomato, Cereal, Poultry AERI
118
Legislation to prevent further fragmentation of production
Threats:
Strong and increasing international competition when the sector fails to improve
competitiveness
Increasing cost of inputs (fertilizer. diesels and agro-chemicals) and dependence on
imports from abroad
Climate change
Accession into EU

SECTORAL ANALYSIS: Dairy, Tomato, Cereal, Poultry AERI
119
4. POLICY RECOMMENDATIONS
Below one finds a list of the main policy recommendations derived from the analysis made in
the previous chapters.
1. Tackle the constraint of small-sized and divided agricultural lands
The inheritance law aggravates the division of agricultural lands resulting in farms becoming
too small to be profitable. This situation prevents efficient usage of resources and increases
costs.
A new law aiming to implement practices to improve soil protection and increase area usage
has been in force since 09.02.2007 following official newspaper publication. Effective
implementation of the mentioned law could provide part of the solution to problems related to
divided and small sized agricultural lands.
In addition. it is necessary to encourage and to accelerate the integration activity of
agricultural areas.
2. Tackle inadequate grain yield and quality following insufficient use of certified high-
quality seeds
Seed production research studies should respond to the needs of the producers and the sector
as a whole. Government should support such activities. Since governmental resources to
produce certified seed are insufficient, private sector must be encouraged to produce such
seeds. TIGEM must be a guide for private sector in producing certified seed. The usage of
certificated seed by farmers must be encouraged for instance through training and extension
activities. Premium measures should be linked to product quality. Seed production under
contract should be promoted.
3. Improving the licensed storage system
Although licensed storing law is operational, aiming at stabilizing market prices, the
construction of additional storing capacity is required. The government must support the

SECTORAL ANALYSIS: Dairy, Tomato, Cereal, Poultry AERI
120
operation of the system since small farmers and traders do not have the financial means to
finance it.
4. Tackle low yield and quality
It is recommended to implement a regional approach to improve grain yield and quality.
Looking at competitiveness, especially the production regions which have the ability to
compete with the EU are crucial. The support system should have a differentiated structure,
responding to different needs in the production regions. Contractual production must be
supported.
5. Improve information flow and training
Farmer training and extension must be strengthened so that research results can be
implemented. Training materials must be provided to the producers.
6. Enhance agricultural financing
Land title and cadastre processes must be revised in order to make the land ownership
situation clear. Currently, this lack of clarity prevents farmers from getting credit.
7. Improve market structure
Although TMO is an alternative outlet for producers at the time of harvest, it is recommended
that the establishment of a futures markets is promoted to provide farmers with more options.
In addition. it is necessary to increase the number of wholesale markets with high-quality
infrastructure operating in a system of quality standards.
8. Promote fair market competition
Unregistered enterprises, which do not pay taxes form an unfair competition to registered
enterprises. Operating under a lower cost structure such informal companies could possibly
obtain a high market share and higher profit margins. Some control and education measures
are required to prevent this situation.

SECTORAL ANALYSIS: Dairy, Tomato, Cereal, Poultry AERI
121
Workshop 1.Cereal Problem Tree
EF
FE
CT
S
Poor competitiveness Low levels of production
of cereal processing
industry
Import
penetration
Low producer
income
Low levels
of export
Low levels of
production
MAIN PROBLEM: LOW YIELDS
CA
US
ES
Rainfed
agriculture
Lack of
rain Existence
of the
substitute
crops in
irrigated
agriculture
High number of
holdings
(fragmented
structure)
Small
scale
holdings
Split land by
heritage
Poor awareness and
poor input usage
Little use
of
certified,
high-
quality
seed
Poor
producti
on
Lack of
farmer
training
High input
prices

SECTORAL ANALYSIS: Dairy, Tomato, Cereal, Poultry AERI
122
WORKSHOP 1. Cereal Target Tree
RE
SU
LT
S
Increase in supply of raw
material to agricultural
industry
Decreased
imports Increased export
Rise in
producer
incomes
Production increase
MAIN PROBLEM: INCREASING YIELDS
FA
CT
OR
S
Increase in
production of
certificated and
qualitative seed
Research Private
sector
entrepre
nourship
Increasing
farms sizes
Land
consolidation
Improving farmer
training
Increase in input usage
and improving training
Improving
heritage law Soil
analyses
Decreasing
input costs
Increase in
competitivenes

SECTORAL ANALYSIS: Dairy, Tomato, Cereal, Poultry AERI
123
REFERENCES
Dönmez, D. 2006. Rice Situation and Outlook:2006/2007, Agriculture and Rural Affairs
Ministry Agricultural Economics Research Institute, Publication No: 148,Ankara.
DPT, 2006. 9.Development Plan (2007–2013) Food Special Committe Report.
Ege, H., Eken,H.,Çakaryıldırım,N. 2006. Barley Situation and Outlook:2006/2007,
Agriculture and Rural Affairs Ministry Agricultural Economics Research Institute Publication
No:147, Ankara.
MAFWE, 2003.The Romanian Agrifood Chain:On the Road to Accession, Ministry of
Agriculture, Forests, Water and Environment, Bucharest.
Agriculture and Rural Affairs Ministry Agricultural Economics Research Institute, Wheat
Situation and Outlook Reports, Various Years.
Agriculture and Rural Affairs Ministry Agricultural Economics Research Institute, Feed
Grains Situation and Outlook Reports, Various Years.
Agriculture and Rural Affairs Ministry, 2006.Agriculture in Turkey, Ankara.
Soil Products Office,2006 Yılı Cereals Report
State Statistics Institute , Agricultural Structure and Production, Various Years, Ankara.
State Statistics Institute,.Agricultural statistics Summary (1986–2005), Ankara.
http://www.dpt.gov.tr, Reaching Date:05.02.2007
http://www.tmo.gov.tr, Reaching Date:07.02.2007
http://www.igeme.gov.tr, Reaching Date:11.02.2007
http://www.faostat.fao.org , Reaching Date:21.02.2007
http://www.epp.eurostat.ec.europa.eu , Reaching Date:25:02.2007

SECTORAL ANALYSIS: Dairy, Tomato, Cereal, Poultry AERI
124
Turkish Poultry Meat Sector Analysis
Halit ÇINAR Alkan DEMĠR ġevket KALANLAR
Berrin TAġKAYA Siemen van BERKUM
1. INTRODUCTION
Background and approach of the study
The aim of this chapter is to describe and estimate the state and performance of the poultry
meat sector in Turkey. The report aims to judge the competitiveness of the Turkish poultry
meat sector, to identify key constraints to competitiveness and to develop policy interventions
to improve the competitive position of the sector.
The common methodology established is based upon internationally accepted definitions of
competitiveness, which focus on the ability of individual industries to “profitably maintain or
increase market share” in either domestic or international export markets. Structure, conduct,
and performance concepts are combined with resource analyses in judging the
competitiveness of the Turkish poultry meat chain, to identify key constraints to
competitiveness and to develop policy interventions to improve competitiveness. The study
considers the entire poultry meat chain including farmers and meat processing companies, as
well as their linkages to marketing and retailing activities.
This sector report covers the following issues:
a description of the sub-sector based upon secondary data covering among others trends in
production, consumption and trade, yields, prices, concentration of production, capacity
utilization, and a description of the linkages within the food chain;
primary data collection using case-studies to illustrate key activities in the poultry meat
sector and identify lessons for the sector‟s development;
an identification of key-constraints limiting the competitiveness and development of the
sector;
and an identification of policy options.
SECTORAL ANALYSIS: Dairy, Tomato, Cereal, Poultry AERI
125
The structure of this chapter is as follows. In section 2, an overview of the present situation
and conditions in poultry meat production and processing in Turkey is presented. Section 3
further elaborates on the issue by evaluating factors, which influence the competitiveness and
efficiency of the poultry meat chain. Based on these analyses, the sector‟s Strengths and
Weaknesses, Opportunities and Threats are identified in section 4. Such a SWOT analysis
gives the possibility to define prerequisites and directions for the sector‟s future development.
The recognition of key constraints leads to a series of ideas for policies that may address the
obstacles to further development and help reduce the inefficiencies identified. Section 5 drafts
policy options in as much detail as is possible at this stage.
2. OVERVIEW of the TURKISH POLULTRY MEAT SECTOR
2.1. Description of the Sector
The poultry meat sector consists of production on farm level and processing industry of
broiler, turkey, duck and goose ready for consumption. In Turkey, 93% of poultry meat
production is made by integrations (vertically integrated poultry meat producers, including
farms and processing units) today. The poultry meat sector started to produce in industrial
means during the 1970s. Especially after investments on infrastructure in the 1980s the sector
could respond to increasing demand for animal products because of population and income
increases. Furthermore, poultry meat is considered healthier than beef meat and red meat
prices are higher than for poultry meat, two additional reasons why demand for poultry meat
increased significantly in last decades. Yet, per capita consumption in Turkey is still much
below the average consumption levels in many European Union and other developed
countries.
2.2. Production Value
Poultry meat production accounted for 3.7% of the Gross Agricultural Output in 2005 (see
table 1). During the last decade, poultry meat production was the fastest growing sub-sector in
livestock production with its average 12% growth rate per year (see table 2). In table 1 below
this shows as the share of poultry production in total livestock production increased from 10%
in 1996 to 15% in 2005. Poultry meat production is mainly chicken meat (see also table 2).

SECTORAL ANALYSIS: Dairy, Tomato, Cereal, Poultry AERI
126
Table 1. Gross Agricultural Output (GAO) value and share of poultry meat 1996 1997 1998 1999 2000 2001 2002 2003 2004 2005
Total GAO (billion YTL) 2.7 4.78 9.7 13.3 20.1 26.1 42.2 55.1 61.1 67.4
Crop production (billion YTL) 2.1 3.6 7.3 9.7 14.9 20.0 31.8 40.7 45.7 51.0
Livestock production value (billion YTL) 0.6 1.2 2.5 3.7 5.2 61 10.5 14.4 15.4 16.5
Poultry production value (million YTL) 63 138 271 437 658 661 1.492 2.077 2.255 2.481
Chicken meat production value (million
YTL) 63 137 270 426 632 638 1.402 1.913 2.082 2.277
Share of poultry meat in total livestock
production value (%) 10.1 11.5 11.0 11.9 12.8 10.9 14.3 14.4 14.6 15.0
Share of poultry meat in GAO (%) 2,3 2,9 2,.8 3.3 3.3 2.5 3.5 3.8 3.7 3.7
Source: TÜİK, Agricultural Structure (Production, Price, Value)
2.3 Production, consumption and trade
2.3.1. Production
The strong depreciation of the Turkish Lira in 2001 caused a significant decrease of 5% in
production due to increased production costs of the sector which is heavily dependent on feed
imports and because of decreased purchasing power of the consumer. Even there is an
increasing trend in turkey production, duck and geese production decreased over time (see
table 2).There are approximately 5.5 production cycles in Turkish broiler production each
year, and on average 110 thousand animals produced each cycle.
Table 2: Turkish Poultry Meat Production (Tonnes Carcass Weight)
Chicken Meat Turkey Meat Duck M. Geese M. Total 1995 282.038 - - - 282.038
1996 420.609 1.027 266 464 422.366
1997 471.415 376 40 97 471.928
1998 486.710 702 24 106 487.542
1999 596.880 12.744 5 24 609.653
2000 643.457 19.274 4 13 662.748
2001 614.745 15.125 5 13 629.888
2002 696.187 30.401 6 13 726.607
2003 872.419 32.801 10 21 905.251
2004 876.774 37.623 10 51 914.458
2005 936.697 42.709 2 5 979.413
2006* 945.779 45.750 - - 1.031.779
2007* 997.000 33.000 1.085.000 Source: TÜĠK
Avian Influenza (AI) is an animal disease in Turkey, carried by wild birds. Until the first AI
plague in Turkey, that appeared especially in backyard poultry during the last months of 2005,
it was a common and legal practice to slaughter the spent hens from layer flocks, and

SECTORAL ANALYSIS: Dairy, Tomato, Cereal, Poultry AERI
127
subsequently to sell backyard poultry in open markets. This practice was left during AI
struggle and it was decided to slaughter spent hens in separate slaughterhouses to process in
the rendering plants and to ban the sale of backyard poultry in open markets.
Since foreign trade volumes are very small compared with internal consumption, production
data is very similar with consumption data. During the summer season there is usually an
increase in demand because of the grill season and tourism. That is why there is a huge
difference in consumption levels between summer and winter seasons. The average capacity
utilization in integrations remains 70% for that reason. On the other hand, because of AI
plague started in the end of 2005 and lasted till the first quarter of 2006, production decreased
and some integrations cut the production down, yet on a temporary basis. The production in
early 2006 declined but generally the impact of the AI has been low, as production capacity
recovered so that the total 2006 production reached a higher level than in 2005 (see figure 1).
Source : BESD-BĠR

SECTORAL ANALYSIS: Dairy, Tomato, Cereal, Poultry AERI
128
Turkish poultry meat production in 2005 was almost 1 million ton. This equals to 9% of EU-
25 total production. Table 3 lists the major poultry producing countries in the EU. Including
Turkey in this list would rank the country as number six .
Table 3. Total poultry meat production in EU-25 in 2005 (in 1,000 tonnes)
Country Production
France 1,940
United Kingdom 1,606
Spain 1,302
Germany 1,196
Italy 1,092
Poland 972
Holland 565
Hungary 449
Belgium/Luxembourg 297
Portugal 286
Total 11,030
Box 1. BROILER INTEGRATIONS
Turkish Broiler Integrations mostly completed their vertical integration. Most
of the companies work with contracted farmers with the help of their own feed
mills, parent stocks and hatcheries; distribute poultry meat with their own
marketing network which they process in their own facilities. Live production
is made with contracted farming. Integrations usually do not invest in poultry
house installations, but request the contracted farmer to comply with some
technical conditions. Integrations give veterinary services to the contracted
farmers in charge. After supplying day old chicks and feed without any fee to
the farmer according to the contract, integrations transport animals ready to
slaughter which were collected by the farmer to slaughterhouse. Payments are
made at the end of the cycle according to the contract for kg live weight.
Prepayments are also made to the farmer during the production cycle if
needed. Additionally premiums are paid to the farmer by the integration
according to contract, for the good technical production parameters like
mortality rate, feed convertion rate and slaughtering weight.

SECTORAL ANALYSIS: Dairy, Tomato, Cereal, Poultry AERI
129
Poultry production is concentrated in the Middle North, Agean, Marmara and the
Mediterrannean regions of Turkey. One of the most important reason for this is the short
distance to big consumption centres. In these regions with dense population and higher
income, markets are available which makes poultry production in these regions attractive.
Also a developed tourism sector and good infrastructure (ports, roads) are reasons for poultry
producers to choose these regions.
In the sector, there are approximately 12,650 broiler and 2,800 egg poultry houses. Over 500
thousand people (including producers, farmers, traders related with the sector, feed, medicine,
related industry, transportation and marketing) are employed in the sector and around 2
million people (assuming that those 500 thousand people have families of 4 people) are
making a living from this sector. Annual turnover of the sector is around 3 billion USD
(BESD BIR website Sector report 2006). There are 21 members of BESD-BĠR with their own
slaughter houses.
Figure 1. Geographical Distribution of Turkish Poultry Meat Production
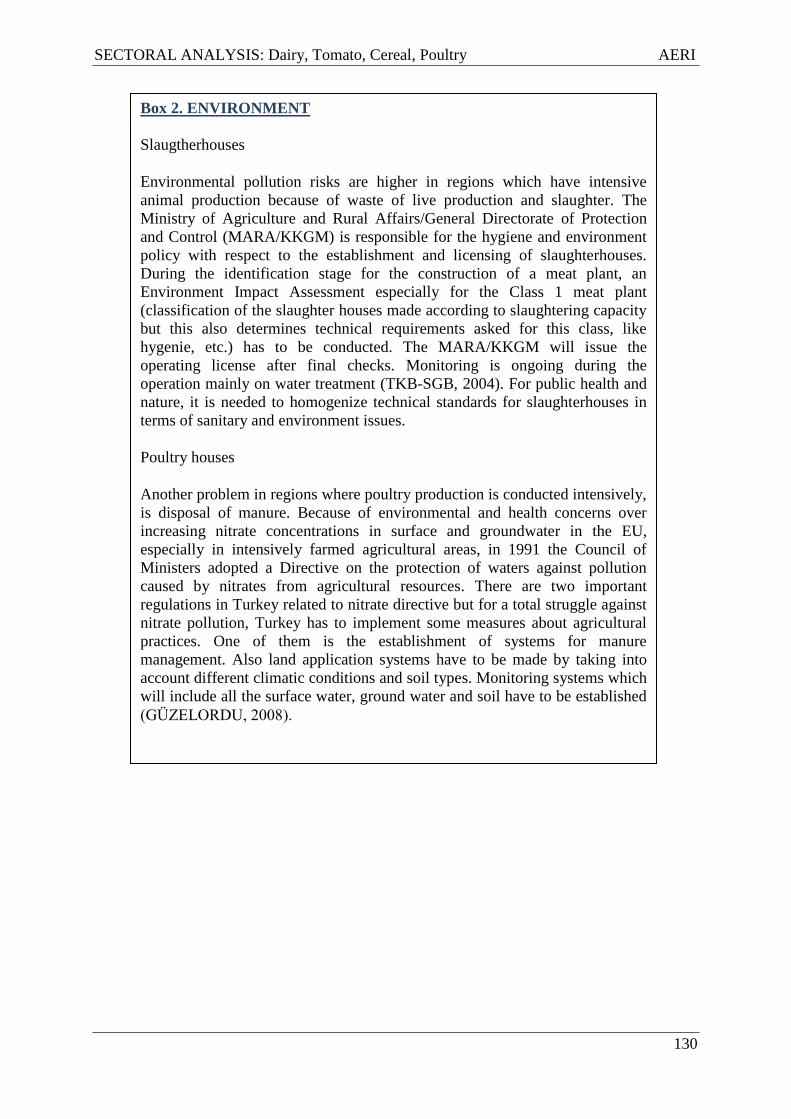
SECTORAL ANALYSIS: Dairy, Tomato, Cereal, Poultry AERI
130
Box 2. ENVIRONMENT
Slaugtherhouses
Environmental pollution risks are higher in regions which have intensive
animal production because of waste of live production and slaughter. The
Ministry of Agriculture and Rural Affairs/General Directorate of Protection
and Control (MARA/KKGM) is responsible for the hygiene and environment
policy with respect to the establishment and licensing of slaughterhouses.
During the identification stage for the construction of a meat plant, an
Environment Impact Assessment especially for the Class 1 meat plant
(classification of the slaughter houses made according to slaughtering capacity
but this also determines technical requirements asked for this class, like
hygenie, etc.) has to be conducted. The MARA/KKGM will issue the
operating license after final checks. Monitoring is ongoing during the
operation mainly on water treatment (TKB-SGB, 2004). For public health and
nature, it is needed to homogenize technical standards for slaughterhouses in
terms of sanitary and environment issues.
Poultry houses
Another problem in regions where poultry production is conducted intensively,
is disposal of manure. Because of environmental and health concerns over
increasing nitrate concentrations in surface and groundwater in the EU,
especially in intensively farmed agricultural areas, in 1991 the Council of
Ministers adopted a Directive on the protection of waters against pollution
caused by nitrates from agricultural resources. There are two important
regulations in Turkey related to nitrate directive but for a total struggle against
nitrate pollution, Turkey has to implement some measures about agricultural
practices. One of them is the establishment of systems for manure
management. Also land application systems have to be made by taking into
account different climatic conditions and soil types. Monitoring systems which
will include all the surface water, ground water and soil have to be established
(GÜZELORDU, 2008).

SECTORAL ANALYSIS: Dairy, Tomato, Cereal, Poultry AERI
131
2.3.2. Consumption
Population growth, income increases and poultry meat prices being lower than beef prices are
all reasons why poultry meat consumption per capita increased strongly over the last decade
to reach 14kg/capita in 2004.
Consumptions Per Capita of Poultry Meat and Beef Per
Year
0
2
4
6
8
10
12
14
16
18
1995 1996 1997 1998 1999 2000 2001 2002 2003 2004
Kg
/ Y
ıl
Poultry Meat Red Meat
The share of poultry meat consumption in total food expenses increased especially in the
1990s: in 1994 it accounted for only 1.9%, yet it increased to reach 3.5% in recent years.
During the economic crisis in 2001 there was a decrease in purchasing power of the
consumers. Poultry meat consumption didn‟t lose its share in total food expenses, but total
poultry meat consumption decreased for the first time in several years.
In spite of the significant increase in poultry meat consumption per capita during the last
decade, Turkish poultry meat consumption per capita is still lower than EU average and
developed countries average. (See table 4). In the near future it is expected that the increasing
trend in poultry meat consumption in Turkey will continue because of population growth and
an increase in income levels.
Source : BESD-BĠR

SECTORAL ANALYSIS: Dairy, Tomato, Cereal, Poultry AERI
132
Table 4: Poultry Meat Consumption per capita in Turkey and World 2006 Region Consumption per cap. (kg/year)
World 11.7
USA 46.2
Russia 16.7
EU-27 15.8
Turkey 12.9 Source: USDA-FAS
Most of the poultry meat (83%) is consumed as chilled carcass and the rest is sold as frozen.
75% of the total sales is in the form of hole birds and the rest (25%) as cut pieces. 73% of the
cut pieces sales is legs & breast, 11% as gizzard, 6% as wings and 4% as filet (Emine Çiğdem
CĠVANER, DTM). Turkey meat is traditionally consumed more in new years ewe in Turkey.
People usually use broiler meat to as main part of their animal protein diet which is a result of
high red meat prices. Since it is more expensive than red meat, duck and goose meat
consumption is not common in urban areas. In rural areas they are consumed in evening meal
during Ramadan as a special meal.
Box 3. ANIMAL BY-PRODUCTS
In terms of struggle against BSE, a Directive related to Disposal of Animal By
products Not Intented for Human Consumption was prepared and in addition
to that a decision was taken to ban animal by-products as a feeding stuff for
animals produced for human consumption by EU. This implementation had
serious effects on both the environment and the economics of poultry meat
production. It is estimated that the costs of disposal of animal byproducts to
reach 3 billion € in EU (europa.eu.int/comm/food/fs/bse/bse47_en.pdf ). Since 1
million ton of poultry meat is produced in Turkey and 90% of this production
is made by establishments which has rendering facilities, it is assumed that
slaughter by-products like legs, feather and heads are equal to 140,000 ton a
year. Rendering products generate an estimated 90 million dollars of added
value annually in Turkey. Expected expenditures like DCP
(Dicalciumphosphate), soy meal, methionine and lysine increase to 80 million
dollars to replace poultry meal. This amount is equal to the cost of constructing
new slaughterhouses for each integration. Since there is no system for
incineration of biomass in Turkey, environmental and economic results of
landfilling of by-products should be considered. For broiler producers,
replacement of poultry meal (which is their own source) by imported feed raw
matterial would further decrease their competitiveness (ÇINAR, 2006).
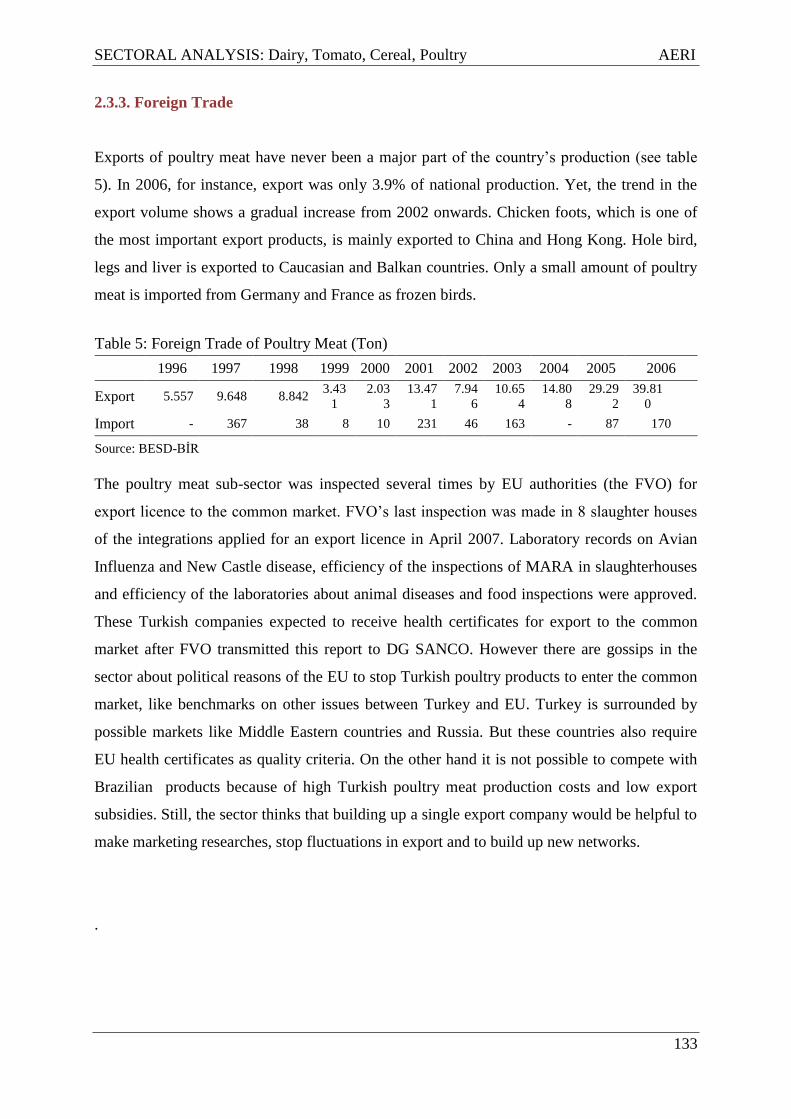
SECTORAL ANALYSIS: Dairy, Tomato, Cereal, Poultry AERI
133
2.3.3. Foreign Trade
Exports of poultry meat have never been a major part of the country‟s production (see table
5). In 2006, for instance, export was only 3.9% of national production. Yet, the trend in the
export volume shows a gradual increase from 2002 onwards. Chicken foots, which is one of
the most important export products, is mainly exported to China and Hong Kong. Hole bird,
legs and liver is exported to Caucasian and Balkan countries. Only a small amount of poultry
meat is imported from Germany and France as frozen birds.
Table 5: Foreign Trade of Poultry Meat (Ton)
1996 1997 1998 1999 2000 2001 2002 2003 2004 2005 2006
Export 5.557 9.648 8.842 3.43
1
2.03
3
13.47
1
7.94
6
10.65
4
14.80
8
29.29
2
39.81
0
Import - 367 38 8 10 231 46 163 - 87 170
Source: BESD-BĠR
The poultry meat sub-sector was inspected several times by EU authorities (the FVO) for
export licence to the common market. FVO‟s last inspection was made in 8 slaughter houses
of the integrations applied for an export licence in April 2007. Laboratory records on Avian
Influenza and New Castle disease, efficiency of the inspections of MARA in slaughterhouses
and efficiency of the laboratories about animal diseases and food inspections were approved.
These Turkish companies expected to receive health certificates for export to the common
market after FVO transmitted this report to DG SANCO. However there are gossips in the
sector about political reasons of the EU to stop Turkish poultry products to enter the common
market, like benchmarks on other issues between Turkey and EU. Turkey is surrounded by
possible markets like Middle Eastern countries and Russia. But these countries also require
EU health certificates as quality criteria. On the other hand it is not possible to compete with
Brazilian products because of high Turkish poultry meat production costs and low export
subsidies. Still, the sector thinks that building up a single export company would be helpful to
make marketing researches, stop fluctuations in export and to build up new networks.
.

SECTORAL ANALYSIS: Dairy, Tomato, Cereal, Poultry AERI
134
POULTRY MEAT MARKETING FLOW CHART 2005
Commercial Production % 94 INT
Hipermarket
Production
1,045,000 ton
Import 121 ton (Poultry
Meat)
Backyard Poultry =̃ %6
Wholesaler Regional Distributor
Supermarket
Marketing Unit INT
Export 31.690 ton
(Poultry Meat)
Slaughterhouse INT
Hotels, Hospitals etc.
Groceries, Butchers
Consumed in Village
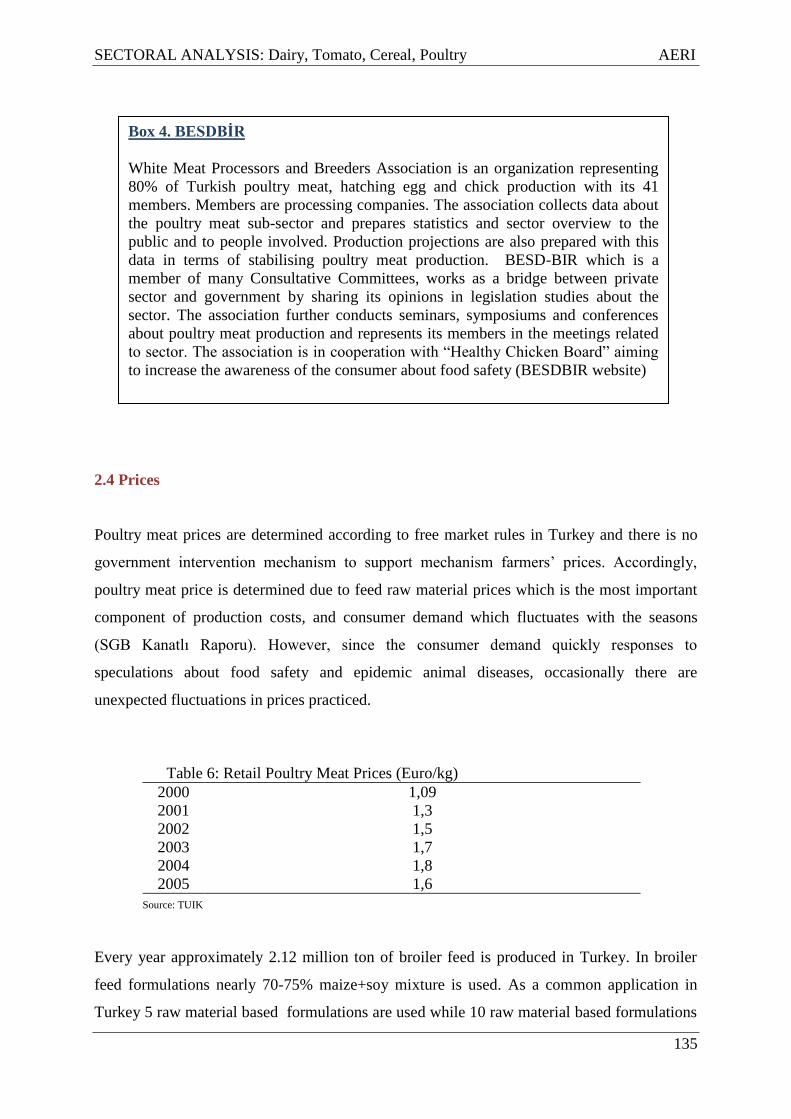
SECTORAL ANALYSIS: Dairy, Tomato, Cereal, Poultry AERI
135
2.4 Prices
Poultry meat prices are determined according to free market rules in Turkey and there is no
government intervention mechanism to support mechanism farmers‟ prices. Accordingly,
poultry meat price is determined due to feed raw material prices which is the most important
component of production costs, and consumer demand which fluctuates with the seasons
(SGB Kanatlı Raporu). However, since the consumer demand quickly responses to
speculations about food safety and epidemic animal diseases, occasionally there are
unexpected fluctuations in prices practiced.
Table 6: Retail Poultry Meat Prices (Euro/kg)
2000 1,09
2001 1,3
2002 1,5
2003 1,7
2004 1,8
2005 1,6
Source: TUIK
Every year approximately 2.12 million ton of broiler feed is produced in Turkey. In broiler
feed formulations nearly 70-75% maize+soy mixture is used. As a common application in
Turkey 5 raw material based formulations are used while 10 raw material based formulations
Box 4. BESDBİR
White Meat Processors and Breeders Association is an organization representing
80% of Turkish poultry meat, hatching egg and chick production with its 41
members. Members are processing companies. The association collects data about
the poultry meat sub-sector and prepares statistics and sector overview to the
public and to people involved. Production projections are also prepared with this
data in terms of stabilising poultry meat production. BESD-BIR which is a
member of many Consultative Committees, works as a bridge between private
sector and government by sharing its opinions in legislation studies about the
sector. The association further conducts seminars, symposiums and conferences
about poultry meat production and represents its members in the meetings related
to sector. The association is in cooperation with “Healthy Chicken Board” aiming
to increase the awareness of the consumer about food safety (BESDBIR website)

SECTORAL ANALYSIS: Dairy, Tomato, Cereal, Poultry AERI
136
are used in rations. This means less flexibility for feed formulators to changing prices of feed
raw materials in global market and higher dependency on import products. The poultry meat
production sector needs 1.5 million ton soy/soybean meal production for feed, of which only
50 thousand ton can be produced locally. Also only 50% of the maize needed for feed
production is supplied locally. Because of policies supporting maize production with
protection on customs, import taxes are due in a range of 40 to 130% (in the harvest period in
Turkey). Because of dependency on import for feed raw materials and support policies for
local feed raw material producers, usually Turkish compound feed prices are higher than thos
in the EU.
Table 7 : Broiler Compound Feed Prices in Turkey (Euro/kg) Including VAT(%8)
2000 0.30
2001 0.27
2002 0.29
2003 0.29
2004 0.32
2005 0.33
Source : TEAE
3. COMPETITION ANALYSIS
3.1 Competition of integrations
3.1.1. Capacity
Poultry meat integrations produce approximately 1 million ton of poultry meat each year by
using on average 70% capacity. Main reasons for using this relatively low capacity are
seasonal fluctuation of demand and lack of opportunities for export during periods with low
domestic demand.
Table 8: Shares Of Companies in Market (%)
C.P.
Standart Banvit Beypiliç Er Piliç ġen Piliç Keskinoğlu Pak Piliç ġeker Piliç
Köy Tür
Ege Abalıoğlu
2000 8.8 11.3 5.7 5.0 4.1 3.8 2.9 4.5 15.6 -
2001 10.6 12.5 8.4 6.5 5.6 4.6 3.7 5.1 13.5 0.7
2002 12.3 11.8 10.2 7.5 6.9 4.8 4.5 4.9 12.9 2.4
2003 11.6 11.2 9.7 8.5 7.5 5.0 5.1 4.7 5.2 2.7
2004 11.2 10.0 9.8 7.9 7.5 4.7 4.5 4.3 2.7 2.5
2005 10.9 9.9 10.0 8.9 8.7 5.5 4.1 5.5 2.8
2006 10.0 10.3 10.1 9.1 8.2 5.7 3.5 5.9 2.5 3.2
Source: BESD-BĠR

SECTORAL ANALYSIS: Dairy, Tomato, Cereal, Poultry AERI
137
The Turkish poultry meat industry is rather concentrated. The top ten companies in the broiler
meat production have over 68% share of the total market according to 2006 data (see table 8).
This is close to the share these companies had in 2001, yet the distribution of the shares is
different among the companies. Köy-Tür, a company with 15% market share in 2000, lost it‟s
position because of the crisis caused by the exchange rates in 2001. Several other companies
though increased their market at the turn of 2001 and 2002 – partly taking over Köy-Tür‟s
markets. Also some new companies started business in the sector. Fastest growing company
in 2002 was CP Standart (Thailand based) the only foreign broiler integration in Turkey.
However, considering the period up to 2006 companies like Er Piliç and ġen Piliç have shown
the most significant increase in their market shares. According to today‟s conditions it is
likely to have difficulties with big supermarket chains in trade since there is no dominant
actor in the sector. According to contracts between poultry meat integrations and big retail
chains, payments must be made in 90 days. However there are complaints in the sector that
these big retail chains are using their market power to often exceed this deadline.
3.1.2. Production and Productivity Comparisons
In this comparison Dutch figures are used against Turkish, because Netherlands is well known
with its high technology and good technical field parameters in livestock production, and with
closest prices to global market for feed raw materials, compared to other EU countries. That
means, if Turkish producers can compete with Dutch producers, they will have chance in the
global and the EU market.
If main technical performance parameters are compared, such as mortality rate, feed
conversion rates and live weight at slaughter, Turkish poultry meat producers show better
results than those in neighbouring countries such as Romania, Bulgaria and Iran. The
production period, which is longer than in western countries, affects the feed conversion rate,
but this loss can be compensated with a higher slaughtering weight. Improved performance
could be gained by taking measures to reduce mortality rates.
An international comparison of production costs using the same calculation formula is
presented in table 9-11. Most important factor affecting Turkish poultry meat production costs
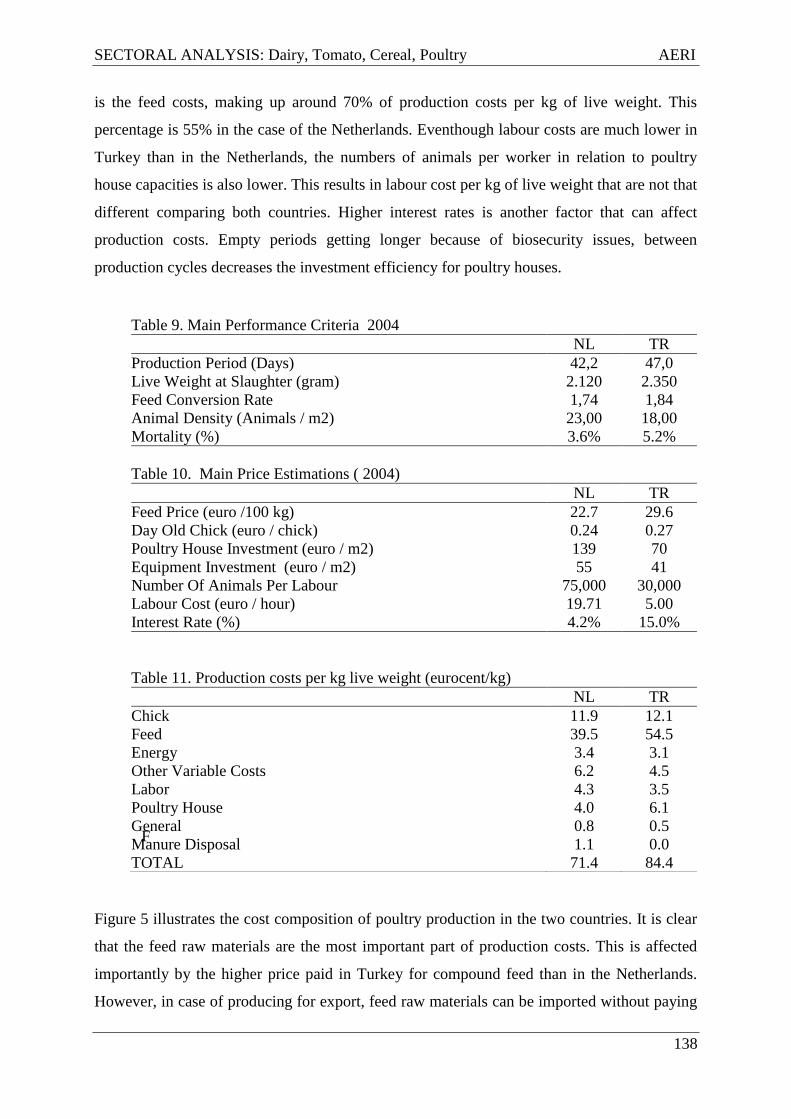
SECTORAL ANALYSIS: Dairy, Tomato, Cereal, Poultry AERI
138
is the feed costs, making up around 70% of production costs per kg of live weight. This
percentage is 55% in the case of the Netherlands. Eventhough labour costs are much lower in
Turkey than in the Netherlands, the numbers of animals per worker in relation to poultry
house capacities is also lower. This results in labour cost per kg of live weight that are not that
different comparing both countries. Higher interest rates is another factor that can affect
production costs. Empty periods getting longer because of biosecurity issues, between
production cycles decreases the investment efficiency for poultry houses.
F
Figure 5 illustrates the cost composition of poultry production in the two countries. It is clear
that the feed raw materials are the most important part of production costs. This is affected
importantly by the higher price paid in Turkey for compound feed than in the Netherlands.
However, in case of producing for export, feed raw materials can be imported without paying
Table 9. Main Performance Criteria 2004
NL TR
Production Period (Days) 42,2 47,0
Live Weight at Slaughter (gram) 2.120 2.350
Feed Conversion Rate 1,74 1,84
Animal Density (Animals / m2) 23,00 18,00
Mortality (%) 3.6% 5.2%
Table 10. Main Price Estimations ( 2004)
NL TR
Feed Price (euro /100 kg) 22.7 29.6
Day Old Chick (euro / chick) 0.24 0.27
Poultry House Investment (euro / m2) 139 70
Equipment Investment (euro / m2) 55 41
Number Of Animals Per Labour 75,000 30,000
Labour Cost (euro / hour) 19.71 5.00
Interest Rate (%) 4.2% 15.0%
Table 11. Production costs per kg live weight (eurocent/kg)
NL TR
Chick 11.9 12.1
Feed 39.5 54.5
Energy 3.4 3.1
Other Variable Costs 6.2 4.5
Labor 4.3 3.5
Poultry House 4.0 6.1
General 0.8 0.5
Manure Disposal 1.1 0.0
TOTAL 71.4 84.4

SECTORAL ANALYSIS: Dairy, Tomato, Cereal, Poultry AERI
139
import tax according to re-export rules. If producers could use feed without paying taxes,
calculations show that Turkish poultry meat production costs would be close to Dutch cost
levels.
Chick Chick
Feed
Feed
Energyi
Energyi
0,000
0,100
0,200
0,300
0,400
0,500
0,600
0,700
0,800
0,900
Hollanda Türkiye
avro
/kg
C.A
.
Şekil 5. Poultry Meat Production Costs
chick feed energy
4. SWOT ANALYSIS
Weak
- High feed cost as a result of high prices raw materials. Turkey‟s prices of corn are
much higher than world market prices. Import tariffs are 130%
- Depended on foreign inputs (raw materials, breeding stock, vaccines)
- High capital costs
- Insufficient measures of bio security
Strength
- modern state of art (partly)
- wide range of products
- integrated structure with large scale integrator
- good performance / good technical efficiency.(compared to neighbour countries)
- Good organization system of integrations
Opportunity
- Export poultry products based on world market broiler feed prices (import tax)
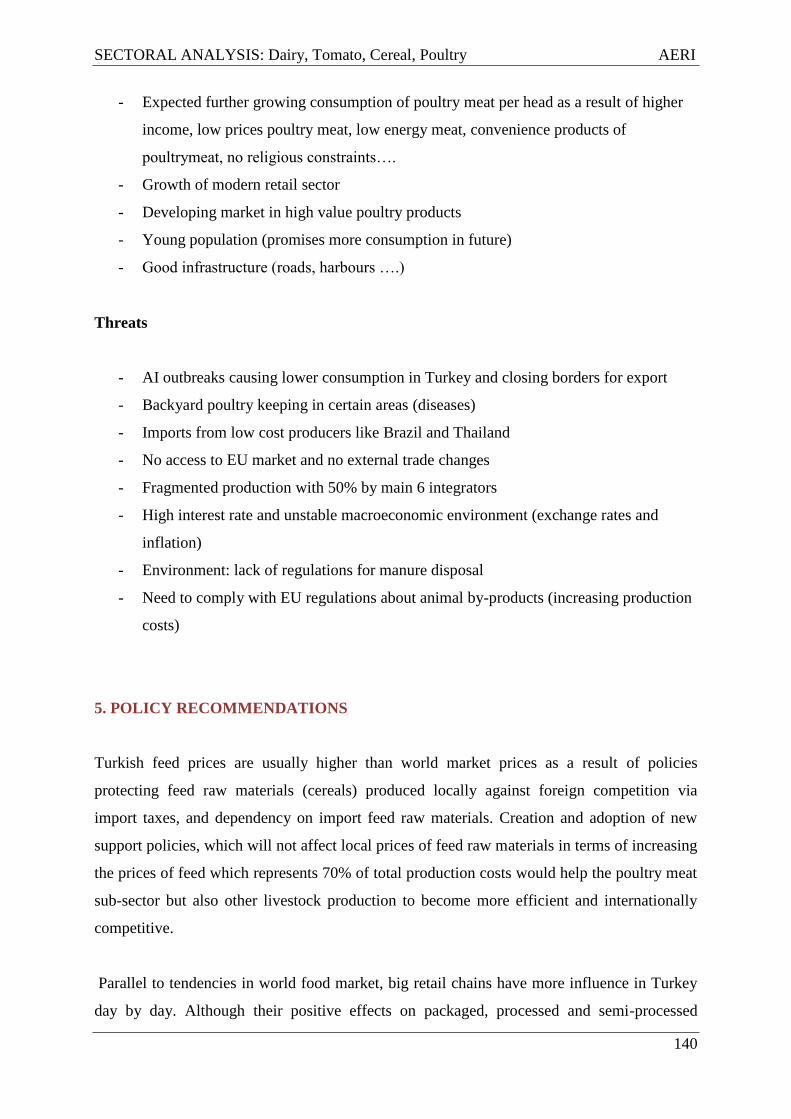
SECTORAL ANALYSIS: Dairy, Tomato, Cereal, Poultry AERI
140
- Expected further growing consumption of poultry meat per head as a result of higher
income, low prices poultry meat, low energy meat, convenience products of
poultrymeat, no religious constraints….
- Growth of modern retail sector
- Developing market in high value poultry products
- Young population (promises more consumption in future)
- Good infrastructure (roads, harbours ….)
Threats
- AI outbreaks causing lower consumption in Turkey and closing borders for export
- Backyard poultry keeping in certain areas (diseases)
- Imports from low cost producers like Brazil and Thailand
- No access to EU market and no external trade changes
- Fragmented production with 50% by main 6 integrators
- High interest rate and unstable macroeconomic environment (exchange rates and
inflation)
- Environment: lack of regulations for manure disposal
- Need to comply with EU regulations about animal by-products (increasing production
costs)
5. POLICY RECOMMENDATIONS
Turkish feed prices are usually higher than world market prices as a result of policies
protecting feed raw materials (cereals) produced locally against foreign competition via
import taxes, and dependency on import feed raw materials. Creation and adoption of new
support policies, which will not affect local prices of feed raw materials in terms of increasing
the prices of feed which represents 70% of total production costs would help the poultry meat
sub-sector but also other livestock production to become more efficient and internationally
competitive.
Parallel to tendencies in world food market, big retail chains have more influence in Turkey
day by day. Although their positive effects on packaged, processed and semi-processed

SECTORAL ANALYSIS: Dairy, Tomato, Cereal, Poultry AERI
141
products are well known, it is frequently pronounced that these chains with great economic
power cause some difficulties for small producers with little economic power, in terms of
timing of payments. Preparation of a legislation that would regulate trade between retail
chains and producers, similar to legislations adopted in some Western countries should
benefit the food producers in all sub-sectors.
Because of infrastructure advantages such as ports and roads, poultry meat production is
mainly located in certain regions of Turkey. Although not a problem today, disposal of
manure originated from poultry production can become a problem in future. The manure
which is preferred to be used for spreading on crop and/or grassland , cannot be used in this
way today since processing and transport costs are high. Producing new policies for manure
disposal would benefit the sub-sector in future as production is expected to increase.
Although the general bio-security conditions of poultry houses in Turkey are currently
sufficient, there is still need for improvement. Improvement of bio-security conditions in
poultry houses is both possible by better technical conditions and training of poultry farmers.
The supply of credit facilities with low(er) interest rates for bio-security improvements in
poultry houses by presentation would encourage poultry farmers to invest in the solution of
this problem. It is possible to improve the economic efficiency of poultry production; by
decreasing mortality which is one of the most important production parameters, but also to
increase the resistance of the sector to epidemic animal diseases, with training of poultry
farmers as a second step after improvement of infrastructure.
Poultry meat producers which comply with EU quality and hygieny requirements, could not
start to actively export to the EU eventhough their requests were approved after several
inspections. A possible problem in the near future with respect to export to the EU is animal
by-products. As a part of the measures to drive out BSE the EU has banned the usage of meat
and bone meal in animal feeds. Poultry producers which are depended on import raw
materials for feed production, are complaining that they would have serious economic losses
if poultry meal is banned in feed, as it is their own by-product and considered as good feed
raw material. Also, huge investments are needed for the disposal of by-products in
compliance with EU legislation. Further research is needed and action plans should be drafted
in this field to avoid possible problems in future.

SECTORAL ANALYSIS: Dairy, Tomato, Cereal, Poultry AERI
142
REFERENCES
BESDBIR Sector report 2006, www.besd-bir.org
TURKSTAT, Agricultural Structure (Production, Price, Value), www.tuik.gov.tr
MARA, Tarım ve KöyiĢleri Bakanlığı Strateji GeliĢtirme BaĢkanlığı, Kanalı Eti Raporu,
Aralık 2006 (Europaid Framework, Agri-Livestock Consultants Ltd and WDC World
Development Consultants S.A., Poultry Meat Report, December 2006)
CĠVANER, E.Ç., 2005 , DıĢ Ticaret MüsteĢarlığı, Ġhracatı GeliĢtirme Etüd Merkezi, Beyaz Et
Raporu


