

www.mu-leoben.at/iae A-8700 Leoben
INSTITUT FÜR NACHHALTIGE ABFALLWIRTSCHAFT UND ENTSORGUNGSTECHNIK Montanuniversität Leoben Peter-Tunner-Straße 15 Das institutseigene Labor für Umwelt- und Prozessanalytik ist akkreditiert nach der Norm ISO 17025
Diplomarbeit
Laboratory Scale Experiments for
the Development of an
Electrokinetic in-situ Soil
Remediation Method Using
Diamond Electrodes
erstellt am
Institut für Nachhaltige Abfallwirtschaft und Entsorgungstechnik, Montanuniversität Leoben
Vorgelegt von: Betreuer/Gutachter: Julia Yvonne Schmale Dipl.-Ing. Heidi Mikkola 0135128 O.Univ.Prof.Dipl.-Ing.Dr. Karl E. Lorber
Leoben, Juni 2007
EIDESSTATTLICHE ERKLÄRUNG
Ich erkläre an Eides statt, dass ich die
vorliegende Diplomarbeit selbständig und
ohne fremde Hilfe verfasst, andere als die
angegebenen Quellen und Hilfsmittel nicht
benutzt und die den benutzten Quellen
wörtlich und inhaltlich entnommenen Stellen
als solche erkenntlich gemacht habe.
Kurzfassung
Laborversuche zur Entwicklung einer elektrokinetischen in-situ Bodenbehandlung mit Einsatz von Diamantelektroden
Diese Magisterarbeit präsentiert eine Literaturstudie und Laborversuche, die die Grundlage
zur Entwicklung einer neuartigen elektrokinetischen in-situ Bodenbehandlungsmethode zur
Eliminierung von organischen Schadstoffen darstellen.
In Österreich sind ca. 93 % der Altlasten mit organischen Schadstoffen kontaminiert, wobei
für 40 % des Schadens Mineralöle und Phenole verantwortlich sind. Bislang steht in
Österreich keine adäquate in-situ Methode zur Behebung dieses Problems zur Verfügung.
Die hier zu entwickelnde Bodenbehandlung sieht die chemische Oxidation von Phenol und
Diesel im Boden mittels Peroxodisulfat vor. Das Oxidationsmittel wird elektrochemisch an
bor-dotierten Diamantelektroden aus einer Sulfatlösung synthetisiert. Danach wird es
elektrokinetisch in der kontaminierten Bodenzone mit Hilfe von Feldelektroden unter einem
elektrischen Gradienten verteilt, um zum Schadstoff zu gelangen.
Das Ergebnis dieser Laborstudie sagt aus, dass die Eliminierung von Diesel und Phenol in
Altlasten mittels dieser Methode möglich ist. Produktionsversuche an einer bipolaren
mechanisch implantierten Diamantelektrode ergaben eine linear verlaufende
Synthesefunktion von Peroxodisulfat mit einer Steigung von 1,1 (Ah/l gegen mmol/l) bei
200 mA/cm². Somit können 54 mmol des Oxidationsmittels in ca. 16 Stunden generiert
werden. Diese Menge ist notwendig, um ein mmol Natriumphenolat (0,1 g) in sandigem
Lehm innerhalb von vier Wochen mit zweiwertigem Eisen als Katalysator zu 99 % zu
oxidieren. Ein mmol Diesel (0,2 g) kann bis zu 84 % in zwölf Wochen durch 285 mmol
katalysiertes Peroxodisulfat zersetzt werden. In elektrokinetischen Transportversuchen in
gesättigtem lehmigen Sandboden gelang es, das Oxidationsmittel unter einer Feldspannung
von 4 V/cm mit einer Geschwindigkeit von 4 cm/h von der Kathode in Richtung Anode
wandern zu lassen. Dieses war das beste Ergebnis aus diversen Versuchsreihen, die
Bodentexturen von reinem Ton bis zu reinem Sand inkludierten.
Somit lassen alle Ergebnisse der Teilversuche darauf schließen, dass eine Kombination
derselben zu einer erfolgreichen in-situ Bodenbehandlung zur Eliminierung von Diesel und
Phenol führen kann. Es besteht allerdings Potential zur Verbesserung der Elektrosynthese
von Peroxodisulfat. Zudem sollte das Abbauverhalten von organischen Schadstoffen,
besonders Diesel, unter oxidativen Bedingungen besser untersucht werden. Einzelne
Dieselkomponenten könnten dafür individuell abgebaut und analysiert werden.

Abstract
Laboratory Scale Experiments for the Development of an Electrokinetic in-situ Soil Remediation Method Using Diamond Electrodes
This master thesis presents a review of literature experiences and the outcome of laboratory
pre-assays leading to the development of a new electrokinetic in-situ remediation method for
elimination of organic compounds in soil.
About 93 % of Austria’s contaminated land is affected by organic pollutants out of which
diesel oil and phenol account for 40 %. Up to the present day, no effective in-situ remediation
method exists (in Austria) in order to mitigate the damage. Thus, there is a need for a new
treatment technology. The method to be developed aims to chemically oxidize phenol and
diesel in soil with peroxodisulfate. The oxidant is generated in an electro synthesis process
with diamond electrodes from a sulfate solution. The peroxodisulfate rich solution is then
distributed electrokinetically within the contaminated area by means of an electric gradient
generated by field electrodes in order to reach the pollutant.
The overall outcome of the laboratory study suggests that the elimination of diesel and
phenol in soil matrix by means of this technique is possible. Electro synthesis experiments
with a bipolar mechanically implanted diamond electrode at 200 mA/cm² resulted in a linear
peroxodisulfate production curve with a slope of 1.1 (Ah/l vs mmol/l). Under these conditions,
54 mmol of the oxidant can be generated in about 16 hours. This is the amount needed to
eliminate one mmol sodium phenolate (0.1 g) to over 99 % in sandy loam soil during four
weeks in presence of bivalent iron as catalyst. One mmol of diesel oil (0.2 g) can be
decomposed up to 84 % in twelve weeks with 285 mmol of catalyzed peroxodisulfate. As for
the oxidant’s electrokinetic distribution different soil compositions have been tested (from
pure clay to only sand) with loamy sand yielding the best result. Under the influence of an
electric gradient of 4 V/cm, peroxodisulfate can travel 4 cm/h from the cathode towards the
anode in this soil texture.
Thus, all investigated components of the new treatment method yield results suggesting that
a combination of them can lead to an effective in-situ remediation technology for diesel and
phenol elimination in contaminated soil. However, for further improvement, the oxidant
production should be enhanced and the oxidative elimination of organic compounds,
especially diesel oil, needs to be understood more clearly. Therefore, single constituents
should be degraded and analyzed individually.
Resumen
Ensayos de escala de laboratorio para el desarrollo de un método in-situ de electrorremediación de suelos utilizando electrodos de diamantes
En esta memoria de título se presenta un estudio de literatura y se exponen resultados de
pre-ensayos a escala de laboratorio que llevan al desarrollo de un nuevo método de
electroremediacion in-situ de suelos para la eliminación de diesel y fenol.
En Austria, 93 % del suelo contaminado está afectado por compuestos orgánicos de los
cuales diesel y fenol son los responsables de un 40 % de la contaminación. Hasta ahora no
existe ningún método in-situ adecuado en Austria para la mitigación de este daño. El
tratamiento a desarrollar se basa en la oxidación de diesel y fenol químicamente con
peroxodisulfato. El agente oxidante se sintetiza con electrodos de diamantes a partir de una
solución de sulfato. A continuación el oxidante se distribuye en el area contaminada por un
gradiente eléctrico para llegar a estar en contacto con el contaminante.
El resultado integral de este estudio lleva a la conclusión que la eliminación de diesel y fenol
en suelo mediante éste método es posible. Los ensayos de electrosíntesis de
peroxodisulfato con electrodos de diamantes bipolares de implantación mecánica resultaron
en una producción lineal a 200 mA/cm² con una pendiente de 1.1 (Ah/l contra mmol/l). Bajo
éstas condiciones se producirían 54 mmol del oxidante en 16 horas. Esta cántidad se
necesitará para una eliminación de 99 % de un mmol fenolato de sodio (0,1 g) en un suelo
arenoso durante cuatro semanas en presencia de fierro bivalente como catalizador. Un
mmol de diesel (0,2 g) se oxidará hasta un 84 % durante doce semanas con 285 mmol de
peroxodisulfato catalizado. En cuanto a los ensayos de distribución electrocinética del
oxidante en un suelo arenoso se logró una velocidad de 4 cm/h de migración desde el
cátodo hacia el ánodo bajo un gradiente eléctrico de 4 V/cm. Se efectuaron ensayos con
varias composiciones de suelo empezando con 100 % arcilla y terminando con solo arena.
Por lo tanto, los resultados obtenidos de cada subsistema del método sugieren que una
combinación de éstos llevará a un nuevo tratamiento de suelo in-situ para la eliminación de
diesel y fenol. Sin embargo, la electro síntesis del peroxodisulfato disponde de un potencial
de mejoramiento. Además, la eliminación oxidativa de compuestos orgánicos, especialmente
del diesel, debe investigarse más a fondo. Por ende, componentes particulares del diesel
podrían degradarse y analizarce de manera individual.

Acknowledgements
I would like to thank all persons who supported me in completing this Master Thesis.
First of all, I thank DI Heidi Mikkola, the head of the study and my tutor, for her guidance in
the course of the development of this thesis, all the supportive discussions and the revision
of this work.
I express my gratitude to Professor Lorber for the helpful conversations and especially for
fostering the abilities of critically questioning results and distinguishing between scientific and
practical considerations.
To all members of the study, especially Slagjana Petkovska and Estephany Marillo, I owe a
lot for all their help in conducting the laboratory experiments that are referred to in this work.
Furthermore, I thank the heads of the Institute’s laboratory, DI Norbert Kienzl and Dr.
Manfred Weinberger for their help in designing experimental arrangements and chemical
advice.
I give my special thanks to all the members of the Institute of Sustainable Waste
Management and Technology for welcoming me as a co-worker and for the good working
atmosphere.
Last but no least, I would like to thank my dear family for all their support and understanding.
And I owe special thanks to my boyfriend Roberto Coloma who always took the time for
listening to me, who supported me with valuable ideas and fruitful conversations especially
on chemical issues.
Introduction
_________________________________________________________________________________________________________________________________________________________________________________________________________________
1
Table of Contents
Page
1 INTRODUCTION...................................................................................................4
1.1 Problem Identification .....................................................................................4
1.2 Goals and Targets ..........................................................................................5
1.3 Electrokinetic Remediation with Diamond Electrodes .....................................5
2 BACKGROUND INFORMATION ON CONTAMINATED SITES IN AUS TRIA.....7
2.1 Legal Background ...........................................................................................7
2.1.1 Definitions..........................................................................................................8
2.1.2 Threshold Values...............................................................................................9
2.2 Statistics .......................................................................................................10
2.3 Common Remediation methods....................................................................11
3 SOIL CHARACTERISTICS AND CONTAMINATION............. ............................13
3.1 Soil Parameters ............................................................................................13
3.2 Soil Contamination........................................................................................15
4 POLLUTANTS ......................................... ...........................................................17
4.1 Phenol...........................................................................................................18
4.2 Diesel Oil ......................................................................................................19
5 SPIKING METHODOLOGY ................................ ................................................21
6 ELECTROKINETIC SOIL REMEDIATION .................... .....................................22
6.1 Theoretical Considerations ...........................................................................23
6.2 Methods and Studies on Electrokinetic Remediation....................................25
6.3 Considerations and Conclusions for Laboratory Scale Experiments.............29
7 IN-SITU CHEMICAL OXIDATION......................... ..............................................32
7.1 ISCO Chemicals ...........................................................................................32
7.1.1 Hydrogen Peroxide/Fenton’s Reagent .............................................................33
7.1.2 Peroxodisulfate/Sulfate Free Radical ...............................................................34
7.2 Requirements and Applications ....................................................................36
7.3 Literature Experiences with Fenton’s Reagent .............................................37
7.4 Literature Experiences with Peroxodisulfate .................................................39
7.5 Available Peroxodisulfate ISCO Technology ................................................42
Introduction
_________________________________________________________________________________________________________________________________________________________________________________________________________________
2
7.6 Useful Information for Laboratory Scale Experiments...................................42
8 SYNTHESIS OF OXIDANTS WITH DIAMOND ELECTRODES...... ...................44
8.1 Diamond Electrodes......................................................................................44
8.1.1 Fundamentals and Characteristics of BDD.......................................................44
8.1.2 Fabrication Methods ........................................................................................46
8.1.3 Development of Diamond Electrode Models for the Soil Remediation Project..48
8.2 Applications of Diamond Electrodes .............................................................49
8.2.1 Inorganic Electro Synthesis..............................................................................50
8.3 Practical Approach to Laboratory Scale Experimental Details ......................53
9 DEVELOPMENT OF A NEW REMEDIATION PROCESS........... .......................55
9.1 Spiking of Test Soil .......................................................................................55
9.1.1 Materials and Methods.....................................................................................55
9.1.2 Results and Discussion....................................................................................56
9.1.3 Conclusion .......................................................................................................58
9.2 Treatment of Soil with Peroxodisulfate..........................................................59
9.2.1 Materials and Methods.....................................................................................59
9.2.2 Results and Discussion....................................................................................61
9.2.3 Conclusion .......................................................................................................65
9.3 Generation of Peroxodisulfate with Diamond Electrodes ..............................67
9.3.1 Materials and Methods.....................................................................................67
9.3.2 Results and Discussion....................................................................................71
9.3.3 Conclusion .......................................................................................................77
9.4 Kinetics of Ion Transport in Soil by Electromigration.....................................77
9.4.1 Materials and Methods.....................................................................................78
9.4.2 Results and Discussion....................................................................................82
9.4.3 Conclusion .......................................................................................................87
10 RECOMMENDATIONS AND OUTLOOK ........................ ...................................89
11 RESUME.............................................................................................................91
12 INDICES..............................................................................................................95
12.1 Bibliography ..................................................................................................95
12.2 Tables .........................................................................................................102
12.3 Figures........................................................................................................104
12.4 Abbreviations ..............................................................................................106
ANNEXURE .................................................................................................................I
Introduction
_________________________________________________________________________________________________________________________________________________________________________________________________________________
3
APPENDIX 1 – CONTAMINATED SITES IN AUSTRIA......... .....................................II
APPENDIX 2 – ADDITIONAL ISCO CHEMICALS ............. ....................................... V
APPENDIX 3 – PATENTS............................... ......................................................... VII
APPENDIX 4 – CHEMICAL VAPOR DEPOSITION PROCESS ..... ........................ VIII
APPENDIX 5 - WASTE WATER TREATMENT WITH BDD ELECTRO DES............. X
APPENDIX 6 – DEVICES, CHEMICALS AND SOIL MATERIAL.. ......................... XIII
APPENDIX 7 – CHEMICAL ANALYTICAL METHODS........... ................................XV
APPENDIX 8 – CHROMATOGRAMS......................... ...........................................XVII
APPENDIX 9 – SOIL TEXTURAL TRIANGLE................ ........................................XIX
APPENDIX 10 – LINEAR REGRESSION CALCULATIONS ....... ............................XX
APPENDIX 11 – PHOTOS ....................................................................................XXIII
Introduction
_________________________________________________________________________________________________________________________________________________________________________________________________________________
4
1 Introduction
This master thesis has evolved in the course of the development of a new electrokinetic
remediation method for sites contaminated with organic compounds conducted at the
Institute of Sustainable Waste Management and Technology, University of Leoben. It
includes theoretical considerations on the new technology and a selection of results from
laboratory scale experiences. As the development of the remediation technique will continue
at larger scales, this thesis can only present preliminary results.
1.1 Problem Identification
In Austria, for the year 2006, 40,438 old industrial sites have been localized, whereas organic
pollutants account for 93 % of the contamination. Out of the 93 % more than 40 % of the
sites are affected by mineral oil and phenol. There are about 6,000 gas stations in Austria
declared as contaminated land. [1, p. 13, 16], [2, p. 694]
Soil affected by organic pollutants poses a threat to the environment and human health for
various reasons. Volatile organic compounds escape from top soil layers into the air, where
they can be inhaled by animals or humans. Soluble organics, such as phenol, are highly
mobile in soil and are destined to reach aqueous media. This can lead to groundwater
contamination and spoil potential sources of drinking water [3, p. 24]. Lipophilic (gr. fat
loving) substances, which accumulate in animal and human fat, are immobile in soil due to
their hydrophobicity (not soluble in water). However, they tent to gather as non-aqueous
phase liquids (NAPLs) above or below the water table according to their density, thus
representing a source of constant groundwater contamination [4, pp. 2], [5, p. 30]. Mineral
oils are one typical example for NAPLs.
There are several in-situ methods designed to treat soil contaminated with organic
substances. However, each one of them has crucial drawbacks. Soil vapor extraction only
serves to remove volatile compounds in non-clayey soils. Pump-and-treat is an inefficient
method for NAPL removal and works only in high permeability soils. In-situ soil flushing is
more effective than pump-and-treat considering lipophilic organic contaminants due to the
application of surfactants and/or cosolvents. Nonetheless, the flushing solution will form
canals in the soil system leaving out areas of lower permeability. Thus the method cannot
clean-up a contaminated site completely. If bioremediation methods are applicable, they
need long times for soil treatment. Ex-situ technologies are able to treat soils affected by
NAPLs and other organic compounds. However, they always imply excavation of the
contaminated ground, which means great distortion of the area and additional expenditures
for heavy machinery, treatment and disposal fees. [6, p. 192], [7, pp. 158]
Thus, taking into account the number of contaminated sites and the disadvantages of
existing remediation technologies, it is necessary to work on the development of a new in-
situ treatment technique designed to clean-up soils affected particularly by organic
compounds. The approach taken at the Institute for Sustainable Waste Management and

Introduction
_________________________________________________________________________________________________________________________________________________________________________________________________________________
5
Technology combines two innovative remediation methods. This is for one electrokinetic
treatment (EK) and for another in-situ chemical oxidation (ISCO). This combination promises
to overcome the major shortcomings of the above mentioned established methods, which are
the difficulty of treating low permeability and inhomogeneous soil and the removal of NAPL.
EK guarantees a homogeneous coverage of all soil zones during the treatment and ISCO
chemicals are able to deplete NAPLs and a great variety of other organic compounds [8,
p. 35], [9, p. 4]. A description of the new remediation technology is presented in Chapter 1.3.
1.2 Goals and Targets
This master thesis aims to
1. describe the methodological approach to the development of the new electrokinetic
remediation technique, i.e. clearly present crucial steps taken,
2. work out important parameters for all subsystems of the new technology based on
literature and conducted experiments and
3. discuss the preliminary results and recommend further points of investigation to
enhance the method.
1.3 Electrokinetic Remediation with Diamond Electro des
The Institute for Sustainable Waste Management and Technology aims to develop a new
method of electrochemical in-situ soil remediation. This technique shall be applied to soils
contaminated with organic pollutants. For this work, phenol and diesel have been chosen as
exemplary pollutants, because the new technology is meant to primarily remediate old gas
stations and sites containing hydrocarbons and phenol.
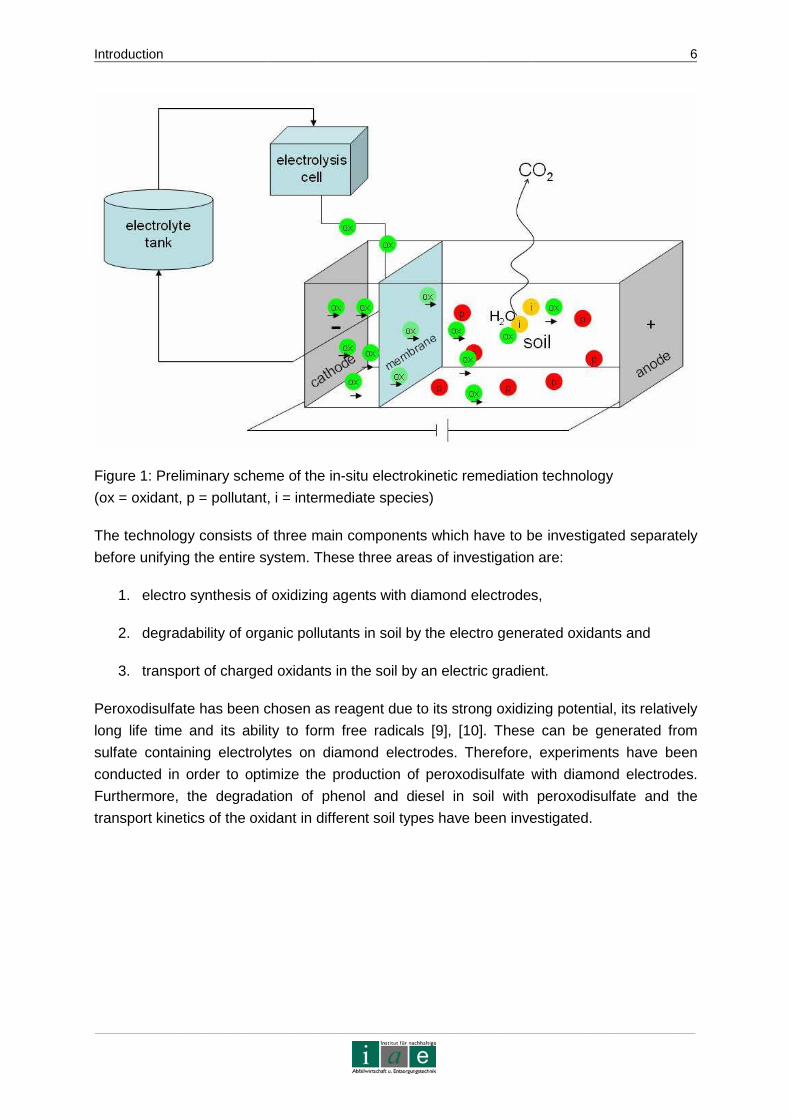
The principal of this remediation approach is the production of oxidizing agents in an
electrolysis cell. From there they are conducted into the soil driven by an electric field which
is generated by electrodes placed in the soil. These force the oxidants to migrate through the
contaminated soil material towards the field anode. The electrochemical cell will be operated
with a diamond electrode provided by the company pro aqua Diamantelektroden Produktion
GmbH. Diamond electrodes are especially apt to produce strong oxidants (see Chapter
8.2.1). The electrolyte is then conducted into a compartment which is subjected to an electric
field produced by a stainless steel cathode and anode. The oxidants enter the soil system
near the negatively charged cathode and are forced to move towards the anode. The fluid
compartment is separated from the soil by a membrane which retains the electrolyte from
entering the soil and allows only the ionic reagents to travel into the remediation site. Within
the soil, the negatively charged oxidizing agents react with organic pollutants and
decompose them, ideally to CO2 and H2O, on their way to the anode. Intermediate species
will be formed during the degradation process. Figure 1 shows a preliminary scheme of the
remediation technology.
Introduction
_________________________________________________________________________________________________________________________________________________________________________________________________________________
6
Figure 1: Preliminary scheme of the in-situ electrokinetic remediation technology
(ox = oxidant, p = pollutant, i = intermediate species)
The technology consists of three main components which have to be investigated separately
before unifying the entire system. These three areas of investigation are:
1. electro synthesis of oxidizing agents with diamond electrodes,
2. degradability of organic pollutants in soil by the electro generated oxidants and
3. transport of charged oxidants in the soil by an electric gradient.
Peroxodisulfate has been chosen as reagent due to its strong oxidizing potential, its relatively
long life time and its ability to form free radicals [9], [10]. These can be generated from
sulfate containing electrolytes on diamond electrodes. Therefore, experiments have been
conducted in order to optimize the production of peroxodisulfate with diamond electrodes.
Furthermore, the degradation of phenol and diesel in soil with peroxodisulfate and the
transport kinetics of the oxidant in different soil types have been investigated.

Chapter 2 - Background Information on Contaminated Sites in Austria
_________________________________________________________________________________________________________________________________________________________________________________________________________________
7
2 Background Information on Contaminated Sites in Austria
There is a need for innovative in-situ remediation techniques to cope with difficulties not yet
overcome. Thus, this chapter aims to give an overview on the issue of contaminated sites in
Austria in order to position the development of a new remediation technology into an overall
context consisting of legal, statistical and technical components.
2.1 Legal Background
The Austrian legal framework on contaminated sites is partly subjected to European
legislature, in this context mainly to directives. European directives need to be transformed
into national laws. Those EU directives dealing with the issue of contaminated sites concern
mostly water resources (drinking water, groundwater) and environmental liability. However,
there is no directive especially addressing the problem of contaminated sites in Europe.
Austrian’s national legislature includes several laws, ordinances and standards for the
management of contaminated areas, i.e. old industrial sites and abandoned landfills. Table 1
gives an overview of applicable laws and their basic concerns. The according standards
include the S series from 2085 until 2089 and 2091. A detailed list can be found in Appendix
1 – Contaminated Sites in Austria.
Table 1: Austrian laws on contaminated sites
Legal Document Concern
Water Act (Wasserrechtsgesetz)
The water act is the most important legal basis for the execution of soil remediation or containment, influencing as well site investigation measures. According to its concern of keeping water resources clean, especially groundwater, legal authorization is needed for the treatment of contaminated sites.
Law for the Clean-up of Contaminated Sites (Altlastensanierungsgesetz)
This law represents the foundation for financing the treatment of contaminated sites. Furthermore, it manages the national registration of potentially contaminated areas and the assessment of their potential hazard. If this evaluation confirms an environmental hazard the status from a potentially contaminated site turns into a registered contaminated site, which is entered into the Austrian atlas of contaminated land. All entries are assigned to priority classes for clean-up measures.
Trade Law (Gewerbeordnung)
The Austrian trade regulations oblige owners of enterprises to take environmental precautions when closing operative areas. They need to assure, that there is no danger to human life and health and no impact on the quality of water resources.
Waste Management Act (Abfallwirtschaftsgesetz)
This law is the legal representation for the principle of sustainability and obliges to take care of resources and only deposit waste free of hazardous potentials for following
Chapter 2 - Background Information on Contaminated Sites in Austria
_________________________________________________________________________________________________________________________________________________________________________________________________________________
8
generations. It also rules the closedown of landfills. Landfill operators have to take measures in order to avoid negative environmental impacts. These measures include site investigation, sampling and even containment or remediative actions.
Law for the Promotion of Environmental Measures (Umweltförderungsgesetz)
This law regulates the financial aid for measures of environmental protection. Considering contaminated sites, these measures include containment and remediation. The financial means are raised by financial contributions regulated by the law for the Clean-up of Contaminated Sites.
2.1.1 Definitions
For the technical context of this master thesis several terminological definitions should be
considered according to ÖNORM S 2089 (1 to 6) and S 2088 (7 to 11):
1. remediation: elimination of the hazard’s origin and effects
2. containment: inhibition of the emission of pollutants hazardous to human health and
the environment
3. on site: treatment of contaminated material directly in the area of the affected site
4. in-situ: treatment of contaminated sites without moving any polluted material
5. ex-situ: treatment of contaminated material after excavation
6. off site: treatment of contaminated material after excavation in another place than the
contaminated site
7. critical value (Grenzwert): minimum or maximum value of a parameter determined in
a legal document
8. benchmark (Orientierungswert): concentration of a substance serving as a
comparative value for the assessment of site risks, it is the basis for local assessment
of individual cases
9. reference value (Referenz- and Hintergrundwert): measured values of a substance
considering regional geogenic and anthropologic impacts
10. inspection value (Prüfwert): if the inspection value is surpassed further investigation
has to be conducted
11. intervention value (Maßnahmen-Schwellenwerte): if the intervention value is
surpassed containment or remediation measures have to be taken.
Chapter 2 - Background Information on Contaminated Sites in Austria
_________________________________________________________________________________________________________________________________________________________________________________________________________________
9
2.1.2 Threshold Values
In the Netherlands, a precursor in the management of contaminated sites in Europe,
standards distinguish three values according to the Risk-Based Assessment of Soil and
Groundwater Quality:
1. target value: below this value the soil is considered clean
2. intervention value: above this value the site is seriously contaminated and
3. intermediate value: the contaminant concentration ranges between the target and
intervention value causing a slight contamination. [11]
Thus, the technology to be developed described in this thesis is an in-situ remediation
technology. Its remedial success can be measured by the ability to reduce the concentration
of a pollutant in the first place below the intervention value and in the second place below the
inspection value. For real site clean-up, remediation goals have to be determined beforehand
according to the mentioned standards in order to be able to evaluate the treatment success.
Inspection or target and intervention values for hydrocarbons and phenol, the contaminants
chosen for this study, are the following according to ÖNORM S 2088-1 and the Netherlands’s
standard (see Table 2):
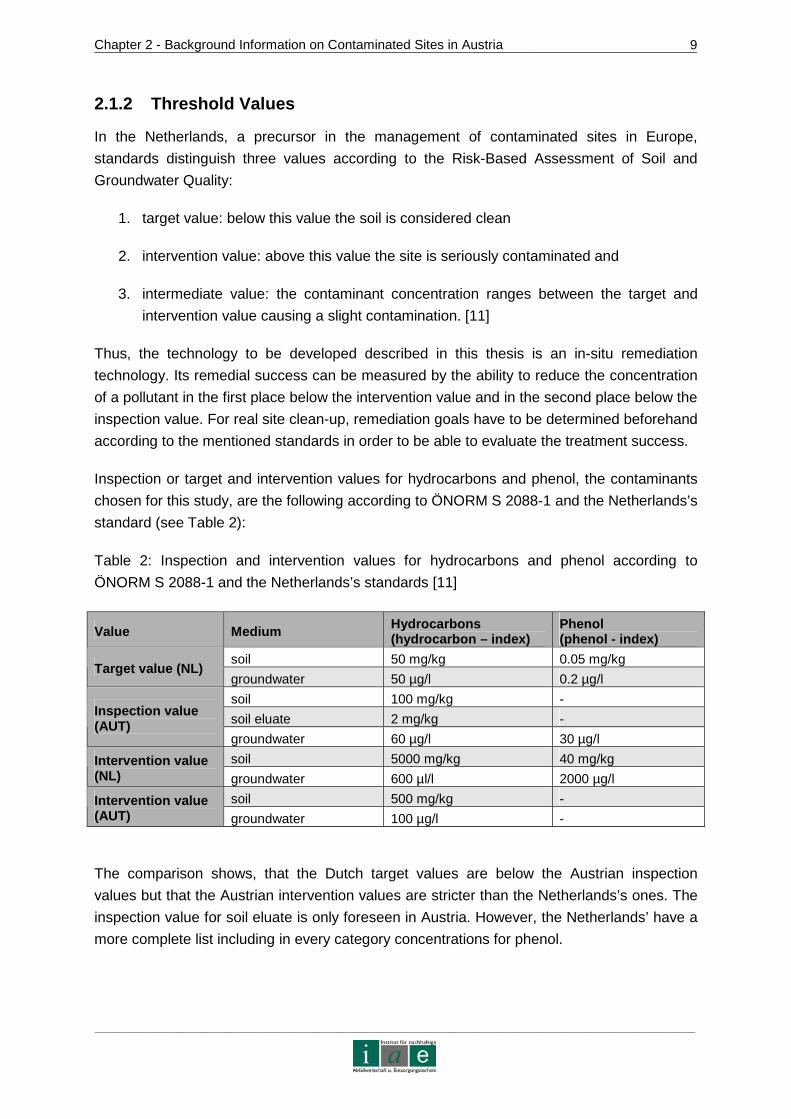
Table 2: Inspection and intervention values for hydrocarbons and phenol according to
ÖNORM S 2088-1 and the Netherlands’s standards [11]
Value Medium Hydrocarbons (hydrocarbon – index)
Phenol (phenol - index)
soil 50 mg/kg 0.05 mg/kg Target value (NL)
groundwater 50 µg/l 0.2 µg/l
soil 100 mg/kg -
soil eluate 2 mg/kg - Inspection value (AUT)
groundwater 60 µg/l 30 µg/l
soil 5000 mg/kg 40 mg/kg Intervention value (NL) groundwater 600 µl/l 2000 µg/l
soil 500 mg/kg - Intervention value (AUT) groundwater 100 µg/l -
The comparison shows, that the Dutch target values are below the Austrian inspection
values but that the Austrian intervention values are stricter than the Netherlands’s ones. The
inspection value for soil eluate is only foreseen in Austria. However, the Netherlands’ have a
more complete list including in every category concentrations for phenol.

Chapter 2 - Background Information on Contaminated Sites in Austria
_________________________________________________________________________________________________________________________________________________________________________________________________________________
10
2.2 Statistics
By January 1, 2006, 45,207 contaminated sites (4,769 abandoned landfills and 40,438 old
industrial sites) have been localized in Austria. It is estimated that about 65 % of the
abandoned landfills and 55 % of the old industrial sites have been reported. This would result
in a total of 80,860 contaminated sites only for Austria. While more than half of the total
number has been reported, only 2,030 have been registered as potentially contaminated
sites, whereas 1,796 sites account for abandoned landfills. Within the number of registered
sites, 81 % pose a threat to groundwater, 10 % to air, 8 % to surface water and 1 % to soil.
Out of the number of registered sites only 162 areas form part of the contaminated land
atlas. 18 of them are in the process of remediation, 25 are being contained. In Appendix 1 –
Contaminated Sites in Austria more detailed Austrian statistics on registered contaminated
sites, potentially contaminated areas and the status of remediative actions for the year 2006
are presented. [1]
In order to estimate the relevance of the new remediation technology for phenol and
hydrocarbon contaminated sites’ treatment, it is necessary to know about the probability of
occurrence of these pollutants in old industrial sites. Diesel oil will mainly be found in old gas
stations, refineries and scrap yards for vehicles. Gas stations make up almost 6,000
contaminated sites in Austria [1, p. 16]. Phenol can be found in a number of sites of industrial
activities, such as mineral coal mining, gas production, refineries, oil treatment facilities,
polymer, paint and varnish production and wood treatment facilities [12]. Figure 2 shows the
kind of branches that account for Austria’s contaminated sites.
Metal Industries
Gas Stations
Automobile services
Wood and Paper Industries
Deposits and Transfer Centers
Chemical Industries
Glas, Ceramics and Construction Material
Textile and LeatherIndustries
Laundry Services
Print Shops
Metal Industries
Gas Stations
Automobile services
Wood and Paper Industries
Deposits and Transfer Centers
Chemical Industries
Glas, Ceramics and Construction Material
Textile and LeatherIndustries
Laundry Services
Print Shops
Figure 2: Branches accounting for contaminated sites in Austria adapted from [1, p. 16]
Chapter 2 - Background Information on Contaminated Sites in Austria
_________________________________________________________________________________________________________________________________________________________________________________________________________________
11
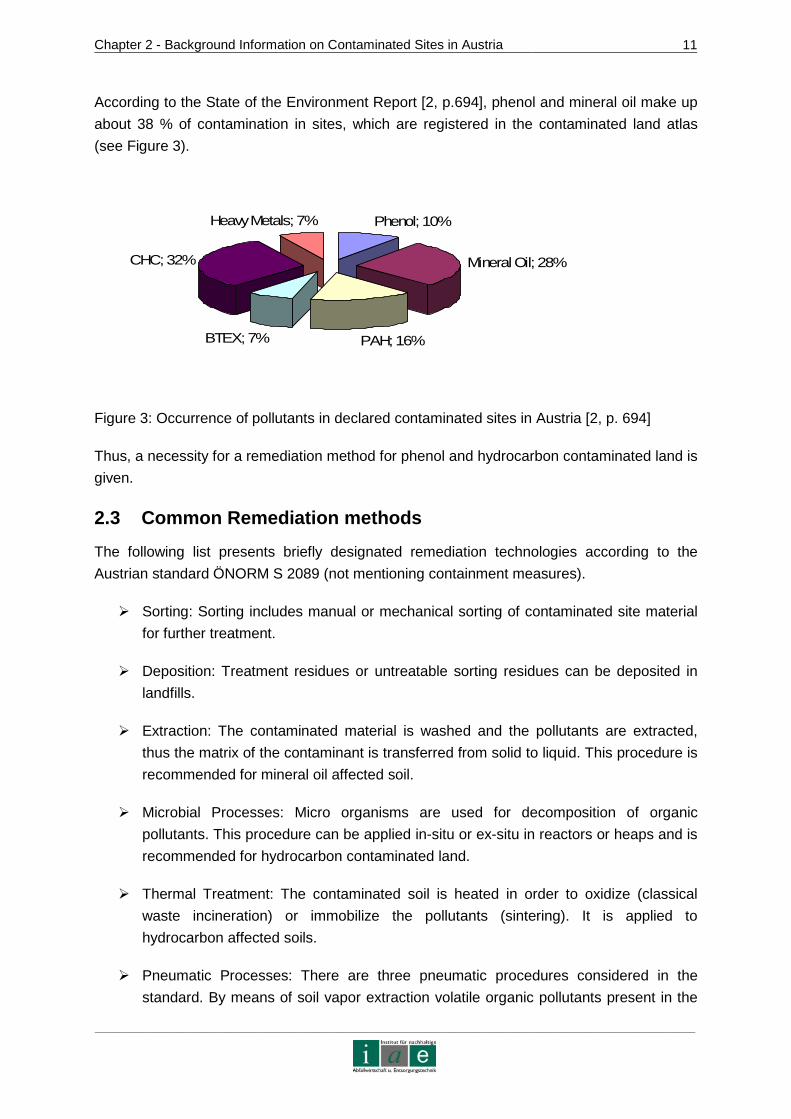
According to the State of the Environment Report [2, p.694], phenol and mineral oil make up
about 38 % of contamination in sites, which are registered in the contaminated land atlas
(see Figure 3).
Phenol; 10%
Mineral Oil; 28%
PAH; 16%BTEX; 7%
CHC; 32%
Heavy Metals; 7%
Figure 3: Occurrence of pollutants in declared contaminated sites in Austria [2, p. 694]
Thus, a necessity for a remediation method for phenol and hydrocarbon contaminated land is
given.
2.3 Common Remediation methods
The following list presents briefly designated remediation technologies according to the
Austrian standard ÖNORM S 2089 (not mentioning containment measures).
Sorting: Sorting includes manual or mechanical sorting of contaminated site material
for further treatment.
Deposition: Treatment residues or untreatable sorting residues can be deposited in
landfills.
Extraction: The contaminated material is washed and the pollutants are extracted,
thus the matrix of the contaminant is transferred from solid to liquid. This procedure is
recommended for mineral oil affected soil.
Microbial Processes: Micro organisms are used for decomposition of organic
pollutants. This procedure can be applied in-situ or ex-situ in reactors or heaps and is
recommended for hydrocarbon contaminated land.
Thermal Treatment: The contaminated soil is heated in order to oxidize (classical
waste incineration) or immobilize the pollutants (sintering). It is applied to
hydrocarbon affected soils.
Pneumatic Processes: There are three pneumatic procedures considered in the
standard. By means of soil vapor extraction volatile organic pollutants present in the
Chapter 2 - Background Information on Contaminated Sites in Austria
_________________________________________________________________________________________________________________________________________________________________________________________________________________
12
vadose zone are removed. Active degassing collects gaseous residues from
microbial decomposition processes. This technology is mainly applied to landfills.
Active aeration is used in order to foster microbial activity in soils.
Pump and Treat: This active hydraulic process extracts soil- and groundwater via
wells from where it is conducted to a water treatment facility. The treated water can
be re-injected into the groundwater, another receiving water course or a sewage
system. Pump and treat is applied in the case of mineral oil contaminated
groundwater.
There is no electrokinetic or in-situ oxidation remediation technology mentioned in the
Austrian legal framework.
Chapter 3 - Soil Characteristics and Contamination
_________________________________________________________________________________________________________________________________________________________________________________________________________________
13
3 Soil Characteristics and Contamination
When developing an electrokinetic soil remediation method it is necessary to know about soil
systems and their parameters, which are responsible for the success of the treatment
method. Additionally, the behaviour of pollutants in the soil matrix has to be studied in order
to be able to target them effectively. This will be discussed in more detail in Chapter 4.
Principally, soil consists of mineral particles originating from weathered rocks, organic matter
such as humic and fulvic acids, water and its solutes and air. Thus, it constitutes the so
called pedosphere, a 3-phase system composed of solid, liquid and gaseous constituents.
Soil is characterized by a large surface, which interacts constantly with the surrounding
environment. Matter and energy enter and leave the open system as they are transferred into
the groundwater, surface water, atmosphere, plants, animals and food, while the pedosphere
operates as storage, filter, buffer and transformation system. Central European soil presents
pH-values between 3 and 8, whereas aging soil is getting more and more acid. Its content of
organic matter varies between 5 and 500 mg/l for agricultural soils and 30 to 500 mg/l for
wood soils. Electrical conductivity ranges from 0.1 to 1.8 mS/cm² and 0.2 to 1.6 mS/cm²
respectively. [13, p.3]
3.1 Soil Parameters
This chapter will describe several soil parameters which are important to the electrokinetic
remediation technique involving chemical in-situ oxidation.
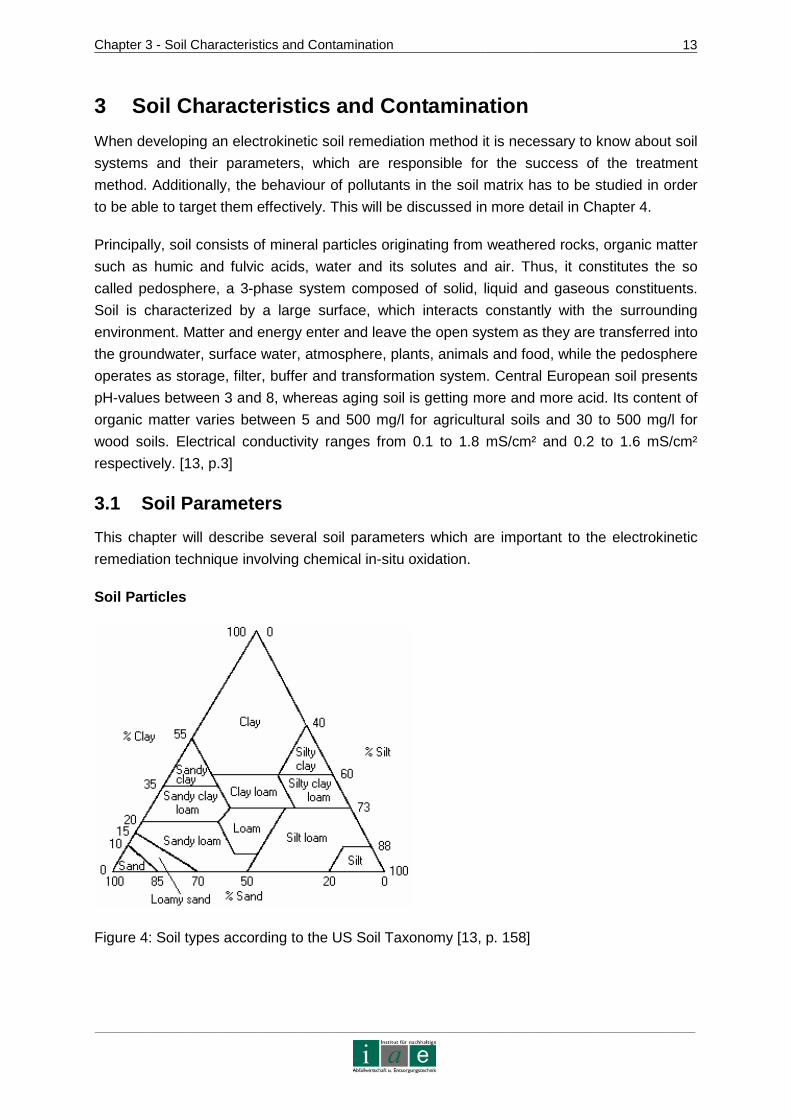
Soil Particles
Figure 4: Soil types according to the US Soil Taxonomy [13, p. 158]

Chapter 3 - Soil Characteristics and Contamination
_________________________________________________________________________________________________________________________________________________________________________________________________________________
14
Particles of different minerals and sizes compose the soil. According to the content of
different particle sizes, soil < 2 mm is called sand (2 mm to 63 µm), loam (63 µm to 2 µm) or
clay (2 µm to 0 µm). Figure 4 shows the internationally used pyramid of US Soil Taxonomy.
Porosity and Water Content
Dependent on its type soil is characterized by a certain porosity and pore water content. The
size of the pores varies with the size of the soil grains. The smaller the particles the smaller
will be the pores. However, three types of pore sizes are distinguished: 1) transmission pores
(> 50 µm diameter), 2) storage pores (0.5 – 50 µm) and 3) residual pores (< 0.5 µm). The
last type of pore is always filled with water even when the soil seems to be dry. Due to the
small size of residual pores, gravity is not strong enough to force the water to percolate into
the groundwater. Storage pores retain water after rainfall for a certain amount of time. When
there is no more water input, the water gradually moves downwards and the pores are
emptied. Transmission pores are not able to retain water for longer periods of time. A soil is
called water saturated when all pores are filled, which occurs after heavy rainfalls. The field
capacity describes the state of humidity when all gravitational water left the soil and is
measured in volume %, the water capacity is measured in mass %. Thus, when the water
content exceeds the field capacity, the soil is called saturated. [14, p. 20], [15, pp. 37]
The soil’s pore space (ps) can be calculated from the ratio between the bulk density and the
particle density (see Eq. 1):
Eq. 1: ( ) %100*1particle
bulkps ρρ−=
The particle density usually ranges between 2.6 and 2.7 g/cm³. [14 , p. 19]
Hydraulic Conductivity
The above described porosity has a direct influence on the permeability of soil, an important
parameter for the electrokinetic remediation. The smaller the particles, i.e. the less porous
the soil, the lower the hydraulic conductivity will be. Sands present a permeability of 10-3 m/s,
clayey soils of 10-9 m/s. Conventional methods, such as pump-and-treat can be applied only
to soils with high hydraulic conductivity close to the permeability value of sand. Soil flushing
still works at 10-5 m/s, whereas EK remediation promises to treat clayey soils as well. [13,
pp. 248]
Thermal conductivity
The most important mechanism of heat conduction in soil is water vapour transport beside
convection and thermal conductivity. It is unusual to find isothermal conditions in soil.
However, the closer to the soil surface the stronger the temperature gradient will be. In more
profound depths temperature will vary less. At 1 m depth, temperatures range between 3 and

Chapter 3 - Soil Characteristics and Contamination
_________________________________________________________________________________________________________________________________________________________________________________________________________________
15
15°C during the year in Central Europe, at 7 m dept h, temperature is almost constant at 8°C.
[13, pp. 257]
3.2 Soil Contamination
Considering only organic soil pollution, the tendency shows that the increasing production of
organic chemical compounds poses a threat to soil conservation. Today about 300 million
tons of organic substances are yearly produced world wide and about 1000 new compounds
are invented each year [15]. A pollutant’s behavior in soil depends on its characteristics.
However, these are known well only for very few substances. The most important parameter
is the contaminant’s persistence. Persistence depends on physical properties such as vapour
pressure, solubility, adsorption and desorption characteristics in soil. Generally, the sum of
the substance’s specific toxicity, its concentration and persistency result in the observed
effect. [13, p.392]
Before considering in detail what happens to a pollutant in soil, basic paths from soil into the
surrounding environment shall be mentioned. These are presented in Figure 5.
soil
soil
soil
soil
soil
micro organisms
animals
plants
animals humans
leachatesurface water
ground waterdrinking water
air plants, animals, humans
animals, humans
soil water, air, organisms
soil
soil
soil
soil
soil
micro organisms
animals
plants
animals humans
leachatesurface water
ground waterdrinking water
air plants, animals, humans
animals, humans
soil water, air, organisms
Figure 5: Possible pathways of soil pollutants into the surrounding environment [13, p. 360]
Once a pollutant gets in contact with soil, there are several pathways to enter other
environmental compartments: the first option in Figure 5 shows that micro organisms and
small animals, which live in the soil or on its surface, as well as plant roots can take up
pollutants. These are then transferred to animals superior in the food chain and finally to
humans. This is called bio magnification. Secondly, the pollutant can also be accumulated in
the leachate if it is water soluble and can so reach surface- or groundwater, which is naturally
transformed into drinking water. Thirdly, the pollutant can be re-transported into the air by soil
air movement and be incorporated by plants, animals and humans. Also, a direct uptake is
possible, especially for playing children. Last, if polluted soil is excavated and transferred to
Chapter 3 - Soil Characteristics and Contamination
_________________________________________________________________________________________________________________________________________________________________________________________________________________
16
another place, i.e. deposited, it can initiate the same four mechanisms as described above.
[13, p. 360]
Considering more in detail what may happen to the soil’s pollutants there are six
mechanisms they are subjected to:
1. Volatilization: Pollutants of low molecular weight and little affinity (little adsorption) to
soil particles leave the soil via the air path especially in areas prone to erosion.
2. Leaching: Water soluble compounds leave the soil with the percolating water and are
not retained by soil particles.
3. Adsorption: Organic pollutants have an affinity for organic soil particles where they
can be adsorbed. The higher the organic content of the soil and the smaller the soil
particles are, the better pollutants are adsorbed. Adsorption can happen in two
phases: 1) during minutes up to a few days a balance between the soil solution and
the solid phase can evolve or 2) in a process called aging, where during several years
the pollutant is bound in a covalent manner to humic substances or diffuses into the
soil matrix. Only if the rate of adsorption is higher than the rate of biological
degradation, there will be an accumulation of pollutants.
4. Biological absorption: Pollutants which are available for plants and soil animals can
be accumulated biologically.
5. Microbial degradation: The soil’s micro organisms do not distinguish between organic
pollutants and organic soil matter as nutrients, so the pollutants might be transformed
into metabolites or even mineralized in micro biological processes. However, this is
only the case if the pollutant is not toxic to the bacteria or does not appear in toxic
concentrations.
6. Chemical degradation: By means of hydrolysis, oxidation, precipitation or exposure to
light contaminants can be chemically degraded or immobilized. [13, pp. 365], [15,
p.166]
Chapter 4 - Pollutants
_________________________________________________________________________________________________________________________________________________________________________________________________________________
17
4 Pollutants
As mentioned in Chapter 3, chemical and physical characteristics of a pollutant determine its
behavior in soil. Thus, it can be localized in different zones in the soil. Roughly, soil can be
divided in the water saturated and vadose (unsaturated) zone. Thus, considering only the
pollutant’s solubility and density it is possible to make an approximation about its residence
area in soil. Volatile organic compounds (VOC), such as gasoline, have temperatures of
ebullition in the range of 60 to 250 °C according t o the WHO. Those are often present in pore
air in the top soil layers from where they escape gradually by volatilization. In these cases,
site clean-up can be realized by soil vapor extraction. However, VOCs with lower vapor
pressure migrate into deeper zones of soil. In the case of non-polar organic liquids like fuel
oils, which have low solubility in water, a separate phase apart from water is formed in the
soil pores. Therefore, they are called non-aqueous phase liquids (NAPLs). They are divided
into LNAPLs (low-dense NAPLs) and DNAPLs (dense NAPLs). LNAPLs have a density
inferior to water and thus form a pool above the water table. DNAPLs are denser than water
and consequently accumulate just above the impermeable stratum in the groundwater. NAPL
contaminated sites are difficult to treat with conventional methods: soil vapor extraction does
not remove all constituents of NAPLs, pump-and-treat will have little success due to the
insolubility of the contaminant in water. Only enhanced soil flushing with surfactants and/or
cosolvents seems to be able to remove the pollutants, beside the option of excavating the
contaminated soil [4, p. iii]. The emerging technology of in-situ chemical oxidation promises
to remediate NAPLs contaminated sites, which are a continuous source of contamination
plumes in groundwater [5, p. 30], [9, p. 4]. Polar organic contaminants, such as phenol, are
able to dissolve in water. Therefore, they are more mobile and migrate with the soil’s pore
water until reaching the groundwater. Thus, they can be found alongside the entire soil depth
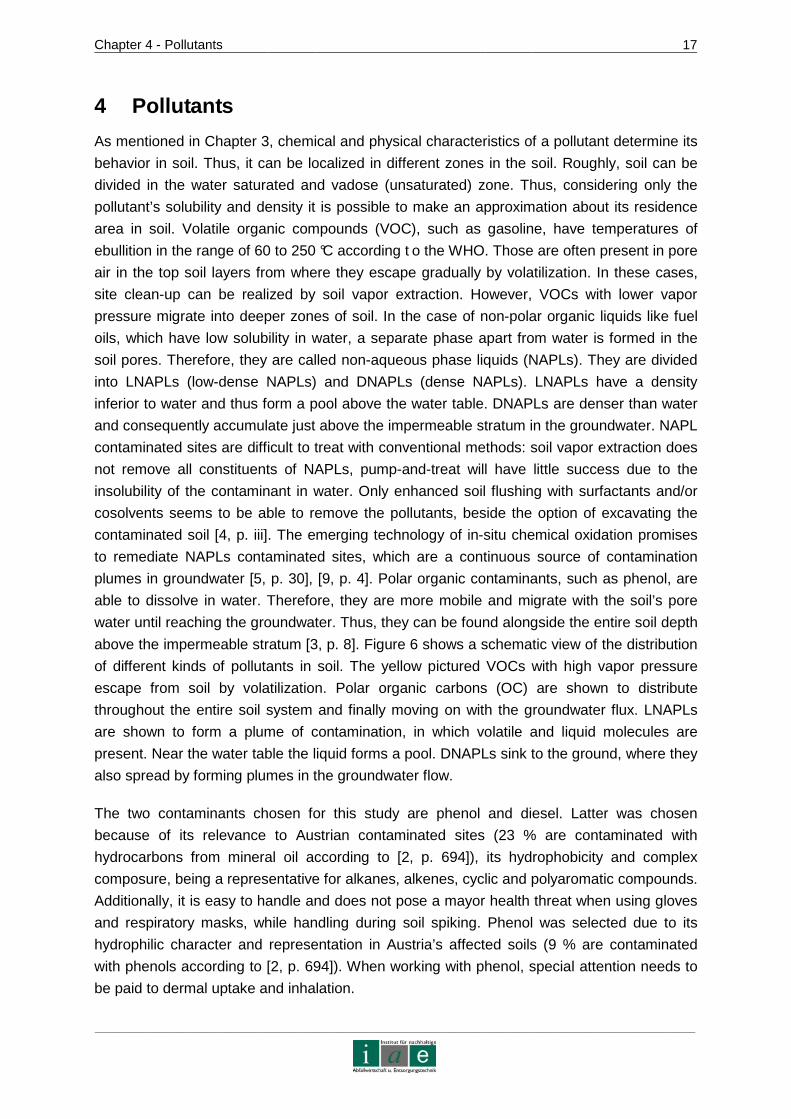
above the impermeable stratum [3, p. 8]. Figure 6 shows a schematic view of the distribution
of different kinds of pollutants in soil. The yellow pictured VOCs with high vapor pressure
escape from soil by volatilization. Polar organic carbons (OC) are shown to distribute
throughout the entire soil system and finally moving on with the groundwater flux. LNAPLs
are shown to form a plume of contamination, in which volatile and liquid molecules are
present. Near the water table the liquid forms a pool. DNAPLs sink to the ground, where they
also spread by forming plumes in the groundwater flow.
The two contaminants chosen for this study are phenol and diesel. Latter was chosen
because of its relevance to Austrian contaminated sites (23 % are contaminated with
hydrocarbons from mineral oil according to [2, p. 694]), its hydrophobicity and complex
composure, being a representative for alkanes, alkenes, cyclic and polyaromatic compounds.
Additionally, it is easy to handle and does not pose a mayor health threat when using gloves
and respiratory masks, while handling during soil spiking. Phenol was selected due to its
hydrophilic character and representation in Austria’s affected soils (9 % are contaminated
with phenols according to [2, p. 694]). When working with phenol, special attention needs to
be paid to dermal uptake and inhalation.
Chapter 4 - Pollutants
_________________________________________________________________________________________________________________________________________________________________________________________________________________
18
Figure 6: Distribution of different types of contaminants in soil
4.1 Phenol
Phenol is a water soluble, 84 g/l at 20 °C, aromati c organic compound and thus highly mobile
in soil and slightly acid in solution [3, p. 8]. The compound is a hazard to groundwater and
drinking water. The final destination of phenol contamination is the aquatic medium. Its fish
toxicity is LC50 5.4 mg/l in 96 hours. It is easily micro degradable under aerobic and
anaerobic conditions, if its concentration does not exceed the toxicity level for
microorganisms, which is about 0.5 g/l [16]. Therefore, it is estimated that phenol’s half live in
soil ranges between a few days up to 300 days, whereas in water it ranges between 10 to
100 days [3, p. 12]. At room temperature, phenol is a solid forming clear to white crystals. It
is mainly uptaken by inhalation and dermal resorption. The maximum allowable
concentration at work places (MAC) is 19 ppm. Oral intake of 1 g phenol and dermal intake
of 10 g can be lethal for humans. Chronic intoxications lead to changes in blood constituency
and harm the kidney. Phenol is used in the production of resins, medicine, pesticides,
lubricants, softeners and others. [16]
Contaminated sites resulting from mineral coal mining, gas production, refineries, oil
treatment facilities, polymer, paint and varnish production and wood treatment facilities
amongst others most probably show presence of phenol together with other contaminants
[12]. Beside contamination by spill in predestined areas as mentioned above, phenol also
enters the environment by vehicle exhaust [3, p.9]. When localized in soil, it needs to be
taken into account that it is a natural constituent of coal tar and a frequent intermediate
product in organic matter decomposition.
Chapter 4 - Pollutants
_________________________________________________________________________________________________________________________________________________________________________________________________________________
19
In chemical analysis phenol and its derivates can be determined by the phenol-index, which
is a spectroscopic method.
4.2 Diesel Oil
Diesel can be characterized as LNAPL as it is hydrophobic. Its solubility in water is 0.01 g/l,
and it has a lower density (810 - 860 kg/m³ at 15 °C) than water [17]. It is composed of
various constituents such as alkanes, isoalkanes, cycloalkanes, alkenes and polyaromatic
hydrocarbons [18, p. 212]. According to the Austrian ÖNORM S 2088-1 diesel has an
average carbon length of C10 – C21. The LD50 value is 2000 mg/kg for rats. The compound is
also toxic to fish. It is adsorbable in soil, almost not biodegradable, but bio accumulative and
non-mobile [17]. It belongs to the petroleum-based hydrocarbons and therefore to the priority
pollutant group defined by the US EPA and EU [13]. Diesel contamination can be found
basically in all places, where fuels are used and spilled. This refers mainly to gas stations,
refineries and scrap yards for vehicles. As it is a very heterogeneous compound, its behavior
in soil is difficult to characterize. Nevertheless, it can be estimated that the short carbon-
chained constituents are volatile and leave the soil via the air path. The long chained
components are mainly hydrophobic and remain over the water table as LNAPL. Aromatic
compounds with polar characteristics might enter the groundwater and pose a threat to
drinking water sources. Therefore, diesel or heating fuel contamination is difficult to handle.
In order to find an appropriate treatment technology, it is important to understand the
behavior of diesel in soil.
The behavior of hydrophobic organic compounds (HOCs) in soil depends on both the
contaminant’s and the soil’s characteristics. Interaction between HOCs and soil can be
described by sorption phenomena, meaning adsorption and absorption. HOCs are adsorbed
to organic or mineral surfaces. They are absorbed mainly into organic matter and
microporous minerals. Absorption into soft organic matter can happen within minutes, while
absorption into hard organic matter can take up to weeks. It is believed that the binding
between hydrophobic particles and soil depends on the soil’s organic matter. Binding
mechanisms are versatile (interaction of functional groups, protonation, van der Waals
interactions etc.). Additionally, the percentage of fine soil particles (clay and silt) seems to be
crucial to HOC binding due to their large surface areas. Clay-sized soil particles present
surface charges, which might provoke the effect that they, when water wetted, repulse
hydrophobic organic matter, which then tends to accumulate in soil organic matter (SOM). [7,
pp. 137]
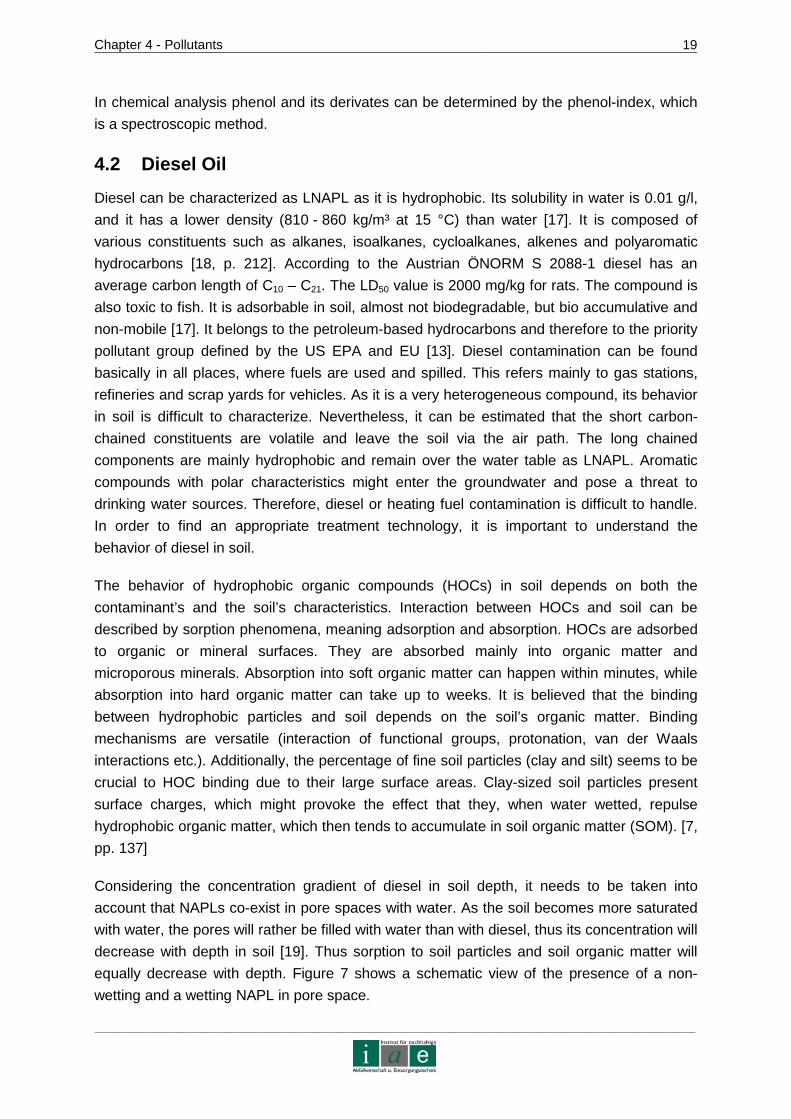
Considering the concentration gradient of diesel in soil depth, it needs to be taken into
account that NAPLs co-exist in pore spaces with water. As the soil becomes more saturated
with water, the pores will rather be filled with water than with diesel, thus its concentration will
decrease with depth in soil [19]. Thus sorption to soil particles and soil organic matter will
equally decrease with depth. Figure 7 shows a schematic view of the presence of a non-
wetting and a wetting NAPL in pore space.
Chapter 4 - Pollutants
_________________________________________________________________________________________________________________________________________________________________________________________________________________
20
Solid
Water
Non-wetting NAPL Wetting NAPL
Solid
Water
Non-wetting NAPL Wetting NAPL
Figure 7: Characteristics of the presence of NAPL in pore water (adapted from [19])
The common analytical parameter for diesel oil detection in contaminated sites is the
hydrocarbon index. This parameter measures the concentration of all carbon chained
molecules between C10 and C40 by means of gas chromatography.
Chapter 5 - Spiking Methodology
_________________________________________________________________________________________________________________________________________________________________________________________________________________
21
5 Spiking Methodology
In order to be able to measure the success of decontamination, the soil needs to be spiked
with the pollutant. As the homogeneous distribution of the substance is the basis for any
interpretation and conclusion drawn from the decomposition results, the spiking methodology
is crucial. It needs to be efficient in order not to spread the pollutant into the surroundings
and reproducible for high confidence in the results. Generally, a spiking method is
considered valid and statistically sound if the coefficient of variance is below 20 %. For
example, a coefficient of 10 % implies that the homogeneity is about 90 %, which means that
any analytical measurement following the spiking is submitted to 10 % of variability [20,
p. 401]. Thus, the coefficient of variance is a parameter of precision. Soil spiking with water
soluble pollutants is less complicated, as the contaminating substance can be dissolved in
water, and will thus not be discussed in detail. However, several organic contaminants are
little water soluble, e.g. diesel oil. In most scientific reports on synthetically contaminated soil
treatment, there is no description of the applied spiking method. Thus, the confidence for the
final results after treatment is not given, due to the lack of information on the homogeneity of
contamination. Brinch et al. [21, p. 1808] suggest that the pollutant can be dissolved in a
hydrophobic solvent and added to the soil sample. Two methods have been investigated: a)
spiking a fraction of the sample, evaporate the solvent and add the rest of the sample or b)
spiking the entire sample and evaporate the solvent. As the solvent can be a disturbance for
the following experiments, method a) seems more suitable, because the solvent’s remains
were less. Watts et al. [18, p. 213] spiked soil with diesel and BTX dissolving equimolar
amounts of each pollutant in pentane, adding the solution to the soil until obtaining a
concentration of 15 mmol/kg. Pentane was then allowed to evaporate. However, there is no
comment on the completeness or extent to which pentane evaporated. Doick et al. [20, p.
400] suggest adding the entire spike to a fraction of the sample and while mixing aggregating
the rest of the specimen. A Waring blender, an adapted bench drill and a stainless steel
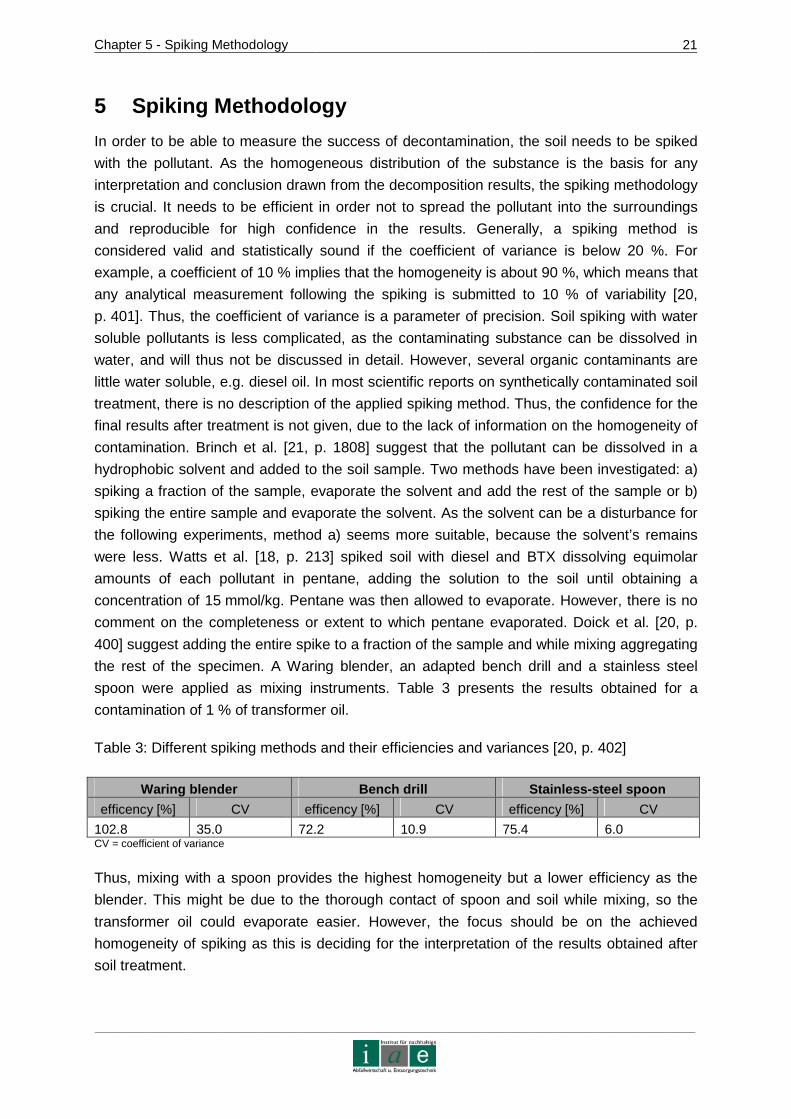
spoon were applied as mixing instruments. Table 3 presents the results obtained for a
contamination of 1 % of transformer oil.
Table 3: Different spiking methods and their efficiencies and variances [20, p. 402]
Waring blender Bench drill Stainless-steel spoon
efficency [%] CV efficency [%] CV efficency [%] CV
102.8 35.0 72.2 10.9 75.4 6.0 CV = coefficient of variance
Thus, mixing with a spoon provides the highest homogeneity but a lower efficiency as the
blender. This might be due to the thorough contact of spoon and soil while mixing, so the
transformer oil could evaporate easier. However, the focus should be on the achieved
homogeneity of spiking as this is deciding for the interpretation of the results obtained after
soil treatment.
Chapter 6 - Electrokinetic Soil Remediation 22
_________________________________________________________________________________________________________________________________________________________________________________________________________________
6 Electrokinetic Soil Remediation
Electrokinetic (EK) soil remediation refers to the application of a direct current via electrodes,
which are implanted into the soil of a contaminated area. Low intensity currents in the range
of mA/cm² cross sectional area or low electrical gradients such as 1 V/cm length are applied
[22, p. 2638]. This remediation approach is an innovative method for the in-situ treatment of
soils contaminated with a number of different pollutants. The process is apt to treat species
such as heavy metals, radioactive elements, nitrates, sulfates, cyanides, polar and non-polar
organic contaminants, halogenated hydrocarbons and mixtures of the mentioned pollutants
[23, p. 103]. The main advantage of EK remediation is that it is able to treat small grained soil
in-situ, particularly with high clay content and low hydraulic conductivity (10-9 m/s), where
traditional techniques such as pump-and-treat have no or incomplete effects [8, p. 35]. The
low hydraulic conductivity is of advantage because the soil can retain water and therefore the
pore liquid can conduct the electrical current [7, p. 160]. Until now, it has been difficult to treat
such soils in-situ with little distortion. EK methods can also be applied to sandy and
unsaturated soils [23, p. 108]. Within EK remediation, there is a variety of mechanisms
involved. For one, EK processes such as electroosmosis, electromigration and
electrophoresis will take place and for another, a number of physicochemical reactions such
as sorption, precipitation, dissolution, oxidation and reduction determine the effect of the
applied technique [6, p. 192], [22, p. 2638], [24, p. 498], [25, p. 117]. In the following chapter
these theoretic aspects will be explained in more detail.
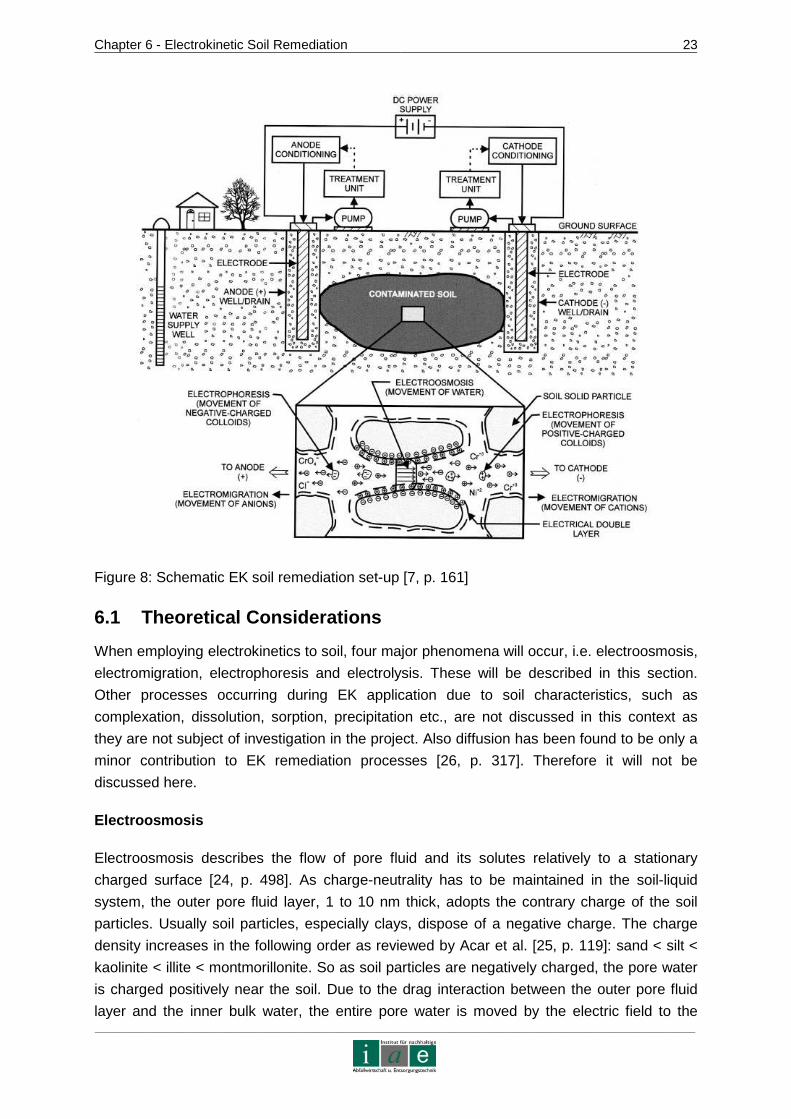
A typical EK remediation system is shown in Figure 8, where the electrodes are inserted via
wells in the soil. The area between the electrodes is subjected to EK processes. Two main
phenomena occur: one, the transport of contaminants via electromigration (migration of ionic
species in an electric field) or two, via electroosmosis (water flux induced by an electric field)
which takes dissolved contaminants with it to the cathode [25, p. 117]. The method which is
being described in this work, however, takes a different approach to EK remediation. The
contaminant, in this case an organic compound, shall not be flushed to either one of the
electrodes but shall be oxidized directly in the soil. Thus, oxidizing agents are introduced into
the electric field and travel into the soil driven by electromigration and electroosmosis.
Chapter 6 - Electrokinetic Soil Remediation 23
_________________________________________________________________________________________________________________________________________________________________________________________________________________
Figure 8: Schematic EK soil remediation set-up [7, p. 161]
6.1 Theoretical Considerations
When employing electrokinetics to soil, four major phenomena will occur, i.e. electroosmosis,
electromigration, electrophoresis and electrolysis. These will be described in this section.
Other processes occurring during EK application due to soil characteristics, such as
complexation, dissolution, sorption, precipitation etc., are not discussed in this context as
they are not subject of investigation in the project. Also diffusion has been found to be only a
minor contribution to EK remediation processes [26, p. 317]. Therefore it will not be
discussed here.
Electroosmosis
Electroosmosis describes the flow of pore fluid and its solutes relatively to a stationary
charged surface [24, p. 498]. As charge-neutrality has to be maintained in the soil-liquid
system, the outer pore fluid layer, 1 to 10 nm thick, adopts the contrary charge of the soil
particles. Usually soil particles, especially clays, dispose of a negative charge. The charge
density increases in the following order as reviewed by Acar et al. [25, p. 119]: sand < silt <
kaolinite < illite < montmorillonite. So as soil particles are negatively charged, the pore water
is charged positively near the soil. Due to the drag interaction between the outer pore fluid
layer and the inner bulk water, the entire pore water is moved by the electric field to the

Chapter 6 - Electrokinetic Soil Remediation 24
_________________________________________________________________________________________________________________________________________________________________________________________________________________
negative cathode [24, p. 498]. A maximum flux of 10-4 (cm³/s*cm²) can be achieved at 1 V/cm
electric field gradient in low activity clays with high water content and low conductivity
(100 µS/cm) according to Acar et al. [25, p. 120]. However, electroosmotic flow can cease
when the counter flow driven by a hydraulic gradient is equal to electroosmosis or when the
surface charge of soil particles is zero [25, p. 118].
Considering that the electric field is homogeneous even in heterogeneous soils, transport of
ions and organic compounds due to electroosmotic advection will occur in every region of the
targeted treatment area. This is an advantage over soil flushing techniques, where the
flushing liquid will take the path of lowest resistance in heterogeneous soils, i.e. areas of
bigger pores [24, p. 498].
Electromigration
The term electromigration refers to the transport of charged ions in solution in the electric
field. They are responsible for the current conduction. In contrast to electroosmosis,
migration is not dependent on soil charge; therefore, it occurs as well in sandy as in clayey
soils. Generally, ion velocity is proportional to the ion charge number and the field strength
[24, p. 498]. However, on the one hand, movement of ions is subjected to their concentration
in the soil solution, which again depends on interactions with the soil such as sorption, ion
exchange, complexation and others. On the other hand the movement depends on their
velocity in the pore liquid, when they are not engaged in any other reaction, which is then a
function of the electric potential gradient and the ion concentration gradient amongst others.
The latter factor is not soil dependent, except for advection by electroosmosis [26, pp. 316,
318]. Due to the number of factors, which interfere with the theoretical ion velocity, the
effective ion mobility is important for EK remediation. This effective mobility is a function of
soil porosity, ion charge and ion diffusion coefficient. It is measured in cm²/Vs. Multiplication
with the electric gradient V/cm leads to the actual ion velocity [22, p. 2641].
Comparing the influence of electromigration and electroosmotic advection on ion transport,
Acar and Alshawabkeh [22, p. 2643] came to the conclusion that transport by migration is
about 10 times higher.
Electrophoresis
Electrophoresis describes the movement of charged particles relative to a stationary liquid
(mirror process of electroosmosis). It is only of relevance if surfactants are used in order to
mobilize hydrophobic pollutants for an electroosmotic advection [22, p. 2642], [24, p. 498].
Electrolysis
At the anode and cathode water electrolysis reactions take place (Eq. 2 and Eq. 3).
Eq. 2: Anode: 2 H2O → 4 H+ + 4 e + O2
Chapter 6 - Electrokinetic Soil Remediation 25
_________________________________________________________________________________________________________________________________________________________________________________________________________________
Eq. 3: Cathode: 2 H2O → H2 + 2 OH-
Thus, the area around the anode becomes acid and around the cathode basic. As the
protons and hydroxyl ions are subjected to the electric field, they start to migrate into the
opposite direction. However, as the proton is about 1.8 times faster than the hydroxyl ion due
to its smaller radius, the system is dominated by an acid front moving towards the cathode,
where it neutralizes the basic front. The final acidity of the soil depends on its buffering
capacity which is linked directly to its cation exchange capacity. The pH-value can drop to
about two near the anode and rise to 12 near the cathode [8, p. 9], [22, p. 2640]. It is
possible to enhance EK remediation by neutralizing the electrolytes near the anode and
cathode in order to save soil from acidification or alkalinization and to inhibit adverse
chemical reactions due to extreme pH-values.
6.2 Methods and Studies on Electrokinetic Remediati on
Electrokinetic remediation techniques have not been applied before the late 1980s. Since
then, a variety of approaches has been investigated and put into practize. This chapter will
give an overview of important technologies and studies on EK remediation.
As conventional methods did not succeed in remediating low hydraulic conductivity soils
without greater distortion of the area, the necessity for the development of in-situ EK
processes rose. Methods, such as pump-and-treat, work in soils with higher hydraulic
conductivity and can clean the soil only from soluble contaminants. Also soil vapour
extraction does not present satisfying results in clayey soils. Soil washing implies the
excavation of contaminated material, which then can be treated in solution containers, where
good cleaning results are obtained. The pollutant is transferred from the soil to the water
matrix which can be treated by regular waste water technology. Another method, in-situ soil
flushing, an enhanced version of pump-and-treat, works with cosolvents or surfactants which
mobilize hydrophobic organic contaminants and is applicable to soils with hydraulic
conductivities as low as 10-5 cm/s [4, p. 5]. Bioremediation processes do not succeed either,
if conditions are more difficult. Low temperatures, the lack of nutrients and too high
concentrations of contaminants which are toxic to the micro organisms let microbiological
techniques fail. Pure heat treatment, with the soil as resistor to electric current, has also been
employed, rising the soil’s temperature up to 100 °C in order to extract vaporized and
volatilized contaminants from soil air. This method, however, is biologically not sound and the
captured gases need to be treated externally. [6, p. 193], [7, pp.158]
Having a look at the evolution of EK techniques, it can be observed that by the late 80’s the
first EK method was patented in the Netherlands. In the early 90’s in the USA, the Lasagna
group started to develop the “Lasagna Process” for the removal of organic compounds. At
the same time in Germany, “Geooxidation” was fostered. In the late 90’s, interest rose in
Asia, Japan and South Korea, and thorough investigation on EK remediation started. In the
following, relevant methods which have been put into practize are briefly presented. [6,
pp. 192]
Chapter 6 - Electrokinetic Soil Remediation 26
_________________________________________________________________________________________________________________________________________________________________________________________________________________
Electro-Bioreclamation
This technique has been developed by a Dutch company for volatile and semi-volatile
organics, NAPLs, heavy fuel oils, PAH and others. AC or DC current is applied for Joule
heating. The soil itself is the resistor and is heated up to 90 °C. At this phase soil vapour and
groundwater are extracted via wells placed between the two electrodes. In a second phase,
thermophilic bacteria inherent to the soil start degrading the organic compounds. As
temperatures decrease the fauna of bacteria changes and continues to decompose the
pollutants. Meanwhile, nutrients are inserted by using the electrical field. [6]
Lasagna Process
This process is focused on removing heavy metals and soluble organic compounds from low
permeability soils. It was applied first in 1995 in the US. The name is derived from the
position of treatment zones between the electrodes, which are placed horizontally into the
soil. For shallow zones, not deeper than 15 m, a vertical placement of electrodes is also
possible. Sorbents, catalytic reagents, buffering solutions and oxidizing agents are
introduced into the soil to create treatment zones. Electric current is applied which drives the
contaminants into the designated areas by electromigration and electroosmosis. These
electrokinetic effects have advantages over traditional hydraulic methods, because the
electric field spreads homogeneously and thus all zones of the contaminated field can be
treated equally. The polarity of the electrodes may be switched in order to force the pollutant
to travel several times through the treatment area. The cathodic effluent can be recycled into
the anode compartment neutralizing the pH-value at the same time. However, a
disadvantage of this process is the difficulty of establishing a good electrical contact with the
electrodes and the entrapment of gases, which evolve in the electrolysis at the electrodes.
[23, pp. 109], [27]
Electro-Klean Process
This process has also been developed in the US. The method can remediate several types
of soils, from permeable to low permeable, and treat heavy metals, radionuclides and certain
volatile organics. A DC current is applied directly to the soil via two electrodes. For
enhancement, mostly acid fluids are added for better heavy metal solubility. The drawback of
this technique is its low efficiency of application in high buffering capacity soils and its poor
applicability to organic compounds. [23, pp. 110]
Electrokinetic Bioremediation
Via an electric field nutrients are inserted into the area of remediation, where they can be
dispersed homogeneously or be directed to a certain point. These nutrients will foster
microorganisms’ growth and their metabolism. The activated microbiological fauna can then
decompose organic pollutants. However, as all methods involving micro organisms, the
Chapter 6 - Electrokinetic Soil Remediation 27
_________________________________________________________________________________________________________________________________________________________________________________________________________________
concentration or the metabolized species of the contaminant may surpass the microbial
tolerance and thus inhibit the remediation process. [23, p. 111]
Electrochemical Geooxidation
An electric field is applied to the soil. Soil particles are supposed to act like anodes and
cathodes, thus each promoting oxidation and reduction processes on their surfaces. The
method is supposed to remediate sites from organic and inorganic species. However, the
success of this method has never been proven and remediation times are long. [6, 193], [23,
p. 111]
Sandia Method - Electrochemical Ion Exchange
Electrodes are placed into porous but conductive ceramic castings in the soil in order to keep
the electrolyte from infiltrating the soil and taking pollutants with it into deeper soil zones.
When current is applied, ionic contaminant species, e.g. heavy metals, move to the electrode
compartment of opposite charge due to electromigration. There they are trapped in the
circulating electrolyte in the ceramic casting, which leads the pollutant through an ion
exchange facility. As the concentration of the ionic contaminant is very low in the electrolyte
the treatment of the effluent becomes very expensive. [23, pp. 111]
Electrosorb
Via electromigration, ionic species move to the electrodes, where they are trapped in a
polymer matrix. This matrix is impregnated with pH-regulators and surrounds the cylindrical
electrodes, which are placed into the soil. Until now, there has not been observed any
disadvantage to this method applied in the US [23, p. 112]. However, it is unable to treat soil
contaminated with non-polar species.
Studies
Beside these applied technologies mentioned above, there are several new methods being
investigated.
Acar et al. [25] succeeded in removing phenol from kaolinite clay soil by electromigration and
electroosmotic advection. As phenol is a polar organic compound, it can protonate in acid
media and therefore travel as any other ion. Removal rates reached up to 95 %. In the same
study, a non-polar organic compound, hexachlorbutadiene, could not be removed without
surfactants (enhanced EK remediation). So it was concluded that successful EK remediation
was only viable for water soluble contaminants.
Yang and Long [28] combined the effects of electrokinetics and the Fenton reaction in order
to mineralize and remove organic contaminants, in that case phenol. The soil was spiked
with a concentration of 200 mg/kg phenol. Experiments lasted 10 days. Near the anode a
permeable wall of iron powder was constructed and hydrogen peroxide was introduced into

Chapter 6 - Electrokinetic Soil Remediation 28
_________________________________________________________________________________________________________________________________________________________________________________________________________________
the electric field via the electrolyte. H2O2 reacts with the iron powder, which functions as a
catalyst and produces hydroxyl radicals - strong oxidizing agents. In a sandy loam soil
sample it was found, that for a decontamination efficiency of 99 % about 32 % resulted from
in-situ oxidation, whereas 67 % were due to ion migration or osmotic advection. However,
the blank experiment without oxidizing agents resulted in 99.8 % removal.
In later studies Yang and Liu [29] used basically the same set-up for trichloroethylene (TCE)
removal. It was found that TCE can be removed up to 89 % in loamy sand, whereas half the
removal is ascribed to in-situ mineralization by hydroxyl radicals. In sandy loam, up to 60 %
of oxidation can be achieved.
Park et al. [30] confirm these results. A sandy soil sample was spiked with phenanthrene and
iron (Fe(II) and Fe°). Hydrogen peroxide was introd uced via osmotic advection into the
system from the anode. It was found, that up to 82 % of phenanthrene could be removed of
which only 31 % accounted for osmotic flow.
In Austria, as part of the INTERLAND project [31] within the scope of the subproject of “In-
situ Generation of Oxidative Substances”, a new approach to EK remediation was tested
(see Figure 9). The cylindrical production anode (a diamond electrode, which is known to be
able to produce strong oxidizing agents, see Chapter 8.2.1), was placed in a hydrocarbon
contaminated area and fed by an electrolyte in order to produce OH° (black point). The
generated oxidants are transported by the electrical field to the field anodes (red points in
Figure 9). On their way they oxidize organic contaminants. The green points represent
sampling points for chemical analysis. Results from laboratory experiments (50 kg soil
material) show that after a period of 256 days, applying the analytical method of the
hydrocarbon-index (HC-index), about 23 % of the organic pollutant were mineralized.
However, in the blank experiment, about 12 % of the original contaminant concentration was
lost, which results in only 11 % degradation. For another experiment, hydrocarbon
contaminated soil has been treated electrochemically during 20 weeks. Final analyses
showed that according to the hydrocarbon-index 56 % and according to the TOC 48 % of the
original pollutant have been eliminated, whereas the blank experiment lost 28 % (HC-index).
In the field experiment, during one month, a reduction of 17 % of the total TOC could be
achieved [31, pp. 538 - 542]. This leads to the conclusion that further experiments have to be
conducted in order to obtain reliable results and to enhance homogenization of the spiked
soil and analysis methods.

Chapter 6 - Electrokinetic Soil Remediation 29
_________________________________________________________________________________________________________________________________________________________________________________________________________________
production electrode
field electrodes
sampling spots
production electrode
field electrodes
sampling spots
Figure 9: Schematic set-up of electrodes for the in-situ generation of oxidizing agents and
their transport through the contaminated soil in the Interland project [31, p.470].
In this study, the basic scheme of the remediation method is different from the methods and
studies mentioned above. It has already been presented in the introduction. An external
production unit, composed of an electrolysis cell with a diamond anode, will produce
peroxodisulfate ions, which are strong oxidants. These will be introduced into the electric
field by circulating the electrolyte between the field cathode and the soil protected by a
membrane. The anionic oxidants are repelled from the cathode and will migrate in the
electric field towards the anode. On their way the peroxodisulfate or its free radicals will
oxidize the organic pollutants, phenol and diesel oil. The supposed advantage of this method
is that it is not dependent on the type of soil. First, the removal of contaminants does not rely
on a strong osmotic flux, because they will be decomposed directly in the soil. Secondly, high
buffer capacity soils will not be of disadvantage, as the method shall be independent of the
soil’s pH-value. Thirdly, the soil may be coarse grained or fine grained as the principal
mobilization of the oxidizing agent will occur by electromigration, which works in both types of
soil. Effects in the vadose and saturated zones have to be explored as above mentioned
studies almost completely focused on saturated soils.
6.3 Considerations and Conclusions for Laboratory S cale Experiments
Before conducting EK soil remediation experiments, a number of parameters have to be
considered. The specification of parameters depends on the type of EK method being
applied and the kind of contaminant. In the following, some common parameter
determinations for the treatment of organic pollutants with electroosmosis, electromigration
and integrated in-situ oxidation shall be presented.

Chapter 6 - Electrokinetic Soil Remediation 30
_________________________________________________________________________________________________________________________________________________________________________________________________________________
I) Soil Type: Soil is very versatile and therefore its selection will determine an
important number of parameters. First, it should be decided if the soil sample shall
be real soil, including the uncertainty of the exact substances of content,
scavengers etc., or a synthetic soil, which can be described precisely but is only a
model of real soil and might exclude difficulties, which later appear in field
experiments. The soil type is also crucial for factors like permeability, particle size,
buffer capacity, sorption reactions, cation exchange capacity, types of minerals
present (and the chemical reactions they might be involved in), pore volume, and
content of organic matter amongst others. All these factors have an influence on
the mobility and chemical reactions of the pollutant in soil. In representative
studies, real soils have been used including kaolinite, sandy loam and loamy sand
[23], [25], [28], [29], [30].
II) Water Content: Mostly saturated soil has been used, as on the field water can be
added easily [25], [28], [29], [30]. However, this could result in a flushing effect.
Therefore, investigation for the vadose soil zone is necessary.
III) Specimen Conditioning: After having decided on a soil type and water content,
the laboratory sample needs to be conditioned before application. This includes
mainly pretreatment of real soils, such as drying, sieving and spiking. Spiking
procedures have been presented in Chapter 5 in detail.
IV) Electrical Parameters: Electrical parameters include the type of current, DC or
AC, and the applied current density in mA/cm² cross sectional area or electrical
gradient in V/cm length. Normally direct current is chosen, but changing poles of
electrodes at slow frequencies can contribute to the system’s equilibrium (water
content). As for the electrical gradient, usually, 1 V/cm is applied [25], [28], [29].
V) Field Electrode Material and Integration: The electrode should be inert and
stable, especially the anode. Graphite, platinum, gold, silver but also titanium and
stainless steel meet the requirements [23, p. 100]. There are basically two
possibilities of integrating the electrodes into the soil system. The first one is to
simply insert the electrodes into the soil sample, the second one is to build an
electrode compartment. When using an electrode compartment, the electrolyte
can be circulated and effluent withdrawn. It is necessary to protect the soil from
the electrolyte, which implies the usage of a membrane or low permeable barriers.
Bentonite has been employed [30] or glass fiber filters sandwiched between nylon
clothes [28], [29]. Furthermore, the electrodes can simply be placed opposite from
each other. In field experiments a variety of arrangement can be tested.
VI) Reactor Arrangement: The experiments can be conducted in one or two
dimensional systems. A one dimensional system would take into account e.g. only
the length, while a two dimensional system would include length and depth. The
system can be open or closed. Both types have been used. Yang and Long [28]
Chapter 6 - Electrokinetic Soil Remediation 31
_________________________________________________________________________________________________________________________________________________________________________________________________________________
and Yang and Liu [29] used a closed system with cylindrical acylic glass, i.e. a soil
column, while Acar et al. [25] and Park et al. [30] worked with open boxes. The
size of a test cell can vary from 10 cm to about 100 cm in length, which implies at
the same time shorter or longer experimental periods. All revised literature
reported horizontal arrangements.
VII) Analysis: Also the analytical method after conducting the experiments has to be
chosen carefully. First of all, a blank run is always necessary in order to estimate
removal effects which are not ascribable to the remediation method (e.g.
vaporization, microbial degradation if microorganisms are present, chemical
reactions with soil substances). Furthmore, the content of soil organic matter has
to be determined beforehand. Many authors having conducted respective
experiments with hydrocarbon and phenol contamination have used gas
chromatography in combination with a flame ionization detector [18], [28], [32],
[33]. Acar et al. [25, p. 126] propose to slice the soil into segments and analyze
each part. Thus, it is possible to conclude, where along the length of the cell the
remediation method succeeds after a certain time.
As for the experiments conducted in the course of this thesis, different soil types have been
chosen. Degradation assays have been conducted separately with synthetic sandy loam
while transportation of ions has been tested on several points of the textural triangle, also
using synthetic samples. The soil’s water content was adjusted near the field capacity. Two
stainless steel electrodes have been placed directly onto the soil. Horizontal and vertical
arrangements have been tried. Analysis has been conducted by slicing the soil into 1 cm
pieces.
Chapter 7 - In-situ Chemical Oxidation 32
_________________________________________________________________________________________________________________________________________________________________________________________________________________
7 In-situ Chemical Oxidation
In-situ chemical oxidation (ISCO) is a relatively new approach to soil and groundwater
remediation, whereas it has been a long established waste water treatment. Oxidizing
agents, aqueous or gaseous, are introduced into soil and/or groundwater at the source of
contamination. These decompose the pollutants, ideally, to water and carbon dioxide or to
less nocuous compounds. The major oxidants used for ISCO are permanganate, ozone,
hydrogen peroxide and peroxodisulfate. As in soil systems a great number of reactants and
conditions can be found, several reactions might take place, amongst which acid/base
reactions, adsorption/desorption, dissolution, hydrolysis, ion exchange, oxidation/reduction
and precipitation are common [9, p. 4]. Pollutants, which can be treated with ISCO chemicals
are: benzene, toluene, ethylbenzene, xylene (BTEX), methyl tert-butyl ether (MTBE),
petroleum hydrocarbons, chlorinated solvents, polyaromatic hydrocarbons (PAH),
polychlorinated biphenyls (PCB), chlorinated benzenes, phenols, organic pesticides and
munitions constituents [34, p. 1], [35, p. 3]. ISCO’s main advantages are: It does not produce
great amounts of residues to be treated, it is a relatively quick method with treatment times of
months up to one year, it can be applied to a variance of different pollutants and works best
at hot spots. Its drawbacks are soil conditions (matrix, soil organic matter and permeability),
low contaminant concentration in large polluted areas, contaminant mixtures, delivery
problems and short-lived oxidants [9, p. 4], [10, p. 5], [34, pp. 1]. Other common methods for
treatment of soil and groundwater contaminated with organic pollutants (as mentioned in
Chapter 4) imply more complicated technical measures. These result, both, in a greater
impact to the contaminated area, even in case of on-site or in-situ treatment, and in higher
expenses. The alternative of bioremediation is often not sufficient due to the toxicity of the
contaminant. But it is ideal for subsequent application to a previous ISCO treatment. Thus,
ISCO seems to be the method with less impact to the site to be treated. Furthermore, few
devices are needed, which saves costs. It is also estimated that remediation times are short.
This chapter will introduce the applied chemicals, their reaction mechanisms, advantages
and disadvantages, experiences and recent studies and the available ISCO technology.
ISCO is relevant to this work, as the electrochemically synthesized oxidants are distributed
via an electric field into the soil matrix, where they will oxidize organic pollutants. The method
described in this work only differs from classical ISCO by the electrokinetic distribution of the
oxidants and their electro synthesis with diamond electrodes.
7.1 ISCO Chemicals
ISCO chemicals have first been applied in waste water treatment. Therefore, chemical
reactions and the applicability to certain pollutants has already been investigated. In Table 4
the standard oxidation potentials of strong oxidizing agents are presented.
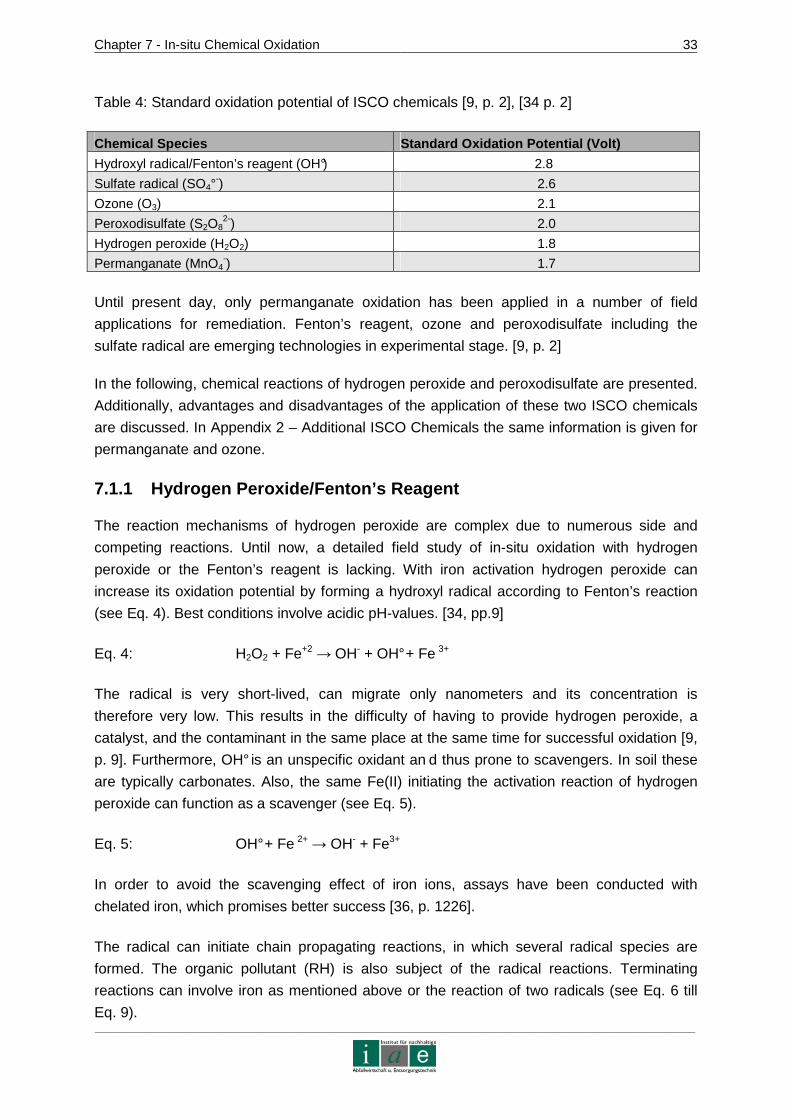
Chapter 7 - In-situ Chemical Oxidation 33
_________________________________________________________________________________________________________________________________________________________________________________________________________________
Table 4: Standard oxidation potential of ISCO chemicals [9, p. 2], [34 p. 2]
Chemical Species Standard Oxidation Potential (Volt)
Hydroxyl radical/Fenton’s reagent (OH°) 2.8
Sulfate radical (SO4°-) 2.6
Ozone (O3) 2.1
Peroxodisulfate (S2O82-) 2.0
Hydrogen peroxide (H2O2) 1.8
Permanganate (MnO4-) 1.7
Until present day, only permanganate oxidation has been applied in a number of field
applications for remediation. Fenton’s reagent, ozone and peroxodisulfate including the
sulfate radical are emerging technologies in experimental stage. [9, p. 2]
In the following, chemical reactions of hydrogen peroxide and peroxodisulfate are presented.
Additionally, advantages and disadvantages of the application of these two ISCO chemicals
are discussed. In Appendix 2 – Additional ISCO Chemicals the same information is given for
permanganate and ozone.
7.1.1 Hydrogen Peroxide/Fenton’s Reagent
The reaction mechanisms of hydrogen peroxide are complex due to numerous side and
competing reactions. Until now, a detailed field study of in-situ oxidation with hydrogen
peroxide or the Fenton’s reagent is lacking. With iron activation hydrogen peroxide can
increase its oxidation potential by forming a hydroxyl radical according to Fenton’s reaction
(see Eq. 4). Best conditions involve acidic pH-values. [34, pp.9]
Eq. 4: H2O2 + Fe+2 → OH- + OH° + Fe 3+
The radical is very short-lived, can migrate only nanometers and its concentration is
therefore very low. This results in the difficulty of having to provide hydrogen peroxide, a
catalyst, and the contaminant in the same place at the same time for successful oxidation [9,
p. 9]. Furthermore, OH° is an unspecific oxidant an d thus prone to scavengers. In soil these
are typically carbonates. Also, the same Fe(II) initiating the activation reaction of hydrogen
peroxide can function as a scavenger (see Eq. 5).
Eq. 5: OH° + Fe 2+ → OH- + Fe3+
In order to avoid the scavenging effect of iron ions, assays have been conducted with
chelated iron, which promises better success [36, p. 1226].
The radical can initiate chain propagating reactions, in which several radical species are
formed. The organic pollutant (RH) is also subject of the radical reactions. Terminating
reactions can involve iron as mentioned above or the reaction of two radicals (see Eq. 6 till
Eq. 9).
Chapter 7 - In-situ Chemical Oxidation 34
_________________________________________________________________________________________________________________________________________________________________________________________________________________
Eq. 6: OH° + H 2O2 → HO2° + H 2O
Eq. 7: HO2° → O2°- + H+
Eq. 8: OH° + RH → R° + OH -
Eq. 9: R° + H 2O2 → ROH + OH°
When applying hydrogen peroxide, special attention has to be paid to heat and gas
evolution. Volatile compounds may escape with the evolving gas into the environment.
Therefore, gas monitoring and extraction is necessary. On the other hand, controlled
exothermic reactions might desorb or dissolve organics and NAPLs and make them available
for degradation. However, DNAPLs can be mobilized as well, resulting in a groundwater
contamination plume. Hydrogen peroxide’s advantages are the high oxidation potential and
the potential to treat mixtures of contaminants. [9, p. 20], [10, pp.6], [18, p. 210], [34,
pp. 9 - 14]
7.1.2 Peroxodisulfate/Sulfate Free Radical
Peroxodisulfate in non-activated and activated form is the newest oxidant in ISCO
applications. Peroxodisulfate has a stability of one to two weeks in soil. Even though, this is
an asset, it has to be considered that S2O82- is kinetically slow in reacting with organic
contaminants [37, p. 1]. Usually, sodium peroxodisulfate is used for in-situ remediation as it
is sufficiently soluble in water and does not produce ammonia like ammonium
peroxodisulfate [9, pp. 19]. Its reactions vary with pH conditions (see Eq. 10 till Eq. 13) [34,
p. 7]:
Eq. 10: S2O82- + 2 H2O → 2 HSO4
- + 0.5 O2 (for pH 7)
Eq. 11: S2O82- + 2 H2O + H+ → 2 HSO4
- + H2O2 (for pH 3 – 7)
Eq. 12: S2O82- + 2 H2O + H+ → 2 HSO4
- + HSO5- (for pH < 3)
Eq. 13 : S2O82- + OH- → HSO4
- + SO42- + 0.5 O2 (for pH > 13)
When heat, UV radiation or a catalyst (mostly Fe2+) is applied, the peroxodisulfate anion
produces sulfate free radicals (see Eq. 14 and Eq. 15) [9, p. 19]. A radical disposes of an
unpaired electron and is therefore highly reactive. The existence of the sulfate free radical
has been proven by absorption spectra. The adsorption wave length is about 450 nm [38,
p. 533]. The sulfate free radical is comparable to the hydroxyl radical in oxidative strength
and in reaction velocity which results from its electrophilicity [39, p. 163].
Eq. 14: S2O82- → 2 SO4°
- (for > 40 °C)
Eq. 15 : Fe2+ + S2O82- → SO4°
- + SO42- + Fe3+
Chapter 7 - In-situ Chemical Oxidation 35
_________________________________________________________________________________________________________________________________________________________________________________________________________________
Other catalysts can be Ag >> Co > Cu, Fe, > Pt listed according to their efficiency [35, p. 4].
Chain propagating reactions are as follows (see Eq. 16 till Eq. 18) [34, p. 8], [37, p. 2]:
Eq. 16: SO4°- + RH → R° + HSO 4
-
Eq. 17: SO4°- + H2O → OH° + HSO 4
-
Eq. 18: SO4°- + OH- → OH° + SO 4
2- (for alkaline pH)
OH° reacts with the organic compound as shown in Eq . 8. Eq. 17 has a very low rate
constant in comparison to the sulfate radical reaction rate with organics (reviewed by [37,
p. 2]). Both radicals, OH° and SO 4°-, can be responsible for the decomposition of organics.
Which one predominates depends on the pH-value. As reviewed by Liang et al. [37, p. 2] the
sulfate radical predominates under acidic conditions, while the hydroxyl radical prevails in an
alkaline environment. Radicals react by three mechanisms with organics: 1) hydrogen
abstraction, 2) hydrogen addition and 3) electron transfer. Sulfate radicals are known to react
rapidly with aromatic compounds and with higher selectivity than OH°. This suggests that
SO4°- reacts rather by an electron transfer mechanism than hydrogen addition or withdrawal
[37, p. 2], [39, p. 163].
The equations above show that the sulfate free radical can initiate a number of radical
reactions, which can lead to the effect that theoretically less than the stoichiometric amount
of peroxodisulfate is needed for pollutant oxidation. Chain terminating reactions take place
between two radicals, in Eq. 19 self decay is presented [38, p. 533], or with the same iron
catalyst as shown in Eq. 20 [34, p. 8]. Thus controlling the amount of the catalyst is
paramount for good oxidation efficiency. This can be achieved by sequential addition of the
catalyst or by chelating it [36, p. 1232], [40, p. 1214].
Eq. 19: SO4°- + SO4°
- → S2O82-
Eq. 20: SO4°- + Fe2+ → SO4
2- + Fe3+
The half life of the sulfate free radical is reported to be about 4 seconds [40, p. 1214]. If Fe2+
is used as catalyst, acidic conditions are needed in order to keep the ion in solution.
However, it also functions as a scavenger. A disadvantage of peroxodisulfate usage is the
drop in pH when peroxodisulfate is degraded. This unbalances the soil system. As
peroxodisulfate is corrosive the equipment material should be chosen carefully [34, pp. 8]. An
advantage of peroxodisulfate over permanganate is that it can oxidize benzene and is
therefore apt to treat BTEX and fuel spill contaminated sites. Furthermore, peroxodisulfate
seems to react to less extent with soil organic matter. Another plus for peroxodisulfate is its
ability to form free radicals, however, the same factor can be a drawback as the
administration of the right mixture of peroxodisulfate and catalyst might be difficult.
Furthermore, information on soil remediation with peroxodisulfate is very rare, and its
application to vadose soil zone has not been reported. [9, pp. 20]
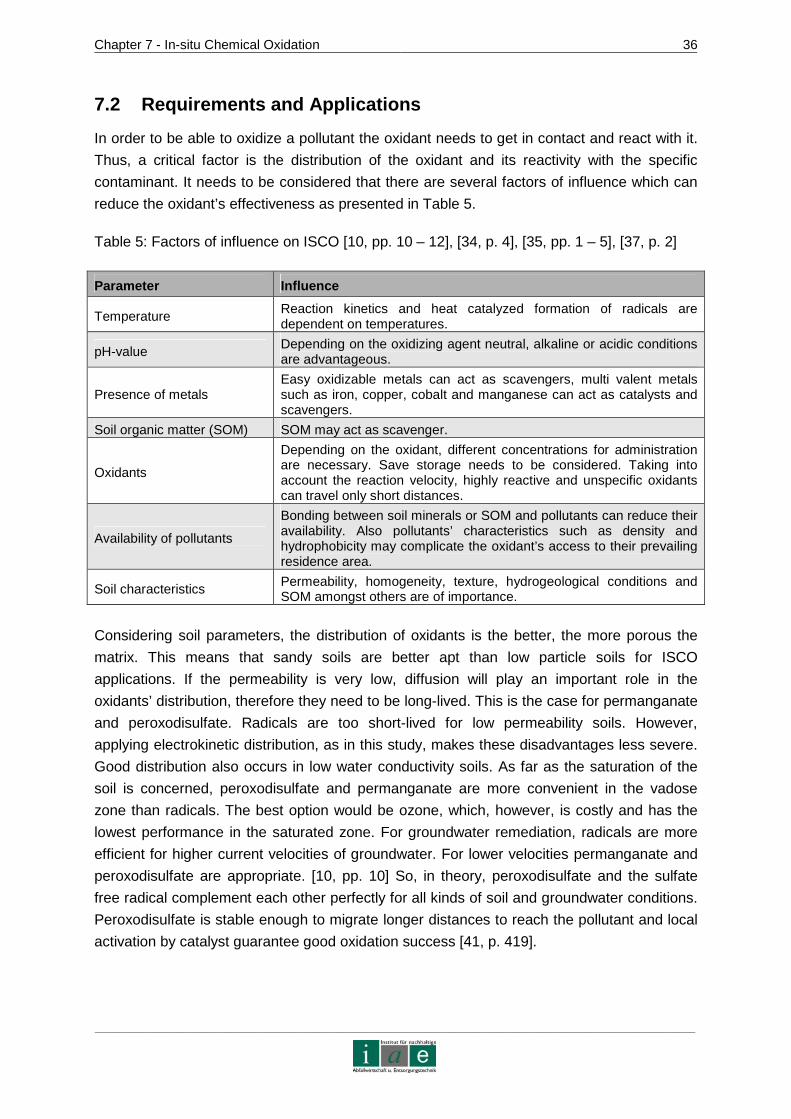
Chapter 7 - In-situ Chemical Oxidation 36
_________________________________________________________________________________________________________________________________________________________________________________________________________________
7.2 Requirements and Applications
In order to be able to oxidize a pollutant the oxidant needs to get in contact and react with it.
Thus, a critical factor is the distribution of the oxidant and its reactivity with the specific
contaminant. It needs to be considered that there are several factors of influence which can
reduce the oxidant’s effectiveness as presented in Table 5.
Table 5: Factors of influence on ISCO [10, pp. 10 – 12], [34, p. 4], [35, pp. 1 – 5], [37, p. 2]
Parameter Influence
Temperature Reaction kinetics and heat catalyzed formation of radicals are dependent on temperatures.
pH-value Depending on the oxidizing agent neutral, alkaline or acidic conditions are advantageous.
Presence of metals Easy oxidizable metals can act as scavengers, multi valent metals such as iron, copper, cobalt and manganese can act as catalysts and scavengers.
Soil organic matter (SOM) SOM may act as scavenger.
Oxidants
Depending on the oxidant, different concentrations for administration are necessary. Save storage needs to be considered. Taking into account the reaction velocity, highly reactive and unspecific oxidants can travel only short distances.
Availability of pollutants
Bonding between soil minerals or SOM and pollutants can reduce their availability. Also pollutants’ characteristics such as density and hydrophobicity may complicate the oxidant’s access to their prevailing residence area.
Soil characteristics Permeability, homogeneity, texture, hydrogeological conditions and SOM amongst others are of importance.
Considering soil parameters, the distribution of oxidants is the better, the more porous the
matrix. This means that sandy soils are better apt than low particle soils for ISCO
applications. If the permeability is very low, diffusion will play an important role in the
oxidants’ distribution, therefore they need to be long-lived. This is the case for permanganate
and peroxodisulfate. Radicals are too short-lived for low permeability soils. However,
applying electrokinetic distribution, as in this study, makes these disadvantages less severe.
Good distribution also occurs in low water conductivity soils. As far as the saturation of the
soil is concerned, peroxodisulfate and permanganate are more convenient in the vadose
zone than radicals. The best option would be ozone, which, however, is costly and has the
lowest performance in the saturated zone. For groundwater remediation, radicals are more
efficient for higher current velocities of groundwater. For lower velocities permanganate and
peroxodisulfate are appropriate. [10, pp. 10] So, in theory, peroxodisulfate and the sulfate
free radical complement each other perfectly for all kinds of soil and groundwater conditions.
Peroxodisulfate is stable enough to migrate longer distances to reach the pollutant and local
activation by catalyst guarantee good oxidation success [41, p. 419].
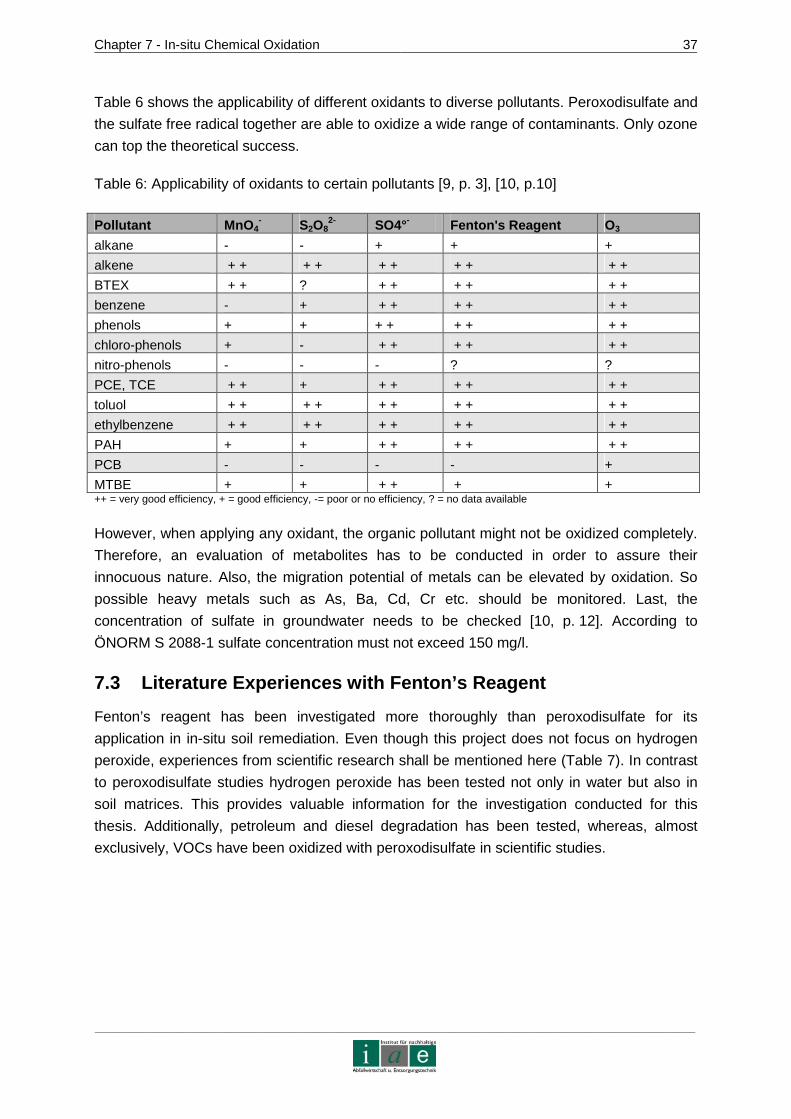
Chapter 7 - In-situ Chemical Oxidation 37
_________________________________________________________________________________________________________________________________________________________________________________________________________________
Table 6 shows the applicability of different oxidants to diverse pollutants. Peroxodisulfate and
the sulfate free radical together are able to oxidize a wide range of contaminants. Only ozone
can top the theoretical success.
Table 6: Applicability of oxidants to certain pollutants [9, p. 3], [10, p.10]
Pollutant MnO4- S2O8
2- SO4°- Fenton's Reagent O3
alkane - - + + +
alkene + + + + + + + + + +
BTEX + + ? + + + + + +
benzene - + + + + + + +
phenols + + + + + + + +
chloro-phenols + - + + + + + +
nitro-phenols - - - ? ?
PCE, TCE + + + + + + + + +
toluol + + + + + + + + + +
ethylbenzene + + + + + + + + + +
PAH + + + + + + + +
PCB - - - - +
MTBE + + + + + + ++ = very good efficiency, + = good efficiency, -= poor or no efficiency, ? = no data available
However, when applying any oxidant, the organic pollutant might not be oxidized completely.
Therefore, an evaluation of metabolites has to be conducted in order to assure their
innocuous nature. Also, the migration potential of metals can be elevated by oxidation. So
possible heavy metals such as As, Ba, Cd, Cr etc. should be monitored. Last, the
concentration of sulfate in groundwater needs to be checked [10, p. 12]. According to
ÖNORM S 2088-1 sulfate concentration must not exceed 150 mg/l.
7.3 Literature Experiences with Fenton’s Reagent
Fenton’s reagent has been investigated more thoroughly than peroxodisulfate for its
application in in-situ soil remediation. Even though this project does not focus on hydrogen
peroxide, experiences from scientific research shall be mentioned here (Table 7). In contrast
to peroxodisulfate studies hydrogen peroxide has been tested not only in water but also in
soil matrices. This provides valuable information for the investigation conducted for this
thesis. Additionally, petroleum and diesel degradation has been tested, whereas, almost
exclusively, VOCs have been oxidized with peroxodisulfate in scientific studies.

Chapter 7 - In-situ Chemical Oxidation 38
Table 7: Summary on contaminant elimination with hydrogen peroxide
Contaminant Elimination Initial contaminant concentration
Hydrogen peroxide amount in ml/g soil and concentration
Catalyst Catalyst concentration Soil type Reaction
time Ref.
diesel 99 % 1000 mg/kg 1 (1.5 M) iron (III) perchlorate 25 mM silty loam 1 h [18]
diesel & kerosene
70 % 1000 mg/kg 1 (35 %) magnetite 5 wt% silica sand 192 h [32]
BTX 95 % 15 mmol/kg 1 (2.5 %) iron (III) sulfate
12.5 mM loamy sand 2 h [42]
nonane 37 % 15 mmol/kg 1 (2.5 %) iron (III) sulfate
12.5 mM loamy sand 2 h [42]
decane 7 % 15 mmol/kg 1 (2.5 %) iron (III) sulfate
12.5 mM loamy sand 2 h [42]
dodecane 1 % 15 mmol/kg 1 (2.5 %) iron (III) sulfate 12.5 mM loamy sand 2 h [42]
TCE 40 % 19.5 g/kg 1.33 (3 %) iron present in sand
0.04 g/kg sand slurry 1 h [5]
TCE 42 % *) 3 g/kg - (3 %) iron present in sand
0.04 g/kg sand -**) [5]
transformer oil > 80 % 17.4 g/kg 1 (0.7 %) iron present in sand
4.52 g/kg sand 72 h [43]
transformer oil 60 % 19.0 g/kg 20 (0.08 %) iron present in peat
2.64 g/kg peat 72 h [43] *) 100 % minus TCE remaining in the sample and in the effluent; **) 5 pore volumes at a velocity of 8.5 cm/h
All assays have been conducted at near neutral pH-value and room temperature

Chapter 7 - In-situ Chemical Oxidation 39
Referring to Watts et al. [42] the outcome of the study is that the more toxic compounds of
diesel, namely BTX, have been destroyed and the health risk is reduced significantly, while
the less toxic aliphatic constituents, i.e. nonane, decane and dodecane, can hardly be
oxidized. Thus, the authors suggest treating only the aromatic part of gasoline contamination
in order to save time and money while revising the applied threshold value and the analytical
method for evaluating the potential danger of gasoline contaminated sites. Two further
studies revealed additional information. Yeh et al. [33] investigated the effect of soil organic
matter (SOM) for the oxidation of chlorophenols with catalyzed hydrogen peroxide in loamy
sand soil. An oxidation – desorption – oxidation scheme is proposed where initially part of the
SOM is oxidized, which leads to desorption of the contaminant, which then is oxidized by the
remaining reagent. Ferguson et al. [44] found that in-situ chemical oxidation of diesel
contaminated Antarctic soil with hydrogen peroxide is not an appropriate technology to solve
the problem. The low temperatures and permafrost soil inhibit successful chemical oxidation.
Activation by heating is not recommendable due to possible melting of the permafrost soil
and the potential spread of the contaminant into deeper soil layers. Thus, ISCO is restricted
for temperate climate zones.
Resuming the outcomes of these studies the following aspects should be considered for
ISCO treatment:
1. Natural occurring iron minerals, such as goethite and magnetite, can enhance the
oxidation process by peroxygen (i.e. hydrogen peroxide) compound activation.
2. When treating multi component contaminants such as gasoline, attention should be
paid to intermediate products; often the more toxic compounds (aromatic
hydrocarbons) are oxidized almost completely reducing the sites hazardous potential,
while the legal threshold value can not be met due to little depletion of aliphatic less
hazardous compounds.
3. SOM should be determined beforehand, as it has great influence on the oxidation
success and efficiency.
4. DNAPLs can be treated, however, solubilization by partial oxidation needs to be
considered and additional groundwater treatment might be necessary.
5. ISCO seems to be inadequate for permafrost regions and extreme cold climate
zones.
7.4 Literature Experiences with Peroxodisulfate
Among the number of oxidants used in soil remediation, peroxodisulfate is the chemical less
investigated [45, p. 552]. In this chapter a number of studies shall be reported (see Table 8)
in order to obtain an overview of peroxodisulfate’s strengths and successful laboratory
application.
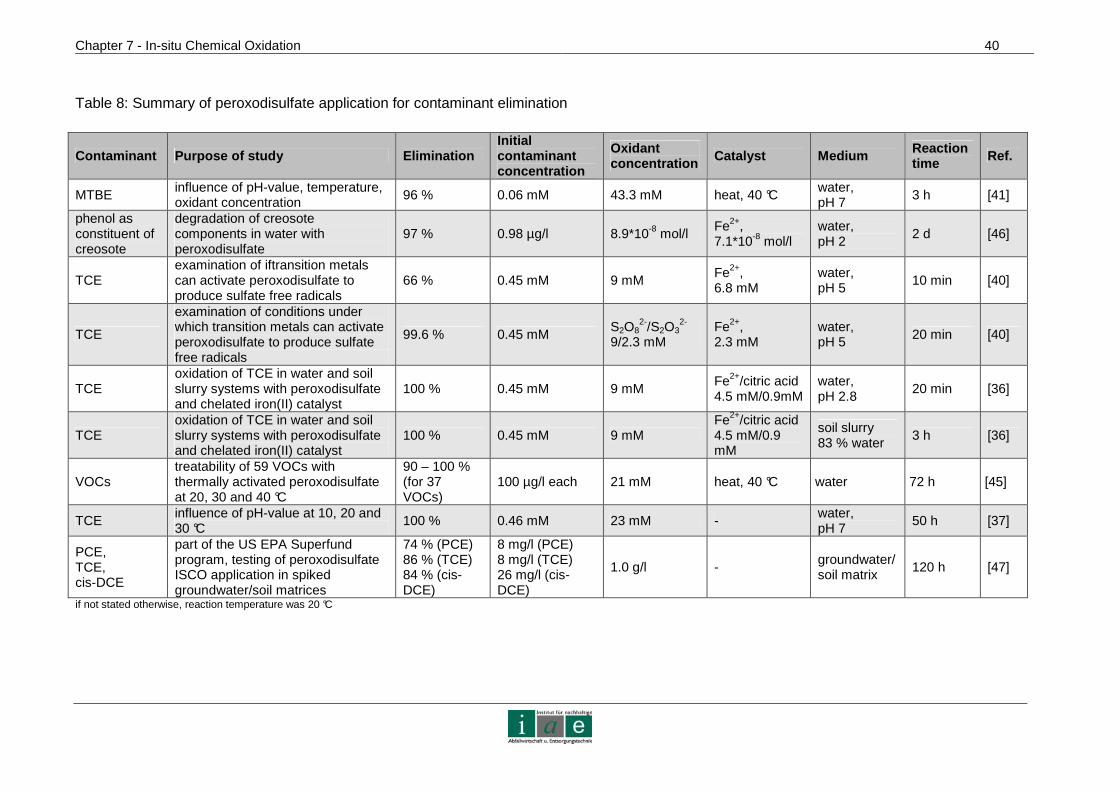
Chapter 7 - In-situ Chemical Oxidation 40
Table 8: Summary of peroxodisulfate application for contaminant elimination
Contaminant Purpose of study Elimination Initial contaminant concentration
Oxidant concentration Catalyst Medium Reaction
time Ref.
MTBE influence of pH-value, temperature, oxidant concentration 96 % 0.06 mM 43.3 mM heat, 40 °C
water, pH 7 3 h [41]
phenol as constituent of creosote
degradation of creosote components in water with peroxodisulfate
97 % 0.98 µg/l 8.9*10-8 mol/l Fe2+, 7.1*10-8 mol/l
water, pH 2
2 d [46]
TCE examination of iftransition metals can activate peroxodisulfate to produce sulfate free radicals
66 % 0.45 mM 9 mM Fe2+, 6.8 mM
water, pH 5
10 min [40]
TCE
examination of conditions under which transition metals can activate peroxodisulfate to produce sulfate free radicals
99.6 % 0.45 mM S2O8
2-/S2O32-
9/2.3 mM Fe2+, 2.3 mM
water, pH 5 20 min [40]
TCE oxidation of TCE in water and soil slurry systems with peroxodisulfate and chelated iron(II) catalyst
100 % 0.45 mM 9 mM Fe2+/citric acid 4.5 mM/0.9mM
water, pH 2.8
20 min [36]
TCE oxidation of TCE in water and soil slurry systems with peroxodisulfate and chelated iron(II) catalyst
100 % 0.45 mM 9 mM Fe2+/citric acid 4.5 mM/0.9 mM
soil slurry 83 % water
3 h [36]
VOCs treatability of 59 VOCs with thermally activated peroxodisulfate at 20, 30 and 40 °C
90 – 100 % (for 37 VOCs)
100 µg/l each 21 mM heat, 40 °C water 72 h [45]
TCE influence of pH-value at 10, 20 and 30 °C
100 % 0.46 mM 23 mM - water, pH 7
50 h [37]
PCE, TCE, cis-DCE
part of the US EPA Superfund program, testing of peroxodisulfate ISCO application in spiked groundwater/soil matrices
74 % (PCE) 86 % (TCE) 84 % (cis-DCE)
8 mg/l (PCE) 8 mg/l (TCE) 26 mg/l (cis-DCE)
1.0 g/l - groundwater/soil matrix
120 h [47]
if not stated otherwise, reaction temperature was 20 °C
Chapter 7 - In-situ Chemical Oxidation
41
With respect to the study conducted by Huang et al. [41], it was found that increasing pH and
ionic strength slow down degradation, whereas higher temperature and oxidant
concentration speed up the reaction. Near neutral pH the half life of MTBE at 50 °C was
found to be 0.3 hours, whereas it is 14.8 hours at 20 °C. The formed MTBE metabolites were
tert-butyl formate, tert-butyl alcohol, acetone and methyl acetate, which are all degradable by
peroxodisulfate. However, results in groundwater were less successful than in synthetic
solutions, probably due to the presence of scavenger carbonates. It is suggested to do
further testing on this oxidation technology for groundwater and soil systems. Huang et al.
[45] revealed that compounds with carbon – carbon double bonding and benzene rings
attached to functional groups were degraded more rapidly. In contrast, saturated
hydrocarbons and halogenated alkanes were difficult to deplete. According to Liang et al.
[37] best degradation occurs at pH 7. Half lives of TCE at 10, 20 and 30 °C are 116, 35 and 6
h respectively. Thus, the influence of temperature is evident. Furthermore, the reduction
rates slow down with increasing and decrasing pH-values. If not controlled, pH will drop due
to the nature of the peroxodisulfate reaction. A prior study realized by Balasz [35] tested
several transition metal catalysts for degradation of ethylene glycol, 1,3-dichloro-2-propanol,
1,1,1-trichloroethane and tributyl-phosphate with peroxodisulfate. The aqueous solution was
acidified. Experiments were run at 80°C. It was fou nd that the following metals are apt for
catalysis: Ag >> Co > Cu, Fe > Pt. The authors recommend applying an oxidant
concentration of at least 0.5 M for optimal efficiency for treatment of chlorinated organics.
Concluding from the findings of the above mentioned studies, the following aspects should
be considered for the in-situ oxidation with peroxodisulfate:
1. The influence of temperature needs to be taken into account. Laboratory experiments
were conducted in a range of temperatures between 80 and 10 °C, finding that the
half life for TCE is 21 times longer at 10 °C than at 30 °C. Temperature conditions in
soil are likely to be around 10 °C.
2. Both, increase and decrease in pH diminish the performance of peroxodisulfate
remediation. Due to the nature of peroxodisulfate reactions, the pH-value will
decrease. Thus, it is recommendable to control pH conditions.
3. As for hydrogen peroxide, the same difficulty with catalysts applies: the same ion, i.e.
Fe(II), which serves as catalyst, can turn into a scavenger. The solution of chelated
iron complexes does not seem to be as successful in soil application according to
Dahmani et al. [47, p. 139]. Also carbonates in groundwater impede good
performance of peroxodisulfate remediation.
4. The pollutants tested in the above mentioned studies include mainly chlorinated
compounds and VOC. The oxidation of aliphatic pollutants and contaminants with a
variety of organic compounds, such as diesel, has not been investigated yet.
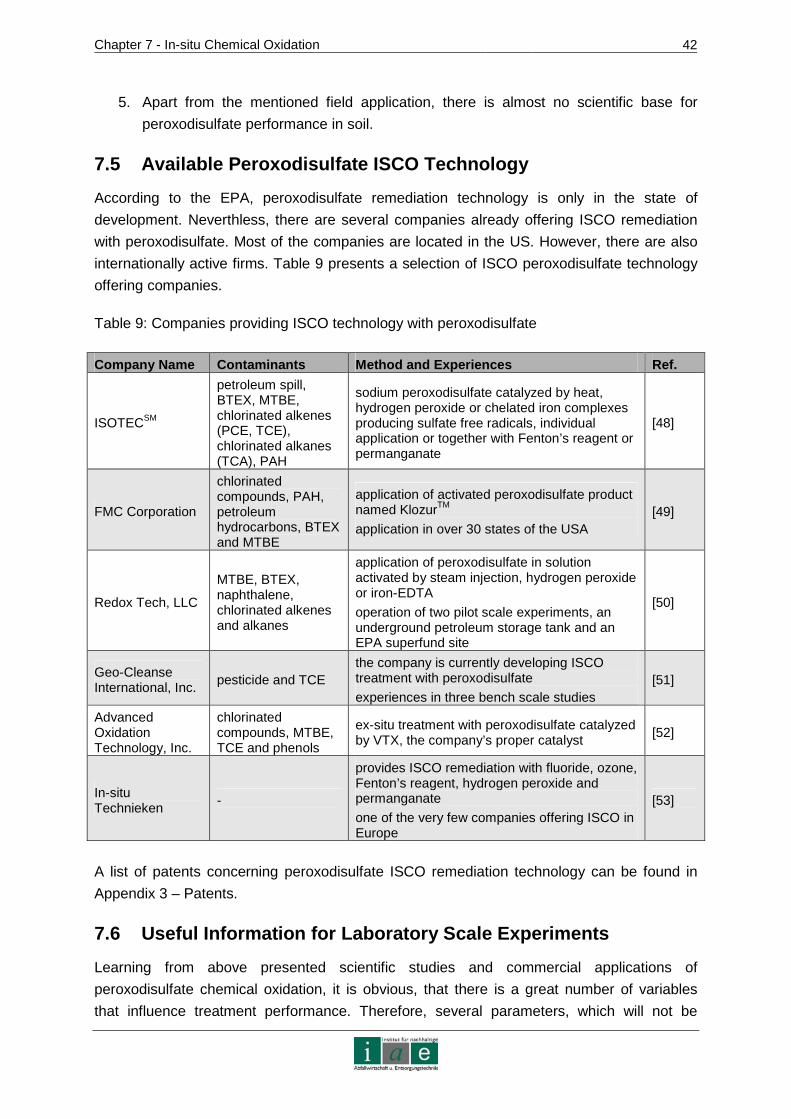
Chapter 7 - In-situ Chemical Oxidation
42
5. Apart from the mentioned field application, there is almost no scientific base for
peroxodisulfate performance in soil.
7.5 Available Peroxodisulfate ISCO Technology
According to the EPA, peroxodisulfate remediation technology is only in the state of
development. Neverthless, there are several companies already offering ISCO remediation
with peroxodisulfate. Most of the companies are located in the US. However, there are also
internationally active firms. Table 9 presents a selection of ISCO peroxodisulfate technology
offering companies.
Table 9: Companies providing ISCO technology with peroxodisulfate
Company Name Contaminants Method and Experiences Ref.
ISOTECSM
petroleum spill, BTEX, MTBE, chlorinated alkenes (PCE, TCE), chlorinated alkanes (TCA), PAH
sodium peroxodisulfate catalyzed by heat, hydrogen peroxide or chelated iron complexes producing sulfate free radicals, individual application or together with Fenton’s reagent or permanganate
[48]
FMC Corporation
chlorinated compounds, PAH, petroleum hydrocarbons, BTEX and MTBE
application of activated peroxodisulfate product named KlozurTM
application in over 30 states of the USA [49]
Redox Tech, LLC
MTBE, BTEX, naphthalene, chlorinated alkenes and alkanes
application of peroxodisulfate in solution activated by steam injection, hydrogen peroxide or iron-EDTA
operation of two pilot scale experiments, an underground petroleum storage tank and an EPA superfund site
[50]
Geo-Cleanse International, Inc.
pesticide and TCE the company is currently developing ISCO treatment with peroxodisulfate
experiences in three bench scale studies [51]
Advanced Oxidation Technology, Inc.
chlorinated compounds, MTBE, TCE and phenols
ex-situ treatment with peroxodisulfate catalyzed by VTX, the company’s proper catalyst
[52]
In-situ Technieken
-
provides ISCO remediation with fluoride, ozone, Fenton’s reagent, hydrogen peroxide and permanganate
one of the very few companies offering ISCO in Europe
[53]
A list of patents concerning peroxodisulfate ISCO remediation technology can be found in
Appendix 3 – Patents.
7.6 Useful Information for Laboratory Scale Experim ents
Learning from above presented scientific studies and commercial applications of
peroxodisulfate chemical oxidation, it is obvious, that there is a great number of variables
that influence treatment performance. Therefore, several parameters, which will not be
Chapter 7 - In-situ Chemical Oxidation
43
changed during the laboratory investigation, have to be determined in advance in order to
keep the number of assays reasonable. The following list will give an overview of aspects to
consider.
Soil Characteristics : In order to produce a wide spectrum of results that cover a
large number of different soils and its characteristics the following important
parameters have to be considered:
1) Soil permeability and particle sizes are important for the administration of oxidants
and the probability of contact between oxidant and pollutant.
2) Soil organic matter has an influence on the strengths of sorption of organic pollutants
to the soil and their availability for chemical oxidation. It also functions as a
scavenger.
3) On the one hand, metals can act as catalysts as in the case of iron, but on the other
hand can function as scavengers. Additionally, heavy metals can be mobilized by
oxidation or in an acidic environment.
4) Treatment success in saturate and vadose conditions should be determined.
Temperature: The influence of temperature on the reaction kinetics and therefore the
remediation time needs to be taken into account. Therefore, simulating subsurface
soil conditions would be adequate, i.e. working with temperatures around 8 to 15 °C.
Pollutant: According to the selection of pollutants it might be necessary to analyze
intermediate species as in the case of diesel oil, where aromatic compounds are
rather oxidized than aliphatic constituents, in order to determine the actual reduction
of hazard potential.
pH-Value: The development of pH conditions should be monitored as it is known that
pH will drop decreasing the remediation performance.
Oxidant and Catalyst: The concentrations of peroxodisulfate and its catalyst should
be varied in order to find an optimal combination for a group of pollutants. It has to be
kept in mind, that an overdose of catalyst might have adverse effects, namely the
catalyst turning into a scavenger.
For the laboratory experiments of this study, it has been decided to work at a temperature of
about 15 to 17 °C in a dark surrounding in order to avoid heat and UV catalysis. Furthermore,
one cyclic and one multi component pollutant were chosen, namely phenol and diesel oil.
The spiked soil was mixed directly with the oxidant in order to exclude the possible lack of
contact between peroxodisulfate and pollutant. Likewise, the influence of soil organic matter
is not considered as the chosen soil type does not dispose of any natural organic
compounds. The water content was set at 20 % on a wet basis. Thus, in a first series of
experiment only the concentration of peroxodisulfate and general presence of a catalyst were
investigated.
Chapter 8 - Synthesis of Oxidants with Diamond Electrodes
44
8 Synthesis of Oxidants with Diamond Electrodes
This chapter will focus on several aspects concerning diamond electrodes. First, diamond
electrodes will briefly be characterized and their advantages will be pointed out. Then, the
specific electrodes used for this work and their development in the course of the project will
be described. Finally, the production of oxidants, especially peroxodisulfate, is explained,
before giving useful details for laboratory scale experiments involving diamond electrodes.
8.1 Diamond Electrodes
The first reports on diamond electrochemistry were written by the early 1980s, more
thorough investigation was conducted from the 1990s on, when applications in electro
analysis and electrochemical water treatment were fostered [54, pp. 3]. Boron-doped
diamond electrodes (BDD) consist of a substrate, on which diamond crystals are implanted
or deposited and resemble semi metallic conductors. By now, BDD are commercially used in
electro analysis, waste water treatment and electro synthesis of inorganic and organic
compounds.
8.1.1 Fundamentals and Characteristics of BDD
Diamond electrodes offer several advantages in comparison to other electrodes. Some of
BDD electrodes’ special characteristics are:
extremely wide potential window of water stability,
ability of synthesis of strong oxidizing agents,
resistance from fouling and
chemical stability in aggressive media. [55, p. 1950], [56, p. 1062], [57], [54, p.2], [58,
p. 26]
BDD electrodes have shown advantages over several traditional electrodes and their
applications. Titanium/metal-oxide electrodes (Pt, Sn, Sb, As, Nb, Zr, Pb) have been tested
for the decomposition of organic pollutants and electro synthesis of oxidants. However, they
present a number of disadvantages, such as the formation of chloro-organic compounds, low
current efficiency and the inability of mineralizing organic species. Lead-dioxide electrodes
decompose themselves during utilization by releasing lead ions into the electrolyte. Platinum
electrodes are prone to corrosion and have also lower current efficiencies, especially in the
application of oxidants’ synthesis (see Figure 16). Graphite or carbon-based electrodes
produce carbon dioxide during operation by decomposing themselves. Tinoxide electrodes
present a limited service life and iridumoxide electrodes only provide selective oxidation of
organic composites [59, p. 192], [60, pp. 24].
A further important advantage of BDD electrodes is their chemical inertness. They show high
corrosive stability even in acidic fluoride media and dispose of an inert surface with low
adsorption properties, which inhibits fouling [59, p. 192]. As far as reaction mechanisms on
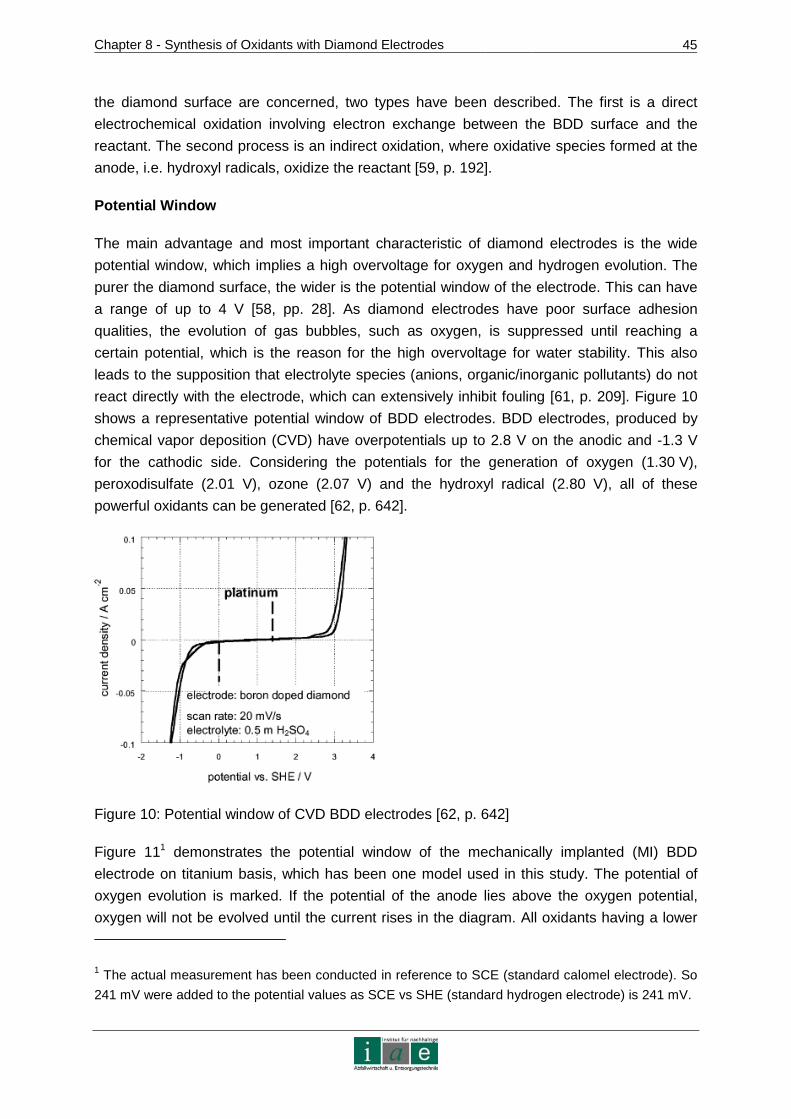
Chapter 8 - Synthesis of Oxidants with Diamond Electrodes
45
the diamond surface are concerned, two types have been described. The first is a direct
electrochemical oxidation involving electron exchange between the BDD surface and the
reactant. The second process is an indirect oxidation, where oxidative species formed at the
anode, i.e. hydroxyl radicals, oxidize the reactant [59, p. 192].
Potential Window
The main advantage and most important characteristic of diamond electrodes is the wide
potential window, which implies a high overvoltage for oxygen and hydrogen evolution. The
purer the diamond surface, the wider is the potential window of the electrode. This can have
a range of up to 4 V [58, pp. 28]. As diamond electrodes have poor surface adhesion
qualities, the evolution of gas bubbles, such as oxygen, is suppressed until reaching a
certain potential, which is the reason for the high overvoltage for water stability. This also
leads to the supposition that electrolyte species (anions, organic/inorganic pollutants) do not
react directly with the electrode, which can extensively inhibit fouling [61, p. 209]. Figure 10
shows a representative potential window of BDD electrodes. BDD electrodes, produced by
chemical vapor deposition (CVD) have overpotentials up to 2.8 V on the anodic and -1.3 V
for the cathodic side. Considering the potentials for the generation of oxygen (1.30 V),
peroxodisulfate (2.01 V), ozone (2.07 V) and the hydroxyl radical (2.80 V), all of these
powerful oxidants can be generated [62, p. 642].
Figure 10: Potential window of CVD BDD electrodes [62, p. 642]
Figure 111 demonstrates the potential window of the mechanically implanted (MI) BDD
electrode on titanium basis, which has been one model used in this study. The potential of
oxygen evolution is marked. If the potential of the anode lies above the oxygen potential,
oxygen will not be evolved until the current rises in the diagram. All oxidants having a lower
1 The actual measurement has been conducted in reference to SCE (standard calomel electrode). So
241 mV were added to the potential values as SCE vs SHE (standard hydrogen electrode) is 241 mV.
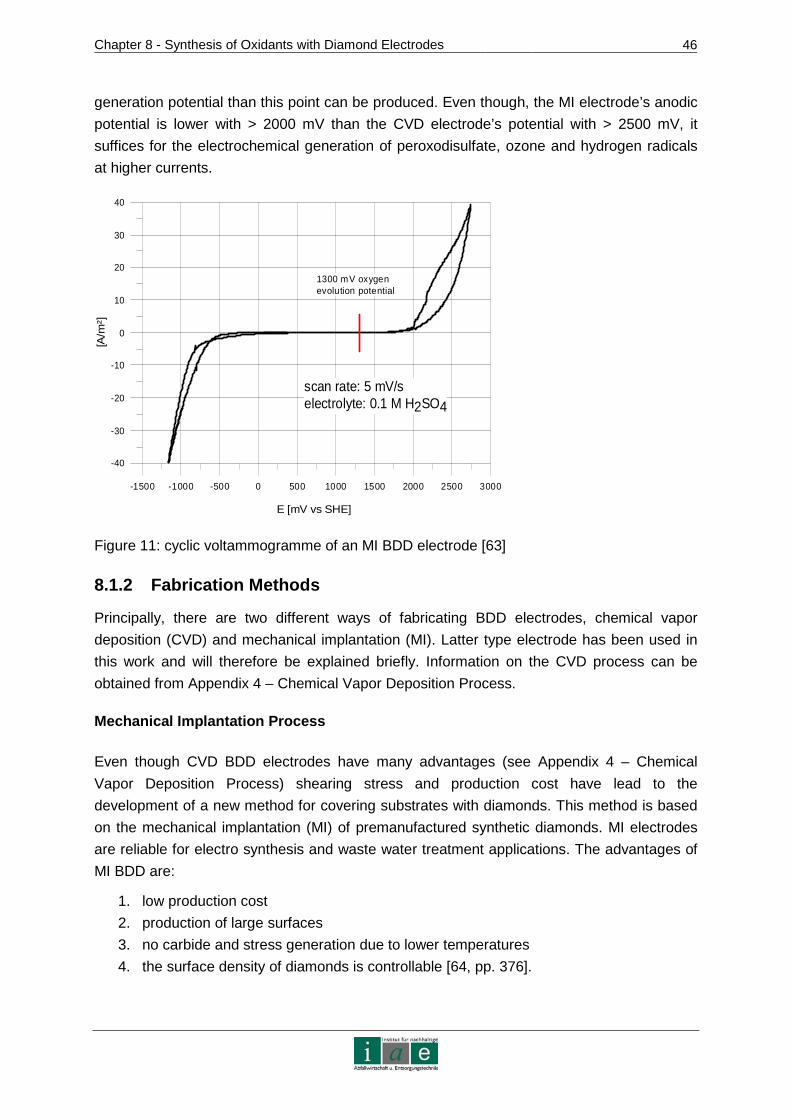
Chapter 8 - Synthesis of Oxidants with Diamond Electrodes
46
generation potential than this point can be produced. Even though, the MI electrode’s anodic
potential is lower with > 2000 mV than the CVD electrode’s potential with > 2500 mV, it
suffices for the electrochemical generation of peroxodisulfate, ozone and hydrogen radicals
at higher currents.
-1500 -1000 -500 0 500 1000 1500 2000 2500 3000
E [mV vs SHE]
-40
-30
-20
-10
0
10
20
30
40
[A/m
²]
scan rate: 5 mV/selectrolyte: 0.1 M H2SO4
1300 mV oxygen evolution potential
Figure 11: cyclic voltammogramme of an MI BDD electrode [63]
8.1.2 Fabrication Methods
Principally, there are two different ways of fabricating BDD electrodes, chemical vapor
deposition (CVD) and mechanical implantation (MI). Latter type electrode has been used in
this work and will therefore be explained briefly. Information on the CVD process can be
obtained from Appendix 4 – Chemical Vapor Deposition Process.
Mechanical Implantation Process
Even though CVD BDD electrodes have many advantages (see Appendix 4 – Chemical
Vapor Deposition Process) shearing stress and production cost have lead to the
development of a new method for covering substrates with diamonds. This method is based
on the mechanical implantation (MI) of premanufactured synthetic diamonds. MI electrodes
are reliable for electro synthesis and waste water treatment applications. The advantages of
MI BDD are:
1. low production cost
2. production of large surfaces
3. no carbide and stress generation due to lower temperatures
4. the surface density of diamonds is controllable [64, pp. 376].
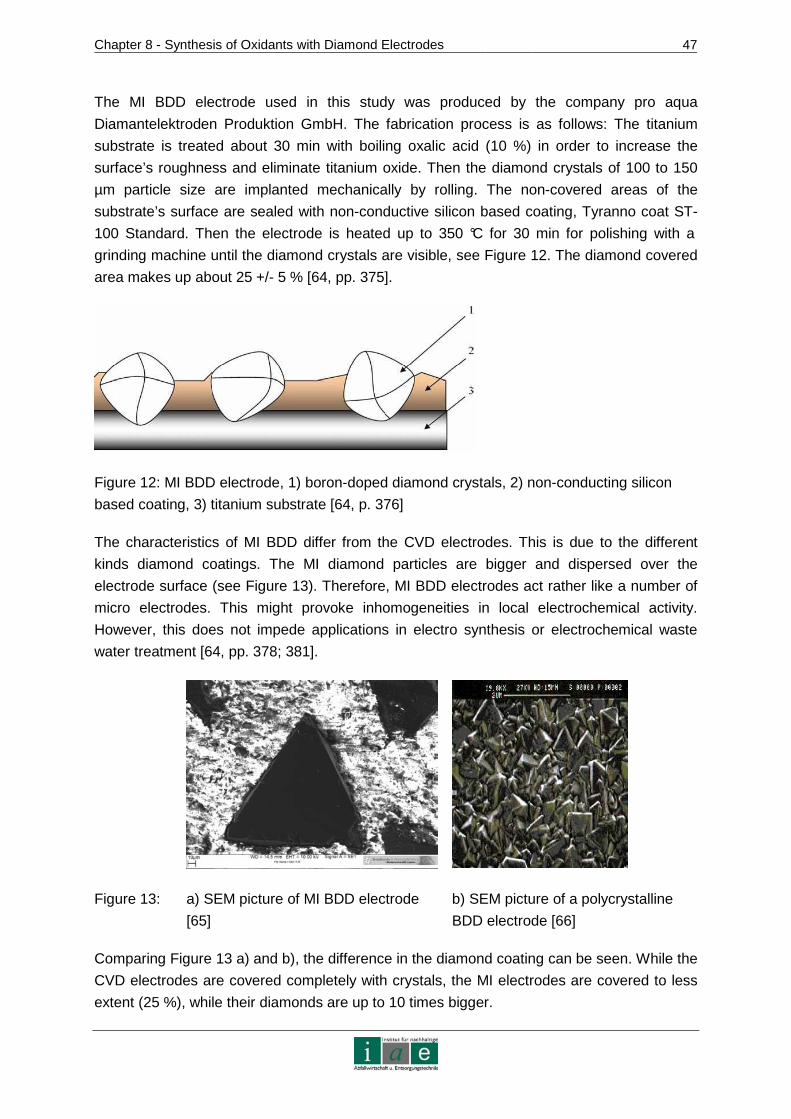
Chapter 8 - Synthesis of Oxidants with Diamond Electrodes
47
The MI BDD electrode used in this study was produced by the company pro aqua
Diamantelektroden Produktion GmbH. The fabrication process is as follows: The titanium
substrate is treated about 30 min with boiling oxalic acid (10 %) in order to increase the
surface’s roughness and eliminate titanium oxide. Then the diamond crystals of 100 to 150
µm particle size are implanted mechanically by rolling. The non-covered areas of the
substrate’s surface are sealed with non-conductive silicon based coating, Tyranno coat ST-
100 Standard. Then the electrode is heated up to 350 °C for 30 min for polishing with a
grinding machine until the diamond crystals are visible, see Figure 12. The diamond covered
area makes up about 25 +/- 5 % [64, pp. 375].
Figure 12: MI BDD electrode, 1) boron-doped diamond crystals, 2) non-conducting silicon
based coating, 3) titanium substrate [64, p. 376]
The characteristics of MI BDD differ from the CVD electrodes. This is due to the different
kinds diamond coatings. The MI diamond particles are bigger and dispersed over the
electrode surface (see Figure 13). Therefore, MI BDD electrodes act rather like a number of
micro electrodes. This might provoke inhomogeneities in local electrochemical activity.
However, this does not impede applications in electro synthesis or electrochemical waste
water treatment [64, pp. 378; 381].
Figure 13: a) SEM picture of MI BDD electrode
[65]
b) SEM picture of a polycrystalline
BDD electrode [66]
Comparing Figure 13 a) and b), the difference in the diamond coating can be seen. While the
CVD electrodes are covered completely with crystals, the MI electrodes are covered to less
extent (25 %), while their diamonds are up to 10 times bigger.
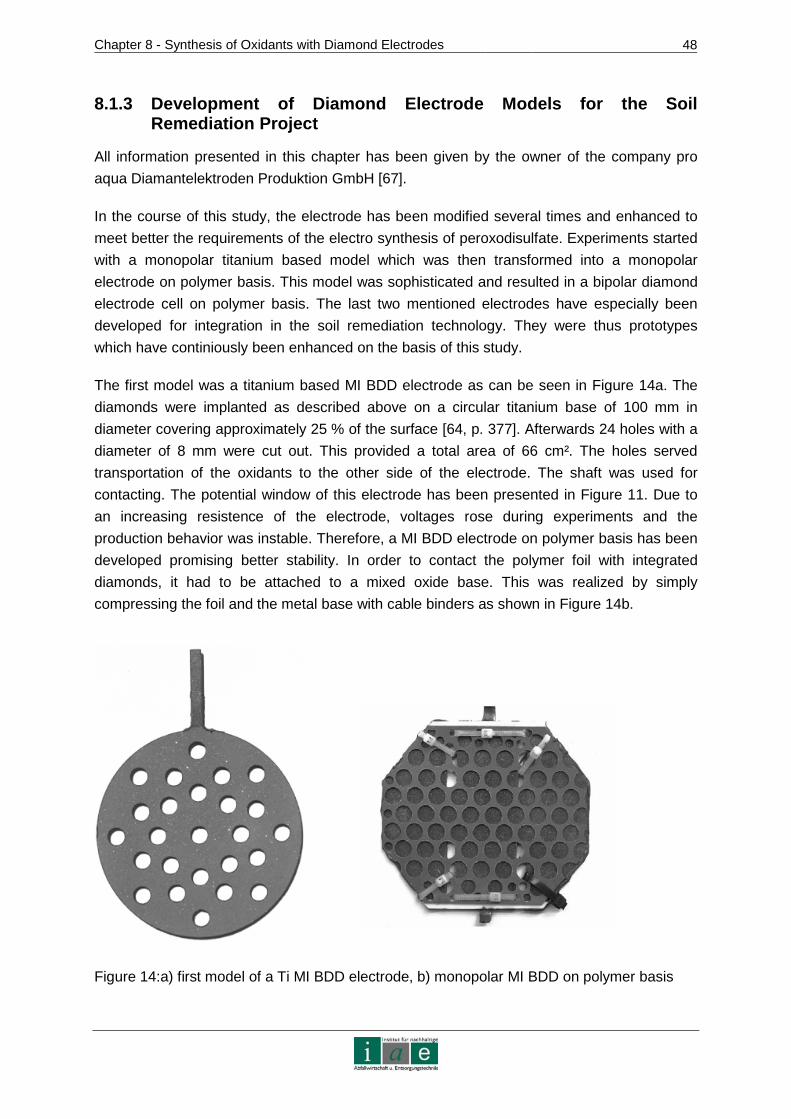
Chapter 8 - Synthesis of Oxidants with Diamond Electrodes
48
8.1.3 Development of Diamond Electrode Models for t he Soil Remediation Project
All information presented in this chapter has been given by the owner of the company pro
aqua Diamantelektroden Produktion GmbH [67].
In the course of this study, the electrode has been modified several times and enhanced to
meet better the requirements of the electro synthesis of peroxodisulfate. Experiments started
with a monopolar titanium based model which was then transformed into a monopolar
electrode on polymer basis. This model was sophisticated and resulted in a bipolar diamond
electrode cell on polymer basis. The last two mentioned electrodes have especially been
developed for integration in the soil remediation technology. They were thus prototypes
which have continiously been enhanced on the basis of this study.
The first model was a titanium based MI BDD electrode as can be seen in Figure 14a. The
diamonds were implanted as described above on a circular titanium base of 100 mm in
diameter covering approximately 25 % of the surface [64, p. 377]. Afterwards 24 holes with a
diameter of 8 mm were cut out. This provided a total area of 66 cm². The holes served
transportation of the oxidants to the other side of the electrode. The shaft was used for
contacting. The potential window of this electrode has been presented in Figure 11. Due to
an increasing resistence of the electrode, voltages rose during experiments and the
production behavior was instable. Therefore, a MI BDD electrode on polymer basis has been
developed promising better stability. In order to contact the polymer foil with integrated
diamonds, it had to be attached to a mixed oxide base. This was realized by simply
compressing the foil and the metal base with cable binders as shown in Figure 14b.
Figure 14:a) first model of a Ti MI BDD electrode, b) monopolar MI BDD on polymer basis
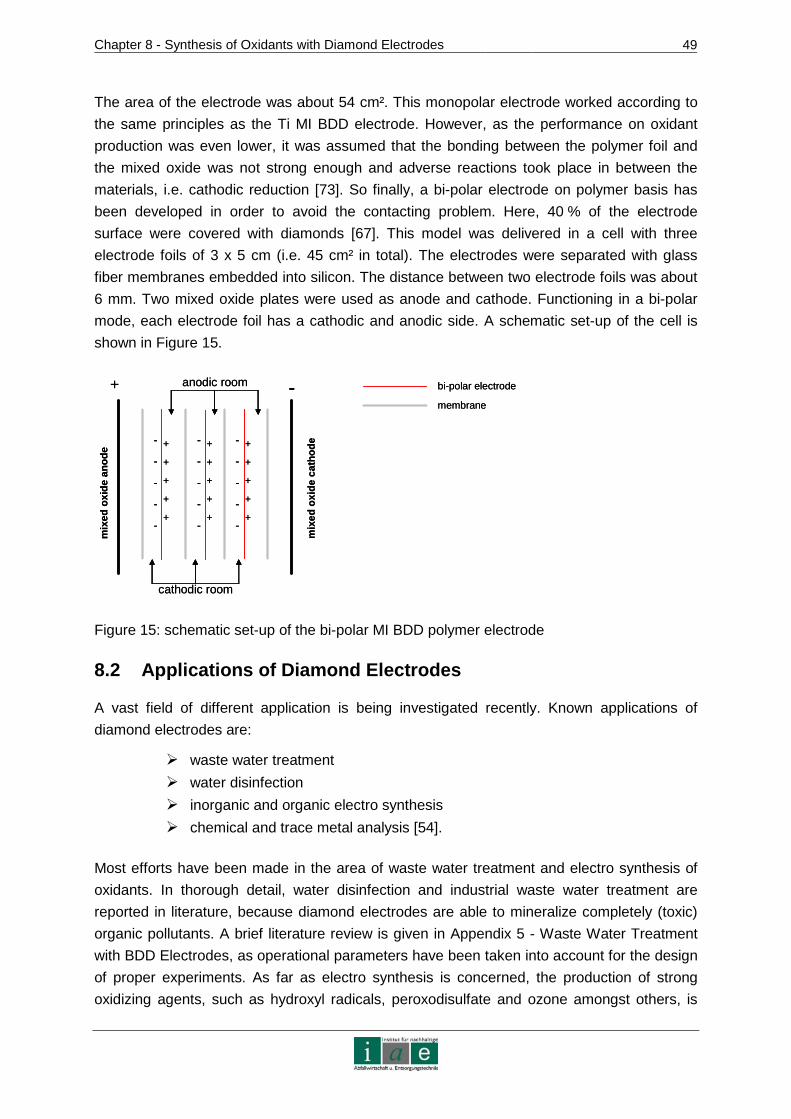
Chapter 8 - Synthesis of Oxidants with Diamond Electrodes
49
The area of the electrode was about 54 cm². This monopolar electrode worked according to
the same principles as the Ti MI BDD electrode. However, as the performance on oxidant
production was even lower, it was assumed that the bonding between the polymer foil and
the mixed oxide was not strong enough and adverse reactions took place in between the
materials, i.e. cathodic reduction [73]. So finally, a bi-polar electrode on polymer basis has
been developed in order to avoid the contacting problem. Here, 40 % of the electrode
surface were covered with diamonds [67]. This model was delivered in a cell with three
electrode foils of 3 x 5 cm (i.e. 45 cm² in total). The electrodes were separated with glass
fiber membranes embedded into silicon. The distance between two electrode foils was about
6 mm. Two mixed oxide plates were used as anode and cathode. Functioning in a bi-polar
mode, each electrode foil has a cathodic and anodic side. A schematic set-up of the cell is
shown in Figure 15.
+ -membrane
bi-polar electrode
+
+
+
+
+
+
+
+
+
+
+
+
+
+
+
-
-
-
-
-
-
-
-
-
-
-
-
-
-
-
mix
edox
ide
cath
ode
mix
edox
ide
anod
e
anodic room
cathodic room
+ -membrane
bi-polar electrode
+
+
+
+
+
+
+
+
+
+
+
+
+
+
+
-
-
-
-
-
-
-
-
-
-
-
-
-
-
-
mix
edox
ide
cath
ode
mix
edox
ide
anod
e
anodic room
cathodic room
Figure 15: schematic set-up of the bi-polar MI BDD polymer electrode
8.2 Applications of Diamond Electrodes
A vast field of different application is being investigated recently. Known applications of
diamond electrodes are:
waste water treatment
water disinfection
inorganic and organic electro synthesis
chemical and trace metal analysis [54].
Most efforts have been made in the area of waste water treatment and electro synthesis of
oxidants. In thorough detail, water disinfection and industrial waste water treatment are
reported in literature, because diamond electrodes are able to mineralize completely (toxic)
organic pollutants. A brief literature review is given in Appendix 5 - Waste Water Treatment
with BDD Electrodes, as operational parameters have been taken into account for the design
of proper experiments. As far as electro synthesis is concerned, the production of strong
oxidizing agents, such as hydroxyl radicals, peroxodisulfate and ozone amongst others, is
Chapter 8 - Synthesis of Oxidants with Diamond Electrodes
50
being investigated. In the following, the most important aspects of electro synthesis for the
generation of peroxodisulfate are explained.
8.2.1 Inorganic Electro Synthesis
When speaking of electro synthesis, the electricity driven generation of oxidizing reagents is
referred to. BDD electrodes are ideal for this application due to their high overpotential for
water stability. Mostly, hydroxyl radicals (OH°), o zone (O3), hydrogen peroxide (H2O2) and
peroxodisulfate (S2O82-) are produced amongst others.
Advantages of electro synthesis with BDD electrodes over conventional synthesis are [59,
p. 196]:
Electricity driven synthesis does not have any need for extra chemical reactants,
which are mostly hazardous, expensive in acquisition and disposal and difficult to
handle,
the electrochemical synthesis allows the precise control of reaction conditions and
produces less side products and
electro synthesis can reduce the overall number of process steps.
However, until now, electro generation (mainly Na2S2O8, KMnO4, H2O2, O3 and metal ion
redox species like Ag+/Ag2+) has not succeeded to be applied on industrial scale due to
limitations in the availability and the stable performance of BDD electrodes [59, p.196].
In the following, general chemical reactions (Eq. 21 till Eq. 25) occurring during any kind of
electro synthesis in aqueous media, are presented. According to Comninellis et al. [68,
p. 469] hydroxyl radicals are generated directly at the surface of BDD electrodes:
Eq. 21: BDD (H2O) → BDD (OH°) + H + + e E° = 2.33 V
The hydroxyl radicals can then form hydrogen peroxide and ozone according to the following
reactions [69, pp.485]:
Eq. 22: 2 OH° → H2O2 E° = 1.78 V
Eq. 23: OH° → O° + H + + e
Eq. 24: 2 O° → O2
Eq. 25: O° + O 2 → O3 E° = 2.07 V
These species are therefore available in the electrolyte for oxidizing other compounds like
sulfate to peroxodisulfate, on which will be put emphasis in this chapter as this oxidant shall
be used for soil remediation.
Chapter 8 - Synthesis of Oxidants with Diamond Electrodes
51
Generation of Peroxodisulfate
The main studies on peroxodisulfate generation with BDD electrode surfaces have been
conducted by Comninellis et al. [68], Michaud et al. [70] and Serrano et al. [71].
Peroxodisulfate is used for cyanide oxidation, dye oxidation and fibre whitening amongst
others. However, it has not been considered until recently for oxidation of organic pollutants.
Comninellis et al. [68] state that BDD electrodes are more apt for peroxodisulfate synthesis
than the traditionally used Pt electrodes (see Figure 16), because the electrochemical
process is strongly dependent on the electrode material. Due to their resistance to corrosion
and high over potential BDD electrodes meet the requirements better. Results show that high
concentrations of sulphuric acid (7.5 M) and high current densities (200 mA/cm²) at 25 °C
can achieve current efficiencies of 75 %. [69]
Serrano et al. [71] used circular CVD BDD anodes on Si substrate with a diameter of 90 mm.
The distance between anode and zirconium cathode was 10 mm. The cell was fed with two
circuits of anolyte and catholyte the flow rate being about 200 l/h, the temperature 9 °C and
the applied current density 23 mA/cm². It has been found that electrolytes with higher
concentrations of sulphuric acid (> 2M) result in a current efficiency of about 90 %. Lower
concentrations (< 2M) result in efficiencies below 90 %. Serrano et al. [71, p. 431] suggest
two reaction mechanisms for the generation of peroxodisulfate (see Eq. 26 till Eq. 32). As
sulfuric acid is present in associated (H2SO4) and dissociated (HSO4-, SO4
2-) forms, all
compounds can be involved in the reaction mechanisms.
Eq. 26: 2 HSO4- → S2O8
2- + 2 H+ + 2 e E° = 2.12 V
Eq. 27: 2 SO42- → S2O8
2- + 2 e E° = 2.01 V
The main side reaction is oxygen evolution, while a little ozone is generated, as well:
Eq. 28: H2O → 0.5 O2 + 2 H+ + 2 e E° = 1.02 V
The second mechanism involves hydroxyl radicals generated through the anodic discharge
of water:
Eq. 29: H2O → OH° + H + + e
Eq. 30: HSO4- + OH° → SO4
-° + H 2O
Eq. 31: H2SO4 + OH° → SO4-° + H 3O
+
Eq. 32: SO4-° + SO 4
-° → S2O82-
A competitive side reaction (Eq. 33) can be:
Chapter 8 - Synthesis of Oxidants with Diamond Electrodes
52
Eq. 33: OH° + OH° → O2 + 2 H+ + 2 e
It was also discovered that lower temperatures foster good performance. At 60 °C the
efficiency drops down to 27 %. This might be due to thermal activation of the peroxodisulfate
ions, see Eq. 34 and Eq. 35, [69, p. 488]:
Eq. 34: S2O82- + heat → 2 SO4
-°
Eq. 35: SO4-° + H 2O → OH° + HSO 4
-
Comninellis et al. [68] opine that peroxodisulfate ions decompose the following way, see Eq.
36 till Eq. 38:
Eq. 36: S2O82- + H2O → 2 HSO4
- + 0.5 O2
Eq. 37: S2O82- + H2O → SO5
2- + SO42- + 2 H+
Eq. 38: SO52- + H2O → H2O2 + SO4
2-
In order to measure the current efficiency, Faraday’s law is applied (see Eq. 39). The
theoretical amount of generated oxidant in moles (molth) is:
Eq. 39: η***
*
1tI
Fzmolth =
where z is the number of electrons transfered, F is the Faraday constant in As/mol, I the
current in A, t is the time in s and η the current efficiency in percent. Measuring the amount of
peroxodisulfate generated (in mol) the efficiency can be calculated.
According to [72, p. 528], peroxodisulfate can be produced over a wide range of pH. The
optimum for a CVD BDD electrode is found in an electrolyte of H2SO4 and Na2SO4, each of
the chemicals providing 0.5 mol of sulfate ions per liter (see Figure 16).
Thus, the most important parameters for efficient peroxodisulfate production are the
concentration of sulfate in the electrolyte, the current density, pH-value and temperature.
Based on above cited literature peroxodisulfate production (sodium, potassium and
ammonium peroxodisulfate) has been patented (EP 1148155A2). The process applies
current densities between 400 and 900 mA/cm², anolyte concentrations of 300 up to 700 g
NaHSO4/l, catholyte concentrations of 300 till 400 g H2SO4/l or 300 till 500 g Na2SO4/l.
Additionally, anode and cathode (distance of 2.2 cm) are separated by an ion exchange
membrane. Operation temperature is at 45 °C.
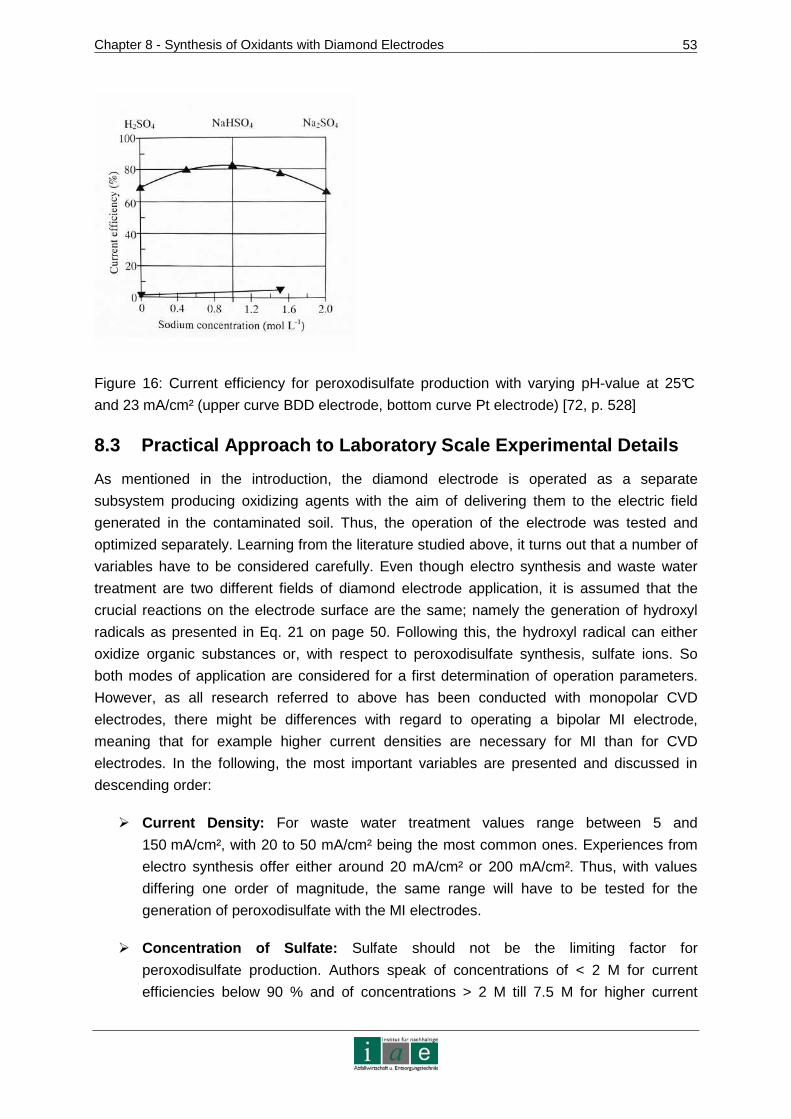
Chapter 8 - Synthesis of Oxidants with Diamond Electrodes
53
Figure 16: Current efficiency for peroxodisulfate production with varying pH-value at 25°C
and 23 mA/cm² (upper curve BDD electrode, bottom curve Pt electrode) [72, p. 528]
8.3 Practical Approach to Laboratory Scale Experime ntal Details
As mentioned in the introduction, the diamond electrode is operated as a separate
subsystem producing oxidizing agents with the aim of delivering them to the electric field
generated in the contaminated soil. Thus, the operation of the electrode was tested and
optimized separately. Learning from the literature studied above, it turns out that a number of
variables have to be considered carefully. Even though electro synthesis and waste water
treatment are two different fields of diamond electrode application, it is assumed that the
crucial reactions on the electrode surface are the same; namely the generation of hydroxyl
radicals as presented in Eq. 21 on page 50. Following this, the hydroxyl radical can either
oxidize organic substances or, with respect to peroxodisulfate synthesis, sulfate ions. So
both modes of application are considered for a first determination of operation parameters.
However, as all research referred to above has been conducted with monopolar CVD
electrodes, there might be differences with regard to operating a bipolar MI electrode,
meaning that for example higher current densities are necessary for MI than for CVD
electrodes. In the following, the most important variables are presented and discussed in
descending order:
Current Density: For waste water treatment values range between 5 and
150 mA/cm², with 20 to 50 mA/cm² being the most common ones. Experiences from
electro synthesis offer either around 20 mA/cm² or 200 mA/cm². Thus, with values
differing one order of magnitude, the same range will have to be tested for the
generation of peroxodisulfate with the MI electrodes.
Concentration of Sulfate: Sulfate should not be the limiting factor for
peroxodisulfate production. Authors speak of concentrations of < 2 M for current
efficiencies below 90 % and of concentrations > 2 M till 7.5 M for higher current
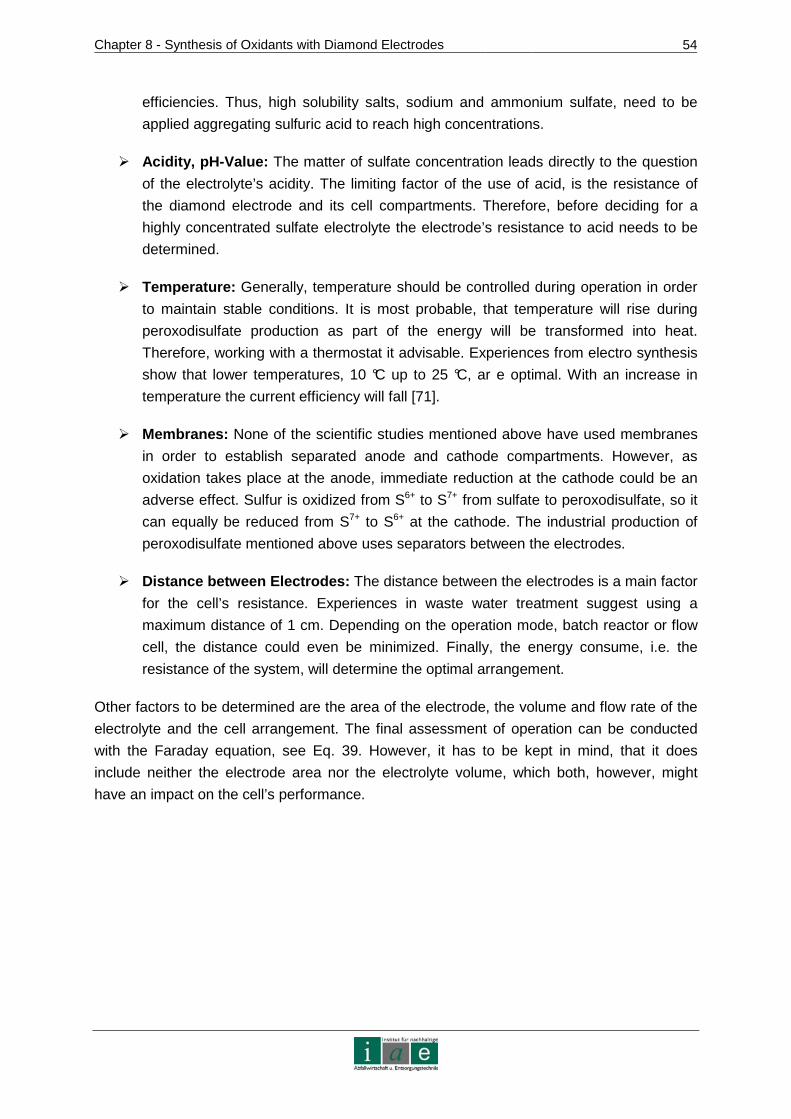
Chapter 8 - Synthesis of Oxidants with Diamond Electrodes
54
efficiencies. Thus, high solubility salts, sodium and ammonium sulfate, need to be
applied aggregating sulfuric acid to reach high concentrations.
Acidity, pH-Value: The matter of sulfate concentration leads directly to the question
of the electrolyte’s acidity. The limiting factor of the use of acid, is the resistance of
the diamond electrode and its cell compartments. Therefore, before deciding for a
highly concentrated sulfate electrolyte the electrode’s resistance to acid needs to be
determined.
Temperature: Generally, temperature should be controlled during operation in order
to maintain stable conditions. It is most probable, that temperature will rise during
peroxodisulfate production as part of the energy will be transformed into heat.
Therefore, working with a thermostat it advisable. Experiences from electro synthesis
show that lower temperatures, 10 °C up to 25 °C, ar e optimal. With an increase in
temperature the current efficiency will fall [71].
Membranes: None of the scientific studies mentioned above have used membranes
in order to establish separated anode and cathode compartments. However, as
oxidation takes place at the anode, immediate reduction at the cathode could be an
adverse effect. Sulfur is oxidized from S6+ to S7+ from sulfate to peroxodisulfate, so it
can equally be reduced from S7+ to S6+ at the cathode. The industrial production of
peroxodisulfate mentioned above uses separators between the electrodes.
Distance between Electrodes: The distance between the electrodes is a main factor
for the cell’s resistance. Experiences in waste water treatment suggest using a
maximum distance of 1 cm. Depending on the operation mode, batch reactor or flow
cell, the distance could even be minimized. Finally, the energy consume, i.e. the
resistance of the system, will determine the optimal arrangement.
Other factors to be determined are the area of the electrode, the volume and flow rate of the
electrolyte and the cell arrangement. The final assessment of operation can be conducted
with the Faraday equation, see Eq. 39. However, it has to be kept in mind, that it does
include neither the electrode area nor the electrolyte volume, which both, however, might
have an impact on the cell’s performance.

Chapter 9 - Development of a New Remediation Process
55
9 Development of a New Remediation Process
The three major fields of investigation, i.e. the subsystems of the remediation method, are
presented in this chapter. Chemical oxidation of diesel and phenol in soil, production of
peroxodisulfate with diamond electrodes, and oxidant transport in soil have been tested
parallel and independently from each other. Spiking tests have been undertaken extra before
proceeding to contaminant elimination in soil matrix. All data for chemicals, analytical
methods and laboratory equipment is presented in detail in Appendix 6 – Devices, Chemicals
and Soil Material. Therefore, no extra specification is given in this chapter. All HC-index,
phenol-index and COD analysis has been conducted in the laboratory of the Institute for
Sustainable Waste Management and Technology, University of Leoben. TOC has been
determined in the laboratory of Echem, Wiener Neustadt, if not stated otherwise.
9.1 Spiking of Test Soil
As mentioned in Chapter 5, a successful spiking methodology is the basis for a reliable
interpretation of spike concentrations in soil for any kind of experiment. The initial coefficient
of variance (CV) should not exceed 20 % in order to count with a homogeneity of at least
80 % of artificial contamination. In this study, spiking experiments had to be conducted
previously to decomposition experiments of organic pollutants in order to assure precise
contamination. The method was developed in co-operation with Böhm [86].
9.1.1 Materials and Methods
Spiking assays were conducted for two types of pollutants, namely diesel oil and sodium
phenolate. Diesel oil was obtained as extra light heating fuel marked with red color from the
A1 gas station in Leoben, Austria, and was stored in a glass bottle at room temperature.
Sodium phenolate was stored in a plastic test tube at room temperature in the dark.
Spiking with Diesel Oil
In order to spike the soil material with diesel oil, various soil components were mixed
previously by hand. Generally, the synthetic soil was composed of sand, silt and zeolite (for
specifications please see Appendix 6 – Devices, Chemicals and Soil Material) and had been
dried beforehand. Then diesel oil was filled into a laboratory spray bottle made of glass with
a capacity of 150 ml. According to previous tests, an amount of about 7 g diesel had to be
applied to 1 kg of soil to obtain a concentration of ca. 5 g/kg, thus counting with a spiking
efficiency of approximately 70 % due to evaporation and loss of diesel while spraying. The
actual spiking was realized in an aluminum baking dish under a laboratory bell. A thin layer of
soil was placed into the tray. The soil layer was subsequently sprayed with diesel so that the
entire surface was wetted, then another layer of soil was added. This procedure was
repeated until having used all soil material, while the spray bottle with diesel was weighed
several times in order to spike the soil with the appropriate amount of contaminant.
Afterwards, the spiked soil layers were mixed by using a stainless steel spoon which was

Chapter 9 - Development of a New Remediation Process
56
moved in a zigzag line in both directions of the tray. Then, the material was filled into a
plastic container in which two rectangular shaped steel bars were fixed. The receptacle was
placed onto a mixer and agitated by rolling for 15 minutes. The steel bars fostered the mixing
of the material. Afterwards, distilled water was added to the soil and it was mixed with a
stainless steel spoon. The homogenized material was placed again into the cleaned baking
dish from where five samples, one from each corner and one from the center, were
withdrawn. Appendix 11 – Photos shows pictures of the procedure. The contaminated
samples were analyzed according to the hydrocarbon index method EN ISO 9377 (for
detailed information see Appendix 7 – Chemical Analytical Methods) as required by the
Austrian Standard ÖNORM S 2088-1. TOC and COD were determined additionally in order
to assure the reliability of the HC-index.
Spiking with Sodium Phenolate
As described above, the synthetic soil material was prepared prior to adding the
contaminant. Na-Phenolate, was diluted in the respective amount of distilled water (500 mg
phenol per kg of soil with a water content of 20 %) with a magnetic stirring bar at room
temperature and then aggregated under constant mixing to the soil with a stainless steel
spoon in a glass bowl. After having added the entire spike the material was mixed for five
more minutes. Out of the entire material three samples were taken randomly. The samples
were analyzed according to the phenol-index method DIN 38409-16 (for details see
Appendix 7 – Chemical Analytical Methods) which is required according to the Austrian
Standard of site evaluation. In order to counter check the method, TOC was measured as
well. Pre-assays in order to verify the success of this spiking method have not been
conducted as it was assumed that the water soluble contaminant would spread
homogeneously in the wet soil.
9.1.2 Results and Discussion
The principal result of the spiking tests is the obtained homogeneity. Where possible, spiking
efficiency is also presented, however, this parameter is not as important as the previous one
as long as the exact initial concentration of a spiked specimen is determined before running
an experiment. Homogeneity was calculated by equation Eq. 40:
Eq. 40: %100*1
−=µσ
H
where H is homogeneity, σ is the standard deviation of analysis results and µ is the mean
value of the analyses’ results from the samples taken.
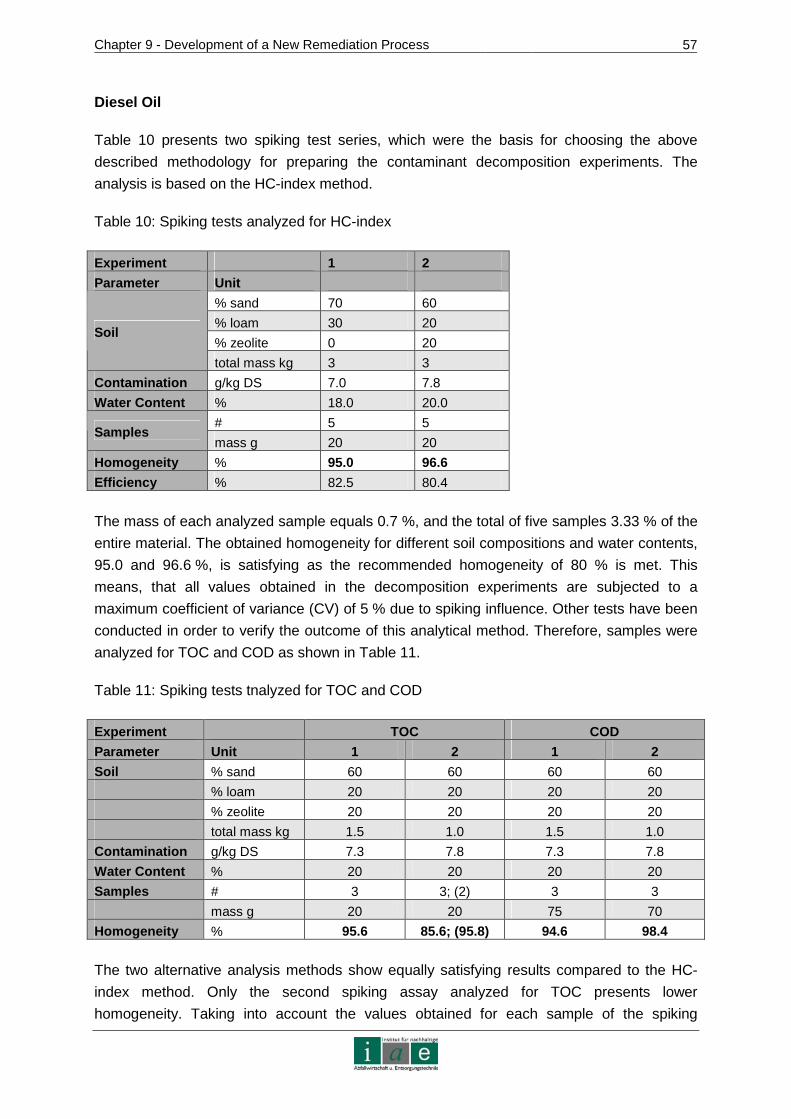
Chapter 9 - Development of a New Remediation Process
57
Diesel Oil
Table 10 presents two spiking test series, which were the basis for choosing the above
described methodology for preparing the contaminant decomposition experiments. The
analysis is based on the HC-index method.
Table 10: Spiking tests analyzed for HC-index
Experiment 1 2
Parameter Unit
% sand 70 60
% loam 30 20
% zeolite 0 20 Soil
total mass kg 3 3
Contamination g/kg DS 7.0 7.8
Water Content % 18.0 20.0
# 5 5 Samples
mass g 20 20
Homogeneity % 95.0 96.6
Efficiency % 82.5 80.4
The mass of each analyzed sample equals 0.7 %, and the total of five samples 3.33 % of the
entire material. The obtained homogeneity for different soil compositions and water contents,
95.0 and 96.6 %, is satisfying as the recommended homogeneity of 80 % is met. This
means, that all values obtained in the decomposition experiments are subjected to a
maximum coefficient of variance (CV) of 5 % due to spiking influence. Other tests have been
conducted in order to verify the outcome of this analytical method. Therefore, samples were
analyzed for TOC and COD as shown in Table 11.
Table 11: Spiking tests tnalyzed for TOC and COD
Experiment TOC COD
Parameter Unit 1 2 1 2
Soil % sand 60 60 60 60
% loam 20 20 20 20
% zeolite 20 20 20 20
total mass kg 1.5 1.0 1.5 1.0
Contamination g/kg DS 7.3 7.8 7.3 7.8
Water Content % 20 20 20 20
Samples # 3 3; (2) 3 3
mass g 20 20 75 70
Homogeneity % 95.6 85.6; (95.8) 94.6 98.4
The two alternative analysis methods show equally satisfying results compared to the HC-
index method. Only the second spiking assay analyzed for TOC presents lower
homogeneity. Taking into account the values obtained for each sample of the spiking
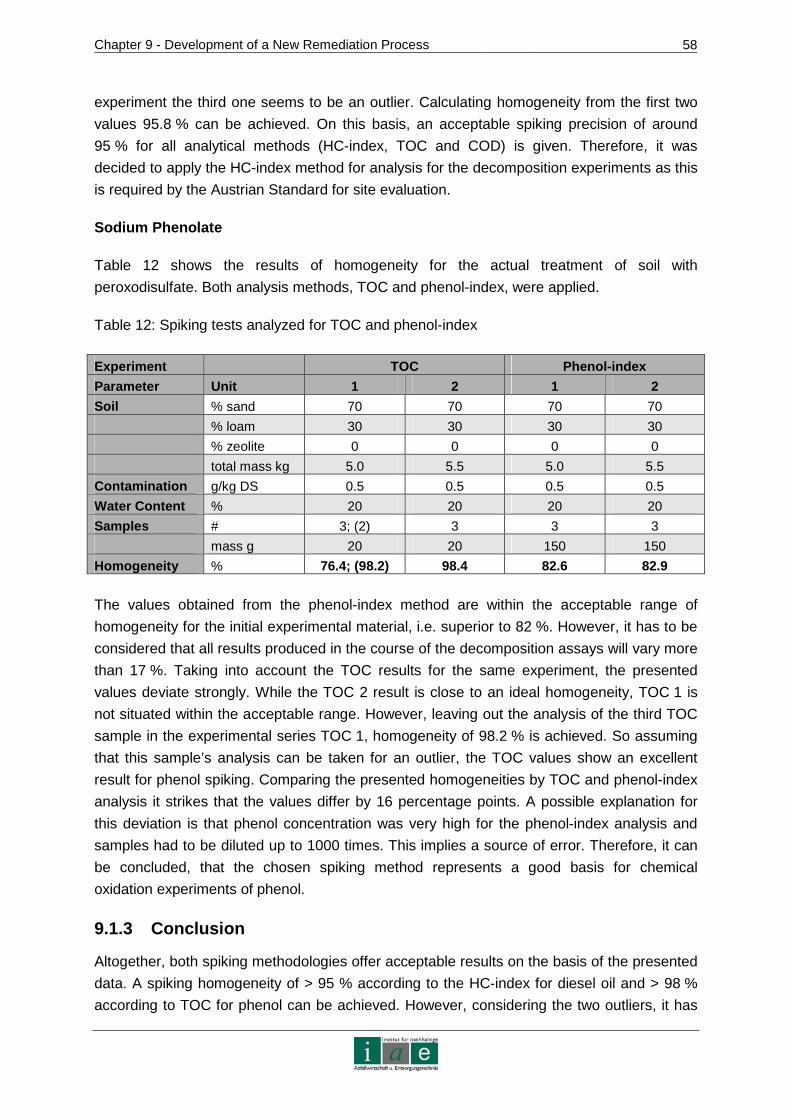
Chapter 9 - Development of a New Remediation Process
58
experiment the third one seems to be an outlier. Calculating homogeneity from the first two
values 95.8 % can be achieved. On this basis, an acceptable spiking precision of around
95 % for all analytical methods (HC-index, TOC and COD) is given. Therefore, it was
decided to apply the HC-index method for analysis for the decomposition experiments as this
is required by the Austrian Standard for site evaluation.
Sodium Phenolate
Table 12 shows the results of homogeneity for the actual treatment of soil with
peroxodisulfate. Both analysis methods, TOC and phenol-index, were applied.
Table 12: Spiking tests analyzed for TOC and phenol-index
Experiment TOC Phenol-index
Parameter Unit 1 2 1 2
Soil % sand 70 70 70 70
% loam 30 30 30 30
% zeolite 0 0 0 0
total mass kg 5.0 5.5 5.0 5.5
Contamination g/kg DS 0.5 0.5 0.5 0.5
Water Content % 20 20 20 20
Samples # 3; (2) 3 3 3
mass g 20 20 150 150
Homogeneity % 76.4; (98.2) 98.4 82.6 82.9
The values obtained from the phenol-index method are within the acceptable range of
homogeneity for the initial experimental material, i.e. superior to 82 %. However, it has to be
considered that all results produced in the course of the decomposition assays will vary more
than 17 %. Taking into account the TOC results for the same experiment, the presented
values deviate strongly. While the TOC 2 result is close to an ideal homogeneity, TOC 1 is
not situated within the acceptable range. However, leaving out the analysis of the third TOC
sample in the experimental series TOC 1, homogeneity of 98.2 % is achieved. So assuming
that this sample’s analysis can be taken for an outlier, the TOC values show an excellent
result for phenol spiking. Comparing the presented homogeneities by TOC and phenol-index
analysis it strikes that the values differ by 16 percentage points. A possible explanation for
this deviation is that phenol concentration was very high for the phenol-index analysis and
samples had to be diluted up to 1000 times. This implies a source of error. Therefore, it can
be concluded, that the chosen spiking method represents a good basis for chemical
oxidation experiments of phenol.
9.1.3 Conclusion
Altogether, both spiking methodologies offer acceptable results on the basis of the presented
data. A spiking homogeneity of > 95 % according to the HC-index for diesel oil and > 98 %
according to TOC for phenol can be achieved. However, considering the two outliers, it has
Chapter 9 - Development of a New Remediation Process
59
to be recommended to conduct further series of experiments in order to assure the good
performance of the spiking procedure. Comparing the results with those cited from literature
in Chapter 5, Doick et al. [20, p. 402] obtained a CV of 6.0 for spiking with 1 % of transformer
oil, whereas above mentioned data implies average CVs of 4.2 for HC-index, 4.2 for TOC
and 3.4 for COD for diesel spiking. Thus, an appropriate methodology for LNAPL spiking
without solvent has been developed successfully.
9.2 Treatment of Soil with Peroxodisulfate
The purpose of the in the following described experiments was to test if the chosen oxidant,
ammonium peroxodisulfate, is apt to decompose diesel oil and phenol in soil matrix. As
mentioned in Chapter 7, there is almost no scientific data available on peroxodisulfate
performance in soil on diesel oil, as most experiments have been conducted in aqueous
media above 20 °C and with chlorinated compounds. T herefore, the following assays aim to
simulate a more realistic situation in terms of reaction matrix and temperature conditions and
to provide first data on diesel oil decomposition together with phenol oxidation in soil.
9.2.1 Materials and Methods
Chemical oxidation with peroxodisulfate has been conducted with sodium phenolate and
diesel oil in synthetically spiked soil. The detailed spiking procedures have been described in
the previous chapter. The soil material was composed of 70 % sand and 30 % loam, thus,
providing coarse and fine grained particles for different adsorption and desorption
mechanisms (see Chapter 3).
Diesel Oil
Ammonium peroxodisulfate ((NH4)2S2O8) was added in its solid form in different quantities
(+/- 0.1 g) to the spiked soil by mixing with a stainless steel spoon for approximately three
minutes. Then, to half of the samples, iron sulfate heptahydrate (FeSO4*7 H2O) has been
aggregated as catalyst by mixing the chemical powder (+/- 0.01 g) with the dry soil material.
Finally, the respective amount of distilled water (+/- 5 ml) was added under stirring in order to
obtain 20 % humidity. A concentration of around 9 g diesel per kg of soil with the mentioned
humidity guarantees that diesel is present as NAPL as only 0.01 g solve in one liter of water.
All samples had a mass of 250 to 350 g and were prepared individually. The difference in
weight is due to distinct amounts of the oxidizing agent and catalyst. Three parameters were
varied, namely oxidant quantity, reaction time and catalyst quantity as can be seen in Table
13. The samples, placed in 250 ml glasses with a plastic screw tap, were stored in the dark
at a temperature ranging between 15 and 17°C.

Chapter 9 - Development of a New Remediation Process
60
Table 13: Variation of parameters in long-term diesel oil decomposition experiments
Parameter Unit Value
time weeks 0; 1; 2; 4; 12
oxidant amount mol (NH4)2S2O8 per mol diesel 0; 28.5; 142.3; 284.6
catalyst mg FeSO4*7 H2O per g soil 0; 0.7
The amounts of oxidant correspond to 0; 2.5; 12.5 and 25 mol ammonium peroxodisulfate
per mol carbon in the spiked soil sample.
After the designated time of experiment, the sample was stirred by hand with a laboratory
spatula for homogenization. Then 20 to 30 g were withdrawn in order to determine the dry
substance. Previous experiments have shown that a determination with 20 g of material
results in a standard deviation below 2 %. Another 20 g were handed in for HC-index
analysis and stored in a refrigerator for subsequent processing or in a freezer for later
analysis.
Sodium Phenolate
The dry synthetic soil was mixed with the respective amounts of ammonium peroxodisulfate
(+/- 0.1 g) and iron sulfate (+/- 0.01 g) by stirring with a stainless steel spoon for three
minutes. A certain amount of sodium phenolate (+/- 0.01 g) was diluted in distilled water in
order to obtain a humidity of 20 % and a concentration of 0.50 g pollutant per kg of soil. The
solution was added to each soil sample under constant stirring. All specimens weighed
between 250 and 400 g due to the different amounts of added chemicals. The specimens
were stored in 250 ml glasses with a plastic screw tap in the dark between 15 and 17°C.
Table 14 presents the varied parameters and relative quantities of substances added.
Table 14: Variation of parameters in long-term phenol decomposition experiments
Parameter Unit Value
time weeks 0; 2; 4; 8
oxidant amount mol (NH4)2S2O8 per mol phenol 0; 10.7; 54.0; 107.5
catalyst mg FeSO4*7 H2O per g soil 0; 3.7
The quantities of oxidant correspond to 0; 1.8; 9.0; 18.0 mol of ammonium peroxodisulfate
per mol of carbon in the spiked soil.
After having finished the experiments, the samples were homogenized during several
minutes by mixing with a laboratory spatula. About 30 g were taken for dry substance
determination and 150 g were handed in for phenol-index analysis. If the samples could not
be processed immediately they were stored in glass bottles with plastic screw taps in
freezers. After eight weeks of chemical oxidation with peroxodisulfate, the pH-value was
measured in order to determine the reaction’s influence on soil acidity.
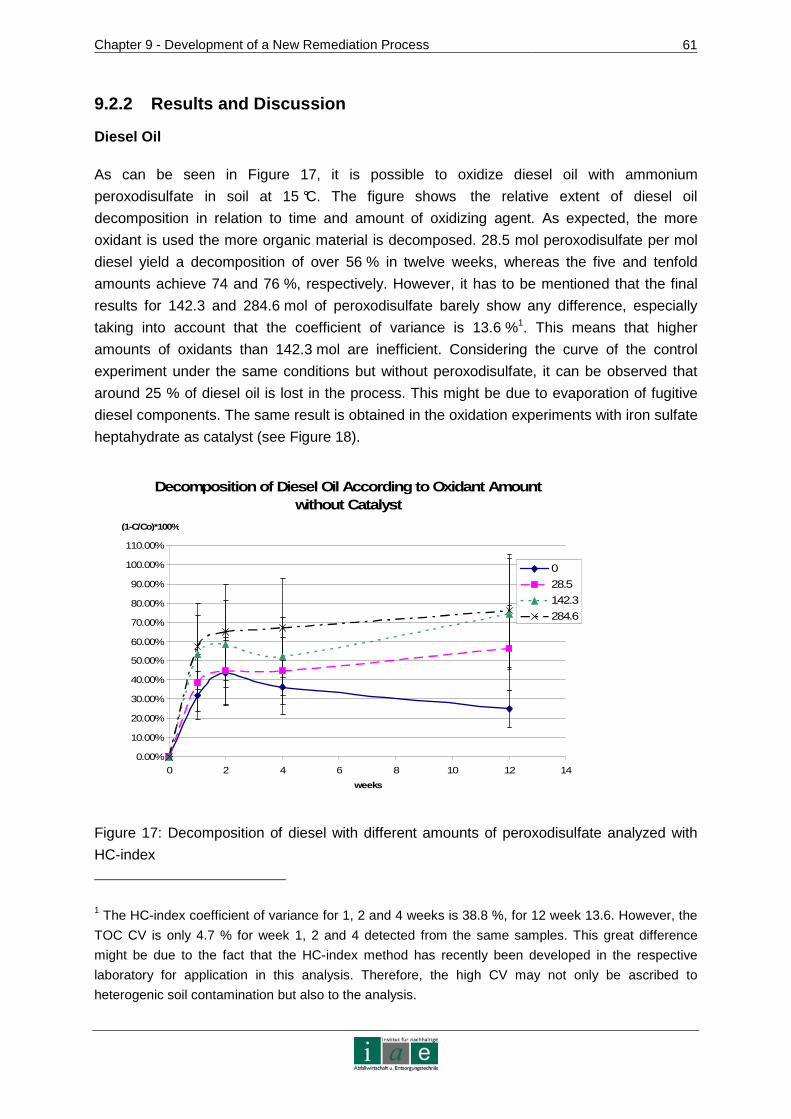
Chapter 9 - Development of a New Remediation Process
61
9.2.2 Results and Discussion
Diesel Oil
As can be seen in Figure 17, it is possible to oxidize diesel oil with ammonium
peroxodisulfate in soil at 15 °C. The figure shows the relative extent of diesel oil
decomposition in relation to time and amount of oxidizing agent. As expected, the more
oxidant is used the more organic material is decomposed. 28.5 mol peroxodisulfate per mol
diesel yield a decomposition of over 56 % in twelve weeks, whereas the five and tenfold
amounts achieve 74 and 76 %, respectively. However, it has to be mentioned that the final
results for 142.3 and 284.6 mol of peroxodisulfate barely show any difference, especially
taking into account that the coefficient of variance is 13.6 %1. This means that higher
amounts of oxidants than 142.3 mol are inefficient. Considering the curve of the control
experiment under the same conditions but without peroxodisulfate, it can be observed that
around 25 % of diesel oil is lost in the process. This might be due to evaporation of fugitive
diesel components. The same result is obtained in the oxidation experiments with iron sulfate
heptahydrate as catalyst (see Figure 18).
Decomposition of Diesel Oil According to Oxidant Am ount without Catalyst
0.00%
10.00%
20.00%
30.00%
40.00%
50.00%
60.00%
70.00%
80.00%
90.00%
100.00%
110.00%
0 2 4 6 8 10 12 14
weeks
(1-C/Co)*100%
0
28.5
142.3
284.6
Figure 17: Decomposition of diesel with different amounts of peroxodisulfate analyzed with
HC-index
1 The HC-index coefficient of variance for 1, 2 and 4 weeks is 38.8 %, for 12 week 13.6. However, the
TOC CV is only 4.7 % for week 1, 2 and 4 detected from the same samples. This great difference
might be due to the fact that the HC-index method has recently been developed in the respective
laboratory for application in this analysis. Therefore, the high CV may not only be ascribed to
heterogenic soil contamination but also to the analysis.
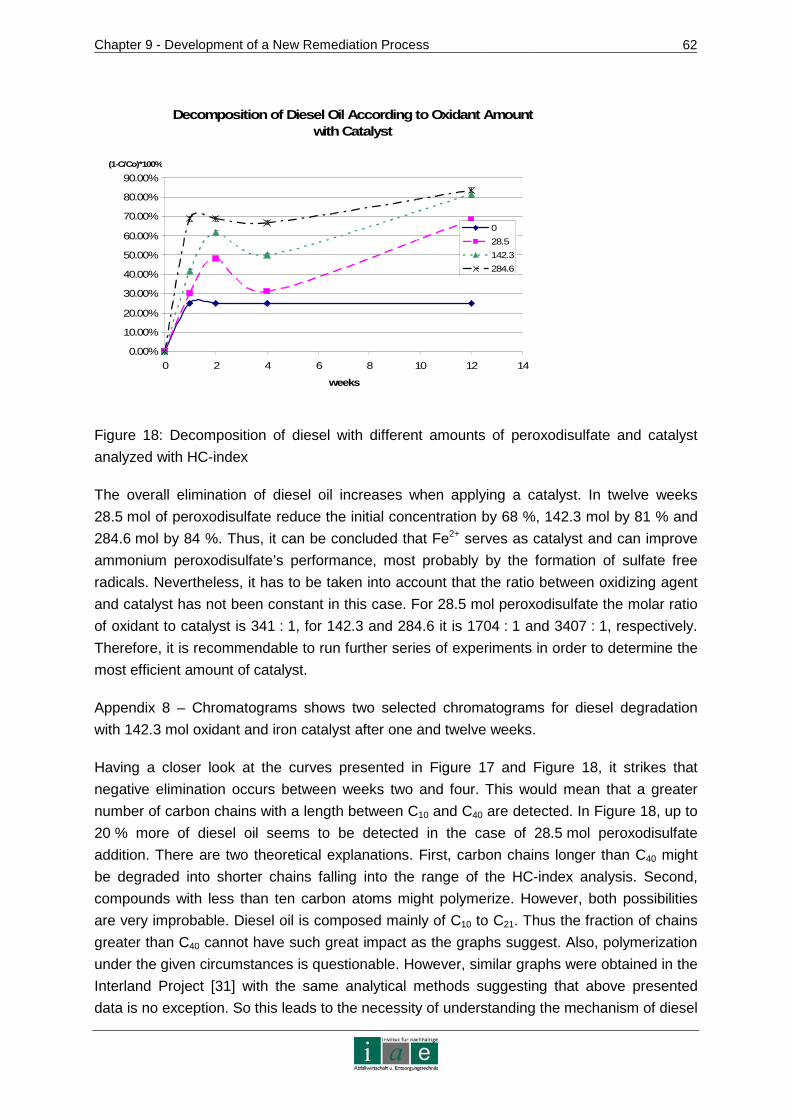
Chapter 9 - Development of a New Remediation Process
62
Decomposition of Diesel Oil According to Oxidant Am ount with Catalyst
0.00%
10.00%
20.00%
30.00%
40.00%
50.00%
60.00%
70.00%
80.00%
90.00%
0 2 4 6 8 10 12 14
weeks
(1-C/Co)*100%
0
28.5
142.3
284.6
Figure 18: Decomposition of diesel with different amounts of peroxodisulfate and catalyst
analyzed with HC-index
The overall elimination of diesel oil increases when applying a catalyst. In twelve weeks
28.5 mol of peroxodisulfate reduce the initial concentration by 68 %, 142.3 mol by 81 % and
284.6 mol by 84 %. Thus, it can be concluded that Fe2+ serves as catalyst and can improve
ammonium peroxodisulfate’s performance, most probably by the formation of sulfate free
radicals. Nevertheless, it has to be taken into account that the ratio between oxidizing agent
and catalyst has not been constant in this case. For 28.5 mol peroxodisulfate the molar ratio
of oxidant to catalyst is 341 : 1, for 142.3 and 284.6 it is 1704 : 1 and 3407 : 1, respectively.
Therefore, it is recommendable to run further series of experiments in order to determine the
most efficient amount of catalyst.
Appendix 8 – Chromatograms shows two selected chromatograms for diesel degradation
with 142.3 mol oxidant and iron catalyst after one and twelve weeks.
Having a closer look at the curves presented in Figure 17 and Figure 18, it strikes that
negative elimination occurs between weeks two and four. This would mean that a greater
number of carbon chains with a length between C10 and C40 are detected. In Figure 18, up to
20 % more of diesel oil seems to be detected in the case of 28.5 mol peroxodisulfate
addition. There are two theoretical explanations. First, carbon chains longer than C40 might
be degraded into shorter chains falling into the range of the HC-index analysis. Second,
compounds with less than ten carbon atoms might polymerize. However, both possibilities
are very improbable. Diesel oil is composed mainly of C10 to C21. Thus the fraction of chains
greater than C40 cannot have such great impact as the graphs suggest. Also, polymerization
under the given circumstances is questionable. However, similar graphs were obtained in the
Interland Project [31] with the same analytical methods suggesting that above presented
data is no exception. So this leads to the necessity of understanding the mechanism of diesel
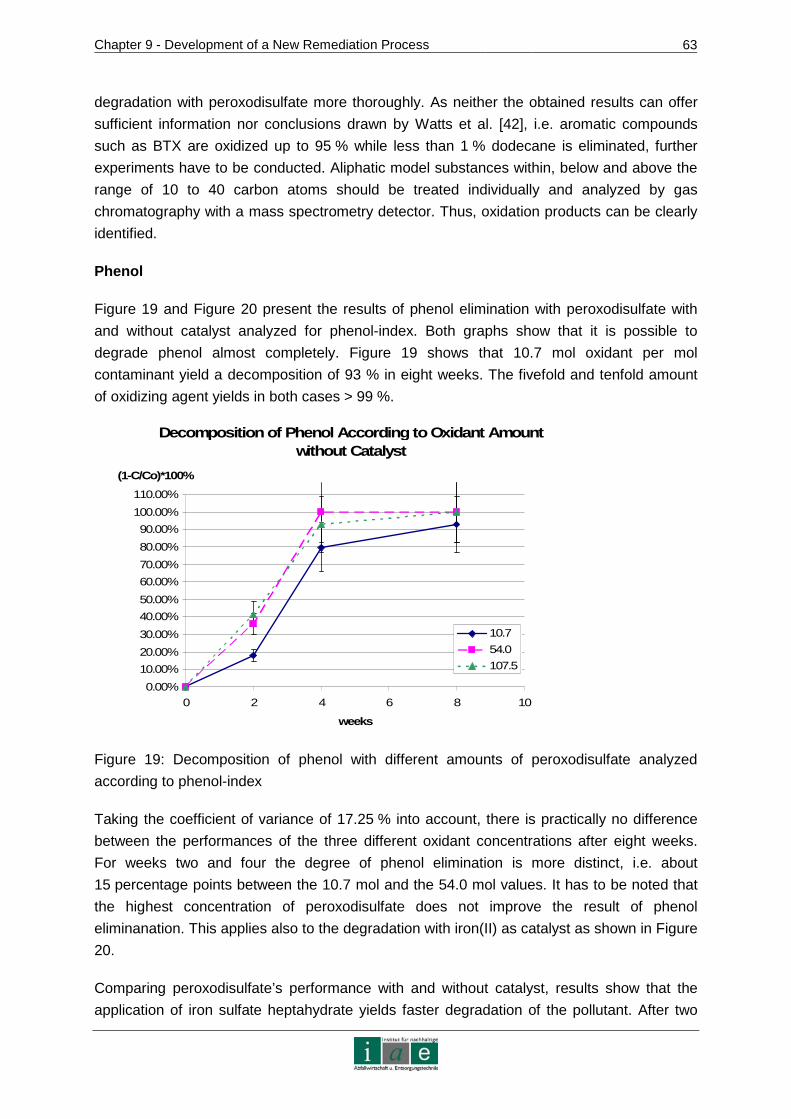
Chapter 9 - Development of a New Remediation Process
63
degradation with peroxodisulfate more thoroughly. As neither the obtained results can offer
sufficient information nor conclusions drawn by Watts et al. [42], i.e. aromatic compounds
such as BTX are oxidized up to 95 % while less than 1 % dodecane is eliminated, further
experiments have to be conducted. Aliphatic model substances within, below and above the
range of 10 to 40 carbon atoms should be treated individually and analyzed by gas
chromatography with a mass spectrometry detector. Thus, oxidation products can be clearly
identified.
Phenol
Figure 19 and Figure 20 present the results of phenol elimination with peroxodisulfate with
and without catalyst analyzed for phenol-index. Both graphs show that it is possible to
degrade phenol almost completely. Figure 19 shows that 10.7 mol oxidant per mol
contaminant yield a decomposition of 93 % in eight weeks. The fivefold and tenfold amount
of oxidizing agent yields in both cases > 99 %.
Decomposition of Phenol According to Oxidant Amount without Catalyst
0.00%
10.00%
20.00%
30.00%
40.00%
50.00%
60.00%
70.00%
80.00%
90.00%
100.00%
110.00%
0 2 4 6 8 10
weeks
(1-C/Co)*100%
10.7
54.0
107.5
Figure 19: Decomposition of phenol with different amounts of peroxodisulfate analyzed
according to phenol-index
Taking the coefficient of variance of 17.25 % into account, there is practically no difference
between the performances of the three different oxidant concentrations after eight weeks.
For weeks two and four the degree of phenol elimination is more distinct, i.e. about
15 percentage points between the 10.7 mol and the 54.0 mol values. It has to be noted that
the highest concentration of peroxodisulfate does not improve the result of phenol
eliminanation. This applies also to the degradation with iron(II) as catalyst as shown in Figure
20.
Comparing peroxodisulfate’s performance with and without catalyst, results show that the
application of iron sulfate heptahydrate yields faster degradation of the pollutant. After two

Chapter 9 - Development of a New Remediation Process
64
weeks the amounts of 54.0 and 107.5 mol oxidant decompose 95 and > 99 % of phenol
compared to 36 and 42 % without catalyst, respectively. As for 10.7 mol peroxodisulfate per
mol phenol, there is only a difference in performance after two weeks, where it degrades
56 % instead of 18 % of phenol. The four and eight week values vary insignificantly.
Decomposition of Phenol According to Oxidant Amount with Catalyst
0.00%
10.00%
20.00%
30.00%
40.00%
50.00%
60.00%
70.00%
80.00%
90.00%
100.00%
110.00%
0 1 2 3 4 5 6 7 8 9
weeks
(1-C/Co)*100%
10.7
54.0
107.5
Figure 20: Decomposition of phenol with different amounts of peroxodisulfate with catalyst
analyzed according to phenol-index
It can thus be concluded that an amount of 54.0 mol peroxodisulfate per mol phenol with an
application of 3.7 mg FeSO4*7 H2O per g of soil can decompose > 95 % of the contaminant
in two weeks and > 99 in four weeks. The double amount of oxidant cannot increase the
performance significantly. Therefore, it is recommendable to investigate the performances of
oxidant concentrations between 10.7 and 54.0 mol with an optimized amount of catalyst, as
in this study the amount of catalyst has not been varied with the different concentrations of
peroxodisulfate. Furthermore, analysis should be conducted after one week reaction time.
After eight weeks of reaction time, the influence on the soil’s acidity was measured. Table 15
shows the impact of oxidant and catalyst on the material’s pH-value.
Table 15: Soil pH alteration by peroxodisulfate and iron(II) application
Specification Amount Oxidant *) pH-value Specification Amount Oxidant *) pH-value
initial 0 > 8.0 initial 0 > 8.0
0 7.8 0 6.5
10.7 5.5 10.7 4.6
54.0 3.9 54.0 3.5 after 8 weeks
107.5 3.4
after 8 weeks with Fe(II) catalyst
107.5 3.0 *) in mol per mol phenol
Chapter 9 - Development of a New Remediation Process
65
According to the obtained data, the pH-value in soil decreases with the amount of added
peroxodisulfate. This conincides with the theoretic consideration of the formation of HSO4-
(see equations Eq. 11, Eq. 16 and Eq. 17 in Chapter 7). In case of catalyst application, the
effect is even stronger. This is a possible disadvantage of peroxodisulfate application as
ISCO chemical.
9.2.3 Conclusion
Due to different experimental conditions it is difficult to compare the obtained results for
diesel oil elimination with other studies. In a thorough study of catalyst influence, Watts et al.
[18] decomposed diesel oil in soil with hydrogen peroxide and iron(II) sulfate at a molar ratio
of between 42 and 86 to 1 (oxidant to catalyst) and a molar ratio of between 237 and
340 to 1 of hydrogen peroxide to diesel. The 5 g soil samples were contaminated with a
concentration of 1000 mg diesel per kilogram soil and mixed with 3.5 ml of oxidant and
catalyst solution. After one hour hydrogen peroxide was consumed and yielded over 60 % of
diesel elimination. Proper experiments resulted in the decomposition of 84 % diesel by
286.4 mol ammonium peroxodisulfate per mol contaminant with an iron(II) catalyst in a 300 g
soil sample with 20 % humidity. However, depletion with peroxodisulfate took 12 weeks
whereas Watts et al. [42] finished experiments after one hour. Nevertheless, the water
content of the 5 g soil sample was above 40 % and the oxidant concentration was between
0.2 and 0.3 mol/g soil, whereas only 0.01 mol of peroxodisulfate accounted for 1 g soil in the
proper experiments. Therefore, it can be assumed that the high elimination of 60 % diesel in
one hour is due to an optimized contact between contaminant and oxidant, as well as
between oxidant and catalyst, a factor which has not been sophisticated in the proper
experiments in order not to detach too much from a realistic soil system under remediation
conditions.
In order to meet the requirements of Austrian legislation, diesel contamination has to be
reduced to below 500 mg/kg soil (intervention value) or even below 100 mg/kg soil
(inspection value). Considering above presented results, oxidation with ammonium
peroxodisulfate during twelve weeks does not meet the requirements. With an initial diesel
contamination of more than 9.6 g/kg and a maximum elimination of 84 % still 1.56 g/kg
remain. This implies that longer treatment times are required. It has to be considered as well,
that the molar ratio between pollutant and oxidant, in this case 1 : 284.6, is very high.
Additionally, the conditions for contaminant removal by peroxodisulfate oxidation at low
concentrations around 500 mg/kg need to be investigated. Another subsequent treatment, for
example bacterial remediation, might be necessary for the decomposition of low contaminant
concentration, as in this case establishing contact between pollutant and oxidant may be
very sumptuous.
Considering the facts that there has been detected a negative diesel oil elimination between
weeks two and four according to the HC-index and that diesel is depleted up to 70 % during
the first two weeks it is necessary to question these results and conduct further analysis.

Chapter 9 - Development of a New Remediation Process
66
Especially taking into account that Watts et al. [42] found that only 1 % dodecane can be
eliminated under more favorable oxidation conditions. Thus, it is recommendable to analyze
the oxidation products individually using single model substances and applying a mass
spectrometry detector.
Applying the obtained results for phenol decomposition to the Netherlands’ legislation on
phenol contamination of soil (Austria’s Standards only foresee intervention values for 30 µg/l
groundwater contamination), the remaining phenol concentration with 54.0 and 107.5 mol
oxidant after four weeks without catalyst are inferior to the intervention value of 40 mg/kg
soil. After eight weeks all three concentrations meet the requirement. With catalyst
application the two higher oxidant amounts degrade phenole sufficiently after two weeks,
while 10.7 mol of oxidant decrease phenol to a concentration of 40 mg/kg after eight weeks.
Considering the great amount of oxidants needed for fast degradation, an eight week period
does not seem disadvantageous. However, considering the target value of 0.05 mg/kg, none
of the oxidant concentrations can meet this limit. Soil has been contaminated with 500 mg/kg
soil. Eliminating phenol down to a concentration of 0.05 mg/kg would require a performance
of 99.99 %. Best yields of 99.97 % were achieved both with 54.0 and 107.5 mol with catalyst
after eight weeks. Thus, it might be possible to meet the target value by in-situ oxidation with
ammonium peroxodisulfate and iron(II) as catalyst.
As there are no similar experiments reported in Chapter 7 on in-situ oxidation of phenol in
soil, it is difficult to position the obtained results. However, Huang et al. [45, p. 559] reported
that peroxodisulfate activated at 40 °C preferably degrades carbon-carbon double bondings
and benzene rings attached to functional groups instead of aliphatic saturated hydrocarbons.
This observation can be confirmed by above obtained results as phenol is eliminated more
quickly and thoroughly than diesel. After four weeks the best yield of diesel decomposition
according to the HC-index is > 65 %, while phenol is eliminated more than 99 % according to
the phenol-index.
Altogether, in-situ oxidation of diesel and phenol with ammonium peroxodisulfate seems a
promising method for site decontamination. Above presented results show, that
peroxodisulfate is able to eliminate > 99 % of phenol and 84 % of diesel with iron(II) sulfate
heptahydrate at 15 °C and 20 % soil humidity. Never theless, the obtained results can only be
considered a preliminary basis to a more thorough investigation for several reasons:
assays for better understanding of diesel elimination need to be conducted in order to
explain the behavior of the presented curves, e.g. decomposition of single
constituents under the same conditions could be analyzed by gas chromatography
with mass spectrometry,
multiple experiments have to be run in order to confirm the obtained results,
different concentrations of catalyst in accordance to the amount of oxidant have to be
administered in order to foster an optimized performance,
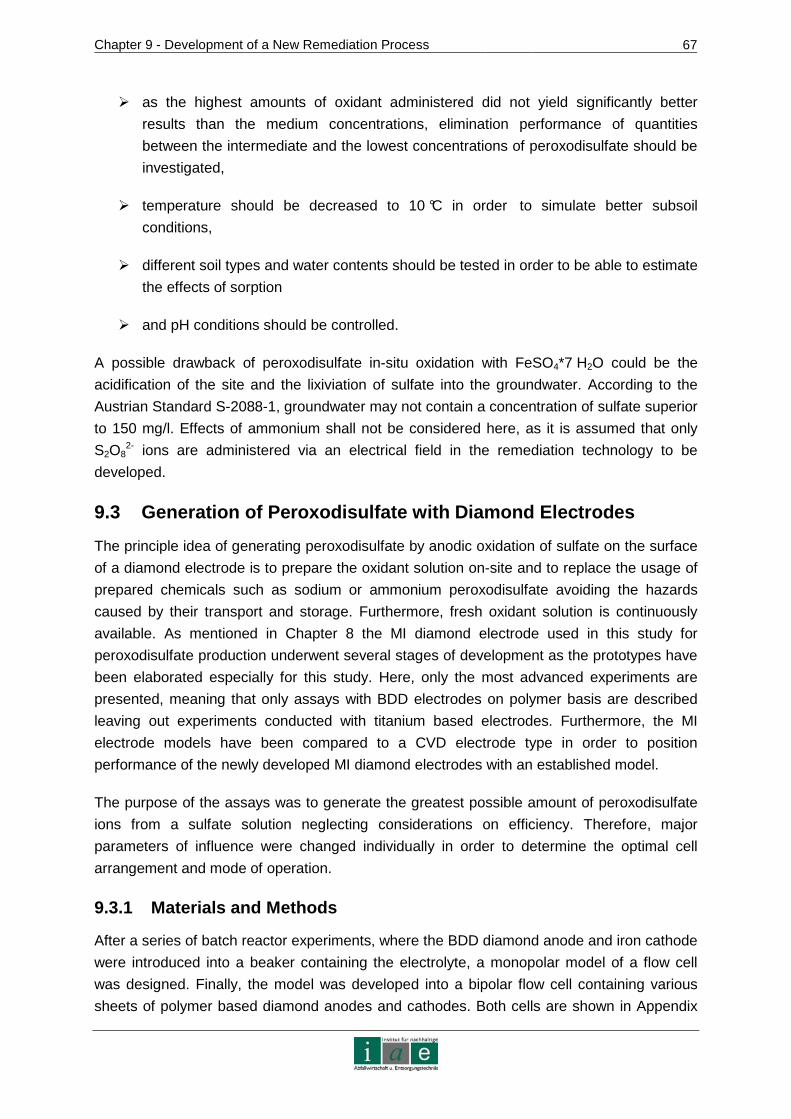
Chapter 9 - Development of a New Remediation Process
67
as the highest amounts of oxidant administered did not yield significantly better
results than the medium concentrations, elimination performance of quantities
between the intermediate and the lowest concentrations of peroxodisulfate should be
investigated,
temperature should be decreased to 10 °C in order to simulate better subsoil
conditions,
different soil types and water contents should be tested in order to be able to estimate
the effects of sorption
and pH conditions should be controlled.
A possible drawback of peroxodisulfate in-situ oxidation with FeSO4*7 H2O could be the
acidification of the site and the lixiviation of sulfate into the groundwater. According to the
Austrian Standard S-2088-1, groundwater may not contain a concentration of sulfate superior
to 150 mg/l. Effects of ammonium shall not be considered here, as it is assumed that only
S2O82- ions are administered via an electrical field in the remediation technology to be
developed.
9.3 Generation of Peroxodisulfate with Diamond Elec trodes
The principle idea of generating peroxodisulfate by anodic oxidation of sulfate on the surface
of a diamond electrode is to prepare the oxidant solution on-site and to replace the usage of
prepared chemicals such as sodium or ammonium peroxodisulfate avoiding the hazards
caused by their transport and storage. Furthermore, fresh oxidant solution is continuously
available. As mentioned in Chapter 8 the MI diamond electrode used in this study for
peroxodisulfate production underwent several stages of development as the prototypes have
been elaborated especially for this study. Here, only the most advanced experiments are
presented, meaning that only assays with BDD electrodes on polymer basis are described
leaving out experiments conducted with titanium based electrodes. Furthermore, the MI
electrode models have been compared to a CVD electrode type in order to position
performance of the newly developed MI diamond electrodes with an established model.
The purpose of the assays was to generate the greatest possible amount of peroxodisulfate
ions from a sulfate solution neglecting considerations on efficiency. Therefore, major
parameters of influence were changed individually in order to determine the optimal cell
arrangement and mode of operation.
9.3.1 Materials and Methods
After a series of batch reactor experiments, where the BDD diamond anode and iron cathode
were introduced into a beaker containing the electrolyte, a monopolar model of a flow cell
was designed. Finally, the model was developed into a bipolar flow cell containing various
sheets of polymer based diamond anodes and cathodes. Both cells are shown in Appendix
Chapter 9 - Development of a New Remediation Process
68
11 – Photos. The exact description of the diamond electrodes is presented in detail in
Chapter 8, whereas the cells’ set-ups are characterized in the following.
Monopolar Flow Cell
The monopolar flow cell (see Figure 21) consisted of a plastic casing with one in- and outlet
for electrolyte circulation, a stainless steel cathode and a diamond anode implanted in a
polymer base contacted with a mixed oxide metal. The circular casing consisting of two
halves had an inner diameter of 10 cm. In between the electrodes a glass fiber membrane
was placed. The round steel cathode of an area of 79 cm² and the octagonal diamond anode
of an area of 54 cm² were located at each side of the membrane at a total distance of about
1 cm. All experiments were conducted with one electrolyte circuit entering the anode
compartment from the bottom and leaving at its top through silicon tubes circulated by a
garden pump. This way produced gases can escape with the electrolyte from the electrolysis
cell. As the glass fiber membrane did not seal the two electrode compartments completely,
the electrolyte was able to enter the cathode room. The electrolyte was prepared from
distilled water and sodium sulfate at a concentration of 0.85 M (+/- 0.01 M) and stored in a
glass bowl. In case of temperature regulation, the electrolyte was circulated through a
thermostat bath set at 10 °C in a plastic tube in o rder to obtain 15 °C (+/- 2°C) before
entering the cell. The experiments were run galvanostatically at 14, 28 and 56 mA/cm².
Figure 21: Schematic set-up of the monopolar MI BDD polymer electrode
The generated amount of oxidants, in this case peroxodisulfate, was measured by
withdrawing approximately every 0.375 Ah a sample from the cell outlet. To an amount of
20 ml approximately 20 ml of 10 % H2SO4 and an excess amount of KI in solution were
added. The samples were sealed by screw taps and kept in the dark over night before
iodometric titration (iodometric titration is explained in Appendix 7 – Chemical Analytical
Methods). Thus the total amount of produced peroxodisulfate was determined. The cells
efficiency was calculated according to Faraday’s law (see equation Eq. 39).
Chapter 9 - Development of a New Remediation Process
69
The mayor parameters changed were current density and number of glass fiber membranes.
Table 16 shows a crucial series of experiments conducted with the monopolar flow cell.
Table 16: Resume of experiments conducted with the monopolar flow cell
# current density temperature sulfate concentration # of membranes
mA/cm² °C mol/l
1 14 15 0.85 1
2 28 15 0.85 1
3 56 15 0.85 1
4 14 15 0.85 5
5 28 15 0.85 5
6 56 15 0.85 5
7 28 15 0.85 10
8 56 15 0.85 10
9 28 15 0.85 30
10 28 15 0.85 47
Bipolar Flow Cell
Following the monopolar cell assays, a more elaborated bipolar flow cell was tested. This
model consisted of two mixed oxide electrodes between which three diamond electrode foils
on polymer basis were placed. The BDD electrodes were embedded in a polymer sheet.
Between each electrode pair a total of four glass fiber membrane packages was located. The
distance between the electrodes was 6 mm. Appendix 11 – Photos shows a picture of the
cell, Figure 15 illustrated the basic scheme. The mixed oxide metal sheets were connected
as anode and cathode, while the bipolar diamond electrodes functioned both as anode and
cathode. The total area of the diamond anode surface was 45 cm². The cell disposed of two
inlets and outlets, one pair for the cathodic and another for the anodic room. Thus,
experiments were conducted with two electrolyte circuits. Both, anolyte and catholyte were
administered by a garden pump at a maximum velocity of 25 l/h. The flow was regulated
manually with laboratory valves. Therefore, the electrolytes did not always circulate with the
same velocity. Consequently, a quasi stationary operation mode was simulated. The
electrolytes were composed of a 0.85 mol/l sodium sulfate solution and sulfuric acid in
different concentrations (0.17, 0.43 and 0.85 mol/l (+/- 0.01 mol/l)) and stored in glass
beakers. These were surrounded by plastic tubes fed with cooling water. The electrolyte
administration tubes were also conducted via a thermostat in order to temperate anolyte and
catholyte. Operation was galvanostatic at different current densities. Table 17 presents the
final series of conducted experiments, in which the parameters current density, temperature,
electrolyte’s sulfate concentration and number of membranes were varied.
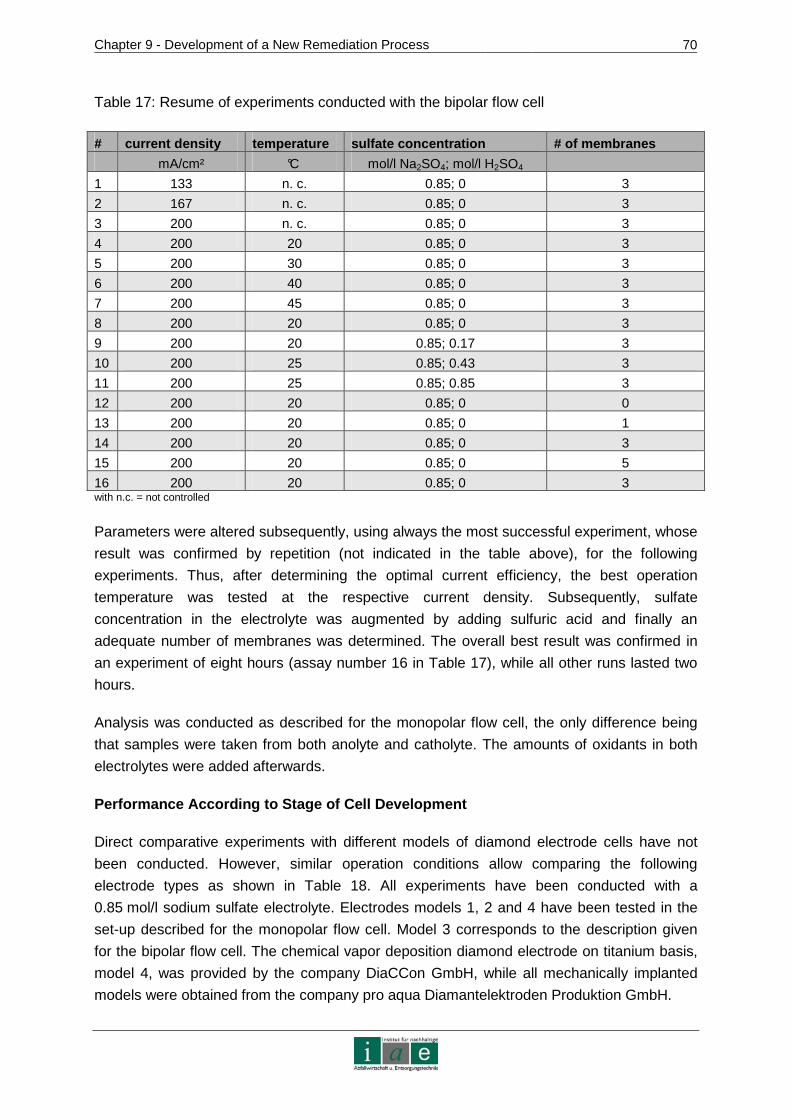
Chapter 9 - Development of a New Remediation Process
70
Table 17: Resume of experiments conducted with the bipolar flow cell
# current density temperature sulfate concentration # of membranes
mA/cm² °C mol/l Na2SO4; mol/l H2SO4
1 133 n. c. 0.85; 0 3
2 167 n. c. 0.85; 0 3
3 200 n. c. 0.85; 0 3
4 200 20 0.85; 0 3
5 200 30 0.85; 0 3
6 200 40 0.85; 0 3
7 200 45 0.85; 0 3
8 200 20 0.85; 0 3
9 200 20 0.85; 0.17 3
10 200 25 0.85; 0.43 3
11 200 25 0.85; 0.85 3
12 200 20 0.85; 0 0
13 200 20 0.85; 0 1
14 200 20 0.85; 0 3
15 200 20 0.85; 0 5
16 200 20 0.85; 0 3 with n.c. = not controlled
Parameters were altered subsequently, using always the most successful experiment, whose
result was confirmed by repetition (not indicated in the table above), for the following
experiments. Thus, after determining the optimal current efficiency, the best operation
temperature was tested at the respective current density. Subsequently, sulfate
concentration in the electrolyte was augmented by adding sulfuric acid and finally an
adequate number of membranes was determined. The overall best result was confirmed in
an experiment of eight hours (assay number 16 in Table 17), while all other runs lasted two
hours.
Analysis was conducted as described for the monopolar flow cell, the only difference being
that samples were taken from both anolyte and catholyte. The amounts of oxidants in both
electrolytes were added afterwards.
Performance According to Stage of Cell Development
Direct comparative experiments with different models of diamond electrode cells have not
been conducted. However, similar operation conditions allow comparing the following
electrode types as shown in Table 18. All experiments have been conducted with a
0.85 mol/l sodium sulfate electrolyte. Electrodes models 1, 2 and 4 have been tested in the
set-up described for the monopolar flow cell. Model 3 corresponds to the description given
for the bipolar flow cell. The chemical vapor deposition diamond electrode on titanium basis,
model 4, was provided by the company DiaCCon GmbH, while all mechanically implanted
models were obtained from the company pro aqua Diamantelektroden Produktion GmbH.
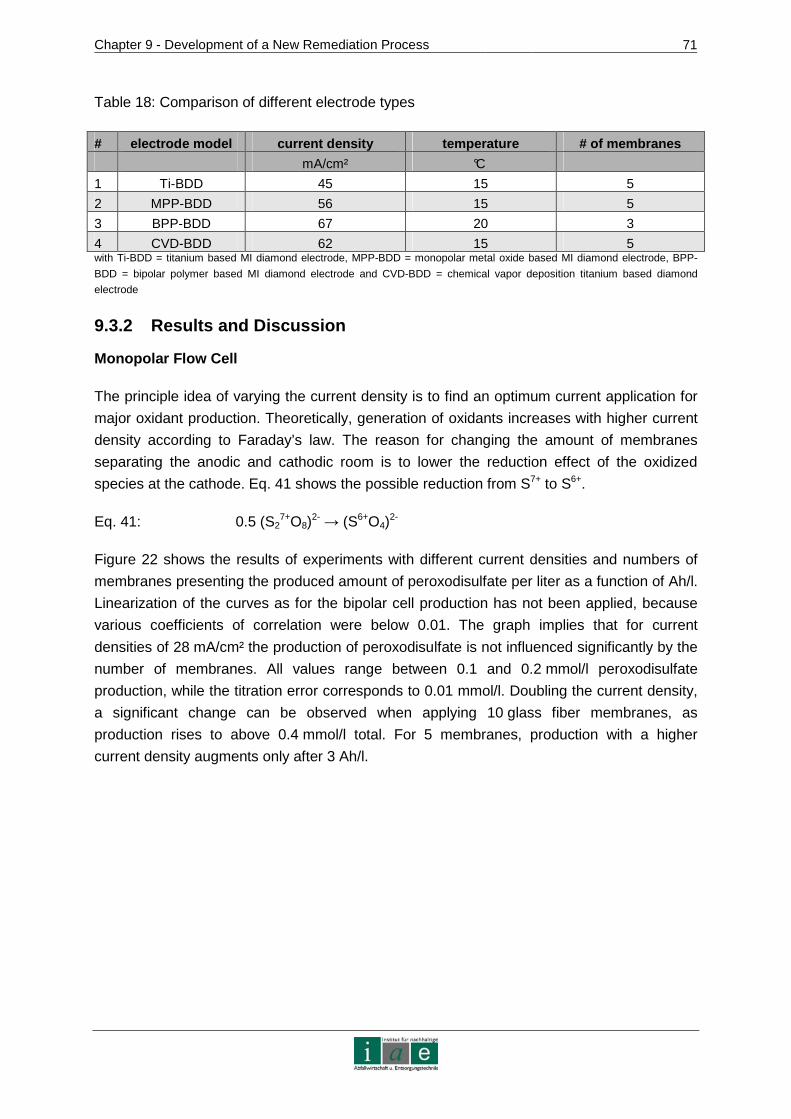
Chapter 9 - Development of a New Remediation Process
71
Table 18: Comparison of different electrode types
# electrode model current density temperature # of membranes
mA/cm² °C
1 Ti-BDD 45 15 5
2 MPP-BDD 56 15 5
3 BPP-BDD 67 20 3
4 CVD-BDD 62 15 5 with Ti-BDD = titanium based MI diamond electrode, MPP-BDD = monopolar metal oxide based MI diamond electrode, BPP-
BDD = bipolar polymer based MI diamond electrode and CVD-BDD = chemical vapor deposition titanium based diamond
electrode
9.3.2 Results and Discussion
Monopolar Flow Cell
The principle idea of varying the current density is to find an optimum current application for
major oxidant production. Theoretically, generation of oxidants increases with higher current
density according to Faraday’s law. The reason for changing the amount of membranes
separating the anodic and cathodic room is to lower the reduction effect of the oxidized
species at the cathode. Eq. 41 shows the possible reduction from S7+ to S6+.
Eq. 41: 0.5 (S27+O8)
2- → (S6+O4)2-
Figure 22 shows the results of experiments with different current densities and numbers of
membranes presenting the produced amount of peroxodisulfate per liter as a function of Ah/l.
Linearization of the curves as for the bipolar cell production has not been applied, because
various coefficients of correlation were below 0.01. The graph implies that for current
densities of 28 mA/cm² the production of peroxodisulfate is not influenced significantly by the
number of membranes. All values range between 0.1 and 0.2 mmol/l peroxodisulfate
production, while the titration error corresponds to 0.01 mmol/l. Doubling the current density,
a significant change can be observed when applying 10 glass fiber membranes, as
production rises to above 0.4 mmol/l total. For 5 membranes, production with a higher
current density augments only after 3 Ah/l.
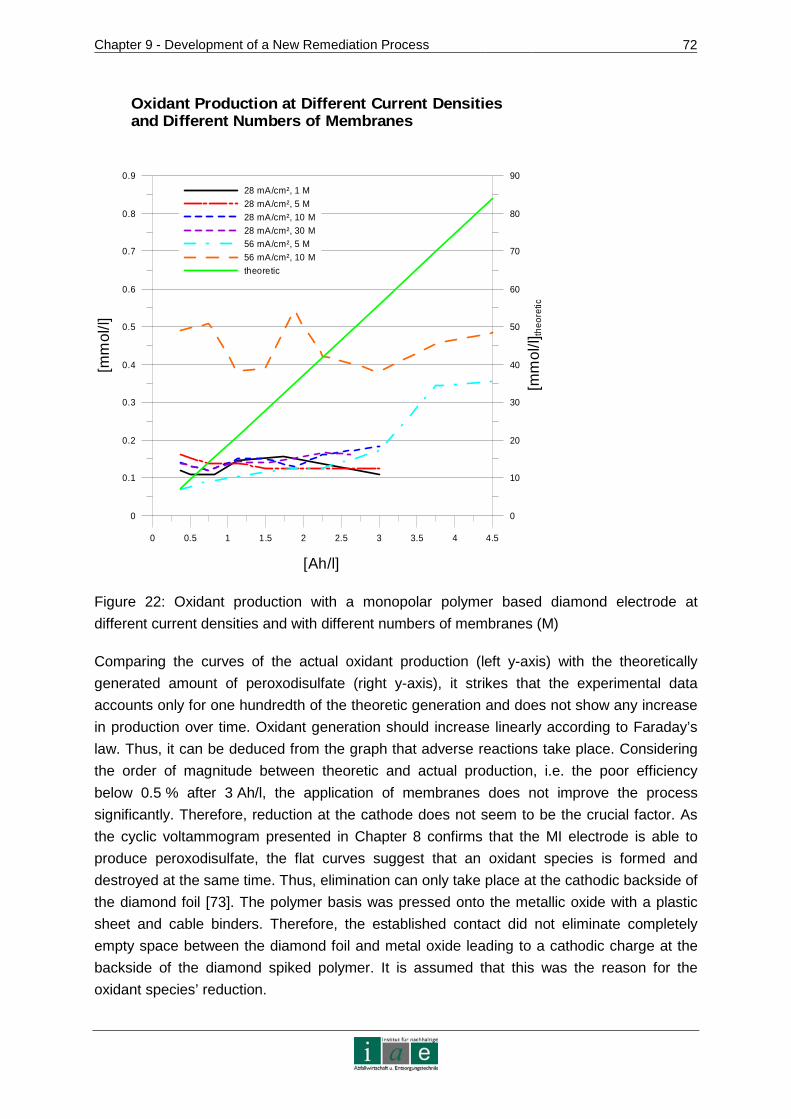
Chapter 9 - Development of a New Remediation Process
72
0 0.5 1 1.5 2 2.5 3 3.5 4 4.5
[Ah/l]
0
0.1
0.2
0.3
0.4
0.5
0.6
0.7
0.8
0.9
[mm
ol/l]
28 mA/cm², 1 M28 mA/cm², 5 M28 mA/cm², 10 M28 mA/cm², 30 M56 mA/cm², 5 M56 mA/cm², 10 Mtheoretic
0
10
20
30
40
50
60
70
80
90
[mm
ol/l]
theo
retic
Oxidant Production at Different Current Densities and Different Numbers of Membranes
Figure 22: Oxidant production with a monopolar polymer based diamond electrode at
different current densities and with different numbers of membranes (M)
Comparing the curves of the actual oxidant production (left y-axis) with the theoretically
generated amount of peroxodisulfate (right y-axis), it strikes that the experimental data
accounts only for one hundredth of the theoretic generation and does not show any increase
in production over time. Oxidant generation should increase linearly according to Faraday’s
law. Thus, it can be deduced from the graph that adverse reactions take place. Considering
the order of magnitude between theoretic and actual production, i.e. the poor efficiency
below 0.5 % after 3 Ah/l, the application of membranes does not improve the process
significantly. Therefore, reduction at the cathode does not seem to be the crucial factor. As
the cyclic voltammogram presented in Chapter 8 confirms that the MI electrode is able to
produce peroxodisulfate, the flat curves suggest that an oxidant species is formed and
destroyed at the same time. Thus, elimination can only take place at the cathodic backside of
the diamond foil [73]. The polymer basis was pressed onto the metallic oxide with a plastic
sheet and cable binders. Therefore, the established contact did not eliminate completely
empty space between the diamond foil and metal oxide leading to a cathodic charge at the
backside of the diamond spiked polymer. It is assumed that this was the reason for the
oxidant species’ reduction.
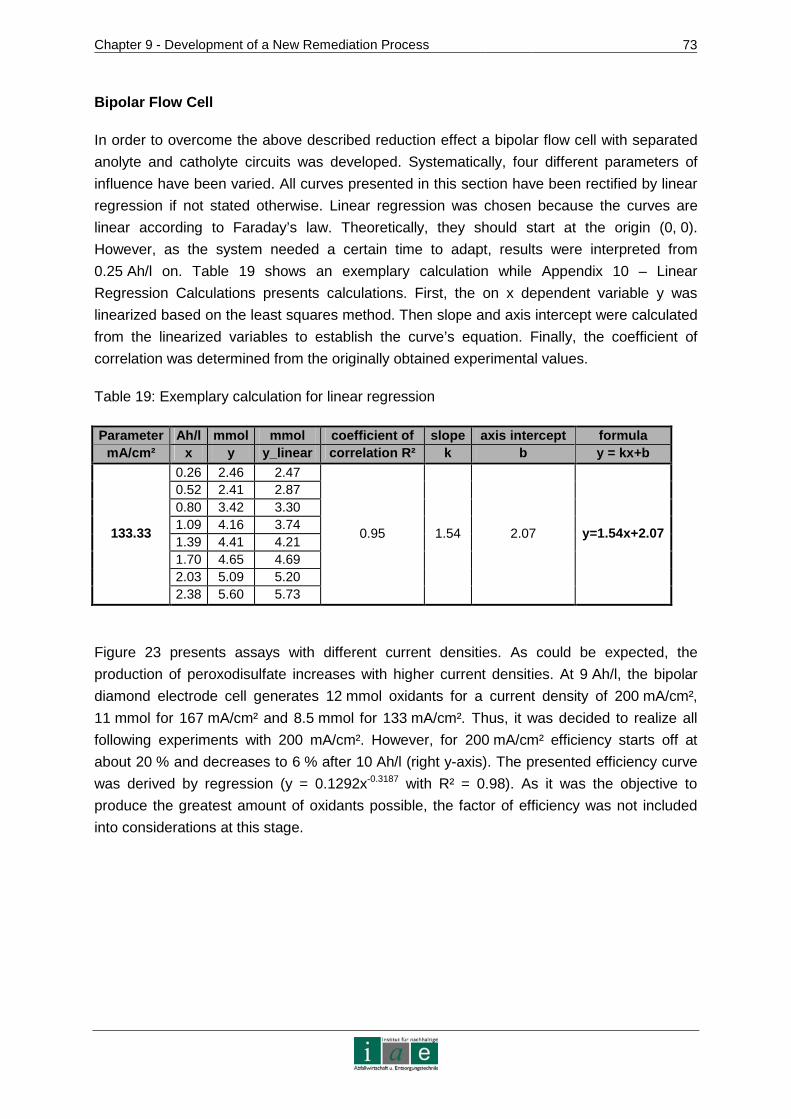
Chapter 9 - Development of a New Remediation Process
73
Bipolar Flow Cell
In order to overcome the above described reduction effect a bipolar flow cell with separated
anolyte and catholyte circuits was developed. Systematically, four different parameters of
influence have been varied. All curves presented in this section have been rectified by linear
regression if not stated otherwise. Linear regression was chosen because the curves are
linear according to Faraday’s law. Theoretically, they should start at the origin (0, 0).
However, as the system needed a certain time to adapt, results were interpreted from
0.25 Ah/l on. Table 19 shows an exemplary calculation while Appendix 10 – Linear
Regression Calculations presents calculations. First, the on x dependent variable y was
linearized based on the least squares method. Then slope and axis intercept were calculated
from the linearized variables to establish the curve’s equation. Finally, the coefficient of
correlation was determined from the originally obtained experimental values.
Table 19: Exemplary calculation for linear regression
Parameter Ah/l mmol mmol coefficient of slope axis intercept formula mA/cm² x y y_linear correlation R² k b y = kx+b
0.26 2.46 2.47 0.52 2.41 2.87 0.80 3.42 3.30 1.09 4.16 3.74 1.39 4.41 4.21 1.70 4.65 4.69 2.03 5.09 5.20
133.33
2.38 5.60 5.73
0.95 1.54 2.07 y=1.54x+2.07
Figure 23 presents assays with different current densities. As could be expected, the
production of peroxodisulfate increases with higher current densities. At 9 Ah/l, the bipolar
diamond electrode cell generates 12 mmol oxidants for a current density of 200 mA/cm²,
11 mmol for 167 mA/cm² and 8.5 mmol for 133 mA/cm². Thus, it was decided to realize all
following experiments with 200 mA/cm². However, for 200 mA/cm² efficiency starts off at
about 20 % and decreases to 6 % after 10 Ah/l (right y-axis). The presented efficiency curve
was derived by regression (y = 0.1292x-0.3187 with R² = 0.98). As it was the objective to
produce the greatest amount of oxidants possible, the factor of efficiency was not included
into considerations at this stage.
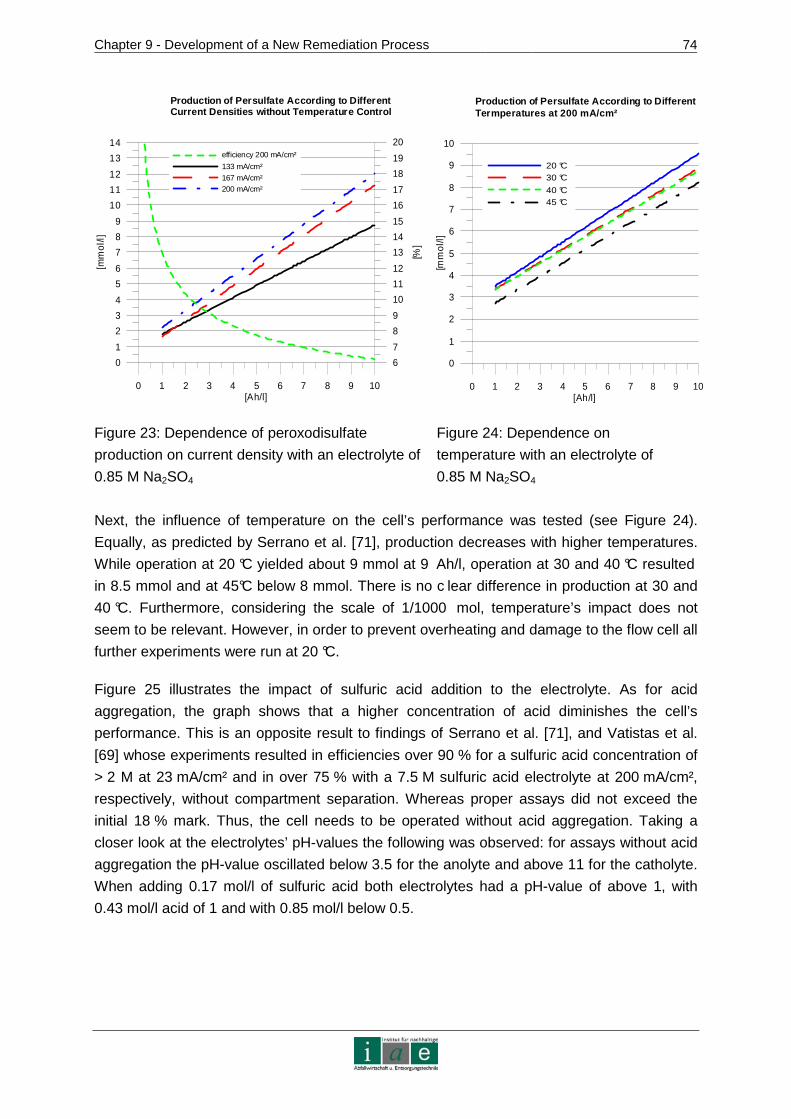
Chapter 9 - Development of a New Remediation Process
74
0 1 2 3 4 5 6 7 8 9 10[Ah/l]
0
1
2
3
4
5
6
7
8
9
10
11
12
13
14
[mm
ol/l]
efficiency 200 mA/cm²
133 mA/cm²
167 mA/cm²
200 mA/cm²
6
7
8
9
10
11
12
13
14
15
16
17
18
19
20
[%]
Production of Persulfate According to Different Current Densities without Temperature Control
0 1 2 3 4 5 6 7 8 9 10[Ah/l]
0
1
2
3
4
5
6
7
8
9
10
[mm
ol/l]
20 °C30 °C
40 °C45 °C
Production of Persulfate According to Different Termperatures at 200 mA/cm²
Figure 23: Dependence of peroxodisulfate
production on current density with an electrolyte of
0.85 M Na2SO4
Figure 24: Dependence on
temperature with an electrolyte of
0.85 M Na2SO4
Next, the influence of temperature on the cell’s performance was tested (see Figure 24).
Equally, as predicted by Serrano et al. [71], production decreases with higher temperatures.
While operation at 20 °C yielded about 9 mmol at 9 Ah/l, operation at 30 and 40 °C resulted
in 8.5 mmol and at 45°C below 8 mmol. There is no c lear difference in production at 30 and
40 °C. Furthermore, considering the scale of 1/1000 mol, temperature’s impact does not
seem to be relevant. However, in order to prevent overheating and damage to the flow cell all
further experiments were run at 20 °C.
Figure 25 illustrates the impact of sulfuric acid addition to the electrolyte. As for acid
aggregation, the graph shows that a higher concentration of acid diminishes the cell’s
performance. This is an opposite result to findings of Serrano et al. [71], and Vatistas et al.
[69] whose experiments resulted in efficiencies over 90 % for a sulfuric acid concentration of
> 2 M at 23 mA/cm² and in over 75 % with a 7.5 M sulfuric acid electrolyte at 200 mA/cm²,
respectively, without compartment separation. Whereas proper assays did not exceed the
initial 18 % mark. Thus, the cell needs to be operated without acid aggregation. Taking a
closer look at the electrolytes’ pH-values the following was observed: for assays without acid
aggregation the pH-value oscillated below 3.5 for the anolyte and above 11 for the catholyte.
When adding 0.17 mol/l of sulfuric acid both electrolytes had a pH-value of above 1, with
0.43 mol/l acid of 1 and with 0.85 mol/l below 0.5.
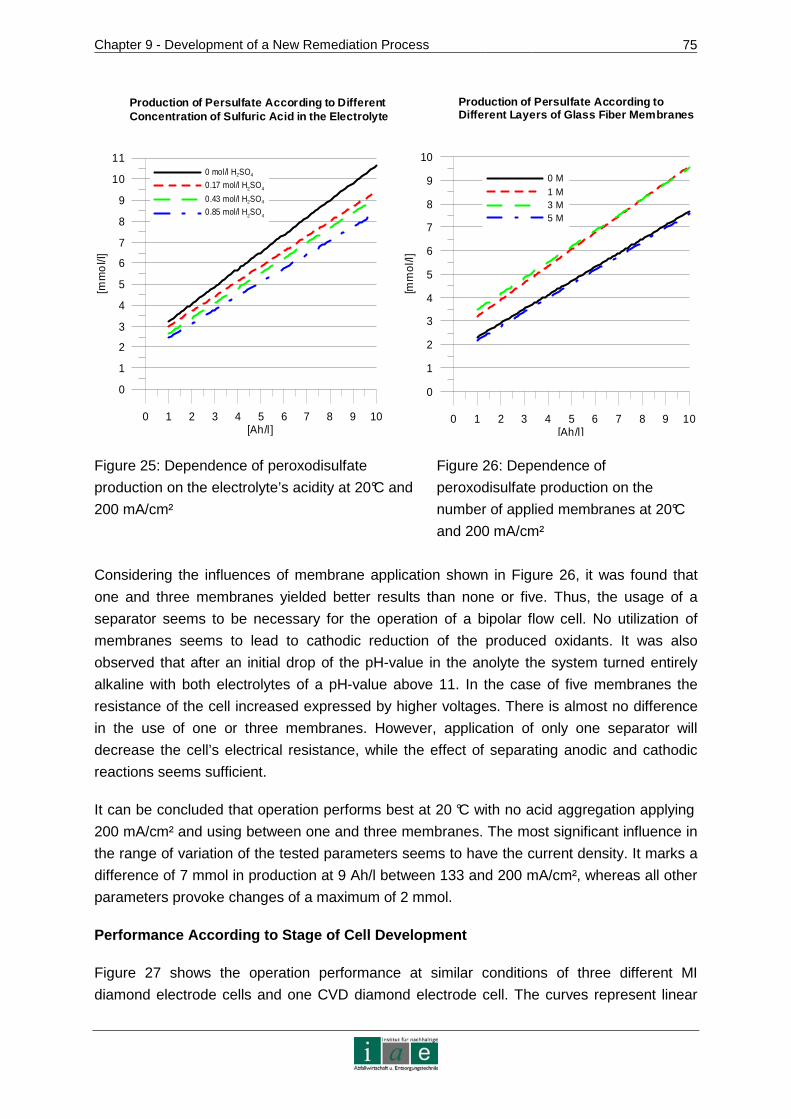
Chapter 9 - Development of a New Remediation Process
75
0 1 2 3 4 5 6 7 8 9 10[Ah/l]
0
1
2
3
4
5
6
7
8
9
10
11
[mm
ol/l
]
0 mol/l H2SO4
0.17 mol/l H2SO4
0.43 mol/l H2SO4
0.85 mol/l H2SO4
Production of Persulfate According to Different Concentration of Sulfuric Acid in the Electrolyte
0 1 2 3 4 5 6 7 8 9 10[Ah/l]
0
1
2
3
4
5
6
7
8
9
10
[mm
ol/l]
0 M1 M3 M5 M
Production of Persulfate According to Different Layers of Glass Fiber Membranes
Figure 25: Dependence of peroxodisulfate
production on the electrolyte’s acidity at 20°C and
200 mA/cm²
Figure 26: Dependence of
peroxodisulfate production on the
number of applied membranes at 20°C
and 200 mA/cm²
Considering the influences of membrane application shown in Figure 26, it was found that
one and three membranes yielded better results than none or five. Thus, the usage of a
separator seems to be necessary for the operation of a bipolar flow cell. No utilization of
membranes seems to lead to cathodic reduction of the produced oxidants. It was also
observed that after an initial drop of the pH-value in the anolyte the system turned entirely
alkaline with both electrolytes of a pH-value above 11. In the case of five membranes the
resistance of the cell increased expressed by higher voltages. There is almost no difference
in the use of one or three membranes. However, application of only one separator will
decrease the cell’s electrical resistance, while the effect of separating anodic and cathodic
reactions seems sufficient.
It can be concluded that operation performs best at 20 °C with no acid aggregation applying
200 mA/cm² and using between one and three membranes. The most significant influence in
the range of variation of the tested parameters seems to have the current density. It marks a
difference of 7 mmol in production at 9 Ah/l between 133 and 200 mA/cm², whereas all other
parameters provoke changes of a maximum of 2 mmol.
Performance According to Stage of Cell Development
Figure 27 shows the operation performance at similar conditions of three different MI
diamond electrode cells and one CVD diamond electrode cell. The curves represent linear
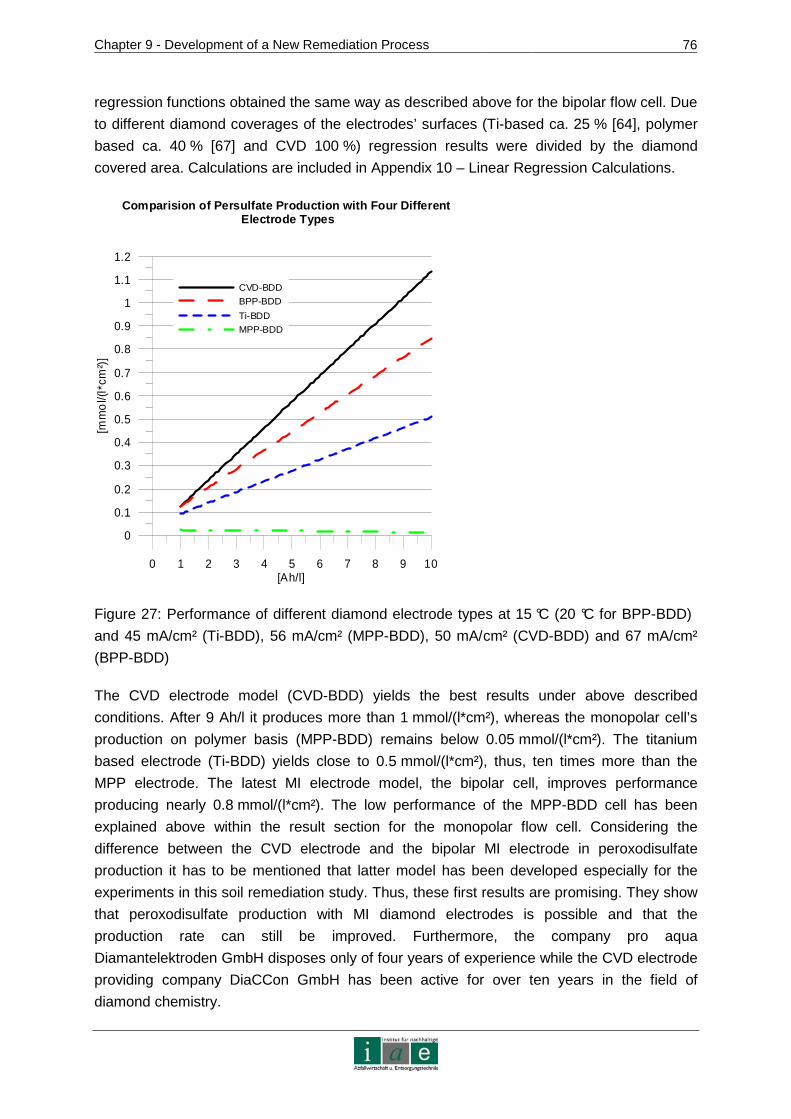
Chapter 9 - Development of a New Remediation Process
76
regression functions obtained the same way as described above for the bipolar flow cell. Due
to different diamond coverages of the electrodes’ surfaces (Ti-based ca. 25 % [64], polymer
based ca. 40 % [67] and CVD 100 %) regression results were divided by the diamond
covered area. Calculations are included in Appendix 10 – Linear Regression Calculations.
0 1 2 3 4 5 6 7 8 9 10[Ah/l]
0
0.1
0.2
0.3
0.4
0.5
0.6
0.7
0.8
0.9
1
1.1
1.2
[mm
ol/(
l*cm
²)]
CVD-BDD
BPP-BDD
Ti-BDD
MPP-BDD
Comparision of Persulfate Production with Four Diff erent Electrode Types
Figure 27: Performance of different diamond electrode types at 15 °C (20 °C for BPP-BDD)
and 45 mA/cm² (Ti-BDD), 56 mA/cm² (MPP-BDD), 50 mA/cm² (CVD-BDD) and 67 mA/cm²
(BPP-BDD)
The CVD electrode model (CVD-BDD) yields the best results under above described
conditions. After 9 Ah/l it produces more than 1 mmol/(l*cm²), whereas the monopolar cell’s
production on polymer basis (MPP-BDD) remains below 0.05 mmol/(l*cm²). The titanium
based electrode (Ti-BDD) yields close to 0.5 mmol/(l*cm²), thus, ten times more than the
MPP electrode. The latest MI electrode model, the bipolar cell, improves performance
producing nearly 0.8 mmol/(l*cm²). The low performance of the MPP-BDD cell has been
explained above within the result section for the monopolar flow cell. Considering the
difference between the CVD electrode and the bipolar MI electrode in peroxodisulfate
production it has to be mentioned that latter model has been developed especially for the
experiments in this soil remediation study. Thus, these first results are promising. They show
that peroxodisulfate production with MI diamond electrodes is possible and that the
production rate can still be improved. Furthermore, the company pro aqua
Diamantelektroden GmbH disposes only of four years of experience while the CVD electrode
providing company DiaCCon GmbH has been active for over ten years in the field of
diamond chemistry.
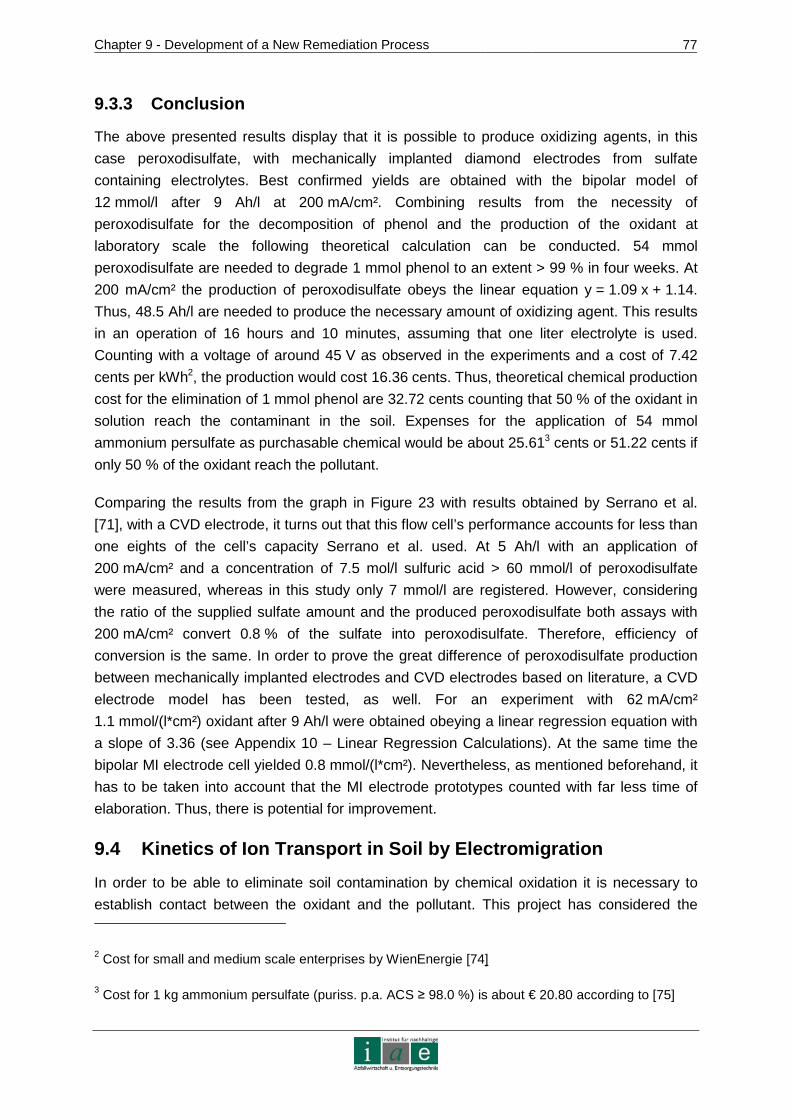
Chapter 9 - Development of a New Remediation Process
77
9.3.3 Conclusion
The above presented results display that it is possible to produce oxidizing agents, in this
case peroxodisulfate, with mechanically implanted diamond electrodes from sulfate
containing electrolytes. Best confirmed yields are obtained with the bipolar model of
12 mmol/l after 9 Ah/l at 200 mA/cm². Combining results from the necessity of
peroxodisulfate for the decomposition of phenol and the production of the oxidant at
laboratory scale the following theoretical calculation can be conducted. 54 mmol
peroxodisulfate are needed to degrade 1 mmol phenol to an extent > 99 % in four weeks. At
200 mA/cm² the production of peroxodisulfate obeys the linear equation y = 1.09 x + 1.14.
Thus, 48.5 Ah/l are needed to produce the necessary amount of oxidizing agent. This results
in an operation of 16 hours and 10 minutes, assuming that one liter electrolyte is used.
Counting with a voltage of around 45 V as observed in the experiments and a cost of 7.42
cents per kWh2, the production would cost 16.36 cents. Thus, theoretical chemical production
cost for the elimination of 1 mmol phenol are 32.72 cents counting that 50 % of the oxidant in
solution reach the contaminant in the soil. Expenses for the application of 54 mmol
ammonium persulfate as purchasable chemical would be about 25.613 cents or 51.22 cents if
only 50 % of the oxidant reach the pollutant.
Comparing the results from the graph in Figure 23 with results obtained by Serrano et al.
[71], with a CVD electrode, it turns out that this flow cell’s performance accounts for less than
one eights of the cell’s capacity Serrano et al. used. At 5 Ah/l with an application of
200 mA/cm² and a concentration of 7.5 mol/l sulfuric acid > 60 mmol/l of peroxodisulfate
were measured, whereas in this study only 7 mmol/l are registered. However, considering
the ratio of the supplied sulfate amount and the produced peroxodisulfate both assays with
200 mA/cm² convert 0.8 % of the sulfate into peroxodisulfate. Therefore, efficiency of
conversion is the same. In order to prove the great difference of peroxodisulfate production
between mechanically implanted electrodes and CVD electrodes based on literature, a CVD
electrode model has been tested, as well. For an experiment with 62 mA/cm²
1.1 mmol/(l*cm²) oxidant after 9 Ah/l were obtained obeying a linear regression equation with
a slope of 3.36 (see Appendix 10 – Linear Regression Calculations). At the same time the
bipolar MI electrode cell yielded 0.8 mmol/(l*cm²). Nevertheless, as mentioned beforehand, it
has to be taken into account that the MI electrode prototypes counted with far less time of
elaboration. Thus, there is potential for improvement.
9.4 Kinetics of Ion Transport in Soil by Electromig ration
In order to be able to eliminate soil contamination by chemical oxidation it is necessary to
establish contact between the oxidant and the pollutant. This project has considered the
2 Cost for small and medium scale enterprises by WienEnergie [74]
3 Cost for 1 kg ammonium persulfate (puriss. p.a. ACS ≥ 98.0 %) is about € 20.80 according to [75]
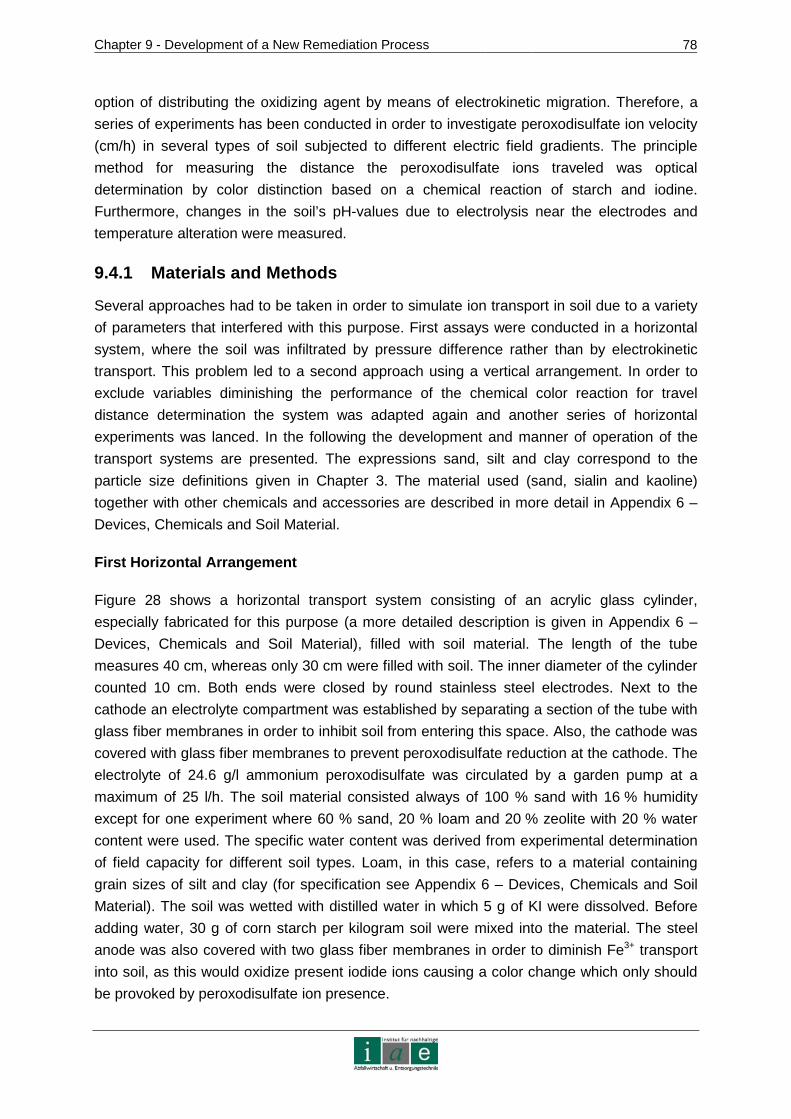
Chapter 9 - Development of a New Remediation Process
78
option of distributing the oxidizing agent by means of electrokinetic migration. Therefore, a
series of experiments has been conducted in order to investigate peroxodisulfate ion velocity
(cm/h) in several types of soil subjected to different electric field gradients. The principle
method for measuring the distance the peroxodisulfate ions traveled was optical
determination by color distinction based on a chemical reaction of starch and iodine.
Furthermore, changes in the soil’s pH-values due to electrolysis near the electrodes and
temperature alteration were measured.
9.4.1 Materials and Methods
Several approaches had to be taken in order to simulate ion transport in soil due to a variety
of parameters that interfered with this purpose. First assays were conducted in a horizontal
system, where the soil was infiltrated by pressure difference rather than by electrokinetic
transport. This problem led to a second approach using a vertical arrangement. In order to
exclude variables diminishing the performance of the chemical color reaction for travel
distance determination the system was adapted again and another series of horizontal
experiments was lanced. In the following the development and manner of operation of the
transport systems are presented. The expressions sand, silt and clay correspond to the
particle size definitions given in Chapter 3. The material used (sand, sialin and kaoline)
together with other chemicals and accessories are described in more detail in Appendix 6 –
Devices, Chemicals and Soil Material.
First Horizontal Arrangement
Figure 28 shows a horizontal transport system consisting of an acrylic glass cylinder,
especially fabricated for this purpose (a more detailed description is given in Appendix 6 –
Devices, Chemicals and Soil Material), filled with soil material. The length of the tube
measures 40 cm, whereas only 30 cm were filled with soil. The inner diameter of the cylinder
counted 10 cm. Both ends were closed by round stainless steel electrodes. Next to the
cathode an electrolyte compartment was established by separating a section of the tube with
glass fiber membranes in order to inhibit soil from entering this space. Also, the cathode was
covered with glass fiber membranes to prevent peroxodisulfate reduction at the cathode. The
electrolyte of 24.6 g/l ammonium peroxodisulfate was circulated by a garden pump at a
maximum of 25 l/h. The soil material consisted always of 100 % sand with 16 % humidity
except for one experiment where 60 % sand, 20 % loam and 20 % zeolite with 20 % water
content were used. The specific water content was derived from experimental determination
of field capacity for different soil types. Loam, in this case, refers to a material containing
grain sizes of silt and clay (for specification see Appendix 6 – Devices, Chemicals and Soil
Material). The soil was wetted with distilled water in which 5 g of KI were dissolved. Before
adding water, 30 g of corn starch per kilogram soil were mixed into the material. The steel
anode was also covered with two glass fiber membranes in order to diminish Fe3+ transport
into soil, as this would oxidize present iodide ions causing a color change which only should
be provoked by peroxodisulfate ion presence.

Chapter 9 - Development of a New Remediation Process
79
Figure 28: Horizontal transport system with electrolyte solution
The electrolyte was circulated through the respective compartment and an electric gradient
of 1 V/cm was generated forcing the peroxodisulfate ions to migrate towards the anode. On
their way, they oxidized iodide ions from KI to iodine (I°), which then in the presence of starch
and leftover iodide forms a dark blue or violet color complex. For optical analysis, the soil
was pushed out of the tube maintaining its cylindrical shape and was sliced in 1 cm thick
pieces. Dark violet colored soil indicated the distance traveled by the oxidizing ions.
Vertical Arrangement
Subsequent to the experiments in horizontal direction, assays were run in a vertical
arrangement, an innovative approach to electromigration in soil. The principle of this
arrangement was, that the oxidizing ions needed to travel upwards in order to reach the
anode, thus overcoming gravity force. Therefore, a minimum value of migration velocity was
measured. In the first series, two glass fiber tubes were placed upside down into a receptacle
filled with 1 l of ammonium peroxodisulfate solution of 24.6 g/l. The cylinders were filled with
various quantities of soil material, i.e. to different heights between 10 and 40 cm. At the
bottom of the tubes, a glass fiber membrane was attached, protected by a permeable kitchen
cloth from the soil material. The membranes simulated the barrier the peroxodisulfate ions
would have to overcome in order to enter the soil system from the solution in a real case
application. On top of the soil column stainless steel electrodes were placed and connected
as anode and cathode. Figure 29 shows the schematic set-up of the experiments. After
terminating the first series of experiments a second one was lanced in order to scale up the
system obtaining a total length of soil column of at least 50 cm by using longer tubes and
more soil material. Appendix 11 – Photos shows one picture of a vertical experimental
arrangement. As described above, the soil was wetted and spiked with KI and starch for
optical determination of peroxodisulfate ion migration. For analysis, the soil was pushed out
of the cylinder and sliced in 1 cm thick pieces. Furthermore, the conductivity of soil material
and pH-values after finishing the experiments were measured. Therefore, 50 g soil was
mixed with 50 ml of distilled water in order to measure the pH-value and conductivity from the
liquid phase. The osmotic flow was measured after experiments by filling the migrated water,
which was collected on top of the cathode, into a measuring cylinder. Before starting and
after terminating the experiments, soil temperature was measured directly at the electrodes
with a laboratory thermometer.
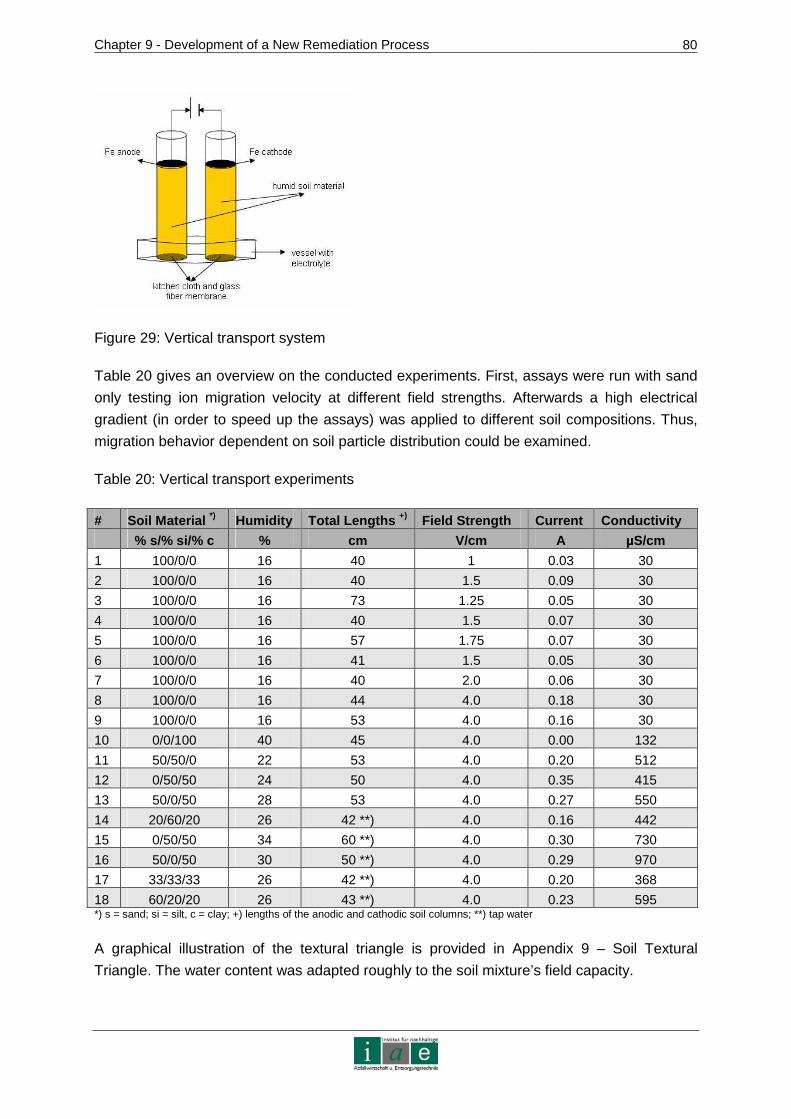
Chapter 9 - Development of a New Remediation Process
80
Figure 29: Vertical transport system
Table 20 gives an overview on the conducted experiments. First, assays were run with sand
only testing ion migration velocity at different field strengths. Afterwards a high electrical
gradient (in order to speed up the assays) was applied to different soil compositions. Thus,
migration behavior dependent on soil particle distribution could be examined.
Table 20: Vertical transport experiments
# Soil Material *) Humidity Total Lengths +) Field Strength Current Conductivity
% s/% si/% c % cm V/cm A µS/cm
1 100/0/0 16 40 1 0.03 30
2 100/0/0 16 40 1.5 0.09 30
3 100/0/0 16 73 1.25 0.05 30
4 100/0/0 16 40 1.5 0.07 30
5 100/0/0 16 57 1.75 0.07 30
6 100/0/0 16 41 1.5 0.05 30
7 100/0/0 16 40 2.0 0.06 30
8 100/0/0 16 44 4.0 0.18 30
9 100/0/0 16 53 4.0 0.16 30
10 0/0/100 40 45 4.0 0.00 132
11 50/50/0 22 53 4.0 0.20 512
12 0/50/50 24 50 4.0 0.35 415
13 50/0/50 28 53 4.0 0.27 550
14 20/60/20 26 42 **) 4.0 0.16 442
15 0/50/50 34 60 **) 4.0 0.30 730
16 50/0/50 30 50 **) 4.0 0.29 970
17 33/33/33 26 42 **) 4.0 0.20 368
18 60/20/20 26 43 **) 4.0 0.23 595 *) s = sand; si = silt, c = clay; +) lengths of the anodic and cathodic soil columns; **) tap water
A graphical illustration of the textural triangle is provided in Appendix 9 – Soil Textural
Triangle. The water content was adapted roughly to the soil mixture’s field capacity.

Chapter 9 - Development of a New Remediation Process
81
Second Horizontal Arrangement
As negative influences on the peroxodisulfate migration detection by the behavior of KI and
starch in the electric field could not be excluded in above described experiments the second
series of horizontal transport assays aimed to eliminate those. Two adverse effects of KI
behavior were suspected to undermine peroxodisulfate detection. For one, I- ions also
migrate towards the anode and are likely faster than the oxidant due to their smaller size. For
another, the osmotic flow towards the cathode might flush the iodide ions into the electrolyte
vessel. This could be observed by the change of electrolyte color from transparent to purple.
Furthermore, if KI and starch are washed out of the soil, peroxodisulfate can equally be
inhibited from traveling towards the anode due to the flushing effect. Therefore, a different
kind of experimental set-up was chosen. A polypropylene tube of 15 cm length and 4 cm
diameter was filled with 2 cm of wetted soil material, then with 2 cm of wetted soil material
spiked with ammonium peroxodisulfate and the left over 11 cm were filled again with wetted
soil material. On each side, a fleece soaked in NaCl solution was located between the soil
and electrode for better electrical contact. A titanium based diamond electrode functioned as
anode in order not to release any oxidative ions, which could provoke a color reaction with
iodine and starch. A stainless steel electrode served as cathode. The soil material was
wetted with tap water to its field capacity. The two centimeters of spiked material consisted of
35 g of soil, 3.5 g (+/- 0.1 g) of ammonium peroxodisulfate and the respective amount of
water. After having installed the tube and electrodes, the peroxodisulfate ions were subjected
to an electric field. For analysis, the soil was pushed out of the tube centimeter by centimeter
and sliced. The slices were located in a white ceramic dish. Then solutions of starch and
0.05 M KI were added in drops. In presence of peroxodisulfate ions the purple iodine starch
color complex formed and the travel distance could be determined. Figure 30 illustrates the
color change during analysis. Appendix 11 – Photos presents the procedure of soil sample
slicing.
Figure 30: Analysis of horizontal transport experiments with peroxodisulfate spiked soil
In addition to the above described qualitative analysis, also quantitative determination of
peroxodisulfate presence according to the traveled distance was conducted. Therefore,
slices of exactly 1 cm were shacked for 30 min in 60 ml of distilled water in a horizontal
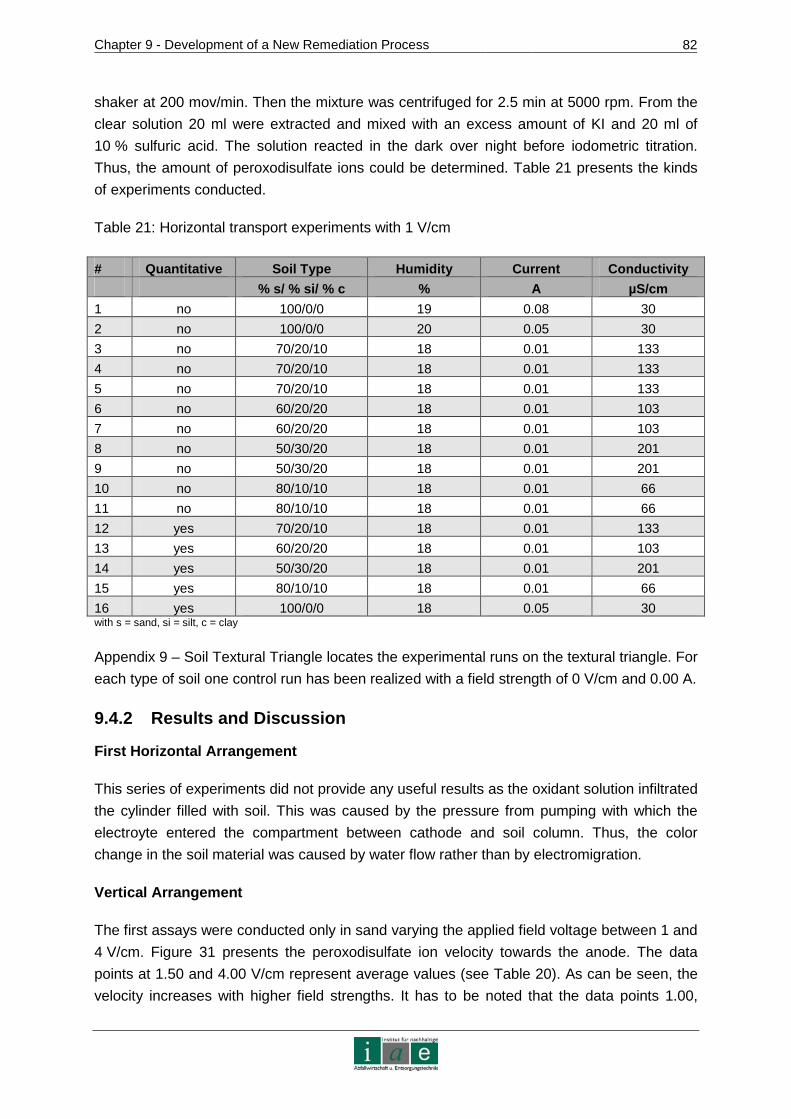
Chapter 9 - Development of a New Remediation Process
82
shaker at 200 mov/min. Then the mixture was centrifuged for 2.5 min at 5000 rpm. From the
clear solution 20 ml were extracted and mixed with an excess amount of KI and 20 ml of
10 % sulfuric acid. The solution reacted in the dark over night before iodometric titration.
Thus, the amount of peroxodisulfate ions could be determined. Table 21 presents the kinds
of experiments conducted.
Table 21: Horizontal transport experiments with 1 V/cm
# Quantitative Soil Type Humidity Current Conductivity
% s/ % si/ % c % A µS/cm
1 no 100/0/0 19 0.08 30
2 no 100/0/0 20 0.05 30
3 no 70/20/10 18 0.01 133
4 no 70/20/10 18 0.01 133
5 no 70/20/10 18 0.01 133
6 no 60/20/20 18 0.01 103
7 no 60/20/20 18 0.01 103
8 no 50/30/20 18 0.01 201
9 no 50/30/20 18 0.01 201
10 no 80/10/10 18 0.01 66
11 no 80/10/10 18 0.01 66
12 yes 70/20/10 18 0.01 133
13 yes 60/20/20 18 0.01 103
14 yes 50/30/20 18 0.01 201
15 yes 80/10/10 18 0.01 66
16 yes 100/0/0 18 0.05 30 with s = sand, si = silt, c = clay
Appendix 9 – Soil Textural Triangle locates the experimental runs on the textural triangle. For
each type of soil one control run has been realized with a field strength of 0 V/cm and 0.00 A.
9.4.2 Results and Discussion
First Horizontal Arrangement
This series of experiments did not provide any useful results as the oxidant solution infiltrated
the cylinder filled with soil. This was caused by the pressure from pumping with which the
electroyte entered the compartment between cathode and soil column. Thus, the color
change in the soil material was caused by water flow rather than by electromigration.
Vertical Arrangement
The first assays were conducted only in sand varying the applied field voltage between 1 and
4 V/cm. Figure 31 presents the peroxodisulfate ion velocity towards the anode. The data
points at 1.50 and 4.00 V/cm represent average values (see Table 20). As can be seen, the
velocity increases with higher field strengths. It has to be noted that the data points 1.00,
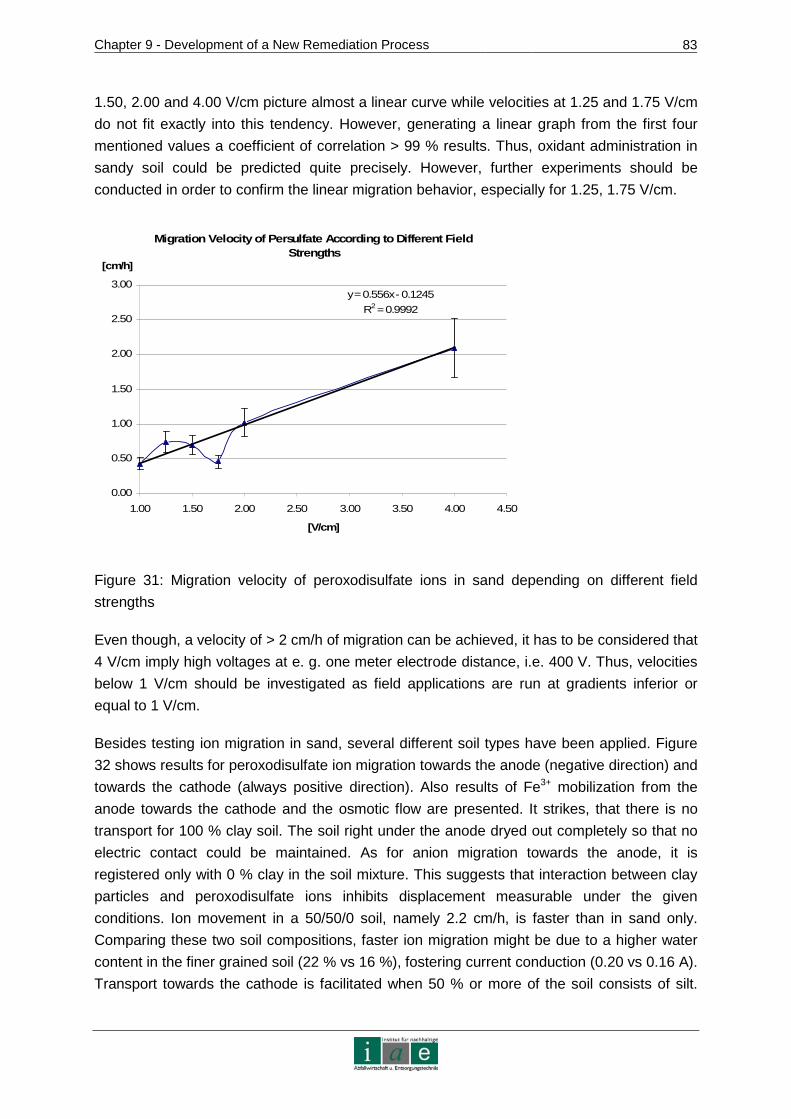
Chapter 9 - Development of a New Remediation Process
83
1.50, 2.00 and 4.00 V/cm picture almost a linear curve while velocities at 1.25 and 1.75 V/cm
do not fit exactly into this tendency. However, generating a linear graph from the first four
mentioned values a coefficient of correlation > 99 % results. Thus, oxidant administration in
sandy soil could be predicted quite precisely. However, further experiments should be
conducted in order to confirm the linear migration behavior, especially for 1.25, 1.75 V/cm.
Migration Velocity of Persulfate According to Diffe rent Field Strengths
y = 0.556x - 0.1245
R2 = 0.9992
0.00
0.50
1.00
1.50
2.00
2.50
3.00
1.00 1.50 2.00 2.50 3.00 3.50 4.00 4.50
[V/cm]
[cm/h]
Figure 31: Migration velocity of peroxodisulfate ions in sand depending on different field
strengths
Even though, a velocity of > 2 cm/h of migration can be achieved, it has to be considered that
4 V/cm imply high voltages at e. g. one meter electrode distance, i.e. 400 V. Thus, velocities
below 1 V/cm should be investigated as field applications are run at gradients inferior or
equal to 1 V/cm.
Besides testing ion migration in sand, several different soil types have been applied. Figure
32 shows results for peroxodisulfate ion migration towards the anode (negative direction) and
towards the cathode (always positive direction). Also results of Fe3+ mobilization from the
anode towards the cathode and the osmotic flow are presented. It strikes, that there is no
transport for 100 % clay soil. The soil right under the anode dryed out completely so that no
electric contact could be maintained. As for anion migration towards the anode, it is
registered only with 0 % clay in the soil mixture. This suggests that interaction between clay
particles and peroxodisulfate ions inhibits displacement measurable under the given
conditions. Ion movement in a 50/50/0 soil, namely 2.2 cm/h, is faster than in sand only.
Comparing these two soil compositions, faster ion migration might be due to a higher water
content in the finer grained soil (22 % vs 16 %), fostering current conduction (0.20 vs 0.16 A).
Transport towards the cathode is facilitated when 50 % or more of the soil consists of silt.
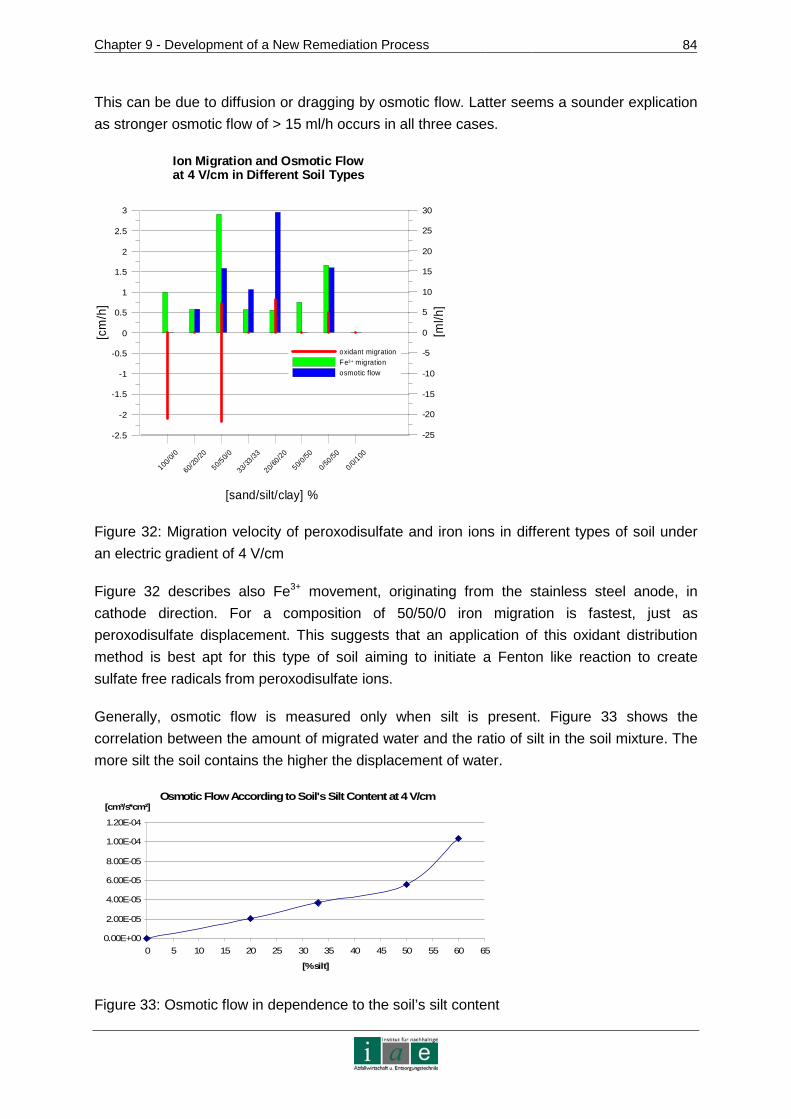
Chapter 9 - Development of a New Remediation Process
84
This can be due to diffusion or dragging by osmotic flow. Latter seems a sounder explication
as stronger osmotic flow of > 15 ml/h occurs in all three cases.
100/0/
0
60/20
/20
50/50/
0
33/33
/33
20/60
/20
50/0/5
0
0/50/50
0/0/100
[sand/silt/clay] %
-2.5
-2
-1.5
-1
-0.5
0
0.5
1
1.5
2
2.5
3
[cm
/h]
-25
-20
-15
-10
-5
0
5
10
15
20
25
30
[ml/h
]
oxidant migrationFe3+ migrationosmotic flow
Ion Migration and Osmotic Flow at 4 V/cm in Different Soil Types
Figure 32: Migration velocity of peroxodisulfate and iron ions in different types of soil under
an electric gradient of 4 V/cm
Figure 32 describes also Fe3+ movement, originating from the stainless steel anode, in
cathode direction. For a composition of 50/50/0 iron migration is fastest, just as
peroxodisulfate displacement. This suggests that an application of this oxidant distribution
method is best apt for this type of soil aiming to initiate a Fenton like reaction to create
sulfate free radicals from peroxodisulfate ions.
Generally, osmotic flow is measured only when silt is present. Figure 33 shows the
correlation between the amount of migrated water and the ratio of silt in the soil mixture. The
more silt the soil contains the higher the displacement of water.
Osmotic Flow According to Soil's Silt Content at 4 V/cm
0.00E+00
2.00E-05
4.00E-05
6.00E-05
8.00E-05
1.00E-04
1.20E-04
0 5 10 15 20 25 30 35 40 45 50 55 60 65
[% silt]
[cm³/s*cm²]
Figure 33: Osmotic flow in dependence to the soil’s silt content
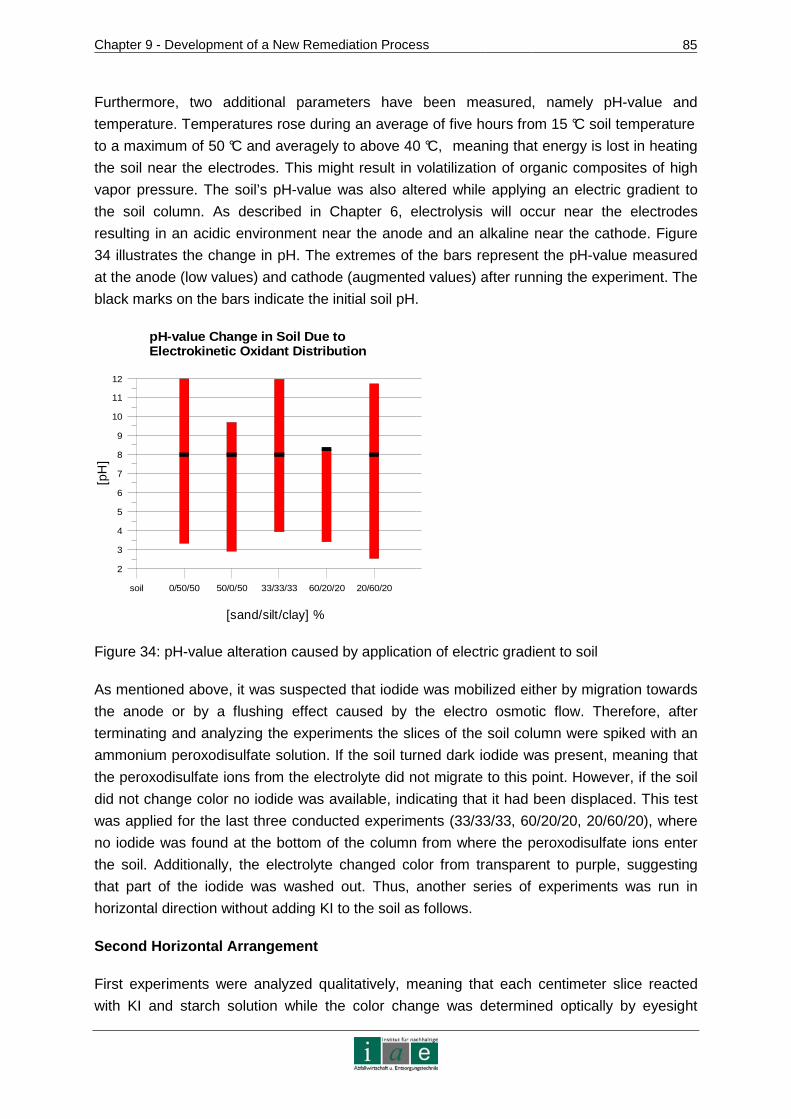
Chapter 9 - Development of a New Remediation Process
85
Furthermore, two additional parameters have been measured, namely pH-value and
temperature. Temperatures rose during an average of five hours from 15 °C soil temperature
to a maximum of 50 °C and averagely to above 40 °C, meaning that energy is lost in heating
the soil near the electrodes. This might result in volatilization of organic composites of high
vapor pressure. The soil’s pH-value was also altered while applying an electric gradient to
the soil column. As described in Chapter 6, electrolysis will occur near the electrodes
resulting in an acidic environment near the anode and an alkaline near the cathode. Figure
34 illustrates the change in pH. The extremes of the bars represent the pH-value measured
at the anode (low values) and cathode (augmented values) after running the experiment. The
black marks on the bars indicate the initial soil pH.
soil 0/50/50 50/0/50 33/33/33 60/20/20 20/60/20
[sand/silt/clay] %
2
3
4
5
6
7
8
9
10
11
12
[pH
]
pH-value Change in Soil Due toElectrokinetic Oxidant Distribution
Figure 34: pH-value alteration caused by application of electric gradient to soil
As mentioned above, it was suspected that iodide was mobilized either by migration towards
the anode or by a flushing effect caused by the electro osmotic flow. Therefore, after
terminating and analyzing the experiments the slices of the soil column were spiked with an
ammonium peroxodisulfate solution. If the soil turned dark iodide was present, meaning that
the peroxodisulfate ions from the electrolyte did not migrate to this point. However, if the soil
did not change color no iodide was available, indicating that it had been displaced. This test
was applied for the last three conducted experiments (33/33/33, 60/20/20, 20/60/20), where
no iodide was found at the bottom of the column from where the peroxodisulfate ions enter
the soil. Additionally, the electrolyte changed color from transparent to purple, suggesting
that part of the iodide was washed out. Thus, another series of experiments was run in
horizontal direction without adding KI to the soil as follows.
Second Horizontal Arrangement
First experiments were analyzed qualitatively, meaning that each centimeter slice reacted
with KI and starch solution while the color change was determined optically by eyesight
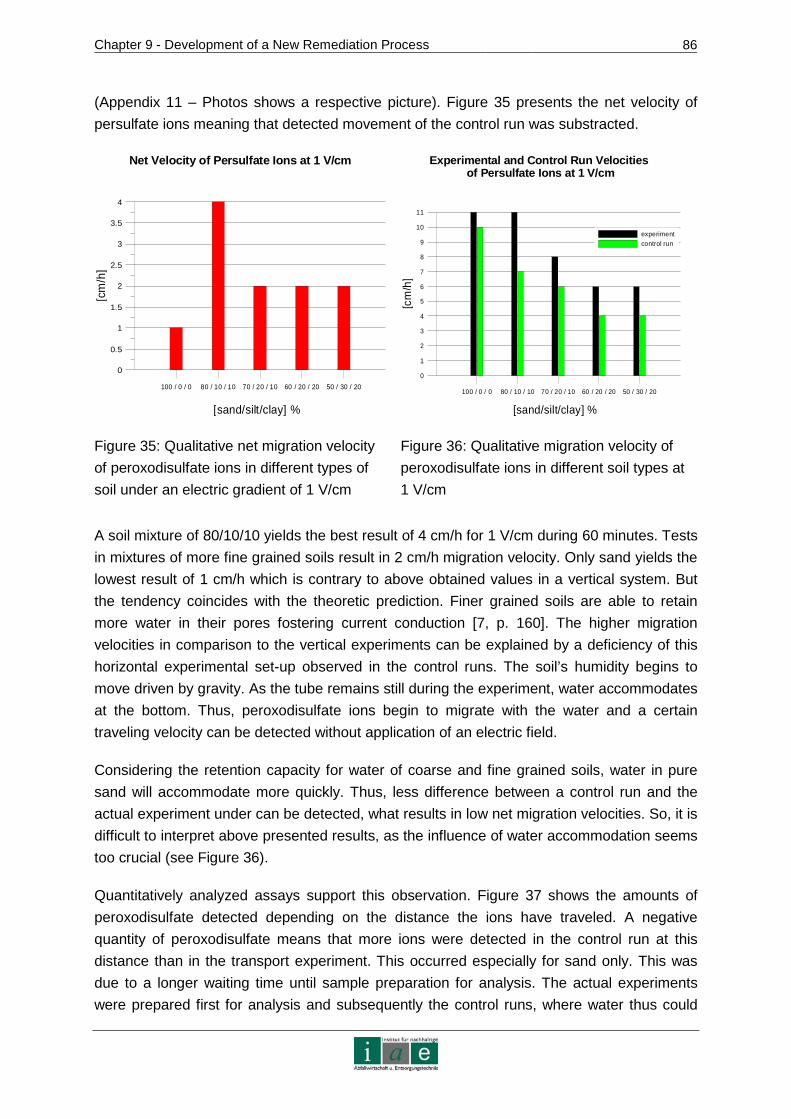
Chapter 9 - Development of a New Remediation Process
86
(Appendix 11 – Photos shows a respective picture). Figure 35 presents the net velocity of
persulfate ions meaning that detected movement of the control run was substracted.
100 / 0 / 0 80 / 10 / 10 70 / 20 / 10 60 / 20 / 20 50 / 30 / 20
[sand/silt/clay] %
0
0.5
1
1.5
2
2.5
3
3.5
4
[cm
/h]
Net Velocity of Persulfate Ions at 1 V/cm
100 / 0 / 0 80 / 10 / 10 70 / 20 / 10 60 / 20 / 20 50 / 30 / 20
[sand/silt/clay] %
0
1
2
3
4
5
6
7
8
9
10
11
[cm
/h]
experimentcontrol run
Experimental and Control Run Velocities of Persulfate Ions at 1 V/cm
Figure 35: Qualitative net migration velocity
of peroxodisulfate ions in different types of
soil under an electric gradient of 1 V/cm
Figure 36: Qualitative migration velocity of
peroxodisulfate ions in different soil types at
1 V/cm
A soil mixture of 80/10/10 yields the best result of 4 cm/h for 1 V/cm during 60 minutes. Tests
in mixtures of more fine grained soils result in 2 cm/h migration velocity. Only sand yields the
lowest result of 1 cm/h which is contrary to above obtained values in a vertical system. But
the tendency coincides with the theoretic prediction. Finer grained soils are able to retain
more water in their pores fostering current conduction [7, p. 160]. The higher migration
velocities in comparison to the vertical experiments can be explained by a deficiency of this
horizontal experimental set-up observed in the control runs. The soil’s humidity begins to
move driven by gravity. As the tube remains still during the experiment, water accommodates
at the bottom. Thus, peroxodisulfate ions begin to migrate with the water and a certain
traveling velocity can be detected without application of an electric field.
Considering the retention capacity for water of coarse and fine grained soils, water in pure
sand will accommodate more quickly. Thus, less difference between a control run and the
actual experiment under can be detected, what results in low net migration velocities. So, it is
difficult to interpret above presented results, as the influence of water accommodation seems
too crucial (see Figure 36).
Quantitatively analyzed assays support this observation. Figure 37 shows the amounts of
peroxodisulfate detected depending on the distance the ions have traveled. A negative
quantity of peroxodisulfate means that more ions were detected in the control run at this
distance than in the transport experiment. This occurred especially for sand only. This was
due to a longer waiting time until sample preparation for analysis. The actual experiments
were prepared first for analysis and subsequently the control runs, where water thus could
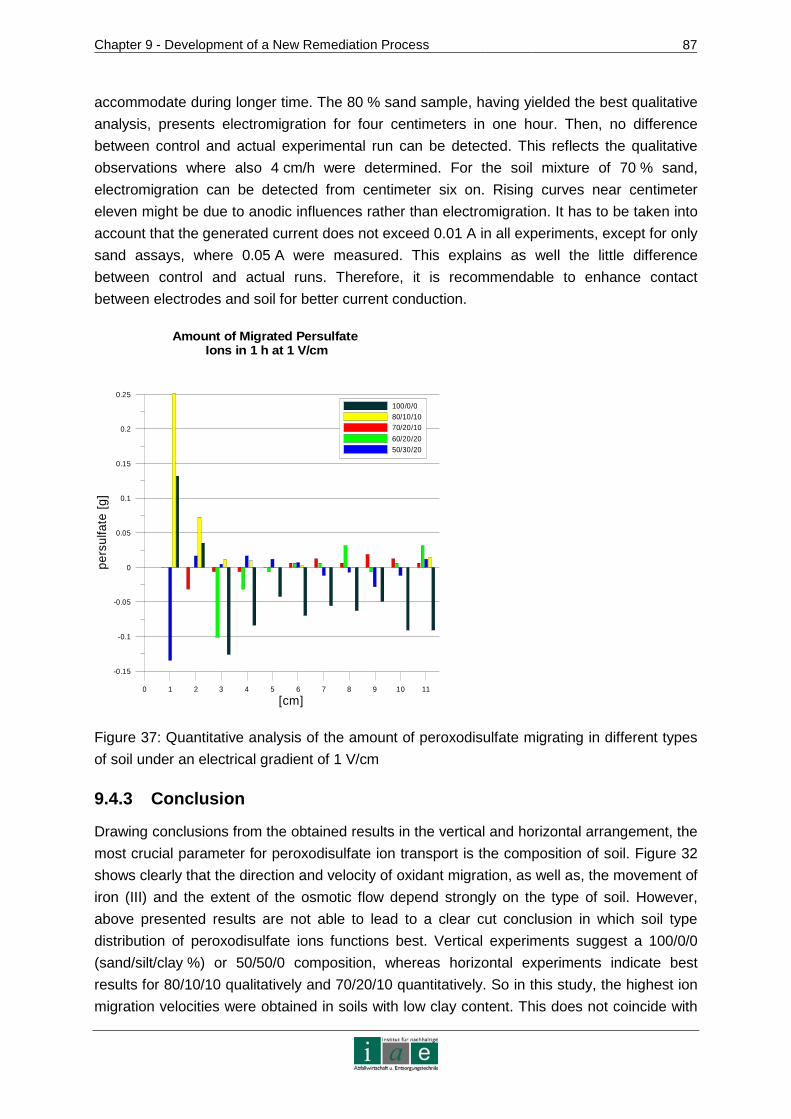
Chapter 9 - Development of a New Remediation Process
87
accommodate during longer time. The 80 % sand sample, having yielded the best qualitative
analysis, presents electromigration for four centimeters in one hour. Then, no difference
between control and actual experimental run can be detected. This reflects the qualitative
observations where also 4 cm/h were determined. For the soil mixture of 70 % sand,
electromigration can be detected from centimeter six on. Rising curves near centimeter
eleven might be due to anodic influences rather than electromigration. It has to be taken into
account that the generated current does not exceed 0.01 A in all experiments, except for only
sand assays, where 0.05 A were measured. This explains as well the little difference
between control and actual runs. Therefore, it is recommendable to enhance contact
between electrodes and soil for better current conduction.
0 1 2 3 4 5 6 7 8 9 10 11
[cm]
-0.15
-0.1
-0.05
0
0.05
0.1
0.15
0.2
0.25
pers
ulfa
te [
g]
100/0/080/10/1070/20/10
60/20/2050/30/20
Amount of Migrated Persulfate Ions in 1 h at 1 V/cm
Figure 37: Quantitative analysis of the amount of peroxodisulfate migrating in different types
of soil under an electrical gradient of 1 V/cm
9.4.3 Conclusion
Drawing conclusions from the obtained results in the vertical and horizontal arrangement, the
most crucial parameter for peroxodisulfate ion transport is the composition of soil. Figure 32
shows clearly that the direction and velocity of oxidant migration, as well as, the movement of
iron (III) and the extent of the osmotic flow depend strongly on the type of soil. However,
above presented results are not able to lead to a clear cut conclusion in which soil type
distribution of peroxodisulfate ions functions best. Vertical experiments suggest a 100/0/0
(sand/silt/clay %) or 50/50/0 composition, whereas horizontal experiments indicate best
results for 80/10/10 qualitatively and 70/20/10 quantitatively. So in this study, the highest ion
migration velocities were obtained in soils with low clay content. This does not coincide with
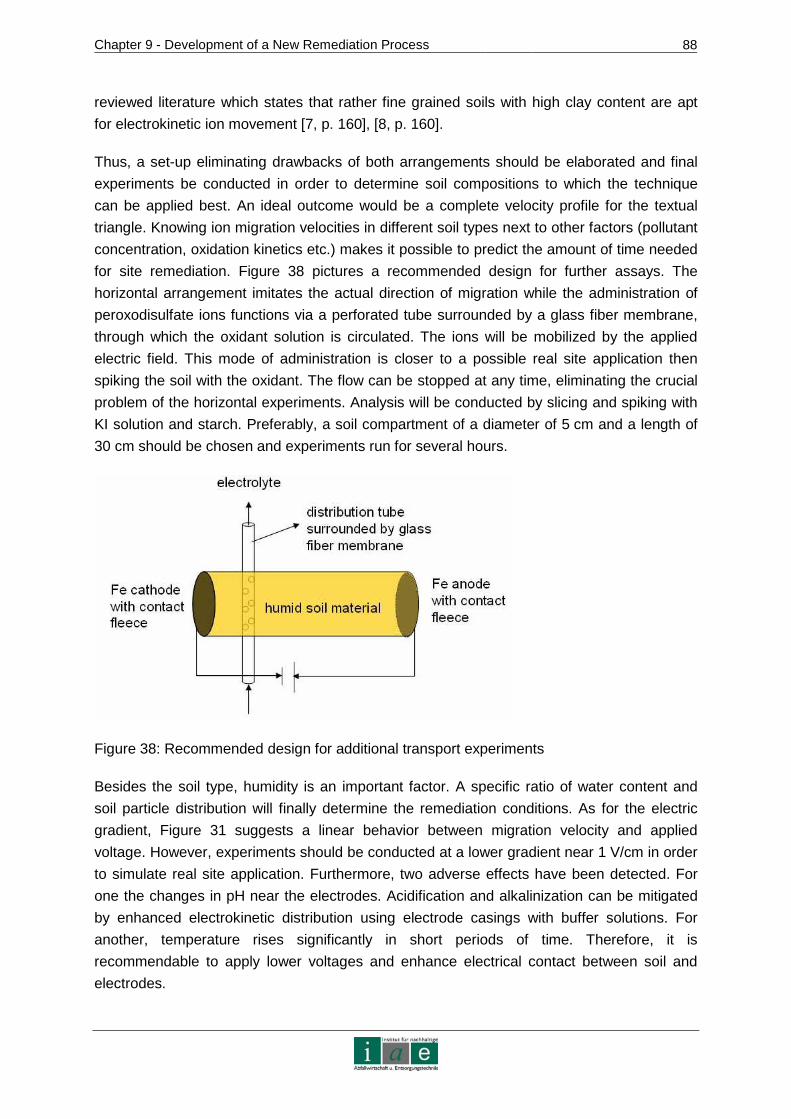
Chapter 9 - Development of a New Remediation Process
88
reviewed literature which states that rather fine grained soils with high clay content are apt
for electrokinetic ion movement [7, p. 160], [8, p. 160].
Thus, a set-up eliminating drawbacks of both arrangements should be elaborated and final
experiments be conducted in order to determine soil compositions to which the technique
can be applied best. An ideal outcome would be a complete velocity profile for the textual
triangle. Knowing ion migration velocities in different soil types next to other factors (pollutant
concentration, oxidation kinetics etc.) makes it possible to predict the amount of time needed
for site remediation. Figure 38 pictures a recommended design for further assays. The
horizontal arrangement imitates the actual direction of migration while the administration of
peroxodisulfate ions functions via a perforated tube surrounded by a glass fiber membrane,
through which the oxidant solution is circulated. The ions will be mobilized by the applied
electric field. This mode of administration is closer to a possible real site application then
spiking the soil with the oxidant. The flow can be stopped at any time, eliminating the crucial
problem of the horizontal experiments. Analysis will be conducted by slicing and spiking with
KI solution and starch. Preferably, a soil compartment of a diameter of 5 cm and a length of
30 cm should be chosen and experiments run for several hours.
Figure 38: Recommended design for additional transport experiments
Besides the soil type, humidity is an important factor. A specific ratio of water content and
soil particle distribution will finally determine the remediation conditions. As for the electric
gradient, Figure 31 suggests a linear behavior between migration velocity and applied
voltage. However, experiments should be conducted at a lower gradient near 1 V/cm in order
to simulate real site application. Furthermore, two adverse effects have been detected. For
one the changes in pH near the electrodes. Acidification and alkalinization can be mitigated
by enhanced electrokinetic distribution using electrode casings with buffer solutions. For
another, temperature rises significantly in short periods of time. Therefore, it is
recommendable to apply lower voltages and enhance electrical contact between soil and
electrodes.

Chapter 10 - Recommendations and Outlook
89
10 Recommendations and Outlook
In order to provide a reliable laboratory scale foundation for pilot experiments on the
electrokinetic remediation method involving electro synthesis of peroxodisulfate and in-situ
contaminant oxidation the following recommendations are given:
As for soil spiking, few assays have been conducted. Thus, in order to support 98 %
homogeneity for phenol spiking according to TOC and 95 % for diesel spiking
according to the HC-index more analysis should be conducted to establish a
statistically sound basis. Especially in one case of diesel spiking for decomposition
experiments, the coefficient of variance was nearly 39 %. Considering phenol, a
coefficient of variance of 17 % for several conducted oxidation experiments can still
be improved.
As far as contaminant decomposition is concerned, the amounts of catalyst and
oxidant (the molar ratio of pollutant to oxidant was very high, 1 : 284.6 for diesel and
1 : 107.5 for phenol) should be defined more clearly in additional experiments at
lower temperatures (e.g. 10 °C). Furthermore, mecha nisms of diesel oil elimination
have to be investigated more thoroughly in order to design an analytical method
providing more reliable results. Between weeks two and four the HC-index suggests
that diesel oil is formed. Therefore, several constituents of diesel oil could be oxidized
with peroxodisulfate under the same conditions as for the already conducted
experiments. The outcome should be analyzed by gas chromatography with a mass
spectrometer. Thus, the mechanism of diesel oil degradation can be clarified and the
already obtained elimination curves can be explained or the analysis method be
adapted. Additionally, the intermediate species formed in the process should be
characterized. Metabolites might be more toxic than the actual contaminant to the
environment. Also, the amount of sulfate which may possibly enter groundwater
resources as leachate should also be determined. Finally, the influence of soil organic
matter should also be investigated.
Considering the results of oxidant production with diamond electrodes, two issues
should be discussed. For one, the bipolar MI electrode model needs to be enhanced
in order to be able to compete with the tested CVD electrode. For another, an
estimation of investment and electrochemical peroxodisulfate production cost (for
both electrode types) should be elaborated and compared to the cost of purchasing
peroxodisulfate as a chemical, a viable alternative for in-situ soil remediation involving
electrokinetic oxidant distribution.
With reference to the transport experiments, a recommendation on how to improve
the experimental arrangement has already been given in Chapter 9. The system
should be arranged horizontally in order to avoid adverse effects against the oxidant’s
migration by osmotic flow and gravitiy. Furthermore, the administration of

Chapter 10 - Recommendations and Outlook
90
peroxodisulfate needs to be controllable. Additionally, behavior in real soil should be
investigated.
Giving an outlook on how to simulate the complete remediation technique at laboratory scale,
an oxidant solution administration facility should be designed, optionally as recommended in
Chapter 9. Subsequently, ion transport with coupling oxidant production and electrokinetic
distribution needs to be tested determining the relative amount of peroxodisulfate entering
the soil system from the administration solution. Finally, all three subsystems need to be
unified and coordinated in order to complete the laboratory phase of the project before
continuing at pilot scale.
Chapter 11 - Resume
91
11 Resume
In Austria, 93 % of the contaminated sites are affected by organic compounds. Out of these
sites 40 % are polluted by mineral oil and phenol which cause a potential threat to ground
and drinking water resources [2]. Therefore they have been chosen as model contaminants
in this study. Up to the present day, there is no adequate in-situ remediation method for
diesel or phenol contaminated land in Austria. Thus, the Institute of Sustainable Waste
Management and Technology is developing a new in-situ electrokinetic remediation method.
The technology is composed of three subsystems, which are electro synthesis of
peroxodisulfate with diamond electrodes, electrokinetic distribution of the oxidant in soil and
in-situ oxidation of diesel and phenol.
The goals of this master thesis were to present the methodological approach taken in this
project, elaborating and naming crucial parameters of influence on the subsystems and
giving further recommendations for the method’s enhancement. The strategy for creating the
new electrokinetic remediation method consisted of establishing each subsystem individually
before unifying them (which was not part of this thesis). As a basis for the laboratory work,
literature experiences from electrokinetic soil remediation (EK), in-situ chemical oxidation
(ISCO) and electro synthesis (ES) with diamond electrodes have been utilized. In the
following, the results of each field of investigation are summarized.
Spiking of Test Soil
Before starting assays on contaminant decomposition in soil, the material has to be spiked
homogeneously with the pollutant. An acceptable coefficient of variation should be inferior to
20 % [20, p. 401]. This means that any result referring to the contaminants concentration in
the sample obtained after spiking is subjected to the coefficient of variance. Therefore,
spiking tests were conducted prior to realizing soil decontamination by chemical oxidation.
Diesel oil concentration in the spiked soil was determined by HC-index, TOC and COD. All
methods yielded satisfying results with coefficients of variance of 4.2, 4.2 and 1.6,
respectively, not counting outliers. For phenol analysis TOC and phenol-index were applied
yielding coefficients of 1.6 and 17.3, respectively.
Decomposition of Contaminants in Soil
The actual remediation work of the technology is conducted by chemical in-situ oxidation.
The selected oxidant, peroxodisulfate, of an oxidation potential of 2.0 V is known to be able
to degrade various types of organic compounds, amongst those phenols and petroleum
hydrocarbons. Oxidation’s performance can be enhanced by a Fenton like reaction, i.e.
administering Fe2+ as catalyst for sulfate free radical formation. Those are even more
powerful oxidants with a potential of 2.6 V. Even though successful application of activated
peroxodisulfate has been reported for aqueous media, tests on the oxidant’s performance in
soil are rare [9, pp. 20], [10, pp. 13]. So experiments were run with sandy loam soil with 20 %
water content at 15 to 17 °C in the dark. The diese l spike concentration was 9.6 g/kg,
Chapter 11 - Resume
92
phenol’s concentration 0.5 mg/kg. Results revealed that phenol can be eliminated up to 99 %
within four weeks with 54.0 mol peroxodisulfate per mol phenol in presence of iron(II) as
catalyst, while diesel could be eliminated up to 84 % in twelve weeks also in presence of the
catalyst with 284.6 mol peroxodisulfate per mol diesel. Referring to the outcome of phenol
degradation, a higher amount of peroxodisulfate than 54.0 mol is inefficient. However, for
both pollutants the amount of needed oxidant is very high. Considering more carefully the
elimination curve of diesel oil, HC-index analysis detected an increase in hydrocarbons after
two weeks of oxidation. Thus, the contaminant’s oxidation needs to be investigated more
thoroughly in order to be able to interpret the behavior or adapt the analytical method. In
order to be able to further evaluate the success of chemical oxidation with peroxodisulfate of
diesel and phenol, intermediate species should be monitored as they could be more harmful
to the environment than the original pollutant. Furthermore, the potential amount of sulfates
leaching into the groundwater should be determined.
Electro Synthesis of Peroxodisulfate with Diamond Electrodes
Boron doped diamond (BDD) electrodes are known to have a high overpotential for water
decomposition which makes them able to produce highly oxidative species, amongst those
peroxodisulfate. Various researchers have shown that production of peroxodisulfate with
chemical vapor deposition BDD electrodes is possible [68], [69], [70], [71]. However, assays
with mechanically implanted (MI) BDD electrodes have not been reported. Thus, experiments
have been conducted with various types of MI electrodes which have been developed
especially for this study. These were a monopolar titanium based electrode, a monopolar
electrode on polymer basis and a bipolar flow cell on polymer basis. The amount of oxidant
was determined by iodometric titration. The final model provided best results within the group
of MI electrodes. A kind of sensitivity analysis was conducted varying several parameters
subsequently. It turned out that current density is the most crucial parameter. The best
operation mode resulted at 20 °C with 0.85 M sodium sulfate electrolyte, three membranes
and at 200 mA/cm². After 5 Ah/l more than 6 mmol/l peroxodisulfate could be generated.
Under these conditions elimination of one mmol phenol would cost 36.72 cents. Additionally,
a CVD electrode has been tested at 50 mA/cm² with five membranes at 15 °C and an
electrolyte of a 0.85 M sodium sulfate solution yielding 1.1 mmol/(l*cm²), while the MI
electrode under similar condiditions produced 0.8 mmol/(l*cm²) referred to the diamond
covered area of the electrodes surface. Even though these results suggest opting for a CVD
electrode, it has to be considered that these experiments were the first ones conducted with
the MI BDD electrode cell prototypes, whereas the CVD electrode had been sophisticated
during several years. Thus, results are promising for the MI electrode. Furthermore,
investment and operation cost of both electrode types should be compared to the cost of
peroxodisulfate purchase.
Chapter 11 - Resume
93
Electrokinetic Transport
Electrokinetic (EK) remediation is classically applied for contaminant transport in soil towards
a designated area. However, it can also be used to distribute an oxidant species in soil for in-
situ oxidation. EK techniques are applicable to saturated and unsaturated soils with low
permeabilities down to 10-9 m/s. The electric gradient provided by two field electrodes is
supposed to spread homogeneously through the soil. Ion species are thus moved by
electromigration or dragged by electroosmotic flow. Adverse effects on ion transport may
occur due to physiochemical interactions with the soil particles, thus depending strongly on
the soil type and texture. Usually, electrical gradients of 1 V/cm are applied. A possible
drawback of this manner of ion distribution in soil is electrolysis occurring at the field
electrodes provoking an acid front movment from the anode towards the cathode. [6, pp.
192], [8, p. 39], [22, p. 2640], [23, p. 100] Experiments conducted in the course of this project
investigated mainly transport behavior of peroxodisulfate ions under several electrical
gradients and in different soil compositions. For analysis, the soil was spiked with KI and
starch so that peroxodisulfate presence would provoke a color reaction. Out of a series of
eight different soil compositions, it was found that peroxodisulfate ions only migrated towards
the anode when no clay was present. The fastest velocity was achieved in a 50 % sand and
silt soil with 2.2 cm/h. Osmotic flow occurred every time silt was present. Generally, the
pH-value dropped below 4 near the anode and rose to above 11 near the cathode.
Temperature rose to over 40 °C near the electrodes. Another series of experiments with
sand only varying the electric gradient from 1 to 4 V/cm showed that peroxodisulfate velocity
obeys a linear equation of a slope of 0.56. Subsequent horizontally arranged experiments
yielded different results. The highest ion migration velocity was found in an 80 % sand and
each 10 % silt and clay soil with 4 cm/h. This is contrary to the reviewed literature which
claims that soils with high clay content yield the best results. Thus, it is recommendable to
enhance the set-up in order to produce more reliable results. In any case, experiments
revealed that the soil texture and water content play a crucial role in ion migration.
Table 22 and Table 23 give a final overview of the most important results.
Table 22: Most crucial parameters
Field of investigation Parameter
contaminant decomposition presence of catalyst
production of oxidant current density
type of electrode
electrokinetic transport soil composition
water content
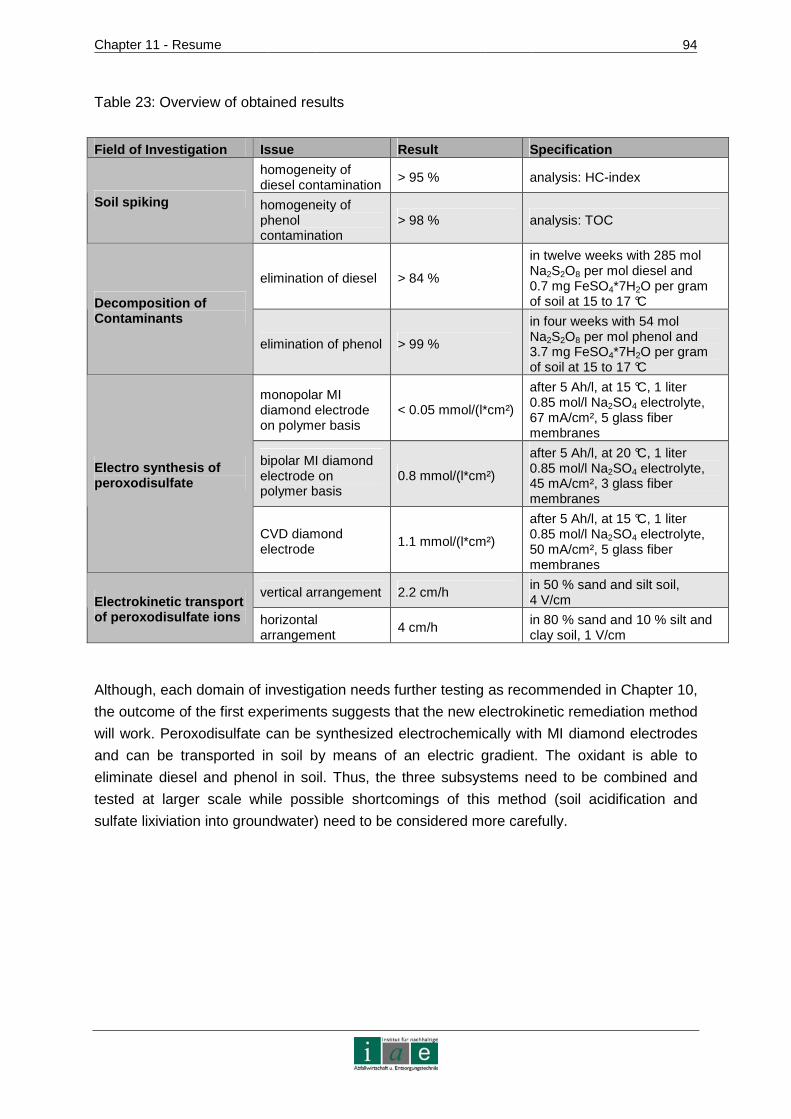
Chapter 11 - Resume
94
Table 23: Overview of obtained results
Field of Investigation Issue Result Specification
homogeneity of diesel contamination
> 95 % analysis: HC-index
Soil spiking homogeneity of phenol contamination
> 98 % analysis: TOC
elimination of diesel > 84 %
in twelve weeks with 285 mol Na2S2O8 per mol diesel and 0.7 mg FeSO4*7H2O per gram of soil at 15 to 17 °C Decomposition of
Contaminants
elimination of phenol > 99 %
in four weeks with 54 mol Na2S2O8 per mol phenol and 3.7 mg FeSO4*7H2O per gram of soil at 15 to 17 °C
monopolar MI diamond electrode on polymer basis
< 0.05 mmol/(l*cm²)
after 5 Ah/l, at 15 °C, 1 liter 0.85 mol/l Na2SO4 electrolyte, 67 mA/cm², 5 glass fiber membranes
bipolar MI diamond electrode on polymer basis
0.8 mmol/(l*cm²)
after 5 Ah/l, at 20 °C, 1 liter 0.85 mol/l Na2SO4 electrolyte, 45 mA/cm², 3 glass fiber membranes
Electro synthesis of peroxodisulfate
CVD diamond electrode
1.1 mmol/(l*cm²)
after 5 Ah/l, at 15 °C, 1 liter 0.85 mol/l Na2SO4 electrolyte, 50 mA/cm², 5 glass fiber membranes
vertical arrangement 2.2 cm/h in 50 % sand and silt soil, 4 V/cm Electrokinetic transport
of peroxodisulfate ions horizontal arrangement
4 cm/h in 80 % sand and 10 % silt and clay soil, 1 V/cm
Although, each domain of investigation needs further testing as recommended in Chapter 10,
the outcome of the first experiments suggests that the new electrokinetic remediation method
will work. Peroxodisulfate can be synthesized electrochemically with MI diamond electrodes
and can be transported in soil by means of an electric gradient. The oxidant is able to
eliminate diesel and phenol in soil. Thus, the three subsystems need to be combined and
tested at larger scale while possible shortcomings of this method (soil acidification and
sulfate lixiviation into groundwater) need to be considered more carefully.
Indices 95
12 Indices
12.1 Bibliography
[1] Spausta, G. and Weihs, S.: Verdachtsflächenkataster und Altlastenatlas – Stand 1.
Jänner 2006. Federal Environment Agency, Vienna, 2006
[2] Federal Environment Agency: State of the Environment in Austria. Vol. 6, Vienna,
2002
[3] Department for Environment, Food and Rural Affairs and Environment Agency: Soil
Guideline Values for Phenol Contamination. Science Report SGV 8, October, 2005,
Bristol, downloaded from www.environment.agency.gov.uk, January 16, 2007
[4] Interstate Technology & Regulatory Guide: Technical and Regulatory Guidance for
Surfactant/Cosolvent Flushing of DNAPL Source Zones. Washington, D.C., 2003,
downloaded from www.itrcweb.org, November 26, 2006
[5] Yeh, C. K.-J., Wu, H.-M., Chen, T-C.: Chemical oxidation of chlorinated non-aqueous
phase liquid by hydrogen peroxide in natural sand systems. Journal of Hazardous
Materials Vol. B96 (2003) pp. 29 – 51
[6] Lageman, R., Clarke, R. L., Pool, W.: Electro-reclamation, a versatile soil remedation
solution. Engineering Geology Vol. 77 (2005) pp. 191 – 201
[7] Saichek, R. E. and Reddy, K.: Electrokinetically Enhanced Remediation of
Hydrophobic Organic Compounds in Soils: A Review. Critical Reviews in
Environmental Science and Technology Vol. 35 (2005) pp. 115 - 192
[8] Alshawabkeh, A.: Basics and Applications of Electrokinetic Remediation. Handouts
Prepared for a Short Course at Federal University of Rio de Janeiro, November 2001,
Department of Civil and Environmental Engineering, Northeastern University, USA
[9] Huling, S. and Pivetz, B.: In-Situ Chemical Oxidation, Engineering Issue, EPA
Document EPA/600/R-06/072, August, 2006
[10] Soja, G.: In-situ-Anwendung chemischer Oxidationsmittel und Oxidationsverfahren.
Technischer Leitfaden, prepared for the INTERLAND research project, downloaded
from http://interland.arcs.ac.at/extranet/interland/publikat.htm, November 24, 2006
[11] Swartje, F.: Risk-Based Assessment of Soil and Groundwater Quality in the
Netherlands: Standards and Remediation Urgency. Risk Analysis Vol. 19, No. 6,
(1999), pp. 1235 - 1249
[12] Lindlbauer, A.: interview on June 30, 2006
Indices 96
[13] Scheffer, F. and Schachtschabel, P.: Lehrbuch der Bodenkunde. Spektrum,
Heidelberg, 2002
[14] Wild, A.: Soil and the environment: an introduction. Cambridge, Cambridge University
Press, 1994
[15] Ashman, M. R. and Puri, G.: Essential soil science: a clear and consice introduction to
soil science. Blackwell Science Ltd, MPG Books Ltd., Cornwall, 2002
[16] Koch, R.: Umweltchemikalien. VHC, Weinheim, 1995
[17] GKG Mineralölhandel, safety data sheet heating oil, 2005
[18] Watts, R. J. and Dilly, S. E.: Evaluation of iron catalysts for the Fenton-like
remediation of diesel-contaminated soils. Journal of Hazardous Materials Vol. 51
(1996) pp. 209 - 224
[19] Remediation Technology Development Forum: The Basics – Understanding Light-
Non Aqueous Phase Liquids (NAPL) Behavior in Soil. presented at EPA Region
3/State Corrective Action Workshop, Rocky Gap Lodge, Maryland, 2004
[20] Doick, K. J., Lee, P. H., Semple, K. T.: Assessment of spiking procedures for the
introduction of a phenanthrene-LNAPL mixture into field-wet soil. Environmental
Pollution, Vol. 126 (2003) pp. 399 – 406
[21] Brinch, U. C., Ekelund, F., Jacobsen, C. S.: Method for Spiking Soil Samples with
Organic Compounds. Applied and Environmental Microbiology, Vol. 64, No. 4, (2002)
pp. 1808 – 1816
[22] Acar, Y. B. and Alshawabakeh, A. N.: Principles of Electrokinetic Remediation.
Environmental Science and Technology, Vol. 27, No. 13, (1993) pp. 2638 - 2647
[23] Virkutyte, J., Sillanpää, M., Latostenmaa, P.: Electrokinetic soil remediation – critical
overview. The Science of the Total Environment Vol. 289 (2002) pp. 97 – 121
[24] Probstein, R. and Hicks, R.: Removal of Contaminants from Soils by Electric Fields.
Science, Vol. 260 (1993) pp. 498 - 504
[25] Acar, Y. B., Gale, R. J., Alshawabkeh, A. N., Marks, R. E., Puppala, S., Bricka, M.,
Parker, R.: Electrokinetic remediation: Basics and technology status. Journal of
Hazardous Materials Vol. 40 (1995) pp. 117 – 137
[26] Baraud, F., Tellier, S., Astruc, M.: Ion velocity in soil solution during electrokinetic
remediation. Journal of Hazardous Materials Vol. 56 (1997) pp. 315 - 332
Indices 97
[27] Online information: http://web.em.doe.gov/plumesfa/intech/lasagna/summary.html,
viewed on January 18, 2007
[28] Yang, G. and Long, Y.-W.: Removal and degradation of phenol in a saturated flow by
In-situ electrokinetic remediation and Fenton-like process. Journal of Hazardous
Materials Vol. B 69 (1999) pp. 259 – 271
[29] Yang, G. and Liu, C.-Y: Remediation of TCE contaminated soils by in situ EK-Fenton
process. Journal of Hazardous Materials Vol. B85 (2001) pp. 317 – 331
[30] Park, J.-Y., Kim, S.-J., Lee, Y-J., Baek, K., Yang, J.-W.: EK-Fenton process for
removal of phenanthrene in a two-dimensional soil system. Engineering Geology Vol.
77 (2005) pp. 217 – 224
[31] Final Report, 2006, downloaded from www.interland.arcs.ac.at, October 24, 2006
[32] Kong, S.-H., Watts, R. J., Choi, J.-H.: Treatment of Petroleum-Contaminated Soils
Using Iron Mineral Catalyzed Hydrogen Peroxide. Chemosphere Vol. 37 (1998) pp.
1473 – 1482
[33] Yeh, C. K.-J. Kao, Y.-A., Cheng, C.-P.: Oxidation of chlorophenols in soil at natural
pH by catalyzed hydrogen peroxide : the effect of soil organic matter. Chemosphere
Vol. 46 (2002) pp. 67 – 73
[34] The Interstate Technology & Regulatory Council In Situ Chemical Oxidation Team:
Technical and Regulatory Guide for In Situ Chemical Oxidation of Contaminated Soil
and Groundwater. 2nd ed. ISCO-2, 2005, Washington D.C., download from:
www.itrcweb.org, November 24, 2006
[35] Balazs, G. B., Cooper, J. F., Lewis, P. R., Adamson, M. G.: Transition Metal Catalysts
for the Ambient Temperature Destruction of Organic Wastes using Peroxydisulfate.
216th American Chemical Society National Meeting, Boston, August 23 – 27, 1998
[36] Liang, C., Bruell, C. J., Marley, M. C., Sperry, K. L.: Peroxodisulfate oxidation for in
situ remediation of TCE. II. Activated by chelated ferrous ion. Chemosphere Vol. 55
(2004) pp. 1225 - 1233
[37] Liang, C., Wang, Z.-S., Bruell, C. J.: Influence of pH on peroxodisulfate oxidation of
TCE at ambient termperatures. Chemosphere (2006), article in press
[38] Zuo, Z., Katsumura, Y., Ueda, K., Ishigure, K.: Laser photolysis study on reactions of
sulfate radical and nitrate radical with chlorate ion in aqueous solutions – Formation
and reduction potential of ClO3° radical. J. Chem. Soc., Faraday Trans. Vol. 93(4)
(1997) pp. 533 - 536
Indices 98
[39] Neta, P., Madhavan, V., Zemel, H., Fessenden, R. W.: Rate Constants and
Mechanism of Reaction of SO4-° with Aromatic Compounds. Journal of American
Chemical Society Vol. 99 (1977) p.163
[40] Liang, C., Bruell, C. J., Marley, M. C., Sperry, K. L.: Peroxodisulfate oxidation for in
situ remediation of TCE. I. Activated by ferrous ion with and without a peroxodisulfate-
thiosulfate redox couple. Chemopshere Vol. 55 (2004) pp. 1213 - 1223
[41] Huang, K-C., Couttenye, R. A., Hoag, G. E.: Kinetics of heat-assisted peroxodisulfate
oxidation of methyl tert-butyl ether (MTBE). Chemosphere Vol. 49 (2002) pp. 413 –
420
[42] Watts, R. J., Haller, D. R., Jones, A. P., Teel, A. L.: A foundation for the risk-based
treatment of gasoline-contaminated soils using modified Fenton’s reactions. Journal
of Hazardous Materials Vol. B76 (2000) pp. 73 – 89
[43] Goi, A., Kulik, N., Trapido, M.: Combined chemical and biological treatment of oil
contaminated soil. Chemosphere Vol. 63 (2006) pp. 1754 – 1763
[44] Ferguson, S. H., Woinarski, A. Z., Snape, I., Morris, C. E., Revill, A. T.: A field trial of
in situ chemical oxidation to remediate long-term diesel contaminated Antartic soil.
Cold Regions Science and Technology Vol. 40 (2004) pp. 47 – 60
[45] Huang, K.-C., Zhao, Z., Hoag, G. E., Dahmani, A., Block, P. A.: Degradation of
volatile organic compounds with thermally activated peroxodisulfate oxidation.
Chemosphere Vol. 61 (2005) pp. 551 – 560
[46] Forsey, S. P.: In situ Chemical Oxidation of Creoste/Coal Tar Residuals: Experimental
and Numerical Investigation. Doctor Thesis, University of Waterloo, Canada, 2004
[47] Dahmani, M. A., Huang, K., Hoag, G. E.: Sodium Peroxodisulfate Oxidation for the
Remediation of Chlorinated Solvents (USEPA Superfund Innovative Technology
Evaluation Program). Water, Air and Soil Pollution: Focus Vol. 6 (2006) pp. 127 – 141
[48] Online information from http://www.insituoxidation.com/index.html, viewed on January
6, 2007
[49] Online information from http://www.envsolutions.fmc.com/, viewed on January 6, 2007
[50] Redox Tech, LLC: Online information from www.redox-tech.com viewed on January
6, 2007
[51] GeoCleanse: Online information from http://www.geocleanse.com/, viewed on
January 6, 2007
Indices 99
[52] Advanced Oxidation: Online information from
http://www.advancedoxidation.com/index.html, viewed on January 6, 2007
[53] Insitu Tecnieken: Online information from http://www.insitu.nl/index.php, viewed on
January 6, 2007
[54] Fujishima, A. et al.: Historical Survey of Diamond Electrodes. in Ed. Fujishima, A. et
al.: Diamond Electrochemistry. BKC INC, Tokyo, Elsevier B.V., Amsterdam, 2005
[55] Fryda, M., Matthée, T., Mucahy, S., Hampel, A., Schäfer, L, Tröster, I.: Fabrication
and application of Diachem® electrodes. Diamond and Related Materials Vol. 12
(2003) pp. 1950 - 1956
[56] Gerger, I., Haubner, R., Kronberger, H., Fafilek, G.: Investigation of diamond coatings
on titanium substrates for electrochemical applications. Diamond an Related Materials
Vol. 13 (2004) pp. 1062 - 1069
[57] DiaCCon GmbH: Diamond The Hardest Material For Harshest Requirements.
Brochure, obtained at Achema, Frankfurt, 2006
[58] Martin, H. et al.: Electrochemical Effects on Diamond Surfaces: Wide Potential
Window, Reactivity, Spectroscopy, Doping Levels and Surface Conductivity. in Ed.
Fujishima, A. et al.: Diamond Electrochemistry. BKC INC, Tokyo, Elsevier B.V.,
Amsterdam, 2005
[59] Panizza M., Cerisola, G.: Application of diamond electrodes to electrochemical
processes. Electrochimica Acta Vol. 51 (2005) pp. 191 - 199
[60] Schlager, R.: Implementation of a New Electrochemical Technique for Drinking Water,
Process Water and Waste Water Treatment in Chile. Diploma Thesis, Institute of
Sustainable Waste Treatment and Technology, University of Leoben, 2005
[61] Tröster, I., Schäfer, L., Fryda, M., Matthée, T.: Electrochemical advanced oxidation
prosses using DiaChem® electrodes. Water Science and Technology Vol 49, No 4
(2004) pp. 207 – 212
[62] Tröster, I., Fryda, M., Hermann, D., Schäfer, L, Haenni, W, Perret, A., Blaschke, M.,
Kraft, A., Stadelmann, M.: Electrochemical advanced oxidation process for water
treatment using DiaChem® electrodes. Diamond and Related Materials Vol. 11
(2002) pp. 640 - 645
[63] Universtiy of Leoben, Austria, Department for Analytical Chemistry, experiment
conducted in June, 2006

Indices 100
[64] Cięciwa, A., Wüthrich, R., Comninellis, C.: Electrochemical characterization of
mechanically implanted boron-doped diamond electrodes. Electrochemistry
Communications Vol. 8 (2006) pp. 375 - 382
[65] University of Leoben, Austria, Department of Physical Metallurgy and Material
Testing, picture taken in July, 2006
[66] Homepage of the Ecole Polytechnique Fédérale de Lausanne Institut des sciences et
ingénierie chimiques : Online information from http://isic2.epfl.ch/page61926.html,
viewed on November 1, 2006
[67] Schelch, M., owner of pro aqua Diamantelektroden Produktion GmbH, technical
conversation from December 2005 until January 2007
[68] Comninellis, C. et al. : Application of Synthetic Boron-Doped Diamond Electrodes in
Electrooxidation Processes. in Ed. Fujishima, A. et al.: Diamond Electrochemistry.
BKC INC, Tokyo, Elsevier B.V., Amsterdam, 2005
[69] Vatistas N. et al.: Oxidant Production on BDD Anodes and Advanced Oxidation
Processes. in Ed. Fujishima, A. et al.: Diamond Electrochemistry. BKC INC, Tokyo,
Elsevier B.V., Amsterdam, 2005
[70] Michaud. P.A., Mahé, E., Haenni, W., Perret, A., Comninellis, C.: Preparation of
Peroxodisulfuric Acid Using Boron-Doped Diamond Thin Film Electrodes.
Electrochemical and Solid State Letters Vol. 3 (2000) pp. 77 - 79
[71] Serrano, K., Michaud, P. A., Comninellis, C., Savall, A.: Electrochemical prepartion of
peroxodisulfuric acid using boron doped diamond thin film electrodes. Electrochimica
Acta Vol. 48 (2002) pp. 431 - 436
[72] Furuta, T. et al.: Application of Diamond Electrodes for Water Disinfection. in Ed.
Fujishima, A. et al.: Diamond Electrochemistry. BKC INC, Tokyo, Elsevier B.V.,
Amsterdam, 2005
[73] Wesner, W.: Echem, technical conversation, August 2006
[74] Homepage WienEnergie: Online information from www.wienernergie.at, viewed on
April 4, 2007
[75] Homepage Sigma-Aldrich: Online information from. www.sigmaaldrich.com, viewed
on April 27, 2007
[76] Ivandini, T. et al.: Preparation and Characterization of Polycrystalline Chemical Vapor
Deposited Boron-doped Diamond Thin Films. in Ed. Fujishima, A. et al.: Diamond
Electrochemistry. BKC INC, Tokyo, Elsevier B.V., Amsterdam, 2005

Indices 101
[77] Kraft, A., Stadelmann, M., Blaschke, M.: Anodic oxidation with doped diamond
electrodes: a new advanced oxidation process. Journal of Hazardous Materials Vol.
B103 (2003) pp. 247 – 261
[78] Perret, A., Haenni, W., Skinner, N., Tang, X.-M., Gandini, D., Comninellis, C., Correa,
B., Foti, G.: Electrochemical behavior of synthetic diamond thin film electrodes.
Diamond and Related Materials Vol. 8 (1999) pp. 820 – 823
[79] Cañizares, P., Sáez, C., Lobato, J., Rodrigo, M. A.: Electrochemical treatment of 2.4-
dinitrophenol aqueous wastes using boron-doped diamond electrodes. Electrochimica
Acta Vol. 49 (2004) pp. 4641 - 4650
[80] Cañizares, P., Lobato, J., Paz, R., Rodrigo, M. A., Sáez, C.: Electrochemical oxidation
of phenolic wastes with boron-doped diamond anodes. Water Research Vol. 39
(2005) pp. 2687 – 2703
[81] Brillas, E., Sirés, I., Arias, C., Cabot, P. L., Centellas, F., Rodríguez, R. M., Garrido,
J.-A.: Mineralization of paracetamol in aqueous medium by anodic oxidation with a
boron-doped diamond electrode. Chemosphere Vol. 58 (2005) pp. 399 - 406
[82] Chen, X., Chen, G., Yue, P. L.: Anodic oxidation of dyes at novel Ti/B-diamond
electrodes. Chemical Engineering Science Vol. 58 (2003) pp. 995 - 1001
[83] Montilla, F., Michaud, P. A., Morallón, E., Vázquez, J. L., Comninellis, C.:
Electrochemical oxidation of benzoic acid at boron-doped diamond electrodes.
Electrochimica Acta Vol. 47 (2002) pp. 3509 - 3515
[84] Iniesta, J., Michaud, P. A., Panizza, M. Cerisola, G., Aldaz, A., Comninellis, C.:
Electrochemical oxidation of phenol at boron-doped diamond electrode.
Electrochimica Acta Vol. 46 (2002) pp. 3573 – 3578
[85] Laboratory of the Institute of Sustainable Waste Management and Technology,
University of Leoben
[86] Böhm, A., Institut für Aufbereitung und Veredelung, University of Leoben, technical
conversations November – December 2005
Indices 102
12.2 Tables
Table 1: Austrian laws on contaminated sites........................................................................ 7
Table 2: Inspection and intervention values for hydrocarbons and phenol according to
ÖNORM S 2088-1 and the Netherlands’s standards [11] ............................................... 9
Table 3: Different spiking methods and their efficiencies and variances [20, p. 402].............21
Table 4: Standard oxidation potential of ISCO chemicals [9, p. 2], [34 p. 2]..........................33
Table 5: Factors of influence on ISCO [10, pp. 10 – 12], [34, p. 4], [35, pp. 1 – 5], [37, p. 2] 36
Table 6: Applicability of oxidants to certain pollutants [9, p. 3], [10, p.10] .............................37
Table 7: Summary on contaminant elimination with hydrogen peroxide................................38
Table 8: Summary of peroxodisulfate application for contaminant elimination ......................40
Table 9: Companies providing ISCO technology with peroxodisulfate ..................................42
Table 10: Spiking tests analyzed for HC-index .....................................................................57
Table 11: Spiking tests tnalyzed for TOC and COD..............................................................57
Table 12: Spiking tests analyzed for TOC and phenol-index ................................................58
Table 13: Variation of parameters in long-term diesel oil decomposition experiments ..........60
Table 14: Variation of parameters in long-term phenol decomposition experiments .............60
Table 15: Soil pH alteration by peroxodisulfate and iron(II) application.................................64
Table 16: Resume of experiments conducted with the monopolar flow cell ..........................69
Table 17: Resume of experiments conducted with the bipolar flow cell ................................70
Table 18: Comparison of different electrode types................................................................71
Table 19: Exemplary calculation for linear regression...........................................................73
Table 20: Vertical transport experiments ..............................................................................80
Table 21: Horizontal transport experiments with 1 V/cm.......................................................82
Table 22: Most crucial parameters .......................................................................................93
Table 23: Overview of obtained results.................................................................................94
Table 24: Austrian Standards concerning contaminated sites................................................ II
Table 25: Number of localized contaminated sites in Austria at 1, January 2006 [1, p. 13] ... III
Table 26: Number of registered potentially contaminated sites in Austria at 1, January 2006
[1, p. 18] ........................................................................................................................ III
Table 27: Status quo of contaminated sites management actions by 1, January 2006 [1, p.30]
...................................................................................................................................... IV
Table 28: Patents concerning ISCO treatment with persulfate............................................. VII
Indices 103
Table 29: Parameters for degradation of organic compounds with BDD............................... XI
Table 30: Devices used for laboratory experiments ............................................................ XIII
Table 31: Chemicals...........................................................................................................XIV
Table 32: Soil material........................................................................................................XIV
Table 33: Linear regression calculation for oxidant production with the bipolar flow cell on
polymer basis ...............................................................................................................XX
Table 34: Linear regression calculation of different diamond electrode flow cells at similar
conditions referred to diamond covered surface .........................................................XXII
Table 35: Net diamond covered surface of different diamond electrode types ...................XXII
Indices 104
12.3 Figures
Figure 1: Preliminary scheme of the in-situ electrokinetic remediation technology
(ox = oxidant, p = pollutant, i = intermediate species)..................................................... 6
Figure 2: Branches accounting for contaminated sites in Austria adapted from [1, p. 16] .....10
Figure 3: Occurrence of pollutants in declared contaminated sites in Austria [2, p. 694].......11
Figure 4: Soil types according to the US Soil Taxonomy [13, p. 158]....................................13
Figure 5: Possible pathways of soil pollutants into the surrounding environment [13, p. 360]
......................................................................................................................................15
Figure 6: Distribution of different types of contaminants in soil .............................................18
Figure 7: Characteristics of the presence of NAPL in pore water (adapted from [19])...........20
Figure 8: Schematic EK soil remediation set-up [7, p. 161]...................................................23
Figure 9: Schematic set-up of electrodes for the in-situ generation of oxidizing agents and
their transport through the contaminated soil in the Interland project [31, p.470]. ..........29
Figure 10: Potential window of CVD BDD electrodes [62, p. 642].........................................45
Figure 11: cyclic voltammogramme of an MI BDD electrode [63]..........................................46
Figure 12: MI BDD electrode, 1) boron-doped diamond crystals, 2) non-conducting silicon
based coating, 3) titanium substrate [64, p. 376] ...........................................................47
Figure 13: .............................................................................................................................47
Figure 14:a) first model of a Ti MI BDD electrode, b) monopolar MI BDD on polymer basis .48
Figure 15: schematic set-up of the bi-polar MI BDD polymer electrode ................................49
Figure 16: Current efficiency for peroxodisulfate production with varying pH-value at 25°C
and 23 mA/cm² (upper curve BDD electrode, bottom curve Pt electrode) [72, p. 528] ...53
Figure 17: Decomposition of diesel with different amounts of peroxodisulfate analyzed with
HC-index .......................................................................................................................61
Figure 18: Decomposition of diesel with different amounts of peroxodisulfate and catalyst
analyzed with HC-index.................................................................................................62
Figure 19: Decomposition of phenol with different amounts of peroxodisulfate analyzed
according to phenol-index .............................................................................................63
Figure 20: Decomposition of phenol with different amounts of peroxodisulfate with catalyst
analyzed according to phenol-index ..............................................................................64
Figure 21: Schematic set-up of the monopolar MI BDD polymer electrode...........................68
Figure 22: Oxidant production with a monopolar polymer based diamond electrode at
different current densities and with different numbers of membranes (M)......................72
Indices 105
Figure 23: Dependence of peroxodisulfate production on current density with an electrolyte of
0.85 M Na2SO4 ..............................................................................................................74
Figure 24: Dependence on temperature with an electrolyte of 0.85 M Na2SO4 .....................74
Figure 25: Dependence of peroxodisulfate production on the electrolyte’s acidity at 20°C and
200 mA/cm²...................................................................................................................75
Figure 26: Dependence of peroxodisulfate production on the number of applied membranes
at 20°C and 200 mA/cm² ............................. ..................................................................75
Figure 27: Performance of different diamond electrode types at 15 °C (20 °C for BPP-BDD)
and 45 mA/cm² (Ti-BDD), 56 mA/cm² (MPP-BDD), 50 mA/cm² (CVD-BDD) and 67
mA/cm² (BPP-BDD).......................................................................................................76
Figure 28: Horizontal transport system with electrolyte solution............................................79
Figure 29: Vertical transport system .....................................................................................80
Figure 30: Analysis of horizontal transport experiments with peroxodisulfate spiked soil ......81
Figure 31: Migration velocity of peroxodisulfate ions in sand depending on different field
strengths .......................................................................................................................83
Figure 32: Migration velocity of peroxodisulfate and iron ions in different types of soil under
an electric gradient of 4 V/cm ........................................................................................84
Figure 33: Osmotic flow in dependence to the soil’s silt content ...........................................84
Figure 34: pH-value alteration caused by application of electric gradient to soil ...................85
Figure 35: Qualitative net migration velocity of peroxodisulfate ions in different types of soil
under an electric gradient of 1 V/cm ..............................................................................86
Figure 36: Qualitative migration velocity of peroxodisulfate ions in different soil types at 1
V/cm..............................................................................................................................86
Figure 37: Quantitative analysis of the amount of peroxodisulfate migrating in different types
of soil under an electrical gradient of 1 V/cm .................................................................87
Figure 38: Recommended design for additional transport experiments ................................88
Figure 39: Hot filament CVD process [57]............................................................................. IX
Figure 40: two step advanced oxidation process (compare [69, p. 484]) ............................. XII
Figure 41: Chromatogram for diesel after one week of chemical reaction with 142.3 mol of
persulfate and iron (II) catalyst [85] ............................................................................XVII
Figure 42: Chromatogram for diesel after twelve weeks of chemical reaction with 142.3 mol
of persulfate and iron (II) catalyst [85] .......................................................................XVIII
Figure 43: Tested soil compositions in vertical and horizontal arrangement for electrokinetic
persulfate transport .....................................................................................................XIX
Indices 106
12.4 Abbreviations
Abbreviation Explanation AC alternating current BDD boron doped diamond electrode BPP-BDD bipolar polymer based boron doped diamond electrode BTEX benzene, toluene, ethylbenzene, xylene CHC chlorinated hydrocarbon compounds COD chemical oxygen demand CV coefficient of variance CVD chemical vapour deposition CVD-BDD chemical vapor deposition boron doped diamond electrode DC direct current DCE dichloroethene DNAPL dense non-aqueous phase liquid DS dry substance EDTA ethylenediaminetetraacetate EK electrokinetic remediation or treatment EPA Environmental Protection Agency (US) FEA Federal Environment Agency (Austria) GC-MS gas chromatography mass spectrometer HC hydrocarbon HFCVD hot filament chemical vapour deposition HOC hydrophobic organic compounds ISCO in-situ chemical oxidation LC lethal concentration LD lethal dose LNAPL low-dense non-aqueous phase liquid MI mechanically implanted MPP-BDD monopolar polymer based boron doped diamond electrode MTBE methyl tert-butyl ether NAPLs non-aqueous phase liquids OC organic carbon ÖNORM Austrian Standard PAH polycyclic aromatic hydrocarbons PCB polychlorinated biphenyls PCE perchloroethene PP polypropylene SCE standard calomel electrode SHE standard hydrogen electrode SOM soil organic matter TCA Trichloroethane TCE trichloroethene Ti-BDD titanium based boron doped diamond electrode TOC total organic carbon TPH total petroleum hydrocarbons VOC volatile organic carbons WHO World Health Organization

A I
Annexure
A II
Appendix 1 – Contaminated Sites in Austria
Table 24: Austrian Standards concerning contaminated sites
Austrian Standard Concern
ÖNORM S 2085
Contaminated Sites – Course of Action for Treatment of Waste
Deposits and Industrial Sites: This standard determines the course
of action for standards of the series S 2086 until S 2089.
ÖNORM S 2086
Contaminated Sites – Terms and Definitions: This standard defines
terms, which describe the technical background for the investigation
and assessment of contaminated sites, as well as measures for
hazard reduction and elimination.
ÖNORM S 2087
Contaminated Sites – Identification and Investigation of (potentially)
Contaminated Sites: This standard provides a practical overview on
common identification and investigation methods, gives advice for
efficient acquisition of information and regulates the comparability of
results, which serve as a basis for the planning of treatment
measures.
ÖNORM S 2088-1
Contaminated Sites – Risk Assessment Concerning the Pollution of
Groundwater Which Is to Be Safeguarded: This standard applies to
the assessment of sites with respect to endangerment of
groundwater. It provides inspection and intervention values which
serve as a basis for further action.
ÖNORM S 2088-2
Contaminated Sites – Risk Assessment for Polluted Soil Concerning
Impacts on Surface Environments: This standard describes the
foundations for the evaluation of investigation results of potentially
contaminated sites and determines the assessment of the resulting
endangerment of soil environments.
ÖNORM S 2088-3
Contaminated Sites – Risk Assessment for Public Asset Air Which
Is to Be Safeguarded: This standard describes the foundations for
the evaluation of investigation results of potentially contaminated
sites and determines the assessment of the resulting endangerment
to public air. Its goal is to determine the necessity of containment or
remediation measures.
ÖNORM S 2089
Contaminated Sites – Security Measures and Remediation: This
standard describes the current applied containment and remediation
technologies.
ÖNORM S 2091
Contaminated Sites – Solid Sampling: Extraction of Solid Samples
from Contaminated Sites: This standard determines the
requirements of solid sampling. The results are the basis for the
assessment of the site’s hazard to humans and the environment or
the foundation for control measures during site remediation.
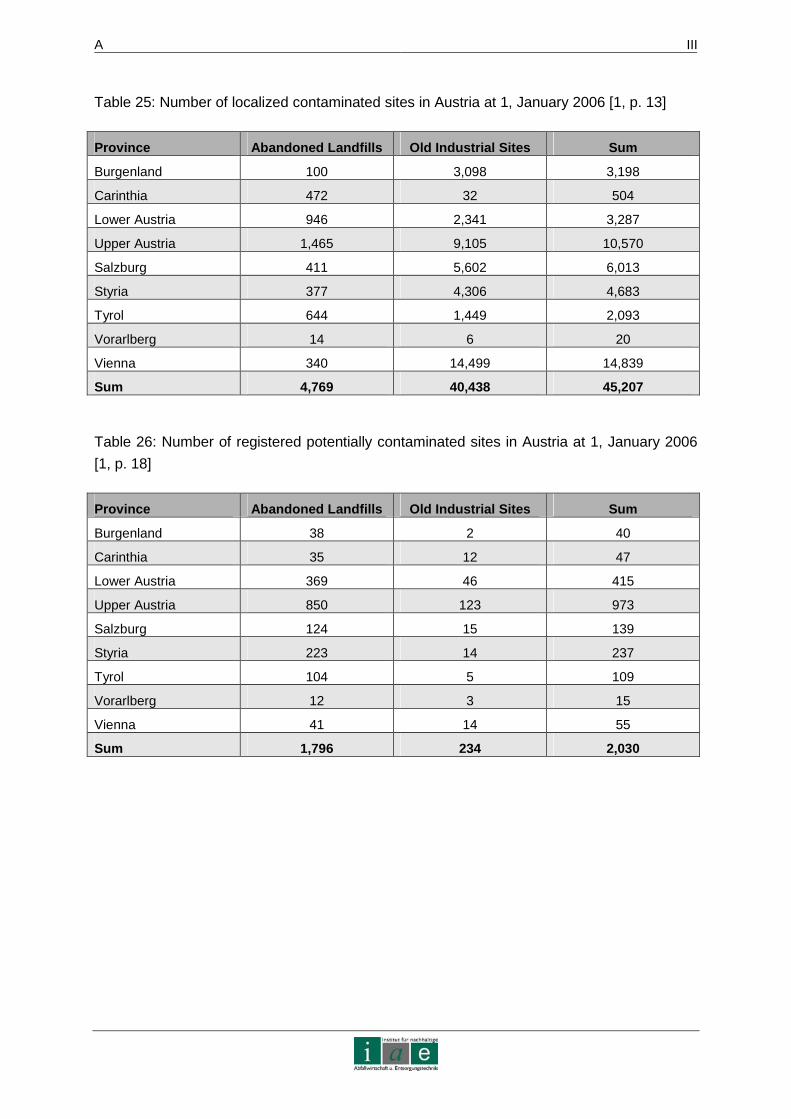
A III
Table 25: Number of localized contaminated sites in Austria at 1, January 2006 [1, p. 13]
Province Abandoned Landfills Old Industrial Sites Sum
Burgenland 100 3,098 3,198
Carinthia 472 32 504
Lower Austria 946 2,341 3,287
Upper Austria 1,465 9,105 10,570
Salzburg 411 5,602 6,013
Styria 377 4,306 4,683
Tyrol 644 1,449 2,093
Vorarlberg 14 6 20
Vienna 340 14,499 14,839
Sum 4,769 40,438 45,207
Table 26: Number of registered potentially contaminated sites in Austria at 1, January 2006
[1, p. 18]
Province Abandoned Landfills Old Industrial Sites Sum
Burgenland 38 2 40
Carinthia 35 12 47
Lower Austria 369 46 415
Upper Austria 850 123 973
Salzburg 124 15 139
Styria 223 14 237
Tyrol 104 5 109
Vorarlberg 12 3 15
Vienna 41 14 55
Sum 1,796 234 2,030
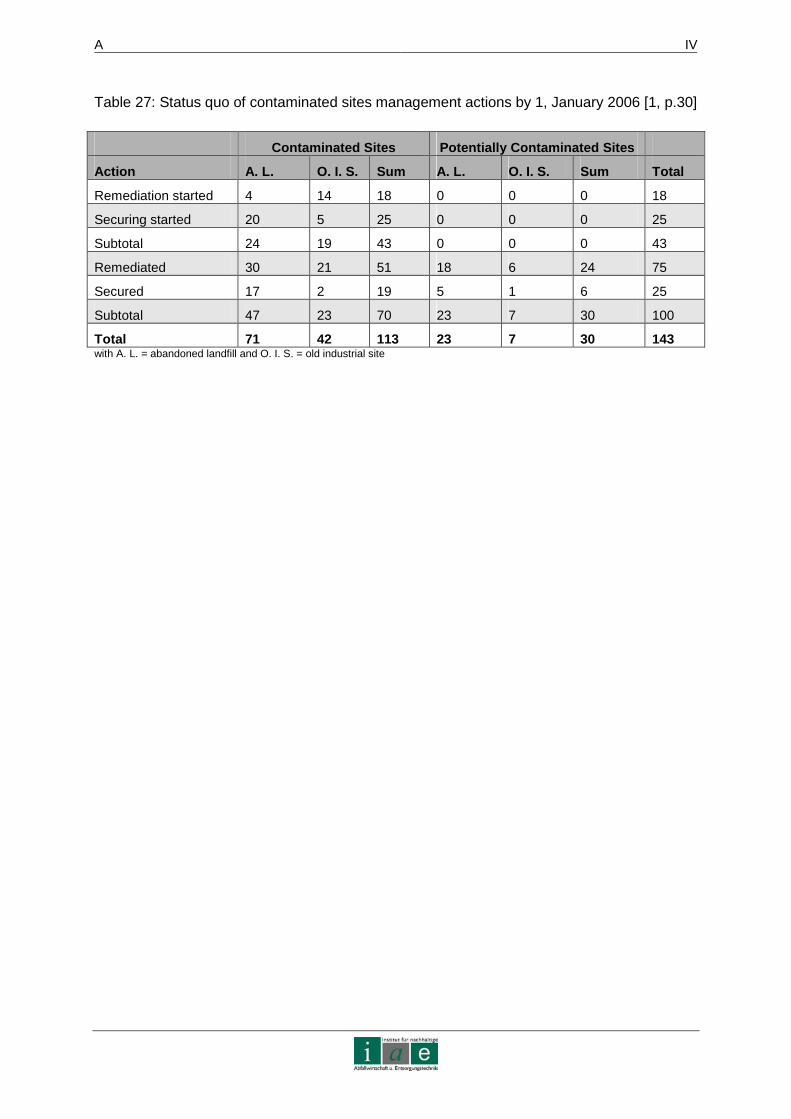
A IV
Table 27: Status quo of contaminated sites management actions by 1, January 2006 [1, p.30]
Contaminated Sites Potentially Contaminated Sites
Action A. L. O. I. S. Sum A. L. O. I. S. Sum Total
Remediation started 4 14 18 0 0 0 18
Securing started 20 5 25 0 0 0 25
Subtotal 24 19 43 0 0 0 43
Remediated 30 21 51 18 6 24 75
Secured 17 2 19 5 1 6 25
Subtotal 47 23 70 23 7 30 100
Total 71 42 113 23 7 30 143 with A. L. = abandoned landfill and O. I. S. = old industrial site

A V
Appendix 2 – Additional ISCO Chemicals
Permanganate
Permanganate is the most tested ISCO chemical both on scientific and practical level.
Therefore, a wide range of information is available. The substance is easy to handle, except
for dust production, and does not produce heat or gas while reacting in the soil matrix. It can
be applied for a wide range of pH-values. Its reaction mechanism is as follows (see Eq. 42 till
Eq. 44):
Eq. 42: MnO4- + 8 H+ + 5 e → Mn2+ + 4 H2O (for pH < 3.5)
Eq. 43: MnO4- + 2 H2O + 3 e → MnO2 + 4 OH- (for pH 3.5 – 12)
Eq. 44. MnO4- + e → MnO4
2- (for pH > 12)
The main disadvantage of permanganate is the formation of manganese peroxide, which can
reduce pore conductivity in certain soil types. Its main advantage is its stability. Therefore, it
can remain up to months in the subsurface and diffuse into lower permeability zones.
Permanganate reacts by direct electron transfer in contrast to the Fenton’s reagent and
peroxodisulfate free radical. Nevertheless, large amounts are necessary to mineralize e.g.
phenol (15.7 g potassium permanganate per g phenol) as has been tested in waste water
treatment. Another shortcoming of permanganate is that it shows poor efficiency in oxidation
of DNAPLs, benzene and MTBE. High concentration of permanganate in the injection
solution might also lead to inefficient remediation and long term release of manganese into
groundwater. Therefore, the EPA has established a threshold value of 0.05 mg/l. [10], [34],
[9]
Ozone
Ozone is the only gaseous oxidant used in the context of in-situ soil remediation. It is
administered as an air ozone mixture to the soil, where it is mainly applied in vadose zone
treatment, but it can also be injected under the water table for groundwater treatment
functioning as in waste water treatment. As it is short-lived, it needs to be produced on-site.
However, its generation is sumptuous. Ozone can react by direct electron transfer mainly
attacking carbon double bondings or by radical reactions (see Eq. 45 and Eq. 46
respectively):
Eq. 45: O3 + 2 H+ + 2 e → O2 + 2 H2O
Eq. 46: O3 + OH- → O2 + OH°
The following reaction steps involving radicals are identical to Eq. 8 and Eq. 9. Oxygen will
continuously be produced as reaction product, which can enhance aerobic microbial activity
in soil and support the oxidation success. Special attention has to be paid to soils rich in

A VI
carbonates as those function as scavengers just like iron, manganese and organic carbon
(not being component of a pollutant). A further drawback is the volatilization of contaminants.
An advantage over permanganate and peroxodisulfate is that it does not leave any residual
products such as MnO2 or SO42-.
Alternatively, ozone and hydrogen peroxide can be applied together, thus offering the
advantages of both chemicals. The two oxidants also produce hydroxyl radicals (see Eq. 47).
Eq. 47: 2 O3 + H2O2 → 2 OH° + 3 O 2
[10], [34], [9]
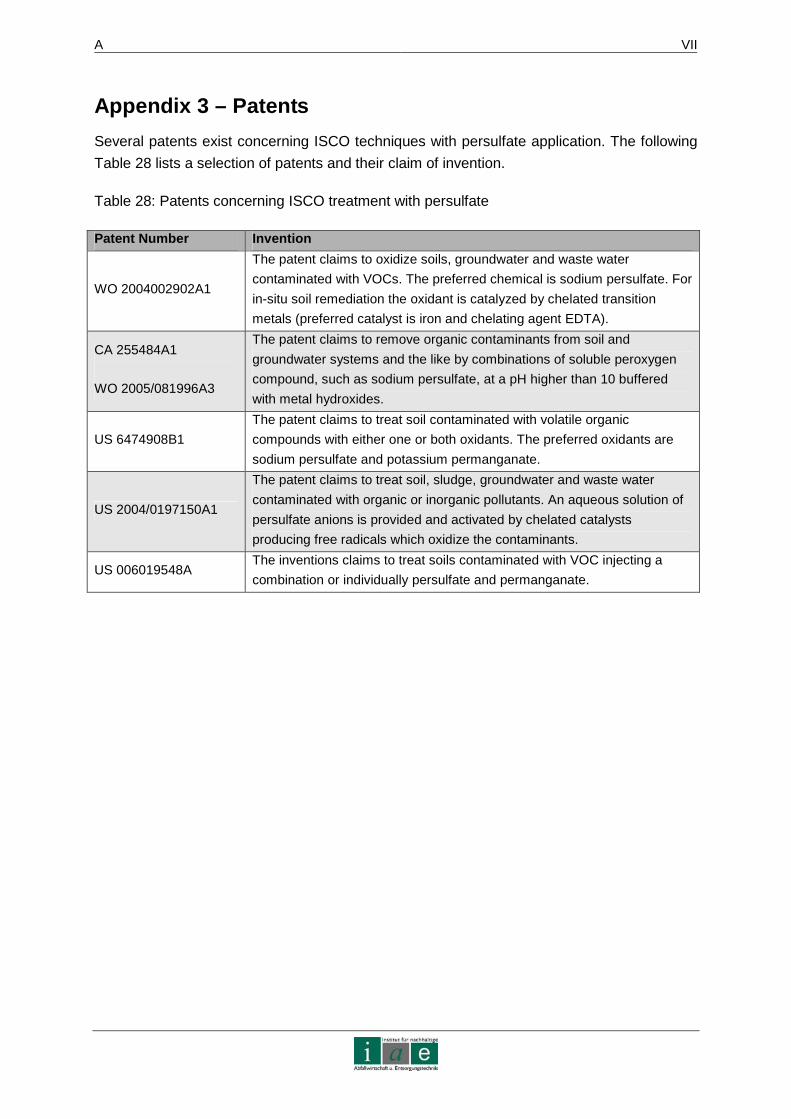
A VII
Appendix 3 – Patents
Several patents exist concerning ISCO techniques with persulfate application. The following
Table 28 lists a selection of patents and their claim of invention.
Table 28: Patents concerning ISCO treatment with persulfate
Patent Number Invention
WO 2004002902A1
The patent claims to oxidize soils, groundwater and waste water
contaminated with VOCs. The preferred chemical is sodium persulfate. For
in-situ soil remediation the oxidant is catalyzed by chelated transition
metals (preferred catalyst is iron and chelating agent EDTA).
CA 255484A1
WO 2005/081996A3
The patent claims to remove organic contaminants from soil and
groundwater systems and the like by combinations of soluble peroxygen
compound, such as sodium persulfate, at a pH higher than 10 buffered
with metal hydroxides.
US 6474908B1
The patent claims to treat soil contaminated with volatile organic
compounds with either one or both oxidants. The preferred oxidants are
sodium persulfate and potassium permanganate.
US 2004/0197150A1
The patent claims to treat soil, sludge, groundwater and waste water
contaminated with organic or inorganic pollutants. An aqueous solution of
persulfate anions is provided and activated by chelated catalysts
producing free radicals which oxidize the contaminants.
US 006019548A The inventions claims to treat soils contaminated with VOC injecting a
combination or individually persulfate and permanganate.
A VIII
Appendix 4 – Chemical Vapor Deposition Process
Chemical Vapor Deposition
CVD is the more common method for BDD fabrication. Three techniques are available:
1. plasma-assisted CVD,
2. hot filament CVD and
3. combustion flame CVD.
Basically, a carbon containing species in gas-phase, mostly methane, is transformed under
low pressure into a cubic crystalline form with controlled integration of boron in an enriched
hydrogen atmosphere. In the plasma-assisted process, it is the task of the plasma to
generate atomic hydrogen and produce appropriate carbon precursors for diamond growth,
i.e. sp³ carbon. Sp² carbon corresponds to graphite and would leave an impure diamond
surface on the electrode, which diminishes its properties [76, pp.11 – 14]. As the hot filament
CVD (HFCVD) process is the most common and succeeded in producing the largest area
electrodes in CVD processes, up to 0.5 m², this method will be explained more in detail,
leaving out explanations for the combustion flame method. The base materials for HFCVD
are refractory metals, such as Ti, Nb, W and also silicon or ceramics. The most common
substrate is titanium. The first step is to pretreat the base metal. This can be done by sand-
blasting for cleaning and increasing the surface’s roughness. Then the filament is heated up
to 2200 till 2600 °C and placed at some 20 cm from the substrate, whose temperature is at
about 700 till 925 °C. The pressure is leveled at 1 0 to 50 mbar. A gas mixture of hydrogen
(96 – 99%), methane (0.5 – 2.5 %) and boron (10 – 200 ppm) is introduced. [55, pp. 1951]
Hydrogen is decomposed to atomic hydrogen due to the high filament temperature. This
reacts with methane to hydrogen and an sp³ carbon, which is deposited on the substrate.
The net reaction can be described as follows [76, p. 17]:
Eq. 48: CH4 (g) → Cdiamond + 2H2
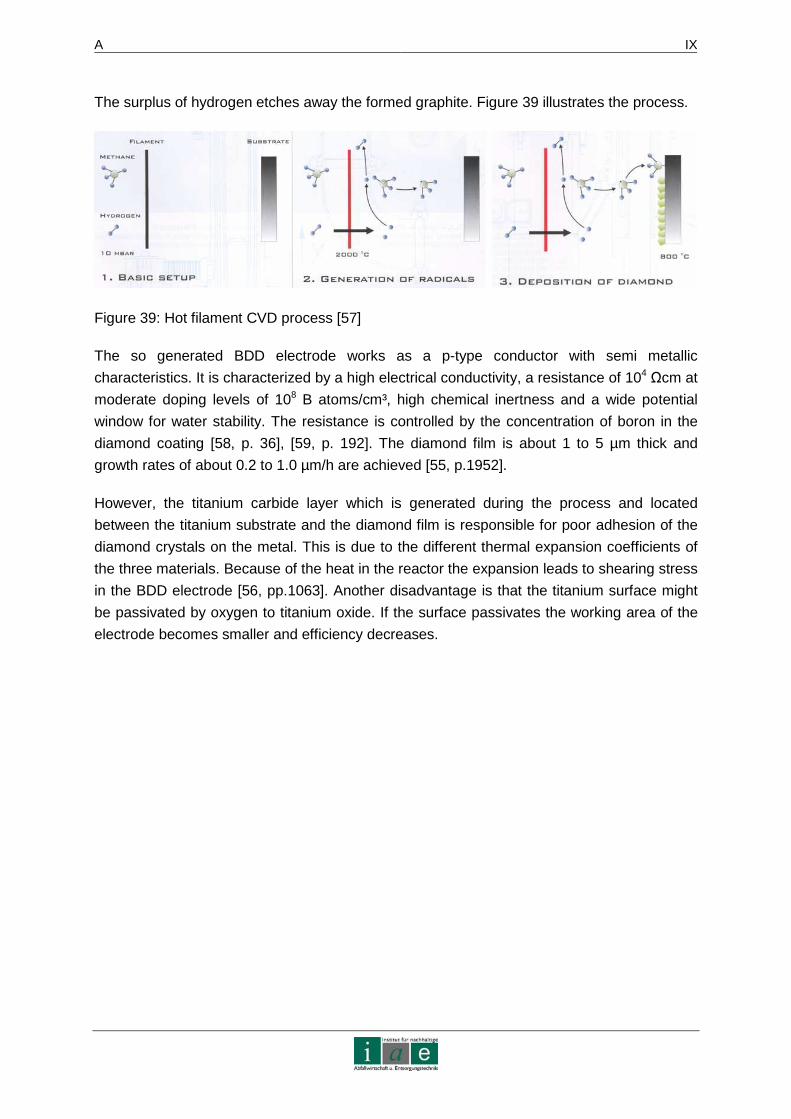
A IX
The surplus of hydrogen etches away the formed graphite. Figure 39 illustrates the process.
Figure 39: Hot filament CVD process [57]
The so generated BDD electrode works as a p-type conductor with semi metallic
characteristics. It is characterized by a high electrical conductivity, a resistance of 104 Ωcm at
moderate doping levels of 108 B atoms/cm³, high chemical inertness and a wide potential
window for water stability. The resistance is controlled by the concentration of boron in the
diamond coating [58, p. 36], [59, p. 192]. The diamond film is about 1 to 5 µm thick and
growth rates of about 0.2 to 1.0 µm/h are achieved [55, p.1952].
However, the titanium carbide layer which is generated during the process and located
between the titanium substrate and the diamond film is responsible for poor adhesion of the
diamond crystals on the metal. This is due to the different thermal expansion coefficients of
the three materials. Because of the heat in the reactor the expansion leads to shearing stress
in the BDD electrode [56, pp.1063]. Another disadvantage is that the titanium surface might
be passivated by oxygen to titanium oxide. If the surface passivates the working area of the
electrode becomes smaller and efficiency decreases.
A X
Appendix 5 - Waste Water Treatment with BDD Electro des
This appendix reports briefly investigations on the degradation of organic compounds in
water with diamond electrodes. Even though this project does not aim at waste water
treatment, the reported literature has been studied in order to obtain a number of parameters
that are crucial for successful BDD electrode operation. This is due to the fact, that BDD
electrode performance has been studied best until now in the context of waste water
treatment. Furthermore, a general application of the MI BDD used in this work for
degradation of organic compounds in aqueous media has been tested in order to be able to
compare the performance of the MI electrode with the CVD electrodes.
When treating waste water with BDD electrodes direct and indirect oxidation can occur. The
first takes place at potentials below oxygen evolution, i.e. where water is stable. The latter
option functions via electro generation of active species, normally OH°, in the potential region
above water stability. These oxidative species have high potentials and can therefore oxidize
organic compounds. The potential for phenol oxidation for example is 1.67 V. [59, pp. 192].
For the evaluation of the degradation performance, the current efficiency is measured. This
generally depends on the initial concentration of the pollutant and the applied current density.
At higher concentrations, the reaction is kinetically controlled, which means that there is no
limitation in mass transport [59, p. 193].
The success of waste water treatment with BDD electrodes is very promising as various
authors report current efficiencies of over 90 % and almost complete depletion of the
pollutant (EDTA, malic acid and others [77]; EDTA, cooling lubricants and cyanides [62];
phenol [78]). Panizza et al. [59] give a complete overview on a number of studies in a critical
review from 2005.
In Table 29 the main parameters, which have been considered in mentioned investigations
shall be listed. They were taken as a basis for the proper experiments of the soil remediation
project.
As degradation success is limited by mass transfer for low concentrations, Vatistas et al. [69]
suggest using a two reactor set-up. Figure 40 shows such a system. Hydroxyl radicals are
generated in the electrolysis cell and then pumped with the electrolyte into an oxidation
chamber where, the waste water is treated. The oxidizing species are activated by heat or
UV radiation. With turbulent mixing the mass transfer problem should not occur. This
application is interesting for the soil remediation project as the soil’s pollutant cannot be
treated directly at the electrode. Therefore, oxidizing agents are produced in the
electrochemical cell and are introduced into the soil, where they are activated by Fe(II) as
catalyst. So in principle, these two procedures resemble each other.
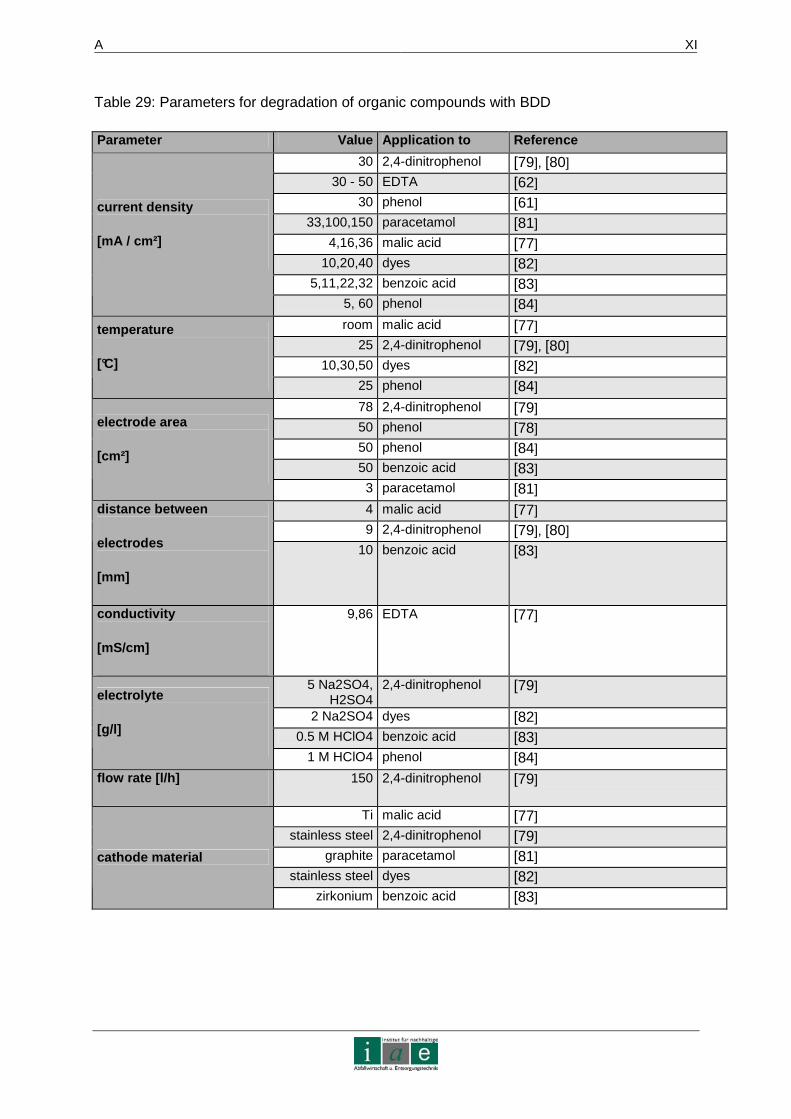
A XI
Table 29: Parameters for degradation of organic compounds with BDD
Parameter Value Application to Reference
30 2,4-dinitrophenol [79], [80] 30 - 50 EDTA [62]
30 phenol [61] 33,100,150 paracetamol [81]
4,16,36 malic acid [77] 10,20,40 dyes [82]
5,11,22,32 benzoic acid [83]
current density
[mA / cm²]
5, 60 phenol [84]
room malic acid [77] 25 2,4-dinitrophenol [79], [80]
10,30,50 dyes [82]
temperature
[°C]
25 phenol [84]
78 2,4-dinitrophenol [79] 50 phenol [78] 50 phenol [84] 50 benzoic acid [83]
electrode area
[cm²]
3 paracetamol [81]
4 malic acid [77] 9 2,4-dinitrophenol [79], [80]
distance between
electrodes
[mm]
10 benzoic acid [83]
conductivity
[mS/cm]
9,86 EDTA [77]
5 Na2SO4, H2SO4
2,4-dinitrophenol [79]
2 Na2SO4 dyes [82] 0.5 M HClO4 benzoic acid [83]
electrolyte
[g/l]
1 M HClO4 phenol [84]
flow rate [l/h] 150 2,4-dinitrophenol [79]
Ti malic acid [77] stainless steel 2,4-dinitrophenol [79]
graphite paracetamol [81] stainless steel dyes [82]
cathode material
zirkonium benzoic acid [83]

A XII
electrolysiscell
oxidation of organic
compounds
+-
polluted waste water
oxidizing agents UV, heat
clean waste water
electrolyte
electrolysiscell
oxidation of organic
compounds
+-
polluted waste water
oxidizing agents UV, heat
clean waste water
electrolyte
Figure 40: two step advanced oxidation process (compare [69, p. 484])
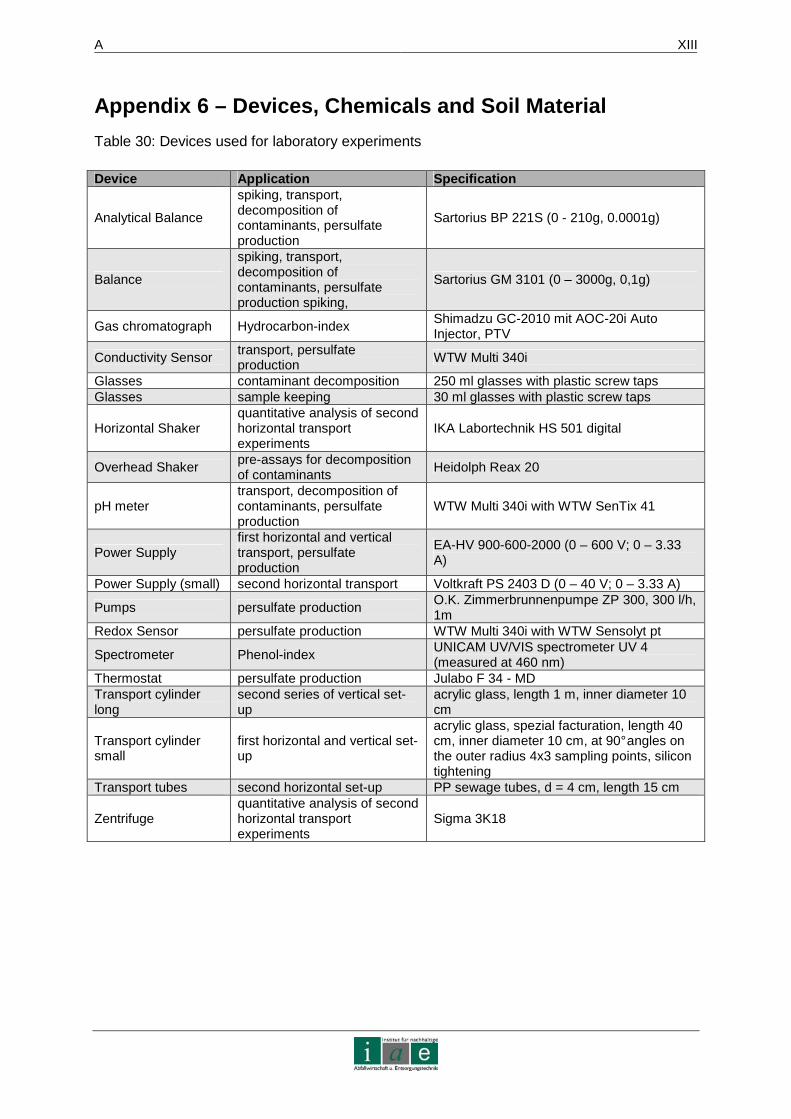
A XIII
Appendix 6 – Devices, Chemicals and Soil Material
Table 30: Devices used for laboratory experiments
Device Application Specification
Analytical Balance
spiking, transport, decomposition of contaminants, persulfate production
Sartorius BP 221S (0 - 210g, 0.0001g)
Balance
spiking, transport, decomposition of contaminants, persulfate production spiking,
Sartorius GM 3101 (0 – 3000g, 0,1g)
Gas chromatograph Hydrocarbon-index Shimadzu GC-2010 mit AOC-20i Auto Injector, PTV
Conductivity Sensor transport, persulfate production WTW Multi 340i
Glasses contaminant decomposition 250 ml glasses with plastic screw taps Glasses sample keeping 30 ml glasses with plastic screw taps
Horizontal Shaker quantitative analysis of second horizontal transport experiments
IKA Labortechnik HS 501 digital
Overhead Shaker pre-assays for decomposition of contaminants
Heidolph Reax 20
pH meter transport, decomposition of contaminants, persulfate production
WTW Multi 340i with WTW SenTix 41
Power Supply first horizontal and vertical transport, persulfate production
EA-HV 900-600-2000 (0 – 600 V; 0 – 3.33 A)
Power Supply (small) second horizontal transport Voltkraft PS 2403 D (0 – 40 V; 0 – 3.33 A)
Pumps persulfate production O.K. Zimmerbrunnenpumpe ZP 300, 300 l/h, 1m
Redox Sensor persulfate production WTW Multi 340i with WTW Sensolyt pt
Spectrometer Phenol-index UNICAM UV/VIS spectrometer UV 4 (measured at 460 nm)
Thermostat persulfate production Julabo F 34 - MD Transport cylinder long
second series of vertical set-up
acrylic glass, length 1 m, inner diameter 10 cm
Transport cylinder small
first horizontal and vertical set-up
acrylic glass, spezial facturation, length 40 cm, inner diameter 10 cm, at 90° angles on the outer radius 4x3 sampling points, silicon tightening
Transport tubes second horizontal set-up PP sewage tubes, d = 4 cm, length 15 cm
Zentrifuge quantitative analysis of second horizontal transport experiments
Sigma 3K18
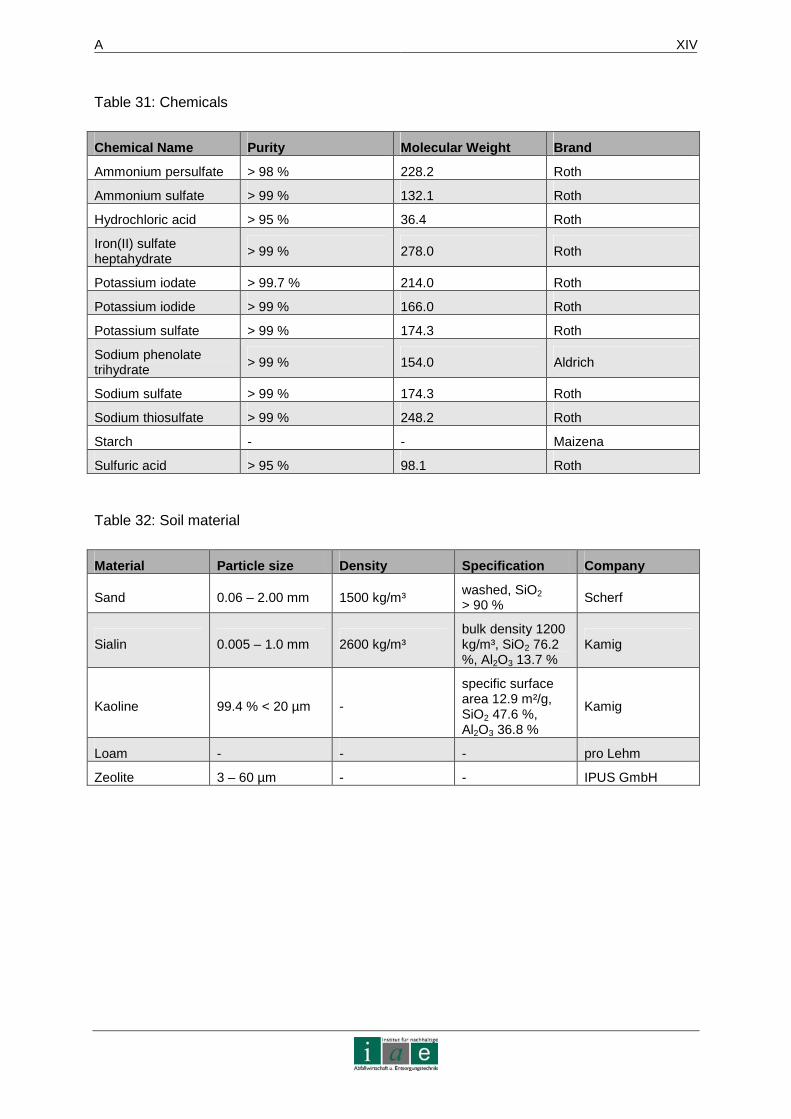
A XIV
Table 31: Chemicals
Chemical Name Purity Molecular Weight Brand
Ammonium persulfate > 98 % 228.2 Roth
Ammonium sulfate > 99 % 132.1 Roth
Hydrochloric acid > 95 % 36.4 Roth
Iron(II) sulfate heptahydrate
> 99 % 278.0 Roth
Potassium iodate > 99.7 % 214.0 Roth
Potassium iodide > 99 % 166.0 Roth
Potassium sulfate > 99 % 174.3 Roth
Sodium phenolate trihydrate > 99 % 154.0 Aldrich
Sodium sulfate > 99 % 174.3 Roth
Sodium thiosulfate > 99 % 248.2 Roth
Starch - - Maizena
Sulfuric acid > 95 % 98.1 Roth
Table 32: Soil material
Material Particle size Density Specification Company
Sand 0.06 – 2.00 mm 1500 kg/m³ washed, SiO2 > 90 % Scherf
Sialin 0.005 – 1.0 mm 2600 kg/m³ bulk density 1200 kg/m³, SiO2 76.2 %, Al2O3 13.7 %
Kamig
Kaoline 99.4 % < 20 µm -
specific surface area 12.9 m²/g, SiO2 47.6 %, Al2O3 36.8 %
Kamig
Loam - - - pro Lehm
Zeolite 3 – 60 µm - - IPUS GmbH
A XV
Appendix 7 – Chemical Analytical Methods
Hydrocarbon-Index
The hydrocarbon-index was determined according to ÖNORM EN ISO 9377-2:2001 by the
laboratory of the Institute for Waste Management and Technology, University of Leoben,
[85]. The following specifications have been applied:
1. sample mass: 5.0 g (+/- 0.1 g)
2. samples were mixed with 20 ml RTW standards
3. thermal program: 80 °C / 3 min, 20 °C / min auf 305 °C / 15 min, 20 °C / min auf
360 °C / 5 min (cleaning)
4. carrier gas: nitrogen, 48,6 cm / s
5. column: Retex XTI-5 (30m x 0,32 mm, 0,25µm)
6. Detector: flame ionization
Phenol-Index
The phenol-index was determined according to DIN 38409-16 by the laboratory of the
Institute for Waste Management and Technology, University of Leoben, [85]. The method is
based on photometric determination of 4-aminoantipyrine without distillation with dye
extraction. All standard chemicals were used and are not named in the chemical list.
Samples were diluted mainly 1:400, several times 1:800 and one time 1:1000 with distilled
water. The spectrometer was used at 460 nm.
Iodometric Titration
Preparation of titration solution
One liter of distilled water was prepared by boiling for sterilization and down-cooling to room
temperature. A respective amount of sodium thiosulfate was added in order to prepare a
0.1 M solution. For stabilization 1 g of amylalcohol was added.
Determination of the titration factor
KIO3 was dried at 180°C and cooled in an exsiccator. Th en an amount of between 0.08 and
0.1 g were added to 200 ml distilled water in an Erlenmeyer flask. The exact amount of
added KIO3 has to be noted. Approximately 1 g of KI was aggregated together with 20 ml of
hydrochloric acid (1:2 dilution). Finally, the prepared solution is titrated with the 0.1 M titration
solution. As 1 ml of 0.1 M thiosulfate solution correspond to 3.567 mg of KIO3 the following
calculation leads to the theoretically needed amount of thiosulfate.
A XVI
−
−
=3
3223
567,3
1*
KIOmg
OSNamlKIOmgYx with Y = exact amount of KIO3
The factor corresponds to the ratio of theoretical amount over actual amount of titration
solution.
Determination of oxidants
The prepared samples (20 ml sample with 20 ml of 10 % sulfuric acid and an excess amount
of KI) haven been titrated with the thiosulfate solution after a reaction time of at least three
hours. The orange sample solution turns yellow and then transparent during titration. Before
changing color to transparent a few drops of starch solution have been added in order to
color the sample blue (due to the starch iodine complex) for better color distinction. The
concentration of oxidant, i.e. persulfate, was calculated as follows:
−−− +→+ IOSIOS 22 2642
232
Two moles of thiosulfate reduce one mol of iodine. Iodine has been formed by the oxidizing
agents in the sample from the added KI. So the molar amount of iodine in the sample
corresponds to the volume in ml of thiosulfate titrated multiplied with its concentration
(0.1 M).
22
232
232
2
−−
==OScVOnS
nI
As it was assumed that one mole persulfate oxidizes two moles of iodide into one mole of
iodine, the determined amount of iodine (nI2) is equal to the amount of persulfate having
been present in the sample.
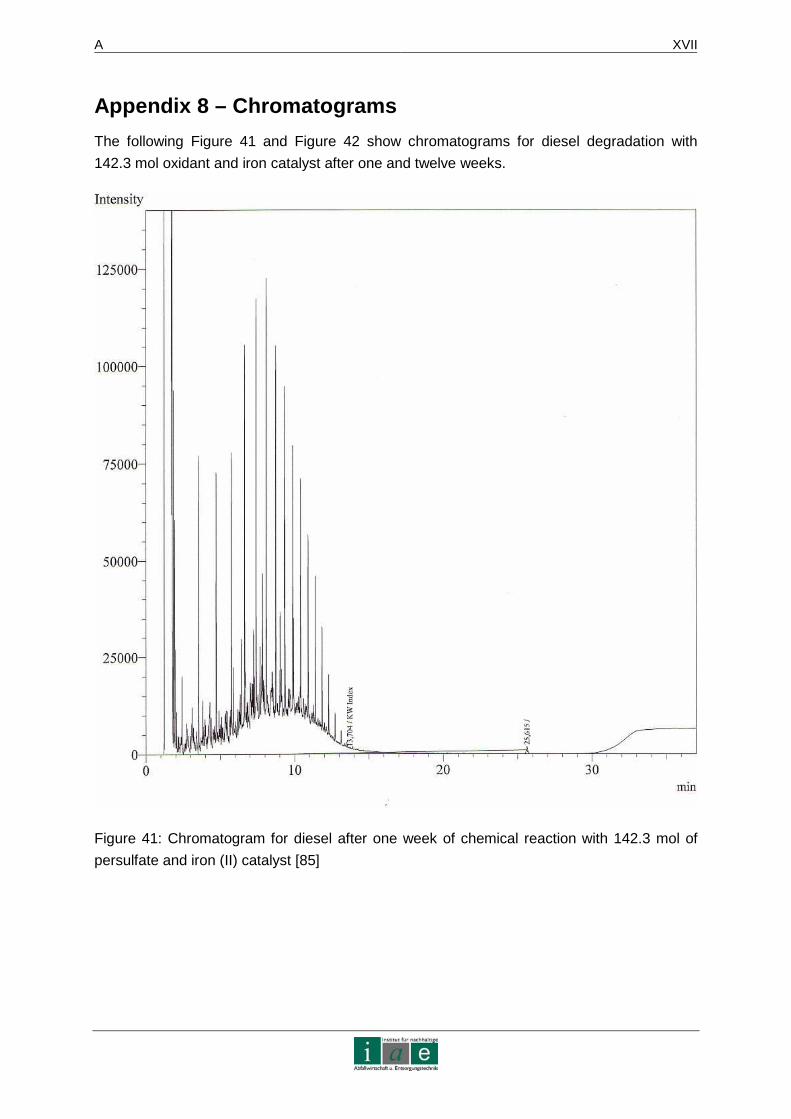
A XVII
Appendix 8 – Chromatograms
The following Figure 41 and Figure 42 show chromatograms for diesel degradation with
142.3 mol oxidant and iron catalyst after one and twelve weeks.
Figure 41: Chromatogram for diesel after one week of chemical reaction with 142.3 mol of
persulfate and iron (II) catalyst [85]

A XVIII
Figure 42: Chromatogram for diesel after twelve weeks of chemical reaction with 142.3 mol
of persulfate and iron (II) catalyst [85]
Optically, the two chromatograms cannot be distinguished. Integration, however, reveals that
after one week about 40 % and after twelve weeks about 80 % have been degraded.
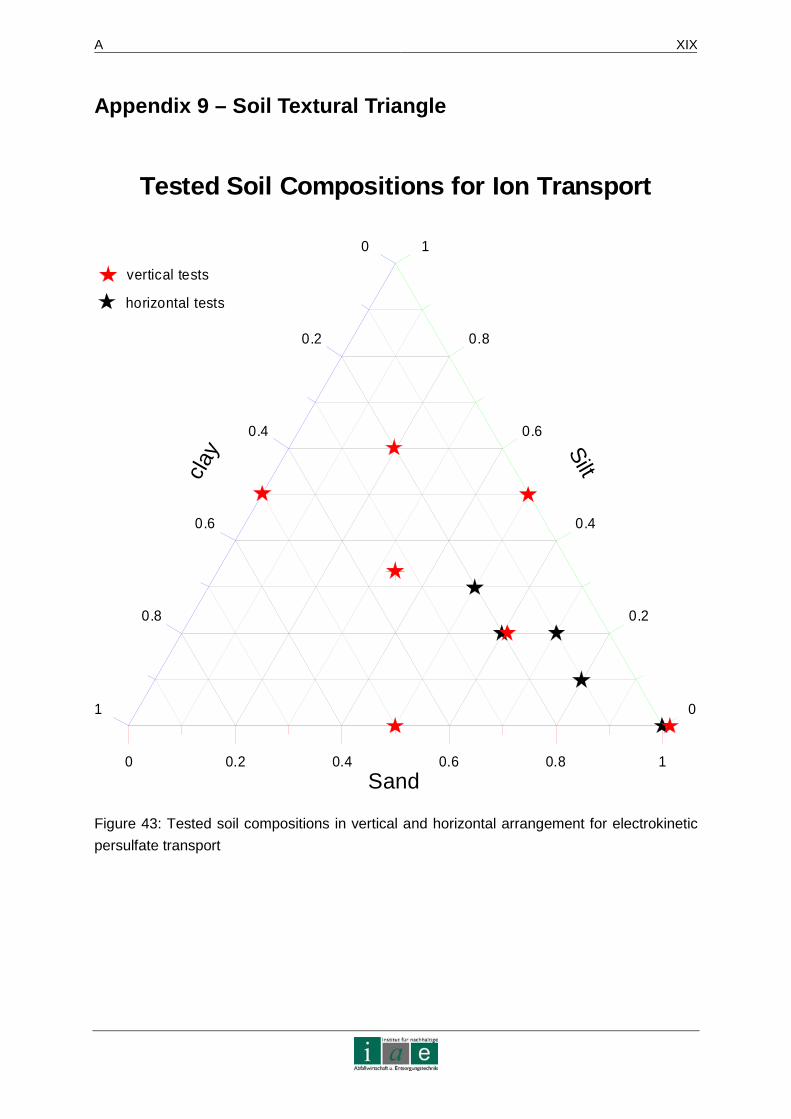
A XIX
Appendix 9 – Soil Textural Triangle
0 0.2 0.4 0.6 0.8 1
Sand
1
0.8
0.6
0.4
0.2
0
Silt
1
0.8
0.6
0.4
0.2
0
clay
Tested Soil Compositions for Ion Transport
vertical tests
horizontal tests
Figure 43: Tested soil compositions in vertical and horizontal arrangement for electrokinetic
persulfate transport
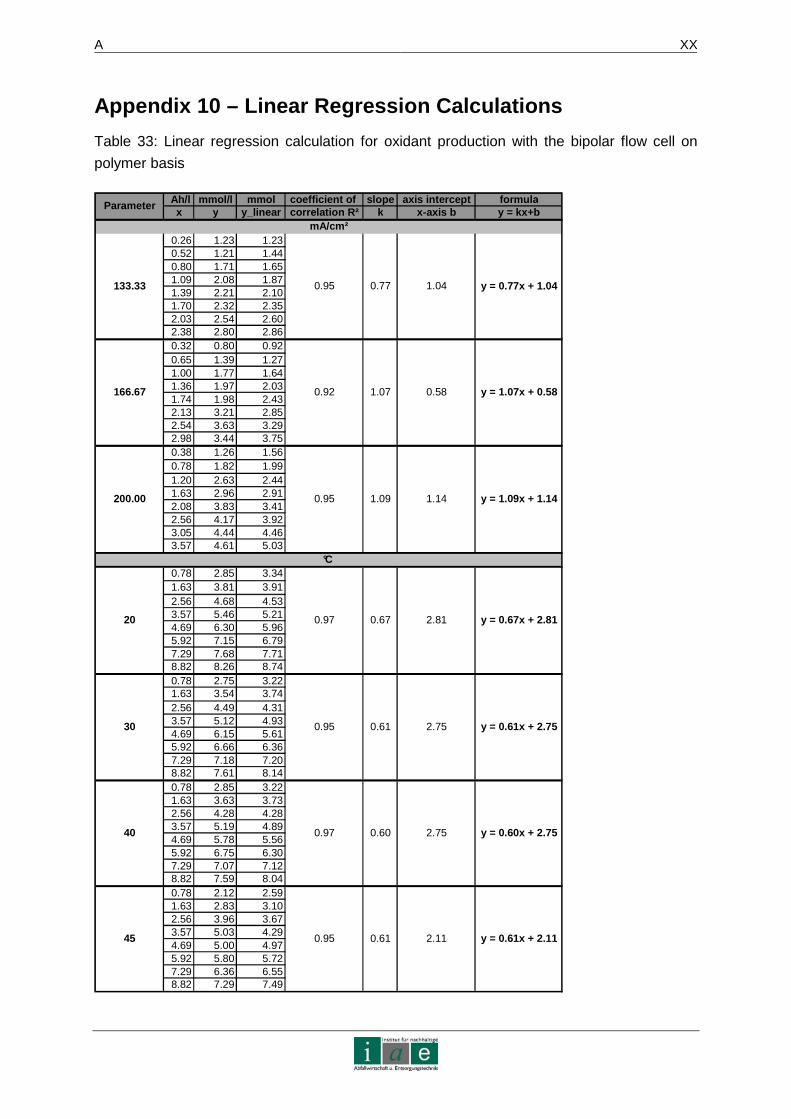
A XX
Appendix 10 – Linear Regression Calculations
Table 33: Linear regression calculation for oxidant production with the bipolar flow cell on
polymer basis
Ah/l mmol/l mmol coefficient of slope axis intercept formulax y y_linear correlation R² k x-axis b y = kx+b
0.26 1.23 1.230.52 1.21 1.440.80 1.71 1.651.09 2.08 1.871.39 2.21 2.101.70 2.32 2.352.03 2.54 2.602.38 2.80 2.860.32 0.80 0.920.65 1.39 1.271.00 1.77 1.641.36 1.97 2.031.74 1.98 2.432.13 3.21 2.852.54 3.63 3.292.98 3.44 3.750.38 1.26 1.560.78 1.82 1.991.20 2.63 2.441.63 2.96 2.912.08 3.83 3.412.56 4.17 3.923.05 4.44 4.463.57 4.61 5.03
0.78 2.85 3.341.63 3.81 3.912.56 4.68 4.533.57 5.46 5.214.69 6.30 5.965.92 7.15 6.797.29 7.68 7.718.82 8.26 8.740.78 2.75 3.221.63 3.54 3.742.56 4.49 4.313.57 5.12 4.934.69 6.15 5.615.92 6.66 6.367.29 7.18 7.208.82 7.61 8.140.78 2.85 3.221.63 3.63 3.732.56 4.28 4.283.57 5.19 4.894.69 5.78 5.565.92 6.75 6.307.29 7.07 7.128.82 7.59 8.040.78 2.12 2.591.63 2.83 3.102.56 3.96 3.673.57 5.03 4.294.69 5.00 4.975.92 5.80 5.727.29 6.36 6.558.82 7.29 7.49
mA/cm²
°C
0.95
0.92
0.95
200.00
166.67
133.33
1.09
1.07
0.77
y = 1.09x + 1.14
y = 1.07x + 0.58
y = 0.77x + 1.04
1.14
0.58
1.04
20 0.97 0.67 2.81 y = 0.67x + 2.81
y = 0.61x + 2.75
40 0.97 0.60 2.75 y = 0.60x + 2.75
30 0.95 0.61 2.75
y = 0.61x + 2.1145 0.95 0.61 2.11
Parameter
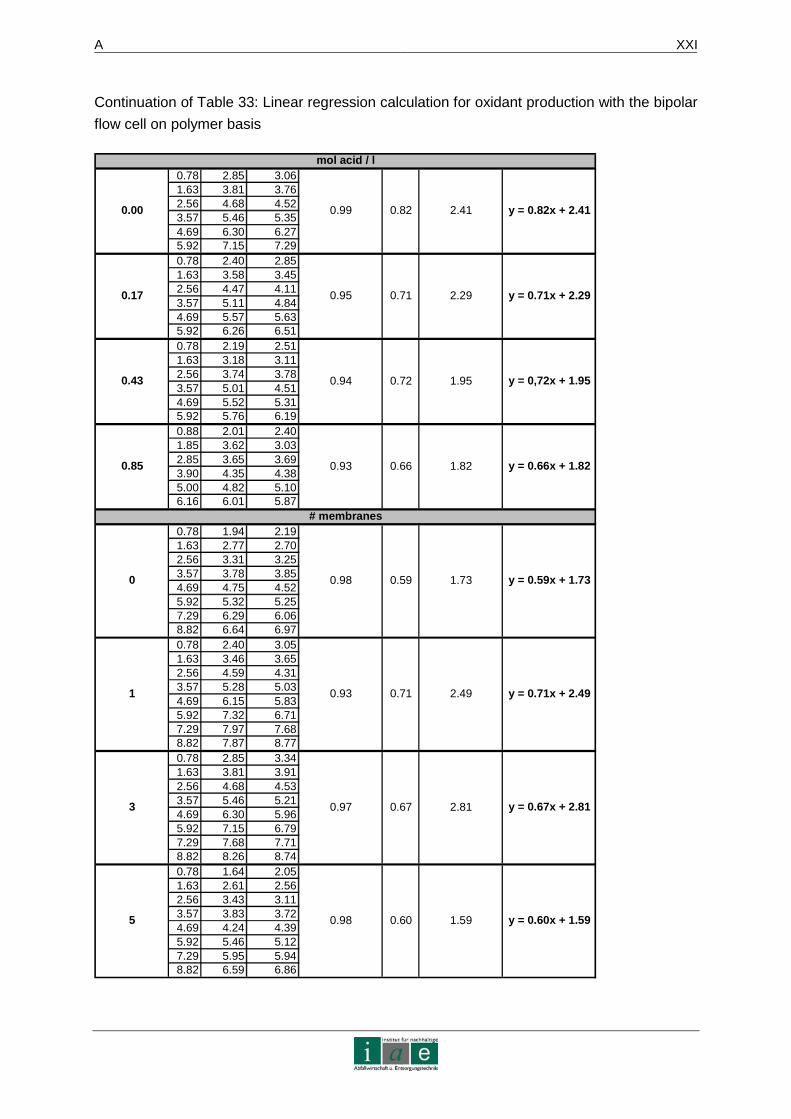
A XXI
Continuation of Table 33: Linear regression calculation for oxidant production with the bipolar
flow cell on polymer basis
0.78 2.85 3.061.63 3.81 3.762.56 4.68 4.523.57 5.46 5.354.69 6.30 6.275.92 7.15 7.290.78 2.40 2.851.63 3.58 3.452.56 4.47 4.113.57 5.11 4.844.69 5.57 5.635.92 6.26 6.510.78 2.19 2.511.63 3.18 3.112.56 3.74 3.783.57 5.01 4.514.69 5.52 5.315.92 5.76 6.190.88 2.01 2.401.85 3.62 3.032.85 3.65 3.693.90 4.35 4.385.00 4.82 5.106.16 6.01 5.87
0.78 1.94 2.191.63 2.77 2.702.56 3.31 3.253.57 3.78 3.854.69 4.75 4.525.92 5.32 5.257.29 6.29 6.068.82 6.64 6.970.78 2.40 3.051.63 3.46 3.652.56 4.59 4.313.57 5.28 5.034.69 6.15 5.835.92 7.32 6.717.29 7.97 7.688.82 7.87 8.770.78 2.85 3.341.63 3.81 3.912.56 4.68 4.533.57 5.46 5.214.69 6.30 5.965.92 7.15 6.797.29 7.68 7.718.82 8.26 8.740.78 1.64 2.051.63 2.61 2.562.56 3.43 3.113.57 3.83 3.724.69 4.24 4.395.92 5.46 5.127.29 5.95 5.948.82 6.59 6.86
y = 0,72x + 1.95
0.85 0.93 0.66 1.82 y = 0.66x + 1.82
0.43 0.94 0.72
y = 0.71x + 2.29
0.00 0.99 0.82
0.17 0.95 0.71 2.29
mol acid / l
2.41
0 0.98 0.59 1.73 y = 0.59x + 1.73
2.81 y = 0.67x + 2.81
1 0.93 0.71 2.49
# membranes
1.95
y = 0.82x + 2.41
y = 0.60x + 1.595 0.98 0.60 1.59
y = 0.71x + 2.49
3 0.97 0.67
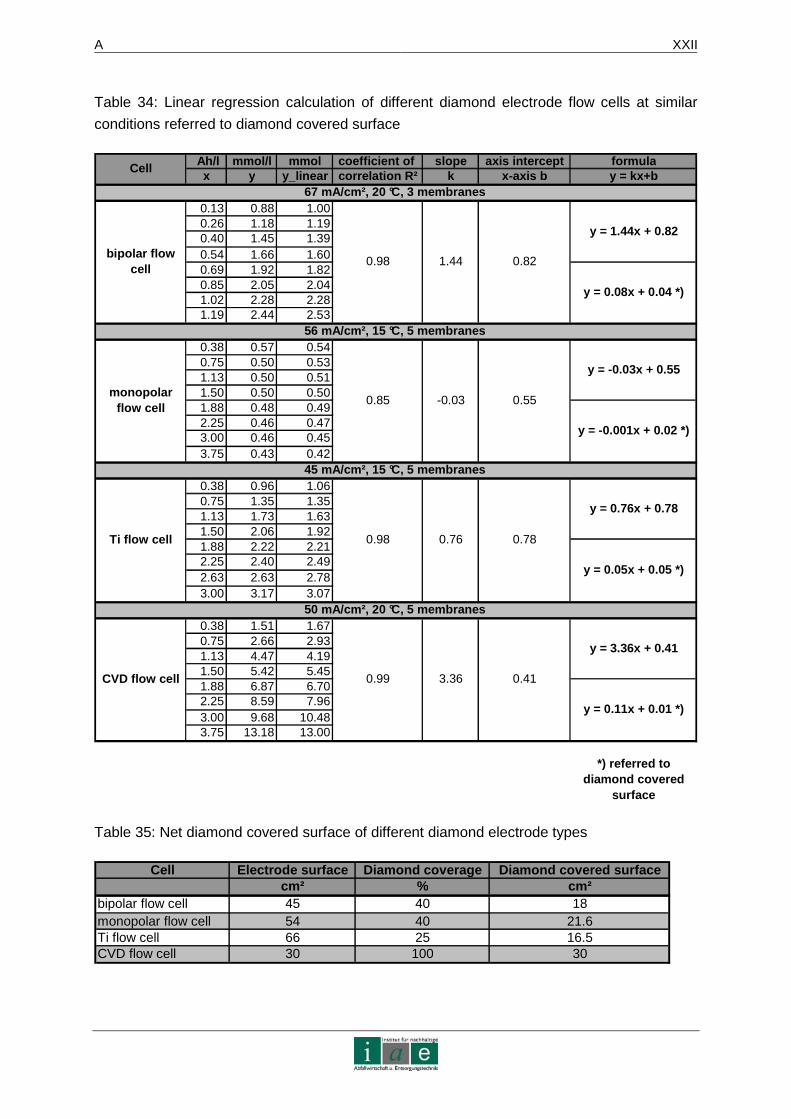
A XXII
Table 34: Linear regression calculation of different diamond electrode flow cells at similar
conditions referred to diamond covered surface
Ah/l mmol/l mmol coefficient of slope axis intercept formulax y y_linear correlation R² k x-axis b y = kx+b
0.13 0.88 1.000.26 1.18 1.190.40 1.45 1.390.54 1.66 1.600.69 1.92 1.820.85 2.05 2.041.02 2.28 2.281.19 2.44 2.53
0.38 0.57 0.540.75 0.50 0.531.13 0.50 0.511.50 0.50 0.501.88 0.48 0.492.25 0.46 0.473.00 0.46 0.453.75 0.43 0.42
0.38 0.96 1.060.75 1.35 1.351.13 1.73 1.631.50 2.06 1.921.88 2.22 2.212.25 2.40 2.492.63 2.63 2.783.00 3.17 3.07
0.38 1.51 1.670.75 2.66 2.931.13 4.47 4.191.50 5.42 5.451.88 6.87 6.702.25 8.59 7.963.00 9.68 10.483.75 13.18 13.00
*) referred to diamond covered
surface
y = 0.05x + 0.05 *)
y = 0.76x + 0.78
y = 0.11x + 0.01 *)
y = 3.36x + 0.41
y = 1.44x + 0.82
y = 0.08x + 0.04 *)
y = -0.001x + 0.02 *)
y = -0.03x + 0.55
monopolar flow cell
0.85 -0.03 0.55
0.76 0.78
Cell
67 mA/cm², 20 °C, 3 membranes
bipolar flow cell
0.98 1.44 0.82
56 mA/cm², 15 °C, 5 membranes
45 mA/cm², 15 °C, 5 membranes
50 mA/cm², 20 °C, 5 membranes
CVD flow cell 0.99 3.36 0.41
Ti flow cell 0.98
Table 35: Net diamond covered surface of different diamond electrode types
Cell Electrode surface Diamond coverage Diamond covered surface cm² % cm²bipolar flow cell 45 40 18monopolar flow cell 54 40 21.6Ti flow cell 66 25 16.5CVD flow cell 30 100 30
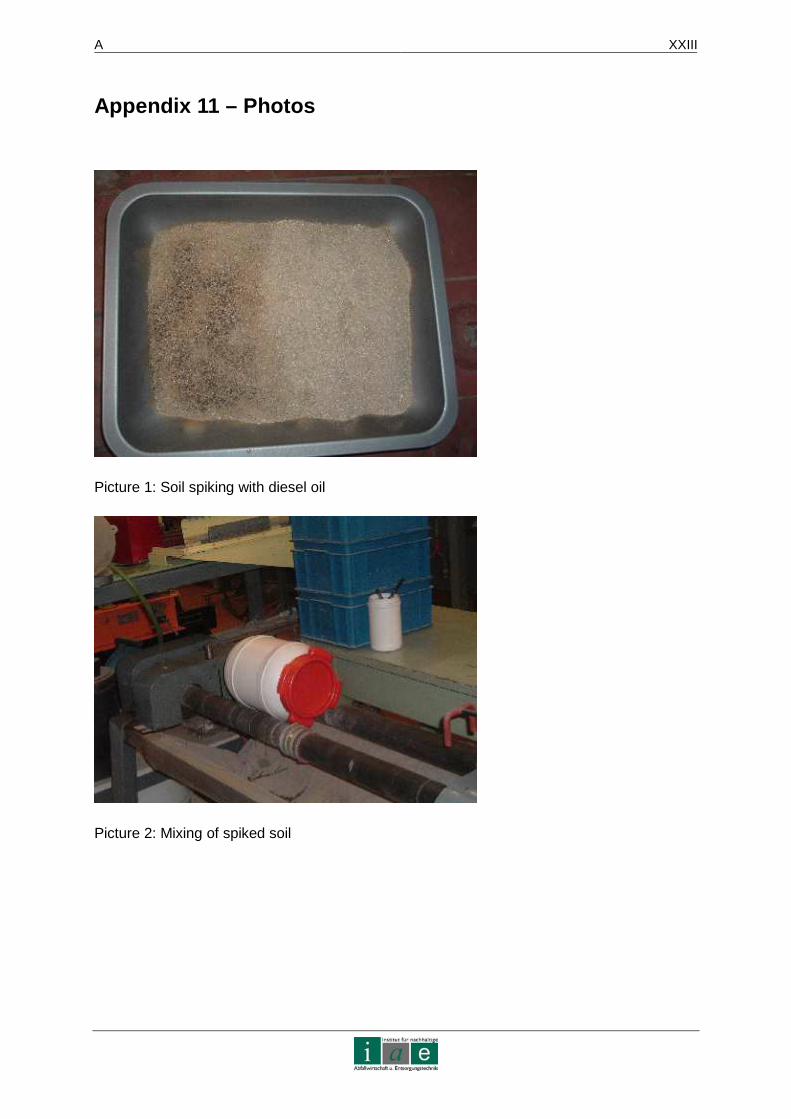
A XXIII
Appendix 11 – Photos
Picture 1: Soil spiking with diesel oil
Picture 2: Mixing of spiked soil
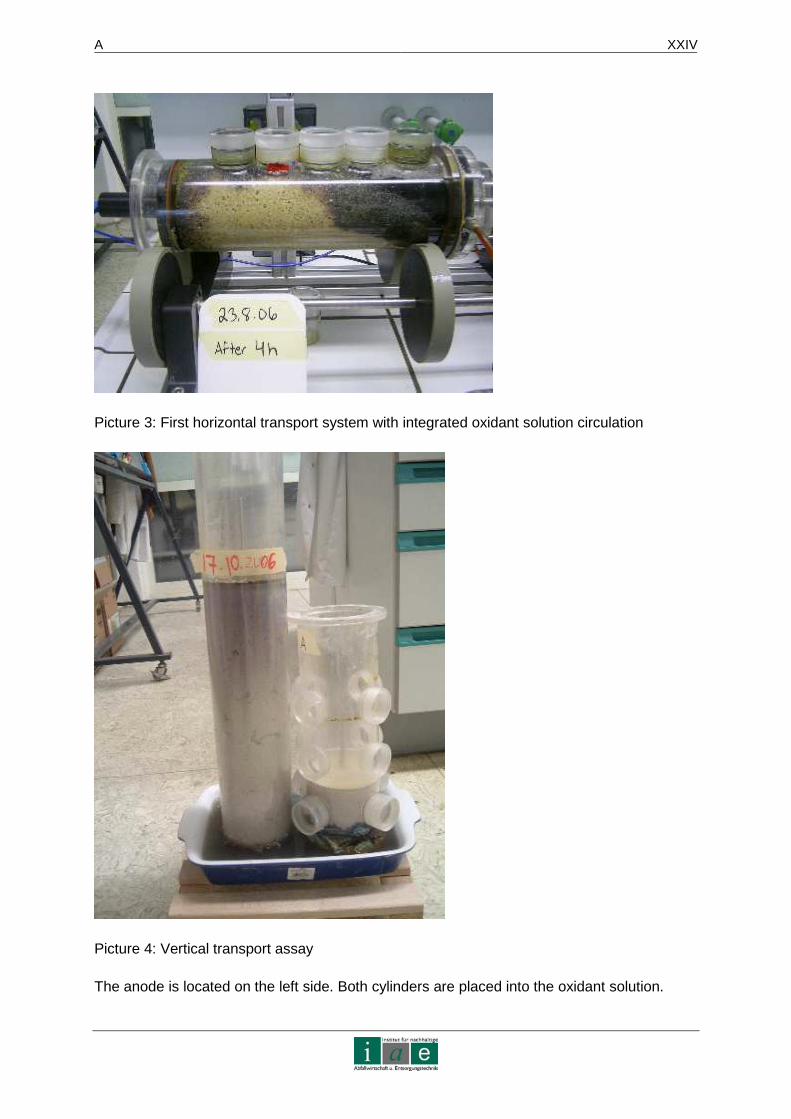
A XXIV
Picture 3: First horizontal transport system with integrated oxidant solution circulation
Picture 4: Vertical transport assay
The anode is located on the left side. Both cylinders are placed into the oxidant solution.
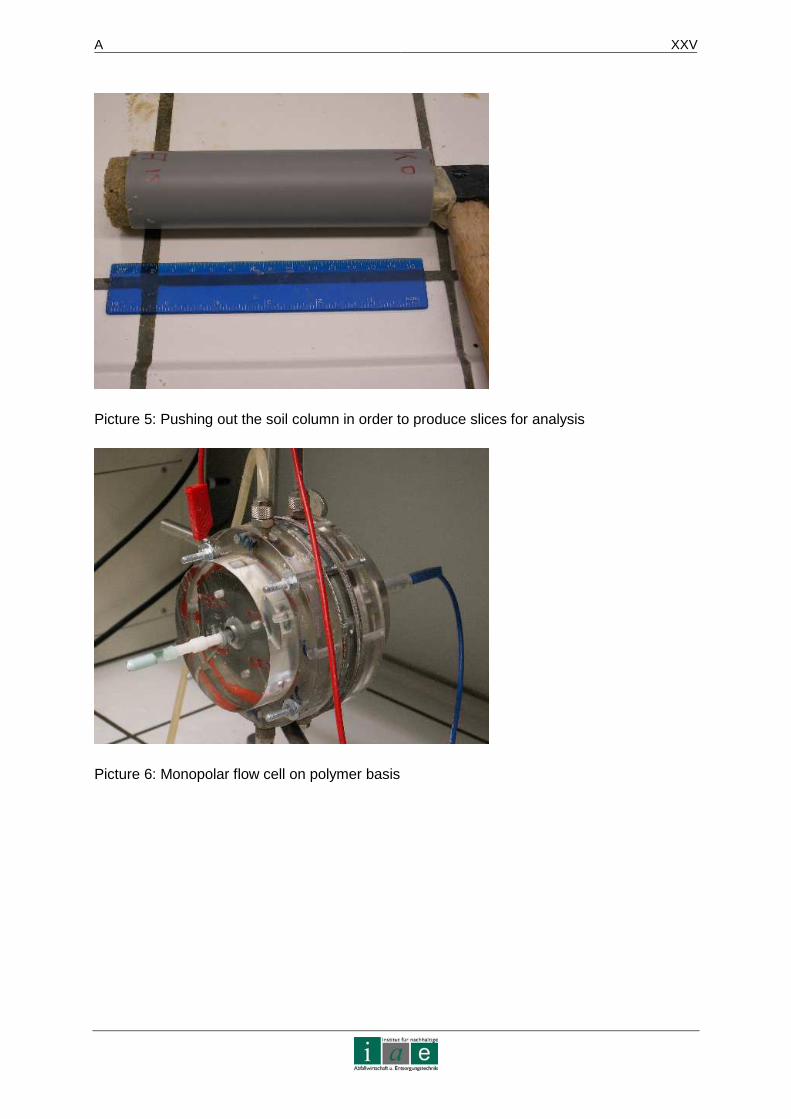
A XXV
Picture 5: Pushing out the soil column in order to produce slices for analysis
Picture 6: Monopolar flow cell on polymer basis
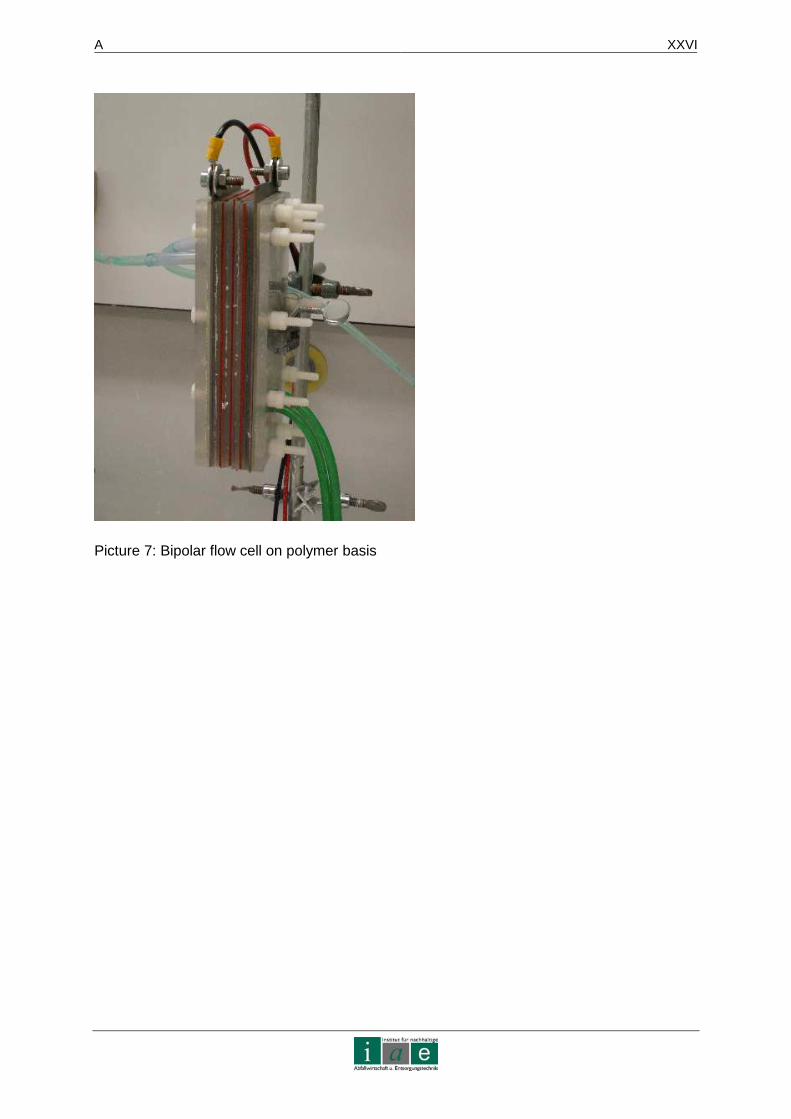
A XXVI
Picture 7: Bipolar flow cell on polymer basis
![Dr. Andreas Thor Sommersemester 2011dbs.uni-leipzig.de/file/CDM_02_Infrastruktur_Service.pdf · Scale-up vs. Scale-out [DGLS99 ff] • Scale-up = vertikale Skalierung – schnellere](https://static.unterlagen.site/doc/80x56/5ec5c0431f5d117cdf2e851b/dr-andreas-thor-sommersemester-scale-up-vs-scale-out-dgls99-ff-a-scale-up.jpg)


