econstor www.econstor.eu Der Open-Access-Publikationsserver der ZBW – Leibniz-Informationszentrum Wirtschaft The Open Access Publication Server of the ZBW – Leibniz Information Centre for Economics Standard-Nutzungsbedingungen: Die Dokumente auf EconStor dürfen zu eigenen wissenschaftlichen Zwecken und zum Privatgebrauch gespeichert und kopiert werden. Sie dürfen die Dokumente nicht für öffentliche oder kommerzielle Zwecke vervielfältigen, öffentlich ausstellen, öffentlich zugänglich machen, vertreiben oder anderweitig nutzen. Sofern die Verfasser die Dokumente unter Open-Content-Lizenzen (insbesondere CC-Lizenzen) zur Verfügung gestellt haben sollten, gelten abweichend von diesen Nutzungsbedingungen die in der dort genannten Lizenz gewährten Nutzungsrechte. Terms of use: Documents in EconStor may be saved and copied for your personal and scholarly purposes. You are not to copy documents for public or commercial purposes, to exhibit the documents publicly, to make them publicly available on the internet, or to distribute or otherwise use the documents in public. If the documents have been made available under an Open Content Licence (especially Creative Commons Licences), you may exercise further usage rights as specified in the indicated licence. zbw Leibniz-Informationszentrum Wirtschaft Leibniz Information Centre for Economics Huang, Yongfu; Quibria, M. G. Working Paper The global partnership for inclusive growth WIDER Working Paper, No. 2013/059 Provided in Cooperation with: United Nations University (UNU), World Institute for Development Economics Research (WIDER) Suggested Citation: Huang, Yongfu; Quibria, M. G. (2013) : The global partnership for inclusive growth, WIDER Working Paper, No. 2013/059, ISBN 978-92-9230-636-6 This Version is available at: http://hdl.handle.net/10419/81052
Transcript
econstor www.econstor.eu
Der Open-Access-Publikationsserver der ZBW – Leibniz-Informationszentrum WirtschaftThe Open Access Publication Server of the ZBW – Leibniz Information Centre for Economics
Standard-Nutzungsbedingungen:
Die Dokumente auf EconStor dürfen zu eigenen wissenschaftlichenZwecken und zum Privatgebrauch gespeichert und kopiert werden.
Sie dürfen die Dokumente nicht für öffentliche oder kommerzielleZwecke vervielfältigen, öffentlich ausstellen, öffentlich zugänglichmachen, vertreiben oder anderweitig nutzen.
Sofern die Verfasser die Dokumente unter Open-Content-Lizenzen(insbesondere CC-Lizenzen) zur Verfügung gestellt haben sollten,gelten abweichend von diesen Nutzungsbedingungen die in der dortgenannten Lizenz gewährten Nutzungsrechte.
Terms of use:
Documents in EconStor may be saved and copied for yourpersonal and scholarly purposes.
You are not to copy documents for public or commercialpurposes, to exhibit the documents publicly, to make thempublicly available on the internet, or to distribute or otherwiseuse the documents in public.
If the documents have been made available under an OpenContent Licence (especially Creative Commons Licences), youmay exercise further usage rights as specified in the indicatedlicence.
zbw Leibniz-Informationszentrum WirtschaftLeibniz Information Centre for Economics
Huang, Yongfu; Quibria, M. G.
Working Paper
The global partnership for inclusive growth
WIDER Working Paper, No. 2013/059
Provided in Cooperation with:United Nations University (UNU), World Institute for DevelopmentEconomics Research (WIDER)
Suggested Citation: Huang, Yongfu; Quibria, M. G. (2013) : The global partnership for inclusivegrowth, WIDER Working Paper, No. 2013/059, ISBN 978-92-9230-636-6
This Version is available at:http://hdl.handle.net/10419/81052
1 UNU-WIDER, Helsinki, email: [email protected]; 2 Department of Economics, Morgan State University, Baltimore, email: [email protected]. This study has been prepared within the UNU-WIDER project ‘ReCom—Research and Communication on Foreign Aid’, directed by Tony Addison and Finn Tarp. UNU-WIDER gratefully acknowledges specific programme contributions from the governments of Denmark (Ministry of Foreign Affairs, Danida) and Sweden (Swedish International Development Cooperation Agency—Sida) for ReCom. UNU-WIDER also gratefully acknowledges core financial support to its work programme from the governments of Denmark, Finland, Sweden, and the United Kingdom. ISSN 1798-7237 ISBN 978-92-9230-636-6
WIDER Working Paper No. 2013/059 The global partnership for inclusive growth Yongfu Huang1 and M. G. Quibria2 May 2013
Abstract
This paper investigates the determinants of inclusive growth with a focus on foreign aid. Based on the Solow growth model, a theoretical model has been developed which shows that foreign aid can stimulate inclusive growth if it is effectively used for augmenting either physical or human productive capacity. Based on UNDP’s (2011) human development index, this research calculates the inequality-adjusted human development index, and uses its growth rate to measure inclusive growth. The empirical section of this paper finds evidence for a significantly positive effect of foreign aid on inclusive growth in the sample countries. It further suggests that foreign aid fosters inclusive growth effectively, particularly when aid is directed to health and education. This research has important implications for an enhanced global partnership in areas such as foreign aid to achieve an inclusive society.
Keywords: inclusive growth, aid effectiveness, post-2015 development agenda, access to water, access to sanitation, primary school enrolment, limited information maximum likelihood JEL classification: O40, I00, F35, F60
The World Institute for Development Economics Research (WIDER) was established by the United Nations University (UNU) as its first research and training centre and started work in Helsinki, Finland in 1985. The Institute undertakes applied research and policy analysis on structural changes affecting the developing and transitional economies, provides a forum for the advocacy of policies leading to robust, equitable and environmentally sustainable growth, and promotes capacity strengthening and training in the field of economic and social policy making. Work is carried out by staff researchers and visiting scholars in Helsinki and through networks of collaborating scholars and institutions around the world.
UNU World Institute for Development Economics Research (UNU-WIDER) Katajanokanlaituri 6 B, 00160 Helsinki, Finland Typescript prepared by Liisa Roponen at UNU-WIDER. The views expressed in this publication are those of the author(s). Publication does not imply endorsement by the Institute or the United Nations University, nor by the programme/project sponsors, of any of the views expressed.
Acknowledgements
We are very grateful to Bart W. Édes, Miguel Niño-Zarazúa, Finn Tarp and Juzhong Zhuang for helpful comments and discussion. The usual disclaimer applies.
Acronyms
DAC Development Assistance Committee (of the OECD) GMM generalized method moments estimation approach
HDI human development index IHDI inequality-adjusted human development index
IV instrumental variable estimation approach LIML limited information maximum likelihood
PEG poverty elasticity of growth
1
1 Introduction
Many developing countries such as China and India have over the past decades experienced rising inequality at the same time as their economies enjoyed fast growth. Serious inequality can erode human potential, impede a society’s normal functions, discourage investment and jeopardize economic development and even trigger political conflict and turmoil (UNDP 2011). Recently, there has been a rising call for a more equitable sharing of benefits to ensure long-term sustainable growth. As encapsulated by the Millennium Declaration, inclusive growth has become a new development paradigm in both the developed and developing world.1
A rapid pace of growth is needed to generate the resources necessary to satisfy the essential needs of human wellbeing: food, health, energy, education and housing, and to address poverty reduction (e.g., Ravallion and Chen 2001; Dollar and Kraay 2002). However, growth itself cannot ensure that all people, especially the poor and the vulnerable, benefit equally from economic progress. If left to market forces, growth can bypass those most vulnerable and the poor, giving rise to an increased gap in income and wealth among people. Social inclusiveness is a must for ensuring sustainable growth, because sustained long-term growth calls for an increasing participation of the labour force in the growth process and an expansion of the sources of growth (Ianchovichina and Lundstrom 2009).
Inclusive growth advocates that growth benefits be shared by people from all walks of life. In other words, regardless of gender, ethnicity and religion, people from all social sectors should be able to contribute to, and benefit from, economic development. From an economic point of view, inclusive growth can contribute to economic development by broadening the base for domestic demand. Politically inclusive growth can lead to a more stable society, essential for long-term advancement. As pointed out by Wilkinson and Pickett (2009), more inclusive societies generally have a better economic and political performance than unequal ones.
An inclusive growth strategy entails a fundamental transformation of the society, and requires considerable resources. Finance and investment are essential for the inclusive institutions that ensure that all people have equal access to job opportunities and social services such as education and health. Despite the growing awareness of the necessity of prioritizing an inclusive growth strategy on the development agenda, many developing countries simply lack sufficient resources and capacity to accommodate this transformation. This highlights the central role foreign aid can play in promoting inclusive growth of aid recipient countries.
After the Second World War, foreign aid’s major objective was to promote economic growth to eliminate poverty and inequality. In recent decades, the purpose of aid has evolved from growth to multiple goals such as the United Nations’ Millennium Development Goals (MDGs) that focus on poverty, literacy, health, women’s right, etc. Accordingly, the allocation of official development assistance (ODA) has shifted from traditional activities
1 Millennium Declaration calls for global policies and measures to ensure that ‘globalization becomes a positive force for all the world’s people’. It focuses on development, poverty eradication, environmental protection, peace, security, disarmament, human rights, good governance and protecting the vulnerable, etc. Its broad vision is encapsulated as inclusive and sustainable development. This paper focuses on inclusive growth while its sister paper (Huang and Quibria 2013) examines sustainable development.
2
that promote economic development and welfare of the developing countries to a more proactive structure that fosters more equitable societies and inclusive growth.
Owing to the adverse impact of the global economic crisis on donor budgets and the subsequent fragile economic recovery, total ODA volumes, after a peak in 2010, fell for the first time in over a decade in 2011. This widened the gap between actual disbursements and the amounts committed in accordance with the United Nations target of 0.7 per cent of gross national income (GNI) of donor countries. But aid flows supporting basic social services increased substantially from an average of 5.6 per cent in 2000–05 to an average of 8.8 per cent of Development Assistance Committee (DAC) sector-allocable ODA in 2006-10.2
Given the constrained supply of foreign aid, aid effectiveness has become a recurring theme in development discourse in recent decades. The international community has taken serious steps to improve aid effectiveness, particularly after the adoption of MDGs in 2000. Major efforts include the 2005 Paris Declaration, 2008 Accra Agenda for Action and 2011 Busan Partnership for Effective Development Cooperation, important platforms for discussing mutual cooperation for achieving the development goals and increasing the effectiveness of aid.3 However, progress in meeting the Paris Declaration principles and targets to stimulate aid effectiveness has been disappointing.4
The recent fiscal austerity and economic challenges have increased pressure on traditional donors to produce tangible results of ODA’s contribution to development outcomes to the sceptics of aid effectiveness, e.g., their governments and taxpayers. So far research specifically on the role of foreign aid in promoting inclusive growth has been lacking, despite the abundance of studies on foreign aid’s effect in reducing poverty and promoting health and education services (e.g. Bourguignon and Sundberg 2007; Virtanen and Ehrenpreis 2007; Alvi and Senbeta 2012).5 This paper attempts to fill this research gap.
This research starts from a theoretical model in which inclusive growth is modelled as a different kind of growth that supports declining inequality, based on the traditional Solow growth approach. With plausible parameter values for the elasticity of substitution in production, foreign aid is likely to have a favourable impact on income distribution and inclusive growth.
The paper continues with an empirical analysis based on annual data for 74 foreign aid recipient countries over the period of 1993-2011. Following UNDP (2011), this research calculates annual data for an inequality-adjusted HDI (IHDI), the growth rate of which is used to measure inclusive growth. This research employs the ‘doubly-filtered’ limited 2 Data are from the OECD/DAC database. Basic social services comprise basic education and health services, population and reproductive programmes, drinking water supply and basic sanitation systems. 3 The 2005 Paris Declaration on Aid Effectiveness adopted five principles to strengthen aid effectiveness and 13 targets to measure their implementation which were to be achieved by 2010. The principles and targets set out in Paris were reconfirmed in Accra in 2008. The Fourth High-level Forum on Aid Effectiveness in Busan in 2011 shifted from the focus from purely aid effectiveness to a more holistic approach that looks at the contribution that effective development cooperation can make to overall development effectiveness, marking a turning point in the international consideration of development cooperation. 4 The final report by OECD (2012) on implementation of the Paris principles and targets shows that only Target 4 in terms of coordinated technical cooperation was met at the global level. 5 See Temple (2010) for a review on aid and social indicators as well as other relevant issues.
3
information maximum likelihood estimation method developed by Akashi and Kunitomo (2010; 2012) to estimate a dynamic panel data model with endogenous regressors for large T and N setting.
This research paper provides evidence that foreign aid exerts both direct and indirect effects on inclusive growth in aid recipient countries. The indirect effect on growth inclusiveness is likely to take place when foreign aid is channelled to improve access to water and sanitations and facilitate primary school education. These results will have important implications for ODA in the post-2015 development agenda and highlight the role of global partnership in promoting an inclusive society that extends beyond aid to structural change, employment growth, etc.
The paper is structured as follows. Section 2 presents a theoretical model; Section 3 reviews the different concepts of inclusive growth and outlines the IHDI calculations. Section 4 introduces the empirical model and Section 5 outlines the estimation methodology. The evidence is discussed in Section 6 and Section 7 concludes the paper.
2 A theoretical model
To explore the link between foreign aid and inclusive growth, we use a simple version of the Solow growth model. The formulation is largely illustrative, and the exposition is heuristic rather formal and definitive. The current formulation is similar to Sachs et al. (2004), with the exception that while Sachs et al. use the AK model, the current formulation posits a modified version of the original Solow formulation. The production function of the Solow-economy is given by the aggregate production function:
(1)
where , , ,Y K L A represent output, capital, labour and total factor productivity respectively. It is further assumed that (.)F is subject to constant returns to scale. Eq. (1) can then be expressed in intensive form:
(2)
where /y Y L= is the output per worker; and / ,k K L= the capital per worker. Finally, it is further assumed that ( )f k is smooth and twice-differentiable with the following properties:
( ) 0; ( ) 0,f k f k′ ′′f p which implies that there are diminishing returns to output per worker. It is also assumed that the so-called Inada-conditions hold: (0) ;f ′ = ∞ and ( ) 0.f ′ ∞ =
The capital accumulation equation is given by:
( ) ( ) ( )k k Asf k n d kφ= ≡ − +&
(3)
where /k dk dt≡& = time derivative of capital per worker. It is assumed that proportion s of net output is saved and invested. The first term on the right-hand side, ( ),sf k represents gross investment; the second term, ,d n+ is the sum of the depreciation rate ( )d and the labour force growth rate ( )n .
( , )Y AF K L=
( )y Af k=
4
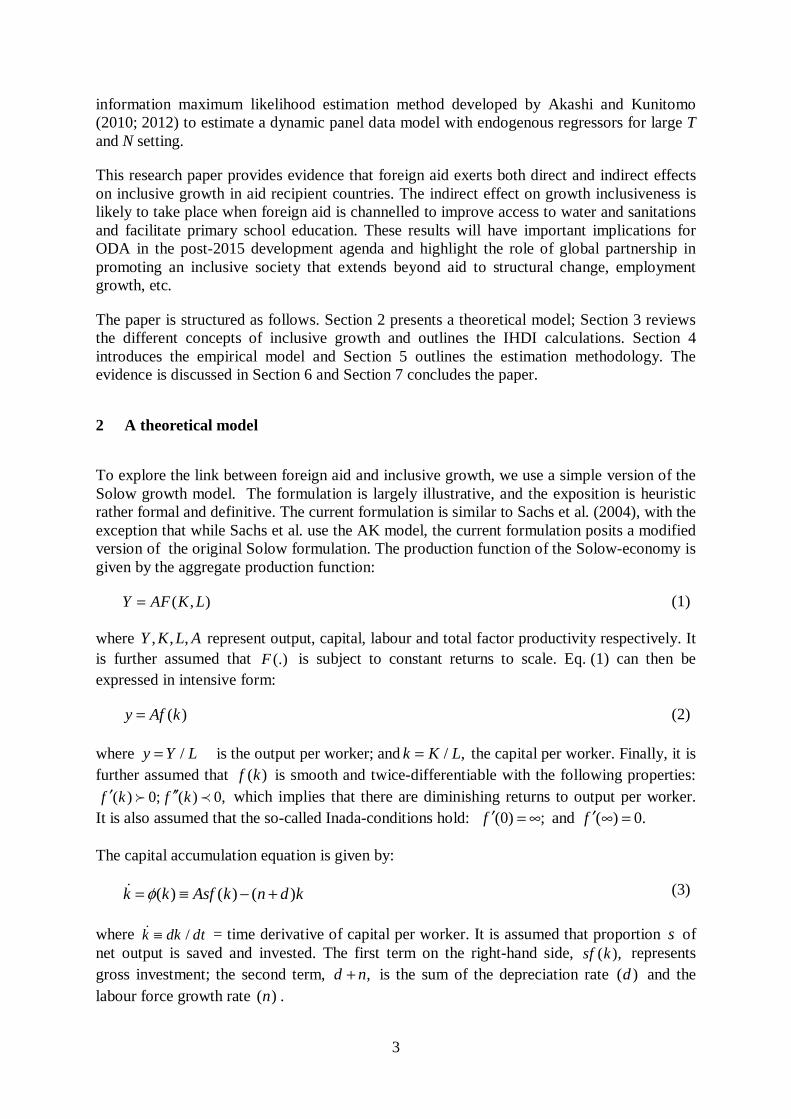
Sachs et al. (2004), observing that the actual behaviour of a poor economy deviates from the standard Solow model, argue that poor economies suffer from various types of poverty traps. The following highlights three types of poverty traps:
Figure 1: Poverty traps
Source: Authors’ own work.
The low-productivity trap
In the standard Solow model, the marginal productivity of capital is very high (infinity) when k is very low. However, in poor countries, marginal productivity of capital tends to be low when k is low because production processes require a minimum threshold amount of capital. This threshold can be in the form of basic infrastructure and/or human capital. In other words, assume that there is a threshold *k so that for *k k∀ ≤ ( ) 0.k sAf nkφ ≡ − ≤ That is, for
( *, )k k∈ ∞ , ( )f k follows the standard neoclassical production properties with 0f ′f and0f ′′p ; moreover, there is a **k so that ( **) ( **) ( ) **k Asf k n d kφ ≡ − + . The above trap is
depicted in Figure 1.
The savings trap
The savings function is less likely to be positively proportional at all income levels, as assumed in the standard model. It has been argued that with a very low level of k , the savings rate is likely to be zero, or even negative, because the poor may need to use all their income for survival. To formalize this, let us assume that there is a * 0k f so that for
*k k∀ ≤ , ( ) ( ) ( ) 0k sAf k d nφ ≡ − + ≤ . After *k k≥ , the savings rate becomes positive and proportional. With that assumption, there is **k so that
( **) ( **) ( ) ** 0k Asf k n d kφ ≡ − + = . It is obvious that the phase diagram will have the same shape and properties as in Figure 1.
Positive
Negative
k
**k *k
φ
0
5
The Malthusian trap
Finally, there is a strong correlation between low per capita income and high fertility rate. This demographic trap may lead to a situation where n is very high at low k . To formalize, let us assume that for *k k∀ ≤ , n is high and ( ) ( ) ( ) 0k sAf k d nφ ≡ − + ≤ . When *k kf , n becomes low and constant. Other things remaining the same, then there is **k so that
( **) ( **) ( ) ** 0k Asf k n d kφ ≡ − + = . It is again obvious that the phase diagram will have the same shape and properties as in Figure 1.
To sum up: All the three cases above point to the existence of multiple equilibria in poor countries. There is a level of foreign aid 0z f which can help a poor economy to go over the threshold level of capital stock *k and help settle the economy to good equilibrium.
Even when the economy is not mired in a poverty trap, a given amount of foreign aid that adds to the investment and the existing capital stock can lead to an increase in the long-run steady-state per capita income. Similarly, a given amount of foreign aid targeted to the social sectors can enhance the productivity of labour and lead to an increase in the long-run steady-state income.
Next, we discuss briefly the possible impact of foreign aid on inclusive growth. Inclusive growth, as discussions in the next section will indicate, has been diversely defined as growth with declining inequality or improving social opportunities. Following this lead in the literature, we posit the indicator of inclusive growth by:
(4)
where y is per capita income and μ is an income distribution parameter. For our case, let us define relative factor shares:
(5)
Eq. (4) can be rewritten in terms of proportionate change by:
ˆ ˆ ˆI y μ= +
Note that ˆy A π= ≡ is the total factor-productivity growth. By taking log on both sides, Eq. (5) can be rewritten as:
(6)
Differentiating both sides with respect to k , we can find:
/ ln ln( / ) / ln 1din d k d w r d kμ = −
= 1 1( 1) ( )σσ σ
−− =
where ln
ln( / )d k
d w rσ ≡ is the elasticity of substitution in production.
I yμ=
/w rkμ ≡
ln ln( / ) lnw r kμ = −
6
As Eq. (6) suggests, as aid z increases, it will affect k which, in turn, will affect both per capita income (y) and income distribution ( μ ). While aid z will affect y positively, the impact on income distribution μ is ambiguous and will depend on the elasticity of substitution in productionσ . Now Eq. (6) can be re-written as:
1ˆ ( )I σπσ−= +
(7)
As the above equation suggests, foreign aid will have a positive impact on inclusive growth, namely growth with equity, for reasonable values of the elasticity of substitution of the aggregate production function. When the production function exhibits high degrees of elasticity in substitution, there may be replacement of labour by capital, leading to an adverse distribution of labour income. For realistic values of the parameter [0,1]σ ∈ , the distribution impact is favourable. Even when elasticity exceeds unity, the distributional impact will continue to be favourable as long as the technological progress is neutral and robust. This would suggest that foreign aid can be a potent instrument for inclusive growth if aid is effectively used for augmenting productive physical or human capacity.
In keeping with the above definition of inclusive growth, the empirical section of the paper uses the growth rate of the human development index adjusted for inequality in the distribution of each dimension across the population.
3 Measurement of inclusive growth
At present there is no internationally-agreed concept of inclusive growth. Although a number of conceptual frameworks have recently been proposed by researchers at the Asian Development Bank (ADB), World Bank, European Commission and UNDP, these concepts have not led to a simple set of indicators.
Ali and Son (2007), using a social opportunity function, which is akin to a social welfare function, argue that growth is inclusive if it enhances the social opportunity function. More specifically, these authors examine the extent to which social opportunities such as access to health and education are aligned along the income distribution and whether improvements are pro-poor. But as pro-poor improvements in health or education can occur with or without income growth, the concept of these researchers is more concerned with the non-income dimension of wellbeing.
According to Klasen (2010), a measure of growth inclusiveness must include both income and non-income dimensions of wellbeing such as access to education and health. Klasen (2010) defines inclusive growth as non-discriminatory and disadvantage-reducing. More specifically, growth is regarded inclusive if it allows all members of society, especially the poor and disadvantaged, to participate in and contribute to the growth process, and if it promotes an inequality decline in the non-income dimension of wellbeing, including education, health, nutrition and social integration. This concept, however, would require a very broad set of indicators, many of which are not available, especially for the developing countries. ADB (2012) has proposed a framework of inclusive growth indicators made up of a set of 35 markers; the question now is how to weigh and aggregate these indicators.
7
Ianchovichina and Gable (2012) propose that for growth to be sustainable in the long run, it needs to be inclusive of the majority of the labour force, be broad-based across sectors, and allow people to benefit from the economic growth to which they have contributed. By reconciling economic growth and equality into one single concern, inclusive growth endeavours to achieve development of the society while assuring equal opportunity for all populations to basic service provision, timely social protection such as effective social security nets, as well as equal access to credit markets. Inclusive growth focuses on both the pace and pattern of growth with a longer-term perspective. This definition of inclusive growth links the macro and micro determinants of growth and captures the importance of structural transformation for economic diversification and competition. The major instrument for inclusive growth is productive employment, and government policies that encourage the creation of productive employment and strengthen the productive resources and capacity of individuals are especially needed.
Similarly, European Commission (2010) articulates in its Europe 2020 Strategy that inclusive growth is based on a high-employment economy and the assurance that all social groups not only participate in the growth process but also enjoy its benefits. Inclusive growth should promote a high-employment economy that delivers social inclusion and economic, social and territorial cohesion. This concept, however, does not lend itself to an easy construction of measurement.
Inclusive growth, as defined by the UNDP International Policy Centre for Inclusive Growth (IPC-IG), is: 6
ensuring that everyone can participate in the growth process, and making sure that everyone shares equitably the benefits of growth. This concept of inclusive growth encompasses an outcome and a process, participation and benefit-sharing in development, income and non-income dimensions. Participation without benefit-sharing will make growth unjust and benefit-sharing without participation will make it a welfare outcome.
Following UNDP’s Technical Note 2 (2011), this paper calculates the inequality-adjusted human development index (IHDI).7 By adjusting HDI for inequality in the distribution of each dimension across the population, the IHDI is computed as a geometric mean of three dimension indices adjusted for inequality.
where LifeI , EducationI and IncomeI are life expectancy index, education index and income index, respectively. LifeA , EducationA and IncomeA are the Atkinson inequality measures for life expectancy, education and income, respectively.
The IHDI can be calculated as follows: 6 Available at: www.ipc-undp.org/pages/newsite/menu/inclusive/whatisinclusivegrowth.jsp?active=1. 7 UNDP (2011) calculates IHDI for year 2011 only.
8
HDIAAAIHDI IncomeEducationLife .)1()1()1(3 −×−×−=
(10)
The Atkinson inequality measure, xA , is obtained using the following equation:
X
XXXAn
nx
..1 21−= (11)
where }..,{ 21 nXXX denotes the underlying distribution in any of the three dimensions of interest. X is the arithmetic mean of the distribution. xA is obtained for three variables: life expectancy, total expected years of primary and secondary schooling and GNI per capita.8
Annual data on HDI for the period 1980-2011 are provided by the UNDP Human Development Report. Data for life expectancy at birth (total years), duration of primary and secondary education (years), and GNI per capita (PPP, current international $) are from taken the World Development Indicators (WDI) Database (World Bank 2012).
The inclusive growth, itINCGR , is defined as the growth rate of itIHDI , as follows:9
itittiit IHDIIHDIIHDIINCGR /)(*100 1, −= + (12)
4 An empirical model
Section 2 models inclusive growth as a function of employment, capital and capital price. Following the theoretical framework, this section makes use of an extended empirical model in which inclusive growth rate, itINCGR , is a function of its lag ( 1, −tiINCGR ), foreign aid indicator ( itAID ), transmission channels ( itCHANNEL ), and a number of control variables of ‘beyond aid’ ( itBEYONDAID ) for country i (i=1,2,…74) at time period t (t=1,2,…19) in this context, as follows:
19,...2,1;74,...2,15
4321,1
==+
+×++++= −
tiBEYONDAID
CHANNELAIDCHANNELAIDINCGRINCGR
itit
itititittiiit
θαααααη
(13)
iη is the unobservable time-invariant fixed effects. Inclusion of the lagged value of the dependent variable on the right-hand side of the equation captures the persistence of inclusive growth process. Its coefficient is assumed to fall within the unit circle, that is, 11 <α . itθ is the error term. Independent variables ( itAID , itCHANNEL , itBEYONDAID ) are assumed to be
8 UNDP (2011) calculates xA
for mean years of schooling of adults. Since data for this indicator are only
available for the years 1980, 1990, 2000, 2005-09 and 2011, this research paper calculates xA for the total expected years of primary and secondary schooling instead. 9 Data on inclusive growth used in this paper are downloadable from www.yongfu-huang.net/research.html.
9
endogenous with respect to the error itθ , due to possible measurement error and/or simultaneity.
The key independent variable is foreign aid, denoted by AID. Foreign aid is the international transfers of capital, goods, or services from a country or international organization for the benefit of the recipient country or its population. Such aid can be humanitarian or developmental, official or private or non-governmental, and bilateral or multilateral. Development aid was defined by DAC/OECD in 1969 as the ‘flows of official financing administered with the promotion of the economic development and welfare of developing countries as the main objective and which are concessional in character with a grant element of at least 25 per cent’ (OECD n.d.). Development aid usually consists of official development assistance (ODA), official assistance and private voluntary assistance. ODA, accounting for the majority of total development aid, refers to grants or loans to countries and territories on the DAC list of recipients (developing countries) and to multilateral agencies that meet certain conditions.
This research considers two indicators: the ratio of net aid transfers to GDP, denoted by NAT, and the ratio of net ODA receipts to GDP, denoted by ODA. Data on net aid transfers and net ODA are from Roodman (2006).10 Data for total GDP by PPP (constant 2005 international US$) are extracted from the WDI Database (World Bank 2012).
Literature has suggested to date a number of important determinants for inclusive growth. According to Ianchovichina and Gable (2012), employment growth can open up new opportunities for productive employment on the labour demand side and increased incomes for the employed, contributing to inclusive growth. According to Habito (2009), sectoral structure of the economy and quality of governance are important for inclusive growth measured by the poverty elasticity of growth (PEG). Sectoral structure impacts on growth inclusiveness, with agricultural and industrial development being more important than other sectors in eliminating poverty. Among the six world governance indicators, political stability and control of violence, government effectiveness, and rule of law as well as the overall quality of governance (the average of all the governance indicators)––all exert an important impact on the PEG, with political stability and control of violence having the strongest explanatory effect.
Following the literature, this analysis considers the following control variables, which are relevant for inclusive growth: the growth rate of employment (EMGR), sectoral structure, and governance. Sectoral structure (VADD) is measured by the first principal component of value added of services, agriculture and industry. The governance indicator (WGI) is the overall governance quality, measured as the average of all governance indicators.
In addition, this analysis controls for financial depth (M2) and urbanization (URBAN). Financial depth gauges the size of financial intermediaries relative to the economy, and measures the extent to which financial intermediaries channel savings into investment, monitor firms, influence corporate governance and undertake risk management. Higher levels of financial depth imply more equal access to financial services. Urban areas offer important opportunities for economic growth, innovation, and employment. They are also places of 10 Net ODA is a capital flow concept while NAT is a net transfer concept. NAT is the net ODA minus old non-aid loan cancellations and interest payments received from developing countries on outstanding concessional loans. A multiplication factor of 1,000,000 is applied on data for net ODA and NAT.
10
modern-day life. Despite high urban poverty in many cities, urban residents, on average, enjoy better access to education and healthcare, as well as other basic public services such as electricity, water, and sanitation. Urbanization is an important process for the eradication of poverty and inequality.
Data for the ratio employment to population (per cent total, 15+) plus data for the value added of services, of agriculture, of industry (as per cent GDP), money and quasi money (M2) (per of GDP), and urban population (per cent of total) are from the WDI Database (World Bank 2012).
The World Governance Indicators are taken from Kaufmann, Kraay and Mastruzzi (2011), which are widely-used indicators of the quality of a given government in a broader sense. There are six measures of the governance quality: voice and accountability, political stability and absence of violence, government effectiveness, regulatory quality, rule of law, and control of corruption.
Three potential channels are investigated, namely ‘access to water’ (WATER), ‘access to sanitation’ (SANIT), and ‘primary school enrolment’ (PSCHOOL). WATER and SANIT are measured by improvements to water sources and improved sanitation facilities, respectively, both as per cent of population with access. PSCHOOL is measured by the total primary school enrolment (per cent net). Data for these indicators are taken from the WDI Database (World Bank 2012).
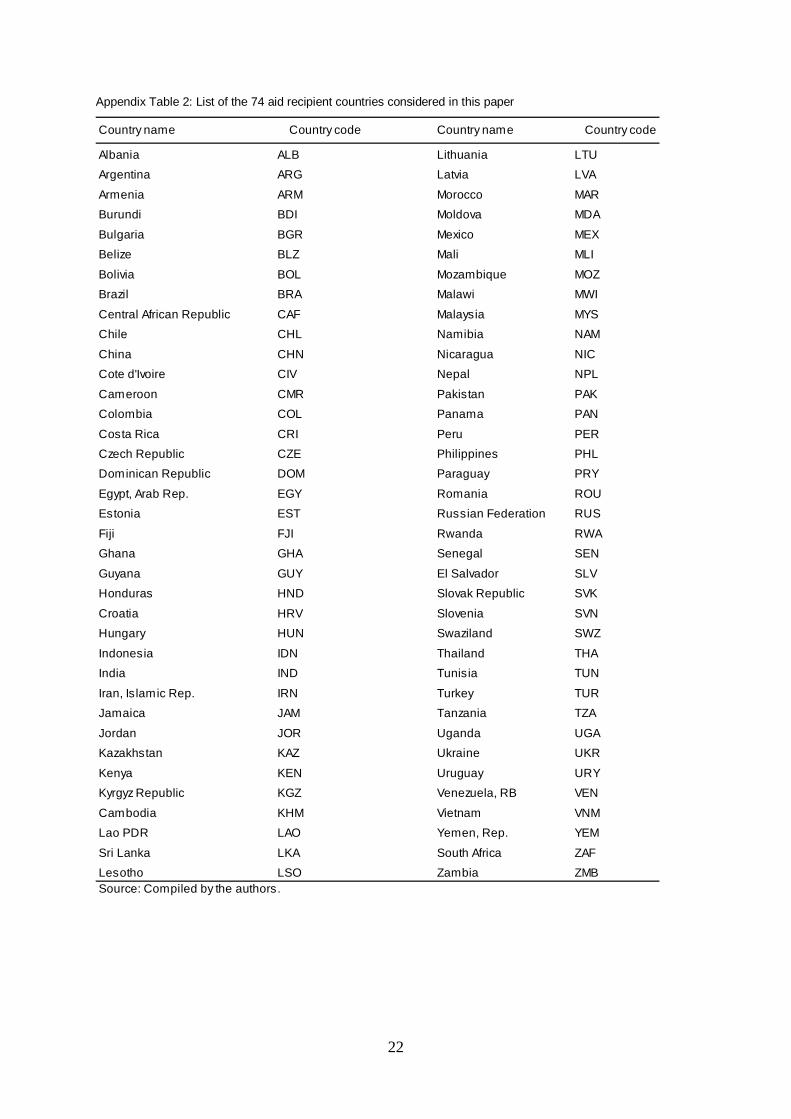
The entire sample includes 74 countries over 1993-2011, as listed in the Appendix Table 2. We exclude countries with less than 12 annual observations for INCGR, ODA_GDP, EMGR, VADD or M2, or less than 2 observations for WATER, SANIT or PSCHOOL. In the regression, we use )100/var1ln( iable+ for INCGR, NAT, ODA and EMGR. We use
)ln(variable for the three value added variables (before conducting the principal component analysis), three transmission channels, M2 and URBAN.11 Variable definitions and sources are given in the Appendix Table 1.
5 Methodology
The section outlines the ‘doubly-filtered’ limited information maximum likelihood (LIML) estimation method developed by Akashi and Kunitomo (2010, 2012) for a dynamic panel data model with endogenous regressors and individual effects when T and N are large.
To estimate the above dynamic panel data model with fixed effects and endogenous regressors, we rewrite the above model as follows:
TtNixyy itiittiit
,..,2,1;,..2,1
'1,
==+++= − θηβα
(14)
11 Missing data for WATER and SANIT are predicted by using linear approximations based on urban population (per cent of total). Missing data for PSCHOOL are predicted on the basis of education expenditure (per cent of GNI) from WDI. Missing data for M2 and WGI are predicted based on GDP per capita from WDI.
11
where ity is itINCGR , itx is a vector of endogenous regressors ( itAID , itCHANNEL ,
itBEYONDAID ). We assume that 0)( ≠ititxE θ for all i and t.
For a dynamic panel data model, the existence of endogenous regressors as well as the lagged dependent variable makes OLS estimates inconsistent. Instrumental variable (IV) or generalized method moments (GMM) approaches can address the issue of endogeneity by removing unobserved fixed effects using first-differencing or orthogonal deviations, and then estimating the parameters of the model using lagged values of the dependent variable and independent variables dated at t-2 or from t-2 and earlier as suitable instruments for the differenced values of original regressors (for example, Arellano and Bond 1991; Blundell and Bond 1998).
However, GMM approaches are typically effective for a panel data setting with fixed T and large N. Moreover, when data are highly persistent, lagged differenced values of the dependent variable and independent variables are typically recognized as ‘weak’ instruments. The efficiency gains from GMM vanish as T becomes larger.
Akashi and Kunitomo (2012) have recently proposed a ‘forward-filtered’ limited information maximum likelihood (LIML) estimator while Akashi and Kunitomo (2010) have recently proposed a ‘doubly-filtered’ LIML estimator for a dynamic panel data model with endogenous regressors and individual effects when T and N are large.12
Basically, Akashi and Kunitomo (2010, 2012) apply the forward orthogonal deviations operator, TF , to both sides of the equation to remove individual effects. Following Alvarez and Arellano (2003), TF is a TT ×− )1( upper triangular matrix so that TTT IFF =' ,
TIQFF TTTTTT
'' ιι−== and ')1,..,1,1(=ι . TF is defined by:
⎥⎥⎥⎥⎥⎥⎥⎥⎥⎥⎥
⎦
⎤
⎢⎢⎢⎢⎢⎢⎢⎢⎢⎢⎢
⎣
⎡
−
−−
−−
−−
−−
−−
−−
−−
−−
−−
−−
⎥⎦
⎤⎢⎣
⎡ −=
110...00021
211...000
.........
.........
.........2
12
12
1...2
1101
11
11
1...1
11
11
21,...,1
TTTT
TTTTT
TTdiagFT
(15)
By pre-multiplying TF , the above equation can be rewritten as:
1,..,2,1;,..2,1
*'**1,
*
−==
++= −
TtNi
xyyiiii θβα
(16)
12 Despite its name, the LIML estimator does not correspond to any meaningful maximum likelihood estimator, but a LIML analogue estimator with an instrumental variable interpretation (Arellano 2003).
12
where ⎥⎦⎤
⎢⎣⎡
−++−= +
)()...( 1,*
tTyyycy iTti
ittit and )1()(2
+−−= tT
tTct .13 *itx and *
itθ are
defined in the same manner. In terms of instruments, following Hayakawa (2009), Akashi and Kunitomo (2010) suggest using the one-period-lagged and backward-filtered regressors as instruments for the forward-filtered variables to account for simultaneity bias. More specifically, by multiplying the backward orthogonal deviation operator by ),( 1, itti xy − , we have the following backward-filtered regressors as instruments:14
1,...,2
1
)1()...(
)1()...(
2
11,**
12,1,
**1,
−=
−=
⎥⎦⎤
⎢⎣⎡
−++−=
⎥⎦⎤
⎢⎣⎡
−++−=
−
−−−
Ttt
tb
txxxbx
tyyyby
t
itiittit
itititti
(17)
⎥⎥⎥⎥⎥⎥⎥⎥⎥⎥⎥
⎦
⎤
⎢⎢⎢⎢⎢⎢⎢⎢⎢⎢⎢
⎣
⎡
−−
−−
−−
−−
−−
−−
−−
−−
−−
−−−
⎥⎦
⎤⎢⎣
⎡ −=
11
11
1...1
11
11
1
012
1...2
12
12
1...........................
000...121
21
000...011
1,...,21
TTTTT
TTTT
TTdiagBT
(18)
Then the moment condition based on these instruments can be written as:
1,...,3
0)( ***
1
**2
−=
=⎟⎟⎠
⎞⎜⎜⎝
⎛
−
−
Ttxy
E itit
it θ
(19)
The doubly-filtered estimator has been shown to outperform standard GMM estimators in large T, small N settings. Backward orthogonal deviation transformation removes individual effects from instrument variables.
13 For each variable, the mean of remaining future observations is subtracted from the current value of the first T-1 observations. 14 For each variable, backward orthogonal deviation subtracts the mean of past values from its current value. The backward orthogonal deviation operator is a TT ×− )1( lower triangular matrix.
13
6 Evidence
6.1 Stylized facts
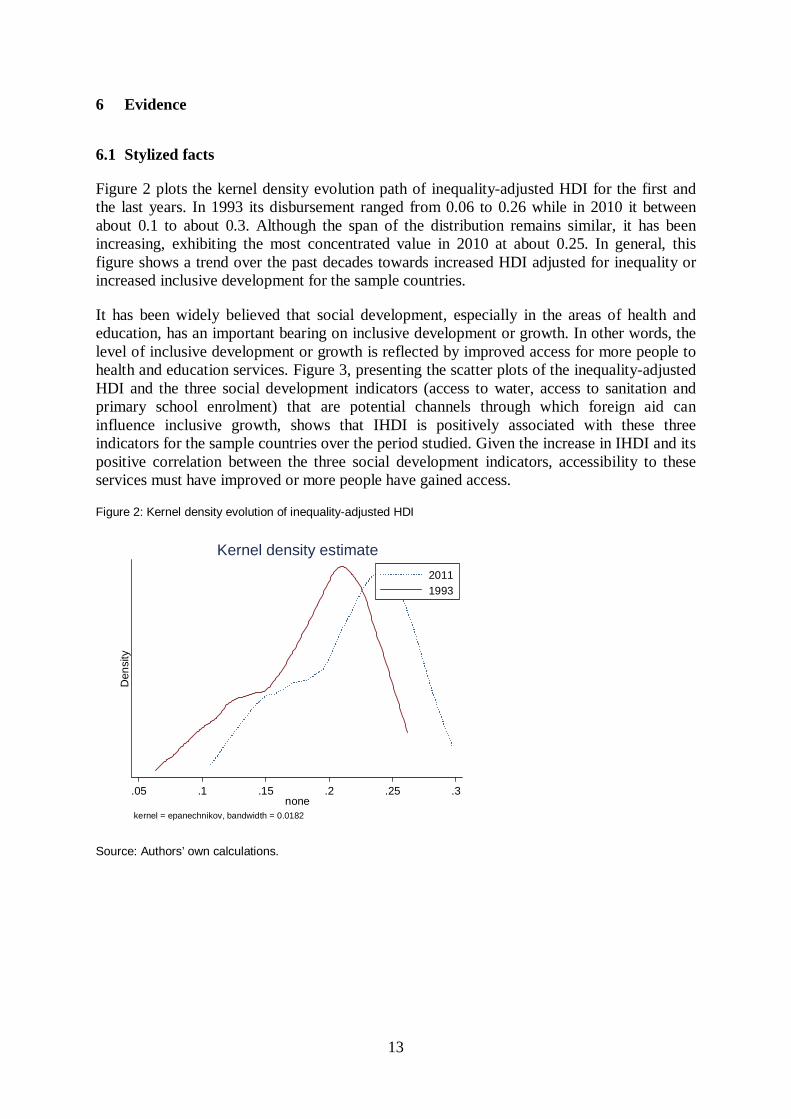
Figure 2 plots the kernel density evolution path of inequality-adjusted HDI for the first and the last years. In 1993 its disbursement ranged from 0.06 to 0.26 while in 2010 it between about 0.1 to about 0.3. Although the span of the distribution remains similar, it has been increasing, exhibiting the most concentrated value in 2010 at about 0.25. In general, this figure shows a trend over the past decades towards increased HDI adjusted for inequality or increased inclusive development for the sample countries.
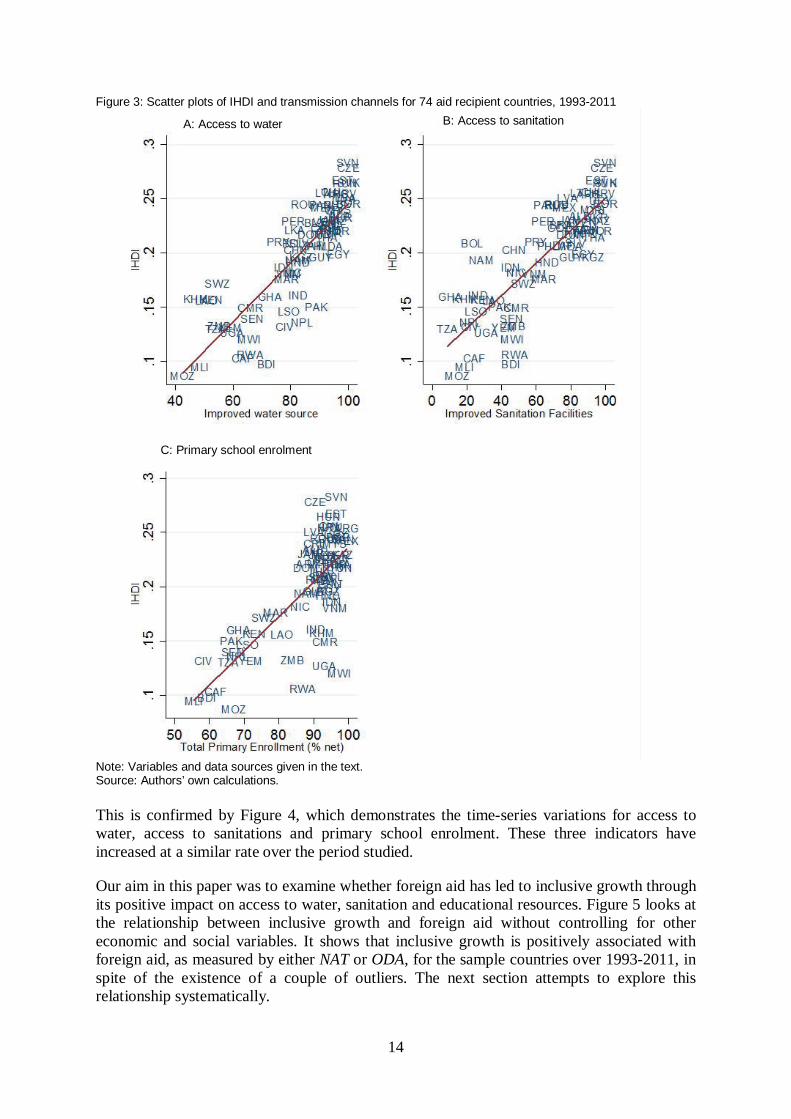
It has been widely believed that social development, especially in the areas of health and education, has an important bearing on inclusive development or growth. In other words, the level of inclusive development or growth is reflected by improved access for more people to health and education services. Figure 3, presenting the scatter plots of the inequality-adjusted HDI and the three social development indicators (access to water, access to sanitation and primary school enrolment) that are potential channels through which foreign aid can influence inclusive growth, shows that IHDI is positively associated with these three indicators for the sample countries over the period studied. Given the increase in IHDI and its positive correlation between the three social development indicators, accessibility to these services must have improved or more people have gained access.
Figure 2: Kernel density evolution of inequality-adjusted HDI
Source: Authors’ own calculations.
Den
sity
.05 .1 .15 .2 .25 .3none
20111993
kernel = epanechnikov, bandwidth = 0.0182
Kernel density estimate
14
Figure 3: Scatter plots of IHDI and transmission channels for 74 aid recipient countries, 1993-2011
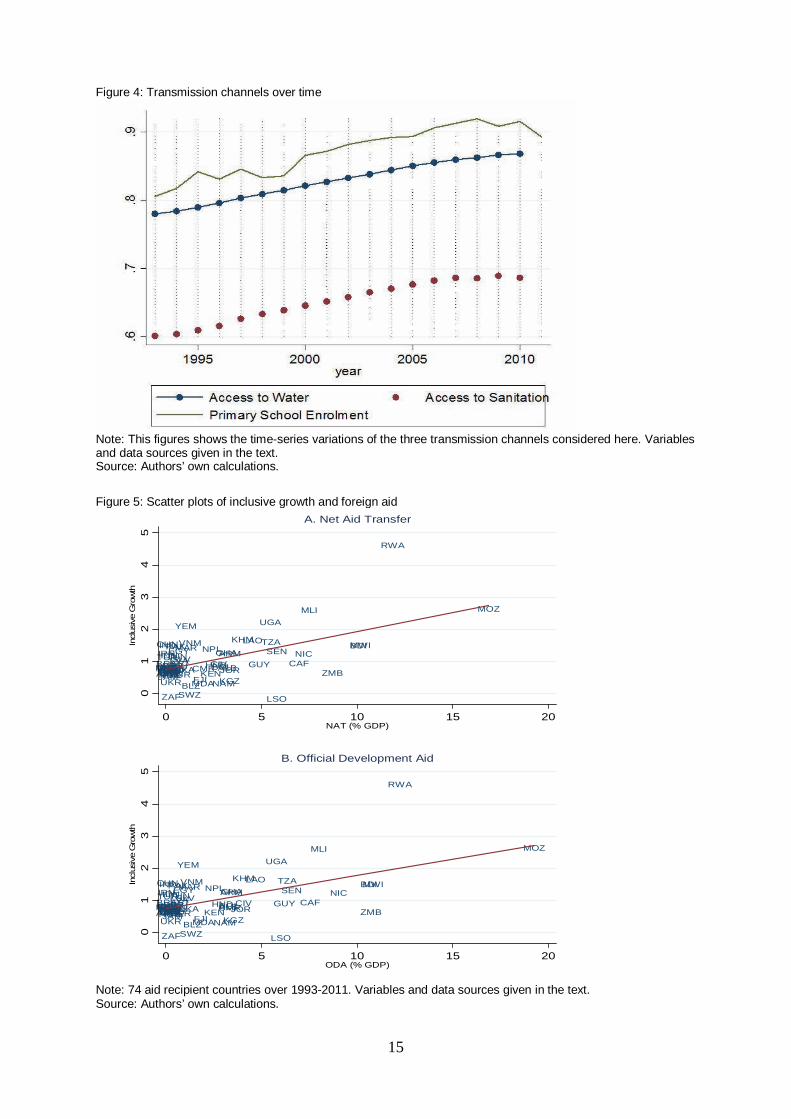
Note: Variables and data sources given in the text. Source: Authors’ own calculations. This is confirmed by Figure 4, which demonstrates the time-series variations for access to water, access to sanitations and primary school enrolment. These three indicators have increased at a similar rate over the period studied.
Our aim in this paper was to examine whether foreign aid has led to inclusive growth through its positive impact on access to water, sanitation and educational resources. Figure 5 looks at the relationship between inclusive growth and foreign aid without controlling for other economic and social variables. It shows that inclusive growth is positively associated with foreign aid, as measured by either NAT or ODA, for the sample countries over 1993-2011, in spite of the existence of a couple of outliers. The next section attempts to explore this relationship systematically.
A: Access to water B: Access to sanitation
C: Primary school enrolment
15
Figure 4: Transmission channels over time
Note: This figures shows the time-series variations of the three transmission channels considered here. Variables and data sources given in the text. Source: Authors’ own calculations.
Figure 5: Scatter plots of inclusive growth and foreign aid
Note: 74 aid recipient countries over 1993-2011. Variables and data sources given in the text. Source: Authors’ own calculations.
ALBARG
ARMBDI
BGRBLZ
BOLBRA CAFCHL
CHN
CIVCMRCOLCRICZEDOM
EGYEST
FJI
GHAGUYHNDHRVHUN
IDNINDIRN
JAMJORKAZ KENKGZ
KHMLAO
LKA
LSO
LTULVAMAR
MDA
MEX
MLI MOZ
MWI
MYS
NAM
NICNPLPAK
PANPERPHLPRYROU
RUS
RWA
SENSLV
SVKSVN
SWZ
THATUNTUR
TZA
UGA
UKRURYVEN
VNM
YEM
ZAF
ZMB
01
23
45
Incl
usiv
e G
row
th
0 5 10 15 20NAT (% GDP)
A. Net Aid Transfer
ALBARG
ARMBDI
BGRBLZ
BOLBRA CAFCHL
CHN
CIVCMRCOLCRICZEDOM
EGYEST
FJI
GHAGUYHNDHRVHUN
IDNINDIRN
JAMJORKAZ KEN
KGZ
KHMLAO
LKA
LSO
LTULVA
MAR
MDA
MEX
MLI MOZ
MWI
MYS
NAM
NICNPLPAK
PANPERPHLPRYROU
RUS
RWA
SENSLV
SVKSVN
SWZ
THATUNTUR
TZA
UGA
UKRURYVEN
VNM
YEM
ZAF
ZMB
01
23
45
Incl
usiv
e G
row
th
0 5 10 15 20ODA (% GDP)
B. Official Development Aid
16
6.2 Econometric evidence
This section presents econometric evidence to determine whether global partnership in areas such as foreign aid has fostered inclusive growth for 74 aid recipient countries over 1993 to 2011. It reports the ‘doubly-filtered’ LIML estimates based on Akashi and Kunitomo (2010, 2012) for the linear dynamic panel data model with fixed effects and endogenous regressors when T and N are large. The lagged value of backward-filtered variables at t-1 are used as instruments for the relevant forward-filtered variables. The panel robust standard errors, based on Arellano (1987), are reported in brackets to adjust for serial correlation.
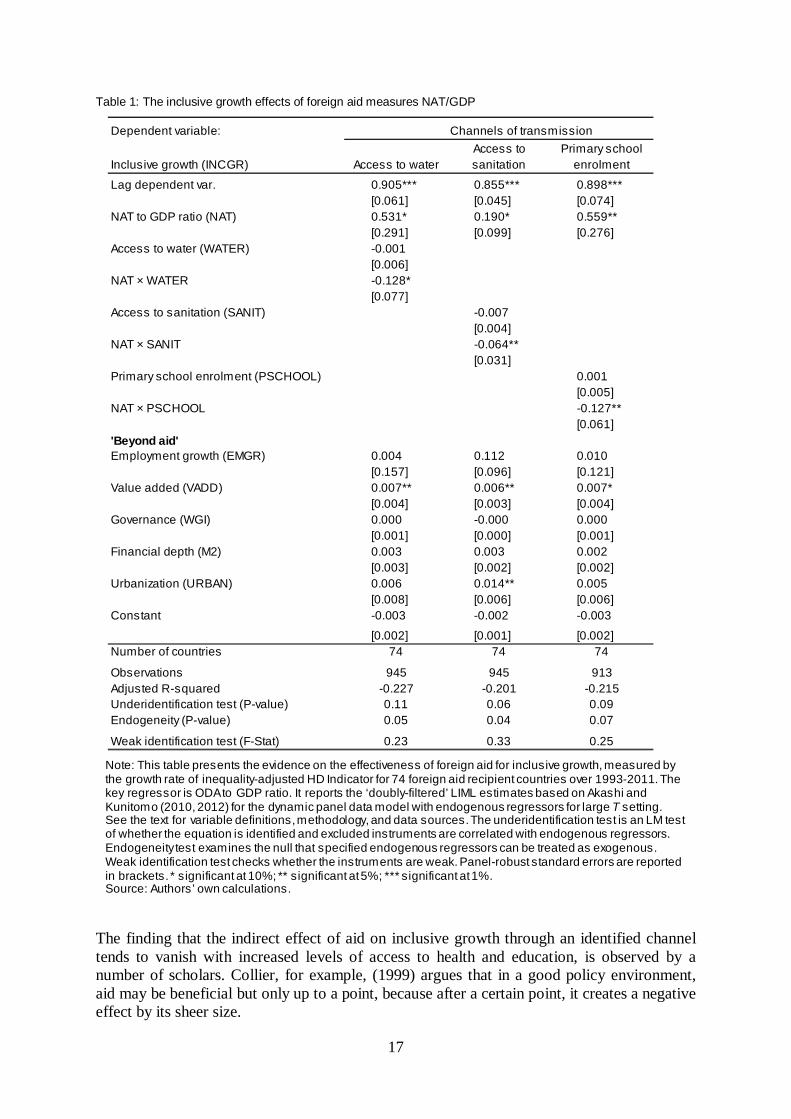
Aid effectiveness In Table 1 on the effectiveness of foreign aid for inclusive growth, foreign aid is measured by the ratio of net aid transfers to GDP. Three models are used to examine each of the three transmission channels (access to water, access to sanitations and primary school enrolment). Three models are well identified, as supported by the under-identification test.15 The p-values of the endogeneity test clearly reject the null, suggesting that regressors in each model should be treated as endogenous. The weak identification tests cannot reject the null for three models. This evidence, together with the under-identification test, indicates that the instruments in terms of the lagged value of backward-filtered variables are relevant but only weakly correlated with endogenous regressors. Given the weak instrument problem, the LIML estimator still performs very well; in contrast, other estimators such as the instrument variable estimator can perform badly.
In column one of Table 1, LIML estimates show that foreign aid has a significantly positive impact on inclusive growth; but there is no evidence indicating a significant effect on growth of the channel ‘access to water’. The interaction between aid and this channel enters the model as significant. Its negative sign, coupled with the positive sign of NAT, implies that foreign aid exerts both direct and indirect effects on inclusive growth. The indirect effect is likely to occur when aid is invested for improvements in water accessibility, but once access to water improves, this indirect effect can diminish.
When the transmission channels with respect to ‘access to sanitation’ and ‘primary school enrolment’ are taken into account, LIML estimates provide evidence that foreign aid can contribute significantly to inclusive growth, both directly and indirectly. The impact of foreign aid, in addition to its effect being channelled through ‘access to water’, is likely to be transmitted indirectly through ‘access to sanitation’ or ‘primary school enrolment’, but the effect vanishes once access to these services reaches a certain level.
The findings regarding these three transmission channels are in line with the existing literature that highlights the role of ODA in promoting health and education services in developing countries. For example, Yontcheva and Masud (2005) and Mishra and Newhouse (2009) show that foreign aid has a beneficial and statistically significant impact on infant mortality in aid recipient countries. Michaelowa (2004) finds significant evidence that aid has increased gross primary enrolment in about 80 low-income countries. Arndt, Jones and Tarp (2012), by looking at transmission channels, note that aid has contributed to growth by stimulating its proximate determinants such as education and health. Birchler and Michaelowa (2013) find that education aid has promoted primary enrolment and education quality over the last 15 years.
15 The null for the first model is not rejected, but its p-value is very close to the significance level.
17
Table 1: The inclusive growth effects of foreign aid measures NAT/GDP
The finding that the indirect effect of aid on inclusive growth through an identified channel tends to vanish with increased levels of access to health and education, is observed by a number of scholars. Collier, for example, (1999) argues that in a good policy environment, aid may be beneficial but only up to a point, because after a certain point, it creates a negative effect by its sheer size.
Dependent variable: Channels of transmission
Inclusive growth (INCGR) Access to waterAccess to sanitation
Primary school enrolment
Lag dependent var. 0.905*** 0.855*** 0.898***[0.061] [0.045] [0.074]
NAT to GDP ratio (NAT) 0.531* 0.190* 0.559**[0.291] [0.099] [0.276]
Note: This table presents the evidence on the effectiveness of foreign aid for inclusive growth, measured by the growth rate of inequality-adjusted HD Indicator for 74 foreign aid recipient countries over 1993-2011. The key regressor is ODA to GDP ratio. It reports the ‘doubly-filtered’ LIML estimates based on Akashi and Kunitomo (2010, 2012) for the dynamic panel data model with endogenous regressors for large T setting. See the text for variable definitions, methodology, and data sources. The underidentification test is an LM test of whether the equation is identified and excluded instruments are correlated with endogenous regressors. Endogeneity test examines the null that specified endogenous regressors can be treated as exogenous. Weak identification test checks whether the instruments are weak. Panel-robust standard errors are reported in brackets. * significant at 10%; ** significant at 5%; *** significant at 1%.Source: Authors’ own calculations.
18
Although other innovative sources of international development financing such as non-DAC aid and private philanthropy continue to grow, foreign aid remains an important and complementary source of funding for development cooperation. However, foreign aid has to be directed to the right sectors and used in a more catalytic manner so as to leverage other sources of development finance. This research points to the importance of access to inexpensive and good quality health and education services for both economic and human development. A greater allocation of public funds, foreign aid included, to health and education is needed to facilitate the development of inclusive growth.
Beyond aid While financial resources will continue to play an important role in achieving inclusive growth, public goods and policies in areas ‘beyond aid’ such as structural change, employment growth, financial systems and governance create an enabling environment to inclusive growth.
This analysis controls for some of the important variables that feature in a policy environment where aid could be conducive to inclusive growth. The first control variable, employment growth, has a positive impact on inclusive growth, but the effect is not significant. This is in general applied to the control variables of governance and financial depth. However, value added (VADD) and urbanization have been observed to make a significant contribution to inclusive growth. This evidence has important policy implications.
As argued by Dollar and Burnside (2000), ‘aid would be more effective if it were more systematically conditioned on good policy’. An enabling environment would include, among others, a progressive labour market that affords rapid employment growth, which is the main instrument of inclusive growth. There should be a better balance in the development of the agricultural, industrial and services sectors so that all segments of the population can participate in the growth process. A balanced development between rural areas and cities could facilitate not only labour mobility (which is driven by development opportunities) but also development and the reduction of poverty and inequality. An enabling environment should also encompass a financial system that offers wider access to people and an efficient regulatory system.
A post-2015 global development framework that would extend ‘beyond aid’ necessitates a renewed partnership to set up an enabling policy and regulatory environment for inclusive growth, enhances the coherence of all national policies with international development, and links national and international efforts in a mutually supportive manner. A renewed global partnership with internationally agreed collective action in these areas is crucial for realizing the vision of inclusive and sustainable development, as expressed in the Millennium Declaration.16
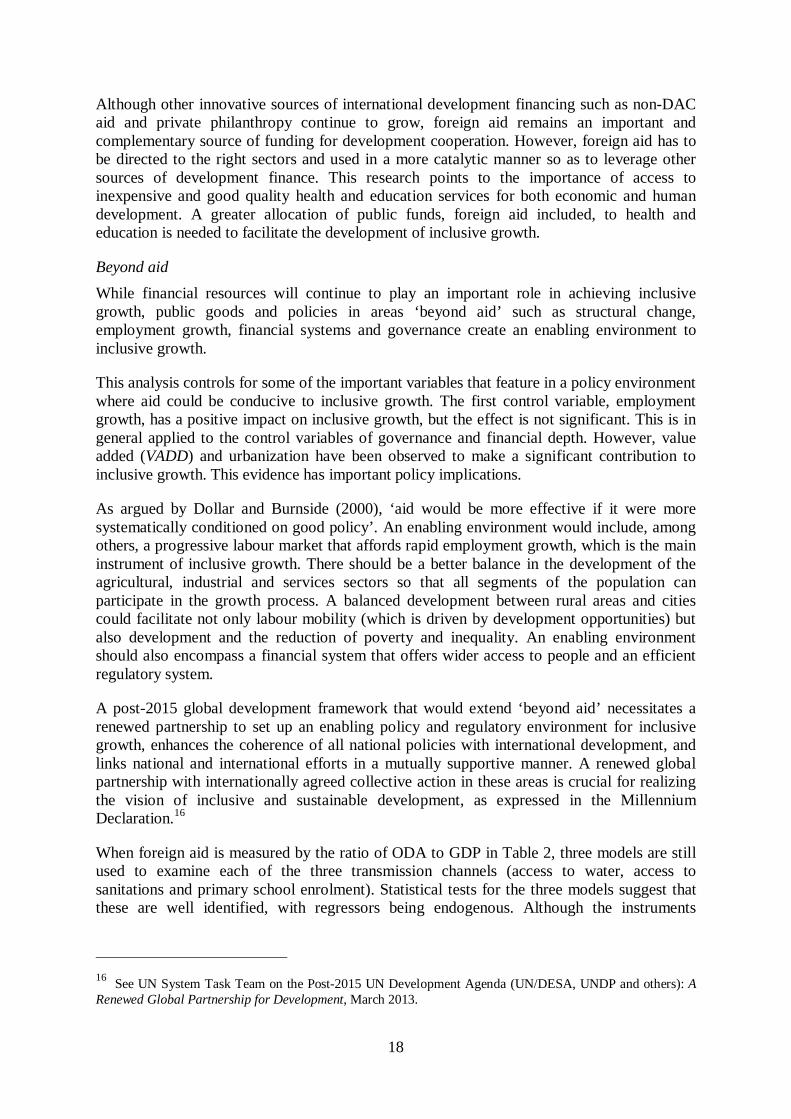
When foreign aid is measured by the ratio of ODA to GDP in Table 2, three models are still used to examine each of the three transmission channels (access to water, access to sanitations and primary school enrolment). Statistical tests for the three models suggest that these are well identified, with regressors being endogenous. Although the instruments
16 See UN System Task Team on the Post-2015 UN Development Agenda (UN/DESA, UNDP and others): A Renewed Global Partnership for Development, March 2013.
19
generated by the backward-filtering are correlated with endogenous regressors, the correlation is only weak.
The LIML estimates in Table 2 confirm the findings for the effects of foreign aid being channelled through ‘access to sanitation’ or ‘primary school enrolment’, but its effect through the access-to-water channel is less evident, although p-values for ODA and WATERODA×are close to the significance level. The findings on the significant impact of sectorial structure and urbanization on inclusive growth are confirmed; and a significant positive effect was observed for financial depth.
Table 2: The inclusive growth effect of foreign aid measured by ODA/GDP
Dependent variable: Channels of transmission
Inclusive growth (INCGR) Access to waterAccess to sanitation
Primary school enrolment
Lag dependent var. 0.906*** 0.858*** 0.898***[0.060] [0.047] [0.068]
ODA to GDP ratio (ODA) 0.381 0.147* 0.503*[0.240] [0.085] [0.260]
Note: This table reports the evidence on the effectiveness of foreign aid for inclusive growth, where foreign aid is measured by the ratio of ODA over GDP. See Table 1 for more notes.Source: Authors' own calculations.
20
6 Conclusion
This paper investigated the importance of an enhanced global partnership in areas such as foreign aid for inclusive growth. Inclusive growth is envisaged to provide all people with equal opportunity to contribute to the growth process and to enjoy the gains of increased wealth. Based on the traditional Solow growth model, the theoretical section of the paper modelled inclusive growth as a different kind of growth which envisages declines in inequality and improved social opportunities. Foreign aid, with plausible parameter values for substitution in production, could exert a favourable impact on income distribution and inclusive growth.
Next, the empirical section employed an extended model, which paid special attention to the transmission channels (in terms of social opportunities such as access to health and education) through which aid can promote growth inclusiveness. A dynamic panel data study based on annual data for 74 countries over 1993-2011 was conducted, using the growth rate of inequality-adjusted HDI to proxy inclusive growth. To address the issue of endogeneity in a large T dynamic panel data model, this research applied the ‘doubly-filtered’ LIML estimator from Akashi and Kunitomo (2010, 2012). The evidence shows that foreign aid has significantly spurred inclusive growth in aid recipient countries, especially through three transmission channels, i.e., access to water, access to sanitation and primary school enrolment. More public funds should be allocated to health, education as well as infrastructure, technology transfer, policy and regulatory mechanism, and mass housing to encourage the development of inclusive growth. Effective subsidy policies should be undertaken to provide the poor with better access to education and health services.
The evidence also suggests that a prerequisite of inclusive growth is an inclusive environment characterized, among others, by progressive labour markets, balanced economic structures, smooth urbanization processes, and efficient financial and regulatory systems. As inclusive growth envisages providing equal opportunity for people everywhere to contribute to the growth process and to reap its benefits, relevant policies need to be designed according to the unique characteristics of each local society. With improved policies in these areas ‘beyond aid’, the potential effectiveness of aid for inclusive growth will increase.
This research has important implications for a post-2015 global development framework that extends ‘beyond aid’. First, foreign aid will continue to be an important funding source for development cooperation and will be used to leverage other sources of development finance. Second, a new global framework should support national policy choices and development paths, respect domestic policy space in areas such as development finance, employment, structural change, governance and migration, and calls for national economic and social transformations in these areas. Moreover, it should boost global partnership so as to ensure that donors fulfil their ODA commitments, harmonize global goals with national targets and the needs of developing countries, stimulate the coherence of all national policies with international development and extend international collective action to tackle development challenges such as inequality, financial crisis and climate change.
21
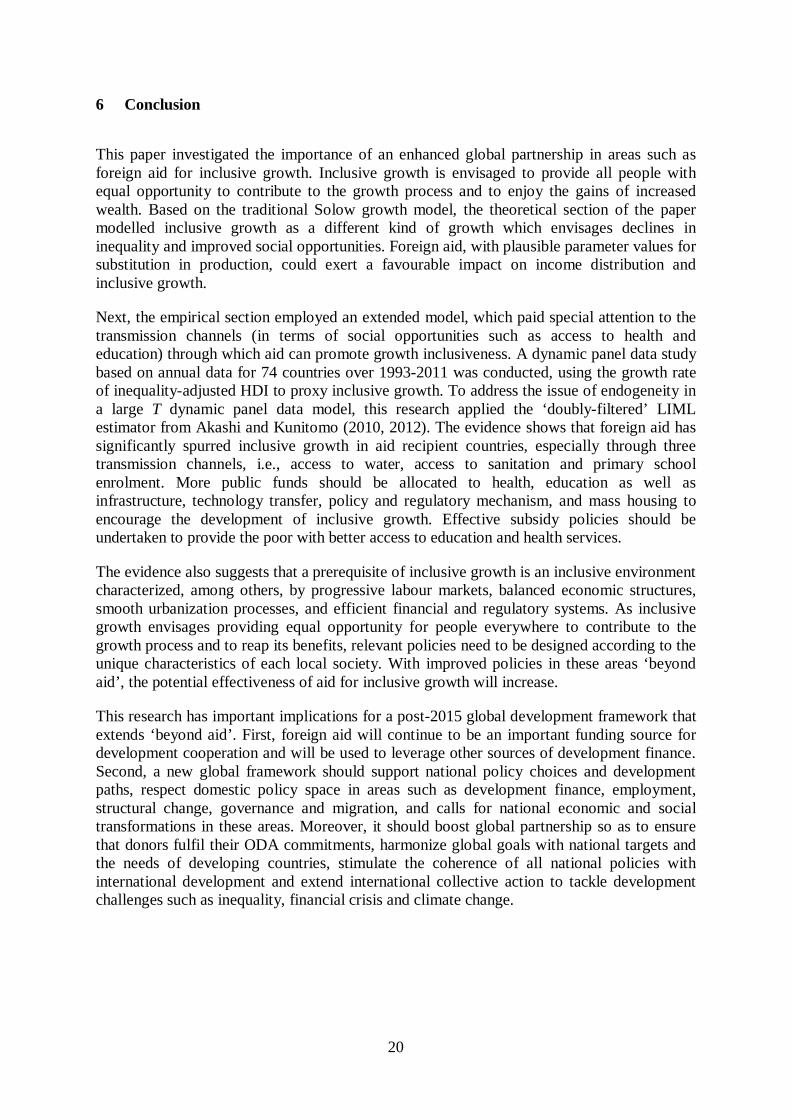
Appendix
Appendix Table 1: The variables
Variable Description Source
INCGR The inclusive growth, the growth rate of IHDI. The regression uses ln(1+INCGR/100).
Own calculation
IHDI Inequality-adjusted HDI, based on Technical Note 2 from UNDP (2011).
Annual data on HDI from UNDP HDI Office.
NAT Net aid transfer (NAT ) (% of GDP). The regression uses ln(1+NAT/100).
Aid data from the Center for Global Development (Washington, DC) based on Roodman (2006) and GDP data from the WDI (World Bank 2012)
ODA Net official development assistance (ODA) received (% of GDP). The regression uses ln(1+ODA/100).
-"-
WATER Improved water source (% of population with access). The regression uses ln(WATER).
WDI (World Bank 2012)
SANIT Improved sanitation facilities (% of population with access). The regression uses ln(SANIT).
-"-
PSCHOOL Total primary school enrolment (% net). The regression uses ln(PSCHOOL).
-"-
EMGR Growth rate of employment to population ratio (total %, 15+). The regression uses ln(1+EMGR/100).
-"-
VADD The first principal component of values added of agriculture, industry and services in log.
Calculation based on data from WDI (2012)
WGI The overall governance quality measured by the average of voice and accountability, political stability and absence of violence, government effectiveness, regulatory quality, rule of law, and control of corruption.
Kaufmann, Kraay and Mastruzzi (2012)
M2 Money and quasi money (M2) (% of GDP). The regression uses ln(M2).
WDI (World Bank 2012)
URBAN Urban population (% of total). The regression uses ln(URBAN).
-"-
Source: Compiled by authors.
22
Appendix Table 2: List of the 74 aid recipient countries considered in this paper
Country name Country code Country name Country code
Albania ALB Lithuania LTUArgentina ARG Latvia LVA
Armenia ARM Morocco MARBurundi BDI Moldova MDA
Bulgaria BGR Mexico MEXBelize BLZ Mali MLI
Bolivia BOL Mozambique MOZBrazil BRA Malawi MWI
Central African Republic CAF Malaysia MYSChile CHL Namibia NAM
China CHN Nicaragua NICCote d'Ivoire CIV Nepal NPL
Cameroon CMR Pakistan PAKColombia COL Panama PAN
Costa Rica CRI Peru PERCzech Republic CZE Philippines PHLDominican Republic DOM Paraguay PRY
Egypt, Arab Rep. EGY Romania ROUEstonia EST Russian Federation RUS
Fiji FJI Rwanda RWAGhana GHA Senegal SEN
Guyana GUY El Salvador SLVHonduras HND Slovak Republic SVK
Croatia HRV Slovenia SVNHungary HUN Swaziland SWZ
Indonesia IDN Thailand THAIndia IND Tunisia TUN
Iran, Islamic Rep. IRN Turkey TURJamaica JAM Tanzania TZA
Jordan JOR Uganda UGAKazakhstan KAZ Ukraine UKR
Kenya KEN Uruguay URYKyrgyz Republic KGZ Venezuela, RB VEN
Sri Lanka LKA South Africa ZAFLesotho LSO Zambia ZMBSource: Compiled by the authors.
23
References
ADB (Asian Development Bank) (2012). Framework of Inclusive Growth Indicators 2012: Key Indicators for Asia and the Pacific, Manila: ABD.
Akashi, K., and N. Kunitomo (2010). ‘The Limited Information Maximum Likelihood Approach to Dynamic Panel Structural Equations’. CIRJE F-Series 708. Tokyo: Faculty of Economics, University of Tokyo.
Akashi, K., and N. Kunitomo (2012). ‘Some Properties of the LIML Estimator in a Dynamic Panel Structural Equation’. Journal of Econometrics, 166(2): 167–83.
Ali, I., and H. H. Son (2007). ‘Measuring Inclusive Growth’. Asian Development Review, 24(1): 11.
Alvi, E., and A. Senbeta (2012). ‘Does Foreign Aid Reduce Poverty?’. Journal of International Development, 24(8): 955–76.
Arellano, M. (1987). ‘Computing Robust Standard Errors for Within-Groups Estimators’. Oxford Bulletin of Economics and Statistics, 49(4): 431–34.
Arellano, M. (2003). Panel Data Econometrics (Advanced Texts in Econometrics). New York: Oxford University Press.
Arezki, R., and M. K. Nabli (2012). ‘Natural Resources, Volatility, and Inclusive Growth: Perspectives from the Middle East and North Africa’. IMF Working Paper 12/111. Washington, DC: IMF.
Arndt, C., S. Jones, and F. Tarp (2012). ‘Assessing Foreign Aid’s Long Run Condition to Growth and Development’. Helsinki: UNU-WIDER. Mimeo.
Birchler, K., and K. Michaelowa (2013). ‘Making Aid Work for Education in Developing Countries: An Analysis of Aid Effectiveness for Primary Education Coverage and Quality’. WIDER WP2013/021. Helsinki: UNU-WIDER.
Bourguignon, F., and M. Sundberg (2007). ‘Aid Effectiveness: Opening the Black Box’. The American Economic Review, 97(2): 316–21.
Collier, P. (1999). ‘Aid “Dependency”: A Critique’. Journal of African Economies, 8(4): 528–45.
Dollar, D., and A. Kraay (2002). ‘Growth Is Good for the Poor’. Journal of Economic Growth, 7(3): 195–225.
Dollar, D., and C. Burnside (2000). ‘Aid, Policies, and Growth’. American Economic Review, 90(4): 847–68.
EC (European Commission) (2010). ‘Europe 2020: A Strategy for Smart, Sustainable and Inclusive Growth. EC document COM(2010) 2020. Brussels: EC. Available at: www. ec.europa.eu/economy_finance/structural_reforms/europe_2020/
Enerdata (2012). ‘Global Energy Market Data’. Available at: www.enerdata.net/.
European Union (2012). ‘Confronting Scarcity: Managing Water, Energy and Land for Inclusive and Sustainable Growth’. Brussels: European Union.
Foster, J. E., and M. Székely (2008). ‘Is Economic Growth Good for the Poor? Tracking Low Incomes Using General Means’. International Economic Review, 49(4):1143–72.
24
Garcia-Verdu, R., M. MacFarlan, S. Nolan, and J. Shields (2012). ‘Sustaining Growth amid Global Uncertainty’. In Regional Economic Outlook: Sub-Saharan Africa. Washington, DC: IMF.
Habito, C. F. (2009). ‘Patterns of Inclusive Growth in Developing Asia: Insights from an Enhanced Growth-Poverty Elasticity Analysis’. ADBI Working Paper Series 145. Tokyo: Asian Development Bank Institute.
Hatlebakk, M. (2008). ‘Inclusive Growth in Nepal’. CMI Report. Bergen: Chr. Michelsen Institute
Hayakawa, K. (2009). ‘A Simple Efficient Instrumental Variable Estimator for Panel AR(p) Models’. Econometric Theory, 25(03): 873–90.
Huang, Y., and M. G. Quibria (2013). ‘The Global Partnership for Sustainable Development’. WIDER Working Paper 2013/057. Helsinki: UNU-WIDER.
Ianchovichina, E., and S. Gable (2012). ‘What Is Inclusive Growth?’ In R. Arezki et al. (eds), Commodity Price Volatility and Inclusive Growth in Low-Income Countries. Washington, DC: IMF, 147–60.
Ianchovichina, E., and S. Lundström (2009). ‘Inclusive Growth Analytics: Framework and Application. WB Policy Research Working Paper 4851. Washington, DC: World Bank.
Kaufmann, D., A. Kraay, M. Mastruzzi (2012). ‘Worldwide Governance Indicators (WGI) 1996-2011’. The Worldwide Governance Indicators (WGI) Project. Washington, DC: World Bank.
Kaufmann, D., and A. Kraay (2008). ‘Governance Indicators: Where Are We, Where Should We Be Going?’. World Bank Research Observer, 23(1): 1–30.
Klasen, S. (2010). ‘Measuring and Monitoring Inclusive Growth: Multiple Definitions, Open Questions, and Some Constructive Proposals’. ADB Sustainable Development Working Paper Series 12. Manila: Asian Development Bank.
Marshall, M. G., and K. Jaggers (2012). ‘Polity IV Project, Political Regime Characteristics and Transitions, 1800-2011’. Vienna, VA: Center for Systemic Peace.
Michaelowa, K. (2004). ‘Aid Effectiveness Reconsidered: Panel Data Evidence for the Education Sector’. HWWI Discussion Paper 264. Hamburg: Hamburg Institute of International Economics.
Mishra, P., and D. Newhouse (2009). ‘Does Health Aid Matter?’. Journal of Health Economics, 28(4): 855–72.
OECD (2012). Aid Effectiveness 2011: Progress in Implementing the Paris Declaration. Paris: OECD Publishing.
OECD (n.d.). Glossy of Statistical Terms. Paris: OECD. Available at: www.stats.oecd.org/glossary/detail.asp?ID=6043
Ravallion, M., and S. Chen (2001). ‘Measuring Pro-Poor Growth’. WB Policy Research Working Paper 2666. Washington, DC: World Bank.
Roodman, D. (2006). ‘An Index of Donor Performance’. CGD Working Paper 67 (revised February 2013). Washington, DC: Center for Global Development.
Sachs, J. D., J. McArthur, G. Schmidt-Traub, M. Kruk, C. Bahadur, M. Faye, and G. McCord (2004). ‘Ending Africa’s Poverty Trap’. Brookings Papers on Economic Activity, 35(1): 117–216.
25
Temple, J. R. W. (2010). ‘Chapter 67 - Aid and Conditionality’. In D. Rodrik and M. Rosenzweig (eds), Handbook of Development Economics, vol. 5. Amsterdam: Elsevier, 4415–523.
UNDP (2011). Sustainability and Equity: A Better Future for All. New York, NY: Palgrave Macmillan.
Virtanen, P., and D. Ehrenpreis (2007). ‘Growth, Poverty and Inequality in Mozambique’. IPC-UNDP Country Study 10. Brasilia: IPC-UNDP.
Wilkinson, R., and K. Pickett (2009). The Spirit Level: Why More Equal Societies almost always Do Better. London: Allen Lane.
World Bank (2012). World Development Indicators Database (December 2012 ed.). Washington, DC: World Bank.
Yontcheva, B., and N. Masud (2005). ‘Does Foreign Aid Reduce Poverty? Empirical Evidence from Nongovernmental and Bilateral Aid’. IMF Working Paper 05/100. Washington, DC: IMF.


![MONTAGEANLEITUNG GEBRAUCHS- UND …cdn.billiger.com/dynimg/T1c2SsNMYfZekHKJwje8-Ht4H9rycHjeBa9L… · dkWEIysDl] ts- ch- uxj] va/ksjh ¼iw½] eqcabZ & 400 059] Hkkjr • 66660915](https://static.unterlagen.site/doc/80x56/6084119bf6fa6e3c2353074e/montageanleitung-gebrauchs-und-cdn-dkweiysdl-ts-ch-uxj-vaksjh-iw-eqcabz.jpg)


