Zur Erlangung des ersten akademischen Grades Diplomforstwirt (Dipl.-Forstw.) wurde der Fakultät Forst-, Geo- und Hydrowissenschaften der Technischen Universität Dresden von Christoph Wöll, geb. am 08.Dezember 1980 in Nastätten, die Diplomarbeit mit dem folgenden Thema vorgelegt: Treeline of mountain birch (Betula pubescens Ehrh.) in Iceland and its relationship to temperature Tag der Einreichung: …………………………… Verantwortlicher Hochschullehrer: Prof. Dr. habil. A. Roloff Betreuer: Prof. B.D. Sigurðsson (Landwirtschaftliche Hochschule Islands) Institut: Institut für Forstbotanik und Forstzoologie Für die Ausleihe zugelassen: ja/nein Tharandt, den ………………… …………………………………. Vorsitzender des Prüfungsausschusses
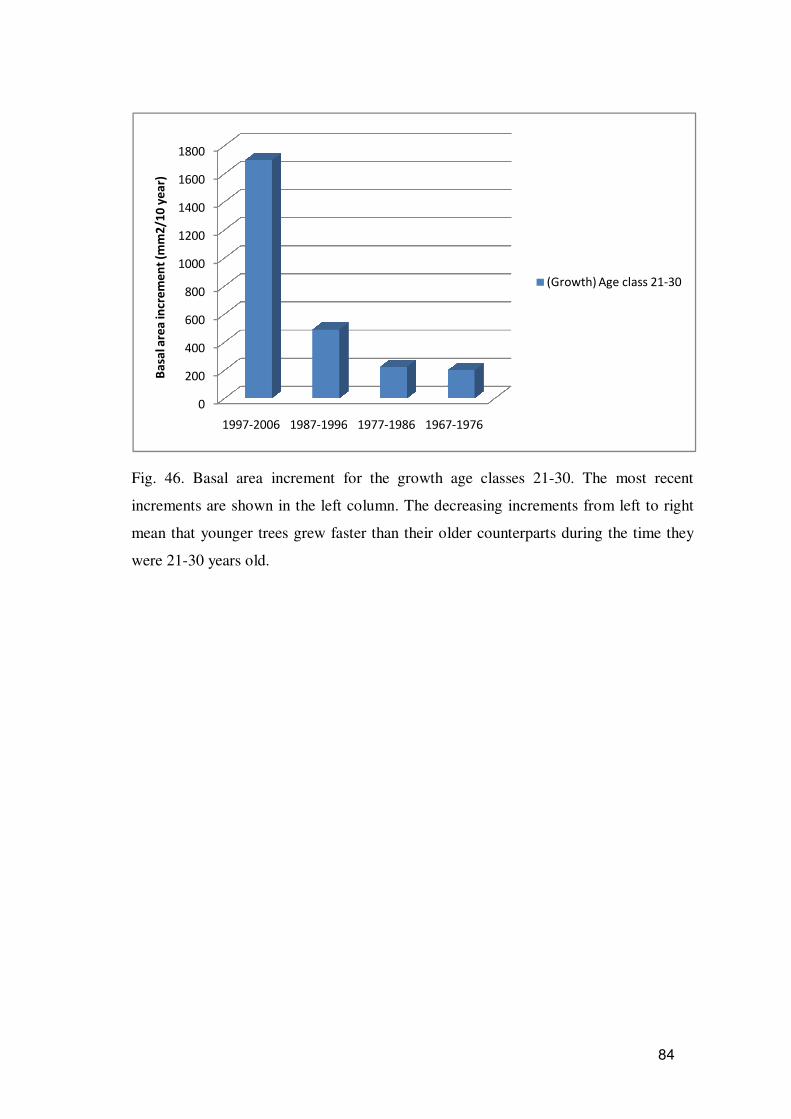
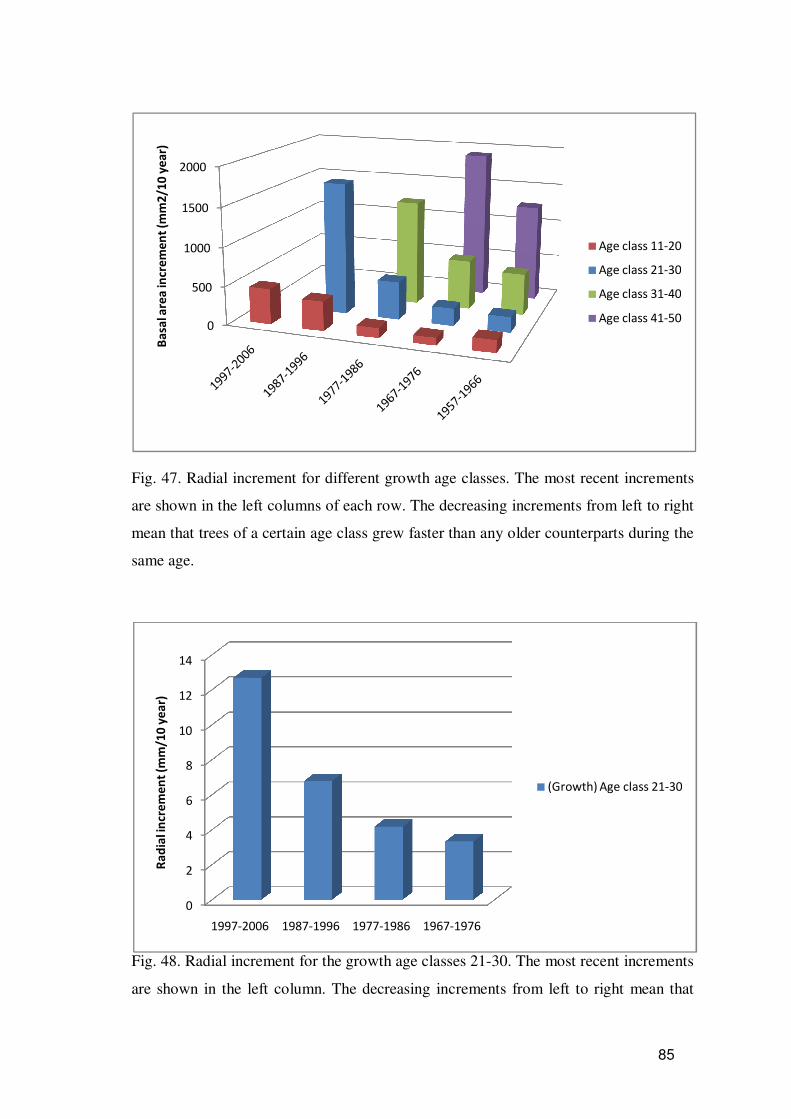
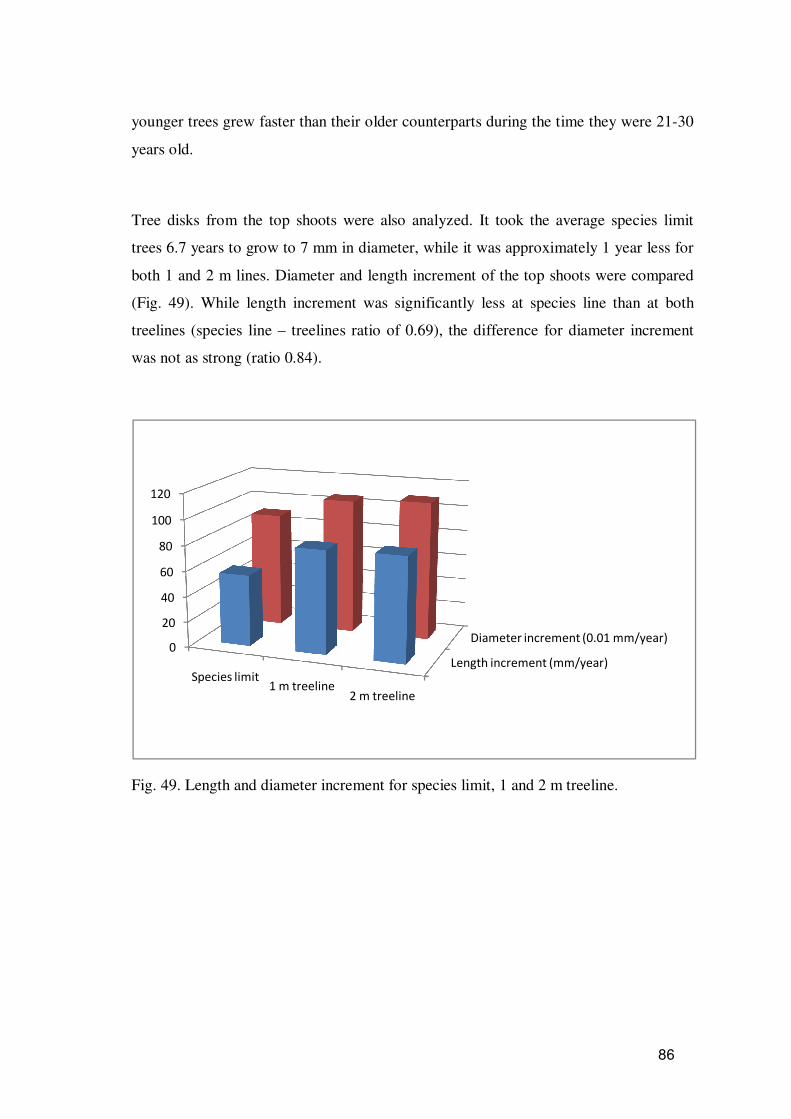
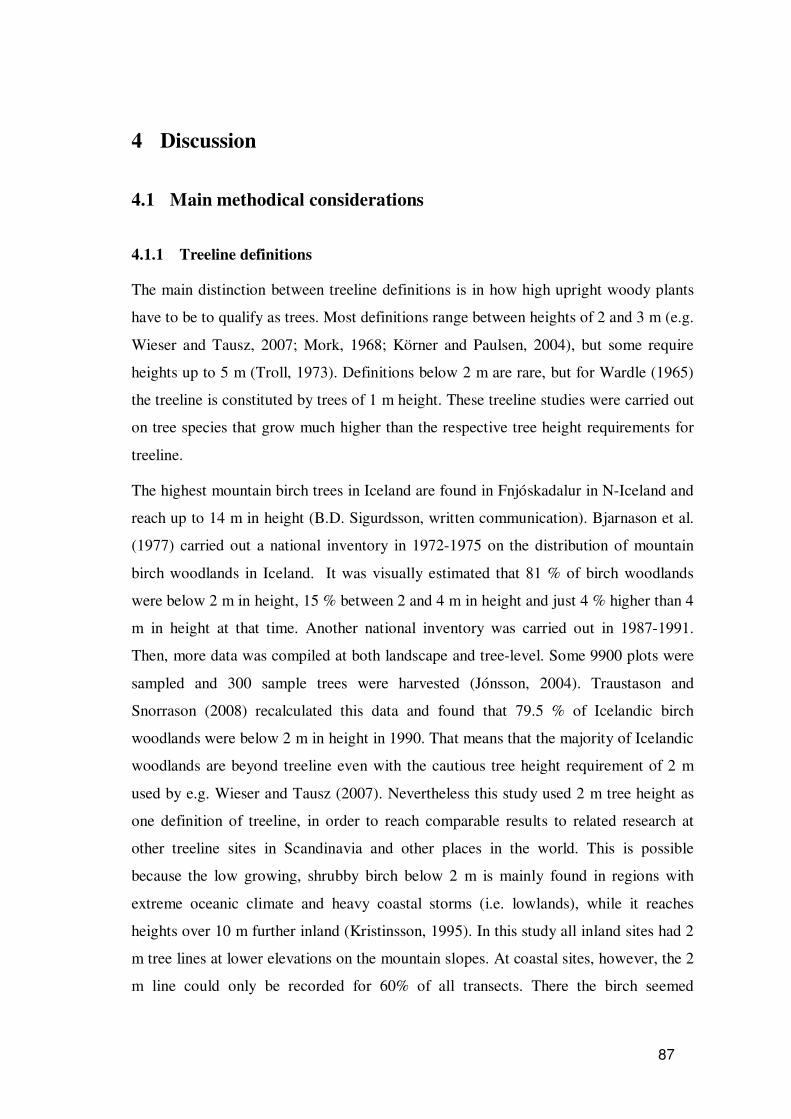
Transcript
Zur Erlangung des
ersten akademischen Grades Diplomforstwirt (Dipl.-Forstw.)
wurde der Fakultät Forst-, Geo- und Hydrowissenschaften
der Technischen Universität Dresden
von Christoph Wöll, geb. am 08.Dezember 1980 in Nastätten,
die Diplomarbeit mit dem folgenden Thema vorgelegt:
Treeline of mountain birch (Betula pubescens Ehrh.) in Iceland and its relationship to temperature
Tag der Einreichung: …………………………… Verantwortlicher Hochschullehrer: Prof. Dr. habil. A. Roloff Betreuer: Prof. B.D. Sigurðsson (Landwirtschaftliche Hochschule Islands) Institut: Institut für Forstbotanik und Forstzoologie Für die Ausleihe zugelassen: ja/nein Tharandt, den ………………… …………………………………. Vorsitzender des Prüfungsausschusses
I
Wöll, C. (2008). Treeline of mountain birch (Betula pubescens Ehrh.) in Iceland and its
relationship to temperature. Technical University Dresden, Department of Forestry,
diploma thesis in Forest Botany.
Abstract
The mountain birch (Betula pubescens Ehrh.) area in Iceland was reduced dramatically
between Viking settlement in 874 AD and today, due to extensive use of the woodlands
and other pressures. These included e.g. charcoal production, grazing by sheep and
climate deterioration. The first aim of this study was to establish a temperature-treeline
relationship for mountain birch in order to estimate the potential area for mountain
birch in Iceland. The second aim was to find out whether one threshold was valid for
the whole country, or if different thresholds have to be used in different regions in
Iceland. Therefore treeline positions in different parts of the country were recorded and
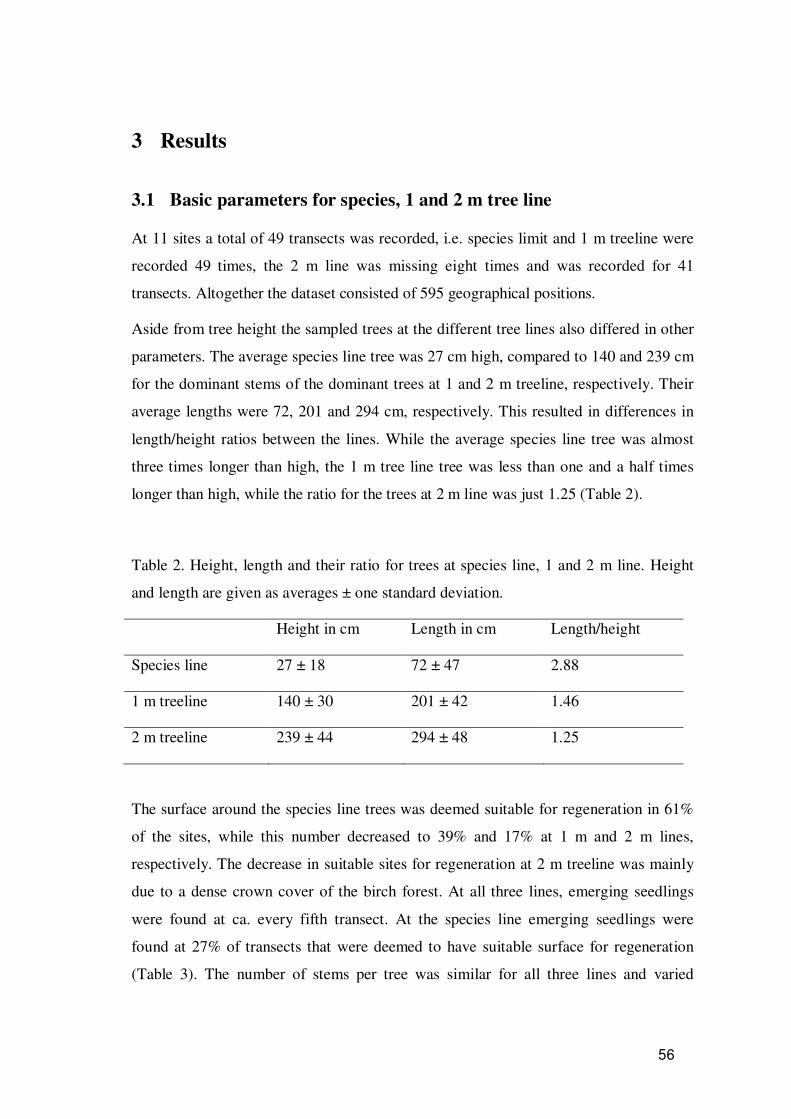
linked to thermal maps in a Geographic Information System. The third aim was to
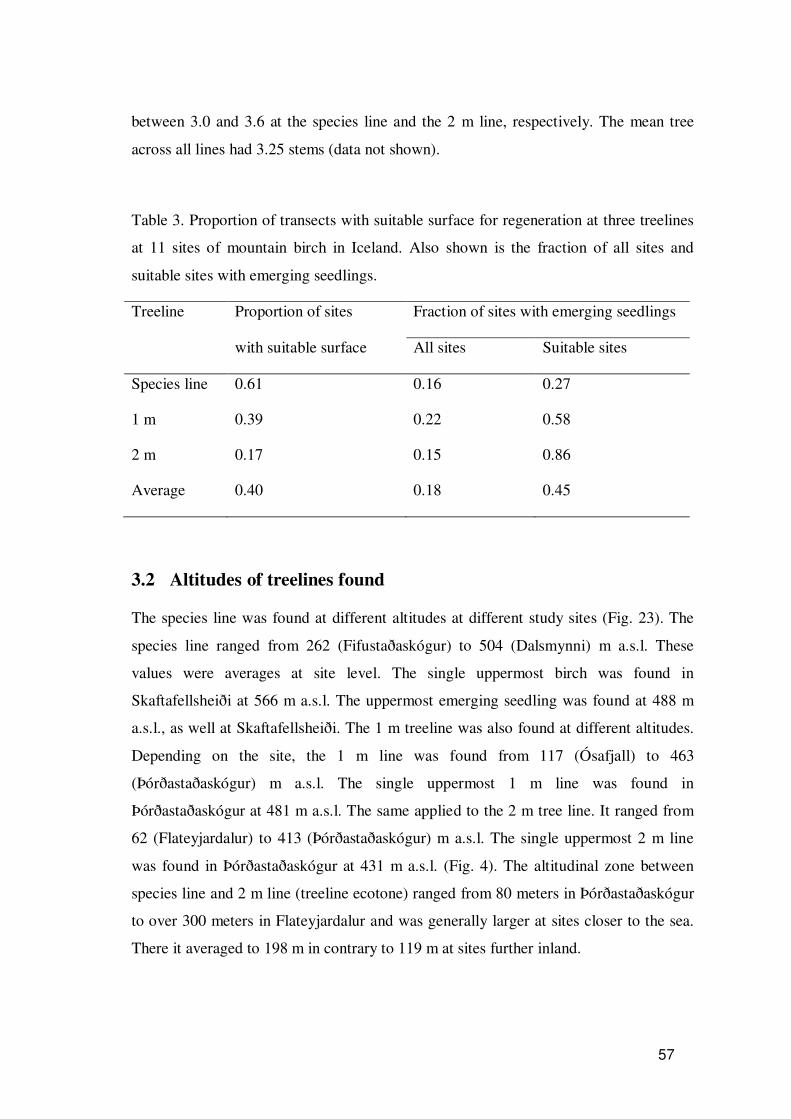
study whether oceanity influences treeline altitudes, by including distance to sea as well
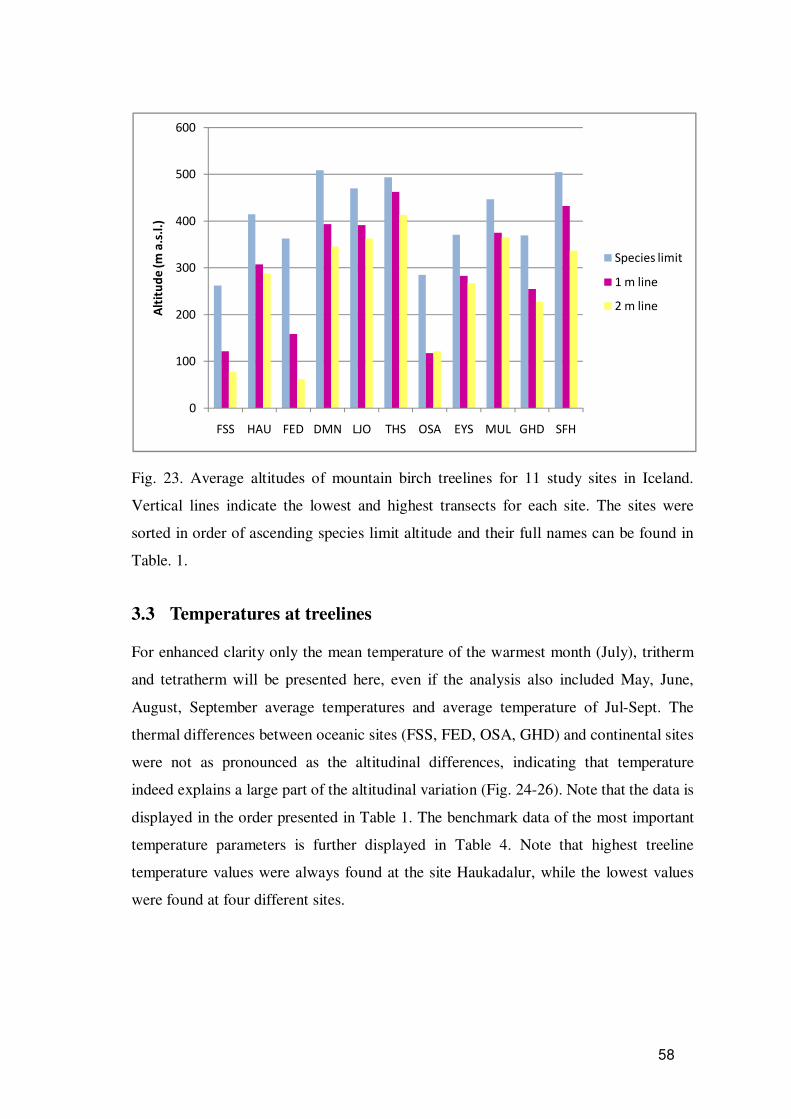
as groundwater and wood chloride content in the analysis. The fourth aim of this study
was to find out whether the recent climate warming could be read from treelines. For
that age and radial increment of sample trees at treeline were analyzed during different
periods using their tree rings.
Two significantly different tritherm thresholds (mean temperature for the three warmest
months of a year) were found for the coastal and the inland part of Iceland, 6.9 and 7.2
°C, respectively for the species line of mountain birch. For the 2 m treeline, the
threshold of 7.9 °C was valid for the whole country. These thresholds gave 41,500 km2
or 40% of the country as potential area for birch woodland (species line threshold) and
25,000 km2 or 24% for birch forest (2 m treeline, first including the latter). Oceanity
was found to influence treelines since their altitude increased with increasing distance
to sea as well as with decreasing groundwater chloride content. The results of the wood
chloride content analysis were inconclusive, though. Radial increment at treelines
increased drastically during the last decades as the climate has become warmer and
differences in tree ages between species line, 1 and 2 m treeline indicated upward
movement of treelines. The latter finding was supported by seedlings commonly found
at species line.
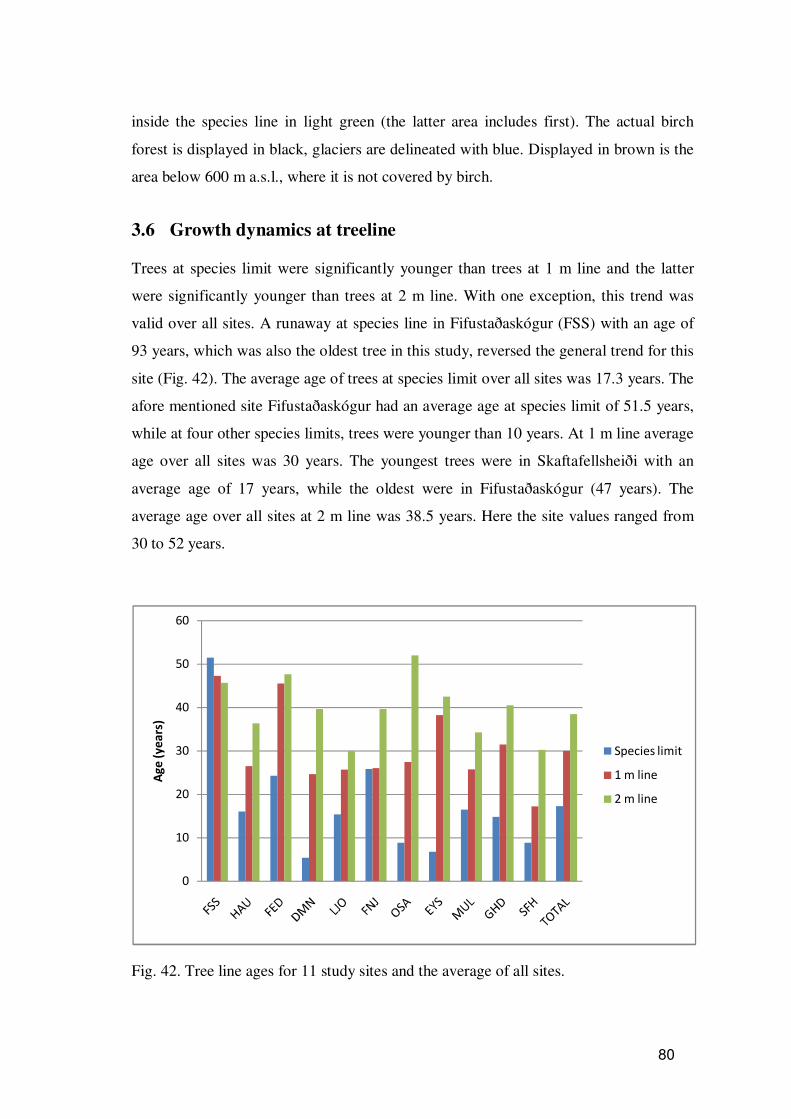
II
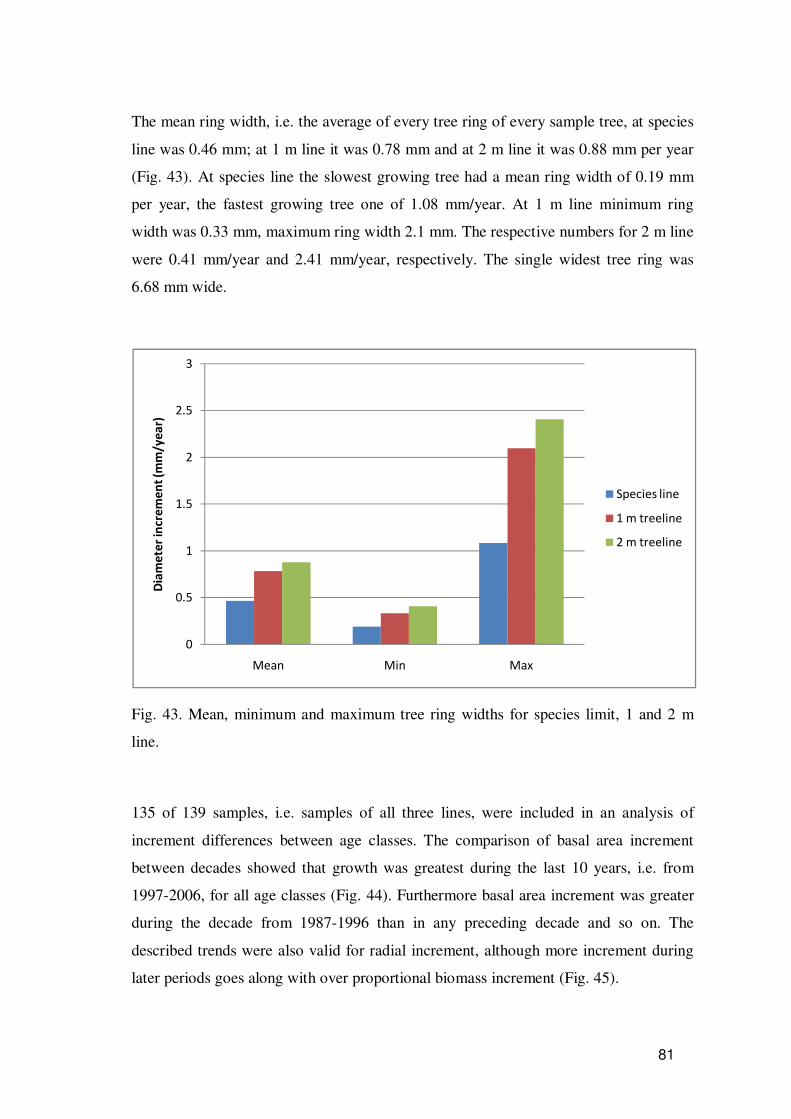
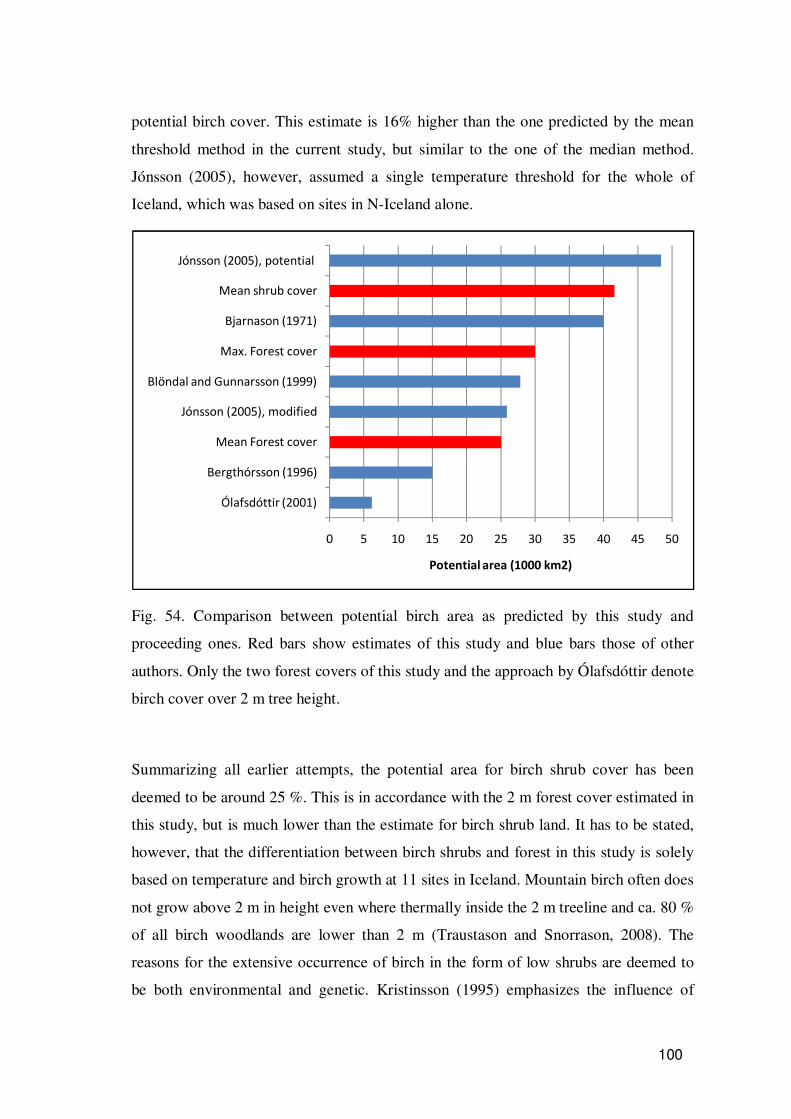
The potential area for birch established in this study was larger than those of previous
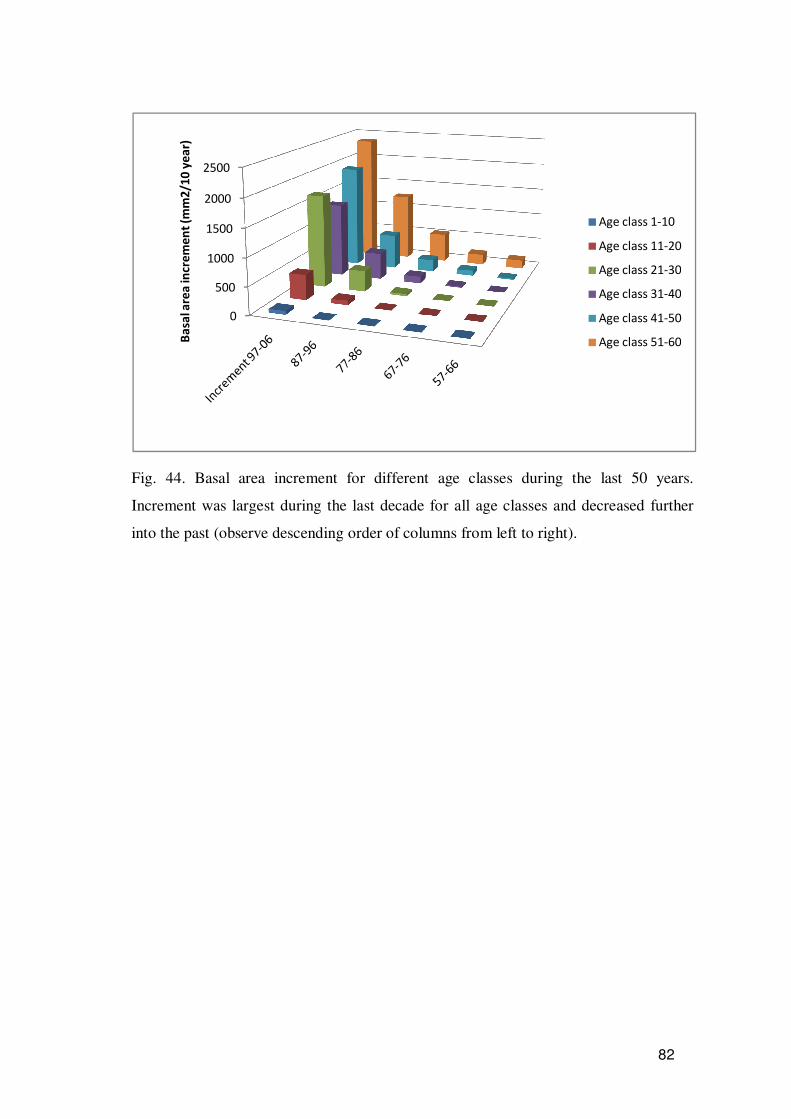
studies which supports the hypothesis that birch cover in Iceland was extensive prior to
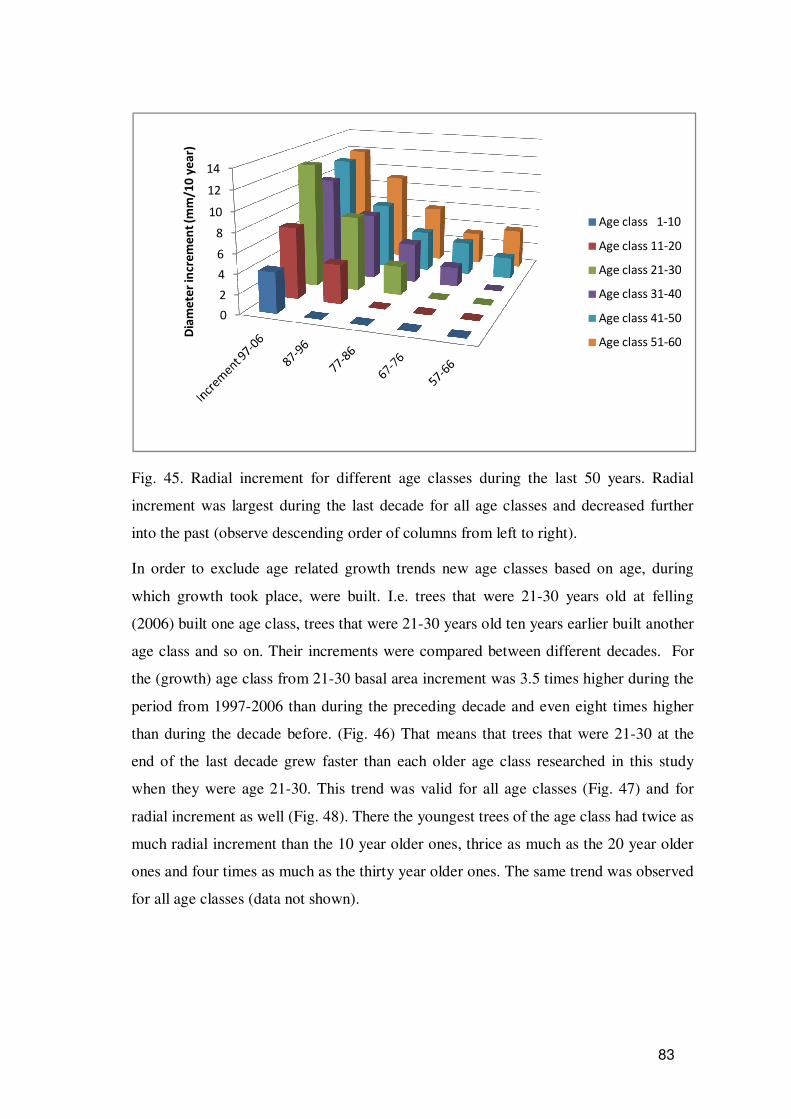
the settlers arrived in the 9th century. Since the consequences of recent climate
warming could already be seen at treelines, enhanced growth for the treeline ecotone as
well as its movement were predicted for the future.
Keywords: mountain birch, treeline, species line, Iceland, oceanity, wood chloride,
climate change.
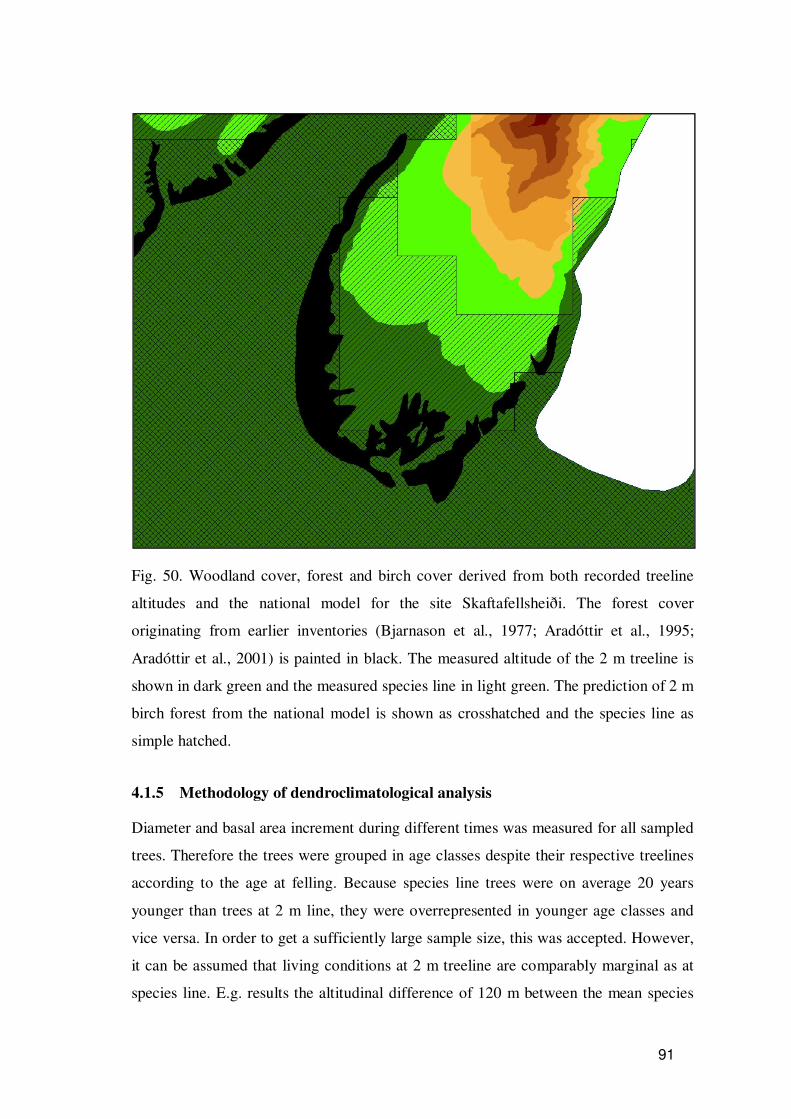
III
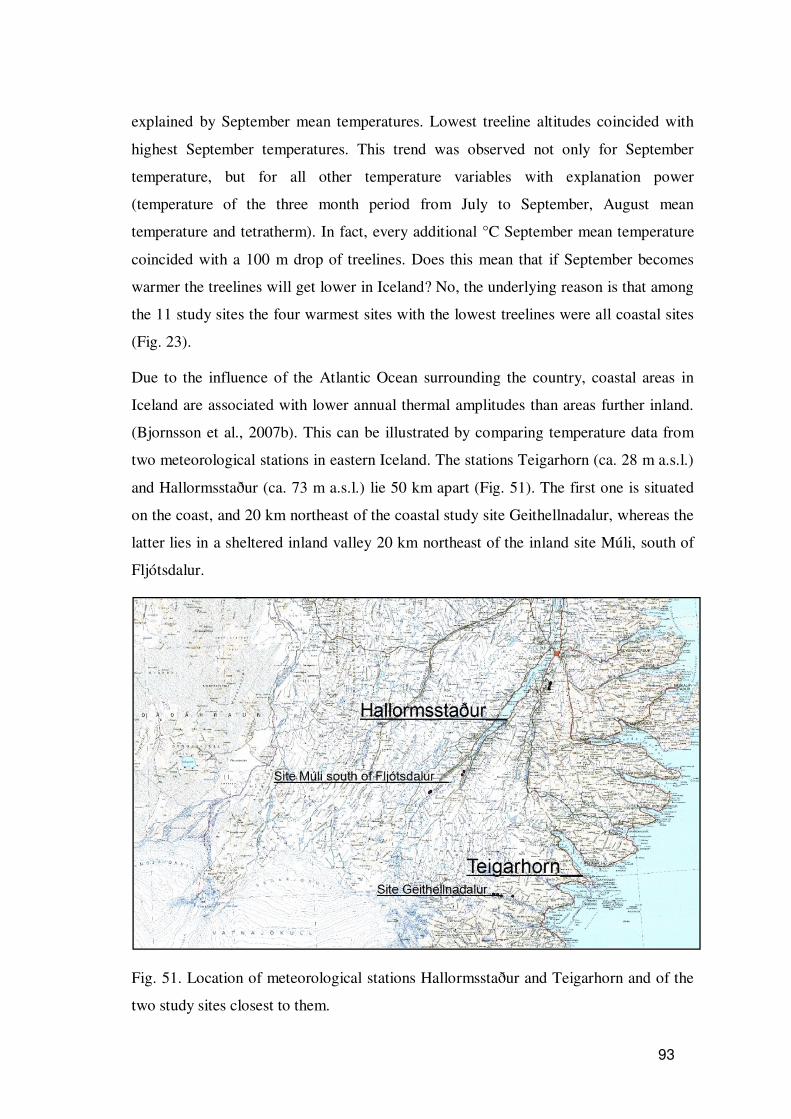
Wöll, C. (2008). Treeline of mountain birch (Betula pubescens Ehrh.) in Iceland and its
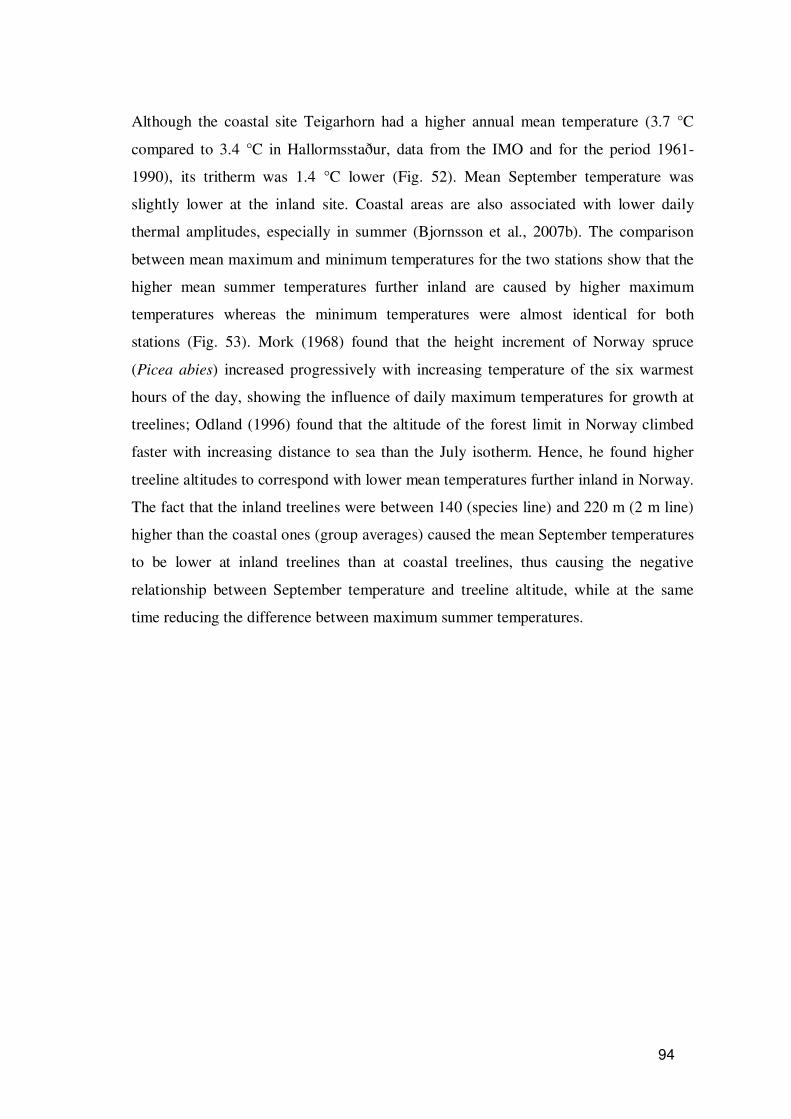
relationship to temperature. Technical University Dresden, Department of Forestry,
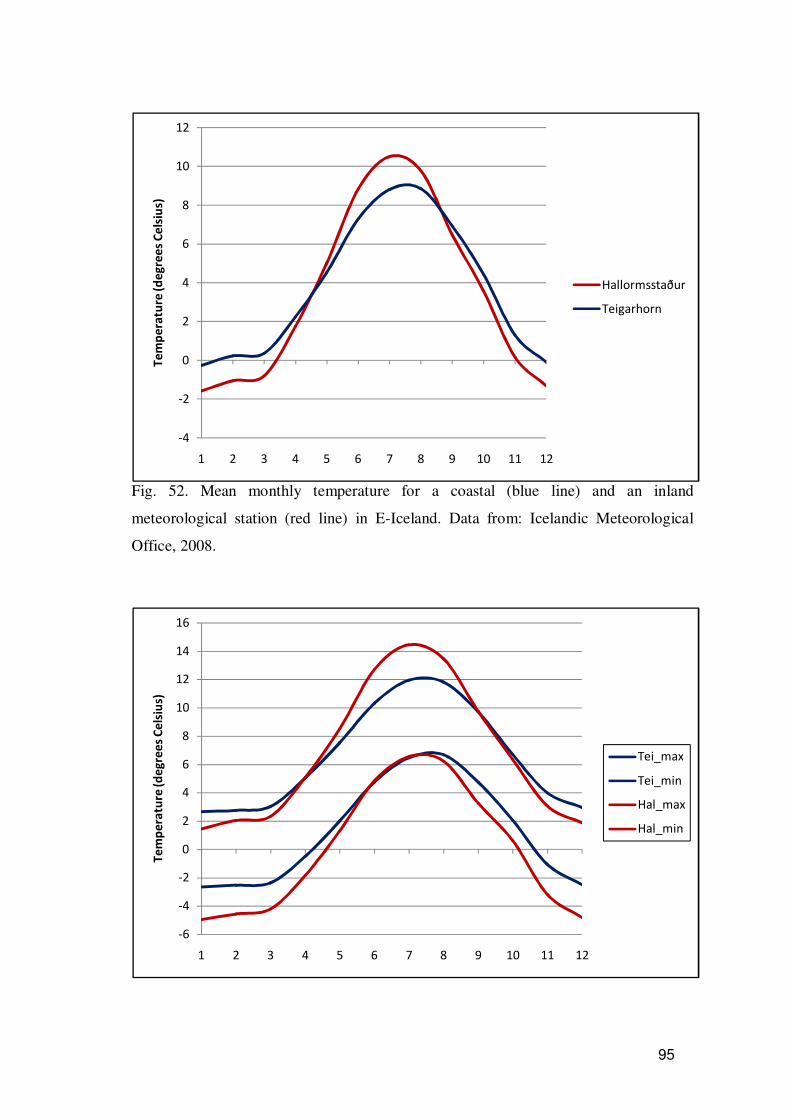
diploma thesis in Forest Botany.
Zusammenfassung
Die Waldfläche der Moorbirke (Betula pubescens Ehrh.) in Island wurde zwischen der
Besiedlung des Landes durch die Wikinger ab 874 n. Chr. und heute dramatisch
reduziert. Ursachen des Rückgangs waren v. a. grossflächige Nutzung des Waldes für
die Produktion von Holzkohle, Verbiss durch frei weidende Schafe und die im 16.
Jahrhundert einsetzende Klimaverschlechterung. Das erste Ziel dieser Studie war es
eine Beziehung zwischen Temperatur und der Baumgrenze für die Moorbirke zu
etablieren um die potientielle Waldfläche für die Moorbirke in Island zu errechnen.
Herauszufinden, ob ein Temperaturschwellenwert für das ganze Land gilt oder ob
verschiedene Schwellenwerte für verschiedene Regionen benutzt werden müssen, war
das zweite Ziel dieser Arbeit. Dafür wurde die Position der Baumgrenze in
verschiedenen Landesteilen vermessen und in einem Geographischen
Informationssystem mit Temperaturkarten verknüpft. Das dritte Ziel war zu
analysieren, ob Ozeanität die Höhe der Baumgrenze beeinflusst. Hierfür wurden der
Einfluss der Entfernung der Baumgrenzstandorte zum Meer und des Grundwasser- und
Holzchlorgehalts auf die Höhe der Baumgrenze analysiert. Herauszufinden, ob die
gegenwärtige, auch in Island statt findende Erwärmung bereits an der Baumgrenze
festzustellen ist, war das vierte Ziel dieser Studie. Dafür wurden Alter und
Durchmesserzuwachs der Probebäume zu verschiedenen Zeiträumen
dendrochronologisch analysiert.
Zwei signifikant voneinander verschiedene Tritherm-Schwellenwerte (Mitteltemperatur
der drei wärmsten Monate des Jahres) wurden für den küstennahen Teil und das
Landesinnere Islands an der Artgrenze gefunden, 6.9 bzw. 7.2 °C. Der Schwellenwert
von 7.9 °C für die 2 m Baumgrenze war gültig für das ganze Land. Diese
Schwellenwerte resultierten in einer potentiellen Fläche für die Art Moorbirke von
41.500 km2 oder 40 % des Landes (Artgrenze) und in einer potentiellen Waldfläche von
25.000 km2 oder 24 % des Landes (2 m Baumgrenze; enthalten in vorhergehender
Fläche). Der Einfluss der Ozeanität auf die Baumgrenze wurde dadurch bestätigt, dass
IV
zunehmende Entfernung vom Meer und abnehmender Chlorgehalt im Grundwasser mit
ansteigenden Baumgrenzen einhergingen. Die Ergebnisse der Holzchloranalyse waren
jedoch unschlüssig. Der Durchmesserzuwachs an der Baumgrenze stieg in den letzten
Jahrzehnten (in denen sich das Klima in Island erwärmt hat) drastisch an und
abnehmende Baumalter von der Artgrenze, über die 1 m hin zur 2 m Baumgrenze
ließen darauf schließen, dass sich die Baumgrenze nach oben bewegt. Die letzte
Aussage wurde durch die Tatsache unterstützt, dass Sämlinge an der Artgrenze
gefunden wurden.
Die potentielle Waldfläche für die Moorbirke in Island war größer als die
vorhergehender Studien. Dies unterstützt die Hypothese, dass ausgedehnte
Birkenwälder Island vor der Besiedlung bedeckten. Weil die Konsequenzen der
gegenwärtigen Erwärmung bereits an den Baumgrenzen festgemacht werden konnten,
werden sowohl schnelleres Wachstum für das Baumgrenzökoton als auch dessen
Verschiebung in höhere Höhen für die Zukunft vorausgesagt.
Stichwörter: Moorbirke, Baumgrenze, Baumgrenze, Artgrenze, Island, Ozeanität,
Holzchlorgehalt, Klimawandel.
V
Acknowledgements
This diploma thesis was carried out with financial help from the German Academic
Exchange Service (DAAD). I thank the Icelandic Agricultural University (LBHÍ) for
letting me use its equipment and office space as well as for paying the gas for my field
trips. I thank the Icelandic Forestry Service (Skógrækt ríkisins) for letting me use the
house and the equipment in Mógilsá.
I thank everyone who has contributed to the successful outcome of this study with
either good advice or generosity:
Aðalsteinn Sigurgeirsson, Andreas Roloff, Arnlín Óladóttir, Arnór Snorrason, Halldór
Björnsson, Hanna Kata and Raggi, Hörður Kristinsson, Jóna Sigurbjörg Óladóttir, Jörn
Appelt, Kjartan Kjartansson, Lárus Heiðarsson, Ólafur Eggertsson, Richard Middleton,
Sigmar Metúsalemsson, Sigurður Blöndal, Timo Wöll, Þorbergur Hjalti Jónsson, Þór
Þorfinnsson, Þröstur Eysteinsson.
My special thanks go to the following four:
Björn Traustason who helped me a great deal in understanding ArcGIS.
Loftur Þór Jónsson who has been really generous.
Guðrún for the trip to Timburvalladalur and all her support during the whole process.
Bjarni Diðrik Sigurðsson for his invaluable help both out in the field and in structuring
this study. Without his firm belief in the good outcome of this study, finishing it would
have been much harder and finishing it decently would have been out of the question.
List of figures ............................................................................................................. 119
List of tables ............................................................................................................... 123
Word of honour (Erklärung über die selbständige Erarbeitung) .................................. 124
1
1 Introduction
1.1 General remarks
1.1.1 Physiography of Iceland
Iceland is a 103,000 km2 volcanically active island situated on the Mid-Atlantic Ridge,
where the boundaries of the American and Eurasian tectonic plates are constantly
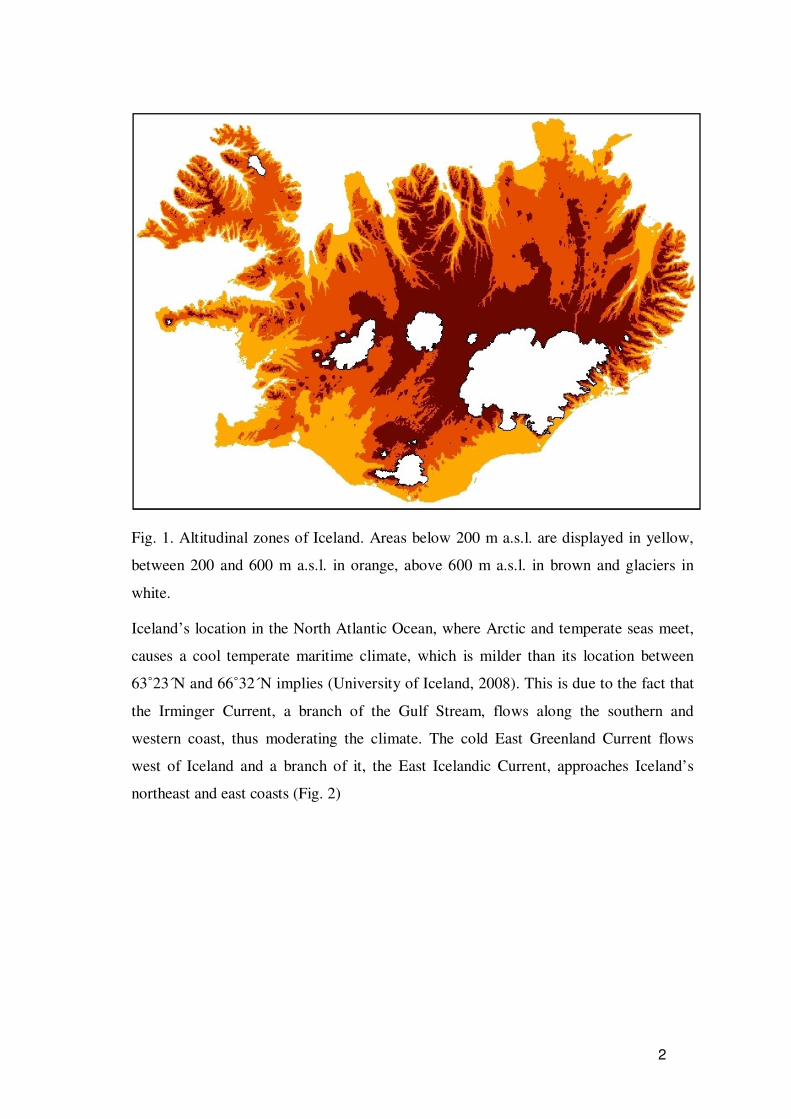
spreading apart. Only 24 % of Iceland lies below 200 m a.s.l. and 37 % lies above 600
m a.s.l. (Fig. 1). Volcanic eruptions leading to wide spread volcanic ash deposits are
frequent in Iceland. For that reason the parent material of all Icelandic soils is volcanic
in origin and most of the soils are classified as Andosols (O. Arnalds, 2004). Andosols
have certain properties such as low cohesion and bulk density, as well as high water
holding capacity, which make them susceptible to erosion (Agricultural Research
Institute of Iceland, 2008). Besides volcanic ash deposits there are also vast sandy areas
along glacial floodplains and near glacial margins. Both volcanic and glacial deposits
are subject to intense eolian activity. Wherever vegetation occurs it stabilizes eolian
materials on the surface leading to soil accumulation (Agricultural Research Institute of
Iceland, 2008). Where there is no vegetation, soils are subject to wind erosion. 35 to 45
% of Iceland today is covered with desert areas that have unstable soils (O. Arnalds and
Kimble, 2001). According to O. Arnalds (2004) Icelandic soils are divided into
different soil types. Histosols are dominated by organic material with an organic C
content bigger than 20 % and can be more than 7 m deep. Histic Andosols appear in
poorly drained areas and have an organic C content between 12 and 20 %. Gleyic
Andosols dominate wetland areas and show oxidation/reduction features. Like Gleyic
Andosols, Brown Andosols have an organic C content between 1 and 12 % but appear
in freely drained areas. Vitrisols or Vitric Andosols (World Reference Base for Soil
Resources) often contain less than 1 % carbon and have very little plant cover.
2
Fig. 1. Altitudinal zones of Iceland. Areas below 200 m a.s.l. are displayed in yellow,
between 200 and 600 m a.s.l. in orange, above 600 m a.s.l. in brown and glaciers in
white.
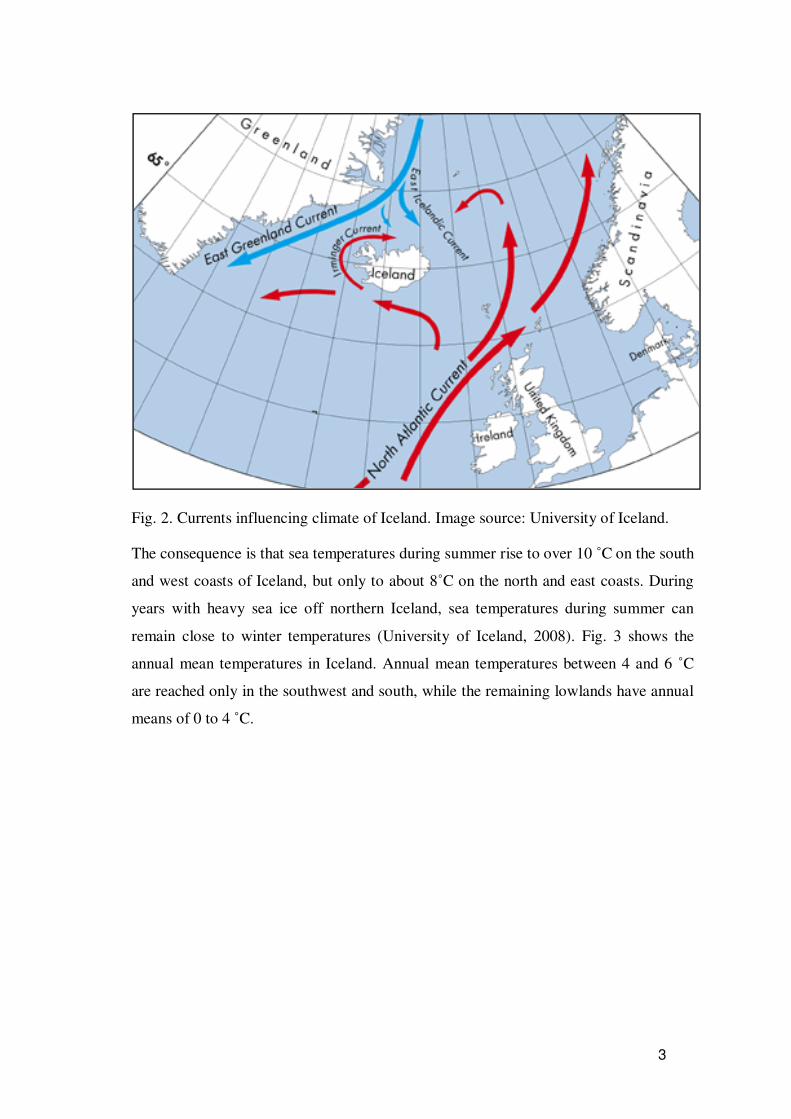
Iceland’s location in the North Atlantic Ocean, where Arctic and temperate seas meet,
causes a cool temperate maritime climate, which is milder than its location between
63˚23´N and 66˚32´N implies (University of Iceland, 2008). This is due to the fact that
the Irminger Current, a branch of the Gulf Stream, flows along the southern and
western coast, thus moderating the climate. The cold East Greenland Current flows
west of Iceland and a branch of it, the East Icelandic Current, approaches Iceland’s
northeast and east coasts (Fig. 2)
3
Fig. 2. Currents influencing climate of Iceland. Image source: University of Iceland.
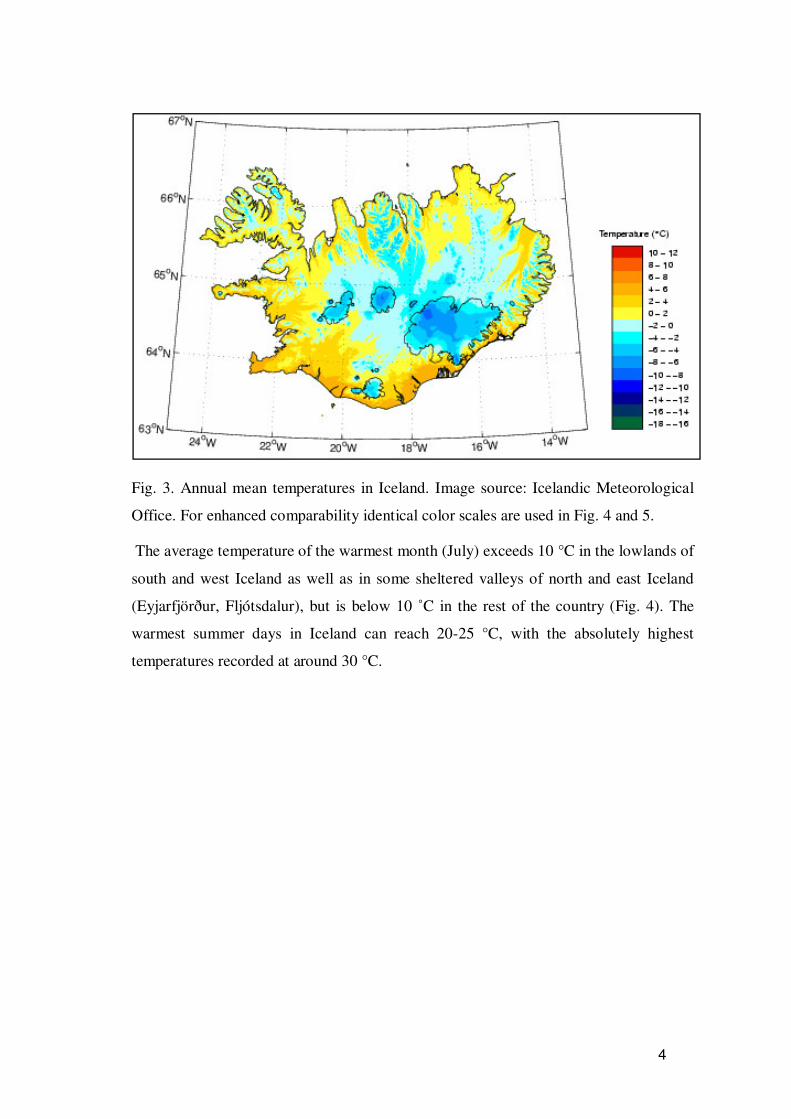
The consequence is that sea temperatures during summer rise to over 10 ˚C on the south
and west coasts of Iceland, but only to about 8˚C on the north and east coasts. During
years with heavy sea ice off northern Iceland, sea temperatures during summer can
remain close to winter temperatures (University of Iceland, 2008). Fig. 3 shows the
annual mean temperatures in Iceland. Annual mean temperatures between 4 and 6 ˚C
are reached only in the southwest and south, while the remaining lowlands have annual
means of 0 to 4 ˚C.
4
Fig. 3. Annual mean temperatures in Iceland. Image source: Icelandic Meteorological
Office. For enhanced comparability identical color scales are used in Fig. 4 and 5.
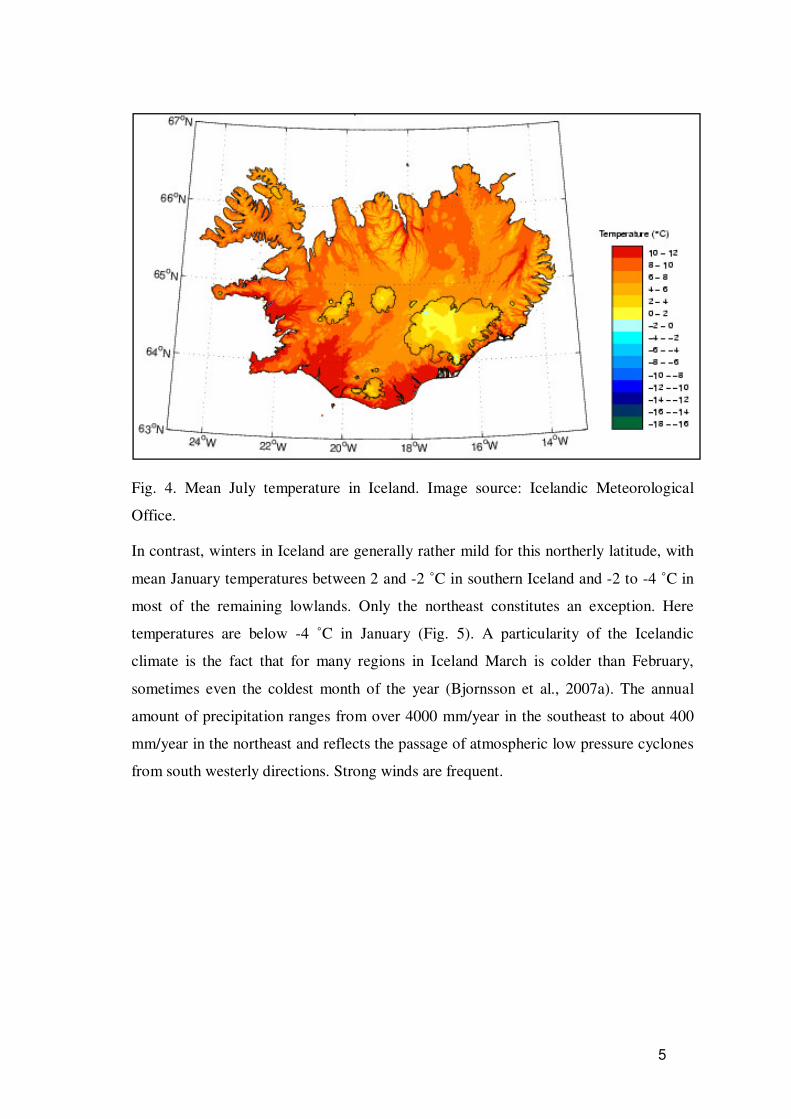
The average temperature of the warmest month (July) exceeds 10 °C in the lowlands of
south and west Iceland as well as in some sheltered valleys of north and east Iceland
(Eyjarfjörður, Fljótsdalur), but is below 10 ˚C in the rest of the country (Fig. 4). The
warmest summer days in Iceland can reach 20-25 °C, with the absolutely highest
temperatures recorded at around 30 °C.
5
Fig. 4. Mean July temperature in Iceland. Image source: Icelandic Meteorological
Office.
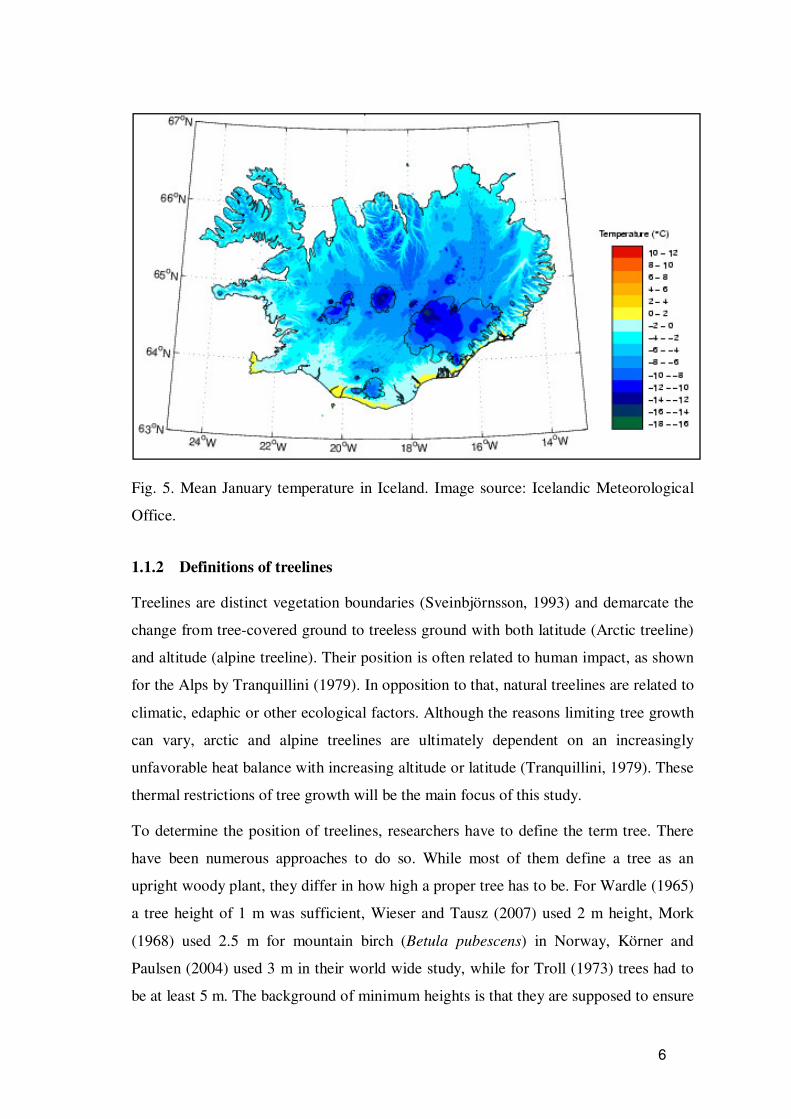
In contrast, winters in Iceland are generally rather mild for this northerly latitude, with
mean January temperatures between 2 and -2 ˚C in southern Iceland and -2 to -4 ˚C in
most of the remaining lowlands. Only the northeast constitutes an exception. Here
temperatures are below -4 ˚C in January (Fig. 5). A particularity of the Icelandic
climate is the fact that for many regions in Iceland March is colder than February,
sometimes even the coldest month of the year (Bjornsson et al., 2007a). The annual
amount of precipitation ranges from over 4000 mm/year in the southeast to about 400
mm/year in the northeast and reflects the passage of atmospheric low pressure cyclones
from south westerly directions. Strong winds are frequent.
6
Fig. 5. Mean January temperature in Iceland. Image source: Icelandic Meteorological
Office.
1.1.2 Definitions of treelines
Treelines are distinct vegetation boundaries (Sveinbjörnsson, 1993) and demarcate the
change from tree-covered ground to treeless ground with both latitude (Arctic treeline)
and altitude (alpine treeline). Their position is often related to human impact, as shown
for the Alps by Tranquillini (1979). In opposition to that, natural treelines are related to
climatic, edaphic or other ecological factors. Although the reasons limiting tree growth
can vary, arctic and alpine treelines are ultimately dependent on an increasingly
unfavorable heat balance with increasing altitude or latitude (Tranquillini, 1979). These
thermal restrictions of tree growth will be the main focus of this study.
To determine the position of treelines, researchers have to define the term tree. There
have been numerous approaches to do so. While most of them define a tree as an
upright woody plant, they differ in how high a proper tree has to be. For Wardle (1965)
a tree height of 1 m was sufficient, Wieser and Tausz (2007) used 2 m height, Mork
(1968) used 2.5 m for mountain birch (Betula pubescens) in Norway, Körner and
Paulsen (2004) used 3 m in their world wide study, while for Troll (1973) trees had to
be at least 5 m. The background of minimum heights is that they are supposed to ensure
7
that the tree’s crown is coupled to the atmosphere and exposed to the prevailing winds
as well as not completely covered in snow during winter. Thus Holtmeier (2003) was
consequent when he used the average depth of winter snow pack as required tree
height. Although it is questionable whether a tree of 1.8 m height experiences
dramatically different conditions when compared with one that is 2.2 m, strict
definitions ensure that research results are comparable and repeatable. Therefore strict
definitions are used in this study, too (cf. chapter 2.2). However, there is consent about
two definitions: the tree species limit demarcates the uppermost (or northernmost)
outposts of individuals (Körner, 1999) and the forest line defines the border of closed
continuous forest. The altitudinal zone between species limit and forest line is
commonly called treeline ecotone (e.g. Holtmeier, 2003; Wieser and Tausz, 2007).
Trees with climatically induced stunted growth form above the treeline are referred to
as krummholz (Holtmeier, 2003).
1.1.3 Mountain birch belt
Betula pubescens is a European species which includes two subspecies. While
subspecies pubescens Ehrh. can grow up to 25 m in height, subspecies tortuosa
(Ledeb.) Nyman, also called mountain birch, is a shrub or low tree which is believed to
be the result of introgressive hybridization with the dwarf shrub Betula nana (Thórsson
et al., 2007). There are other names for the latter subspecies, e.g. subspecies
czerepanovii (Karlsson et al., 2004). In Iceland there is extensive and continuous
morphological variation in birch (Thórsson et al., 2007). For that reason in this study
tree birch in Iceland is not divided into subspecies, but is treated as Betula pubescens
sensu lato. There is a great variation in growth habit of birch not only in Iceland but
also in Fennoscandia, featuring monocormic and polycormic growth forms (Aradottir,
Thorsteinsson and Sigurdsson, 2001; Sveinnbjörnsson, 1993). The polycormic growth
is partly due to introgressive hybridization with B. nana (Sveinnbjörnsson, 1993) but is
also associated with basal sprouting after browsing by herbivores and nutrient poor
soils (Wielgolaski and Sonesson, 2001).
Mountain birch forms a distinct subalpine belt above the montane coniferous forests in
Fennoscandia, which extends on average for 100 to 150 vertical meters (Kullman,
1998). According to Sjörs (1971) this belt represents neither an unstable stage of
8
succession nor a cultural product, but a relatively stable final stage of vegetational
development. Thus mountain birch forms both the arctic and alpine treelines in
Fennoscandia with the exception of the eastern parts of northern Finland (Treter, 1984).
Today the highest limit of birch forests is found near Jotunheimen in south Norway at
1320 m a.s.l. (Aas and Faarlund, 2001). From there climatic treelines descend in all
directions, most rapidly, though, towards the North Atlantic coast of western Norway.
The northernmost occurrence of mountain birch can be found in Oksefjord at 7054´ N.
The species migrated into southern Scandinavia after the late glacial time before 12,000
B.P. (Aas and Faarlund, 2001). About 1,000 years later it had already reached the
northernmost part of Fennoscandia at 71 N. The historically highest treeline in
Fennoscandia has been dated back to 8,500 B.P. and is placed about 150 m above
today´s treeline (Wielgolaski and Sonesson, 2001). The occurrence of the birch belt
above the coniferous forest of Picea abies and Pinus sylvestris is mainly attributed to
climatic oceanity (Wielgolaski and Sonesson, 2001). Mountain birch grows at lower
summer temperatures than spruce and pine in Fennoscandia (Wielgolaski and
Sonesson, 2001). Wielgolaski (2003) also found that high humidity favors the time of
leaf bud break in mountain birch more than in other deciduous tree species in
Fennoscandia, thus prolonging the growing season. Another indicator for the role of
oceanity is Treter´s (1984) observation that the width of the mountain birch belt in
Fennoscandia decreases from west to east, i.e. with decreasing oceanity. Outside
Fennoscandia mountain birch is growing on the Kola peninsula and in Iceland. In
Iceland it is the only forest forming indigenous tree species (Kristinsson, 1995).
Furthermore, birch is also found east of the Kola peninsula but taxonomy is very
unclear and many taxa may be involved (Wielgolaski, 2005) The birch growing in
sheltered valleys in southwestern Greenland is often treated as mountain birch,
although there is strong hybridization with the American Betula glandulosa Michx.
(Wielgolaski, 2005).
1.1.4 Pre-settlement history of birch woodlands
Hallsdóttir (1995) researched the pre-settlement vegetation history of Iceland, i.e. the
time span between the last deglaciation and the arrival of the first settlers in ca 850
A.D. Her findings are based on pollen assemblages in lake sediments and peat as well
as on mega fossils (e.g. tree stumps) and will be summarized here. After deglaciation
9
between 11000 and 10000 years B.P. succession was slow, and for more than a
millennium high to middle treeless arctic flora prevailed. This was mainly due to slow
immigration of other species caused by Iceland’s isolated location and the unfavorable
conditions for tree growth. Around 9200 B.P. heath was established on Skagi peninsula
in Northern Iceland and after 8500 B.P. pollen of Birch (Betula pubescens) appeared
more frequently. In the following centuries conditions in northern Iceland were similar
to today and birch was established in the inner fjords and valleys. Birch extension was
halted in the 8th millennium B.P. and heaths of Salix spp., Juniperus communis and
Betula nana covered a bigger portion of the land. The development in southern Iceland
is less clear due to limited data. Between 7200 and 6000 B.P. conditions were more
favorable for birch growth again and north Iceland was more densely forested than ever
before or afterwards. After this optimum there was a drastic drop in the birch pollen
accumulation rate (PAR), indicating a retrogressive succession towards more open
woodlands with abundant ferns and broadleaved herbs. Heaths and peat lands colonized
more land again during the latter Holocene. A woodland expansion for the time
between 2800 B.P. and the time of settlement is indicated by an increase of the relative
share of birch pollen, without an increase of birch PAR (Hallsdóttir, 1995). Ólafsdóttir
et al. (2001) contradict the hypothesis that the woodland was in expansion before the
time of settlement. With the help of a model described further below they yield a
drastic decrease in forest cover after 2500 B.P.
Which species formed the treelines before settlement and how high were the treelines?
Pollen of rowan (Sorbus aucuparia) was first found around 5500 B.P. and its pollen
curve thereafter is discontinuous and seldom reaches 1%. Nevertheless it cannot be
excluded that rowan was present long before and is under-represented due to the fact
that it is zoogamous. The pollen of the indigenous, but rare aspen (Populus tremula)
has not yet been found in pollen records. During the Holocene birch was the only tree
species that formed woods in Iceland and subsequently the natural tree line. Almost no
data exists on how high the birch treelines might have reached in prehistoric times.
However, the uppermost pollen of Betula was found at the site Tjarnarver south of the
glacier Hofsjökull at an altitude of about 600 m a.s.l., which indicates pre-settlement
birch forests in the vicinity (Hallsdóttir, 1995).
10
Scholars are in disagreement not only about the millennia before the settlement, but
also about the state and extent of Icelandic birch woodlands at the time of settlement.
While Ari the Learned (1068-1148) described the land the first settlers found to be
covered with woods between the seashore and the mountains (Íslendingabók-
Landnámabók, 1968), recent estimations range from 8 % woodland cover (Ólafsdóttir,
2001) to almost 40% (Bjarnason, 1974). However most estimates are in the range of 20
to 30 % and are based on historical records, pollen analyses, old place names and
current distribution of woodlands (Hallsdóttir, 1995; Kristinsson, 1995). Kristinsson
(1995) gives a description of the extent of the woodlands the settlers must have found.
He assumes that regions above 500-550 m a.s.l. were without forests, and that regions
between 300 and 500 m a.s.l. were often woodless as well. He also assumes an oceanic
treeline towards stormy coasts and names Reykjanes peninsula in the southwest and
Melrakkaslétan peninsula in the northeast as examples and assumes that other sites
without birch forests included steep slopes with loose material or periodically flooded
areas along glacial rivers.
1.1.5 Post-settlement history of birch woodlands
The settlers cut and burned the existing woodlands to create space for farming. They
also used the wood as building material, fodder, fuel and for charcoal production. Little
measures were taken to afforest clear-cut land, and natural regeneration was inhibited
by grazing domestic herbivores (A. Arnalds, 1987). As a consequence widespread
ecosystem degradation and soil erosion are likely to have started soon after the
settlement. Ólafsdóttir et al. (2001) suggest that the forest extent was already in decline
at the time of Viking settlement. In their opinion erosion and landscape change were
not a consequence of cutting the woodlands and inhibiting their regeneration, but were
already occurring and only reinforced by anthropogenic factors. Either way, birch
woodlands reached their postglacial minimum at the beginning of the 20th century
when it covered about 1 % of total land area (Aradóttir and Eysteinsson, 2005). In 1907
legislation was passed to protect some of the remaining woodlands and to create new
forests. In the following decades some remaining birch woodlands were protected from
grazing (Aradóttir and Eysteinsson, 2005).
11
Today around 15 % of birch woodlands are fully protected from grazing (Eysteinsson,
1999), most of them in national parks and nature reserves (Nature Conservation
Council, 1996). Although today birch use for livestock fodder is marginal and winter
grazing is rather uncommon, most native birch woodlands are open for summer sheep
grazing, which continues to prevent expansion of woodlands outside protected areas
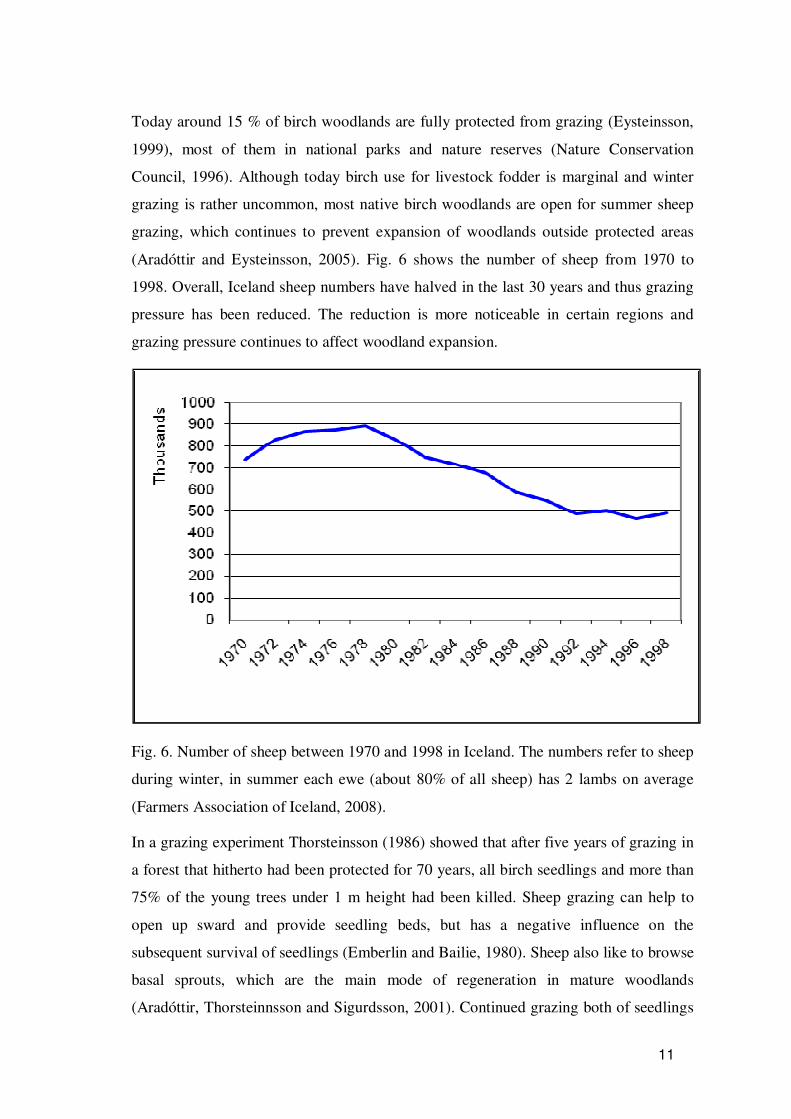
(Aradóttir and Eysteinsson, 2005). Fig. 6 shows the number of sheep from 1970 to
1998. Overall, Iceland sheep numbers have halved in the last 30 years and thus grazing
pressure has been reduced. The reduction is more noticeable in certain regions and
grazing pressure continues to affect woodland expansion.
Fig. 6. Number of sheep between 1970 and 1998 in Iceland. The numbers refer to sheep
during winter, in summer each ewe (about 80% of all sheep) has 2 lambs on average
(Farmers Association of Iceland, 2008).
In a grazing experiment Thorsteinsson (1986) showed that after five years of grazing in
a forest that hitherto had been protected for 70 years, all birch seedlings and more than
75% of the young trees under 1 m height had been killed. Sheep grazing can help to
open up sward and provide seedling beds, but has a negative influence on the
subsequent survival of seedlings (Emberlin and Bailie, 1980). Sheep also like to browse
basal sprouts, which are the main mode of regeneration in mature woodlands
(Aradóttir, Thorsteinnsson and Sigurdsson, 2001). Continued grazing both of seedlings
12
and basal sprouts can cause the disappearance of birch at a given site and change the
vegetation composition from herb - rich forests to grasslands or heath lands covered by
dwarf shrubs and mosses. Further degradation can lead to soil erosion, which removes
the fertile Andosols (Aradottir and O. Arnalds, 2001). Grazing does not only affect the
birch forests but also the mountain sides above the treeline. Willows and other shrubs,
which are crucial for maintaining the soil in steep slopes, are browsed by sheep and
often replaced by grassy slopes. The consequence is that soil begins to slide down and
the originating scars are open to wind erosion (Kristinsson, 1995). Such processes can
affect existing treelines and reduce their elevation, so it is, at least temporally, found
below its climatic equilibrium.
In 1990, the woodland and forest area in Iceland was estimated to be 129,000 ha (1,290
km2) or approximately 1.3% of the total land area (Snorrason et al. 2005). An earlier
estimate was about 116,500 ha or 1.1% of total land area (Guðjónsson and Gislason,
1998). It has to be stated that most of the Icelandic birch woodlands are below 2 m in
height. Bjarnason et al. (1977) estimated after an inventory of Icelandic forests that
81% of birch woodlands were below 2 m in height, 15% between 2 and 4 m and 4%
higher than 4 m (2% between 4 and 8 m and 2% higher than 8 meters). Traustason and
Snorrason (2008) recalculated that data and estimate that almost 80% of Icelandic birch
woodlands are still below 2 m in height.
13
1.2 Literature review of treeline research
1.2.1 Physiological mechanisms at treeline
There are competing hypotheses which try to explain why tree growth is limited both at
high altitudes and latitudes, i.e. “the mechanisms whereby growth, reproduction and
survival of trees are limited at the treeline are not properly understood” (Grace et al.,
2002, p. 538). The following overview of hypotheses is based on reviews by Wieser
and Tausz (2007) as well as Körner (1998, 1999). Hypotheses explaining growth
limiting mechanisms at treeline are:
1. Climatic stress hypothesis
2. Disturbance hypothesis
3. Carbon balance hypothesis
4. Growth limitation hypothesis
5. Nutrient limitation hypothesis
6. Limited regeneration hypothesis
The climatic stress hypothesis suggests that success of trees at high elevations depends
on the ripening of their shoots. In other words, completion of growth resulting in
lignified cell walls and the development of a thick cuticle allows trees to survive low
temperatures and freeze dehydration (Wieser et al., 2007). Injury through low
temperatures therefore consists i.e. in winter desiccation and frost damage. While the
latter concerns most tree species and is most severe when frosts occur during the
growing season, the former threatens evergreen trees in winter.
The disturbance hypothesis assumes that mechanical damage by wind, ice blasting,
snow break, avalanches or herbivory outweigh growth at low temperatures prevailing at
treelines. Cairns and Moen (2004) stressed the modulatory effect of herbivory, saying
that it can have both positive and negative effects on treeline position.
14
The carbon balance hypotheses: carbon uptake or the balance between uptake and loss
are supposed to be insufficient to support maintenance or minimum growth. Outside the
tropics carbon balance is also affected by season length and respiratory losses during
winter dormancy.
The growth limitation hypotheses: Körner (2003) found higher concentrations of non-
structural carbohydrates in treeline trees and suggested that they originate from the fact
that growth, as a carbon sink, is limited. He assumed that there is a threshold
temperature that permits sufficient production of new cells and the differentiation of
functional tissue which is unrelated to carbon gain. However, Sveinbjörnsson (2000)
interpreted high carbohydrate concentrations of treeline trees as acclimation to the
hazards of an extreme environment with high risks of tissue losses.
Nutritional limitation hypothesis: soil nutrient availability has also been shown to affect
tree growth at its upper limit and Holtmeier (2003) shows that treeline ecotones are
characterised by a mosaic of different soil types, due to differences in microclimate and
vegetation cover and suggests a strong below ground control of treeline position.
Limited regeneration hypothesis: the preceding hypotheses deal primarily with the
resistance to harsh environmental conditions of an already established tree. The limited
regeneration hypothesis suggests that regeneration of established treelines is inhibited
due to problems in the reproduction process. Either pollination, pollen tube growth,
seed development, seed dispersal, germination or seed establishment cannot take place
(Körner, 1998). For mountain birch there are different views about the frequency of
viable seed production: while Sveinbjörnsson et al. (2002) suggested that the proportion
of viable seeds is very small, Treter (1984) believed that more than 50% of all birch
seeds produced at birch treeline sites of Fennoscandia are viable.
Körner (1998, 1999) separated between modulative (regional) and fundamental (global)
hypotheses for treeline positions. He suggested that only the growth limitation
hypothesis is a common driver for treelines throughout the world, while any other
hypothesis has only regional explanatory power. Wieser et al. (2007) proposed that at a
given site a multitude of factors control treeline position and enumerated temperature
caused limitations in growth as well as incomplete tissue maturation and inadequate
resistance to climatic stress.
15
1.2.2 Effects of temperature on treeline
There is considerable evidence that treelines around the world are primarily limited by
heat deficiency (Holtmeier, 2003). For example south facing slopes have higher
treelines than north facing slopes and treeline decreases in elevation with increasing
latitude (Richardson and Friedland, 2007). Furthermore the existence of altitudinal
treelines can be correlated to decreasing air temperature with altitude on a coarse scale,
at the very least. However, in what ways temperature affects treelines is more polemic
(cf. the theories regarding treeline mechanisms described above), e.g. how does
temperature limit photosynthesis, reproduction, growth or other physiological
processes? To approach this question it is important to differentiate between air or
canopy and soil temperature, because air temperature has direct effects on all
hypotheses but number 2 and 5, while soil temperature affects mainly hypotheses 4 and
5. Hecht et al. (2007) found that mean soil temperatures were significantly lower than
mean air temperatures during the whole growing season at birch treeline sites in
Iceland, when they were covered with thick moss layers. Körner et al. (2004) showed
that soil temperature at 10 cm depth follows air temperature with decreased amplitude,
i.e. soils are warmer than air at low temperatures and cooler at high temperatures.
The effects of temperature on some of the hypotheses described will be reviewed
below. Low temperatures result in low maximal photosynthetic rates, i.e. high elevation
trees photosynthesise at 30-50 % lower rates than low elevation trees (Grace, 1989).
Guðmundsdóttir and Sigurðsson (2005) showed that the photosynthetic capacity of
mountain birch in Iceland at a leaf temperature of 10 ˚C is only 43 % of its optimum at
35 ˚C. Together with a shorter growing season at higher elevations, which is also
thermally caused, low carbon fixation is fully consumed by respiratory losses and the
production of new leaves and fine roots so no carbon is left over for wood production.
This theory also provides an explanation for the transition zone from vertical trees to
Krummholz commonly found at treelines. The ratio between photosynthetic tissue and
total biomass decreases with increasing tree size and trees that protrude from the
boundary layer of dwarf vegetation experience lower meristem temperatures due to
decreased radiation and increased windspeed (Richardson and Friedland, in press).
Trees at treeline have lower maximal rates of photosynthesis. This, however, does not
exclude the possibility that carbon fixation integrated over the whole growing season
16
can be quite high. For example showed Wieser (1997) for Pinus cembra that the carbon
loss measured during winter is compensated by the photosynthetic production of only
one to two warm summer days. Havranek and Tranquillini (1995) showed that the
respiratory loss of Larix decidua during the leafless period from October to April is
only 2.3% of its annual carbon gain (photosynthesis).
The growth limitation hypotheses assumes that there is a certain temperature threshold
below which cell division and differentiation into functional tissue is inhibited (Körner,
1998). In contrast to the carbon limitation hypothesis temperatures are deemed to be
high enough for sufficient carbon gain. Indeed, Grace et al. (2002) showed no growth
for Pinus sylvestris at 5˚C, although photosynthetic rates were still 30% of the rate at
20˚C. Körner et al. (2004) suggest that shoot expansion at treelines cannot occur during
cold nights and root growth is impaired by self-shading of treeline trees.
Lower temperatures during summer also affect soil decomposition and nutrient release
as well as nutritional uptake (Hobbie, 1996). These processes are further impeded by
self-shading of trees. Karlsson and Weih (2001) showed that the prevailing soil
temperatures under tree crowns at treeline reduce the nitrogen accumulation of
mountain birch seedlings, thus reducing their chance of survival during the first winter.
The climatic stress hypotheses is also related to temperature, since a short growing
season is deemed responsible for the fact that newly formed tissues are unable to fully
develop (Wardle, 1965) and hence are subject to frost related damage (winter
desiccation, frost damage etc.).
To recapitulate: it can be said that all hypotheses described in this chapter have in
common an attempt to explain how plants react to insufficient thermal input at certain
elevations.
1.2.3 Temperature parameters used in treeline research
There have been many approaches which have tried to correlate temperature data and
treeline positions using lapse rates to calculate temperature decrease with increasing
altitude. Treelines have repeatedly been stated to coincide with a mean air temperature
of the warmest month of about 10 ˚C (Brockmann-Jerosch 1919; Daubenmire 1954; in
Körner, 1998). Another simple approach is to correlate treeline position with thermal
17
growing season length, e.g. the number of days above 5 ˚C (Malyshev, 1993).
Fennoscandian and Icelandic treelines have been linked to the mean temperature of the
three warmest months of the year (Aas, 1964; Aas and Faarlund, 1996; Jónsson, 2005;
Odland, 1996) as well as to the four warmest months of the year (Ragnarsson, 1969;
Slettfjord, 1993). The former corresponds with the length of the growing season at most
treeline sites in Fennoscandia and is thus comparable to Körner’s approach (1998) to
reviewing mean growing season air temperatures for treeline positions around the
world. Another approach was carried out by Gansert (2004). He calculated a minimal
thermal time requirement for the differentiation of new tissue for Betula ermanii using
degree days. For that he summed up all daily minimum temperatures of a growing
season above 5.5˚C. The approach by Mork (1968) demands temperature data with
hourly resolution. He found a correlation between daily afternoon temperatures and
daily height increment for the spruce and birch treelines in Norway. He defined the
height increment of a day with a mean temperature of 8 ˚C for the six warmest hours as
one growth unit (GU) and showed that in order for birch to survive in the long run, it
needed a certain amount of GU (cf. chaper 1.2.7). Bergþórsson (1985, 1996) modified
Mork´s approach so it could be based on monthly temperature data and applied it to
mountain birch in Iceland. Treter´s approach (1984) is based on tree ring analysis: he
made a regression analysis using ring width as a dependent variable and different
temperature parameters as independent variables. He extrapolated his data to ring
widths of zero and established the respective temperature values as thresholds for zero
growth.
All these studies have a common flaw in that “trees do not read thermometers”
(Bowling, 1993, p. 192), e.g. trees experience temperature in another way than it is
measured by meteorological stations, which are often several hundred meters below
and kilometres away from treeline sites. Important for tree growth are temperatures of
photosynthesing tissues as well as of cambial and root tissues (Bowling, 1993).
Furthermore temperatures at treeline sites are influenced by micro site and relief
conditions, which often differ from those at respective meteorological stations.
Although temperatures of tree crowns are close to air temperature (Körner, 1998), trees
themselves have an effect on the soil temperature they experience e.g. through self-
shading. Therefore there have been recent studies that tried to establish temperatures as
the tree experiences them, e.g. Guðmundsdóttir and Sigurðsson (2005) who measured
18
photosynthetic activity with respect to leaf temperatures. Mook and Vorren (1996)
measured different air and soil temperature parameters at treeline sites in northern
Norway. Körner et al. (2004) measured root zone temperatures at treelines around the
world and then correlated soil growing season temperatures with treeline positions.
Karlsson and Weih (2001) studied root zone temperature at a birch treeline site in
northern Sweden.
One problem of correlating temperature with treeline positions that is common to both
approaches is pointed out by Körner (1998), namely that treelines might correlate with
a certain mean temperature, but are influenced also by other factors such as seasonal
and diurnal amplitudes of temperature, duration of growing season, solar angles and
peak radiation. Another thing that has to be considered is that past rather than present
climates determine the position of treelines (Körner, 1998), a fact that cannot be
neglected even when dealing with a short-lived pioneer species like mountain birch,
due to its capability for vegetative regeneration.
1.2.4 Effects of oceanity on treelines
Körner (1998) reports that average seasonal temperatures for treeline sites on oceanic
islands differ from means at more continental sites. For example are the means for the
Cairngorns in Scotland and for Mauna Kea in Hawaii are at least 3 ˚C above those for
mainland mountain ranges. Aas and Faarlund (1996) found the birch treeline in Norway
to correlate with a tritherm of 9.6˚C on the western slope of the Scandes in Norway but
with only 8.2˚C on the eastern slope. Aas and Faarlund (2001) showed that the altitudes
of birch treelines in Fennoscandia were highest in central south-eastern Norway where
the terrain provides sheltered places at high levels. Towards the coast the treeline
altitude drops from 1200 to 500 m a.s.l. within 100 km at the same latitude, while it
only drops to 800 m a.s.l. towards the east. As one possible reason for this, Körner
(1998) enumerates the use of temperature means. Island climates as well as oceanic
climates in general are fairly buffered in contrast to more oscillating mainland climates.
Because of this the use of mean temperatures does not take into account the fact that
high temperatures are proportionally more influential on growth (Mork, 1968). That
similar average temperatures during summer go along with higher diurnal and annual
amplitudes at more continental sites can also be interpreted from a research conducted
19
by Odland (1996). He shows that the forest line in Norway increases in altitude from
east to west, e.g. towards a more continental climate, and that this increase in altitude
outweighs the increase of July temperatures in the same direction. Kjällgren and
Kullman (1998) showed that treeline altitude in the southern Swedish Scandes
increased in relation to distance with the sea.
While smaller diurnal and annual temperature amplitudes (at given latitude) can be
classed under the general term climatic oceanity, a short distance to the sea coincides
with further environmental conditions. Therefore Körner (1998) gives one more
possible explanation for the trend described above: above ground organ temperatures
might be lower at oceanic sites due to greater cloudiness, e.g. less radiation energy and
higher wind speeds. Holtmeier (2003) also states that wind reduces temperature
differences between plants and ambient air, thus reducing the temperature plant tissues
experience on warmer days. Treter (1984) showed that trees that were more exposed to
wind grew more slowly than trees of the same altitude in sheltered sites. Wind affects
tree growth not only physiologically but also mechanically (Holtmeier, 2003). Besides
breakage and wind throw, increased foliage loss can be the consequence of heavy
winds. Sveinbjörnsson et al. (1996) reported that foliage loss for mountain birch
growing at treeline, caused by a snowstorm in early summer, reduced seasonal carbon
gain by more than 90%. Another effect of wind is more pronounced drying, particularly
on rapidly draining substrates and if intense grazing and trampling have destroyed the
plant cover (Holtmeier, 2003).
Short distance to sea also coincides with a higher probability of exposition to marine
aerosols. Marine aerosols may cause foliar necrosis and shoot dieback (Jónsson, 2006).
In Iceland strong onshore winds during the dormant season deposit salt on aerial plant
parts, which is absorbed into the shoots in form of chlorine (Jónsson, 2002). Jónsson
(2002) reports that tree growth is severely restricted and heavily dependent on local
shelter in areas of high salt deposition (areas with more than 10 ppm chlorine in
groundwater). Salt stress could lead to a depression of the treeline in an environment
like Iceland, which is already marginal for tree growth (Bergþórsson et al., 1987).
20
1.2.5 Growth dynamics of treelines
In this study, dynamics of treelines comprise altitudinal treeline fluctuations as well as
changes in growth parameters (ring widths) inside the already established treeline
ecotone. Changes of density parameters inside the treeline ecotone will not be regarded.
Treeline fluctuations in Fennoscandia during the Holocene have been reviewed by Aas
and Faarlund (2001). Vorren et al. (1996) suggest pronounced oscillations of forest line
in N-Norway. They suggest that the forest line between 8000 and 5000 B.P. was about
200 m higher than it is today. For Scots pine in Scandinavia Kullman and Kjällgren
(2000) found forest remnants 500 m above the current pine treeline. Jónsson (2005)
suggests less altitudinal change during the same period for the birch treeline in Iceland.
He explains the stable treeline in this way: the treeline advances only when the tritherm
exceeds the threshold for sexual regeneration (which he assumes is 9.2˚C) but does not
recede again until the tritherm falls below the threshold for sufficient birch growth
(which he assumes is 7.6 ˚C). Thus, the treeline remains stable when summer
temperatures are between 7.6 and 9.2 ˚C. Hallsdóttir (1995) suggests an optimum for
birch growth in Iceland from 7000 to 6000 B.P. and a decline in birch woodland area
afterwards.
Treeline fluctuations can be due to two things: either to the establishment of new
seedlings above the treeline or to the fact that previously established trees exceed a
differently defined treeline height during a certain period. The 40 m rise of Norwegian
birch treelines between 1918 and 1968 recorded by Aas (1969) is caused by the fact
that previously established birches reached tree height as defined by the author during
said period. Thus the fluctuation of treelines is the result of phenotypic response of
individual trees to more favorable conditions, whereas true advance of tree growth to
higher altitudes has to be the consequence of sexual regeneration (Holtmeier, 2003).
Kullman (2002) found that approximately 50% of the seedlings he collected at treeline
sites in the Swedish Scandes were viable. Furthermore he recorded recently established
birch saplings at elevations between 1370 and 1410 m a.s.l., whereas previous studies
at the same site noted no saplings above 1095 m a.s.l. Treter (1984) explains advancing
birch treelines in Fennoscandia with increasing summer temperatures and their effect
on early summer snow cover: a sufficient amount of germinable seeds is produced
about every second year, but successful germination is inhibited because long lasting
21
snow cover and melting water reduce soil temperatures during spring and early
summer. Consecutive summers with above average temperatures lead to earlier snow
melt and higher soil temperatures. Seeds can germinate and seedlings can develop.
When climate deteriorates again, saplings are established and can grow into mature
trees. Thus he attributes treeline rises in Fennoscandia to the warm period between
1930 and 1950. The warm period after 1930 is also stressed in dendroclimatological
studies of treeline dynamics. Kullman (1993) and Treter (1984) showed bigger ring
widths during that period and Kullman (2001) showed that most of the stems at a
treeline site in the southern Swedish Scandes emerged in the 1930s, resulting in a
denser treeline ecotone. In Iceland, birch diameter growth was also higher during said
period (Eggertsson and Guðmundsson, 2002).
Projecting treeline dynamics into the future, Holtmeier (2003) suggests that treelines
will advance in response to sustained global warming, but stresses the manifold
restrictions of such a development. Treeline advance would be different due to different
regional and local settings. Because of the local influence of e.g. edaphic and
topographic conditions high elevation forests would not advance in a closed front
towards higher altitudes, but at favorable sites first, while other locations such as
deflated areas could remain treeless for an extended period of time. Other factors such
as droughts, forest fires and mass outbreaks of leaf eating insects would still go on
influencing treelines and their intensity might increase with rising temperatures. On the
basis of Holocene forest history he predicts that global warming will not affect different
tree species in the same way: growth conditions for Scots pine deteriorated from 6000
to 5300 B.P. in the Swedish Scandes while they improved for mountain birch
(Kullman, 1988). He also suggests a time lag of decades to centuries in the response of
treelines to global warming. Kullman’s (2002) findings for mountain birch treelines in
Scandinavia contradict some of Holtmeier’s views. He found the treeline in the
Swedish Scandes to respond quickly to changes in the climate during the 20th century.
At different sites he found receding treelines during a colder period after the middle of
the century but advancing treelines during the two periods 1930-1950 and after the
1980s. Because he found the advances to correlate with periods of warmer summer
temperatures and less hazardous winters, he suggests a greater responsiveness of
treelines to elevated summer temperatures and less frequent frost related injuries. Like
22
Holtmeier (2003) he doubts that the altitudinal advance he found at some sites will
develop on a broad front and attributes this to micro site conditions.
The rise in atmospheric CO2 is also deemed to affect tree growth at high elevations,
especially since high altitudes correlate with low partial CO2 pressures (Wieser et al.,
2007). Experiments at the alpine treeline in Switzerland, where free air was CO2
enriched for three years, showed an increase in photosynthesis in Larix decidua and
Pinus uncinata under elevated CO2. But the enhancement of photosynthesis under
elevated CO2 tended to decline with increasing duration of exposure, indicating a
feedback from other growth-limiting factors (Handa et al., 2005). The only study on the
effect of elevated CO2 on tree growth in Iceland (Populus trichocarpa), clearly showed
that a) the effect on photosynthesis is much reduced at lower temperatures and b) tree
growth only responded to elevated CO2 when nutrient supply was not growth limiting
(Sigurdsson et al., 2001; 2002).
1.2.6 Dendroclimatological research on mountain birch
The following chapter reviews different aspects of dendroclimatological studies on
mountain birch treelines in different parts of Fennoscandia.
Mean ring widths: Treter (1984) researched two treeline areas in S-Norway and N-
Finland. For the Norwegian site he found mean ring widths of individual trees between
0.2 and 0.6 mm/year. His tree ring chronology for the Finnish site shows ring widths
between almost 0 (due to high frequency of missing rings for particular years) and 0.7
mm. For the 110 year long chronology for northern Iceland established by Levanic and
Eggertsson (2008), ring widths varied between 0.25 and 2.25 mm. Karlsson et al.
(2004), who measured ring widths in northern Sweden, found mean ring widths on site
level between 0.32 and 0.64 mm/year.
Ring widths generally differ with tree age. Both Treter (1984) and Karlsson et al.
(2004) found decreasing ring widths with age. Karlsson et al. (2004) calculate the
decrease in ring widths with age by assuming a linear relationship between both and
estimate the age effect to be -8.6 µm/year, while Treter shows the decrease by
establishing different means for different age classes. Kullman (1993), who carried out
tree ring analyses in the southern Swedish Scandes, found that ring widths of birches
established in the 1910s peaked in the 1930s, decreased until 1950, and then stagnated
23
at a low level until the present. The expected trend in ring widths is that at a fixed
growth rate it should continuously decrease as the tree becomes older, since to maintain
the same ring width around an ever-thickening bole would otherwise require a steady
increase in growth rate (amount of wood produced to maintain the same ring width).
However, an opposite trend is usually seen for a certain time after tree establishment as
the growth rate increases more rapidly until canopy closure, when the effect of the
thickening bole sets in.
Ring widths also respond to climate. Levanic and Eggertsson (2008) showed that above
average ring widths are a response to above average temperatures in June and July for
birch in Iceland. They also found a positive correlation of ring width to January and
February precipitation (mostly in the form of snow) and suggested that it has a
favorable effect on birch growth through the availability of enough water in early
spring. Karlsson et al. (2004) take a similar course. The main climatic factors
influencing birch radial stem growth determined by them are (in order of importance):
July, June and May temperature. The influence of May temperature was shown to affect
growth through its influence on the day of budburst and thus on the length of the
growing season. Kullman (1993) also correlated birch radial growth to climate
parameters and found that July temperature of the current year had the most
explanatory power. This was even increased when July temperature of the previous
year was added. Furthermore August temperature correlated well with ring widths, but
early summer temperatures and precipitation did not. Treter (1984) also could not prove
the influence of precipitation on varying birch ring widths. He found that the climate
parameters explaining the highest proportion of inter annual variability of ring widths
were tritherm and tetratherm in north Finland and mean temperature of growing season,
mean maximum temperature of growing season and mean July temperature in south
Norway. The growing season at the treeline site in south Norway lasts from early June
to early September, e.g. roughly the tritherm period. Between 40 and 50 % of the
differences between years were explained by changes in the above-mentioned
parameters.
Ring widths also respond to herbivory. Levanic et al. (2006) explain the large
oscillations in their chronology partly by the influence of summer temperature and late
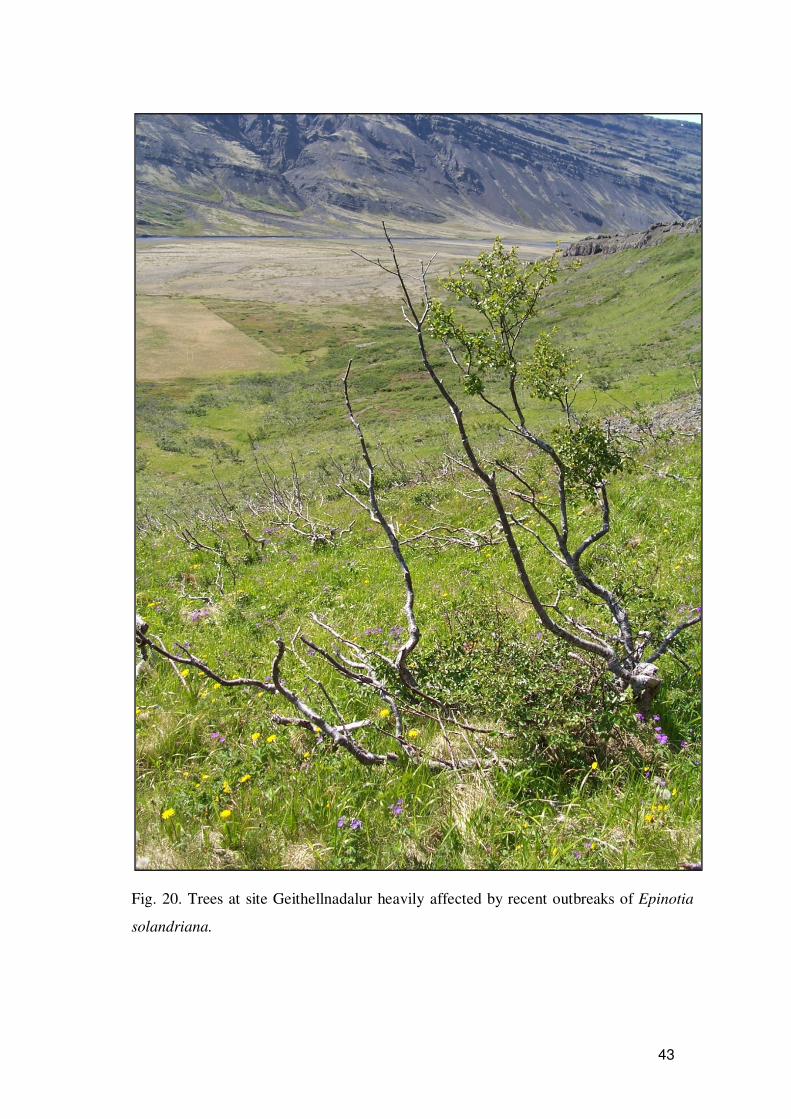
frosts which destroy the cambium, but also with insect attacks, mainly by Epinotia
24
solandriana, which can be seen in severe growth depressions that last three to six years.
Karlsson et al. (2004) also suggested a response of ring widths to different levels of
defoliation through oubreaks of the autumnal moth (Epirrita autumnata). At defoliation
levels between 80 and 90 % they found a decrease in ring widths for one year, while
defoliation levels above 90 % led to reduced growth for four years.
Ring widths and temperature thresholds. Treter (1984) tried to establish temperature
thresholds for tree growth at both his research sites. For that he extrapolated his tree
ring data to ring widths of zero and established the respective temperature values as
thresholds for zero growth.
Dependence of ring widths on other factors. Dalen and Hofgaard (2005) counted tree
rings in different tree heights at three tree line sites in Scandinavia (south and north
Norway, north Sweden) in order to establish tree ages for 0, 1 and 2 m tree height. The
age differences between the different heights were used to establish height growth rates
for the three sites. These growth rates were then correlated with different environmental
factors such as aspect, slope, relative radiation, altitude, snow depth and browsing.
Aspect (deviation from north), relative radiation and altitude were significant at the
P<0.05 level and explained about 30 % of the variation in growth rates for two of the
three sites.
1.2.7 Treeline research on mountain birch in Iceland
There have been some earlier attempts to answer questions also analysed in this study,
namely at which altitude a climatically induced birch treeline can be found in Iceland
and, subsequently, how much area of Iceland is suitable for birch growth and could
have been covered by mountain birch at the time of settlement. Although their goals
were similar, their methods to reach them have been quite different.
The earliest analysis was probably made by Bárðarson (1913; in: Ragnarsson, 1977).
He compared July temperatures at birch treelines in Norway and Sweden to measured
July temperatures in Iceland and concluded that birch could only survive at few
locations in lowland Iceland and the status of woodland cover in Iceland was at a
natural stage. Blöndal and Gunnarsson (1999) assume altitudinal treelines between 200
and 400 m a.s.l. for the whole of Iceland and use an altitudinal map to reconstruct
woodland cover. The estimate leaves out glaciers, lakes, lowland areas with drifting
25
coastal sands, floodplains and some recent lava flows and yields an area of 27% as
woodland cover for the time of settlement. Bjarnason (1971) assumes altitudinal
treelines at different altitudes for different parts of Iceland. He proposes the highest
treelines for the mid-highlands with altitudes up to 550 m a.s.l., altitudes up to 500 m
for sheltered valleys in the north, a maximum of 400 m in south Iceland and altitudes
between 100 and 200 m a.s.l for the exposed peninsulas of north and west Iceland. His
approach comes to the conclusion that 50 % of Iceland was vegetated at the time of
settlement and 40% of the country was covered with birch woodlands. Sveinbjörnsson
(1993) observes that the birch treeline in Swedish Lapland is close to equilibrium at
550 m a.s.l. and concludes that the same should apply to treelines in N-and NE-Iceland.
S. Sigurðsson (1977) assumes a tetratherm (mean temperature of the four warmest
months) of 6.5 °C as threshold for birch growth and estimates that 28 % of Iceland was
covered with woodlands in the 9th century AD. The hitherto mentioned estimates all
have in common that they are not based on real measurements.
Bergþórsson (1985; 1996) used a Norwegian treeline-temperature relationship
established by Mork (1968). He defined the height increment of a day with a mean
temperature of 8 ˚C for the six warmest hours as one growth unit, whereby growth units
grew over proportional to increasing temperature. Mork found that in order for birch to
survive in the long run, it needed an annual sum of 222 GU. Bergþórsson applied this
relationship for Iceland. Since he did not have temperature data with hourly resolution
he modified Mork’s formula so that it worked with monthly maximum and mean
temperatures. He then applied the formula to 28 Icelandic weather stations, which were
all situated in the lowland areas of Iceland, in order to see whether or not they would
support birch growth. For the period 1931-1960 he found that 21 meteorological
stations have would supported birch growth, during the period 1873-1922 the number
was just 10 (Bergþórsson, 1985). He took that as proof that birch treeline fluctuated
markedly after the last Ice Age. For the time of settlement he calculated a birch cover of
15%.
The approach by Ólafsdóttir et al. (2001) yields lower results. Their study is based on
the assumption that the annual amount of heat is indeed the major controlling factor for
birch growth at high latitudes, but not the only one. This is contrary to e.g. S.
Sigurðsson (1977), who had used only temperature. Their conceptual model takes into
26
account the major influencing factors and interacting processes. Some of the major
factors are the amount of heat during growing season, wind, land degradation, grazing
pressure and original vegetation cover (Haraldsson and Ólafsdóttir, 2001). The annual
amount of heat is calculated from the length and temperature of growing season and
expressed in degree days (DD), which are defined as the accumulated product of time
and temperature above a developmental threshold. The threshold for birch growth is set
to 7.5 degrees and the underlying temperature data is obtained through correlation of
temperature proxies stored in Greenlandic ice cores with historic Icelandic
meteorological data. Inside their model, forest cover is calculated using the Norwegian
temperature dependent birch growth model by Mork (1968) and modified for Iceland
by Bergþórsson (1985). Potential birch forest cover for Iceland is established by
coupling the model and a digital elevation model (DEM). Like Blöndal et al. (1999)
they exclude glaciers, coastal sands, lakes, etc. To calculate the forest cover for the time
between the last ice age and today they used temperature fluctuations estimated from
the Greenlandic temperature data. Their approach yields a forest cover of only eight
percent during the time of settlement. It has to be said that they defined forest as stands
exceeding two meters in height whereas the preceding authors make no such restriction.
Contrary to Ólafsdóttir, Jónsson (2005) tries to establish an Icelandic temperature
treeline relationship. For that he uses a map of birch woodland cover based on an
inventory from 1972-1975 which has been subsequently amended (Bjarnason et al.,
1977; Aradóttir et al., 1995; Aradóttir, Thorsteinsson and Sigurdsson, 2001). The map
contains birch polygons whose upper limits represent the altitudinal limit of continuous
birch cover. He established altitude and distance to sea for 20 forest limits in northern
Iceland with the help of the map, and then found their corresponding tritherms (mean
temperature of the three warmest months). For that he used the temperature data of a
local meteorological station (Vaglir) and related it to sea level and zero km distance to
sea using monthly lapse rates from southwest Iceland and the assumption that July
temperature in north Iceland increases by 0.025 °C per km inland. He found that eight
altitudinal limits had a tritherm of 7.6 °C and used this value in a thermal map of
Iceland to upscale it for the whole of Iceland. He found that, subtracting glaciers and
lakes, about 45% of Iceland lay thermally within 7.6 °C. He then took a vegetation map
of Iceland and assumed that birch cannot grow equally well on e.g. wetlands, heath or
already forested land. He estimates proportions of possible birch growth for the
27
different vegetation forms and multiplies these proportions with their respective
proportion of land thermally available for birch growth. He estimates that birch today
could grow on 25 % of Iceland, which is the same as the value of birch cover at the
time of settlement generally accepted by most scholars (e.g. Kristinsson, 1995). In the
study of Jónsson (2005) 7.6 °C is an outlasting threshold, i.e. below a sustained tritherm
of 7.6 °C birch begins to die, but it does not regenerate at sustained tritherms directly
above 7.6 °C. As a threshold for regeneration he estimates a tritherm of 9.2 °C, based
on a Norwegian threshold for birch treelines (Aas, 1964) and the personal observation
that regeneration appears in areas which are above this value. Using the method
described above he estimates that 16% of Iceland provided sufficient summer warmth
for regeneration of birch.
Contrary to the preceding authors, Hecht et al. (2007) do not view temperature effects
on plant communities as solely external factors. In their study soil temperatures
observed over one year at three different treeline sites in Iceland do not strictly follow
air temperatures. They suggest that land use history, i.e. the absence or presence of
sheep grazing, has an impact on the thickness of the moss layer, which affects the soil
temperature regime with consequences for vegetative growth. Hecht et al. (2007)
concluded that therefore treelines should not be correlated with air temperature alone.
1.3 Aims of the study
Previous studies about the potential area for birch in Iceland were based on either
assumed altitudes for treelines (Bjarnason, 1971; Blöndal and Gunnarsson, 1999),
assumed thermal thresholds (S. Sigurðsson, 1977), foreign temperature-treeline
relationships (Bergþórsson, 1996; Ólafsdóttir et al. 2001) or Icelandic treeline-
temperature relationships not based on actual measurements of treeline positions
(Jónsson, 2005). Therefore the main aim of this study was to create an Icelandic birch
treeline-temperature relationship based on measurements of treeline positions and
respective temperatures derived from thermal maps provided by the Icelandic
Meteorological Office (IMO) and to use it to predict the potential area for birch in
Iceland. By measuring treeline altitudes and deducting respective temperatures in
different regions of Iceland, this study aspired to find out whether one temperature-
treeline relationship can account for the whole country or whether different regions
28
(coastal vs. inland, south vs. north) require different thresholds. This aim is based on
the hypothesis that treelines depend foremost on temperature or more exactly,
temperatures during growing season. Proof for this hypothesis was sought as well.
Because of Körner´s (1998) finding that treelines on oceanic islands have higher
temperature thresholds than otherwise comparable ones at continental sites, one aim of
this study was to find out whether Icelandic birch treeline temperature thresholds are
considerably different from those at more continental sites (e.g. inner Fennoscandia)
and to find possible causes for it. Besides thermal causes resulting from peculiarities of
Iceland´s oceanic climate (lower diurnal and annual thermal amplitudes) also non-
thermal environmental factors were researched. Thus one aim of this study was to
detect other oceanity-related explanations for the position of treelines in Iceland.
Another aim of this study was to find out whether increasing summer temperatures, as
they have been recorded during the last years/decades in Iceland as well, can be seen at
the birch treeline. Therefore, recent changes of radial increment of treeline trees, as
well as recent altitudinal changes of the species limit, were researched.
29
2 Materials and Methods
2.1 Criteria for selection of research sites
A perfect site for this study would be five to ten kilometers of continuous mountain
slopes with variation in aspect and inclination, where the tree line is climatically
induced and not created by former land use, soil erosion, vertical cliffs etc. Because
those requirements were not met by the state of Icelandic birch forests and woodlands
described above, it was not possible to select treeline sites randomly. Thus one
preparatory task was to find sites in different regions of Iceland where climatic treelines
could be found, i.e. where the influence of past and present land use, i.e. sheep grazing,
and erosion processes was limited to an extent that did not necessarily lower treeline
altitudes. For that the following means were used.
First a selection of Icelandic experts, from forest inventorists and geobotanists to local
foresters, were questioned (Sigurður Blöndal, Þorbergur H. Jónsson, Hörður
Kristinsson, Arnlín Óladóttir, Aðalsteinn Sigurgeirsson, Bjarni D. Sigurðsson, Arnor
Snorrason, all oral communication). They were presented with a map of birch
woodland cover based on an inventory from 1972-1975 which had been subsequently
amended (Bjarnason et al., 1977; Aradóttir et al., 1995; Aradóttir et al., 2001) and
asked to point out where they thought climatically induced birch tree lines could be
found. Secondly, sites that were mentioned repeatedly by the experts were selected for
further consideration in a Geographical Information System (GIS) using birch
woodland temperature data from Þorbergur H. Jónsson (Jónsson, written
communication). He had linked all mapped forest polygons with a tritherm map of
Iceland for the period 1931-1960. The GIS was used to check if the polygons the
experts had pointed out fell close to or below a tritherm of 7.6 °C, a value established
by Jónsson (2005) as a thermal limit for continuous forest cover in Iceland. If that was
the case, the sites were deemed likely to have climatically controlled treelines. It should
be stated here that the forest polygons are not a precise map of treelines, but give a
good indication of how high continuous forest reached in the 1970s. Thirdly, all the
selected polygons were compared with altitudinal lines in a GIS. The highest polygons,
with differentiation between regions, were noted. Finally, a pre-selection of suitable
30
treeline sites within each region was made on the basis of overlaps between these three
methods, i.e. the experts’ opinions, Jónsson‘s temperature data and highest altitudinal
values of polygons. While being in the preselected areas, final treeline sites were
chosen in accordance with personal observation of how disturbed the sites looked and
on local experts’ opinions of which sites were least influenced by other factors than
climatic ones (Þröstur Eysteinsson, Lárus Heiðarsson, Loftur Jónsson, Bjarni D.
Sigurðsson, Arnlín Óladóttir, Sigurður Skúlason, Arnór Snorrason, all oral
communication).
2.2 Treeline definitions used
In this study three different definitions of tree lines were used. In altitudinally
descending order: tree species limit, 1 meter treeline and 2 meter treeline. The tree
species limit (hereafter: species line) marked the uppermost outposts of individuals of
the species, regardless of their height and distance to the next individual. Contrary to
that, the one and two meter treelines (hereafter: 1 m line and 2 m line) are altitudinal
lines drawn between groups of at least five individuals which were at least of the
particular height.
2.3 Description of study areas
For a better understanding, one Icelandic word often contained in the following site
names has to be translated: skógur means forest. Wieser and Tausz, (2007) use the term
timberline or treeline ecotone to describe the altitudinal zone between the forest limit or
the upper limit of continuous forest canopy and the tree species line. In this study it is
slightly modified to describe the altitudinal zone between species limit and 2 m treeline
(the latter is roughly coinciding with continuous tree canopy).
During the field work 14 sites were visited in Iceland. One of them was dismissed
because of an apparent lowering of the treeline ecotone due to sheep grazing (southern
side of Dalsmynni valley). The remaining 13 sites were chosen as final study sites. Two
times two sites were aggregated to one site (Haukadalur and Miðfell were aggregated to
the site Haukadalur, Kleifskógur and Arnaldsstaðaskógur to the side Múli south of
Lagarfljót). The result was 11 study sites (Fig. 7, Table 1). Soils at all sites were either
Brown Andosols or Gleyic Andosols. Due to lack of data, the Icelandic soil map does
31
not distinguish between both classes everywhere (Björn Traustason, written
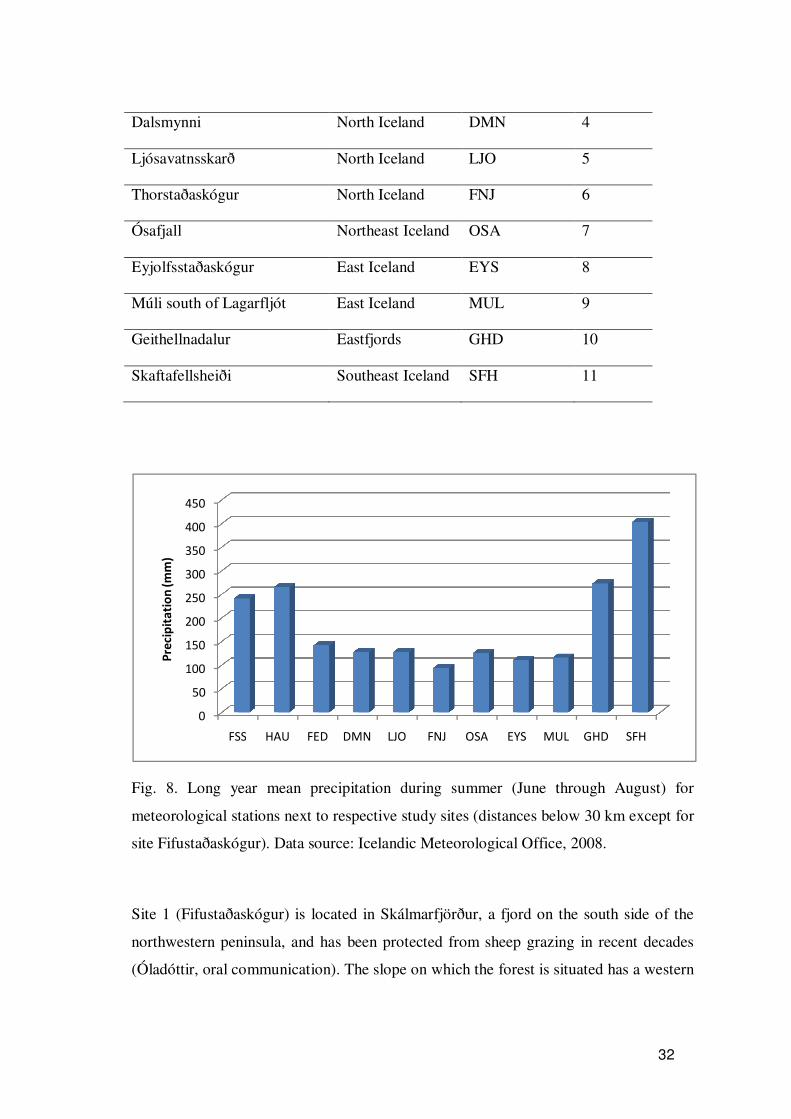
communication). Precipitation during summer months (June to August) varied between
100 and 400 mm and was lower in the north and east than in the rest of the country
(Fig. 8).
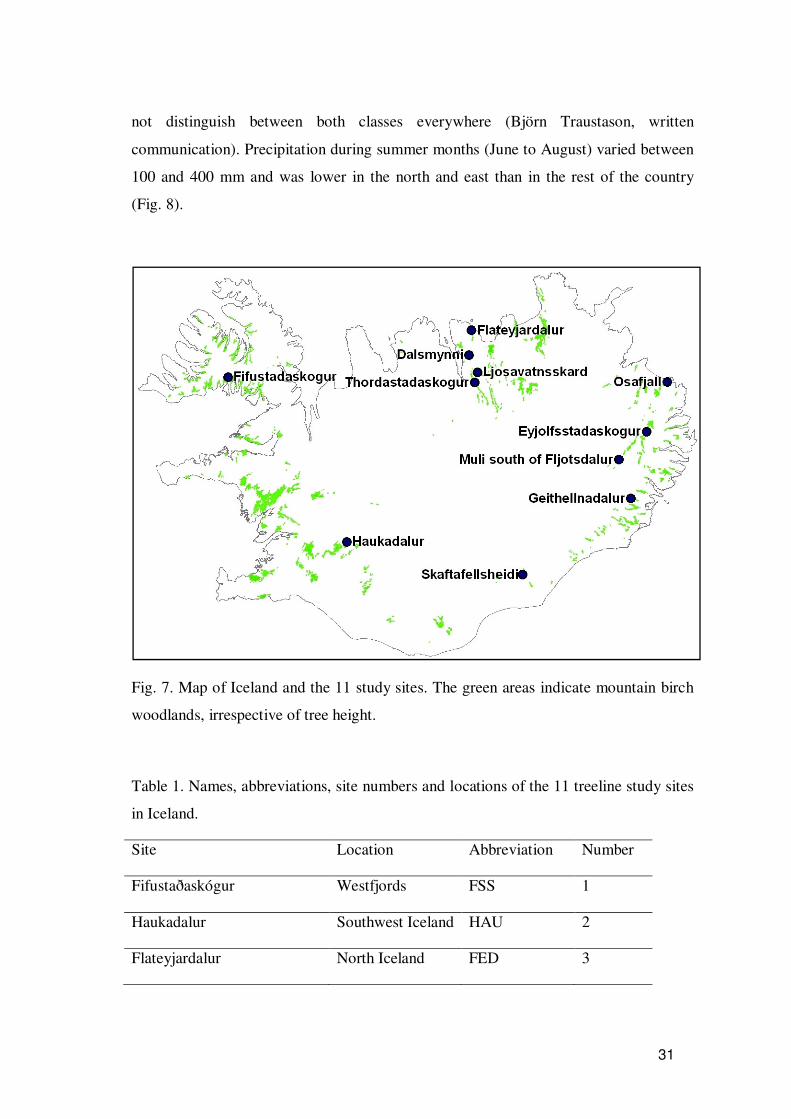
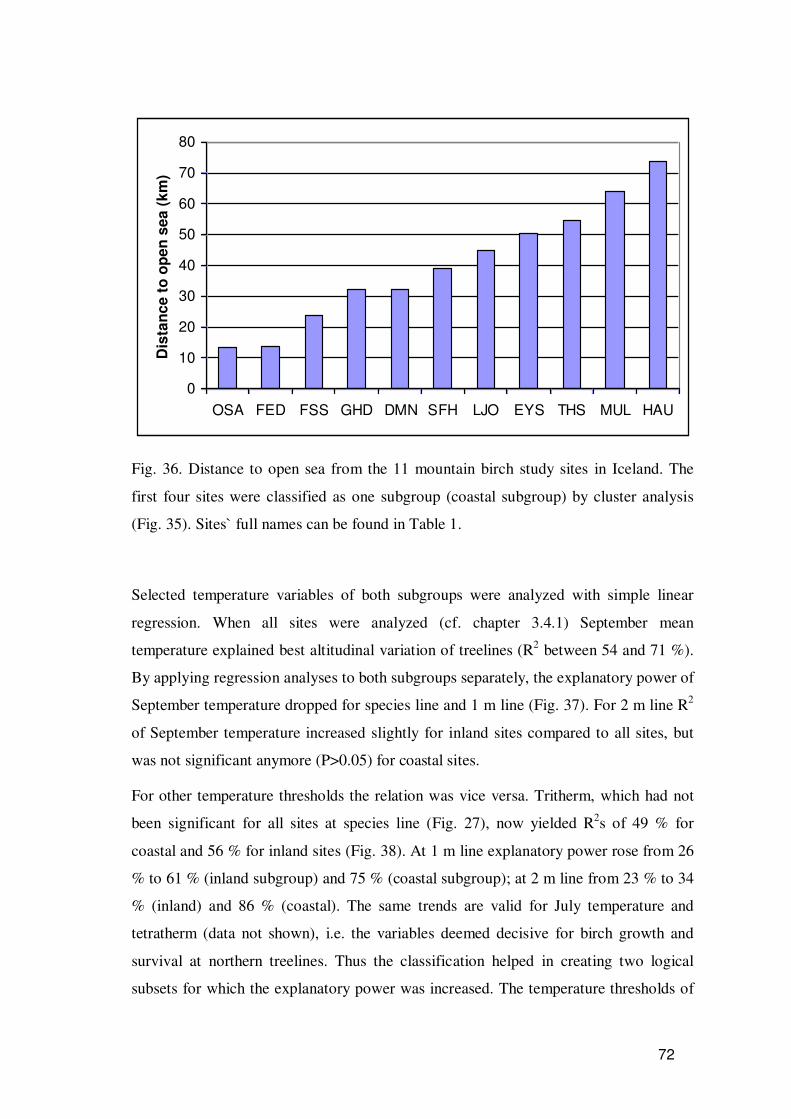
Fig. 7. Map of Iceland and the 11 study sites. The green areas indicate mountain birch
woodlands, irrespective of tree height.
Table 1. Names, abbreviations, site numbers and locations of the 11 treeline study sites
in Iceland.
Site Location Abbreviation Number
Fifustaðaskógur Westfjords FSS 1
Haukadalur Southwest Iceland HAU 2
Flateyjardalur North Iceland FED 3
32
Dalsmynni North Iceland DMN 4
Ljósavatnsskarð North Iceland LJO 5
Thorstaðaskógur North Iceland FNJ 6
Ósafjall Northeast Iceland OSA 7
Eyjolfsstaðaskógur East Iceland EYS 8
Múli south of Lagarfljót East Iceland MUL 9
Geithellnadalur Eastfjords GHD 10
Skaftafellsheiði Southeast Iceland SFH 11
Fig. 8. Long year mean precipitation during summer (June through August) for
meteorological stations next to respective study sites (distances below 30 km except for
site Fifustaðaskógur). Data source: Icelandic Meteorological Office, 2008.
Site 1 (Fifustaðaskógur) is located in Skálmarfjörður, a fjord on the south side of the
northwestern peninsula, and has been protected from sheep grazing in recent decades
(Óladóttir, oral communication). The slope on which the forest is situated has a western
0
50
100
150
200
250
300
350
400
450
FSS HAU FED DMN LJO FNJ OSA EYS MUL GHD SFH
Pre
cip
ita
tio
n (
mm
)
33
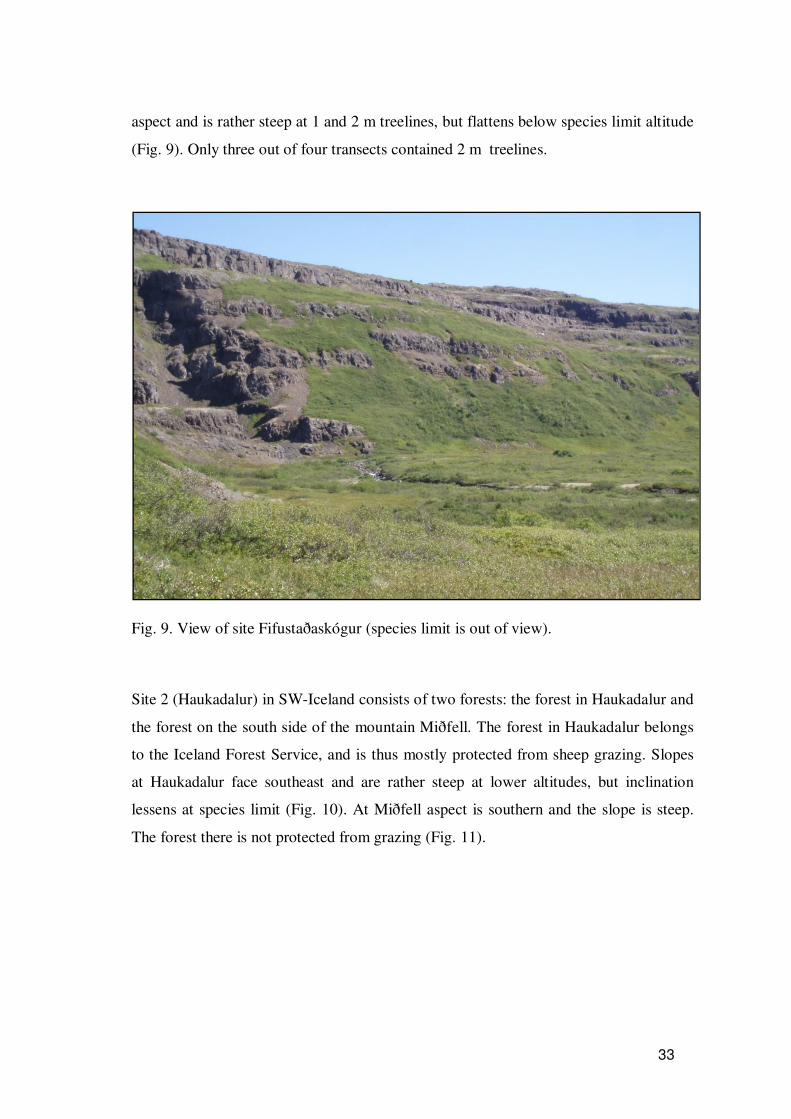
aspect and is rather steep at 1 and 2 m treelines, but flattens below species limit altitude
(Fig. 9). Only three out of four transects contained 2 m treelines.
Fig. 9. View of site Fifustaðaskógur (species limit is out of view).
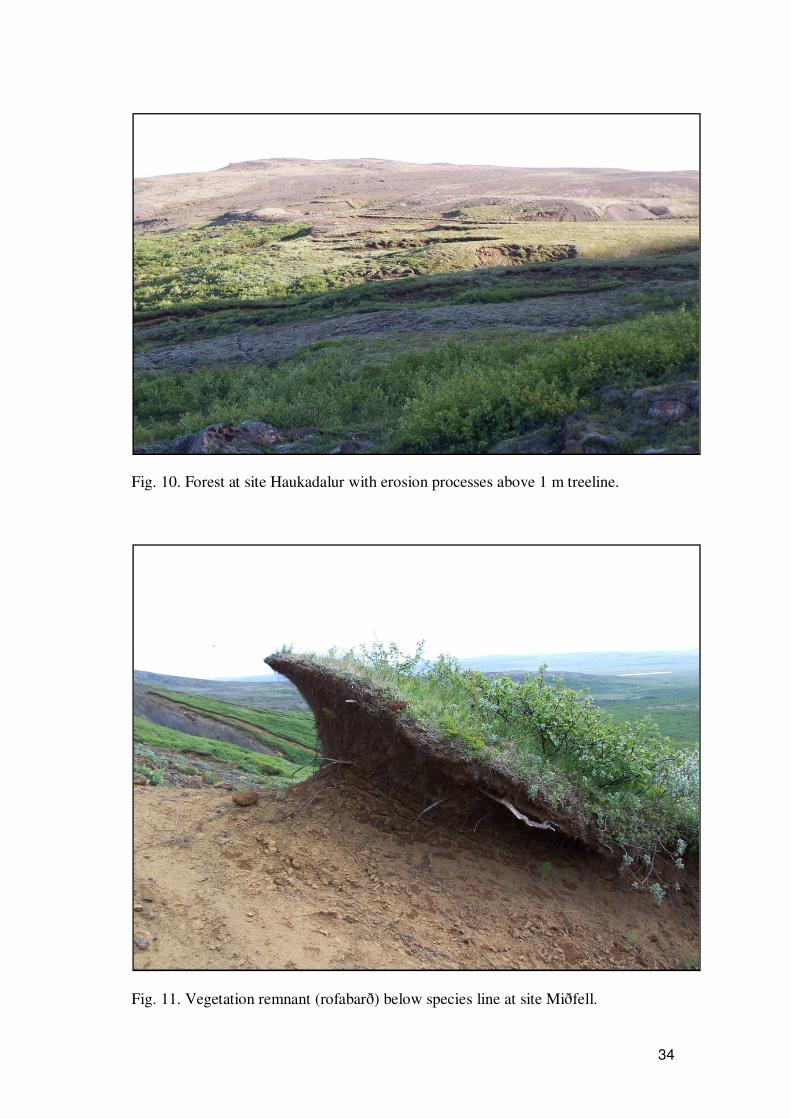
Site 2 (Haukadalur) in SW-Iceland consists of two forests: the forest in Haukadalur and
the forest on the south side of the mountain Miðfell. The forest in Haukadalur belongs
to the Iceland Forest Service, and is thus mostly protected from sheep grazing. Slopes
at Haukadalur face southeast and are rather steep at lower altitudes, but inclination
lessens at species limit (Fig. 10). At Miðfell aspect is southern and the slope is steep.
The forest there is not protected from grazing (Fig. 11).
34
Fig. 10. Forest at site Haukadalur with erosion processes above 1 m treeline.
Fig. 11. Vegetation remnant (rofabarð) below species line at site Miðfell.
35
Site 3 (Flateyjardalur) was the northernmost site included in the study. The forest
recorded is located close to the sea and the transect closest to the sea had no 2 m
treeline. The slope of the researched forest faces west and is rather steep with increased
inclination at species limit altitude. The forests in Flateyjardalur are grazed to some
extent (Fig. 12).
Fig. 12. Species limit at site Flateyjardalur.
36
The forest at site 4 (Dalsmynni) lies on the northern side of a valley running from
southwest to northeast. The aspect for the first two transects, thus is southwest, and the
slope is heavily inclined. The third transect faces east and the slope inclination is
lighter, especially at species limit. The forest is used for sheep grazing (Fig. 13).
Fig. 13. Forest at site Dalsmynni (background). Two transects were recorded in the
forest at the center of the picture. The highest species limit for the site was found for
the third transect on the gentle slope in the top right corner of the picture.
Site 5 (Ljósavatnsskarð) lies in a valley with east west direction and has a southern
aspect. The slopes are very steep and erosion is apparent above the closed forest. Two
of the transects lay in Sigriðastaðaskógur, a state owned fenced in forest. Contrary to
that the third transect further east is subject to sheep grazing (Fig. 14).
37
Fig. 14. Sigriðastaðaskógur in Ljósavatnsskarð with apparent erosion above closed
forest.
Site 6 (Þorðarstaðaskógur) has an (ill maintained) fence below the treelines which
protects the forest below from grazing. The treeline ecotone itself has been subject to
high levels of grazing in the past, although the numbers of sheep grazing today here
have decreased as they have across Iceland (Hecht et al., 2007). The slopes are heavily
inclined and have an eastern aspect. Erosion is clearly visible above the closed forest
(Fig. 15).
38
Fig. 15. A part of site Þorðarstaðarskógur with heavy erosion above the close forest.
Site 7 (Ósafjall) lies on both sides of the Osfjöll mountain range in NE-Iceland. Four
transects have eastern aspect, three have western aspect. The site lies very close to the
sea and is not protected from grazing. Only for one out of seven transects a 2 meter
treeline could be established (Fig. 16).
39
Fig. 16. Treeline ecotone at eastern side of Ósafjall mountain range. Trees reach heights
of less than two meters.
Site 8 (Eyjólfsstaðaskogur) has never been protected from grazing, but levels of grazing
have been reduced in recent decades (Hecht et al., 2007). The forest lies on a slope with
western aspect and is lightly inclined at 1 and 2 m treelines, but steeper below species
limit. It belongs to the East Iceland Forestry Society and has mainly recreational
purpose (Fig. 17).
40
Fig. 17. Treeline ecotone at site Eyjólfsstaðaskógur (view from species line).
Site 9 (Múli south of Lagarfljót) consists of two sites: Kleifskógur and
Arnaldsstaðaskógur. The site Kleifskógur (Fig. 18) west of the mountain Múli is
heavily grazed and was thus complemented with the site Arnaldsstaðaskógur east of
Múli (Fig. 19). Both sites face east and slopes are heavily inclined. The consequences
of landslides were visible at Arnaldsstaðaskógur.
41
Fig. 18. A species line tree at site Kleifskógur. This birch survived due to its
inaccessible position for sheep with a vertical rock below and very steep terrain above.
42
Fig. 19. Treeline ecotone at Arnaldsstaðaskógur (view from species limit).
The forest at site 10 (Fig. 20) is located in Geithellnadalur, a valley in the Eastfjords of
Iceland. The forest has been heavily affected by outbreaks of the birch-aspen leafroller
(Epinotia solandriana, Icel.: Tìgulvefari) in recent years (Hallgrímsson et al. 2006). Its
vitality has subsequently been further reduced by Armillaria ostoyea (Romagn.)
Herink. The slope at the treeline ecotone faces south and is rather steep below species
limit altitude. For one transect no 2 m treeline could be established.
43
Fig. 20. Trees at site Geithellnadalur heavily affected by recent outbreaks of Epinotia
solandriana.
44
Site 11 (Skaftafellsheiði) is part of Skaftafell National Park and thus has been protected
since 1972. Sheep grazing has been effectively excluded since the early 1980s (Bjarni
D. Sigurðsson, oral communication). Three transects lay on a little inclined slope with
southern aspect (Fig. 21), two lay on a more inclined slope with western aspect.
Fig. 21. Treeline ecotone at Skaftafellsheiði (view from species limit).
2.4 Parameters recorded
At each study site different parameters were recorded for each of 3-7 vertical transects.
Where possible a distance of at least 400 meter was kept between transects, so that not
more than two transects were based on one temperature map pixel (resolution of 900 by
900 m).
At species line the positions of the uppermost trees were marked with a GPS unit
(Garmin Inc., George Town, Cayman Islands). Then the following parameters were
recorded for the single uppermost tree: tree height, stem length, number of stems,
45
suitability of ground for generative regeneration and occurrence of seedlings. Tree
height was measured for the dominant stem along a vertical line between ground level
close to the root collar and a horizontal line starting from the tree top. This applied if
the tree grew vertical or downhill. If the tree grew uphill height was measured along a
vertical line connecting tree top with the ground immediately below. Stem length was
also measured for the dominant stem. A measuring tape was applied and the distance
from root collar to tree top was measured along the bark surface. For the number of
stems, all stems apparently originating from one root system were counted. The ground
in the tree´s vicinity was classified according to its suitability for generative
regeneration. Ground covered with e.g. a thick moss layer of Racomitrium lanuginosum
or a thick grass layer as well as ground overshadowed by a dense forest was deemed
unsuitable. The occurrence of regeneration in form of seedlings was noted. Afterwards
the tree was felled and a tree disc was cut from the main stem at 10 cm length. Then the
top shoot was cut off at a diameter of 7 mm and bagged together with the tree disc.
At 1 and 2 m lines the geographical positions of three to ten other tree line trees were
marked per transect and all parameters mentioned above were recorded for the
dominant stem of the dominant tree. Additionally the following parameters were
recorded: shape of crown and abundance of buds below 50 and 130 cm height. The
crown shape was categorized into the following four groups: conical, spherical, flat or
shrubby. According to Aradottir, Thorsteinsson and Sigurdsson (2001), a conical crown
shape is an indicator for vigorous growth often associated with young trees. A spherical
crown indicates slower growth while a flat one indicates stagnation of growth
commonly found in older trees and trees under stress. For the abundance of buds there
were three categories: many, some and none.
46
2.5 Data and Statistical analysis
2.5.1 Climate data used
The geographical positions of the tree lines taken during the fieldwork were linked to
corresponding temperature data. This step was based on temperature maps produced by
the Icelandic Meteorological Office (IMO). The methodical background of the IMO´s
temperature maps has been described by Bjornsson et al. (2007a) and a short summary
of the methodology will be given below.
The maps contain monthly average temperatures for the period 1961-1990 for the
whole of Iceland and have a resolution of 900 by 900 meters. They are based on
temperature data from 84 manned meteorological stations maintained by the IMO. The
manual stations tend to be close to the coast and there are only few stations in the
highlands. Therefore the dataset is augmented with estimates of monthly mean
temperatures for the reference period at 31 automatic stations. These stations were not
in operation during the whole period, but were run during the 1990s. In order to include
their data the following procedure was used: First anomalies for the 1990s at each
manual station were calculated. An anomaly is the amount of deviation of a
meteorological quantity from the accepted normal value of that quantity. The anomalies
were then interpolated to a map using ordinary kriging. Anomalies were used because
systematic effects in temperature, such as altitude, tend to cancel when anomalies are
calculated, contrary to absolute temperature values. The result was an interpolated map
with monthly anomalies which can be read at each automatic station´s location. The
anomaly for a certain month at a station together with the station data for the same
month are used to derive that station’s monthly mean temperatures during the period
from 1961-1990, i.e. the average monthly temperature at an automatic station during
1990s was corrected with the anomaly derived from the interpolated map. The
construction of the monthly mean temperature maps, now based on 115 stations, was
carried out in two steps. First the temperature data was detrended. Detrending normally
means the statistical or mathematical operation of removing trend from a series. Here it
means that the trend components influencing the temperature at a given station location
were first determined and then quantified, not removed. Trend components of
temperature were found using multiple linear regression analyses on the following
47
predictants: station longitude, latitude and altitude, the station’s distance-to-open-sea,
and the first four eigenvectors of local topography. The first four eigenvectors of local
topography denote the difference between actual topography with a pixel size of one
km2 and the background 5 by 5 km average topography and correspond to a north-south
slope, an east-west slope, a unimodal feature (hill/valley) and a saddle-like feature
(Bjornsson, 2003). Contrary to the other predictants, the eigenvectors are linear
independent during regression analysis. The second step was the spatial interpolation.
For that the residuals at each station were interpolated using kriging as a method.
Additionally the IMO made degree day maps for Iceland available. The degree day
value is calculated by subtracting a chosen temperature threshold from every daily
mean temperature above the threshold (Bjornsson et al., 2007b). These maps are
available for the following thresholds: 0, 2, 5, 7 and 10 °C and also have a pixel size of
900 by 900 meters.
2.5.2 Computing temperature map (establishing treeline temperatures)
The maps provided by the IMO have a pixel size of 900 by 900 meters. Because the
different tree lines of a particular site often lay within less than few hundred meters and
transects had average distances of 500 to 600 meters to each other, one pixel often
contained different tree lines of one transect as well as different transects of a site. In
order to specify temperatures values for different lines and transects the pixel size had
to be reduced. This was achieved using a geographical information system. Each
temperature map from January to December includes both the temperature value and
mean altitude for every pixel. For each site separately, one pixel above and one below
the treelines were chosen. Criteria for their selection were proximity to transects and
minimal amplitude of altitude within the pixel. Then a temperature lapse rate (LR) for a
given site was calculated using the following formula:
LR = (TU-TL)/(ALTU-ALTL)
with TU and TL being the temperature value of the upper and lower pixel and ALTU and
ALTL being their respective altitude. Altitude and temperature of the lower pixel were
48
taken as a starting point for a raster calculation using a digital elevation model (DEM)
of Iceland. The pixels of the DEM include an average altitude for each 10 by 10 meter
pixel. In a raster calculator the following calculation was carried out:
T10 = TL – ((Alt10 -AltL)/LR)
TL and AltL are the temperature and altitudinal value of the lower pixel with a size of
900 by 900 meters, while the altitudinal value of the DEM Alt10 has a pixel size of 10
by 10 meters. The result T10 is a new raster where every 10 by 10 meters pixel has its
own temperature value which deviates from the 900 by 900 m temperature value based
on the established lapse rate for the given site. This procedure was performed for each
site separately with the following temperature parameters: monthly average
temperatures from May to September, tritherm, tetratherm and the three month period
from July through September. Tetratherm is the average temperature of the four
warmest months of a year, in Iceland that means June through September. Tritherm is
the average temperature of the three warmest months (June through August). To
summarize: each geographical position recorded during field work was related to eight
different temperature parameters.
The method was cross-validated with the following procedure. The temperature values
of the 10 by 10 meters pixels from each new temperature map were aggregated to the
old pixel size of 900 by 900 meters and compared with the original data, i.e. the pixels
of the original maps. The difference between original and computed data, the error, was
heterogeneous, i.e. similar deviations did not accumulate in one area and were usually
in the range between -1 and 1 °C for all temperature parameters. This, however, did not
account for the site Skaftafellsheiði. There the error for the pixels underlying the three
western transects deviated strongly from the ones for the two eastern transects. Because
of this the hitherto established lapse rates were replaced manually and for both of the
sites’ sides separately. This was done until the lapse rate with the smallest error was
found, i.e. the one where negative and positive deviations equalized one another.
Additionally to monthly mean temperatures and the aggregated values, degree days for
the thresholds 0, 5 and 7 °C were selected and used for further analysis. For that their
49
values were retrieved by reading them from maps provided by the IMO with a
resolution of 900 by 900 m.
2.5.3 Deriving oceanity parameters
Additionally to temperature, further parameters (summarized under the term oceanity
parameters) were derived in order to explain altitudinal position of treelines. They were
distance to shoreline (hereafter named: shore distance), distance to open sea (hereafter:
sea distance), chloride content of groundwater (groundwater chloride) and of top shoots
(wood chloride). For coast distance the shortest distance between each recorded
geographical tree line positions and the shoreline was established using a GIS. The
resulting values were first aggregated to transect, then to site averages. For sea distance
the same method was applied, with the only difference that Iceland´s shoreline was
buffered with a 10 km buffer (excluding islands around the mainland). Both parameters
differentiate greatly in how they treat tree line locations in narrow fjords (Fig. 22).
50
Fig. 22. Geographical positions of treelines at study site Fifustadaskogur (upper left
corner) and its distance to shore (light blue) and open sea (darker blue). Species line is
marked with green dots, 1 m line with yellow dots, 2 m line with red dots. The green
polygons mark birch woodland cover based on an older inventory (Bjarnason et al.,
1977; Aradóttir et al., 1995; Aradóttir et al., 2001).
In order to analyze the wood chloride, the top shoots of the 1 m line were used (N=49).
First their surface was thoroughly washed with deionized water. Subsequently they
were dried for 10 days at 60 °C. The shoot pieces were then milled in a ball mill until
they had a flour-like property. The samples of one site were blended (N=11) and their
mean chloride content was analysed by the Wessling laboratories Ltd (Dresden,
Germany) using elementary analysis and halogen sulphur from high-pressure-oxygen-
bomb combustion. The groundwater chloride content of the 11 sites was established
51
using a digital map made by Björn Traustason, which was based on a paper by F.
Sigurðsson (1993).
2.5.4 Statistics to look for relationships between measured and derived
parameters
2.5.4.1 Simple linear regressions
On the basis of altitude and temperature values for each geographical point (N=595),
averages were calculated for the three different treelines of each transect (N=141, i.e.
49+49+41 for the species, 1 m and 2 m line, respectively). The transect averages were
analyzed by one-way ANOVA. First, differences between the different lines were
examined using all sites. Then, if difference between all sites was significant,
differences between individual sites were examined using species limit, 1 and 2 m tree
lines both separately and combined.
Linear regression was used to investigate the impacts of various independent variables
on site averages for altitude and temperature threshold of the three tree lines (N=33, i.e.
3*11). First, altitude of the three different tree lines was compared to temperature
parameters (including degree day parameters with base temperatures of 0, 5 and 7 ˚C),
shore distance, sea distance, ground and wood chloride content. Then the tetratherm
was used instead of altitude as a dependent variable with the four non-temperature
parameters as independent variables. With latter analysis it was assumed that
temperature is the main factor in explaining differences in treeline altitude, but also
investigated if other factors (coast distance, sea distance and chloride content) affect
altitude significantly. Linear regressions were considered significant at P<0.05. The
same regression analyses were then repeated for site maximum tree line altitudes
instead of averages.
2.5.4.2 Multiple linear regressions
The temperature parameters (excluding degree days) were used again in multiple
regression analyses using SAS statistical software (SAS Institute Inc., Cary, USA).
Here also both mean and maximum values were tested. In SAS the stepwise model
selection method was chosen as regression procedure. This method begins the analysis
52
with no variables, and then adds the variable with the highest R2. The next variable
selected is the one that increases R2 most. This process is repeated until no other single
variable meets a required level of significance, in this analysis P<0.10. Only multiple
regressions with overall P<0.05 were taken as significant.
2.5.5 Classification
Since the outcome of the simple linear regression analyses or multiple regressions
between sites may not always be consistent for different treelines, another approach to
classify the sites into different main groups was attempted. A cluster analysis was
carried out with SAS statistical software. Clustering in this context means the
partitioning of a dataset into subsets. The aim was to divide the whole dataset into
subsets of two main groups. 24 thermal variables were used to divide the dataset: for
each of the three tree lines May, June, July, August and September monthly average
temperature as well as tetratherm, tritherm and the average temperature of the three
month period July through September. By using aggregated values as well as monthly
mean temperatures, more weight was put on summer temperature: May enters the
calculation once, June and September thrice, July and August four times. The
altitudinal data was not used for this purpose, only the treeline temperature thresholds.
In order for the software to differentiate the dataset, it needs an out-group, i.e. a group
which is significantly different from the rest of the dataset. For that three slightly
different temperature values of a highland site (Kverkfjöll, ca. 1300 m a.s.l) were used,
simulating the differences between three altitudinal lines well above the birch tree lines.
To check the outcome of the classification procedure, the two subsets were compared
by one-way ANOVA with each transect as the unit of replication. Linear regression
was used to find out how well selected temperature variables (tritherm, tetratherm, July
and September mean temperature) explained altitudinal treeline variation inside the
subgroups. Linear regressions were considered significant at P<0.05.
2.5.6 Scaling up to national level
2.5.6.1 Using different temperature thresholds for oceanic and continental region
The outcome of the classification analysis (2 groups) was used to divide Iceland into
two main regions (coastal and inland) with different temperature thresholds for the
53
species line and the 1 and 2 m lines. This study used the amplitude of the difference
between mean July and January temperature for the division. As a boundary, a
difference of 11.5 ˚C between July and January was set. The part of Iceland where the
difference between July and January temperature lay below 11.5 ˚C was called coastal,
the part where it was above 11.5 ˚C inland.
Two different methods were used to establish temperature thresholds for each region.
The first one consisted in calculating each subset’s mean values based on site averages
(hereafter: mean method). The second one averaged each group´s transect values
(thermally) below median (hereafter: median method). To determine the thermally
potential area for birch growth in the whole of Iceland, the established tritherm
thresholds were applied to their respective regions. In other words: a raster calculation
was used to select all pixels of the coastal region with a higher temperature value than
the coastal threshold and thus lying inside the potential area for birch growth. In a
second raster calculation the pixels of the inland region lying above the inland threshold
were selected. The sum of both calculations constituted the area for climatically
potential birch distribution. The resulting areas were then categorized with regard to
terrain surface characteristics; and the potential area for birch growth was reduced by
subtracting all areas covered by rivers, lakes, snow and glaciers. No other land surface
classes were excluded. All procedures were repeated for July mean temperature and
tetratherm.
2.5.6.2 Using outcome of multiple regression
In an attempt to include non-temperature parameters (as well as temperature
parameters) to show the potential area for birch growth in Iceland, the resulting
functions of the multiple regression analyses were processed in a GIS. Since raster
calculations were carried out, all used variables had to be in raster format. Therefore the
distance to both shoreline and open sea had to be rasterized. The resulting raster dataset
with a pixel size of 250 by 250 m contained distance to shore and coast line for the
center of each pixel. In the raster calculations terrain elevation stemming from the
digital elevation model was compared to altitude for species, 1 and 2 m line as
predicted by the multiple regressions. If the terrain was lower than the predicted
treeline for a certain pixel it was inside the potential area for birch growth.
54
2.6 Tree ring analysis
The tree discs cut at 10 cm length (lower discs) and a diameter of 0.7 cm (top discs)
were dendrologically analyzed. Therefore they were cut with a scalpel and dampened
with water and talcum was rubbed into them to increase contrast. Then the discs were
measured with a binocular stereoscope using TSAP measuring program. For the lower
discs (N=139) width of annual rings was measured along a diameter containing the
longest radius and the pith. In the process the number of annual rings, radius to
cambium and radius to bark surface, were recorded for both radii.
The disks were collected between the beginning of June and mid July. This results in
differences in the current annual ring width. For better comparison between early and
late samples the current annual ring was not used for subsequent analysis. Differences
in annual rings between the longer and shorter radius were due to missing year rings.
Therefore the number of rings from the longer radius constituted tree age. For the top
discs (N=139) only the number of annual rings and the two diameters were recorded.
Radial increment for each year prior to 2007 was established for the lower disks. Radial
increment was then transformed into basal area increment for each ring. The basal area
increments were grouped into age classes from 0 to 6 for each disk, according to the
following ages: 1-10, 11-20, 21-30, 31-40, 41-50 and 51-60 years. Older age classes
were omitted because there were only four trees older than 60 years. Then diameter as
well as area increment were compared between these age classes in two different ways.
First the increments of the different classes were compared for the same time period,
i.e. at different absolute ages. Periods were 1957-1966, 1967-1976, 1977-1986, 1987-
1996 and 1997-2006. Then the increments of identical absolute ages were compared
between time periods. E.g. the increment of trees from the age class 21-30 years during
the last decade (1997-2006), was compared with the increment of the age class 21-30
during the decade before (1987-1996). In this way age-related growth trends were
minimized.
For the top disk, age and diameter were known. Additionally the length of top shoots
with a maximum diameter of 7 mm was measured with a measuring tape along bark
surface. This year’s length increment was not taken into account, since it was not
55
existent for all samples. Both diameter and length of the top shoot where divided by the
shoot´s age resulting in mean diameter and mean length increment.
56
3 Results
3.1 Basic parameters for species, 1 and 2 m tree line
At 11 sites a total of 49 transects was recorded, i.e. species limit and 1 m treeline were
recorded 49 times, the 2 m line was missing eight times and was recorded for 41
transects. Altogether the dataset consisted of 595 geographical positions.
Aside from tree height the sampled trees at the different tree lines also differed in other
parameters. The average species line tree was 27 cm high, compared to 140 and 239 cm
for the dominant stems of the dominant trees at 1 and 2 m treeline, respectively. Their
average lengths were 72, 201 and 294 cm, respectively. This resulted in differences in
length/height ratios between the lines. While the average species line tree was almost
three times longer than high, the 1 m tree line tree was less than one and a half times
longer than high, while the ratio for the trees at 2 m line was just 1.25 (Table 2).
Table 2. Height, length and their ratio for trees at species line, 1 and 2 m line. Height
and length are given as averages ± one standard deviation.
Height in cm Length in cm Length/height
Species line 27 ± 18 72 ± 47 2.88
1 m treeline 140 ± 30 201 ± 42 1.46
2 m treeline 239 ± 44 294 ± 48 1.25
The surface around the species line trees was deemed suitable for regeneration in 61%
of the sites, while this number decreased to 39% and 17% at 1 m and 2 m lines,
respectively. The decrease in suitable sites for regeneration at 2 m treeline was mainly
due to a dense crown cover of the birch forest. At all three lines, emerging seedlings
were found at ca. every fifth transect. At the species line emerging seedlings were
found at 27% of transects that were deemed to have suitable surface for regeneration
(Table 3). The number of stems per tree was similar for all three lines and varied
57
between 3.0 and 3.6 at the species line and the 2 m line, respectively. The mean tree
across all lines had 3.25 stems (data not shown).
Table 3. Proportion of transects with suitable surface for regeneration at three treelines
at 11 sites of mountain birch in Iceland. Also shown is the fraction of all sites and
suitable sites with emerging seedlings.
Treeline Proportion of sites Fraction of sites with emerging seedlings
with suitable surface All sites Suitable sites
Species line 0.61 0.16 0.27
1 m 0.39 0.22 0.58
2 m 0.17 0.15 0.86
Average 0.40 0.18 0.45
3.2 Altitudes of treelines found
The species line was found at different altitudes at different study sites (Fig. 23). The
species line ranged from 262 (Fifustaðaskógur) to 504 (Dalsmynni) m a.s.l. These
values were averages at site level. The single uppermost birch was found in
Skaftafellsheiði at 566 m a.s.l. The uppermost emerging seedling was found at 488 m
a.s.l., as well at Skaftafellsheiði. The 1 m treeline was also found at different altitudes.
Depending on the site, the 1 m line was found from 117 (Ósafjall) to 463
(Þórðastaðaskógur) m a.s.l. The single uppermost 1 m line was found in
Þórðastaðaskógur at 481 m a.s.l. The same applied to the 2 m tree line. It ranged from
62 (Flateyjardalur) to 413 (Þórðastaðaskógur) m a.s.l. The single uppermost 2 m line
was found in Þórðastaðaskógur at 431 m a.s.l. (Fig. 4). The altitudinal zone between
species line and 2 m line (treeline ecotone) ranged from 80 meters in Þórðastaðaskógur
to over 300 meters in Flateyjardalur and was generally larger at sites closer to the sea.
There it averaged to 198 m in contrary to 119 m at sites further inland.
58
Fig. 23. Average altitudes of mountain birch treelines for 11 study sites in Iceland.
Vertical lines indicate the lowest and highest transects for each site. The sites were
sorted in order of ascending species limit altitude and their full names can be found in
Table. 1.
3.3 Temperatures at treelines
For enhanced clarity only the mean temperature of the warmest month (July), tritherm
and tetratherm will be presented here, even if the analysis also included May, June,
August, September average temperatures and average temperature of Jul-Sept. The
thermal differences between oceanic sites (FSS, FED, OSA, GHD) and continental sites
were not as pronounced as the altitudinal differences, indicating that temperature
indeed explains a large part of the altitudinal variation (Fig. 24-26). Note that the data is
displayed in the order presented in Table 1. The benchmark data of the most important
temperature parameters is further displayed in Table 4. Note that highest treeline
temperature values were always found at the site Haukadalur, while the lowest values
were found at four different sites.
0
100
200
300
400
500
600
FSS HAU FED DMN LJO THS OSA EYS MUL GHD SFH
Alt
itu
de
(m
a.s
.l.)
Species limit
1 m line
2 m line
59
Fig. 24. Mean July temperature at three different mountain birch tree lines for 11 study
sites in Iceland. Site names can be found in Table 1.
Fig. 25. Tritherm at three different mountain birch tree lines for 11 study sites in
Iceland. Site names can be found in Table 1.
0
1
2
3
4
5
6
7
8
9
10
FSSHAU
FEDDM
NLJ
OTH
SOSA
EYSM
UL
GHD
SFH
Ju
ly t
em
pe
ratu
re (
de
gre
es
Ce
lsiu
s)
Species limit
1 m line
2 m line
0
1
2
3
4
5
6
7
8
9
10
FSSHAU
FEDDM
NLJ
OTH
SO
SAEYS
MUL
GHD
SFH
Tri
oth
erm
(d
eg
ree
s C
els
ius
)
Species limit
1 m line
2 m line
60
Fig. 26. Tetratherm at three different mountain birch tree lines for 11 study sites in
Iceland. Site names can be found in Table 1.
Table 4. Selected temperatures (°C) at different mountain birch tree lines for 11 study
sites in Iceland. Site of occurrence in brackets, their full name can be found in Tab. 1.
Species limit Average all sites Lowest value Highest value
July 7.82 7.11 (SFH) 8.55 (HAU)
Tritherm 7.04 6.61 (GHD) 7.75 (HAU)
Tetratherm 6.26 5.67 (DMN) 6.91 (HAU)
1 m line Average all sites Lowest value Highest value
July 8.48 7.50 (SFH) 9.26 (HAU)
Tritherm 7.71 7.01 (SFH) 8.48 (HAU)
Tetratherm 6.94 6.28 (THS) 7.65 (HAU)
2 m line Average all sites Lowest value Highest value
July 8.70 8.01 (SFH) 9.39 (HAU)
Tritherm 7.94 7.53 (SFH) 8.61 (HAU)
0
1
2
3
4
5
6
7
8
9
10
FSSHAU
FEDDM
NLJ
OTH
SOSA
EYSM
UL
GHD
SFH
Te
tra
the
rm (
de
gre
es
Ce
lsiu
s)
Species limit
1 m line
2 m line
61
Tetratherm 7.17 6.58 (THS) 7.79 (HAU)
3.4 Explanatory relationships for differences in altitudes/thresholds
3.4.1 Results of simple linear regressions
3.4.1.1 Relation between altitude and temperature
Relationships between temperature parameters (independent variable) and altitude
(dependent variable) of individual transects (N=49+49+41 for species line, 1 m and 2 m
lines, respectively) were analyzed using simple linear regression. Highest coefficients
of determination were found for September mean temperature, where the regression
yielded R2s between 0.54 (species line) and 0.71 (1 m line). That is, 54-71 % of the
variability observed in treeline altitude could be explained by average September
temperature alone (Fig. 27). The relationship was, however, not positive, as might have
been expected (higher treelines at warmer sites). The higher treeline altitudes correlated
with lower September mean temperatures (Fig. 28). The same trend was also observed
for tetratherm (Fig. 29) and other temperature parameters (data not shown). Tetratherm
explained 50 % of the altitudinal variation for the 1 and 2 m lines, but only 16% for the
species limit (Fig. 27).
0
0.1
0.2
0.3
0.4
0.5
0.6
0.7
0.8
MAY
JUNE
JULY
AUGUST
SEPTEM
BER
TRIO
THER
M
JUL
to S
EP
TETR
ATHER
M
R2
0m
1m
2m
62
Fig. 27. Coefficients of determination (R2) of simple linear regression analyses between
temperature parameters and altitude of three different mountain birch treelines across
11 study sites in Iceland. Results without significance at the 0.05 level are not shown.
Fig. 28. Regression between September mean temperature at 1 m tree line and its
altitude across 11 mountain birch study sites in Iceland. Blue points indicate individual
transects of four sites closest to sea, pink points transects of seven sites further inland.
63
Fig. 29. Regression between tetratherm at 1 m tree line and its altitude across 11
mountain birch study sites in Iceland. Each point indicates an individual transect.
3.4.1.2 Relationship between altitude and oceanity parameters
Regional mean chloride content of groundwater in the vicinity of study sites was used
in regression analyses against altitude of 11 mountain birch treeline sites. Chloride
content in groundwater varied between 2 and 10 ppm (Fig. 30) and explained 44% of
the variation for 1 m line and 64% for 2 m line. This meant less explanatory power than
was found for most temperature parameters for the 1 m line, but a stronger predictor
than all temperature variables for the 2 m line. The species line across all sites,
however, was not significantly related to groundwater chloride content (P>0.05).
0
100
200
300
400
500
600
5 6 7 8 9
Alt
itu
de
(m
a.s
.l.)
Tetratherm (degrees Celsius)
Measured altitude
Predicted altitude
64
Fig. 30. Chloride content (ppm) of groundwater and the altitude of the 1 m treeline (m.
a.s.l.) at 11 mountain birch study sites in Iceland. The line indicates a linear regression.
65
The wood chloride content of top shoots varied between 98 and 620 mg/kg and yielded
no significant results in the regression analyses with altitude as dependent variables
(Fig. 31).
Fig. 31. Wood chloride content and the altitude of the 1 m treeline at 11 mountain birch
study sites in Iceland. The line indicates a linear regression.
Two more variables were analyzed with simple linear regression: distance to shoreline
and to open sea. Like with chloride data, replicates consisted of sites since differences
in distance to sea were negligible between transects. Distance to open sea (Iceland’s
shoreline with a 10 km buffer) varied between 13 and 74 km and explained 41-53 % of
altitudinal variation of 1 and 2 m line, respectively (Fig. 32). This was a weaker
predictor than a number of temperature parameters for both the 1 and 2 m lines (Fig.
27). Shore distance varied between 2 and 63 km, but regression analyses did not yield
significant R2s for differences in treeline altitude (Fig. 33).
When altitude was replaced by tetratherm, none of the four parameters of oceanity
(chloride contents or shore or ocean distance) were significant predictors of species and
1 m line (P>0.05). For 2 m line only groundwater chloride content could explain
66
differences in tetraterm across the 11 sites with a R2 of 0.4 and P<0.05. The results of
the simple regression analyses indicate that oceanity parameters generally affect
treeline altitude in a similar fashion as temperature, but only with lower predictive
power. Temperature seems therefore to be the preferred variable to predict treeline
altitude in Iceland.
Fig. 32. Distance to open sea and the altitude of the 1 m treeline at 11 mountain birch
study sites in Iceland. The line indicates a linear regression.
67
Fig. 33. Distance to shoreline and the altitude of the 1 m treeline at 11 mountain birch
study sites in Iceland. The line indicates a linear regression.
3.4.2 Results of multiple regressions
To further study which parameters best explained the altitudes of different treelines,
multiple regressions were carried out both for site mean altitudes (mean method) and
for site maximum altitudes (maximum method). The maximum method assumed that
various other reasons than climate may have lowered the treeline altitude at different
transects within site, but the transect with the highest altitude should be closest to the
site´s climatic equilibrium. Results are displayed in Table 5. Temperature variables
were always found to be the strongest predictors and were always the first two terms in
the best multiple regression equations. Out of eight temperature variables, only tritherm
(once), August (five times) and September temperature (every time) were part of the
best equations. Shore distance was also part of the best equations every time and sea
distance three times, indicating that they could add a little to the predictive power of the
equations. The chloride parameters were, however, never part of them. Both August
and September temperature had a negative influence on the different treelines.
Increasing shore distance had a positive effect on treeline altitude, while sea distance
was weaker. The two methods (mean and maximum) differed only when predicting the
altitude of the 2 m line.
68
Table 5. Best multiple regression equations for species line, 1 and 2 m line using both
mean and maximum method.
Method Treeline Intercept August
(trith.)
Sept. Shore dist. Sea
dist.
Tot.
R2
Mean Species 1356 -97.5 -72.4 2.95 0.923
Max. Species 1387 -102.4 -71.5 2.96 0.921
Mean 1 m line 1472 -131.6 -49.2 1.66 0.002 0.992
Max. 1 m line 1421 -123 -53.5 1.79 0.002 0.985
Mean 2 m line 1463 -130.4 -50.4 1.56 0.002 0.989
Max. 2 m line 1617 -102* -102 3.67 0.983
* = tritherm
3.5 Maps with potential birch cover for two regions
3.5.1 The multiple regression approach
Best single temperature variables (temperature thresholds) could only explain 50-70%
of the variability found in treeline altitudes at the 11 study sites around Iceland (Fig.
27). When, however, multiple regression was used, 92-99% of the variability in altitude
of the species limit, 1 m or 2 m treeline could be explained for the 11 study sites (Table
5). This increase in explanation power was mostly linked to adding the negative
relationship between August temperature and altitudes to the negative relationship
between and September temperatures and altitude. That means that sites with colder
autumns had higher treelines than sites with milder autumns. Even if the formulas
created by the multiple regression shed some light into which parameters are governing
the treeline altitudes in Iceland, they are not directly applicable for estimating the
potential area of birch in the country. This is because of the negative relationships with
temperature and their high intercepts (Table 5). These formulas indicated that if August
and September temperatures were cold enough, treelines could reach up to 1350-1600
m a.s.l. Therefore, when applied in raster calculations in a GIS, they produced highly
69
unrealistic birch cover, where many high altitude and cool areas dominated (Fig. 34).
Other methods had therefore to be explored to estimate the climatically potential birch
area of Iceland.
Fig. 34. Birch cover in Iceland as predicted by multiple regression. Displayed in green
is the area below species line as predicted by the multiple regression analyses. The
warmest parts of Iceland (the south and Eyjarfjörður in the north) would be without
birch cover, whereas the central highlands and the colder lowlands of the north would
be with.
70
3.5.2 Approach with classified sites
3.5.2.1 Classes
To improve the temperature threshold method, the cluster analysis procedure in the
SAS statistical software was used to classify the 11 study sites into subgroups (Fig. 35).
The question asked by this analysis was: “Was there a systematic difference between
temperature thresholds of the 11 sites that can be used to divide Iceland into regions of
different temperature thresholds?” Indeed, Fig. 35 seems to indicate that such logical
division existed. The first (and strongest division) of the temperature threshold data
split the 11 sites into four and seven sites, respectively. Subgroup one consisted of the
sites Fifustaðaskógur, Flateyjardalur, Ósafjall and Geithellnadalur. Subgroup two
consisted of the sites Haukadalur, Dalsmynni, Ljósavatnsskarð, Þórðastaðaskógur,
Eyjólfsstaðaskógur, and Múli south of Fljótsdalur. Subset one consisted of all the study
sites that were found closest to the open sea (Fig. 36), and was therefore named the
coastal subgroup, while subset two was named the inland subgroup.
By allowing another division and thus three subgroups, the inland subgroup split up and
the two sites Ljósavatnsskarð and Þórðastaðaskógur built a third subgroup. Both sites
of subgroup three are inland sites in north Iceland (Fig. 7). However, it was not possible
to deduct an area division for the subgroup based on these two groups, since another
inland site not included in the subgroup, Dalsmynni, lay only 15 km north of site
Ljósavatnsskarð.
71
Fig. 35. Outcome of cluster analysis using SAS statistical software. The sites were
divided into subgroups, the first division was between seven sites on the left (inland
sites) and four sites on the right (coastal sites). Second division was inside inland
subgroup, splitting off sites five and six in the middle. Site names can be found in Table
1.
72
Fig. 36. Distance to open sea from the 11 mountain birch study sites in Iceland. The
first four sites were classified as one subgroup (coastal subgroup) by cluster analysis
(Fig. 35). Sites` full names can be found in Table 1.
Selected temperature variables of both subgroups were analyzed with simple linear
regression. When all sites were analyzed (cf. chapter 3.4.1) September mean
temperature explained best altitudinal variation of treelines (R2 between 54 and 71 %).
By applying regression analyses to both subgroups separately, the explanatory power of
September temperature dropped for species line and 1 m line (Fig. 37). For 2 m line R2
of September temperature increased slightly for inland sites compared to all sites, but
was not significant anymore (P>0.05) for coastal sites.
For other temperature thresholds the relation was vice versa. Tritherm, which had not
been significant for all sites at species line (Fig. 27), now yielded R2s of 49 % for
coastal and 56 % for inland sites (Fig. 38). At 1 m line explanatory power rose from 26
% to 61 % (inland subgroup) and 75 % (coastal subgroup); at 2 m line from 23 % to 34
% (inland) and 86 % (coastal). The same trends are valid for July temperature and
tetratherm (data not shown), i.e. the variables deemed decisive for birch growth and
survival at northern treelines. Thus the classification helped in creating two logical
subsets for which the explanatory power was increased. The temperature thresholds of
0
10
20
30
40
50
60
70
80
OSA FED FSS GHD DMN SFH LJO EYS THS MUL HAU
Dis
tan
ce
to
op
en
se
a (
km
)
73
both groups were compared with one way ANOVA. For September temperature both
groups were significantly different for all three treelines. For tetratherm both groups
were significantly different from each other for 1 and 2 m line, but not for species line.
For July temperature and tetratherm both groups were significantly different from each
other at species line, not at 1 and 2 m treelines.
Fig. 37. Comparison between R2 of coastal subgroup, inland subgroup and all sites for
September temperature. September temperature explained treeline altitudes better for
all sites than for both subgroups separately at all three treelines.
0
0.1
0.2
0.3
0.4
0.5
0.6
0.7
0.8
Species line 1 m line 2 m line
R2
Coastal sites
Inland sites
All sites
74
Fig. 38. Comparison between R2 of coastal subgroup, inland subgroup and all sites for
tritherm. Tritherm explained treeline altitudes better for coastal and inland subgroup,
when analyzed separately, than when analyzed together.
3.5.2.2 Comparison between oceanic and continental sites
For the resulting two subsets temperature thresholds were established in two ways.
Table 6 shows tritherm thresholds calculated by averaging site means (mean method)
and those established by calculating means using all transect values below median
(median method). Why to make the cumbersome calculation of mean values based only
on sites with temperature thresholds below median? It was apparent that other factors
than climate had influence on the altitude of treelines at some of the sites. This includes
factors such as soil erosion, landslides and browsing by sheep. All these factors are
strongly influenced by the current and past land use, which may have lowered treelines
in some places below their climatic limits. By only using the lower temperature
thresholds, the influence of sites whose thermal treeline character is dubious could be
minimized. The site Haukadalur had the highest temperature values of all sites for all
treelines (Table 4). In the median method, it influenced the position of the median but
had no direct effect on the mean threshold value.
0
0.1
0.2
0.3
0.4
0.5
0.6
0.7
0.8
0.9
Species line 1 m line 2 m line
R2
Coastal sites
Inland sites
All sites
75
Species line thresholds were between 0.5 and 0.9 °C lower than 1 m line thresholds and
the latter were on average 0.2 °C lower than 2 m line thresholds. The median method
produced thresholds that were app. 0.3 °C lower for all treelines than the ones of the
mean method, thus indicating that other factors than climate alone had some influence
on treeline altitudes. Since the difference between methods was steady for both subsets,
the statements made hereafter account for both methods. The overall differences
between the coastal and inland group were rather small and did not exceed 0.4 °C. At
species line the tritherm threshold was lower for coastal sites than for inland sites, while
at 1 and 2 m line it was vice versa. This reflects a result reported earlier, namely, that
the treeline ecotone, e.g. the altitudinal difference between species line and 2 m line, is
larger at coastal than at inland sites (200 vs. 120 altitudinal meter). The higher
thresholds for 1 and 2 m line at oceanic sites thus indicated that vicinity to sea
influenced height growth of birch.
Table 6. Tritherm thresholds for species limit, 1 and 2 m treelines of oceanic and
continental subsets calculated by using mean and median method as well as the
difference between both methods. All values in °C.
Treeline Species line 1 m line 2 m line
Region coastal inland coastal inland coastal inland
Mean
method 6.9 7.2 7.8 7.7 8.0 7.9
Median
method 6.6 6.9 7.5 7.3 7.7 7.6
Mean-
Median 0.3 0.3 0.3 0.4 0.3 0.3
The thresholds of the coastal subset were valid for the (yet to be created) coastal part of
Iceland, while the thresholds of the inland subset were valid for the (yet to be created)
inland part of Iceland. To use the two different temperature thresholds to estimate
potential birch cover, Iceland was divided into a coastal and an inland part based on the
76
difference between mean January and mean July temperature. Areas with a temperature
difference of less than 11.5˚C between mean July and January belonged to the coastal
part. Areas with a bigger temperature amplitude belonged to the inland part of Iceland
(Fig. 39). The resulting inland part covered most of the country´s area and even reached
the coast in some places, e.g. Eyjarfjörður in the north and the coast south of Selfoss in
southwest Iceland. The coastal part covered most of Iceland´s shoreline, extended
further inland in the southeast and covered the two peninsulas Reykjanes in the
southwest and Strandir in the northwest.
Fig. 39. Classification of Iceland into coastal and inland part based on difference
between July and January temperature.
Thresholds were also calculated for tetratherm and July mean temperature. The overall
differences between oceanic and continental sites there were also rather small (data not
shown). Therefore only averages of both subsets for July mean temperature, tritherm
and tetratherm are reported in Table 7 (mean method). Tetratherm thresholds are app.
77
0.8 °C lower than tritherm thresholds at all treelines due to the influence of colder
September temperatures, whereas the warmest month thresholds are about 0.8 °C
higher than tritherm thresholds for all treelines.
Table 7. Thresholds for species, 1 and 2 m treeline based on mean of both subsets.
July Tritherm Tetratherm
Species line 7.82 7.04 6.26
1 m treeline 8.48 7.71 6.94
2 m treeline 8.70 7.94 7.17
3.5.2.3 Maps based on temperature data
Tritherm thresholds of both mean and maximum method were used to calculate the
thermally potential area for birch growth in Iceland (Table 8). The mean method
yielded an area below species line (=birch cover) of 41,574 km2 or 40 % of the country.
The area below 2 m line (=birch forest) amounted to 25,050 km2 thus covering 24 % of
Iceland. These areas excluded land covered with glaciers, snow, lakes and rivers. Fig.
40 shows the distribution of predicted birch cover and forest. Birch forest covered all
Icelandic lowlands with the exception of some peninsulas in the north. So featured
(from west to east) the northern part of Strandir, Skagi and Melrakkasléttan no birch
forest. This was due to the fact that summers on these peninsulas are colder than
summers in the more sheltered fjords and valleys of the north as well as in all lowlands
of the south. Another lowland area showing little birch forest was Húnavatnssysla in
the northwest. There, summers are also colder than further east or south and the lack of
predicted forest cover corresponds with the finding that birch colonized this lowland
area last after the last Ice Age (Bjarni D. Sigurðsson, oral communication). In the south
birch forests reached higher up the mountains than in the north. Birch cover could be
found in all lowlands, even the ones without birch forest. In the south and sheltered
valleys of the north it reached up to almost 600 m a.s.l. compared to less than 400 m
a.s.l. in the areas that also had little or no birch forest. However, birch cover exceeded
400 m a.s.l. in most places, an elevation deemed likely to limit birch growth by
78
previous authors (e.g. Blöndal and Gunnarsson, 1999). Areas above 600 m a.s.l or most
of the central highlands featured no birch cover when using the mean method.
Table 8. Area in km2 climatically available for birch growth based on tritherm.
Method Mean Median
Area (km2) Proportion of
Iceland (%)
Area (km2) Proportion of
Iceland (%)
Species line 41574 40 48074 47
2 m line 25050 24 29966 29
Fig. 40. Climatically available area for birch growth based on tritherm and mean
values. The area below the 2 m line (birch forest) is displayed in dark green, the area
inside the species line in light green (latter includes first). The actual birch forest is
displayed in black, glaciers are delineated with blue. Displayed in brown is the area
below 400 m a.s.l. (where it is not covered by birch).
79
The thresholds of the median method were ca. 0.3 °C lower than the ones of the mean
method. With an average lapse rate of 0.64 °C this was tantamount to an altitudinal
increase of nearly 50 meters compared to the mean method. Hence, the distribution of
birch cover and forest as predicted by the median method resembled the distribution of
the mean method, with the difference that both birch cover and forest reached higher up
mountain slopes and thus further inland (Fig. 41). Contrary to that were the peninsulas
in the north that had been featuring no birch forest in the mean method still without
birch forest. In areas where the mean method already predicted birch forest, the median
method yielded higher altitudes and thus more area. The same accounted for birch
cover, which exceeded 600 m a.s.l. in sheltered valleys of the north and most regions of
the south. It thus spread further into the central highlands and was featured very close
to the glacier Hofsjökull. In Fig. 41 birch cover and forest can also be seen colonizing
the southern tips of Iceland´s biggest glacier Vatnajökull. Summers there were warm
enough to sustain birch growth theoretically. As mentioned above, these areas were not
taken into account when calculating possible birch cover. Altogether the maximum
method yielded a possible birch cover of 48,074 km2 or 47 % and a possible forest area
of 29,966 km2 or 29 % of Iceland.
Fig. 41. Climatically available area for birch growth based on tritherm and median
method. The area below the 2 m line (birch forest) is displayed in dark green, the area
80
inside the species line in light green (the latter area includes first). The actual birch
forest is displayed in black, glaciers are delineated with blue. Displayed in brown is the
area below 600 m a.s.l., where it is not covered by birch.
3.6 Growth dynamics at treeline
Trees at species limit were significantly younger than trees at 1 m line and the latter
were significantly younger than trees at 2 m line. With one exception, this trend was
valid over all sites. A runaway at species line in Fifustaðaskógur (FSS) with an age of
93 years, which was also the oldest tree in this study, reversed the general trend for this
site (Fig. 42). The average age of trees at species limit over all sites was 17.3 years. The
afore mentioned site Fifustaðaskógur had an average age at species limit of 51.5 years,
while at four other species limits, trees were younger than 10 years. At 1 m line average
age over all sites was 30 years. The youngest trees were in Skaftafellsheiði with an
average age of 17 years, while the oldest were in Fifustaðaskógur (47 years). The
average age over all sites at 2 m line was 38.5 years. Here the site values ranged from
30 to 52 years.
Fig. 42. Tree line ages for 11 study sites and the average of all sites.
0
10
20
30
40
50
60
Ag
e (
ye
ars
)
Species limit
1 m line
2 m line
81
The mean ring width, i.e. the average of every tree ring of every sample tree, at species
line was 0.46 mm; at 1 m line it was 0.78 mm and at 2 m line it was 0.88 mm per year
(Fig. 43). At species line the slowest growing tree had a mean ring width of 0.19 mm
per year, the fastest growing tree one of 1.08 mm/year. At 1 m line minimum ring
width was 0.33 mm, maximum ring width 2.1 mm. The respective numbers for 2 m line
were 0.41 mm/year and 2.41 mm/year, respectively. The single widest tree ring was
6.68 mm wide.
Fig. 43. Mean, minimum and maximum tree ring widths for species limit, 1 and 2 m
line.
135 of 139 samples, i.e. samples of all three lines, were included in an analysis of
increment differences between age classes. The comparison of basal area increment
between decades showed that growth was greatest during the last 10 years, i.e. from
1997-2006, for all age classes (Fig. 44). Furthermore basal area increment was greater
during the decade from 1987-1996 than in any preceding decade and so on. The
described trends were also valid for radial increment, although more increment during
later periods goes along with over proportional biomass increment (Fig. 45).
0
0.5
1
1.5
2
2.5
3
Mean Min Max
Dia
me
ter
incr
em
en
t (m
m/y
ea
r)
Species line
1 m treeline
2 m treeline
82
Fig. 44. Basal area increment for different age classes during the last 50 years.
Increment was largest during the last decade for all age classes and decreased further
into the past (observe descending order of columns from left to right).
0
500
1000
1500
2000
2500B
asa
l are
a in
cre
me
nt
(mm
2/1
0 y
ea
r)
Age class 1-10
Age class 11-20
Age class 21-30
Age class 31-40
Age class 41-50
Age class 51-60
83
Fig. 45. Radial increment for different age classes during the last 50 years. Radial
increment was largest during the last decade for all age classes and decreased further
into the past (observe descending order of columns from left to right).
In order to exclude age related growth trends new age classes based on age, during
which growth took place, were built. I.e. trees that were 21-30 years old at felling
(2006) built one age class, trees that were 21-30 years old ten years earlier built another
age class and so on. Their increments were compared between different decades. For
the (growth) age class from 21-30 basal area increment was 3.5 times higher during the
period from 1997-2006 than during the preceding decade and even eight times higher
than during the decade before. (Fig. 46) That means that trees that were 21-30 at the
end of the last decade grew faster than each older age class researched in this study
when they were age 21-30. This trend was valid for all age classes (Fig. 47) and for
radial increment as well (Fig. 48). There the youngest trees of the age class had twice as
much radial increment than the 10 year older ones, thrice as much as the 20 year older
ones and four times as much as the thirty year older ones. The same trend was observed
for all age classes (data not shown).
0
2
4
6
8
10
12
14
Dia
me
ter
incr
em
en
t (m
m/1
0 y
ea
r)
Age class 1-10
Age class 11-20
Age class 21-30
Age class 31-40
Age class 41-50
Age class 51-60
84
Fig. 46. Basal area increment for the growth age classes 21-30. The most recent
increments are shown in the left column. The decreasing increments from left to right
mean that younger trees grew faster than their older counterparts during the time they
were 21-30 years old.
0
200
400
600
800
1000
1200
1400
1600
1800
1997-2006 1987-1996 1977-1986 1967-1976
Ba
sal a
rea
incr
em
en
t (m
m2
/10
ye
ar)
(Growth) Age class 21-30
85
Fig. 47. Radial increment for different growth age classes. The most recent increments
are shown in the left columns of each row. The decreasing increments from left to right
mean that trees of a certain age class grew faster than any older counterparts during the
same age.
Fig. 48. Radial increment for the growth age classes 21-30. The most recent increments
are shown in the left column. The decreasing increments from left to right mean that
0
500
1000
1500
2000B
asa
l are
a in
cre
me
nt
(mm
2/1
0 y
ea
r)
Age class 11-20
Age class 21-30
Age class 31-40
Age class 41-50
0
2
4
6
8
10
12
14
1997-2006 1987-1996 1977-1986 1967-1976
Ra
dia
l in
cre
me
nt
(mm
/10
ye
ar)
(Growth) Age class 21-30
86
younger trees grew faster than their older counterparts during the time they were 21-30
years old.
Tree disks from the top shoots were also analyzed. It took the average species limit
trees 6.7 years to grow to 7 mm in diameter, while it was approximately 1 year less for
both 1 and 2 m lines. Diameter and length increment of the top shoots were compared
(Fig. 49). While length increment was significantly less at species line than at both
treelines (species line – treelines ratio of 0.69), the difference for diameter increment
was not as strong (ratio 0.84).
Fig. 49. Length and diameter increment for species limit, 1 and 2 m treeline.
Length increment (mm/year)
Diameter increment (0.01 mm/year)0
20
40
60
80
100
120
Species limit1 m treeline
2 m treeline
87
4 Discussion
4.1 Main methodical considerations
4.1.1 Treeline definitions
The main distinction between treeline definitions is in how high upright woody plants
have to be to qualify as trees. Most definitions range between heights of 2 and 3 m (e.g.
Wieser and Tausz, 2007; Mork, 1968; Körner and Paulsen, 2004), but some require
heights up to 5 m (Troll, 1973). Definitions below 2 m are rare, but for Wardle (1965)
the treeline is constituted by trees of 1 m height. These treeline studies were carried out
on tree species that grow much higher than the respective tree height requirements for
treeline.
The highest mountain birch trees in Iceland are found in Fnjóskadalur in N-Iceland and
reach up to 14 m in height (B.D. Sigurdsson, written communication). Bjarnason et al.
(1977) carried out a national inventory in 1972-1975 on the distribution of mountain
birch woodlands in Iceland. It was visually estimated that 81 % of birch woodlands
were below 2 m in height, 15 % between 2 and 4 m in height and just 4 % higher than 4
m in height at that time. Another national inventory was carried out in 1987-1991.
Then, more data was compiled at both landscape and tree-level. Some 9900 plots were
sampled and 300 sample trees were harvested (Jónsson, 2004). Traustason and
Snorrason (2008) recalculated this data and found that 79.5 % of Icelandic birch
woodlands were below 2 m in height in 1990. That means that the majority of Icelandic
woodlands are beyond treeline even with the cautious tree height requirement of 2 m
used by e.g. Wieser and Tausz (2007). Nevertheless this study used 2 m tree height as
one definition of treeline, in order to reach comparable results to related research at
other treeline sites in Scandinavia and other places in the world. This is possible
because the low growing, shrubby birch below 2 m is mainly found in regions with
extreme oceanic climate and heavy coastal storms (i.e. lowlands), while it reaches
heights over 10 m further inland (Kristinsson, 1995). In this study all inland sites had 2
m tree lines at lower elevations on the mountain slopes. At coastal sites, however, the 2
m line could only be recorded for 60% of all transects. There the birch seemed
88
depressed by other factors than temperature (Kristinsson, 1995; Jónsson, 2002; personal
observation).
In order to be better able to compare both coastal and inland sites, treelines were also
recorded for 1 m tree height. Because of the state of Icelandic forests described in the
introduction, the demands put on tree density at treeline were not severe. Thus, treelines
were defined as altitudinal lines drawn between groups of at least five individuals of the
particular height. Besides 1 and 2 m treelines, the species line was recorded, i.e. the
uppermost outposts of mountain birch, regardless of height and distance to other
individuals. The species line has the advantage that the determination of its position is
easily repeatable and unsusceptible to measurement errors. It is also a treeline definition
very commonly used (e.g. Holtmeier, 2003; Sveinbjörnsson, 2000; Treter, 1984), and
thus yields comparable results. Furthermore a comparison between the positions of
species lines from different times gives straightforward indications of vegetation
change without having to use dendroclimatological methods.
4.1.2 Downscaling method of temperature data
Different monthly mean temperatures that were attributed to all treeline positions
originated from maps produced by the Icelandic Meteorological Office (IMO). The
pixel size of these maps was reduced using terrain elevation. For each site temperature
and altitude of one pixel above species limits and one below 2 m treelines were used to
derive a lapse rate for the respective site, which was then projected onto an elevation
map resulting in a thermal map with a pixel size of 10 by 10 m. This downscaling
procedure is solely based on elevation differences, whereas the differences between
pixels in the original data are based on seven more factors that partially change on site
scale, i.e. over few kilometers (Bjornsson, 2003). While latitude, longitude and distance
to sea do not change effectively on such a small scale, the first four eigenvectors of
local topography can. They denote the difference between actual topography and the
background or average topography and correspond to a north-south slope, an east-west
slope, an unimodal feature (hill/valley) and a saddle-like feature (Bjornsson, 2003). It
should therefore be noted that the downscaling method of this study can be less
accurate where the site‘s topography is variable, e.g. slopes facing different directions.
Nevertheless the method yielded good results for most sites, as was found out by cross-
89
validation (data not shown). The difference between original and computed data had
heterogenous error, i.e. deviations were usually both positive and negative in the range
between -1 and 1 °C for all temperature parameters in each region and similar
deviations did not accumulate in one area. Skaftafellsheiði was an outlier in this. There,
the error for the pixels underlying the three western transects deviated strongly from the
ones for the two eastern transects, due to slopes facing different directions. This was
solved by applying two different lapse rates, one for each slope.
4.1.3 The validity of the temperature data
The temperature maps by the IMO are based on the reference period 1961-1990. This
period was cooler than the decades before and the years after. The annual mean
temperature has gradually increased, and today (2007) it was about 1.2 °C above the
annual mean of the 1961-1990 period. The increase in summer temperatures was
slightly smaller than the annual value since winters have experienced a more
pronounced warming than summers in Iceland, causing the annual cycle of temperature
to flatten (Björnsson, written communication).
The difference between temperatures during the reference period (1961-1990) and
today has an influence onto the validity of some of the results of the present study. The
average trees at 1 and 2 m treeline were 30 and 38 years old, respectively, and thus
established during the period 1961-1990. Warmer summer temperatures after their
establishment likely caused an enhanced height growth and possibly moved the
respective treelines further uphill than the sustained mean summer temperatures of the
reference period would have. The average tree at species line was only 17 years old.
Hence many of the sampled species line trees were established after the reference
period and their establishment was likely facilitated by warmer summer temperatures.
The dendroclimatological research carried out in this study supports these suggestions,
since it shows enhanced growth for the last decades. The data made available by the
IMO was nevertheless the most recent temperature averages available for the whole of
Iceland. The extent of upward movement caused by this gradual warming during the
last 17 years was not quantified during this study. Any attempt to manipulate the
temperature thresholds would, however, be of arbitrary nature and was therefore not
attempted. Also, the relative error of temperature thresholds was supposedly similar
90
across Iceland, and should therefore not have a significant impact on the accuracy of
the predictions on today’s climatically available area in Iceland for birch growth.
4.1.4 Difference between actual treelines and the national map of birch
woodlands
The calculated thresholds for both inland and coastal regions were used to create a map
of climatically available area for birch growth in Iceland. This was undertaken by
applying the tritherm thresholds to the original tritherm map, e.g. every pixel with a
higher temperature than the threshold was part of the respective area. The outcome of
this method, intended to project the thresholds onto national level, should not be used to
predict treelines on a local scale. The main reason for this is that the pixel size of the
thermal map is too coarse for that purpose. The mean value of a pixel (900 by 900 m)
has to be above the respective threshold to fall within the climatically available area.
This can create errors, especially for areas with steep hills where a pixel´s mean value
often integrates thermal values over several hundred vertical meters, and a certain pixel
might be excluded although its lower boundaries are within the thermal limit for birch
growth. However, on a national scale this is balanced out by the opposite case, i.e. that
pixels are deemed inside the climatically available area, although their upper
boundaries are far above the altitudinal limit for birch growth.
The consequences of the coarse pixel size for the expressiveness of the birch cover on a
local scale are shown for the site Skaftafellsheidi in Fig. 50. Here another restriction for
the use on local scale becomes apparent. Since the thresholds used are calculated as
mean values from a group of similar sites, the birch cover for certain sites with lower or
higher thresholds than the average for the group will be under- or overestimated. At
Skaftafellsheiði the national model for coastal sites is not useful to predict the actual
measured treelines, since it underestimates both the 2 m line and the species line for
birch. However, this error should be balanced out at a national scale if the sample sites
represent the average conditions for the respective classes.
91
Fig. 50. Woodland cover, forest and birch cover derived from both recorded treeline
altitudes and the national model for the site Skaftafellsheiði. The forest cover
originating from earlier inventories (Bjarnason et al., 1977; Aradóttir et al., 1995;
Aradóttir et al., 2001) is painted in black. The measured altitude of the 2 m treeline is
shown in dark green and the measured species line in light green. The prediction of 2 m
birch forest from the national model is shown as crosshatched and the species line as
simple hatched.
4.1.5 Methodology of dendroclimatological analysis
Diameter and basal area increment during different times was measured for all sampled
trees. Therefore the trees were grouped in age classes despite their respective treelines
according to the age at felling. Because species line trees were on average 20 years
younger than trees at 2 m line, they were overrepresented in younger age classes and
vice versa. In order to get a sufficiently large sample size, this was accepted. However,
it can be assumed that living conditions at 2 m treeline are comparably marginal as at
species line. E.g. results the altitudinal difference of 120 m between the mean species
92
line and the mean 2 m treeline in app. 0.8 °C temperature difference (using the mean
lapse rate of 0.643 °C*100 m-1 calculated in this study) and is thus much smaller than
inter-annual temperature fluctuations in Iceland.
Diameter and basal area increment were compared between age classes. This method
did not exclude age related growth trends, as they were found for mountain birch at
treeline by Treter (1984) and Karlsson et al. (2004). To circumvent this problem, the
data was analyzed in another way. Therefore the age classes were remodeled. Age
when increment occurred, not the age at felling, determined membership of a certain
age class. Thus the increment of trees that were 21 to 30 years old at time of felling
(2006) could be compared with the increment that were 21 to 30 years old ten years ago
and so on.
4.2 Temperature limitations to growth and survival
4.2.1 Factors explaining altitude of treelines
The best predictor of treeline altitudes across all sites was September temperature,
followed by tritherm, August temperature and tetratherm (Fig. 27). Depending on
whether root growth or aboveground tissue growth is regarded, it could be expected
that tritherm (above ground tissue) or tetratherm (roots) should correspond better with
the growing season at treelines in Iceland, and thus yield better results than August or
September temperatures alone. In a study of lowland birch forest in SE Iceland,
Eggertsson and Guðmundsson (2002) found that July and August temperatures best
explained diameter growth, followed by tritherm. In another study on lowland birch
forest in northern Iceland, Levanič and Eggertsson (2008) found that growth was best
correlated with June and July temperatures. It seems therefore odd that autumn
temperatures are the best predictors of treeline altitudes in Iceland. For this reason it is
maybe not climatic limits to growth that make September temperature the best predictor
of treelines across all sites (cf. chapter 4.2.2).
4.2.2 Negative temperature relationships
The differences between sites with the highest and the lowest treelines span from 250
meters for the species line to 350 m for the 1 and 2 m lines. These differences were best
93
explained by September mean temperatures. Lowest treeline altitudes coincided with
highest September temperatures. This trend was observed not only for September
temperature, but for all other temperature variables with explanation power
(temperature of the three month period from July to September, August mean
temperature and tetratherm). In fact, every additional °C September mean temperature
coincided with a 100 m drop of treelines. Does this mean that if September becomes
warmer the treelines will get lower in Iceland? No, the underlying reason is that among
the 11 study sites the four warmest sites with the lowest treelines were all coastal sites
(Fig. 23).
Due to the influence of the Atlantic Ocean surrounding the country, coastal areas in
Iceland are associated with lower annual thermal amplitudes than areas further inland.
(Bjornsson et al., 2007b). This can be illustrated by comparing temperature data from
two meteorological stations in eastern Iceland. The stations Teigarhorn (ca. 28 m a.s.l.)
and Hallormsstaður (ca. 73 m a.s.l.) lie 50 km apart (Fig. 51). The first one is situated
on the coast, and 20 km northeast of the coastal study site Geithellnadalur, whereas the
latter lies in a sheltered inland valley 20 km northeast of the inland site Múli, south of
Fljótsdalur.
Fig. 51. Location of meteorological stations Hallormsstaður and Teigarhorn and of the
two study sites closest to them.
94
Although the coastal site Teigarhorn had a higher annual mean temperature (3.7 °C
compared to 3.4 °C in Hallormsstaður, data from the IMO and for the period 1961-
1990), its tritherm was 1.4 °C lower (Fig. 52). Mean September temperature was
slightly lower at the inland site. Coastal areas are also associated with lower daily
thermal amplitudes, especially in summer (Bjornsson et al., 2007b). The comparison
between mean maximum and minimum temperatures for the two stations show that the
higher mean summer temperatures further inland are caused by higher maximum
temperatures whereas the minimum temperatures were almost identical for both
stations (Fig. 53). Mork (1968) found that the height increment of Norway spruce
(Picea abies) increased progressively with increasing temperature of the six warmest
hours of the day, showing the influence of daily maximum temperatures for growth at
treelines; Odland (1996) found that the altitude of the forest limit in Norway climbed
faster with increasing distance to sea than the July isotherm. Hence, he found higher
treeline altitudes to correspond with lower mean temperatures further inland in Norway.
The fact that the inland treelines were between 140 (species line) and 220 m (2 m line)
higher than the coastal ones (group averages) caused the mean September temperatures
to be lower at inland treelines than at coastal treelines, thus causing the negative
relationship between September temperature and treeline altitude, while at the same
time reducing the difference between maximum summer temperatures.
95
Fig. 52. Mean monthly temperature for a coastal (blue line) and an inland
meteorological station (red line) in E-Iceland. Data from: Icelandic Meteorological
Office, 2008.
-4
-2
0
2
4
6
8
10
12
1 2 3 4 5 6 7 8 9 10 11 12
Te
mp
era
ture
(d
eg
ree
s C
els
ius)
Hallormsstaður
Teigarhorn
-6
-4
-2
0
2
4
6
8
10
12
14
16
1 2 3 4 5 6 7 8 9 10 11 12
Te
mp
era
ture
(d
eg
ree
s C
els
ius)
Tei_max
Tei_min
Hal_max
Hal_min
96
Fig. 53. Mean maximum and mean minimum temperatures for a coastal (blue line) and
an inland meteorological station (red line) in east Iceland (for abbr., see: Fig. 52). Data
from: Icelandic Meteorological Office, 2008.
Summer temperatures explained treeline altitudes inside groups better than autumn
temperatures and had smaller value ranges. Because of this and the well acknowledged
fact that summer temperatures are more important for growth at treeline than autumn
temperatures (e.g. Tranquillini, 1979), July temperatures, tritherm and tetratherm were
used to calculate thresholds for the birch treelines in Iceland and tritherm thresholds
were used to calculate the potential area for birch cover and birch forest.
One of the main aims of this study was to find out whether a single temperature
threshold for each of the three treelines researched could be established for Iceland. The
answer to this question is no. At species line, tritherm and July temperature thresholds
were significantly different for coastal and inland groups. At 1 and 2 m treelines
tetratherm thresholds were significantly different between both groups. And September
temperature thresholds were significantly different at all three treelines. This outcome
reflects the finding reported above that the difference between coastal and inland
groups is more pronounced for autumn temperatures.
4.2.3 The measured temperature thresholds compared to other studies
For enhanced clarity, and since the differences between the coastal and inland groups
were not huge (although significant for certain temperature parameters, cf. chapter
4.2.2), the mean of all sites (Table. 7) will be compared to what other researchers have
found at treelines in Iceland, Fennoscandia and elsewhere.
The 2 m treeline correlated with a mean July temperature of 8.7 °C and was thus well
below 10 °C, a value that has been repeatedly stated to coincide with treelines (e.g.
Brockmann-Jerosch, 1919; Daubenmire, 1954; in: Körner, 1998). It was also well
below the 11.2 °C mean July temperature put forward by Odland (1996) for forest
limits in Norway or the 11.4 °C by Mook and Vorren (1996), the latter with a tree
height of 3 m at treeline. The treelines in Iceland go to lower temperatures than those.
The study by Mook and Vorren (1996) excepted, the previous approaches have in
97
common a basis on temperatures recorded at meteorological stations partially far below
the actual treelines.
Körner (1998) reviewed treeline temperatures around the world and put forward a
global threshold for tree growth (3 m height) of 5.5 – 7.5 °C based on seasonal means
of air temperature at treeline positions. The corresponding values of the 2 m treeline in
this study lay at the upper end of Körner´s range. This, however, conforms with
Körner’s observation that average season temperatures for treeline sites on oceanic
islands are higher than those at more continental sites.
Researchers in Iceland and Fennoscandia have commonly linked treelines to the mean
temperatures of the three or four warmest months of the year. Jónsson (2005)
established a tritherm of 7.6 °C from maps of continuous birch cover in northern
Iceland. Although the altitude of the mapped birch cover was sometimes lower than the
altitude of the 2 m treeline in this study, it coincided roughly with the tritherm
calculated for the 1 m treeline (7.7 °C). This difference can be explained by differences
in methodology. Amongst other things Jónsson (2005) used temperature data from
1931-1960, a period that was warmer than this study´s reference period from 1961-
1990. Aas (1964) found the 2.5 m treeline in Norway to correlate with a tritherm of 9.2
°C and Odland (1996) found the forest limit in Norway at a tritherm of 9.8 °C, thus
significantly higher than the corresponding 7.9 °C at the 2 m line of this study.
Similarly, Mook and Vorren (1996) measured a tetratherm of 8.6 °C at 3 m treelines in
northern Norway and are thus well above this study´s value of 7.2 °C. Contrary to this,
Helland´s (1912; in Wielgolaski, 2005) calculation that the mountain birch treeline in
Norway follows a tetratherm of 7.3 °C conforms with this study´s tetratherm threshold.
Slettfjord (1993) assumed that a tetratherm of 6.5 °C is sufficient for the forest limit of
mountain birch in northern Norway. His threshold for the species line lies with 4.7 °C,
well below the present study´s. It is therefore not simply possible to say that Icelandic
birch treelines are generally “cooler” than found elsewhere.
4.2.4 Seedling and mature tree survival
Treter (1984) estimated temperature thresholds for “zero growth“ of birch in
Fennoscandia based on dendroclimatological research (Table 9). His results are
98
however roughly 1 °C higher than the species line temperatures in this study (Tables 6
and 7), where there still was growth.
Table 9. Estimated temperature thresholds for “zero growth“ by Treter (1984), based on
dendroclimatological data, compared to this study´s thresholds for species line.
Treeline site July Tritherm Tetratherm
Zero growth north Finland 9.1-10 °C 7.7-8.6 °C 6.8-7.3 °C
Zero growth southeast
Norway 8.1-8.8 °C 7.8-8.1 °C 7.0-7-8 °C
Species line Iceland 7.8 °C 7.0 °C 6.3°C
Both Slettfjord (1993) and Jónsson (2005) put forward different temperatures for
survival of mature trees and seedlings. Slettfjord (1993) refers to a study by Mork
(1944) that found the seed-ripening limit for dry mountain birch seeds to be at a
tetratherm of 8.2 °C, but also stated that fresh seeds can germinate at lower
temperatures than dry ones. Jónsson (2005) defines his threshold for continuous birch
cover as outlasting threshold, i.e. below a sustained tritherm of 7.6 °C mature birch
begins to die. He further assumes that it does not regenerate at temperatures directly
above 7.6 °C and assumes Aas`s (1964) tritherm threshold for 2.5 m line in Norway of
9.2 °C as a threshold for regeneration of mountain birch in Iceland. The present study
does not support this assumption, since seedlings were found at ca. 30 % of the suitable
species line sites in this study (Table 3). Birch seems to be able to regenerate at lower
temperatures. The tritherm temperature increase can be estimated by comparing the
1961-1990 mean with the 1997-2006 mean of the station Stykkisholmur, a station with
temperatures close to the mean of the whole of Iceland (Björnsson, oral
communication). If the difference of 0.85 °C that has occurred since 1961-1990 is
added to the species line threshold of 7.04 °C, a possible regeneration threshold of
7.9 °C appears.
99
4.2.5 Area thermally available for birch growth in Iceland
The area thermally available for birch included all land surfaces except rivers, lakes and
glaciers (Fig. 40 and 41). No other surfaces were excluded from the potential birch
area. Therefore the maps show the climatically available area for birch, but do not take
different surface types (habitats) into account. Thus, this study yielded a thermally
potential birch shrub cover of 41,574 km2 or 40.3 % of the total land area, e.g. if
summer temperature was the only limiting factor for birch growth and survival. The
potential birch forest cover, e.g. the birch cover with tree heights above 2 m, was
25,050 km2 or 24.3 % of the total land area. The respective areas for the approach using
thresholds calculated from all transect values below median were: 48,074 km2 (shrub
land) and 29,966 (forest), see: Table 8. The median method yielded birch forest cover
as far north as the Westfjords in W-Iceland and Öxarfjörður in E-Iceland, both located
just below the Arctic Circle. While the prediction for east Iceland is backed up by
actual birch forest climbing up the hills in Öxarfjörður (personal observation), hardly
any birches at all can be found in Strandir, the northern peninsula of the Westfjords
(Óladóttir, oral communication). Since the maximum method predicts extensive birch
shrub there, it is deemed to overestimate the potential area. Therefore the mean method
is deemed to be the better alternative to estimate the birch cover in Iceland.
Fig. 54 compares these results to earlier attempts to estimate the potential or historical
birch cover in Iceland. Bjarnason (1971) as well as Blöndal and Gunnarsson (1999) are
two examples of birch shrub cover estimations based on assumed altitudinal limits.
Blöndal and Gunnarsson (1999) assumed that birch could not grow above 400 m a.s.l.
and excluded also some areas below 400 m, i.e. floodplains. Bjarnason (1971) assumed
different altitudinal limits for the birch ranging from 200 m for the northern peninsulas
to 550 m a.s.l. in the mid-highlands. Bergthorsson´s (1996) and Ólafsdóttir´s (2001)
approaches were based on a treeline-temperature relationship by Mork (1968) for
mountain birch in Norway and yielded the lowest results. This is consistent with the
fact that Norwegian studies yielded much higher thresholds for mountain birch than this
study (cf. chapter 4.2.3). Ólafsdóttir´s (2001) estimation was the only one which
explicitly denoted birch forest above 2 m height, whereas all other authors implied that
their estimations also include birch shrubs. Jónsson (2005) established an Icelandic
threshold of 7.6 °C for continuous birch cover, which predicted ca. 48,000 km2 as
100
potential birch cover. This estimate is 16% higher than the one predicted by the mean
threshold method in the current study, but similar to the one of the median method.
Jónsson (2005), however, assumed a single temperature threshold for the whole of
Iceland, which was based on sites in N-Iceland alone.
Fig. 54. Comparison between potential birch area as predicted by this study and
proceeding ones. Red bars show estimates of this study and blue bars those of other
authors. Only the two forest covers of this study and the approach by Ólafsdóttir denote
birch cover over 2 m tree height.
Summarizing all earlier attempts, the potential area for birch shrub cover has been
deemed to be around 25 %. This is in accordance with the 2 m forest cover estimated in
this study, but is much lower than the estimate for birch shrub land. It has to be stated,
however, that the differentiation between birch shrubs and forest in this study is solely
based on temperature and birch growth at 11 sites in Iceland. Mountain birch often does
not grow above 2 m in height even where thermally inside the 2 m treeline and ca. 80 %
of all birch woodlands are lower than 2 m (Traustason and Snorrason, 2008). The
reasons for the extensive occurrence of birch in the form of low shrubs are deemed to
be both environmental and genetic. Kristinsson (1995) emphasizes the influence of
0 5 10 15 20 25 30 35 40 45 50
Ólafsdóttir (2001)
Bergthórsson (1996)
Mean Forest cover
Jónsson (2005), modified
Blöndal and Gunnarsson (1999)
Max. Forest cover
Bjarnason (1971)
Mean shrub cover
Jónsson (2005), potential
Potential area (1000 km2)
101
extreme oceanic climate and heavy coastal storms on the growth form of birch whereas
other authors (see review by Anamthawat-Jónsson, 2003) favor the theory that
introgressive hybridization of B. pubescens with the dwarf birch B. nana is responsible
for it.
4.2.6 How to estimate the woodland cover at settlement from the climatically
potential area?
The mean shrub cover in Fig. 40 is the climatically available area for birch in Iceland,
but does not take into account that some surface types are not suitable for birch growth.
The area therefore includes modern settlements, agricultural fields, gravel floodplains,
beaches, wetlands, presently unvegetated land and recent lava fields. To estimate how
much of Iceland was actually covered by birch forest and shrubs in the 9th century, one
has to take these different surface types into account and estimate how they were
distributed 1,100 years ago. Can this be done in a reasonable way?
Jónsson (2005) grouped the potential area according to present vegetation or land use
types and estimated what share of each surface type could be grown with birch, thus
reducing his estimate from 48,000 km2 to 26,000 km2 (Fig. 54). Similar factoring out
was done for a map of historical mountain birch cover of Iceland in Blöndal and
Gunnarsson (1999), resulting in an estimate of 28,000 km2.
In this study the potential area was grouped according to present vegetation types. The
vegetation data comes from the Agricultural University of Iceland and consists of a
raster with a pixel size of 15 by 15 m. The vegetation map is not quite finished yet
(state: November 2007; only 88 % of the potential area could be classified). It gives,
however, a good estimation of the whole area. Vegetation types with both considerable
extent inside the potential area for birch growth and a debatable ability to sustain birch
growth will be discussed here.
102
Fig. 55. Different classes of present vegetation classes and their share of potential
mountain birch area.
Present unvegetated areas made up 14 % of the potential birch shrub area (Fig. 55).
Together with present half-vegetated areas they made up ¼ of the potential area and are
thus the single biggest vegetation class to be considered if covered by birch at
settlement. The main reasons for the disappearance of the birch forests in Iceland after
the Viking settlement in the 9th century were clear-cutting of forests for charcoal
production and subsequent grazing mainly by sheep (H. Bjarnason, 1974; Þórarinsson,
1974; cf. Chapter 1.1.5) as well as climatic deterioration (Ólafsdóttir et al., 2001). The
disappearing forests left the land open thus affecting runoff characteristics (Einarsson,
1961; Þórarinsson, 1961). This led to that during rapid rain or snow melt the water did
not percolate down through the soil, but formed surface runoff that was often
concentrated by topography and cut gullies into soil and the remaining vegetation cover
(Einarsson, 1994). Isolated erosion spots then broke the vegetation cover and exposed
the underlying loessial soil to wind and water erosion, thus further eroding the topsoil.
As the degradation progressed small erosion patches joined to form large barren areas
Grassland
Cultivated land
Heathland
Forests
Mosses
Wetlands
Half-vegetated land (20-50% vegetation cover)
Unvegetated land (0-20% vegetation cover)
Water
103
(deserts). Since the onset of the desertification in Iceland can be dated back to the
Viking settlement (H. Bjarnason, 1974; Þórarinsson, 1974), it is very likely that a large
part of the presently unvegetated lowland areas were covered by birch at the time of
settlement – if not restricted by edaphic factors (cf. next paragraphs). Furthermore
Aradottir and Eysteinsson (2005) report a natural expansion of birch on a disturbed site
in S-Iceland.
Semi-wetlands and wetlands made up 11% of the potential birch shrub area. The
majority of Icelandic wetlands are so called ‘sloping myres’ (IS: hallamýrar;
Steindórsson, 1964), which would be covered by birch shrubs to a large extent if
protected from livestock grazing. This is quite apparent when the area Hallormsstadur
in eastern Iceland is studied. Hallormsstaður was protected from sheep grazing in 1905
and is the oldest protected forest area in Iceland (Blöndal and Gunnarsson, 1999). It is
therefore only fens and other wetland classes with surface water permanently found at
or above the soil surface that should be deducted from the potential area. These
constitute, however, only a minor part of the wetlands of Iceland.
Recent lava fields in lowland areas are unvegetated for some decades after eruptions
take place, but mountain birch commonly colonizes such substrates quite early in the
vegetation succession if it is found nearby (Á. H. Bjarnason, 1991). Since settlement,
lava has covered ca. 1% of Iceland’s surface (S. Sigurdsson, 1977). Assuming that
1/10th of this area was created each century and that birch would normally have
covered the lava within 100 years, such treeless surfaces at the time of settlement
should only have been ca. 100 km2, or 0.1% of Iceland’s surface. This is such a small
number that it may be neglected.
Another surface class whose ability to sustain birch growth has been debated are
floodplains. They make up vast areas in S- and SE-Iceland and have been deducted
from historical birch cover, e.g. by Blöndal and Gunnarsson (1999). Volcanic eruptions
under glaciers have occurred regularly in Iceland, leading to the creation of large gravel
floodplains where the melt water passed on its way to the sea. Such surfaces can,
however, be easily colonized by birch (Marteinsdóttir, 2004; Marteinsdóttir et al.,
2007). When a larger part of the landscape was covered by birch woodlands and neither
livestock grazing nor lack of seed rain were limiting regeneration, such surfaces would
have regained their forest cover between floods. Recently, Eggertsson et al. (2004)
104
described remains of such a mountain birch forest on Markárfljótsaurar in S-Iceland,
which was probably destroyed just before settlement by a flood from the glacier
covered volcano Mt. Askja. This proves that at least this floodplain was covered by
forest before settlement. Also, it is known that periodic glacial floods in SE Iceland
started after 1200 and became frequent during the little ice-age when glaciers expanded
in area and thickness (S. Björnsson, 2003). It is very doubtful that their present extent
should be used for the settlement period. Therefore, it could be argued that only small
part of the present gravel floodplains in Iceland should be deducted from the historical
woodland area.
Another factor affecting the actual birch cover is whether or not forest can grow on
peninsulas due to high degrees of oceanity (cf. 4.3).
4.3 Influence of oceanity
The classification analysis split all sites into groups based on temperature values only.
The four sites of the coastal group were not only the ones closest to sea but also the
ones with the lowest treelines. Was this solely an effect of lower maximum
temperatures per se at the same mean temperature (cf. chapter 4.2.2) or were there some
additional stress factors that explain lower treelines at coastal sites in Iceland?
To investigate alternative explanations to changes in treeline altitude, distance to
shoreline and distance to open sea were applied as independent variables in a linear
regression analysis. The reason for distinguishing the two variables was that Bjornsson
and Jonsson (2003) had shown that the annual cycle of temperature differs between
areas on the edge of peninsulas and areas inside fjords. Distance to open sea explained
more of the variation in treeline altitude than distance to shoreline: 41 % vs. 14 %
(values referring to 1 m treeline). For distance to open sea every km further inland
coincided with a treeline altitude rise of 4 m. By excluding Haukadalur, the site furthest
inland whose disturbed treeline character has been discussed before, this number was
increased to 6 m. Thus, distance to open sea explained 58 % of the variation in treeline
altitude for the 10 remaining sites. Kjällgren and Kullman also found a significant
positive relation between shortest distance to sea (distance to shoreline in this study)
and birch tree limit altitude in Sweden. Sea distance explained 50 % of variation in tree
limit altitude. Odland (1996) plotted the position of the birch forest limit in Norway
105
against the distance from the coastal reference line (similar to the distance to open sea
in this study). In a linear regression analysis he thus explained 94 % of variation in
forest limit altitude. The forest limit rose about 5 m for every km further east (inland).
That these two examples represent a general trend is shown by Aas and Faarlund
(2001), who showed that birch treelines in Scandinavia rise markedly with increasing
distance to the North Atlantic coast.
Since the differences between altitudes could at least be partially attributed to sea
distance of treelines, salt stress was taken into account as one factor influencing
treelines in Iceland. Jónsson (2002) divided Iceland into different areas based on salt
deposition based on a map of groundwater chloride content by F. Sigurðsson (1993).
He found that in the high salt deposition areas situated close to the sea (but going
further inland in the South-West) tree growth was severely restricted and shoot dieback
a common occurrence. The present study used the same data by F. Sigurdsson (1993) to
determine the influence of marine salt depositions on treeline altitude. In a linear
regression groundwater chloride explained 44 % of variation in treeline altitude (Fig.
30); with every additional ppm chloride in groundwater, treeline altitude dropped ca. 30
m. This is a strong indication for a possible influence of salt stress.
To investigate the relationship between treeline altitude and salt stress further, the
chloride content of top shoots was analyzed. This method has been previously
employed by Jónsson (2006), who found salt induced growth suppression (terminal bud
failure) for an exotic broadleaved species (Populus trichocarpa) in S-Iceland. In the
present analysis, only a weak correlation was found between wood chloride content and
treeline altitude (R2=0.10). Thus, the hypothesis that salt stress, caused by marine
aerosols, influences the position of treeline could not be confirmed. However, it should
be stated that this study cannot be used to reject it either, due to the little sample size of
coastal sites. Also, there existed some unexplained variability in the chloride content of
trees at the site Þórðarstaðaskógur that had a large impact on the results. Although it is
situated far inland in the north of Iceland, and should thus not be exposed to the salt
laden North Atlantic cyclones, it had the second highest chloride content of all sites.
When it was removed from the analysis the explanation power of tissue chloride
content rose to 59 %, making it possible to interpret the data in a way that marine
aerosols would have a strong influence on treeline altitude. Þórðarstaðaskógur,
106
however, cannot be excluded from the present study for any valid reasons, so the
question about the impact of marine aerosols remains.
4.4 Treelines and climate change
Today (2007) the annual average temperature in Iceland is 1.2 °C higher than it was
during the relatively cold reference period from 1961-1990 (Björnsson, written
communication). Winters have warmed slightly faster than summers, making the
increase for the growing season slightly smaller (Björnsson, written communication). If
the annual cycle of temperature continues to flatten, predictions about summer
temperatures instead of annual temperature development are valuable. Björnsson
(2008) predicts a tritherm warming of 0.2 °C per decade for the next century, leading to
an increase of 0.8 °C in summer temperature until 2050.
One of the main aims of this study was to determine whether the ongoing warming
trend can be seen at Icelandic birch treelines, i.e. whether there is proof for enhanced
growth at treelines and whether the birch already started moving upwards. Clues for the
latter have been documented for mountain birch in other countries after relatively warm
periods. Aas (1969) found that the climatic timberline of birch in southeastern Norway
rose at least 40 m from 1918-1968, i.e. after the warm period from 1930-1950. Kullman
(2002) recorded recently established birch saplings in the Swedish Scandes 300 vertical
meters above the highest seedlings of preceding studies.
Unfortunately, birch treelines in Iceland had not been mapped using strict height
definitions before this study. Therefore this study had to make use of a map of birch
woodland cover, originating from past inventories (Bjarnason et al., 1977; Aradóttir et
al., 1995; Aradóttir et al., 2001). A comparison between the upper limits of the mapped
woodland cover and the present analysis showed that species limits were found above
the historical mapped area for 10 sites out of 11. At site Geithellnadalur the species line
was found below the mapped area, but no remnants of a previously existing birch forest
were found where the map indicated. At the site Skaftafellsheiði even the present 2 m
line was partly far above the mapped woodland (Fig. 56). Since the historical woodland
map denotes continuous woodland cover (regardless of height), and was based on aerial
photos and only augmented with terrestrial measurements, it could be argued that the
birch found at the treelines were already there when the map was made. The age
107
established for the sample trees speaks against this argument. The average sample trees
at species line, 1 m line and 2 m line in Skaftafellsheiði were 9, 17 and 30 years old,
respectively (Fig. 42), i.e. not existing or only seedlings at the time when the first map
was created (1977).
Fig. 56. Comparison between previously mapped woodland cover (black) and treeline
altitudes for the site Skaftafellsheidi. The mean altitudes of the five transects have been
averaged so that the altitudinal area between species line (red points) and 1 m treeline
(yellow points) is painted bright green, the one between 1 and 2 m treeline (blue points)
turquoise and the area below 2 m line dark green. The terrain rises from southwest to
northeast. In the east and painted white is Skaftafell glacier.
There is another, heavier argument weakening the hypothesis that a change in treeline
altitude in Iceland can be used as a valuable clue for recent climate warming. The
woodlands might have been kept below their altitudinal limits by other factors than
climate, such as land use (sheep grazing). Thus, the recent advance of birch treelines
108
could also be the result of a change in land use. This argument is especially significant
for the site Skaftafellsheiði, where treelines far above the mapped woodland coincide
with a land use change. The area was turned into the Skaftafell National Park in 1972
and was fully protected from grazing in the 1980s. Most of the trees sampled at
treelines in Skaftafellsheiði were established after effective protection took place in the
early 1980s (Fig. 42). Many of the other study sites have not been protected from
sheep grazing, but still they showed signs of higher species and 1 m treelines compared
to the historical woodland map, although only two other sites featured 2 m treelines
fully above the mapped woodland (Eyjolfsstaðaskógur and Múli south of Fljótsdalur).
It can therefore not be fully rejected that a change in sheep grazing - along with warmer
weather - explains the advance in treeline altitude.
The strongest argument that birch treelines are indeed generally moving upwards in
Iceland was the difference in age between the sample trees of different treelines. These
data are not dependent on any historical comparison to other data. For all sites except
Fifustaðaskógur, where the oldest tree of the study was recorded at species line, species
line trees were younger than trees at 1 m treeline, and both lines were younger than 2 m
treeline (17, 30 and 38 years, respectively; cf. chapter 3.6). The simplest explanation
for this is that the trees from higher lines were established later, which would prove an
upward movement of birch. An alternative explanation for this age pattern, i.e.
indicating no upward movement, would be that living conditions for birch at higher
altitudes are far worse and thus leading to lower life expectancy, higher renewal rate of
birch stems and lower mean age. The latter argument cannot be refuted directly, but the
vigorous growth seen in all sample trees (Fig. 44-47) and the same ratio between 1 and
2 m treelines are not supporting gradually higher mortality at higher altitudes. The
results of the dendroclimatological analyses strongly favor the first explanation that
treelines are really moving upwards in Iceland.
Diameter and basal area increment during different times was measured for all sampled
trees. Basal area increment is a good indicator of biomass increment in mountain birch
in Iceland (B. D. Sigurðsson, oral communication). 10 year mean increments during
different times were compared for each age class (Fig 44 and 45). This showed that all
age classes grew more during the last decade than in any previous decade. This proves
that mountain birch is now growing much better at treeline than previously, most
109
probably due to higher summer temperatures. This is in accordance with Kullman
(1993), who showed that birch close to the tree limit in Sweden had three to four times
more radial increment during the warm 1930s than in the cooler decades before and
afterwards. Eggertsson et al. (2002) also recorded bigger ring widths between 1930 and
1950 in a lowland birch forest in SE Iceland and Karlsson et al. (2004) found decades
of growth enhancements for birch in Sweden following increased temperatures.
4.5 Other factors influencing treeline altitudes
One remaining question is whether enhanced radial growth at the treeline and seedling
establishment above it will continue to lead to a lasting rise of mountain birch treelines
in Iceland, or if climate warming can somehow create new stresses that counteract the
effect of higher temperatures. There are some scholars who have advocated that.
Sveinbjörnsson (1992) stresses the disadvantageous effects of increasing temperatures.
So increasing winter temperatures could cause higher snow loads and thus delay the
start of the growing season. In the period of warmer climate during the past 15 years,
this phenomenon has not been observed as a major limiting factor (Halldórsson et al., in
press).
Sveinbjörnsson (1992) furthermore states that warmer winters could lead to higher
survival rates of insect herbivores, such as Oporinia autumnata, which is able to
devastate birch forests in northern Fennoscandia where minimum winter temperatures
are not low enough to kill its eggs. Holtmeier (2003) also states that mass outbreaks of
leaf eating insects, whose intensity is likely to increase with rising temperatures, could
limit advances of treelines. Increased insect outbreaks and local dieback of birch has
been observed in the past decade in Iceland (Hallgrímsson et al., 2006). The negative
effect of this is small compared to the positive effect on growth and survival of birch
(Halldórsson et al., in press).
Sveinbjörnsson (1992) further predicted that higher summer temperatures might
improve seed production of trees, but would also promote competition for space, e.g.
with herbaceous species, thus making seedling establishment more difficult. Paulsen et
al. (2000) do not believe that seedling success itself has predictive value for potential
advance of treelines as long as individual trees are small and nested in the ground,
where they profit from radiative warming close to the ground. This argument weighs
110
more heavily for mid latitude (high altitude) treelines, where radiative warming is more
extensive than at high latitude treelines.
Holtmeier (2003) stresses that treeline advance due to climate warming can be
restricted by other factors than summer temperature, at least on a local scale, where
edaphic and topographic conditions can inhibit treeline advance. Paulsen et al. (2000)
believe that an advance of the treeline could take place even without an increase in
mean temperature, if low temperature events, which limit treelines today, become so
rare that they become insignificant. Kullman (2002) also emphasizes the role of short-
term extremes, like cold, snow, poor winters, for treeline advance. If such events were
still occurring in a generally warmer world, they could inhibit or even reverse treeline
advance. Both Kullman (2002) and Holtmeier (2003), however, emphasize that if the
present warming continues, treelines will advance sooner or later, even if they won’t do
so with the same speed everywhere.
This study indicates that in Iceland, a) treeline birch trees are growing much better now
than during the past 50 years, b) emerging seedlings are commonly found at present
treelines and c) it is most likely that treelines have been moving upwards during the
past decades. This coincides with a 1.2 °C increase in mean annual temperature from
the reference period 1961- 1990 (Björnsson, written communication). If the mean
summer temperature was the sole factor influencing treeline altitude, the mean lapse
rate in this study should indicate what would be the increase in treeline altitude in
Iceland. The average tritherm lapse rate of all sites was 0.6426 degrees Celsius per 100
m (1 degree per 156 m). According to Björnsson (2008), and depending on which IPCC
scenario the estimation is based on, the summer temperature in Iceland will be 0.9
(scenario B1) to 1.8 °C (scenario A2) warmer during the period 2091-2100 than it is
today. Everything else being equal - and without considering the time needed for
regeneration - this could possibly lead to a 140-280 m upward movement of birch
treelines in Iceland. However, this maximum potential increase is only valid when other
limiting factors, such as salt stress and edaphic factors, are not included. Nevertheless,
it seems likely that the trend discovered in the present analysis will continue into the
future.
111
References
Aas, B. (1964). Björke- og barsskoggrenser i Norge. Unpublished thesis. Oslo.
Aas, B. (1969). Climatically Raised Birch Lines in Southeastern Norway 1918-1968. Norsk geogr. Tidsskr. 23: 119-130.
Aas, B. and Faarlund, T. (1996). The present and the Holocene subalpine birch belt in Norway. Paläoklimaforschung, 20: 19-42.
Aas, B. and Faarlund, T. (2001). The holocene history of the Nordic mountain birch belt. In: Nordic Mountain Birch Ecosystems (Wielgolaski, F. E. ed.), pp. 5-22. UNESCO, Paris, and Parthenon Publishing, Carnforth.
Agricultural Research Institute of Iceland, taken from http://www.rala.is/desert/2-1.html (29.06.2008).
Anamthawat-Jónsson, K. (2003). Hybrid introgression in Betula. In: Plant genome – biodiversity and evolution. Vol.1. Phanerogams (Sharma, A.K. and Sharma A eds.), pp. 249-265. Enfield, USA/Plymouth.
Aradottir, A.L. and Arnalds O. (2001). Ecosystem degradation and restoration of birch woodlands in Iceland. In: Nordic Mountain Birch Ecosystems (Wielgolaski, F. E. ed.), pp. 295-308. UNESCO, Paris, and Parthenon Publishing, Carnforth.
Aradóttir, Á.L. and Eysteinsson Th. (2005). Restoration of birch woodlands in Iceland. In: Restoration of boreal and temperate forests (Stanturf, J.A. and Madsen P. eds.), pp. 195-209. CRC Press, Boca Raton.
Aradóttir, Á.L., Þórsteinsson, I. and Sigurðsson S. (1995). Birkiskógar Íslands. Könnun 1987-1991. I. Yfirlit, aðferðir og niðurstöður fyrir Laugardalshrepp í Árnessýslu og Hálshrepp í Suður-Þingeyjarsýslu. (Survey of Icelandic birch woodlands 1987-1991. I. Overview, methods and results for Laugardalshreppur district in South-Iceland and Hálshreppur districs in North Iceland). IFRS Report 11. In Icelandic with English abstract.
Aradottir, A.L., Thorsteinsson I. and Sigurdsson, S. (2001). Distribution and characteristics of birch woodlands in North Iceland. In: Nordic Mountain Birch Ecosystems (Wielgolaski, F. E. ed.), pp. 51-61. UNESCO, Paris, and Parthenon Publishing, Carnforth.
Arnalds, A. (1987). Ecosystem disturbance in Iceland. Arctic Alpine Research 19: 508-513.
Arnalds, O. (2004). Volcanic soils of Iceland. Catena 56: 3-20.
Arnalds O. and Kimble J. (2001). Andisols of deserts in Iceland. Soil Science Society of America Journal 65: 1778-1786.
Bárðarson, G.B. (1913). Skógræktin og loftslagið. Freyr 7: 96.
Bergthorsson, P. (1985). Sensitivity of Icelandic agriculture to climatic variations. Climatic Change 7: 111-127.
Bergþórsson, P. (1996). Hitafar og gróður. Icelandic Agricultural Sciences, 10: 141-164. In
Icelandic with English summary.
112
Bergþórsson, P., Björnsson, H., Dýrmundsson, Ó., Guðmundsson, B., Helgadóttir, Á. and Jónmundsson, J.V. (1987). The effects on Climatic Variations on Agriculture in Iceland. In: The Impact of Climatic Variations on Agriculture. Vol. I: Assessment in Cool Temperate and Cool Regions (Parry M.L., Carter T.R. and Konijn N.T. eds.), pp. 387-444. IIASA and UNEP, Dordrecht.
Bjarnason, Á.H. (1991). Vegetation on lava fields in the Hekla area, Iceland. Acta Phytogeographica Suecica: 114 p.
Bjarnason, H. (1971). Um friðun lands og frjósemi jarðvegs. Ársrít skógræktarfélags Íslands: 4-19. In Icelandic with English summary.
Bjarnason, H. (1974). Athugasemdir við sögu Íslendinga í sambandi við eyðingu skóglendis (Comments on the history of Icelanders in relation to woodland destruction), Yearb. Icel. For. Soc., 30, 1974 (in Icelandic, with English summary).
Bjarnason H., Sigurðsson, S., Jörundarson, H. (1977), Skóglendi Íslands. Athugarnir á stærð þess og ástandi (Woodlands in Iceland. A survey of their extent and condition) Skógrækt ríkisins og Skógræktarfélag Íslands, Reykjavík (In Icelandic).
Bjornsson, H. (2003). Eigenvectors of local topography in Iceland. VÍ-ÚR07, Reykjavík.
Björnsson, H. (2008). Túlkun sviðsmynda fyrir Ísland og nærliggjandi svæði. In: Veðurfarsbreytingar og afleiðingar þeirra. Skýrsla vísindanefndar um loftslagsbreytingar. Umhverfisráðuneytið (in press). In Icelandic.
Bjornsson, H. and Jonsson, T. (2003): Climate and climatic variability at Lake Myvatn. Aquatic Ecology 38: 129-144.
Bjornsson, H., Olason, E.O., Jonsson, T. and Henriksen, S. (2007a). Analysis of a smooth seasonal cycle with daily resolution and degree day maps for Iceland. Meteorologische Zeitschrift 16, 1: 57-69.
Bjornsson, H., Jonsson, T., Gylfadottir S.G. and Olason E.O. (2007b). Mapping the annual cycle of temperature in Iceland. Meteorologische Zeitschrift 16, 1: 45-56.
Björnsson, S. 2003. Skeiðarársandur og Skeiðará. Náttúrufræðingurinn 71(3-4): 120-128.
Blöndal, S., oral communication.
Blöndal, S. and Gunnarsson, S.B. (1999). Íslandsskógar - Hundrað ára saga. Mál og mynd, Reykjavík. In Icelandic.
Bowling, S.A. (1993). Climate Change as seen by trees and by climate modelers. In: Forest Development in Cold Climates (Alden, J. et al. eds.), pp. 189-202. Plenum Press, New York.
Cairns, D.M. and Moen, J. (2004). Herbivory influences tree lines. Journal of Ecology 92: 1019-1024.
Dalen, L., and Hofgaard, A. (2005). Differential Regional Treeline Dynamics in the Scandes Mountains. Arctic, Antarctic, and Alpine Research 37, 3: 294-296.
Eggertsson, Ó. and Guðmundsson, H.J. (2002). Aldur birkis (Betula pubescens Ehrh.) í Bæjarstaðarskógi. Áhrif veðurfars á vöxt þess og þroska (The age of the birch (Betula
113
pubescens Ehrh.) woodland at Bæjarstaður, Southern Iceland). Skógræktarritið (Journal of Icelandic Forestry Association), 2002 (2): 85-89.
Eggertsson, Ó., Knudsen, Ó. and Guðmundsson, H.J. (2004). Drumbabót í Fljótshlíðfornskógur sem varð Kötlu að bráð? Rit Fræðaþing landbúnaðarins 2004: 337-340 (In Icelandic).
Einarsson, M. Á. (1976). Veðurfar á Íslandi (Climate in Iceland). Iðunn, Reykjavík, 150 p.
Einarsson, Þ. (1961). Pollenanalytische Untersuchungen zur spät- und postglazialen Klimageschichte Islands. Sonderveröffentlichungen des Geologischen Instituts der Universität Köln, 6.
Einarsson, Þ. (1994). Geology of Iceland, rocks and landscape. Mäal og menning, Reykjavík, 309 p.
Emberlin, J.C. and Bailie, I.C. (1980). Aspects of birch regeneration in two woods at Inverpolly National Nature Reserve. Wester Ross. Scott. For. 34, 13-34.
Eythórsson, J. and Sigtryggsson, H. (1971). The climate and weather of Iceland. The zoology of Iceland I (3): 1-62.
Eysteinsson, Th. (1999). Sjálfbær þróun skógræktar og hin sex þverevrópsku viðmið.
Skógræktarritið 1999, 2: 73-82.
Eysteinsson, Þ., oral communication.
Farmers Association of Iceland. Taken from: www.bondi.is (29.06.2008).
Gansert, D. (2004). Treelines of the Japanese Alps – altitudinal distribution and species composition under contrasting winter climates. Flora 199: 143-156.
Grace, J. (1989). Tree lines. Philosophical Transactions of the Royal Society (London) Series B324: 233-245.
Grace, J., Berninger, F. and Nagy, L. (2002). Impacts of Climate Change on Tree Line. Annals of Botany 90: 537-544.
Guðjónsson G. and Gislason E.,(1998) A vegetation map of Iceland, general overview 1:500,000, Icelandic Institute of Natural History, Reykjavík.
Gudmundsdóttir, G. and Sigurdsson, B.D. (2005). Photosynthetic temperature response of mountain birch (Betula pubescens Ehrh.) compared to two other broadleaved tree species in Iceland. Icelandic Agricultural Sciences 18: 43-51.
Hallgrímsson, H., Halldórsson, G. and Kjartansson, B.Þ. (2006). Birkidauðinn á Austurlandi 2005. Skógræktarritið (Journal of Icelandic Forestry) 2006(2): 46-55.
Hallsdóttir, M. (1995). On the pre-settlement history of Icelandic vegetation. Icelandic Agricultural Sciences 9: 17-29.
Handa, T., Körner, Ch. and Hättenschwiler, S. (2005). A test of the treeline carbon limitation hypothesis by in situ CO2 enrichment and defoliation. Ecology 86: 1288-1300.
114
Haraldsson, H.V. and Ólafsdóttir, R. (2001). Dynamic Simulations of Potential Vegetation Cover and Long-Term Climatic Fluctuations in Iceland. Global and planetary change (submitted).
Havranek, W.M. and Tranquilini, W. (1995). Physiological processes during winter dormancy and their ecological significance. In: Ecophysiology of coniferous forests (Smith, W.K. and Hinckley, T. N. eds.), pp. 95-124. Academic press, San Diego.
Hecht, B.P., Vogt, K.A., Eysteinnson, Þ. and Vogt, D.J. (2007). Changes in air and soil temperatures in three Icelandic birch forests with different land-use histories. Icelandic Agricultural Sciences 20: 49-60.
Heiðarsson, L., oral communication.
Hobbie, S.E. (1996). Temperature and plant species control over litter decomposition in Alaskan tundra. Ecol. Monogr. 66: 503-522.
Íslendingabók-Landnámabók (1968). Íslenzk fornrit I (1). Reykjavík.
Jónsson, Th.H. (2002). The salt problem and research on salt tolerance of tree species in Iceland. In: Proc. Urban forests and trees, COST Action E12 (Randrup, T. B. et al. eds.), pp. 151-160, European Commission, Director-General for Research. Luxembourg, Office for Official Publications of the European Communities.
Jónsson, Th.H. (2004). Stature of Sub-arctic Birch in Relation to Growth Rate, Lifespan and Tree Form. Annals of Botany 94 (5): 753-762.
Jónsson, Þ.H. (2005). Útbreiðsla birkis á Íslandi (Distribution of birch in Iceland). Skógræktarritið 2: 60-71.
Jónsson, Th.H. (2006). Terminal bud failure of black cottonwood (populus trichocarpa) exposed to salt-laden winter storms. Tree Physiology 26: 905-914.
Jónsson, Þ.H., oral communication.
Jónsson, Þ.H., written communication.
Karlsson, P.S., Tenow, O., Bylund, J., Hoogesteger, J. and Weih, M. (2004). Determinants of mountain birch growth in situ: effects of temperature and herbivory. Ecography 27: 659-667.
Karlsson, P.S. and Weih, M. (2001). Soil Temperatures near the Distribution Limit of the Mountain Birch (Betula pubescens ssp. czerepanovii): Implications for Seedling Nitrogen Economy and Survival. Arctic Antarctic and Alpine Research 33, 1: 88-92.
Kjällgren, L. and Kullman, L. (1998). Spatial patterns and structure of the mountain birch tree-limit in the southern Swedish Scandes – A regional perspective. Geografiska Annaler 80 A: 1-16.
Körner, Ch. (1998). A re-assessment of high altitude treeline positions and their explanation. Oecologia 115: 445-459.
115
Körner, Ch. (1999). Alpine plant life: functional plant ecology of high mountain ecosystems. Springer, Berlin (2nd edition 2003).
Körner Ch. (2003), Carbon limitation in trees. Journal of Ecology, 91: 4-17.
Körner, Ch. and Paulsen, J. (2004). A world-wide study of high altitude treeline temperatures. Journal of Biogeography 31: 713-732.
Kristinsson, H. (1995): Post-settlement history of Icelandic forests. Icelandic Agricultural Sciences 9: 31-35.
Kristinsson H., oral communication.
Kullman, L. (1988). Holocene history of the forest-alpine tundra ecotone in the Scandes Mountains (central Sweden). New Physiologist 108: 101-110.
Kullman, L. (1993). Tree limit dynamics of Betula pubescens ssp. tortuosa in relation to climate variability: evidence from central Sweden. Journal of Vegetation Science 4: 765-772.
Kullman, L. (1998). Tree-limits and Montane Forests in the Swedish Scandes: Sensitive Biomonitors of Climate Change and Variability. Ambio 27: 312-321.
Kullman, L. (2001). 20th Century Climate Warming and Tree-limit Rise in the Southern Scandes of Sweden. Ambio 30, 2: 72-80.
Kullman, L. (2002). Rapid recent range-margin rise of tree and shrub species in the Swedish Scandes. Journal of Ecology 90: 68-77.
Kullman, L. and Kjällgren, L. (2000), A coherent postglacial tree-limit chronology (Pinus sylvestris L.) for the Swedish Scandes: Aspects of paleoclimate and recent warming , based on megafossil evidence. Arctic, Antarctic, and Alpine Research 32: 419-428.
Levanic, T., Eggertson, O. (2008). Climatic effects on birch (Betula pubescens Ehrh.) growth in Fnjoskadalur valley, northern Iceland. Dendrochronologia 25, 135-143.
Malyshev, L. (1993). Levels of the upper forest boundary in northern Asia. Vegetatio 109: 175-186.
Marteinsdóttir, B. (2004). Landnám birkis á Skeiðarársandi. Skýrsla til Nýsköpunarsjóðs. Háskóli Íslands, Reykjavík. p. 33.
Marteinsdóttir, B., Svavarsdóttir, K., and Þórhallsdóttir, Þ.E. (2007). Landnám birkis á Skeiðarársandi. Náttúrufræðingurinn 75(2-4): 71.
Mook, R. and Vorren, K.D. (1996). The temperature climate at the altitudinal vegetation limits in Skibotn, northern Norway. In: Holocene treeline oscillations, dendrochronology and palaeoclimate (ed. Frenzel, B.). G. Fischer, Stuttgart.
Mork, E. (1968). Økologiske undersøkelser i fjellskogen i Hirkjolen forsoksområde. Meddelser fra Det Norske Skogforsøksvesen 93, 25: 461-614. Norwegian with English summary.
Nature Conservation Council (1996), Nature Conservation Register, 7. ed. Nature Conservation Council, Reykjavík. In Icelandic, with English summary.
NLSI, Iceland in Statistics, taken from www.lmi.is (29.06.2008)
116
Odland, A. (1996). Differences in the vertical distribution pattern of Betula pubescens in Norway and its ecological significance. In: Holocene treeline oscillations, dendrochronology and palaeoclimate (ed. Frenzel, B.). G. Fischer, Stuttgart.
Óladóttir, A., oral communication.
Ólafsdóttir, R., Schlyter, P. and Haraldsson, H.V. (2001). Simulating Icelandic vegetation cover during the Holocene. Implications for long term land degradation. Geogr. Ann. 83 A, 4: 203-215.
Paulsen, J., Weber, U.M. and Körner, Ch. (2000). Tree growth near treeline: abrupt or gradual reduction with altitude? Arctic, antarctic, and alpine research 32, 1: 14-20.
What about ragnarss 1969?
Ragnarsson, H. (1969). Skýrsla um tilraunir í skógrækt 1968. Skógræktarritið.
Ragnarsson, H. (1977). Um skógræktarskilyrði á Íslandi. In: (Guðmundsson, H., Þorsteinsson, I.I., Sigurðsson, S., Ragnarsson, H., Jónsson, J. and Blöndal, S. eds.) Skógarmál. Þættir um gróður og skóga á Íslandi tileinkaðir Hákoni Bjarnasyni sjötugum, pp. 224-247.
Richardson, A.D. and Friedland, A.J. (2007). A review of the theories to explain Arctic and alpine treelines around the world. G.P. Berlyn Festschrift Special Issue 25, 1-2 (in press).
Sigurðsson, B.D., oral communication
Sigurdsson, B.D., Roberntz, P., Freeman, M., Saxe, H., Næss, M., Thorgeirsson, H. and Linder, S. (2002). Impact studies on Nordic forests: effects of elevated CO2 and fertilization on gas exchange. Can. J. For. Res. 32: 779-788.
Sigurdsson, B.D., Thorgeirsson, H. and Linder, S. (2001). Growth and dry-matter partitioning of young Populus trichocarpa in response to CO2 concentration and mineral nutrient availability. Tree Physiol. 21: 941-950.
Sigurðsson, F. (1993). Groundwater chemistry and aquifer classification in Iceland. Memoires of the XXIVth Congress of IAH, Ås, Norway, Part 1, pp. 507–518.
Sigurðsson, S. (1977). Birki á Íslandi – útbreiðsla og ástand (Birch woodlands in Iceland – distribution and condition). Skógarmál, pp. 146-172. Edda hf, Reykjavík. In Icelandic.
Sigurgeirsson, A., oral communication.
Sjörs, H. (1971). Ekologisk botanic. Almqvist & Wiksell, Stockholm. Taken from: Aas, B. and Faarlund, T. (2001). The holocene history of the Nordic mountain birch belt. In: Nordic Mountain Birch Ecosystems (Wielgolaski, F.E. ed.), pp. 5-22. UNESCO, Paris, and Parthenon Publishing, Carnforth.
Skúlason, S., oral communication.
Slettfjord, S. (1993). Development of an environmental forest and arboretum on the outer coast of Finnmark county, Norway. In: Forest Development in Cold Climates (eds. Alden, J. et al.), pp. 437-451. Plenum Press, New York.
Snorrason, A., Kjartansson, B.Þ., Gunnarsson, E. and Eysteinsson, Þ. (2005). Global Forest Resources Assessment Update 2005. Iceland. Country Report. FAO, 50 pp.
117
Steindórsson, S. (1964). Gróður á Íslandi (Vegetation of Iceland). Almenna bókafélagið, Reykjavík, Iceland.
Sveinbjörnsson, B. (1992). Arctic Tree Line in a Changing Climate. In: Arctic Ecosystems in a Changing Climate.
Sveinbjörnsson, B. (1993). Performance of mountain birch in different environments in Sweden and Iceland: Implications for afforestation. In: Forest Development in Cold Climates (eds. Alden, J. et al.). Plenum Press, New York.
Sveinbjörnsson, B. (2000): North American and European Treelines: External Forces and Internal Processes Controlling Position. Ambio 29: 388-395.
Sveinbjörnsson, B. (2001). Performance of mountain birch in relation to its treeline in the Torneträsk area, northern Sweden. In: Nordic Mountain Birch Ecosystems (Wielgolaski, F. E. ed.), pp. 173-184. UNESCO, Paris, and Parthenon Publishing, Carnforth.
Sveinbjörnsson, B., Hofgaard, A. and Lloyd, A. (2002). Natural Causes of the Tundra-Taiga Boundary. Ambio Special Report 12, Tundra Taiga Treeline Research: 23-29.
Sveinbjörnsson B., Kauhanen H., and Nordell O. 1996. Treeline ecology of mountain birch in the Torneträsk area. Ecol. Bull. 46,65–70.
Sveinbjörnsson, B., Nordell, O. and Kauhanen, H. (1992). Nutrient relations of mountain birch growth at and below the elevational tree-line in Swedish Lapland. Fuctional Ecology 6: 213-220.
Þórarinsson, Þ. (1961). Uppblástur á Íslandi í ljósi öskulagarannsókna (Erosion in Iceland. A tephrochronological study). Yearbook Icelandic Forest Society 17. In Icelandic with English summary.
Þórarinsson, Þ. (1974). Þjóðin lifði en skógurinn dó (The nation survived but the forest died). Ársrít Skógræktarfélags Íslands: 16-29.
Thórsson, Æ.Th., Pálsson, S., Sigurgeirsson, A. and Anamthawat-Jónsson, K. (2007). Morphological variation among Betula nana (diploid), B. pubescens (tetraploid) and their Triploid Hybrids in Iceland. Annals of Botany: 1-11.
Thorsteinsson, I. (1986). The effect of grazing on stability and development of northern rangelands: A case study of Iceland. In: Grazing Research at Northern Latitudes (Gudmundsson, O. (ed.), pp. 37-43. Plenum Press, New York.
Tranquillini, W. (1979). Physiological ecology of the alpine timberline. Tree existence at high altitudes with special reference to the European Alps. Springer Verlag, New York.
Traustason, B. and Snorrason, A. (2008). Stærð skóglendis á Íslandi byggt á CORINE flokkun. Rit Fræðaþings landbúnaðarins 5:123-130.
Treter, U. (1984). Die Baumgrenzen Skandinaviens. Franz Steiner Verlag, Wiesbaden.
Troll, C. (1973). The upper timberlines in different climatic zones. Arctic and Alpine Research 5: A3-A18.
University of Iceland, taken from http://www.hi.is/~oi/climate_in_iceland.htm (29.06.2008).
118
Vorren, K.D., Alm, T. and Morkved, B. (1996). Holocene pine (Pinus sylvestris L.) and grey alder (Alnus incana Moench) immigration and areal oscillations in central Troms, northern Norway, and their paleoclimatic implications. Palaeoklimaforschung 20: 271-291.
Wardle, P. (1965). A comparison on alpine timberlines in New Zealand and North America. New Zealand Journal for Botany 9, 3: 371-402.
Wielgolaski, F.E. (2003). Climatic factors governing plant phonological phases along a Norwegian fjord. International Journal for Biometeorology 47: 213-220.
Wielgolaski, F.E. (2005). History and environment of the Nordic mountain birch. In: Ecological Studies, Vol. 180. Plant Ecology, Herbivory, and Human Impact in Nordic Mountain Birch Forests (Wielgolaski, F.E. ed.). Springer Verlag, Berlin Heidelberg.
Wielgolaski, F.E., Sonesson, M. (2001). Nordic mountain birch ecosystems – a conceptual overview. In: Nordic Mountain Birch Ecosystems (Wielgolaski, F.E. ed.), pp. 51-61, UNESCO, Paris, and Parthenon Publishing, Carnforth.
Wieser, G. (1997). Carbon dioxide gas exchange of cembran pine (Pinus cembra) at the alpine timberline during winter. Tree Physiology 17: 473-477.
Wieser, G. (2007). Global Change at the Upper Timberline. In: Trees at their upper limit (Wieser, G. and Tausz, M. eds.), pp.197-217. Springer Verlag, Dordrecht.
Wieser, G. and Tausz, M. (2007). Current Concepts for Treelife Limitation at the Upper Timberline. In: Trees at their upper limit (Wieser, G. and Tausz, M. eds.), pp.1-18. Springer Verlag, Dordrecht.
World Reference Base for Soil Resources. World Soil Resources Reports 84, FAO, Rome.
119
List of figures
• Fig. 1. Altitudinal zones of Iceland.
• Fig. 2. Currents influencing climate of Iceland. Taken from