IADIS International Journal on Computer Science and Information Systems Vol. 8, No. 2, pp. 51-71 ISSN: 1646-3692 51 TOWARDS THE USE OF FACTOR ANALYSIS FOR USER-CENTRIC EVALUATIVE RESEARCH IN INFORMATION SYSTEM Bernard Ijesunor Akhigbe. Obafemi Awolowo University, Nigeria. Olubukola Daniel Adekola. Babcock University, Nigeria. Babajide Samuel Afolabi. Obafemi Awolowo University, Nigeria. Emmanuel Rotimi Adagunodo. Obafemi Awolowo University, Nigeria. ABSTRACT The potentials of factor analysis are summarily to reveal underlying factor structures, test the theory of analytic user-centric models, and demonstrate their causal relationships. Its common applicative types are: Exploratory, confirmatory and structural equation modelling techniques. This paper, underscores it basically due to its multidimensional and multivariate data analytic knack. Analytically, it manages the multidimensionality of user-centric data and yet presents replicable result. Therefore, our enthusiasm hopefully is to whet the appetite of IS researchers, particularly those that are engaged in user-centric evaluative research in a way that motivates them to pursue additional knowledge about the technique. However, this technique has matured in other related fields, such as: The Cognitive and Behavioural sciences, Human Computer Interaction and Psychology from where IS draws from in terms of user- related studies. This is not yet the case in IS. An algorithmic like framework is therefore introduced, and its use to assess an IS with the purpose of underscoring the use of the FA methodology is reported in fulfillment of the aim of this paper. As a result, a measurement model is presented. The use of the FA technique is therefore recommended based on the degree of validity and reliability demonstrated by the model, which is significantly replicable. KEYWORDS Factor analysis, user-centric evaluation, multivariate statistical analysis, measurement model, cognitive and behavioural sciences, and human computer interaction
Transcript
IADIS International Journal on Computer Science and Information Systems Vol. 8, No. 2, pp. 51-71
ISSN: 1646-3692
51
TOWARDS THE USE OF FACTOR ANALYSIS FOR
USER-CENTRIC EVALUATIVE RESEARCH IN
INFORMATION SYSTEM
Bernard Ijesunor Akhigbe. Obafemi Awolowo University, Nigeria.
Olubukola Daniel Adekola. Babcock University, Nigeria.
Babajide Samuel Afolabi. Obafemi Awolowo University, Nigeria.
Emmanuel Rotimi Adagunodo. Obafemi Awolowo University, Nigeria.
ABSTRACT
The potentials of factor analysis are summarily to reveal underlying factor structures, test the theory of
analytic user-centric models, and demonstrate their causal relationships. Its common applicative types
are: Exploratory, confirmatory and structural equation modelling techniques. This paper, underscores it
basically due to its multidimensional and multivariate data analytic knack. Analytically, it manages the
multidimensionality of user-centric data and yet presents replicable result. Therefore, our enthusiasm
hopefully is to whet the appetite of IS researchers, particularly those that are engaged in user-centric
evaluative research in a way that motivates them to pursue additional knowledge about the technique.
However, this technique has matured in other related fields, such as: The Cognitive and Behavioural
sciences, Human Computer Interaction and Psychology from where IS draws from in terms of user-
related studies. This is not yet the case in IS. An algorithmic like framework is therefore introduced, and
its use to assess an IS with the purpose of underscoring the use of the FA methodology is reported in
fulfillment of the aim of this paper. As a result, a measurement model is presented. The use of the FA
technique is therefore recommended based on the degree of validity and reliability demonstrated by the
and behavioural sciences, and human computer interaction
IADIS International Journal on Computer Science and Information Systems
52
1. INTRODUCTION
User-centric evaluative studies (research) in Information System (IS) usually attract large
volume of data, and managing them to provide results that are replicable is often tedious. But,
the core of user-centric evaluative research in IS is User-centricity. It projects the need to
produce software (systems) to help users solve problems as they conceive it, and not as the
designers of the system do. It is also about understanding the user and collaborating
effectively with them through evaluative studies. As a result, informed choices are made based
on deep understanding of users about what software to build for users’ use without personal
bias and assumption (Patton, 2007). To make these informed choices multivariate data analytic
techniques are often required handling user-centric data.
These data are what managers of Information Systems (ISs) in organizations often rely on
for favourable user-centric evaluative outcomes in order to guide useful decision-making. But,
evaluating ISs is still very difficult, since there is yet no unique model to evaluate all kinds of
ISs (Islam, 2009). The implication of this is that a continuous and focused evaluation of IS is
required for the provision of better evaluative models that will improve existing IS evaluative
methodology. ISs is pervasive; this originates from the understanding that current IS “do not
bound their operation only in an organizational setting, but they also include other possible
settings, such as domestic or public settings. Consequently, IS provides useful services that fit
user’s requirements and needs” (Kourouthanassis and Giaglis, 2007; Karaiskos, 2009). Thus,
adopting any kind of IS would require the careful assessment of factors that centers on user-
system interactivity as well as usability with respect to ease of use. This ought to be the
emphasis of modern IS evaluation, and should be based on (i) how ISs serve organizational
change and (ii) the user in the organization (Klecun and Cornford, 2005; Lagsten, 2011). It is
essential that this type of evaluation be focus on the user, since it is the user who will
determine the usefulness of IS. This cannot be derived from investigating how ISs serve
organizational change. To this end, expected result should be reliable; it should not only be
generalizable, but replicable towards the change and betterment of an organization and its IS.
In this paper, the focus is therefore on the user. It is not on (how and) the extent ISs serve
organizational change, which can also be examined from users’ perspective.
This paper therefore builds on some initial studies, such as Akhigbe, Afolabi, Udo and
Adagunodo (2011a), Akhigbe, Afolabi, and Adagunodo (2011b), Akhigbe, Afolabi, and
Adagunodo (2012), and Akhigbe (2012). These experiences occasioned the understanding that
specialized training of some sort may be needed to use the FA technique. This should not be
considering the scores of studies within IS that report its use. It is particularly also worrisome
to note that the reports (projection) are often miserly done. This is not acceptable for a robust
field like IS. Worst still, is the finding that FA as a Data Reduction (DR) and modeling
technique to this very moment is not even contextualized. It was very disturbing and
frustrating to know that it is the miserly reporting of the use of the technique that is
responsible for why naïve users cannot take advantage of it. Essentially, researchers (not only
naïve users) using the technique should be comfortable with FA’s use and also able to find
their way around it for user-centric evaluative research in IS.
This paper therefore seeks to introduce a step by step algorithmic like approach. So as to
contribute to the need to highlight the use of the FA technique considering its usefulness for
data reduction in user-centric evaluative research in IS. Furthermore, this paper draws from
the work of Williams, Onsman, and Brown (2010) where a five-step guide is provided to
TOWARDS THE USE OF FACTOR ANALYSIS FOR USER-CENTRIC EVALUATIVE RESEARCH
IN INFORMATION SYSTEM
53
assists novice researchers with a simplified approach to undertaking Exploratory Factor
Analysis (EFA). The work provided an FA protocol with the intention of educating kindred
paramedic educators and researchers in the use of EFA. What is done differently in this paper
is that a wider focus is pursued, in that all the three types of FA is covered. Here, we aim to
contribute to (i) the need to underscore the FA, and (ii) debate the need to contextualize the
FA as a modeling and DR technique to the best of our knowledge. The belief is that even
naïve users should be able to easily understand and leverage on the FA technique for user-
centric modeling and data reduction in IS. The Web Search Engine (WeSE) - a type of
Information Retrieval (IR) system as example of Information system is used to fulfill this aim.
Additionally, following (Chen, Chang, Hung, and Lin, 2009), the EFA, the Confirmatory
Factor Analysis (CFA), and the Structural Equation Modeling (SEM) techniques were used for
FA in this paper. The paper progresses with related literature in Section 2, while in Section 3,
FA is underscored; and in Section 4 the algorithmic like framework is presented. As well, in
Section 5 IR system as example of IS is presented. The study’s methodology, data analysis
and conclusion are presented in sections 6, 7 and 8 respectively.
2. RELATED LITERATURE
Existing works that use the FA abound in the context of IS, but a few relevant ones are
presented (e.g. Muylle, Moenaert, and Despontin, 2004; Yang, Cai, Zhou, and Zhou, 2005;
Kiraz, and Ozdemir, 2006; Lee, Theng, Goh, and Foo, 2006; Wu, Shen, Lin, Greenes, and
Bates, 2008; Islam, 2009; Chen et al., 2009; Sumak, Hericko, Pusnik, and Polancic, 2011;
Akhigbe et al., 2012 and Akhigbe et al., 2011). Muylle et al. (2004) developed a model with
desirable psychometric properties for measuring the user satisfaction of websites. The IS
success theory was used to underpin the model and its constructs, while the study’s empirical
data analysis was carried out using the FA technique. Similarly, in Yang et al. (2005), a user
perceived service quality of information model was presented in order to assess the factors that
influence the design of an information presentation portal. The EFA, CFA and SEM were used
to carry out the FA that resulted in a five-dimension service quality instrument. However,
Muylle et al. (2004) and Yang et al. (2005) did not adequately describe the FA technique nor
highlight its importance for user-centric evaluative research in IS and the nitty-gritty of its use.
In Kiraz and Ozdemir (2006) the FA technique was employed for data analysis to show that
different educational ideologies may have different effects on teachers’ technology
acceptance. But, like Muylle et al. (2004) and Yang et al. (2005) the use of the FA was only
mentioned. These works were silent on whether it was the three techniques of the FA, namely:
the EFA, CFA and SEM, or only one of the techniques that was used for its data analysis. It is
not good enough to come across miserly reporting only and in all the FA related paper one
finds, especially when one needs guidance on the subject. It is also annoying when a naïve
reader is left to find guidance with respect to how to use the FA from the FA result presented.
There is definitely no circumstance under which the withdrawal of necessary details (miserly
reporting) will be sufficient enough to help users in IS. This will continue to be unacceptable,
and thus requires good attention for this incongruity to be mitigated.
Using the FA, user-related data was analyzed to identify groups of features that supported
students’ document evaluations. The data was collected during IR interaction stages to provide
design implications for an IR interface that supports students’ evaluations of documents in Lee
IADIS International Journal on Computer Science and Information Systems
54
et al. (2006). The researchers used digital libraries as examples of IR systems, and enhanced
objective relevance and tackled its limitations by conducting a quantitative study to understand
students’ perceptions of features for supporting evaluations of subjective relevance of
documents. Though the work was insightful, like other related works (e.g. Muylle et al., 2004;
Yang et al., 2005; and Kiraz, and Ozdemir, 2006), naïve users will not be able to learn the use
of the FA based on the miserly way the use of the FA technique was reported. In other related
works like Wu et al. (2008) and Islam (2009), this incongruity remains the same. For instance,
in Wu et al. (2008) the FA was used to examine an extended technology acceptance model.
The investigation was meant to determine the effect of trust and management support issues
on the acceptance of an adverse event reporting systems by healthcare Professionals. The final
result was inciting, but the reporting followed the same pattern with that of earlier reviewed
works. Both the CFA and the SEM was applied and very evidently were used to resolve
reliability and validity cum causal issues. But, replicating the approach the researchers used is
very difficult to fathom and follow. Comparably, the research effort in Islam (2009) developed
a model to measure user satisfaction and success of an IS using a web base virtual meeting
tool as example of IS. It was very easy to know that the EFA of the FA was used in the
research, and some level of details were also provided, which users may be able to replicate
(follow) in a similar study. But other aspects, particularly when examining the reliability and
validity of the model, the concept of Item-to-Total correlation was vaguely presented. Good
enough, users could understand that it is meant to test the model’s reliability and validity
perhaps, but the question of how to put it to use remain fuzzy.
Likewise, the FA was also used to develop an instrument to assess the quality of a web-
based learning system for nurses’ continuing education (Chen et al., 2009). The researchers
(Chen and Colleagues) used the CFA to verify the instrument’s construct validity based on
quality dimensions. It was very easy to know that the CFA was the FA type that was used for
the study. And the reason was provided, which was that since prior theories or hypotheses are
available, the CFA was preferred to EFA. This was a major strength of the work considering
the ongoing debate. But, the researchers introduced the Squared Multiple Correlation (SMC)
to test the reliability of the model. However, the rationale for introducing SMC was not
provided; one would have expected the use of the other FA that can be used to test reliability
for the sake of clarity and replicability. Also, the use of the SEM to demonstrate the proposed
model’s fit needs an expert to fathom. So, as was the case with other earlier reviewed works,
the one in Chen et al. (2009) was also not reported in details, thus grossly also not
underscoring the FA. In Wu et al. (2008), Islam (2009) and Chen et al. (2009), though the
works are stimulating, they lack the use of sufficient details to underscore the use of the FA
technique. While that of Chen et al. (2009) was fair in terms of the provision of guidance in
the use of FA, that of Wu et al. (2008) and Islam (2009) especially with respect to their report
on SEM did not help matters. Thus, naïve users and curious readers would not benefit much
since they will not be able to take advantage of it.
In Akhigbe et al. (2012) the use of the FA for the characterization of Decision Variables
(DVs) or items using WebSEs as case study in a user-centric experiment was demonstrated.
The implication of their research was that important system resources could be conserved by
applying the FA technique. Other user-centric studies that used the FA technique for data
analysis that are worthy of just mentioning due to time and space are: Akhigbe et al. (2011),
Sumak et al. (2011), Saracevic (1995) and Akhigbe (2012). However, the effort of Chen et al.
(2009) and Sumak et al. (2011) are among the few that were not too miserly in their report of
the FA technique. We thus argue that IS research deserves a better systematic documentation
TOWARDS THE USE OF FACTOR ANALYSIS FOR USER-CENTRIC EVALUATIVE RESEARCH
IN INFORMATION SYSTEM
55
and a generous reporting of the FA technique. This would adequately underscore its usefulness
and provide sufficient guidance for naïve and intended users in IS domain.
Considering the fact that IS is perverse, there ought to be reference documents on how to
use the FA, within its context to assist naïve users to find their way easily with its use (Henson
and Roberts, 2006; Sun, Chou, Stacy, Ma, Unger, and Gallaher, 2007; and Smith and Albaum,
2010). The works of Henson and Roberts (2006), Sun et al. (2007) and Smith and Albaum
(2010) provided the underpinnings that our argument draws and builds on to actualize its aim.
Henson and Roberts (2006) provided a detailed explanation of the use of the technique, thus
recommending it for inferential data analysis. The target beneficiaries were researchers in
Education, Psychology and the Cognitive sciences. Similarly, in Sun et al. (2007) it was
contextualized for the Social sciences, unlike in the IS domain. In the field of marketing
research it is used for data analysis in order to examine consumer lifestyle and personality
type. However, the FA does not have a foundation up till now in IS like in other fields talk less
of seeking further grounding in order to appropriately use it as requested in Henson and
Roberts (2006), Petter, Delone, Mclean, (2008), Sun et al. (2007) and Smith and Albaum
(2010).
3. UNDERSCORING FACTOR ANALYSIS
The FA, particularly the SEM has evidently become one of the techniques of choice for
researchers across disciplines (Hooper, Coughlan, and Mullen, 2008) particularly for
multivariate data analysis that is typical of user-centric evaluative research. The norm is that if
prior theories or hypotheses are available, CFA is usually preferred to EFA (Nunnally and
Berstein, 1994 as cited by Chen et al., 2009). To properly accentuate the FA and thus
underscore its use and canvass the need to contextualize it, it will take more than just a paper
of this nature. Therefore, the overarching attempt in this paper is to whet the appetite of IS
researchers (and others who need the approach) in a way that will hopefully motivate them to
pursue additional knowledge about the FA. Thus, the FA and its associated techniques are
briefly highlighted in the next subsections 3.1 to 3.3 of this paper.
3.1 Brief Overview of the FA
It was necessary to examine a real life (or an example) IS using the technique, and thus very
easily stress the importance of the FA for user-centric evaluative research in IS. This paper
therefore adopts the WebSE and evaluated it as an IR system using the FA. That Search
Engines (SEs) are the commonest application of IR systems, and the fact that several users of
the Web use one SE or the other also added to the motivation for its adoption. This is reviewed
further in section 4.
Historically, the theoretical framework for FA is credited to Pearson and Spearman. In
Kieffer (1999) as cited by Henson and Roberts (2006), it was noted that Spearman through his
work on personality theory, provided the conceptual and theoretical rationale for the
technique. The technique involves the use of both the EFA and CFA, and at times the SEM.
As a multivariate statistical procedure, the FA has many uses, among which are to: (i) reduce a
large number of variables into a smaller set of variables (also referred to as factors), (ii)
establish underlying dimensions between measured variables and latent constructs, thereby
IADIS International Journal on Computer Science and Information Systems
56
allowing the formation and refinement of theory, and (iii) provide construct validity evidence
of self-reporting scales. As stated by Nunnally (1978) and cited by Thompson (2004), and
Williams et al. (2010), “… factor analysis is intimately involved with questions of validity …
Factor analysis is at the heart of the measurement of psychological constructs”. Constructs of
this sort are what is examined in user-centric evaluative research. Additionally, in human-user
related studies researchers would commonly want to explain the most variable occurrences
with the least one. And in order to achieve parsimony, researchers also regularly strive to
explain the most shared variance of measured variables - items. A most succinct and logical
way to do this explanation is to use the fewest possible unobserved (latent or synthetic)
variables. Theoretically, the FA technique is suitable for this and even usable to explain a
larger set of, say x measured variables with a smaller set of, say y latent constructs. Usually, a
matrix of association can be used to model the relationships that exist between the x measured
variables. And the result of this model is a smaller set of y latent constructs. One advantage of
this approach is that the y latent constructs can be used as variables in subsequent analyses.
They can also be seen as actually producing (causing) the observed scores on the measured
variables (Thompson and Daniel, 1996 as cited by Henson and Roberts, 2006).
Basically the goal of FA is to describe a set of say z random variables in terms of a
smaller number (say k ). In rational comparism, k will become less than z (i.e. k z of
unobserved constructs called factors). Furthermore, a factor, like a regression model is a linear
combination of a group of variables (items) combined to represent a scale measure of a
concept. But, the variables must represent indicators of some common underlying dimension
or concept such that they can be grouped together theoretically. This theoretic can be
harnessed mathematically to be able to use the FA for its analytics. Thus, with the FAs the
number of variables used to explain a relationship or to determine which variables show a
relationship can be reduced. In more mathematical terms, these factors can be determined by
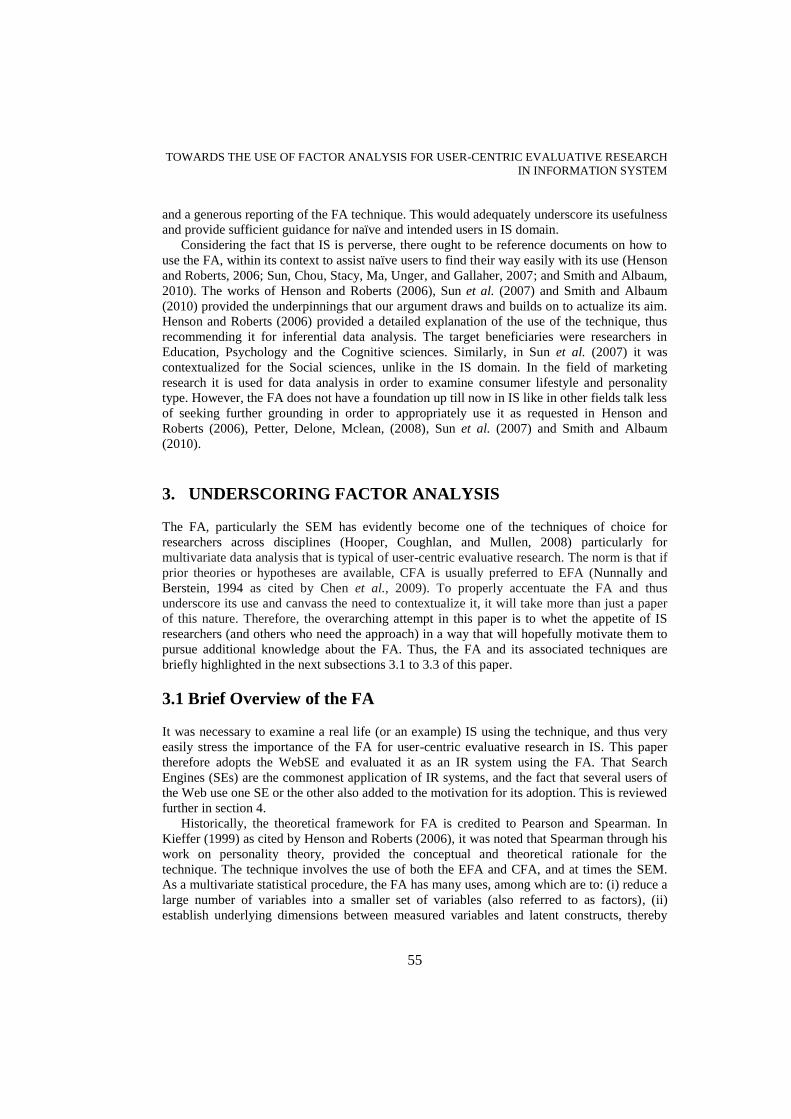
interpreting coefficients in a factor model, called loadings. Following Grau (1997), this factor
model is described using formal specification as follows;
1 1 2 2 3 3i i i i in ny a f a f a f a f
(1)
Where;
iy is the ith variable;
ija is the jth factor loading ((where 1j to n ) for the ith variable);
and
1 2, ,... nf f f are the uncorrelated common factors
In (1), for the variance of iy to be explained by jf , the factor loading - ija must be
squared. The variance of ith variable consists of two parts (i) the variance specific or unique to
that variable, and (ii) the variance that is common to all variables in the form of the n factors.
However, the second part is the communality - the sum of the squared factor loadings across
the n factors for the ith variable. There is Partial Pair Wise (PPW) correlations between the
variables, which should be small, compared to the Original Correlations (OC) after controlling
for all other variables. The implication of this is that the Common Factor Model (CFM) just
described can explain the overall variation. It is necessary to note that if the PPW correlations
vary slightly from the OC, or larger in absolute value, it means that the CFM is inappropriate
TOWARDS THE USE OF FACTOR ANALYSIS FOR USER-CENTRIC EVALUATIVE RESEARCH
IN INFORMATION SYSTEM
57
for the data. Additionally, to improve the CFM, variables must be removed and (or) added to
the set included in the FA (Grau, 1997).
But, in iy , i can be 1i to p set of linear equations, which can only be handled
simultaneously. And for multivariate data analysis as is in user-centric evaluative research,
more than one factor with several users obligated to respond portend the need for a model to
harness them, all in one. This is where the concept of a matrix of association (correlation
matrix). With this concept, pushing the modeling that already started with (1) becomes easy.
This is because at this point the matrix of association is usable to model (represent) the
relationships occasioned byiy , where there are p relationships. Nevertheless, correlation
matrices are often useful for (i) calculating system’s efficiency, (ii) analyzing multivariate
items (properties), and (iii) handling multidimensional views that develop well into useful
goodness-of-fit. The correlation matrices are also useful in the measurement of cognitive
issues. Usually, these issue(s) may be an attempt to examine a system’s efficiency from users’
perspectives. And often, the perspective of the user is commonly investigated using
multivariate items (properties), which are multidimensional in views. The challenge this
multivariate/multidimensional influence presents can be handled using a matrix of association
(Gradoni, Primiani, and Moglie, 2013; Akhigbe et al., 2012; So and Wong, 2010). And using
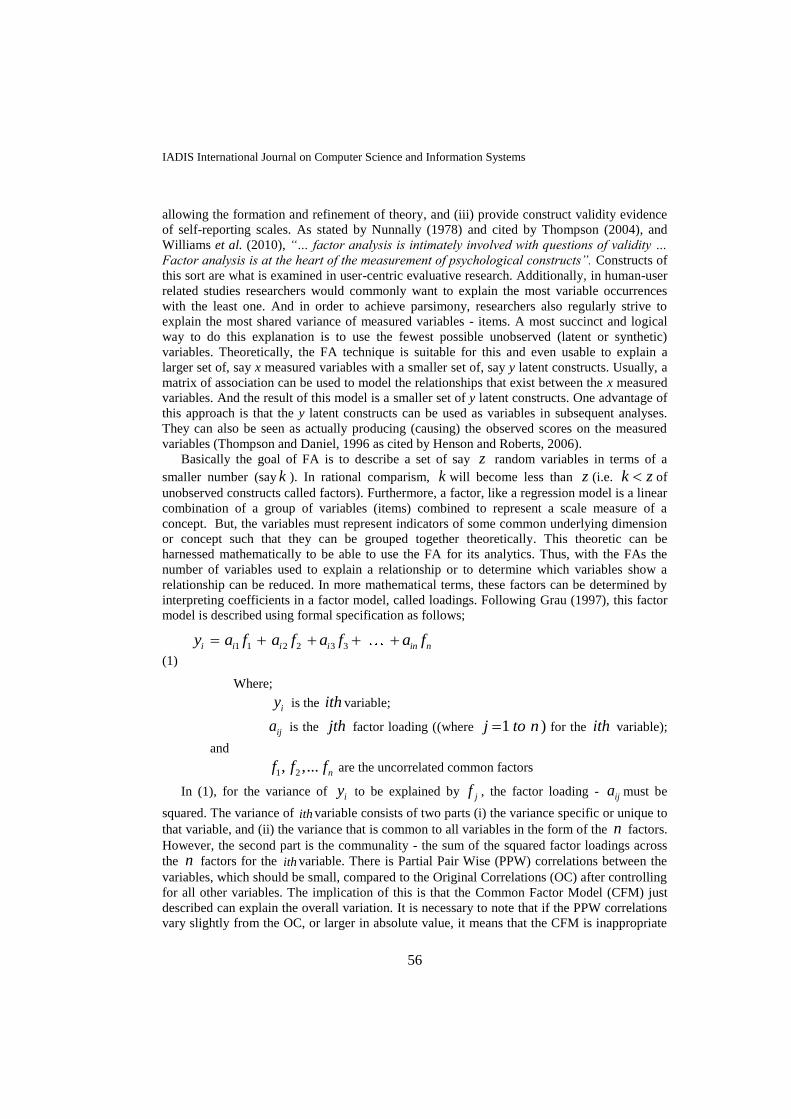
the Frobenius norm of a matrix (So and Wong, 2010), this multivariate/multidimensional
associations can be easily modelled - represented as a matrix say Q as follows;
1 1
k k
ij
i j
Q a
(2)
Where Q is a matrix of order ( )i j , and ija is the element of the matrix which can be a
combination of the responses (ratings) of users, based on the items made available for users to
respond to. Following Gradoni et al. (2013), (2) can naturally be handled by invoking the
concept of a correlation matrix to analyze the many relationships depicted by the elements
(ija ). However, these relationships are many and similar, and exist in a multivariate situation.
As a result, it is easy to model them using the matrix of order ( )i j . Accordingly, the
correlation matrix of Q in (2) can be obtained to capture this modeling of similar and many
relationships following Gradoni et al. (2013) (see equation 3). This reduces the correlation
matrix into a parsimonious meaningful representation of the entire matrix that is replicable and
also fit into the original data set. Mathematically this is represented in (4). To do this will
ordinarily (manually) take a very long and tedious time depending on the order, like in this
case ( )i j . This order is usually determined by the population size (the number of users of
the system under investigation), and the number of items presented to the user to court their
responses.
IADIS International Journal on Computer Science and Information Systems
58
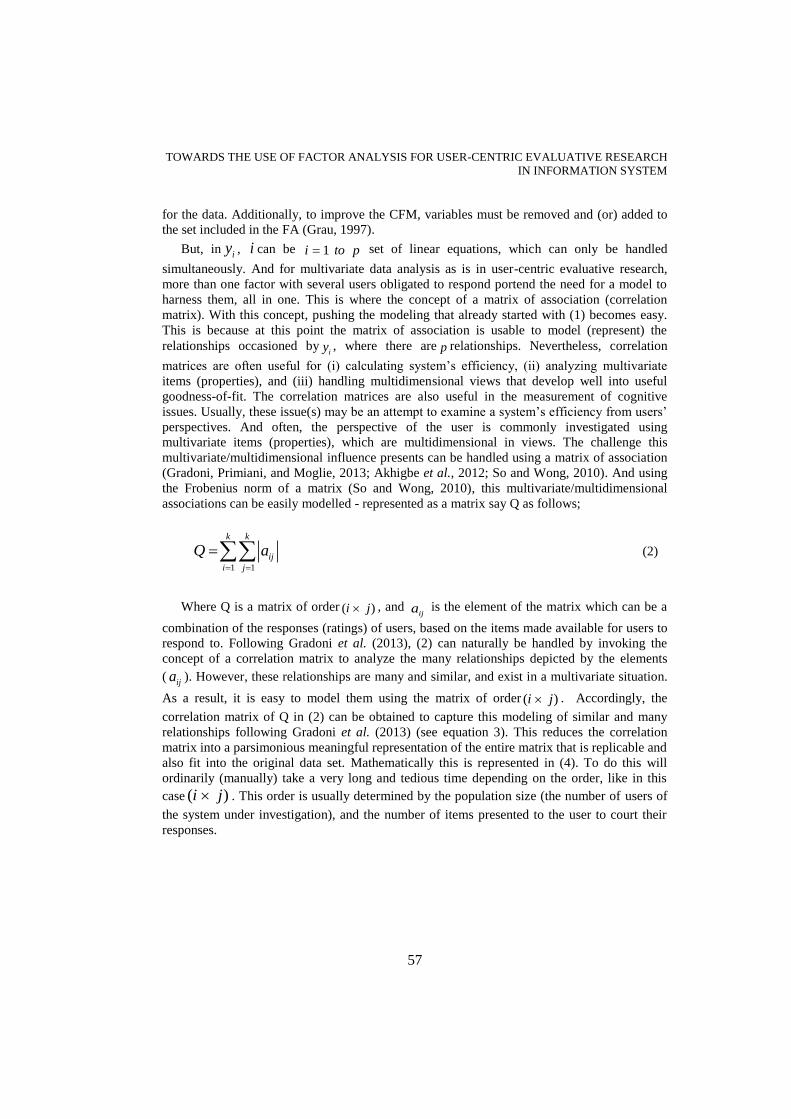
11 12 1
21 22 2
1 2
j
j
i i ij
a a a
a a aq
a a a
(3) As is in (3), the correlation matrix in (3) can be Transposed (Tr) to become (4), which is
presented as follows;
1 2 1 2
( ) ( )Trq Tr Tr
(4)
Having fulfilled specific conditions (which are presented in the next subsection), and based
on the goal of the particular research; the FA is introduced beginning from the EFA. The EFA
is used to uncover the underlying factor structure of the data set (characterized using the
matrix in (2 and 3)), while the CFA can be used to test the reliability of the resultant factor
structure (model). The CFA can also be used to achieve a level of goodness-of-fit of the
model, while the SEM - a type of CFA (though does more in terms of structural modeling) is
well suited to show the cause effect of the variables that the model is composed of
(Stephenson, Holbert, and Zimmerman, 2006). This cause effect uses the Bayesian algorithm,
which scope is beyond this paper. Additionally, no doubt can be entertained in the use of the
FA technique with respect to validity. The implication of this is that results that are replicable
due to parsimonious solutions have been well taken care of in FA (Nunnally, 1978; Henson
and Roberts, 2006). Hence, Kerlinger (1979) adds, FA is “one of the most powerful methods
yet, for reducing variable complexity to greater simplicity”. As a result, issues of validity are
to be taking very seriously in the use of FA as it is in the heart of both psychological and
cognitive constructs (Nunnally, 1978, Henson and Roberts, 2006). Therefore, validity is one of
the major reasons among others why FA is suitable and should be encouraged for use in user-
centric (related) studies in IS.
3.2 Types of FA
Researchers have stressed that the process of theory building and construct measurement are
joint bootstrap operations in multivariate data analysis. Thus, FA is capable of integrity
measurement and guide for further theory refinement (Hendrick and Hendrick, 1986 as cited
by Henson and Roberts, 2006). As regards construct validity, utilizing operational referents for
constructs of a theory is meant to test if the constructs interrelate as the theory states (Gorsuch,
1983 as cited by Henson and Roberts, 2006). Therefore, FA is primarily used for the
development of operational constructs and their representative theoretical constructs.
Essentially, the concept underlying the use of Multivariate Methods (MMs) in user-centric
investigations is simplification. That is reducing a large and possibly complex body of data to
a few meaningful summary measures. This could also imply the identification of key features
and any interesting patterns in the data. To do this, MMs deal with the simultaneous treatment
of several variables (Krzanowski and Marriot, 1994a and b; Sharma, 1996). Hence, “In a
TOWARDS THE USE OF FACTOR ANALYSIS FOR USER-CENTRIC EVALUATIVE RESEARCH
IN INFORMATION SYSTEM
59
strict statistical sense MMs concern the collective study of a group of outcome variables, thus
taking account of the correlation structure of variables within the group” (Ruel, Levin,
Armar-Klemesu, Maxwell and Morris, 1999). How the FA achieves these feats as a
multivariate data analysis technique is briefly presented in the next subsections.
3.2.1 The EFA in Brief
EFA is renowned for data analysis since it could remove redundant features and identify
relationships so that groups - factors describing (most of) the original data would be
discovered (Lattin, Carroll, and Green, 2003; Netemeyer, Bearden, and Sharma, 2003 as cited
by Lee, Theng, Goh, and Foo, 2006). Like Williams and Colleagues accounted, “EFA is
heuristic. In EFA, the investigator has no expectations of the number or nature of the
variables. And as the title suggests, is exploratory in nature. That is, it allows the researcher
to explore the main dimensions to generate a theory, or model from a relatively large set of
latent constructs often represented by a set of items”. Therefore, the basic objectives of the
EFA are to (i) reduce the number of variables, (ii) examine the structure or relationship
between variables, (iii) detect and assess the unidimensionality of a theoretical construct, (iv)
evaluate the construct validity of a scale, test, or instrument, (v) develop parsimonious
(simple) analysis and interpretation, (vi) address multicollinearity (two or more variables that
are correlated), (vii) develop theoretical constructs, and (viii) prove/disprove proposed theories
(Williams et al., 2010).
To conduct the EFA, some precautions (and choices) are very important to take, depending
on the goal of the particular data analysis. However, the use of the principle components
analysis with varimax rotation procedure is quite common with 0.4 factor loading. This allows
the extract of the right factors to form the expected factor structure or measurement model. In
carrying out the extraction one of three or all three heuristics could be used: (i) Factors above
the “elbow” of the scree plot are extracted, (ii) factors that had eigenvalues greater than 1 are
extracted, and (iii) eigenvalues from a dummy dataset are compared with eigenvalues from the
real dataset, and factors in the real dataset that had eigenvalues higher than those in the
dummy dataset are retained (Lattin et al., 2003; Netemeyer et al., 2003 as cited by Lee et al.,
2006). The EFA is commonly used to carry out this type of FA that entails determining the
theoretical constructs that underlie a given data set and the extent to which these constructs
represent the original variables.
3.2.2 The CFA in Brief
The CFA is often used to carry out the corresponding FA needed to examine the reliability and
validity of the measurement model (Wu et al., 2008). Thus, the CFA provide the technique to
empirically test the measurement properties of models. With the CFA technique, a set of
theoretical relationships between measured variables and their respective latent constructs are
tested. Hence, primarily the CFA assists researchers to understand the empirical properties of
theoretically guided constructs in their research (Stephenson et al, 2006). This is possible
since every theoretically guided constructs has empirical properties. This allows the CFA to
guide researchers to advance and test the measurement properties of a scale or its subscales a
priori. This is important because the conclusion of any research is only as good as the
measurement of the concepts used in the research (Bollen, 1989 as cited by Stephenson et al,
2006).
IADIS International Journal on Computer Science and Information Systems
60
According to Williams and Colleague, the CFA assists the researcher to test a proposed
theory or model (CFA as a form of structural equation modeling). In contrast to EFA, it has
assumptions and expectations based on priori theory regarding the number of factors, and
which factor theories or models best fit. Like in EFA, the extraction methods commonly used
in factor analysis are (i) Principal Components Analysis (PCA), (ii) Principal Axis Factoring
(PAF), (iii) maximum likelihood, (iv) unweighted least squares, (v) generalized least squares,
(vi) alpha factoring, and (vii) image factoring. In literature, both the PCA and the PAF still
remain the most commonly used, despite the raging debate on which of them to use. It is
important to stress that the practical differences between the two are often insignificant,
particularly when variables have high reliability or where there are 30 or more variables
(Thompson, 2004; Gorsuch, 1983). PCA also remains the default method in several statistical
programs (software), and it is recommended when no priori theory or model exists. Thus, it
was suggested in establishing preliminary solutions in EFA (Thompson, 2004; Pett, Lackey,
and Sullivan, 2003; Gorsuch, 1983).
3.2.3 The SEM in Brief
In the use of the SEM technique, another common way to use the FA is provided. Thus, using
the SEM allows the simultaneous estimation of a system of hypothesized relationships among
observable and latent variables. The purpose of this estimation is to determine if these
associations between the “hypothesized relationships” are consistent with the sample data
obtained usually from the result of EFA and CFA statistical processes. The use of SEM
involves three primary steps: Specification, estimation, and evaluation. This technique at the
end of the three steps is used to show a model’s goodness of fit, its multivariate normality, and
the model’s modification as well as its structural model. The principal advantage of SEM is its
ability to model constructs as latent variables. Researchers are thus empowered to extract
measurement errors, such that only the systematic relationship between latent variables
remains. These latent variables are the underlying constructs that are not directly tapped by
any one set of measures. In latent variable modeling, a construct’s unreliability is accounted
for in the resultant measurement model. The respective error terms of the measurement model
especially for measured variables are used to estimate the unreliability (measurement error)
that exists between the measured and latent variables. As a result, both random and uniqueness
errors are removed in such a way that construct’s reliability remains 1. This means that the
parameter between the measured variables and their respective latent variable reflects the
systematic (true) relationship of measurement that is corrected in order to avoid unreliability.
In the use of SEM to evaluate causal models, the structural part of the model can theoretically
be specified as either recursive or non-recursive. For non-recursive models, they contain
reciprocal causation, feedback loops, and have correlated disturbances; thus they reflect more
complex processes. Basically, a process of influence that simply does not need to move from
left to right within a model is referred to as a re-cursive model. Usually, when a user-centric
model (especially the measurement model) is proposed based on the result gotten from an
EFA process, the model needs to be empirically tested. This is done using the data collected
from a survey within the relevant context (Cudeck, du Toit, and Sorbom, 2001; Joreskog,
1973; Duncan, 1975; Hoyle and Kenny, 1999; Bollen, 1989 as cited by Stephenson et al,
2006).
TOWARDS THE USE OF FACTOR ANALYSIS FOR USER-CENTRIC EVALUATIVE RESEARCH
IN INFORMATION SYSTEM
61
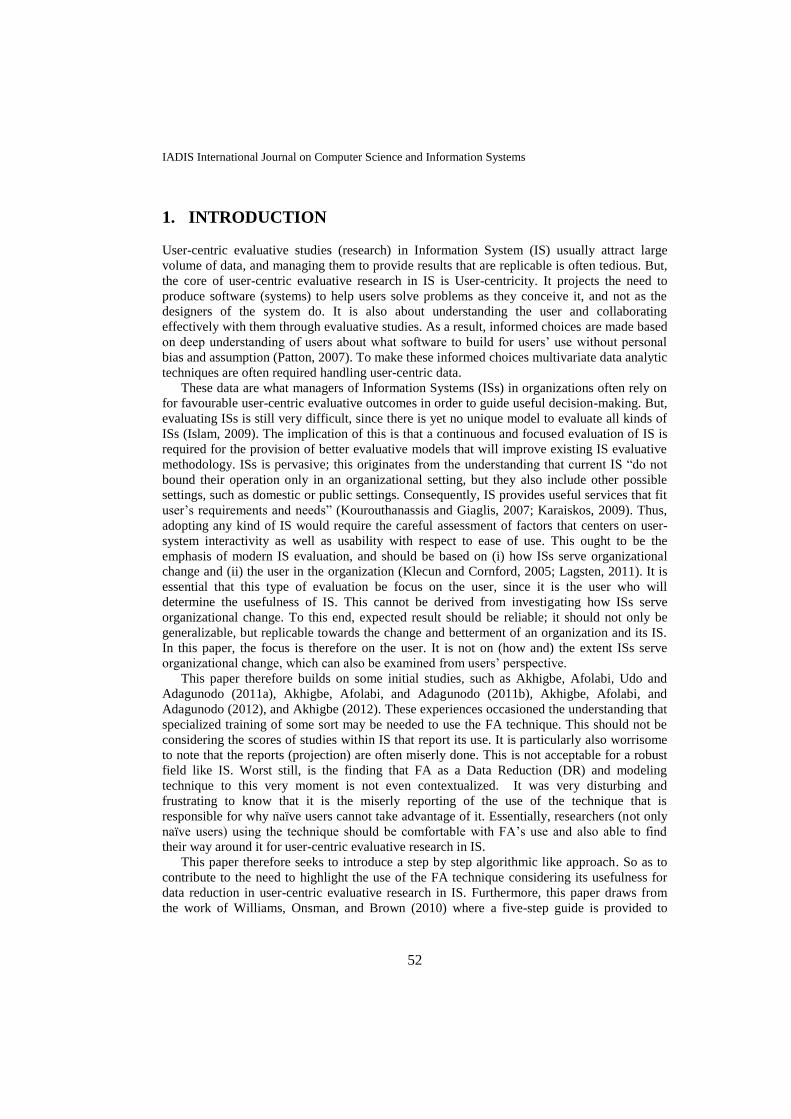
4. AN ALGORITHMIC FRAMEWORK TO USE THE FA
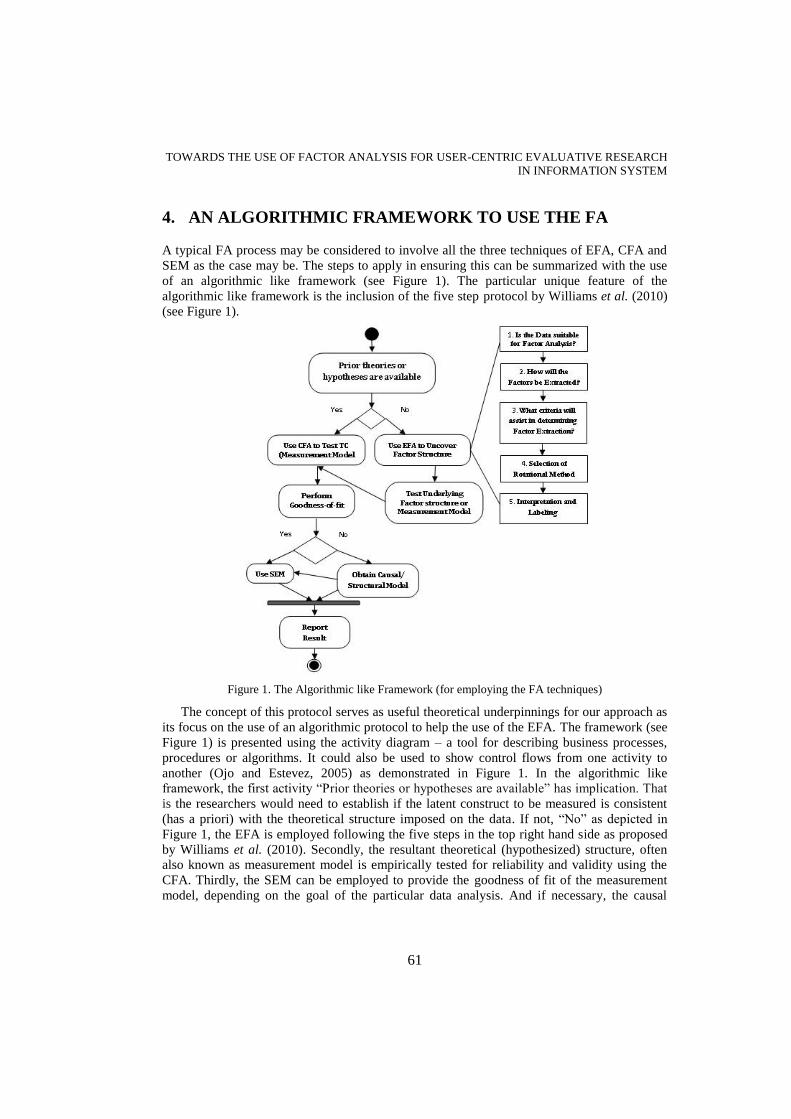
A typical FA process may be considered to involve all the three techniques of EFA, CFA and
SEM as the case may be. The steps to apply in ensuring this can be summarized with the use
of an algorithmic like framework (see Figure 1). The particular unique feature of the
algorithmic like framework is the inclusion of the five step protocol by Williams et al. (2010)
(see Figure 1).
Figure 1. The Algorithmic like Framework (for employing the FA techniques)
The concept of this protocol serves as useful theoretical underpinnings for our approach as
its focus on the use of an algorithmic protocol to help the use of the EFA. The framework (see
Figure 1) is presented using the activity diagram – a tool for describing business processes,
procedures or algorithms. It could also be used to show control flows from one activity to
another (Ojo and Estevez, 2005) as demonstrated in Figure 1. In the algorithmic like
framework, the first activity “Prior theories or hypotheses are available” has implication. That
is the researchers would need to establish if the latent construct to be measured is consistent
(has a priori) with the theoretical structure imposed on the data. If not, “No” as depicted in
Figure 1, the EFA is employed following the five steps in the top right hand side as proposed
by Williams et al. (2010). Secondly, the resultant theoretical (hypothesized) structure, often
also known as measurement model is empirically tested for reliability and validity using the
CFA. Thirdly, the SEM can be employed to provide the goodness of fit of the measurement
model, depending on the goal of the particular data analysis. And if necessary, the causal
IADIS International Journal on Computer Science and Information Systems
62
model of the measurement model can be developed using the SEM technique, but this depends
on the goal of the data analysis (Anderson and Gerbing, 1988).
Finally, the appropriate result is reported with the FA technique providing sufficient
statistical rigor for both multidimensional and multivariate data analysis of this nature. Thus,
researchers (i) would be able to fully capture the intricacies of IS processes, and (ii)
understand completely the very many processes of interrelated variables in IS evaluative
research. However, this technique is not free of weakness, despite the strengths presented so
far. There is much more to this discussion than can be provided here. As a result, readers are
requested to consult Schumacker and Marcoulides (1998), Stephenson et al. (2006), Henson
and Roberts (2006), Smith and Albaum (2010), Kaplan (2000), Tukey (1977), Cheung and
Chan (2004) and other relevant texts for details on (i) the strengths and limitations of the FA,
and (ii) how and when to use them.
5. IR SYSTEM: AN EXAMPLE OF INFORMATION SYSTEM
In the evaluation of the example IS (IR system), there is need for a paradigm change from the
prevalent system-centric methodology to the user-centric methodology. This change is
paramount so as to easily assess IR system from a holistic perspective. IR systems are systems
that assist users to locate documents that should contain information that satisfies their
information need in response to their query (Kumar et al., 2005). The WebSE, question and
answering systems, and information seeking and support system (Ong, Day, and Hsu, 2009;
Mandl, 2008) are examples of IR system. In addition, about 85.6% of those who use the
Internet use one WebSEs other (Rubel, King, Wiley, and Murray, 2009; Jansen and Spink,
2006).Thus, making it one of the most used IS, hence its adaptation for use as a case study in
this paper. The development of IS and its evaluation especially from user’s perspective is
complex and usually require interdisciplinary teams as well as techniques. This feat is the
same for user-centric evaluation of IR, which has experienced huge growth in the past decade
considering the corresponding growth of the Internet because of the ever increasing number of
users on a daily basis. So far, the evaluation of IR systems has been mostly driven by the
Cranfield-philosophy (system-centric) than the user-centric philosophy. While the system-
centric philosophy is used in the evaluation of IR system in laboratory environments, certain
amount of abstraction and control is required (Kelly, 2009). Thus most of the studies available
in literature are system-centric with an insignificant few being user-centric. There is therefore
the need for more user-centric studies that use real life users unlike the laboratory based idea
of the system-centric approach that assumes real life users as abstraction (Mandl, 2008). With
this need met, more user-centric evaluation studies will occur and the user’s aspect of IR
evaluative research that is still at its infancy would mature. The bottleneck of using abstract
users would then be significantly abated. As a result, the use of naturalistic, quantitative and
qualitative studies that will take advantage of real life searchers (Kelly, 2009) would have
been encouraged in the evaluation of IR systems.
A number of WebSEs (IR system) such as Google, Lycos, Hotbot, Yahoo, Excite,
AltaVista, and lots more exist. How they differ from one another in performance; how to
evaluate and measure their effectiveness; where to get existing measures to use to evaluate
them; and what their limitations are; are all questions still inviting research? Most, if not all of
these questions have been answered using the system-centric approach (Kumar, Suri, and
TOWARDS THE USE OF FACTOR ANALYSIS FOR USER-CENTRIC EVALUATIVE RESEARCH
IN INFORMATION SYSTEM
63
Chauhan, 2005). But a major challenge with this approach is that the measures used are not
usable in the user-centric paradigm. However, both paradigms are recommended in IR
literature (Saracevic, 1995; Akhigbe, 2012; Lewandowski and Hochstotter, 2008). This means
that existing measures to use to evaluate the IR system from the user-centric aspect are scarce.
In this paper, we attempt to underscore the need and importance for introducing the FA
technique in user-centric studies in IS. Of particular note is the use of the WebSEs as a case in
this paper to underscore the advantages of using the FA technique in IS’s assessment. As a
result, a measurement model is presented. The process of producing the model is meant to
practically show the suitability of FA as a methodology to be trusted in user-related research
in IS. This is because its data analysis potentials in user-system interactive modeling is yet to
be fully exploited in IS.
6. METHODOLOGY OF RESEARCH
Both online and hardcopy questionnaire was used in a survey to collect the needed data for
this research. 250 respondents were randomly sampled. The scale was developed in
accordance with the guidelines suggested by Churchill (1979) and Anderson and Gerbing
(1988) and it is consistent with the research of Islam (2009), Swaid and Wigand (2009),
Sumak et al. (2011) and Akhigbe et al. (2012). Having, conceptualized the constructs by
defining their domains; their dimensions were operationalized following the suggestions of
(Kelly, 2009). Additionally, following the approach of Williams et al. (2010), the algorithmic
like framework was used on the data collected for the research reported in this paper so as to
demonstrate the usefulness of the FA technique. This section, therefore presents a description
of the development of the measurement instrument, the sampling process and data analysis.
6.1 Development of Measurement Instrument
A total of 17 DVs were presented for data elicitation, using the survey method. The questions
were structured in such a way that it was easy to capture discrete data. The DVs were
operationalized from within IS domain. The Profile of the respondents used in the study was
demographically characterized (see Table 1). A continuum of 5-point Likert scale of: (1)
strongly agree; (2) agree; (3) neutral; (4) disagree and (5) strongly disagree, was employed in
the rating of users’ opinion of any three WebSEs they have used. In order to manage
measurement error in the development of the questionnaire a pre-test of the instrument was
carried out using a pilot study. As in Sumak et al. (2011), the purpose was to improve the item
of measurement and confirm that instrument will measure what it is meant for. The Cronbach
Alpha (CA) technique was used to test the instrument for internal consistency, and the level of
reliability base on the test range from 0.70.
IADIS International Journal on Computer Science and Information Systems
64
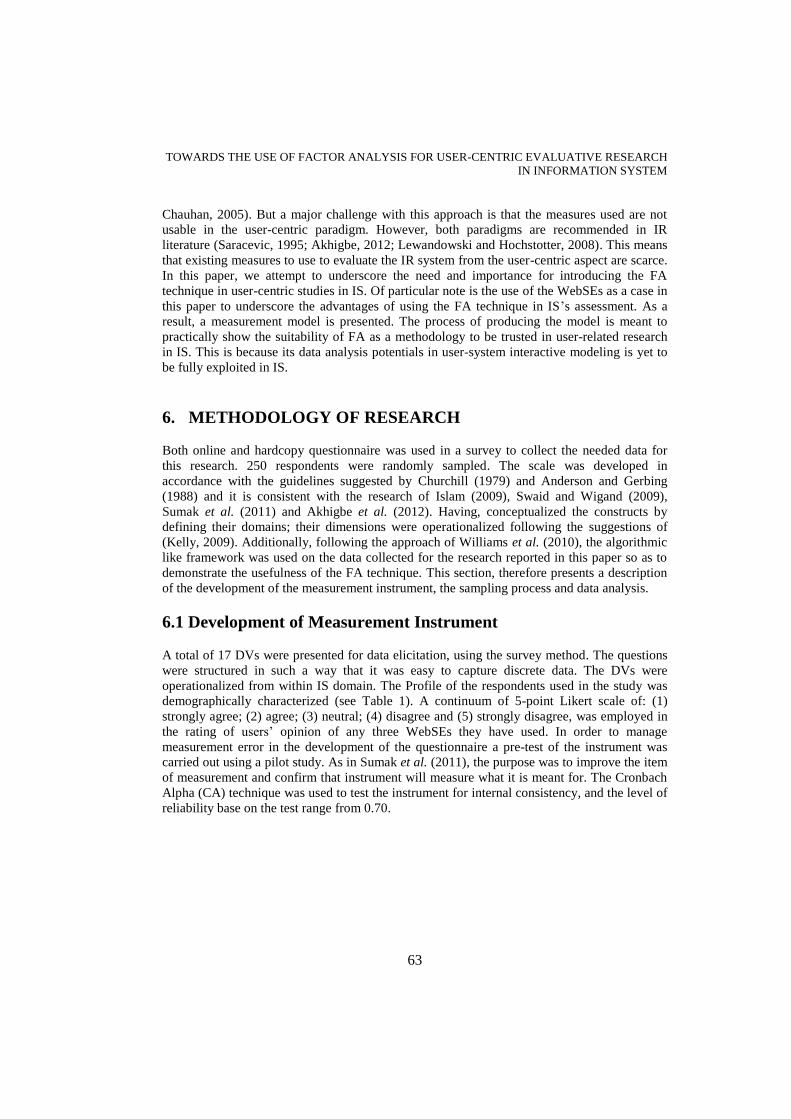
6.2 Sampling Process
WebSEs have a global spread. In order to capture this both online and hardcopy of our survey
instrument was employed for data collection. Unfortunately, the response was not
encouraging, since only 250 out of the over 500 requests that was sent out responded. Part of
the weakness of the sampling process is the inability to track the responses in order to separate
the local and international responses. The approach employed created this tracking difficult,
which we hope to check in future studies to be able to report the exact spread. But
conservatively, the ratio of International to local responses could be estimated at say 25% to
75%. However, the sample frame used is limited to the demographic characteristics or status
in Table 1.
6.3 Statistical Analysis
The EFA technique was used to generate a set of Factor Loadings (FLs) using the PCA, which
statistics revealed a priori factor structure (measurement model) that required further testing
for reliability and validity. The CFA was used to carry out the reliability and validity testing.
Composite Reliability (CR) and Average Variance Extracted (AVE) were used at the level of
the constructs (factors) to show the validity of the model; while the Individual Item Reliability
(IIR) and FLs were used at the level of items to show the reliability of the model. The cut of
points of ≥ 0.6, ≥ 0.5, ≥ 0.4 and ≥ 0.5 were used. The structural part of the model was not
necessary since (i) the focus of the analysis was to presents measures that are suitable and
replicable for subsequent use, and (ii) the analysis was meant to demonstrate the usefulness of
FA in user-centric evaluation in IS. The CFA also served the means to further purify the
model. And to find out if the model’s goodness-of-fit indices are good enough, the SEM was
employed to accomplish this (see Figure 2 for result). The other results of CFA are available
in Tables 2 and 3.
TOWARDS THE USE OF FACTOR ANALYSIS FOR USER-CENTRIC EVALUATIVE RESEARCH
IN INFORMATION SYSTEM
65
7. DATA ANALYSIS
The data analysis and results, which is a sine qua non in this research, are given in this section.
To do this, this section has been separated into three subsections that are presented as follows.
7.1 Demographic Characteristics
In Table 1, a detailed report of the demographic characteristics of the respondents is presented.
From the Table 1; the distinctive respondents are between 36 - 45 years old, most of which are
male. The table also reveals that workers used IR systems more, even more than researchers. It
is also obvious from the table that respondents had concrete internet experiences (see Table 1).
Both measures’ reliability and validity, and the suggested Measurement Model (MM) are
presented in the next two sections.
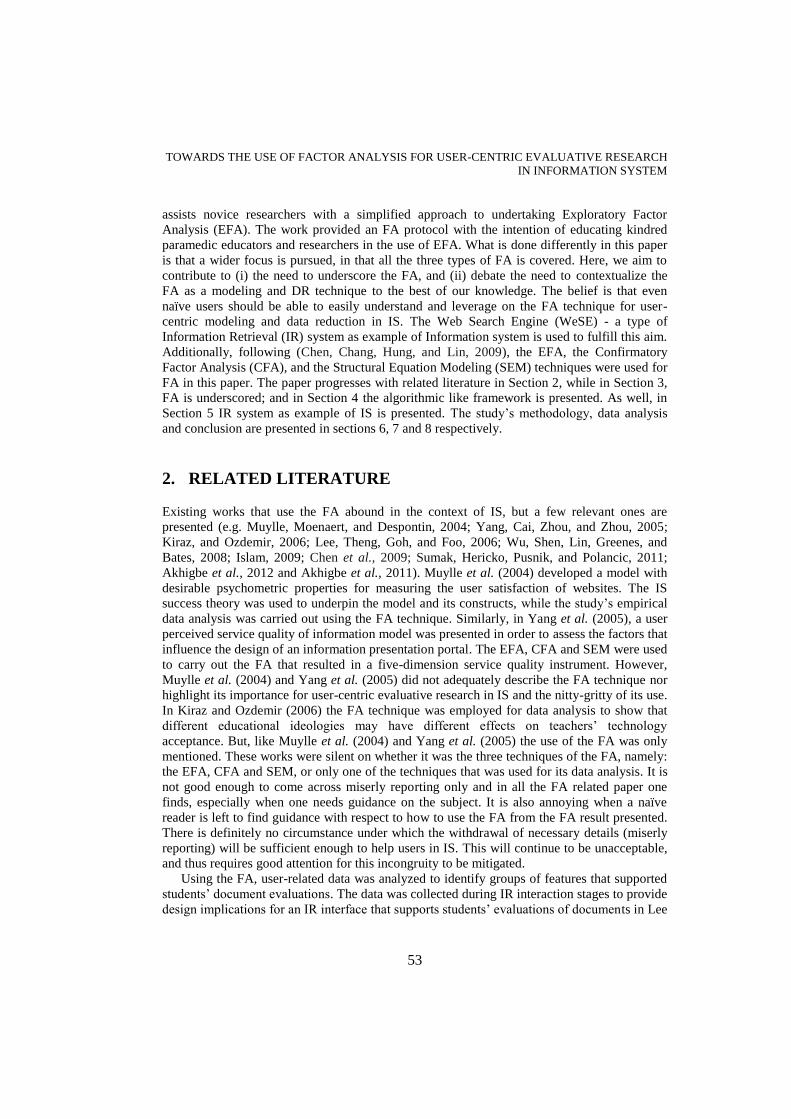
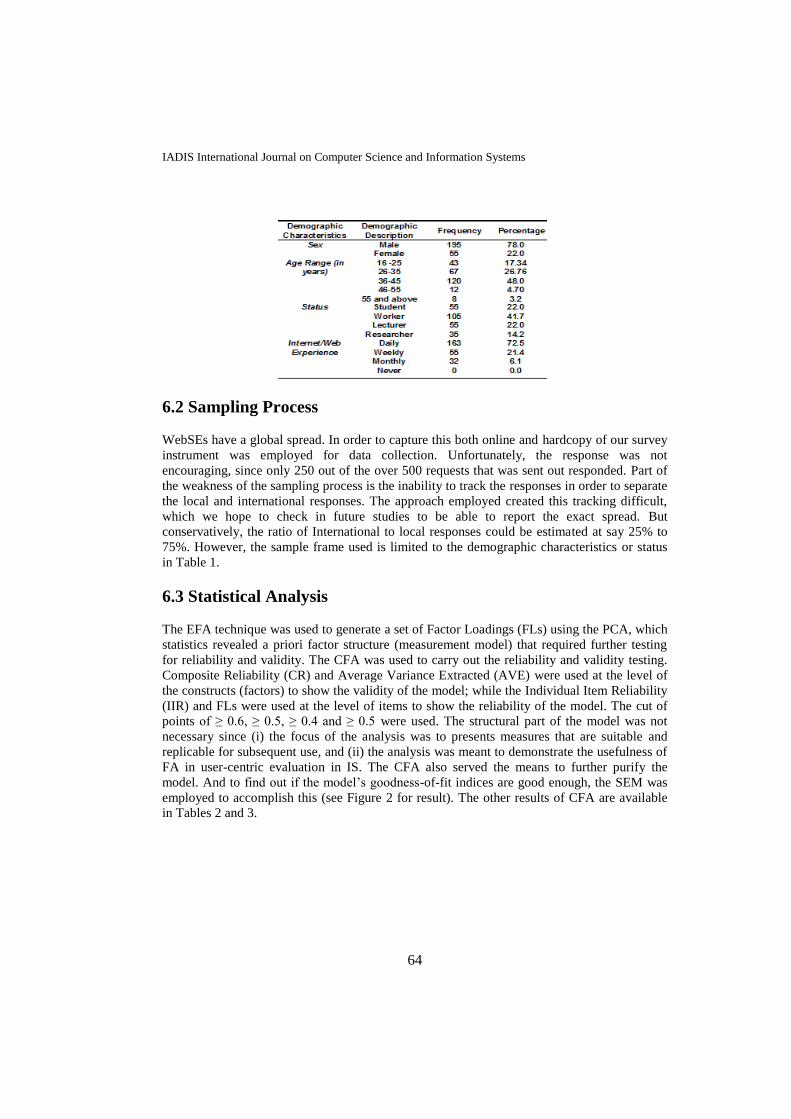
7.2 Measures’ Reliability and Validity
The statistics of Cronbach’s Alpha was used to assess the internal consistency of the
constructs. This provided the opportunity for estimating the extent to which multiple
indicators for a latent variable belong together. All the estimated CA’s values showed all the
measurement items were reliable, with all items scoring ≥ 0.7 and above. This further
confirmed that the scales from which most of the items were extracted and used were well
developed and leave up to de facto standard. The mathematical model employed to produce
the CAs are the same with the one in Schmitt (1996) and used in Sumak et al. (2011) and
Akhigbe et al. (2011). For estimating the CR, AVE, IIR and FLs the equations are the same
with that of Wu et al. (2008) and Sumak et al. (2011). In addition all the test results satisfied
both internal and external validity of the measurement instrument and scales (see Tables 2 and
3).
U (Usability); SQ (Service Quality);
AVE (Average Variance Extracted using ≥ 0.5);
IA (Information Availability); CR (Composite reliability using ≥ 0.6);
SA (System’s Affordances);
MC (Measures Code)
IC (item code);
FLs (Factor loadings using ≥ 0.5);
IIR (Individual Item Reliability using ≥ 0.4)
Table 2. Results of the Tests for Item’s Reliability Table 3. Measure’s Validity
IADIS International Journal on Computer Science and Information Systems
66
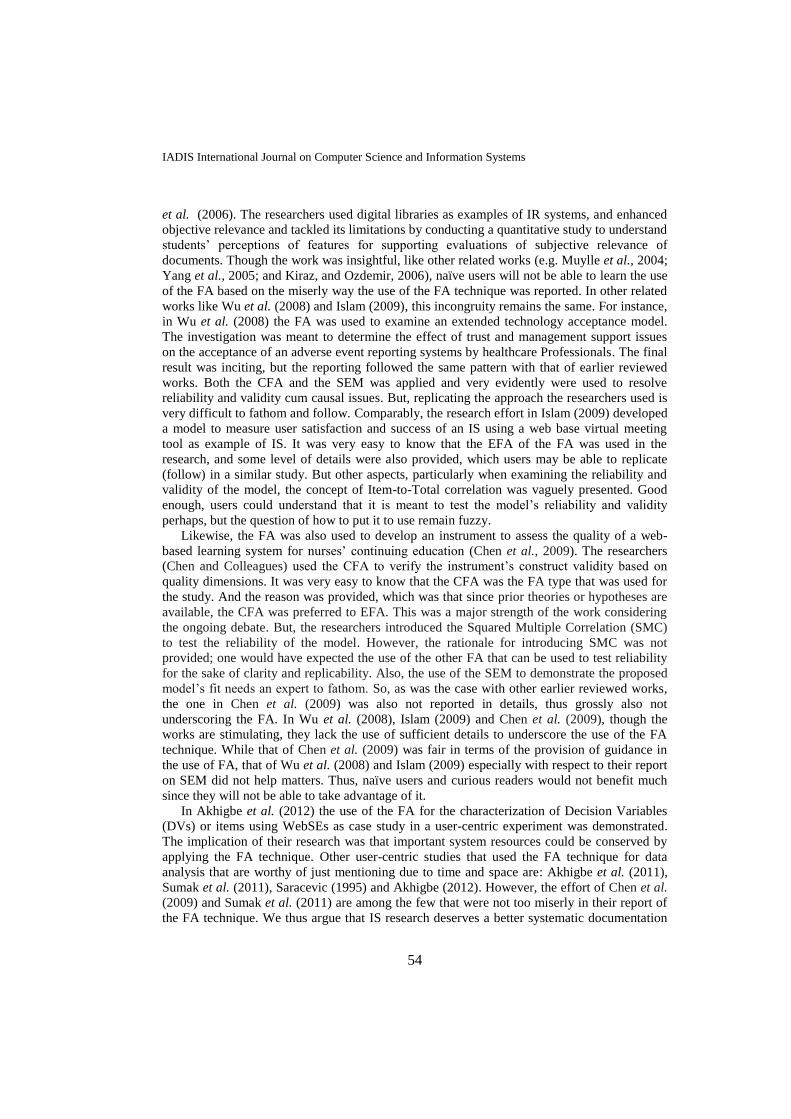
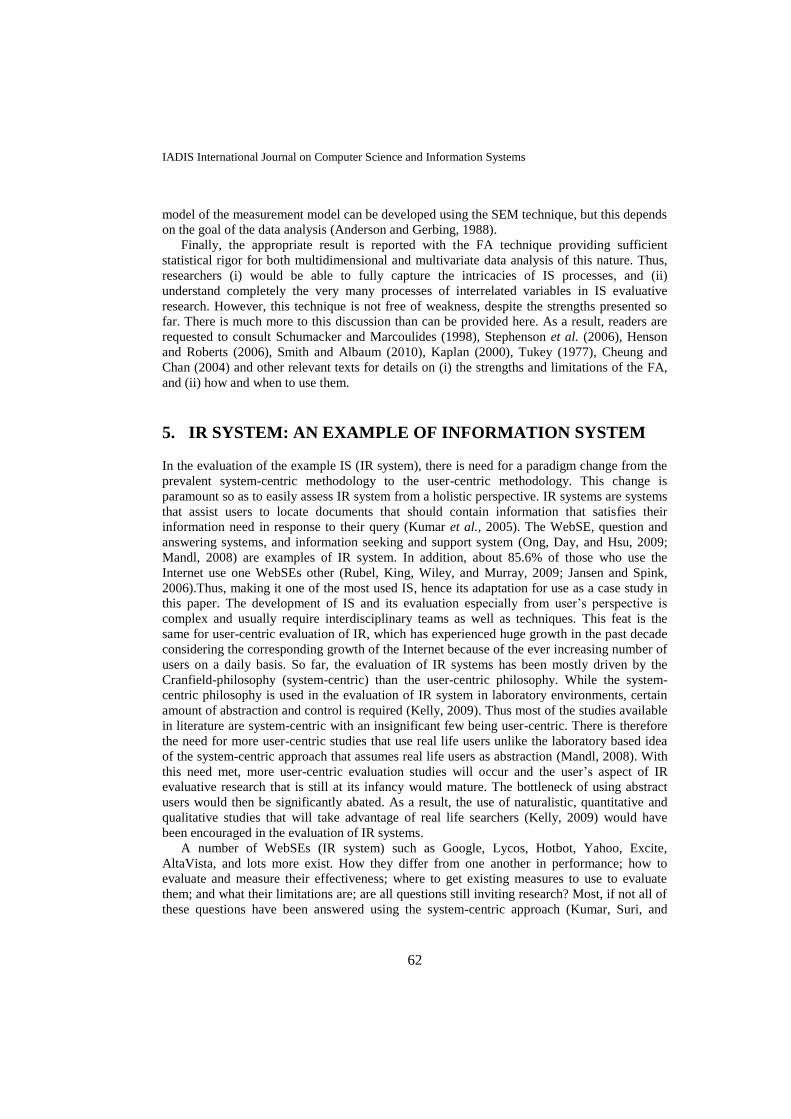
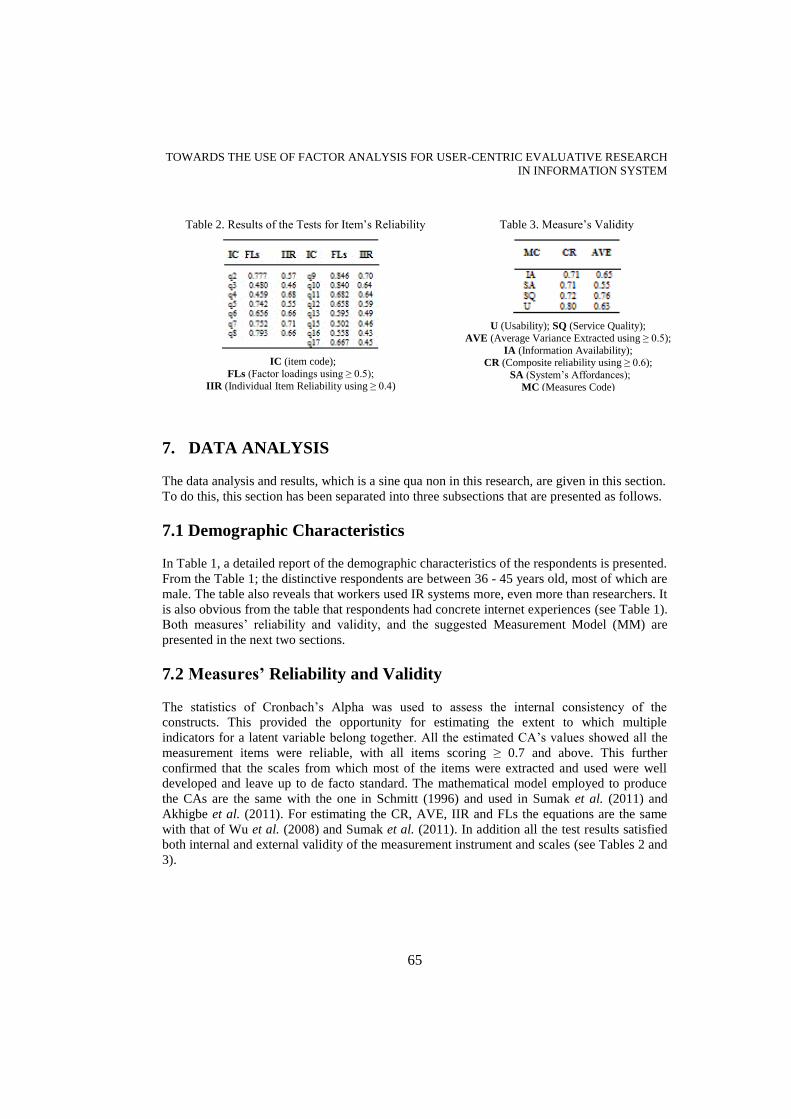
7.3 The Measurement Model
The overall fit model that resulted in the final MM (see Figure 2) was estimated to ensure a
good data fit. This is consequent upon first subjecting the a priori factor (model) structure
from EFA to the CFA statistical rigor, and the secondly the SEM exactitude. As proposed by
Rainer and Miller (1996) and used in Wu et al. (2008), Swaid and Wigand (2009), and Sumak
et al. (2011), a variety of fit indices were assessed to ensure this exactitude and identify the
MM’s goodness-of-fit. The statistics generated for this purpose are: x2/df (Chi Square/Degree
of Freedom); GFI (Goodness of Fit Index); NFI (Normed Fit Index); NNFI (Non-Normed Fit
Index); CFI (Comparative Fit Index); RMSR (Root Mean Square Residual); and RMSEA
(Root Mean Square Error of Approximation). A summary of the estimated fit indices of the
MM are presented beside the MM, using the standard recommended criteria (value) in bracket
(see Figure 2). The model – MM is the validated scale, which data is most consistent and is a
second-order factor model. This strengthens the fact that the MM retains a multidimensional
structure.
Furthermore, the results that brought about the model suggest in entirety that the MM
scales (see Figure 2) are reliable. The four subscales - U (Usability); SQ (Service Quality); IA
(Information Availability); and SA (System’s Affordances) are also reasonably reliable as
subcomponents of the overall MM scale. This is consistent with that of Sumak et al. (2011),
Stephenson et al. (2006), and Swaid and Wigand (2009) and as a result of the CA coefficients
of .70 and above and the composite 17- item scale (see appendix) and its subscales.
8. CONCLUSION
This study employed the scale development procedure to establish a 4-factor and 15-item
Evaluative Model (EM). This resulted from the need to demonstrate the capability of the FA
for data reduction, and also underscore its use for user-centric evaluative research in IS, using
the WeSE. The result of the model’s testing showed that it provided a high degree of
confidence in terms of reliability and validity of the scales. Additionally, the result of the
goodness-of-fit of the EM corroborates this since it is within the recommended standard value.
The 4-dimensions of the model are: Usability, service quality, information availability, and
system’s affordances.
Figure 2. The Measurement Model from CFA
GFI (≥ 0.9) = 0.10
NFI (≥ 0.9) = 0.099
CFI (≥ 0.9) = 0.085
x2/df (≤ 3.00) = 2.55
NNFI (≥ 0.9) = 0.097
RMSR (≤ 0.05) = 0.034
RMSEA (≤ 0.08) = 0.069
The Measurement Model’s
Goodness-of-fit indices
TOWARDS THE USE OF FACTOR ANALYSIS FOR USER-CENTRIC EVALUATIVE RESEARCH
IN INFORMATION SYSTEM
67
The factors (measures) theorize that users’ satisfaction with IR system will depend on its
ability to provide information as at when needed, but within adequate service delivery. In the
use of IR systems, it is necessary for users to be in control of the system in terms of usage.
However, items q1 and q14 were deleted during factor loading and extraction. These two
items connote system quality. Our insinuation is that technically superior system (system
quality) would only be considered successful if it meets users’ needs. So, a system may
retrieve information very fast, and supported by up-to-date hardware and software; but if its
usability is poor and the other 3-dimensions (factors) of the EM is lacking then its
acceptability base on usage amidst users will be very low. This study, therefore compliments
existing research in which statistics such as ANOVA, Chi-square and T-test are used by
demonstrating the potentials of FA over them for user-centric research. This is because unlike
others - ANOVA, Chi-square and T-test, FA can handle multivariate data analysis.
The results of this study have implications that would be relevant to different stakeholders
in IS and IR domain. A good understanding of the 4-factor that forms the EM would help (i) e-
commerce owners and (ii) other related organizations to benefit by possessing the know-how
to make more customers, and also deliver quality service to stakeholders. The 15-items of the
EM, which cut across 4-factors, would serve useful diagnostic purposes. And researchers in IS
could also use the validated scale to evaluate IR systems from the perspective of the user. Both
the information provided about the FA technique and the 4-factor EM could serve as a starting
point for further research on user-centric evaluative research in IR.
This paper is not without some limitations. The expertise demonstrated with respect to the
use of FA still needs a lot of maturing. Secondly, external validity limitations need to be put
into consideration in the interpretation of results. Though, the sample used is a fair, it is
limited in size. Next, the study is also limited to only WeSEs, thus the generalizations of
results are limited to the characteristics and features of WeSEs, hence the need to view the EM
with caution. For future work, it will be necessary to examine new variables for suitability in
IR system evaluation, but within the context of ISs. Since, ISs are within societal context, we
argue that the use of FA is evidently a candidate technique, hence the need to further examine
algorithmic issues and implementation. Thus, FA would be well contextualized for IS
evaluative research.
ACKNOWLEDGEMENT
We wish to express our appreciation to all, especially those whose papers were reviewed to
provide the premise for this study; and to Obafemi Awolowo University, and TETFund for
their immense support.
REFERENCES
Akhigbe, B.I. (2012). Development of a user-centered evaluative model for information retrieval system.
LAP LAMBERT Academic Publishers, Saarbrücken, Germany.
Akhigbe, B.I., Afolabi, B.S., and Adagunodo, E.R. (2012). Item’s Characterization for Model’s
Development in Information Retrieval System Evaluation. Communications in Computer and Information Science, Vol. 285, Part 1, pgs 101-111, doi: 10.1007/978-3-642-29166-1_9.
IADIS International Journal on Computer Science and Information Systems
68
Akhigbe, B.I., Afolabi, B.S., Udo, J.I., and Adagunodo, E.R. (2011a). An Evaluative Model for
Information Retrieval System Evaluation: A User-centered Approach. International Journal on Computer Science and Engineering, Vol. 3 No. 7, pgs 2627 – 2634
Akhigbe, B.I., Afolabi, B.S., and Adagunodo, E.R. (2011b). Assessment of Measures for Information
Retrieval System Evaluation: A User-centered Approach. International Journal of Computer
Applications, Vol. 25 (7), pp 6-12.
Anderson, J.C., and Gerbing, D.W. (1988). Structural equation modeling in practice: A review and
Hendrick, C., and Hendrick, S. (1986). A Theory and Method of Love. Journal of Personality and Social
Psychology, 50, 392-402.
Henson, R.K., and Roberts, J.K. (2006). Use of Exploratory Factor Analysis in Published Research:
Common Errors and Some Comment on. Educational and Psychological Measurement, Vol. 66, No. 3, pgs 393-416.
Hooper, D., Coughlan, J. and Mullen, M.R. (2008). “Structural Equation Modeling: Guidelines for
Determining Model Fit.” The Electronic Journal of Business Research Methods, Vol. 6 (1), pp. 53 – 60. Available online at www.ejbrm.com
Hoyle, R.H., and Kenny, D.A. (1999). Sample size, reliability, and tests of statistical mediation. In R. H.
Hoyle (Ed.), Statistical strategies for small sample research (pp. 195–222). Sage, Thousand Oaks,
CA.
Islam, A.K.M.N. (2009). Developing a Model to Measure User Satisfaction and Success of Virtual
Meeting Tools in an Organization. J. Filipe and J. Cordeiro (Eds.): ICEIS 2009, LNBIP 24, pp. 975–
987, 2009. Springer-Verlag Berlin Heidelberg.
Jansen, B.J., and Spink, A. (2006). How are we searching the world wide web? A comparison of nine
search engine transaction logs. Information Processing and Management 42(1):pp. 248-263.
Joreskog, K.G. (1973). A general method for estimating a linear structural equation system. In A. S.
Goldberger & O. D. Duncan (Eds.), Structural equation models in the social sciences (pp. 85–112). New York: Seminar Press.
Kaplan, D. (2000). Structural Equation Modeling. Foundations and Extensions. Sage Publications, Thousand Oaks, London New Delhi.
Karaiskos, D. C. (2009). A predictive model for the acceptance of pervasive information systems by individuals.
Unpublished PhD Dissertation, Athens University of Economics and Business.
TOWARDS THE USE OF FACTOR ANALYSIS FOR USER-CENTRIC EVALUATIVE RESEARCH
IN INFORMATION SYSTEM
69
Kelly, D. (2009). Methods for Evaluating Interactive Information, Foundations and Trends in Information Retrieval, Vol. 3, Nos. 1–2, 1–224. doi: 10.1561/ 15000 -00012
Kieffer, K.M. (1999). An introductory primer on the appropriate use of exploratory and confirmatory factor analysis. Research in the Schools, 6, 75-92.
Kiraz, E. and Ozdemir, D. (2006). The Relationship between Educational Ideologies and Technology Acceptance in Preservice Teachers. Educational Technology & Society, 9 (2), 152-165.
Klecun E. and Cornford, T. (2005) A critical approach to evaluation. European Journal of Information Systems 14, 229-243.
Kourouthanassis, P.E., and Giaglis, G.M. (2007). Pervasive Information Systems, Armonk, NY: M.E. Sharpe.
Kumar, R., Suri, P.K., and Chauhan, R.K. (2005). Search Engines Evaluation. DESIDOC Bulletin of Information Technology, Vol. 25, No. 2, March 2005, pp. 3-10.
Lagsten, J. (2011). "Evaluating Information Systems according to Stakeholders: A Pragmatic Perspective and Method." Electronic Journal of Information Systems Evaluation (EJISE), 14(1): 73-88.
Lee, S.S., Theng Y.L., Goh, D.H., and Foo, S. (2006). An exploratory factor analytic approach to
understand design features for academic learning environments. Proceedings of the 10th European
Conference on Digital Libraries ECDL 2006, (September 17-22, Alicante, Spain), Lecture Notes in Computer Science 4172, 315-328.
Lewandowski, D., and Hochstotter, N. (2008). Web Searching: A Quality Measurement Perspective. A.
Spink and M. Zimmer (eds.), Web Search, Springer Series in Information Science and Knowledge
Management 14, pp 309- 340. Published in Springer-Verlag Berlin Heidelberg.
Mandl, T. (2008). Recent Developments in the Evaluation of Information Retrieval Systems: Moving
Towards Diversity and Practical Relevance. Informatica, 32 (2008) 27–38
Muylle, S., Moenaert, P., and Despontin, M. (2004). The conceptualization and empirical validation of
web site user satisfaction. Information Management, 41: 543-560.
Netemeyer, R.G., Bearden, W.O., and Sharma, S. (2003). Scaling procedures: issues and applications.
Sage Publications, California, USA.
Nunnally, J.C. (1978). Psychometric theory (2nd ed.). McGraw-Hill, New York.
Nunnally, J.C., and Berstein, I.H. (1994). Psychometric Theory (More recent version). McGraw-Hill,
New York.
Ong, C.-S., Day, M.-Y., and Hsu, W.-L. (2009). The measurement of user satisfaction with question
answering systems. Elsevier, Information & Management, 46 (2009), pp 397–403
Pett, M.A., Lackey, N.R., and Sullivan, J.J. (2003). Making Sense of Factor Analysis: The use of factor analysis for instrument development in health care research. Sage Publications, Inc California.
Petter, S., Delone, W., Mclean, E. (2008). Measuring information systems success: models, dimensions, measures, and relationships. European Journal of Information Systems, 17, pp 236–263.
Rainer, R.K., and Miller, M.D. (1996). An assessment of the psychometric properties of the computer attitude scale. Computers in Human Behavior, vol. 12, Spring. pp. 93-105.
Rubel, S., King, K., Wiley, M. and Murray, R. (2009). Search Engine Visibility: An Edelman Digital
Position Paper Retrieved from http://www.edelman.com/image /insights/content /Search%20Engine%20Visibility.pdf on 02/06/2011 @ 9:04pm
IADIS International Journal on Computer Science and Information Systems
70
Ruel, M.T., C.E. Levin, M. Armar-Klemesu, D. Maxwell and S.S. Morris, (1999). Good care practices
can mitigate the negative effects of poverty and low maternal schooling on children’s nutritional
status: Evidence from Accra. Food Consumption and Nutrition Division Discussion Paper No. 62, International Food Policy Research Institute, Washington, D.C.
Saracevic, T. (1995). Evaluation of Evaluation in Information Retrieval. Proceedings of SIGIR 95, 138-46
Schmitt, N. (1996). Uses and abuses of Coefficient alpha. Psychological Assessment, Vol. 8, pp. 350- 353.
Schumacker, R.E., and Marcoulides, G.A. (1998). Interaction and nonlinear effects in structural equation modeling. Mahwah, NJ: Lawrence Erlbaum Associates, Inc.
Smith, S.M., and Albaum, G.S. (2010). Introduction to Marketing Research. In "Proceedings of the 14th
Conference on Cross Cultural Research in Business Studies," Volume 14, Cross Cultural Research in
Business Studies, Puerto Vallarta, MX, Kristie K. Seawright and Scott M. Smith eds. 2010.
Stephenson, M.T., Holbert, R.L., and Zimmerman, R.S. (2006). On the Use of Structural Equation
Modeling in Health Communication Research. Health Communication, 20 (2), pp 159–167.
Sumak, B., Hericko, M., Pusnik, M., and Polancic, G. (2011). Factors Affecting Acceptance and Use of Moodle: An Empirical Study Based on TAM. Informatica, 35, pp 91–100.
Sun, W., Chou, C.-P., Stacy, A.W., Ma, H., Unger, J. and Gallaher, P. (2007). SAS and SPSS macros to
calculate standardized Cronbach’s alpha using the upper bound of the phi coefficient for dichotomous items. Behavior Research Methods, 39 (1), pp 71-81.
Swaid, S.I., and Wigand, R.T. (2009). Measuring the Quality of e-Service: Scale Development and Initial Validation. Journal of Electronic Commerce Research, Vol. 10, No 1, pp 13-28.
Thompson, B. (2004). Exploratory and confirmatory factor analysis: understanding concepts and applications.
Washington, DC: American Psychological Association.
Thompson, B., and Daniel, L.G. (1996). Factor analytic evidence for the construct validity of scores: A historical overview and some guidelines. Educational and Psychological Measurement, 56, 197-208.
Tukey, J. W. (1977). Exploratory data analysis. Addison Wesley, Reading, MA.
Wu, J.-H., Shen, W.-S., Lin, L.–M., Greenes, R., and Bates, D.W. (2008). Testing the Technology
Acceptance Model for Evaluating Healthcare Professionals’ Intention to Use an Adverse Event
Reporting System. International Journal for Quality in Health Care; Volume 20, Number 2: pp. 123–129
Yang, Z., Cai, S., Zhou, Z., and Zhou, N. (2005). Development and validation of an instrument to
measure user perceived service quality of information presenting Web portals. Information & Management, 42 (2005), pp 575–589.
APPENDIX
Appendix I:
This appendix contains the 17- item composite (multiple) scale and its subscales (see Appendix II)
q1 - The system retrieves information very fast
q2 - The system is easy to use
q3 - The system is clear and understandable to interact with
q4 - Learning to use the system is easy
q5 - It is very easy to express my tasks need to the system
q6 - The user interface of the system is easy to navigate and responds to my tasks needs promptly
TOWARDS THE USE OF FACTOR ANALYSIS FOR USER-CENTRIC EVALUATIVE RESEARCH
IN INFORMATION SYSTEM
71
q7 - The system is dependable
q8 - I rarely see system failure
q9 - The system’s snippet makes it easy to find documents that are relevant to my information need
q10 - The system support even inexperience users with no knowledge to do their job well
q11 - I get the information I need in time
q12 - The system provides up-to-date information
q13 - The system provides prompt service to users
q14 - The system is supported by up-to-date hardware and software
q15 - The system gives clue to help describe information need during query formulation
q16 - It is easy for me to become skillful at using the system
q17 - I find it easy to use the system to do what I want it to do
Appendix II:
The subscales of the 17- item composite (multiple) scale