econstor www.econstor.eu Der Open-Access-Publikationsserver der ZBW – Leibniz-Informationszentrum Wirtschaft The Open Access Publication Server of the ZBW – Leibniz Information Centre for Economics Standard-Nutzungsbedingungen: Die Dokumente auf EconStor dürfen zu eigenen wissenschaftlichen Zwecken und zum Privatgebrauch gespeichert und kopiert werden. Sie dürfen die Dokumente nicht für öffentliche oder kommerzielle Zwecke vervielfältigen, öffentlich ausstellen, öffentlich zugänglich machen, vertreiben oder anderweitig nutzen. Sofern die Verfasser die Dokumente unter Open-Content-Lizenzen (insbesondere CC-Lizenzen) zur Verfügung gestellt haben sollten, gelten abweichend von diesen Nutzungsbedingungen die in der dort genannten Lizenz gewährten Nutzungsrechte. Terms of use: Documents in EconStor may be saved and copied for your personal and scholarly purposes. You are not to copy documents for public or commercial purposes, to exhibit the documents publicly, to make them publicly available on the internet, or to distribute or otherwise use the documents in public. If the documents have been made available under an Open Content Licence (especially Creative Commons Licences), you may exercise further usage rights as specified in the indicated licence. zbw Leibniz-Informationszentrum Wirtschaft Leibniz Information Centre for Economics Chow, Hwee Kwan Working Paper Asian tigers' choices: An overview ADBI working paper series, No. 238 Provided in Cooperation with: Asian Development Bank Institute (ADBI), Tokyo Suggested Citation: Chow, Hwee Kwan (2010) : Asian tigers' choices: An overview, ADBI working paper series, No. 238 This Version is available at: http://hdl.handle.net/10419/53714
Transcript
econstor www.econstor.eu
Der Open-Access-Publikationsserver der ZBW – Leibniz-Informationszentrum WirtschaftThe Open Access Publication Server of the ZBW – Leibniz Information Centre for Economics
Standard-Nutzungsbedingungen:
Die Dokumente auf EconStor dürfen zu eigenen wissenschaftlichenZwecken und zum Privatgebrauch gespeichert und kopiert werden.
Sie dürfen die Dokumente nicht für öffentliche oder kommerzielleZwecke vervielfältigen, öffentlich ausstellen, öffentlich zugänglichmachen, vertreiben oder anderweitig nutzen.
Sofern die Verfasser die Dokumente unter Open-Content-Lizenzen(insbesondere CC-Lizenzen) zur Verfügung gestellt haben sollten,gelten abweichend von diesen Nutzungsbedingungen die in der dortgenannten Lizenz gewährten Nutzungsrechte.
Terms of use:
Documents in EconStor may be saved and copied for yourpersonal and scholarly purposes.
You are not to copy documents for public or commercialpurposes, to exhibit the documents publicly, to make thempublicly available on the internet, or to distribute or otherwiseuse the documents in public.
If the documents have been made available under an OpenContent Licence (especially Creative Commons Licences), youmay exercise further usage rights as specified in the indicatedlicence.
zbw Leibniz-Informationszentrum WirtschaftLeibniz Information Centre for Economics
Chow, Hwee Kwan
Working Paper
Asian tigers' choices: An overview
ADBI working paper series, No. 238
Provided in Cooperation with:Asian Development Bank Institute (ADBI), Tokyo
Suggested Citation: Chow, Hwee Kwan (2010) : Asian tigers' choices: An overview, ADBIworking paper series, No. 238
This Version is available at:http://hdl.handle.net/10419/53714
ADBI Working Paper Series
Asian Tigers’ Choices: An
Overview
Hwee Kwan Chow
No. 238 August 2010
Asian Development Bank Institute
Hwee Kwan Chow is associate professor at the School of Economics of Singapore Management University.
The views expressed in this paper are the views of the authors and do not necessarily reflect the views or policies of ADBI, the Asian Development Bank (ADB), its Board of Directors, or the governments they represent. ADBI does not guarantee the accuracy of the data included in this paper and accepts no responsibility for any consequences of their use. Terminology used may not necessarily be consistent with ADB official terms.
The Working Paper series is a continuation of the formerly named Discussion Paper series; the numbering of the papers continued without interruption or change. ADBI’s working papers reflect initial ideas on a topic and are posted online for discussion. ADBI encourages readers to post their comments on the main page for each working paper (given in the citation below). Some working papers may develop into other forms of publication.
Suggested citation:
Chow, H. 2010. Asian Tigers’ Choices: An Overview. ADBI Working Paper 238. Tokyo: Asian Development Bank Institute. Available: http://www.adbi.org/working-paper/2010/08/09/4029.asian.tiger.economies/ Please contact the author(s) for information about this paper.
This paper considers the choices facing the Asian tiger economies regarding growth strategies that foster trans-Pacific rebalancing. A review of historical data spanning 2000 to 2008 reveals only a slight widening of the overall current account surplus but that there is considerable variation across the countries, with Hong Kong, China exhibiting the biggest increase in the saving and investment (S-I) balance. Meanwhile, cross-correlation coefficient estimates tentatively suggest that changes in the real effective exchange rate do not seem to exhibit a consistent negative lead over changes in the S-I gap in the short run over the past decade. High import leakage, particularly for the ultra small, open economies of Hong Kong and Singapore, calls into question the scope for recalibrating growth drivers towards domestic demand. Nonetheless, the implementation of structural policies such as those aimed at raising the productivity and wages of workers in the services industry as well as the introduction of financial products that alleviates the need for precautionary saving can induce domestic consumer demand, especially for the larger economies of Korea and Taipei,China. Moreover, the rising affluence and living standards in fast growing regional economies such as the People’s Republic of China (PRC) offers the Asian tigers the potential of gearing their trade structure in final goods towards markets in the region, thereby aiding the reduction in trans-Pacific imbalances.
1. INTRODUCTION The recent global economic crisis hit the Asian tiger economies of Hong Kong, China; Korea; Singapore; and Taipei,China hard, in spite of their strong macroeconomic fundamentals and sound financial systems. Following the 1997 Asian financial crisis, these economies had strengthened current accounts and had significant buildups in foreign reserves. Meanwhile, their financial systems had become more resilient, with the restructuring of balance sheets and the enhancement of surveillance. Nevertheless, each tiger economy experienced a collapse in exports and an attendant sharp contraction of Gross Domestic Product (GDP) in the second half of 2008 as global demand faltered. The GDP growth rates for Hong Kong, China; Korea; Singapore; and Taipei,China hit lows of -7.8%, -4.2%, -9.5% and -10.1%, respectively, in the first quarter of 2009. Such developments reflect the small open nature of these economies1 and highlight their vulnerability to external shocks. There were also signs of financial contagion in the case of the Republic of Korea (hereafter Korea) which at one juncture suffered from currency turmoil.
Subsequently, towards the end of 2009, the Asian tigers rapidly rebounded, with the support of swift domestic policy responses on both the fiscal and monetary fronts. Fiscal stimulus measures amounted to around 2.6% of GDP for this group of countries and by the first half of 2009, nearly 40% of the fiscal stimulus was implemented (IMF, 2009a). Meanwhile, massive policy stimulation in the advanced countries led to the normalization of global trade, while pubic support of their financial sectors lifted financial market sentiment. The 2010 and 2011 growth projections by IMF (2010) for the Asian tigers as a whole stand at 4.8% and 4.7%, respectively. There has also been a resurgence of private capital flows into these economies in search of high yielding investments, underscoring international investor optimism about the region’s growth prospects. Consequently, stock prices and property prices have been trending up amid the flood of global liquidity inflows and these developments have started to raise concerns about the emergence of asset prices bubbles in these economies.
By contrast, the recovery in the advanced economies is expected to remain subdued, being weighed down by various factors such as high unemployment rates, high public debt, difficult financial conditions, and weak household balance sheets. In light of these challenges, the advanced economies will probably experience sluggish growth and consequently their demand for Asian exports will likely remain subdued in comparison with the pre-crisis period. Hence, in order to sustain the ongoing economic recovery, it is imperative for the Asian tigers to rely on domestic and regional demand for growth. In other words, policymakers in these countries would need to work towards the rebalancing of demand from say the United States (US) that has large current account deficits in relation to the Asian countries that have big current account surpluses. More importantly, such global imbalances are deemed to be unsustainable and may unwind in a disorderly manner—involving a sharp fall in the US dollar or a protracted economic downturn in the industrialized countries—which would have adverse consequences for the world economy, not least the Asian tigers.
1 Merchandise exports as a % of GDP for Hong Kong, China; Korea; Singapore; and Taipei,China are
169%, 45%, 185%, and 65%, respectively.
ADBI Working Paper 238 Chow
The purpose of this overview paper is to explore the choices faced by the Asian tigers in terms of growth strategies that aid global rebalancing. To this end, we examine the trends of the imbalances in these economies and consider the prospects of reducing such imbalances. The rest of this article is organized as follows: The next section investigates the evolution of saving and investment in the Asian tigers over the past decade and relates the changes in the magnitude of the S-I gap to exchange rate movements. Section 3 discusses the prospect of domestic demand taking on the role of a growth driver in these economies, while section 4 focuses on the potential of targeting final demand in the regional markets. This is followed by an examination of policy issues pertaining to rebalancing the Asian tiger economies in section 5. Section 6 concludes.
2. EVOLUTION OF SAVING AND INVESTMENT This section examines historical data spanning 2000 to 2008 on the saving and investment (S-I) balance at the macroeconomic level for the Asian tiger economies. In addition, we present the sectoral composition of saving and investment when such data are available. Figure 1 below depicts the trends in overall gross national saving and gross investment, while Figure 2 shows the overall current account balance for the grouping.2
Figure 1: Overall Gross National Saving and Gross Investment (% of GDP)
1517192123252729313335
2000 2001 2002 2003 2004 2005 2006 2007 2008 2009
Saving Investment
Source: World Economic Outlook 2009 Database
2 The overall ratios or percentages are obtained from the IMF which computes composites of ratios relating
to the domestic economy weighted by GDP valued at purchasing power parities (PPPs) as a share of group GDP.
4
ADBI Working Paper 238 Chow
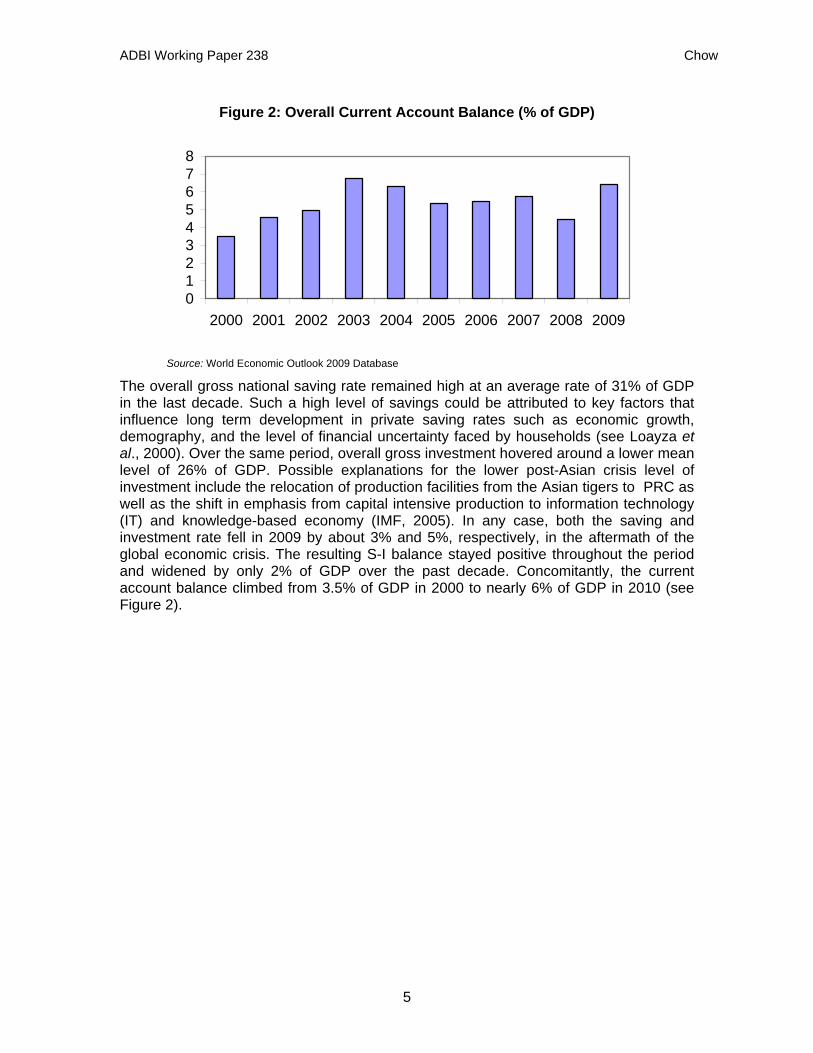
Figure 2: Overall Current Account Balance (% of GDP)
012345678
2000 2001 2002 2003 2004 2005 2006 2007 2008 2009
Source: World Economic Outlook 2009 Database The overall gross national saving rate remained high at an average rate of 31% of GDP in the last decade. Such a high level of savings could be attributed to key factors that influence long term development in private saving rates such as economic growth, demography, and the level of financial uncertainty faced by households (see Loayza et al., 2000). Over the same period, overall gross investment hovered around a lower mean level of 26% of GDP. Possible explanations for the lower post-Asian crisis level of investment include the relocation of production facilities from the Asian tigers to PRC as well as the shift in emphasis from capital intensive production to information technology (IT) and knowledge-based economy (IMF, 2005). In any case, both the saving and investment rate fell in 2009 by about 3% and 5%, respectively, in the aftermath of the global economic crisis. The resulting S-I balance stayed positive throughout the period and widened by only 2% of GDP over the past decade. Concomitantly, the current account balance climbed from 3.5% of GDP in 2000 to nearly 6% of GDP in 2010 (see Figure 2).
5
ADBI Working Paper 238 Chow
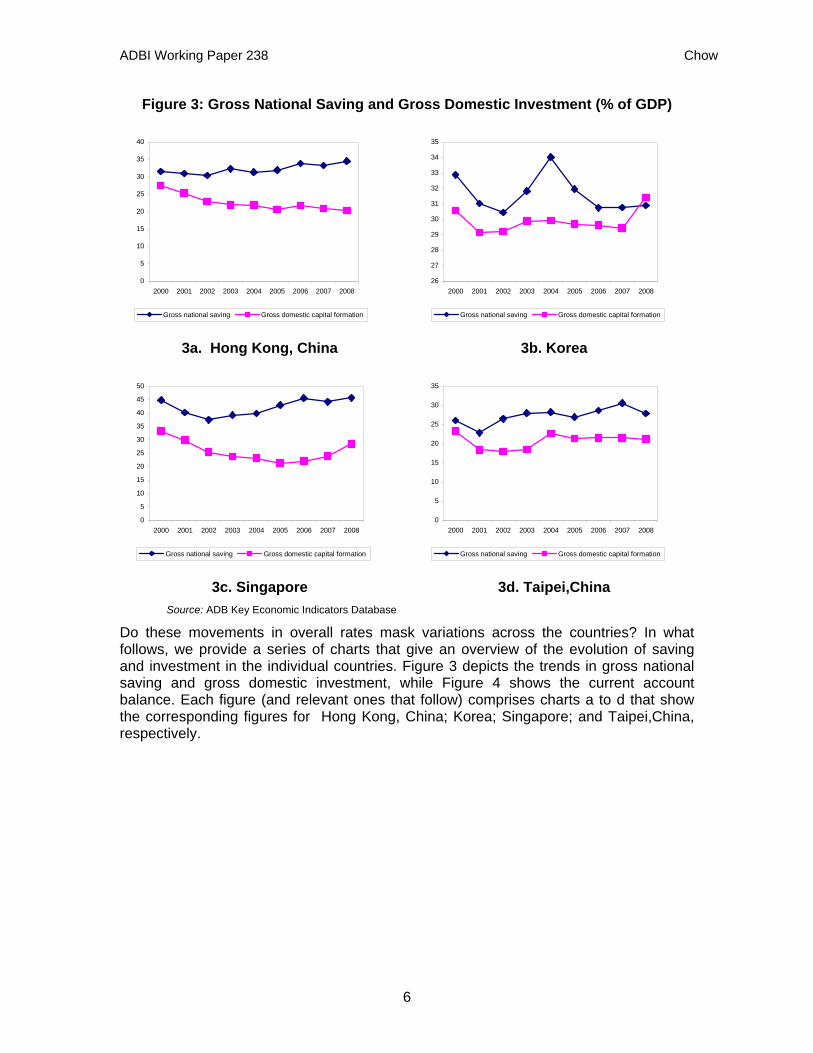
Figure 3: Gross National Saving and Gross Domestic Investment (% of GDP)
0
5
10
15
20
25
30
35
40
2000 2001 2002 2003 2004 2005 2006 2007 2008
Gross national saving Gross domestic capital formation
3a. Hong Kong, China
26
27
28
29
30
31
32
33
34
35
2000 2001 2002 2003 2004 2005 2006 2007 2008
Gross national saving Gross domestic capital formation
3b. Korea
0
5
10
15
20
25
30
35
40
45
50
2000 2001 2002 2003 2004 2005 2006 2007 2008
Gross national saving Gross domestic capital formation
3c. Singapore
0
5
10
15
20
25
30
35
2000 2001 2002 2003 2004 2005 2006 2007 2008
Gross national saving Gross domestic capital formation
3d. Taipei,China
Source: ADB Key Economic Indicators Database Do these movements in overall rates mask variations across the countries? In what follows, we provide a series of charts that give an overview of the evolution of saving and investment in the individual countries. Figure 3 depicts the trends in gross national saving and gross domestic investment, while Figure 4 shows the current account balance. Each figure (and relevant ones that follow) comprises charts a to d that show the corresponding figures for Hong Kong, China; Korea; Singapore; and Taipei,China, respectively.
6
ADBI Working Paper 238 Chow
Figure 4: Current Account Balance (% of GDP)
0
2
4
6
8
10
12
14
16
18
2000 2001 2002 2003 2004 2005 2006 2007 2008
Current Account: Balance
4a. Hong Kong, China
-1
0
1
2
3
4
5
2000 2001 2002 2003 2004 2005 2006 2007 2008
Current Account: Balance
4b. Korea
0
5
10
15
20
25
30
2000 2001 2002 2003 2004 2005 2006 2007 2008
Current Account: Balance
4c. Singapore
0
5
10
15
20
25
2000 2001 2002 2003 2004 2005 2006 2007 2008
Current Account: Balance
4d. Taipei,China
Source: IFS Database Figures 3b and 3c reveal that the S-I balance first increased and then narrowed over the last decade for both Korea and Singapore. In Korea, gross domestic investment overtook gross domestic saving, producing a negative current account balance in 2008 (see Figure 4b). In comparison, the S-I balance for Hong Kong, China and Taipei,China broadened between 2000 and 2008. In particular, Hong Kong, China’s S-I gap widened considerably from 4% to 14% of its GDP over this period. From the external perspective, the charts in Figure 4 show that the current account surplus in Hong Kong, China exhibited the most persistent climb over the last decade.
7
ADBI Working Paper 238 Chow
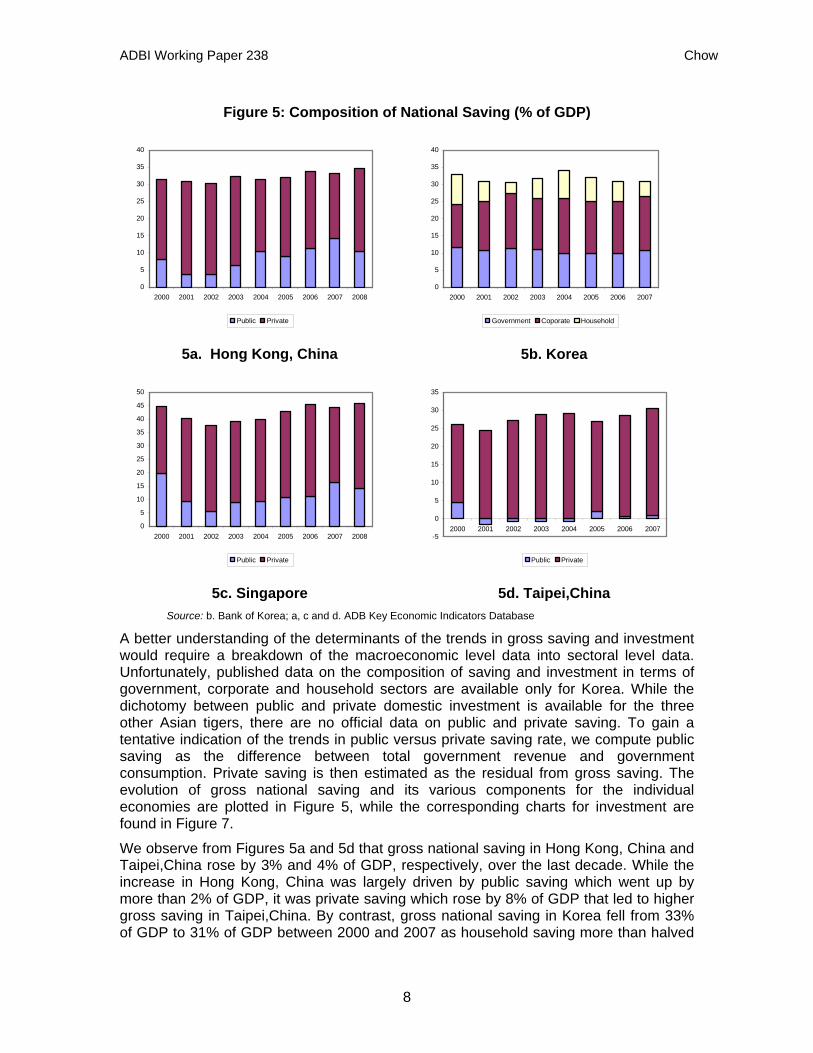
Figure 5: Composition of National Saving (% of GDP)
0
5
10
15
20
25
30
35
40
2000 2001 2002 2003 2004 2005 2006 2007 2008
Public Private
5a. Hong Kong, China
0
5
10
15
20
25
30
35
40
2000 2001 2002 2003 2004 2005 2006 2007
Government Coporate Household
5b. Korea
0
5
10
15
20
25
30
35
40
45
50
2000 2001 2002 2003 2004 2005 2006 2007 2008
Public Private
5c. Singapore
-5
0
5
10
15
20
25
30
35
2000 2001 2002 2003 2004 2005 2006 2007
Public Private
5d. Taipei,China
Source: b. Bank of Korea; a, c and d. ADB Key Economic Indicators Database A better understanding of the determinants of the trends in gross saving and investment would require a breakdown of the macroeconomic level data into sectoral level data. Unfortunately, published data on the composition of saving and investment in terms of government, corporate and household sectors are available only for Korea. While the dichotomy between public and private domestic investment is available for the three other Asian tigers, there are no official data on public and private saving. To gain a tentative indication of the trends in public versus private saving rate, we compute public saving as the difference between total government revenue and government consumption. Private saving is then estimated as the residual from gross saving. The evolution of gross national saving and its various components for the individual economies are plotted in Figure 5, while the corresponding charts for investment are found in Figure 7.
We observe from Figures 5a and 5d that gross national saving in Hong Kong, China and Taipei,China rose by 3% and 4% of GDP, respectively, over the last decade. While the increase in Hong Kong, China was largely driven by public saving which went up by more than 2% of GDP, it was private saving which rose by 8% of GDP that led to higher gross saving in Taipei,China. By contrast, gross national saving in Korea fell from 33% of GDP to 31% of GDP between 2000 and 2007 as household saving more than halved
8
ADBI Working Paper 238 Chow
from 9% to 4% (see Figure 5b). Government saving held steady at around 10% of GDP while corporate saving increased by 3% of GDP over the same period. As for Singapore, there was hardly any change in gross national saving between 2000 and 2008 (see Figure 5c). Public saving, which tended to be the driving force of the saving process in Singapore, fell by about 6%, but this was completely offset by an increase in private saving.
Figure 6: Corporate and Household Savings for Emerging Asia (% of GDP relative to 1997=0)
-10112
2334
2000 2001 2002 2003 2004 2005 2006 2007
Household Corporate
Source: IMF Regional Economic Outlook October 2009 Database A further disaggregation of private saving into household and corporate saving for Hong Kong, China; Singapore; and Taipei,China is hampered by data limitations. Nonetheless, IMF staff estimates of household and corporate savings as a % of GDP from 2000 to 2007 are available for a grouping called “Emerging Asia” which comprises the four Asian tigers and some other regional countries, namely India, Indonesia, Malaysia, the Philippines, Thailand, and Viet Nam (IMF, 2009b). These estimates are plotted in Figure 6, which shows that household saving climbed by over 3% of GDP while corporate saving rose by less than 1% of GDP between 2000 and 2008. The figure suggests that in the more recent period neither the corporate sector nor the household sector played a dominant role in determining private saving in emerging Asia. The same IMF study advocates the strengthening of corporate governance and the deepening of financial market development in the regional countries to induce a reduction in corporate savings as well as boost consumption, thereby fostering global rebalancing.
9
ADBI Working Paper 238 Chow
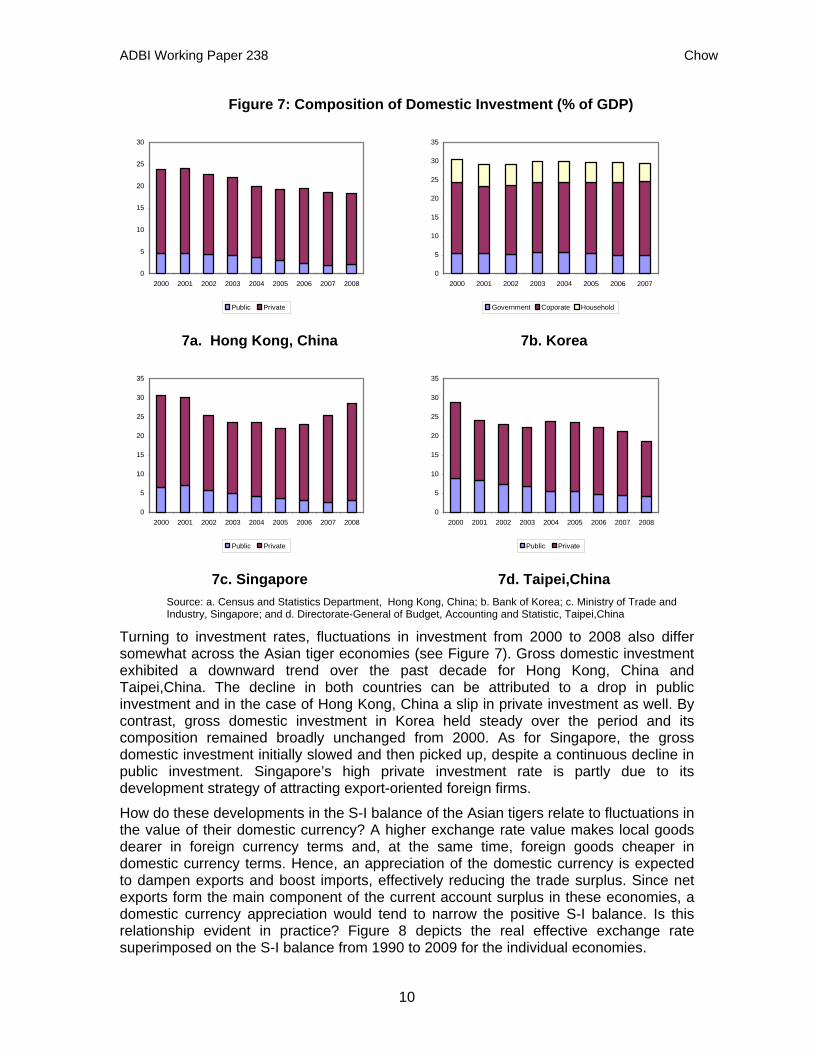
Figure 7: Composition of Domestic Investment (% of GDP)
0
5
10
15
20
25
30
2000 2001 2002 2003 2004 2005 2006 2007 2008
Public Private
7a. Hong Kong, China
0
5
10
15
20
25
30
35
2000 2001 2002 2003 2004 2005 2006 2007
Government Coporate Household
7b. Korea
0
5
10
15
20
25
30
35
2000 2001 2002 2003 2004 2005 2006 2007 2008
Public Private
7c. Singapore
0
5
10
15
20
25
30
35
2000 2001 2002 2003 2004 2005 2006 2007 2008
Public Private
7d. Taipei,China
Source: a. Census and Statistics Department, Hong Kong, China; b. Bank of Korea; c. Ministry of Trade and Industry, Singapore; and d. Directorate-General of Budget, Accounting and Statistic, Taipei,China
Turning to investment rates, fluctuations in investment from 2000 to 2008 also differ somewhat across the Asian tiger economies (see Figure 7). Gross domestic investment exhibited a downward trend over the past decade for Hong Kong, China and Taipei,China. The decline in both countries can be attributed to a drop in public investment and in the case of Hong Kong, China a slip in private investment as well. By contrast, gross domestic investment in Korea held steady over the period and its composition remained broadly unchanged from 2000. As for Singapore, the gross domestic investment initially slowed and then picked up, despite a continuous decline in public investment. Singapore’s high private investment rate is partly due to its development strategy of attracting export-oriented foreign firms.
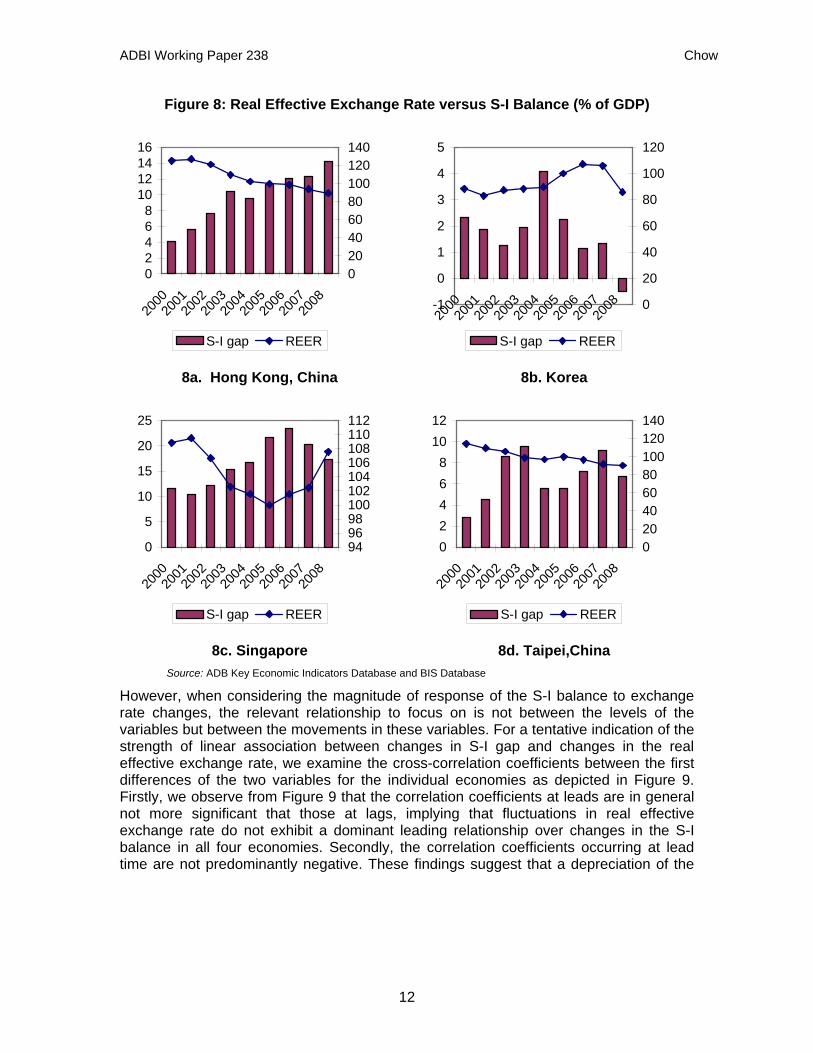
How do these developments in the S-I balance of the Asian tigers relate to fluctuations in the value of their domestic currency? A higher exchange rate value makes local goods dearer in foreign currency terms and, at the same time, foreign goods cheaper in domestic currency terms. Hence, an appreciation of the domestic currency is expected to dampen exports and boost imports, effectively reducing the trade surplus. Since net exports form the main component of the current account surplus in these economies, a domestic currency appreciation would tend to narrow the positive S-I balance. Is this relationship evident in practice? Figure 8 depicts the real effective exchange rate superimposed on the S-I balance from 1990 to 2009 for the individual economies.
10
ADBI Working Paper 238 Chow
A visual inspection of the charts suggests an apparent negative association between the level of real effective exchange rate and the magnitude of S-I balance. In general, a lower level of the real effective exchange rate tends to be associated with a higher level in the S-I balance. This negative relationship is particularly evident in the case of Hong Kong, China and Singapore, and is discernible for Korea. Figure 8a reveals a persistent decline in the Hong Kong, China dollar in real effective terms over the past decade. During this period, the S-I balance in Hong Kong, China rose steadily. The real effective exchange rate of the Singapore dollar initially fell reaching a trough in 2005 and then started to climb as shown in Figure 8c. Interestingly, the magnitude of the S-I balance in Singapore seems to mirror these movements in the exchange rate but with a lag. The strengthening of the Korean won in real effective terms picked up pace after 2004 accompanied by a lowering of the S-I balance in the recent period (see Figure 8b). Taipei,China is the only exception. We see from Figure 8d that the depreciation in its real effective exchange rate does not appear to have a consistent relationship with the level of the S-I balance.
11
ADBI Working Paper 238 Chow
Figure 8: Real Effective Exchange Rate versus S-I Balance (% of GDP)
02468
10121416
2000
2001
2002
2003
2004
2005
2006
2007
2008
020406080100120140
S-I gap REER
8a. Hong Kong, China
-1
0
1
2
3
4
5
2000
2001
2002
2003
2004
2005
2006
2007
2008 0
20
40
60
80
100
120
S-I gap REER
8b. Korea
0
5
10
15
20
25
2000
2001
2002
2003
2004
2005
2006
2007
2008
949698100102104106108110112
S-I gap REER
8c. Singapore
02468
1012
2000
2001
2002
2003
2004
2005
2006
2007
2008
020406080100120140
S-I gap REER
8d. Taipei,China Source: ADB Key Economic Indicators Database and BIS Database
However, when considering the magnitude of response of the S-I balance to exchange rate changes, the relevant relationship to focus on is not between the levels of the variables but between the movements in these variables. For a tentative indication of the strength of linear association between changes in S-I gap and changes in the real effective exchange rate, we examine the cross-correlation coefficients between the first differences of the two variables for the individual economies as depicted in Figure 9. Firstly, we observe from Figure 9 that the correlation coefficients at leads are in general not more significant that those at lags, implying that fluctuations in real effective exchange rate do not exhibit a dominant leading relationship over changes in the S-I balance in all four economies. Secondly, the correlation coefficients occurring at lead time are not predominantly negative. These findings suggest that a depreciation of the
12
ADBI Working Paper 238 Chow
real effective exchange rate in the Asian tigers may not necessarily be linked to an increment in the S-I balance in the short run.3
Figure 9: Cross-Correlations between Changes in Real Effective Exchange Rate and Changes in S-I Balance
-1.0
-0.8
-0.6
-0.4
-0.2
0.0
0.2
0.4
0.6
0.8
1.0
0 1 2 3 4
lead lag
9a. Hong Kong, China
-1.0
-0.8
-0.6
-0.4
-0.2
0.0
0.2
0.4
0.6
0.8
1.0
0 1 2 3 4
lead lag
9b. Korea
-1.0
-0.8
-0.6
-0.4
-0.2
0.0
0.2
0.4
0.6
0.8
1.0
0 1 2 3 4
lead lag
9c. Singapore
-1.0
-0.8
-0.6
-0.4
-0.2
0.0
0.2
0.4
0.6
0.8
1.0
0 1 2 3 4
lead lag
9d. Taipei,China
Source: Author’s calculations
3. INCREASING RELIANCE ON DOMESTIC DEMAND A key component of the trans-Pacific rebalancing strategy is the implementation of structural policies that increase domestic demand and the development of non-tradable sectors in the regional countries. However, as is well recognized, exports have all along played a central role in the growth and development of the Asian tiger economies. In this section, we consider the prospect of adopting a new growth model for the Asian tigers that leverages more on the domestic economy. To this end, we examine the expenditure structure for the characteristics of balance in each country’s growth.
3 We note that these cross-correlation coefficients are preliminary rough estimates as they are computed
over a small number of time periods.
13
ADBI Working Paper 238 Chow
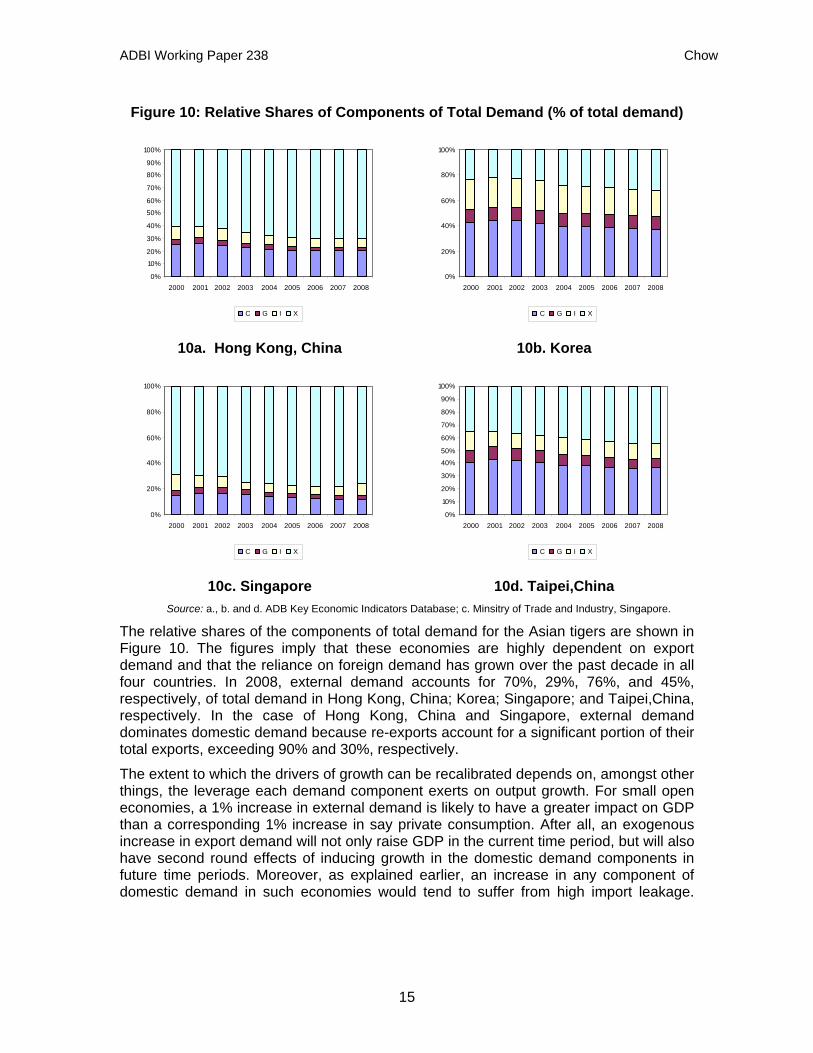
We note at the outset that the size of net exports does not indicate the importance of foreign demand relative to domestic demand in an economy, particularly when there is a high propensity to import. Each domestic expenditure category, namely private consumption (C), government consumption (G) and Investment (I)—which comprises fixed capital formation as well as the increase in stocks—has its own import content. These import components are not shown separately but are aggregated and included in total imports (M) which is in turn subtracted from total exports (X) to produce net exports. Therefore, when considering drivers of growth, a better measure of the significance of external demand is the magnitude of total exports (rather than net exports) relative to the levels of domestic demand components.
To gauge the relative importance of foreign demand, we rewrite the standard national income accounting identity:
GDP = C + G + I + X – M (1)
as C + G + I + X = GDP + M (2)
The left and right hand sides of equation (2) represent total demand and total supply in the economy, respectively. We see from equation (2) that an increase in any of the components of total demand could suffer from import leakage. An increase in C, G, I or X would not only lead to higher production in that country but also increase production elsewhere (as reflected by an increase in imports). While imports in themselves do not generate income in an economy, they are necessary to allow the country to export. Of course, imports are also critical for restoring external imbalances.
14
ADBI Working Paper 238 Chow
Figure 10: Relative Shares of Components of Total Demand (% of total demand)
0%
10%
20%
30%
40%
50%
60%
70%
80%
90%
100%
2000 2001 2002 2003 2004 2005 2006 2007 2008
C G I X
10a. Hong Kong, China
0%
20%
40%
60%
80%
100%
2000 2001 2002 2003 2004 2005 2006 2007 2008
C G I X
10b. Korea
0%
20%
40%
60%
80%
100%
2000 2001 2002 2003 2004 2005 2006 2007 2008
C G I X
10c. Singapore
0%
10%
20%
30%
40%
50%
60%
70%
80%
90%
100%
2000 2001 2002 2003 2004 2005 2006 2007 2008
C G I X
10d. Taipei,China
Source: a., b. and d. ADB Key Economic Indicators Database; c. Minsitry of Trade and Industry, Singapore.
The relative shares of the components of total demand for the Asian tigers are shown in Figure 10. The figures imply that these economies are highly dependent on export demand and that the reliance on foreign demand has grown over the past decade in all four countries. In 2008, external demand accounts for 70%, 29%, 76%, and 45%, respectively, of total demand in Hong Kong, China; Korea; Singapore; and Taipei,China, respectively. In the case of Hong Kong, China and Singapore, external demand dominates domestic demand because re-exports account for a significant portion of their total exports, exceeding 90% and 30%, respectively.
The extent to which the drivers of growth can be recalibrated depends on, amongst other things, the leverage each demand component exerts on output growth. For small open economies, a 1% increase in external demand is likely to have a greater impact on GDP than a corresponding 1% increase in say private consumption. After all, an exogenous increase in export demand will not only raise GDP in the current time period, but will also have second round effects of inducing growth in the domestic demand components in future time periods. Moreover, as explained earlier, an increase in any component of domestic demand in such economies would tend to suffer from high import leakage.
15
ADBI Working Paper 238 Chow
Osada (1998) provides estimates of the marginal propensity to import for Hong Kong, China; Korea; Singapore; and Taipei,China of 3.1, 0.4, 1.5, and 0.6, respectively.4
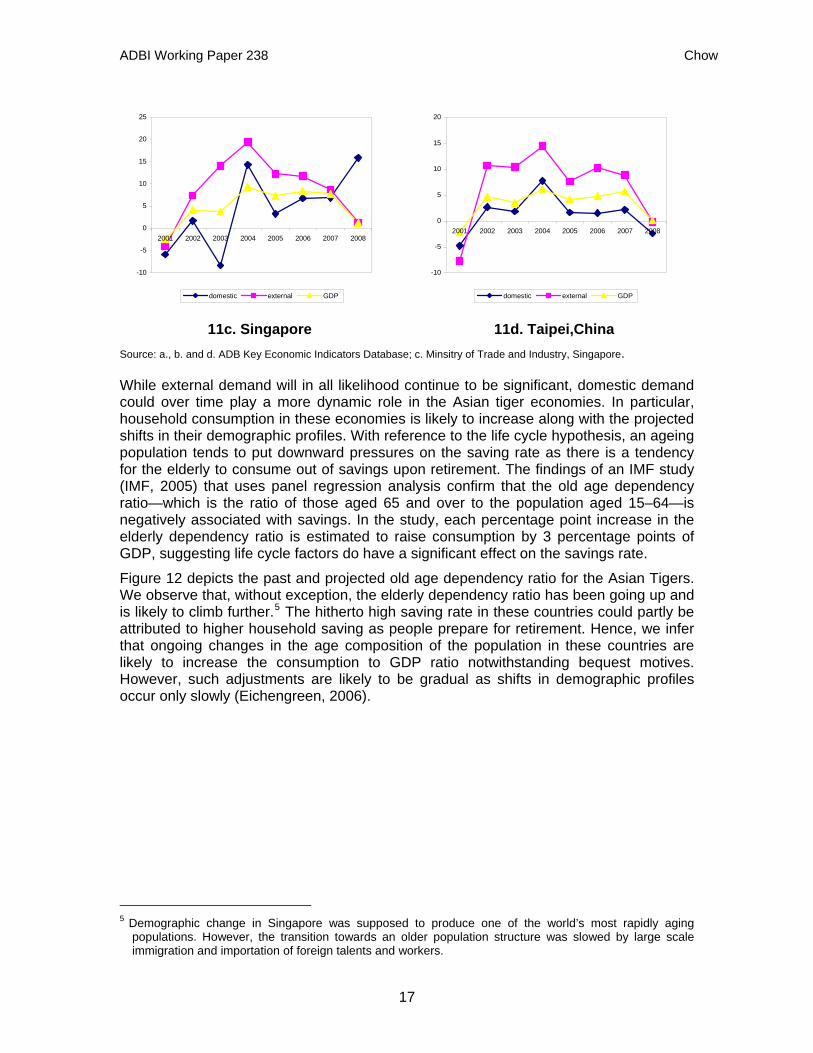
Figure 11 depicts the annual % change of total demand and its components. We observe from this figure that, with the exception of Korea, fluctuations in GDP growth are closely associated with changes in external demand rather than changes in domestic demand. For instance, the dip in domestic demand growth in Hong Kong, China in 2005 did not make a significant dent on its GDP growth in that year (see Figure 11a). Similarly, it is clear from Figure 11c that the upsurge in domestic demand in 2008 in Singapore—that is largely due to a jump in government consumption—did not seem to have any discernible effect on its GDP growth in that year. In sharp contrast, Figure 11b reveals that movements in GDP growth in Korea do not closely follow the fluctuations in external demand but are significantly influenced by developments in domestic demand. As for Taipei,China, there is insufficient deviation in the pattern of fluctuations between domestic demand and external demand, so that we are unable to distinguish which is dominating GDP growth
These findings are not in the least surprising when we consider the population size of the two city states Hong Kong, China and Singapore, which are only 7 million and 4.8 million in 2008, respectively. In other words, added to the problem of high import leakage, domestic demand in both these economies lacks the scale to drive output growth. These observations seem to attest to the fact that a domestic-led growth model is clearly unsuited for ultra small open economies like Hong Kong, China and Singapore. In comparison, the population size in 2008 of Korea and Taipei,China is 48.6 million and 23 million, respectively. Hence, there appears to be more room for policy maneuvering with regard to increasing reliance on domestic demand in the two larger economies of Korea and Taipei,China.
Figure 11: Changes in Domestic and External Demand and Real GDP growth (%)
-4
-2
0
2
4
6
8
10
12
14
16
18
2001 2002 2003 2004 2005 2006 2007 2008
domestic external GDP
11a. Hong Kong, China
-5
0
5
10
15
20
25
2001 2002 2003 2004 2005 2006 2007 2008
domestic external GDP
11b. Korea
4 The marginal propensity to import exceeds unity for Hong Kong, China and Singapore due to the high
proportion of re-exports. The propensity to import goods for domestic production or consumption in Singapore is estimated to be around 0.8 (Peebles and Wilson, 2002), while the propensity to import in Hong Kong, China calculated from retained imports using more recent data is approximately 0.5.
16
ADBI Working Paper 238 Chow
-10
-5
0
5
10
15
20
25
2001 2002 2003 2004 2005 2006 2007 2008
domestic external GDP
11c. Singapore
-10
-5
0
5
10
15
20
2001 2002 2003 2004 2005 2006 2007 2008
domestic external GDP
11d. Taipei,China
Source: a., b. and d. ADB Key Economic Indicators Database; c. Minsitry of Trade and Industry, Singapore.
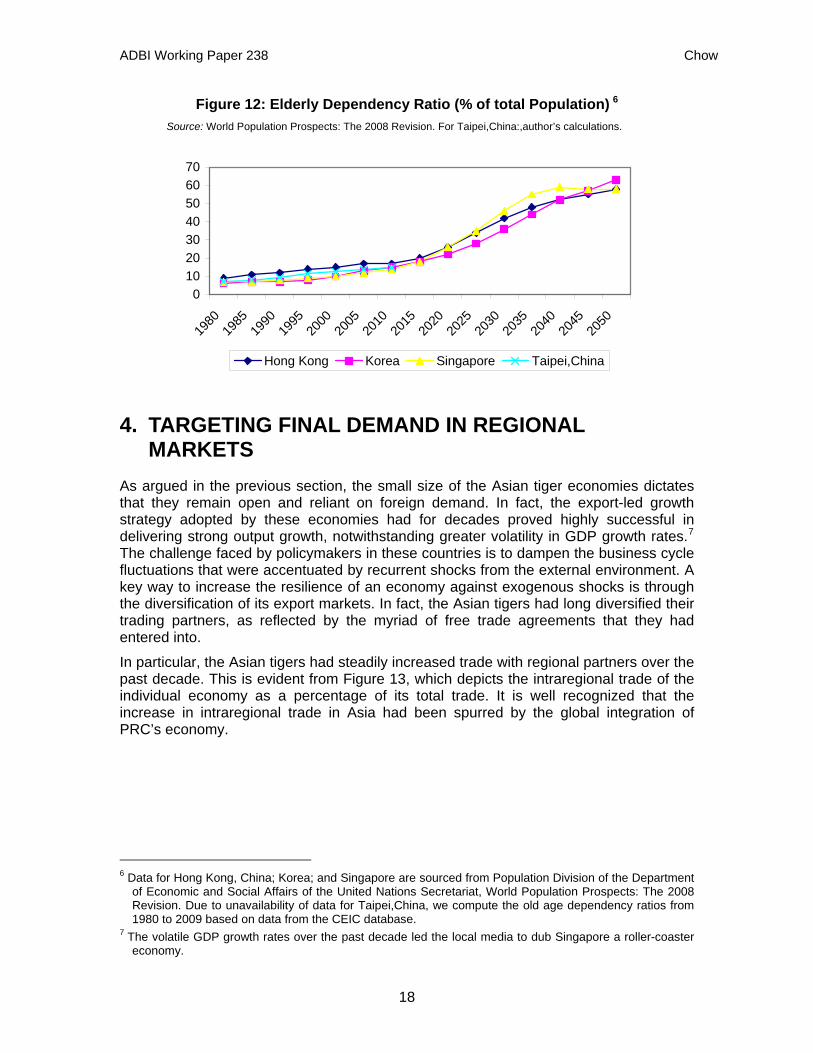
While external demand will in all likelihood continue to be significant, domestic demand could over time play a more dynamic role in the Asian tiger economies. In particular, household consumption in these economies is likely to increase along with the projected shifts in their demographic profiles. With reference to the life cycle hypothesis, an ageing population tends to put downward pressures on the saving rate as there is a tendency for the elderly to consume out of savings upon retirement. The findings of an IMF study (IMF, 2005) that uses panel regression analysis confirm that the old age dependency ratio—which is the ratio of those aged 65 and over to the population aged 15–64—is negatively associated with savings. In the study, each percentage point increase in the elderly dependency ratio is estimated to raise consumption by 3 percentage points of GDP, suggesting life cycle factors do have a significant effect on the savings rate.
Figure 12 depicts the past and projected old age dependency ratio for the Asian Tigers. We observe that, without exception, the elderly dependency ratio has been going up and is likely to climb further.5 The hitherto high saving rate in these countries could partly be attributed to higher household saving as people prepare for retirement. Hence, we infer that ongoing changes in the age composition of the population in these countries are likely to increase the consumption to GDP ratio notwithstanding bequest motives. However, such adjustments are likely to be gradual as shifts in demographic profiles occur only slowly (Eichengreen, 2006).
5 Demographic change in Singapore was supposed to produce one of the world’s most rapidly aging
populations. However, the transition towards an older population structure was slowed by large scale immigration and importation of foreign talents and workers.
17
ADBI Working Paper 238 Chow
Figure 12: Elderly Dependency Ratio (% of total Population) 6 Source: World Population Prospects: The 2008 Revision. For Taipei,China:,author’s calculations.
010203040506070
1980
1985
1990
1995
2000
2005
2010
2015
2020
2025
2030
2035
2040
2045
2050
Hong Kong Korea Singapore Taipei,China
4. TARGETING FINAL DEMAND IN REGIONAL MARKETS
As argued in the previous section, the small size of the Asian tiger economies dictates that they remain open and reliant on foreign demand. In fact, the export-led growth strategy adopted by these economies had for decades proved highly successful in delivering strong output growth, notwithstanding greater volatility in GDP growth rates.7 The challenge faced by policymakers in these countries is to dampen the business cycle fluctuations that were accentuated by recurrent shocks from the external environment. A key way to increase the resilience of an economy against exogenous shocks is through the diversification of its export markets. In fact, the Asian tigers had long diversified their trading partners, as reflected by the myriad of free trade agreements that they had entered into.
In particular, the Asian tigers had steadily increased trade with regional partners over the past decade. This is evident from Figure 13, which depicts the intraregional trade of the individual economy as a percentage of its total trade. It is well recognized that the increase in intraregional trade in Asia had been spurred by the global integration of PRC’s economy.
6 Data for Hong Kong, China; Korea; and Singapore are sourced from Population Division of the Department
of Economic and Social Affairs of the United Nations Secretariat, World Population Prospects: The 2008 Revision. Due to unavailability of data for Taipei,China, we compute the old age dependency ratios from 1980 to 2009 based on data from the CEIC database.
7 The volatile GDP growth rates over the past decade led the local media to dub Singapore a roller-coaster economy.
18
ADBI Working Paper 238 Chow
Figure 13: Intraregional Trade (as % of Total Trade)
0
10
20
30
40
50
60
70
2000 2001 2002 2003 2004 2005 2006 2007 2008
% o
f tot
al tr
ade
Hong Kong Korea Singapore Taipei,China
Source: Asian Development Outlook (2009) Update
Table 1 shows, for each Asian tiger, the six most important trading partners based on bilateral exports trade data as well as the share of total exports they each account for in 1990 and 2008. We observe from the table that, without exception, the regional economies, particularly PRC, gained importance as trading partners of the Asian tigers.
19
ADBI Working Paper 238 Chow
Table 1: Key Export Markets of Individual Economies 1990 2008
% %
Hong Kong, China PRC 25 PRC 51
United States 24 United States 11
Germany 6 Japan 4
Japan 6 Germany 3
United Kingdom 4 United Kingdom 2
Singapore 3 Singapore 2
Korea United States 29 PRC 25
Japan 19 United States 11
Hong Kong, China 6 Japan 6
Germany 4 Singapore 4
Singapore 3 Hong Kong, China 4
United Kingdom 3 Germany 3
Singapore United States 21 Malaysia 13
Malaysia 13 Indonesia 11
Japan 9 Hong Kong, China 11
Thailand 7 PRC 9
Hong Kong, China 6 United States 7
Australia 2 Japan 4
Taipei,China United States 32 Hong Kong, China 13
Hong Kong, China 13 United States 12
Japan 12 Japan 7
Germany 5 Singapore 5
Singapore 3 Korea 3
United Kingdom 3 Germany 2
Source: ADB Key Economic Indicators Database
However, the rise in intraregional trade can in large part be attributed to the growing intensity in vertical intra-industry trade in Asia. The Asian tigers are well integrated in the regional production networks which had been strengthened by the emergence of PRC as a manufacturing powerhouse. Specifically, these economies supply high value intermediate components to PRC for further processing and final assembly. The export profiles of Korea; Singapore; and Taipei,China are similar—their export baskets weigh heavily on electronics components such as semiconductors and printed circuit boards bound for PRC, the information technology assembly hub. In other words, trade flows with the regional countries is dominated by trade in parts and components rather than trade in final products.
20
ADBI Working Paper 238 Chow
Due to the emergence of production networks, trade statistics no longer accurately reflect the dependence of Asian countries on extra-regional demand. Pula and Peltonen (2009) used an updated Asian input-output table to show that Asia has not decoupled from the rest of the world.8 In fact, a study by ADB (2007) estimated that approximately only a third of the final demand composition of Asia’s exports in 2006 can be accounted for by the region. Hence, it is not surprising that the recent collapse in demand of the end markets was transmitted to these countries involved in the different stages of the production process, resulting in the synchronized fall in trade. Not unlike the other Asian economies, the Asian tigers are still heavily dependent on the US and Euro area markets in terms of final demand. Consequently, the economic prospect of the Asian tigers remains coupled to the upswings and downturns in the developed markets.
To reduce the vulnerability of export growth to demand shocks from the extra-regional markets, the Asian tigers need to gear their trade structure in terms of trade in final goods away from excessive dependence on the US and Euro zone markets towards regional markets. The aim would be to have intraregional trade based on trade in final products as an additional source of demand and growth for these economies. This means that intraregional trade should also be driven by consumption rather than by production alone. In this regard, the level of private consumption in Asia is likely to increase in view of rising affluence and standards of living in the fast growing regional economies. In particular, PRC offers some potential as a strong source of independent demand in view of the emergence of its large middle class with growing purchasing power.
8 The same study found that Asia’s exports only account for approximately one-third of its GDP, far below
the 50% dependence indicated by trade data. The exaggerated export dependence is due to the higher import content of exports that resulted from greater segmentation of the production process across the region.
21
ADBI Working Paper 238 Chow
Figure 14: Composition of China’s Trade Balance with Individual Economies in 1996, 2007 and 2008 ($ billion)
0
20
40
60
80
100
120
140
1996 2007 2008
Part s & component s Final goods
14a. Hong Kong, China
-35
-30
-25
-20
-15
-10
-5
01996 2007 2008
Part s & component s Final goods
14b. Korea
-2
0
2
4
6
8
10
12
14
16
1996 2007 2008
Part s & component s Final goods
14c. Singapore
-50
-45
-40
-35
-30
-25
-20
-15
-10
-5
01996 2007 2008
Part s & component s Final goods
14d. Taipei,China
Source: Asian Development Outlook 2009 Update
A recent ADB study (ADB, 2009) provides evidence that domestic demand in PRC is already starting to play a more prominent role in supporting exports from the Asian tigers. Figure 14 shows the composition of trade balance evolving over time between PRC and the individual economies. In the study total trade balance is decomposed into four major categories namely: basic products; construction materials; parts and components; and final goods. Since the figures for the first two categories are relatively small for the countries under consideration, we focus only on the last two categories in our analysis.
Figure 14a reveals that PRC has been running current account surpluses with Hong Kong, China. This is not surprising given Hong Kong, China’s role as a major transshipment centre for PRC’s exports. Although PRC also runs a trade surplus in final goods with Singapore, the magnitude is much smaller than the level of trade balance with the other three countries (see Figure 14c). By contrast, we see from Figures 14b and 14d that PRC has been running current account deficits with Korea and Taipei,China. Moreover, final goods are accounting for a growing share of PRC’s trade deficit with these two countries over time. The magnitude of these deficits are significantly higher for Taipei,China, reflecting its cross-strait trade integration with PRC. Considering the probable shifts in PRC towards a bigger consumption basket that is
22
ADBI Working Paper 238 Chow
typical in a rapidly growing economy, trade in final goods would likely play a more important role in driving the increase in trade between PRC and the Asian tigers going forward.
5. POLICY ISSUES PERTAINING TO REBALANCING This section identifies policy options the Asian tigers need to adopt to realize the process of rebalancing their economies. It is important to note at the outset that boosting domestic demand through structural reforms in these economies would not necessarily require abandoning the export-led growth strategy or turning back from economic openness. Rather, it is a policy imperative for the Asian tigers to remain open to trade and capital flows for the following reasons: Firstly, exports and output often mutually reinforce each other. For instance, exports are known to enhance long-run growth potential by accelerating the process of human capital accumulation which in turn fosters growth (see Chuang, 1998). Secondly, with reference to endogenous growth models, imports also tend to have a positive impact on labor productivity. It is well recognized that imports act as an important channel for foreign technology and knowledge (Grossman and Helpman, 1991). Thirdly, retaining a degree of openness would encourage foreign direct investment inflows that contribute to domestic economic growth through channels such as the injection of greater competitive forces, the introduction of managerial innovations, and the restructuring of underperforming firms.9
Notwithstanding the need to remain integrated with the world economy, it is in the interest of the Asian tigers to increase their resilience against a possibly protracted period of subdued global demand conditions. After all, the unwinding of the huge global imbalances will likely require a prolonged period of adjustment to the global structure of supply and demand. The resolution of the imbalances does not imply the Asian tigers should all attempt to achieve balanced current accounts. Rather, what is required are policies that facilitate a more balanced structure of demand and growth within the economies. Given the mismatch between what the Asian tigers produce and what they consume, such rebalancing will require major adjustments to their underlying economic structure. The rebalancing of growth towards domestic demand will thus be a complex structural process that is not only difficult but also time consuming (Adams and Park, 2009). Nevertheless, there is scope for policy adjustments in the Asian tigers in view of their strong economic fundamentals, fiscal latitude and sound financial systems.
Furthermore, as pointed out by Li (2002), the erstwhile largely complementary economic relationship between the Asian tigers and PRC—in the form of the former supplying capital while the latter providing cheap labour—is likely to evolve into a more competitive relationship in the future as PRC moves up the value chain and progresses to higher value-added industries. This suggests the Asian tigers would also need to identify new areas of comparative advantage as well as seek out new areas of complementarities, especially those that would help them reduce their reliance on extra-regional demand.
As the income level in PRC rises, there is a growing culture of consumerism with shifts in spending patterns leading to higher consumption of luxury goods and services. For instance, strong demand from PRC has been driving the recent recovery in the retail of branded watches and jewelry, while tourist arrivals in the Asian tigers from PRC have been growing rapidly (He et al. 2007). In fact, this shift towards consumption whereby 9 See OECD (2002) for a literature review of empirical studies that show the positive impact of foreign direct
investment on economic growth.
23
ADBI Working Paper 238 Chow
goods and services that had previously been regarded as luxuries are now viewed as necessities is also evident amongst the young urban generation in many traditionally thrifty societies in the region. The Asian tigers should continue to position themselves to capitalize on such ongoing increases in intra-regional demand by re-orientating their economic structures in such a way that taps into the changing spending patterns of prospering Asian countries.
In this regard, the Asian tigers could maintain their dynamic and niche-based competitiveness by focusing on services exports particularly through building up ancillary capabilities. Services sector productivity in Hong Kong, China; Korea; Singapore; and Taipei,China stand at approximately 84, 27, 58 and 53, respectively, on a scale of 1 to 100, where 100 represents the productivity level in the US services sector. This suggests there is ample room for further developing the services industry and there is a need to eradicate existing policy distortions that favor the manufacturing industry.
Regulatory reforms in the services sector of the Asian tigers would not only boost productivity in this sector but also generate large gains in overall economic growth. Policy initiatives such as funding the upgrading of workers’ skills and expertise would result in a more knowledgeable and experienced workforce that would enhance the quality of services. Moreover, policies that induce firms to innovate their work processes and incorporate the use of technology would lead to the improvement of work practices. Business investments targeting higher valued-added exportable services industries such as financial services, medical tourism, and tertiary education should also be encouraged, perhaps by offering tax breaks and incentives for regional expansion.
Apart from tradable services, service sector companies in the Asian tigers that provide lower-value home-grown services such as retail; food and beverages; and personal grooming should also be granted greater tax incentives and a reduction in start-up costs. These industries are important for the stimulation of local consumption as they generate employment and income for the majority of the unskilled population. It follows that the long held bias in favour of the production of tradables over non-tradables in these economies has to be reduced to bring about an increase in domestic consumer demand.10
Meanwhile, demand side policies for reducing the mismatch between output and demand structures should aim to narrow the income gap or at least arrest any further worsening of the income distribution.11 In particular, wage levels at the lower end of the income scale should be raised to alleviate the financial insecurity felt by local residents. Of course, this should be matched by an increase in their productivity such as through retraining efforts. For instance, in the case of Singapore, the authorities have begun to slow the upsurge of low skilled migrant workers as their hitherto easy availability removes the incentives for companies to upgrade and places downward pressure on wages of the lower skilled domestic workforce.
A rise in household consumption brought about by a reduction in precautionary saving could also be induced through further development of the financial markets in Asian tiger economies. For instance, a wider array of financial products could be offered to provide investment opportunities that give better rates of return. The provision of high yielding 10 However, we are not advocating that the Asian tigers adopt a new growth model whereby domestic
demand consistently grows faster than output, as this would in the long term lead to unsustainably large trade deficits.
11 According to a study by IMF (2006b), the Gini coefficient for Hong Kong, China; Korea; Singapore; and Taipei,China climbed 51.4, 33.1, 48.1, and 33.9 points, respectively, from 1995 to 2005.
24
ADBI Working Paper 238 Chow
saving vehicles would help raise household incomes. Moreover, the introduction of annuity products, health insurance schemes, and education financial assistance programs would help ease the requisite level of saving for retirement, medical, and education purposes. Nevertheless, we note that in response to financial sector reforms in the aftermath of the Asian crisis, consumer credit expanded very rapidly—particularly in Korea and to a lesser extend in Taipei,China—leading to a jump in household delinquencies and nonperforming loans (IMF, 2006a). Hence, it is vital for the supervisory authorities to keep pace with new developments in the financial markets and impose regulatory curbs on excessive consumer lending to ensure financial stability.
The aforementioned policy recommendations apply in general to all the Asian tigers. However, those targeted at boosting domestic demand should be implemented to a greater extent in Korea and Taipei,China. As noted in the earlier section, these larger economies have more scope than the small economies of Hong Kong, China and Singapore to increase their reliance on domestic demand. We now turn our attention to Taipei,China.
The Taipei,China economy, which grew at a rapid 9.2% year-on-year in the fourth quarter of 2009, has not only returned to pre-crisis growth levels but also outperformed the other three Asian tigers, whose corresponding growth figures are 2.6%, 6%, and 3.5% for Hong Kong, China; Korea’ and Singapore, respectively.12 Interestingly, PRC featured prominently in the rapid recovery of Taipei,China, even as exports of final goods to PRC increased from 17.8% of total exports at the start of 2009 to 29.2% in January 2010. As shown in Figure 14d in the previous section, exports for final consumption in PRC have been accounting for a growing share of PRC’s trade deficit with Taipei,China over time. This reflects the increased penetration of Taipei,China’s goods in PRC’s markets. Indeed, economic linkages between these two countries have proliferated since the 1990s. 13 However, official figures tend to underestimate trade and investment flows between them due to various cross-border restrictions and political reasons. Taipei,China’s trade with and investment in mainland PRC have all along been partly intermediated through third parties such as Hong Kong, China; Japan; and Singapore. For that matter, Hong Kong, China also serves as a key intermediary to the rest of the world for PRC’s external trade via re-exports and offshore trade, as well as for raising international capital in the form of foreign direct investment, equity and bond financing and syndicated loans to finance PRC’s economic boom.
Cheung et al. (2003) assessed the degree of real and financial integration between Taipei,China and mainland PRC (as well as Hong Kong, China) by testing for real interest rate parity, uncovered interest rate parity, and real purchasing power parity. The authors found that these three parity conditions do hold over the long term, thereby providing empirical evidence of real and financial capital mobility as well as goods market integration between the Taipei,China and PRC, notwithstanding the presence of various forms trade barriers and capital controls. As these impediments continue to be lifted, Taipei,China will gain economically through further integrating its economy with PRC. Wang (2003) used a computable general equilibrium model to show the positive effects of a free trade area in the “Greater China” region, comprising mainland PRC, Hong Kong, China and Taipei,China. Furthermore, Zhang and Sato (2007) found increasing structural symmetry amongst these three economies that raises the potential
12 All the year-on-year growth rate figures are flattered by a low base effect. 13 See Zhang et al. (2003) for a discussion of these linkages from a dynamic economic and political
perspective.
25
ADBI Working Paper 238 Chow
of the region to become a candidate for monetary union. Taipei,China is likely to continue intensifying its economic integration with mainland PRC which will concomitantly reduce its dependence on extra-regional markets, consequently aiding in global rebalancing.
In a similar vein, a way forward to advance trans-Pacific rebalancing is to establish a common market within the region over the long term as this will raise intra-Asian demand and investment (Kawai, 2009). Combining markets in the region could prove an effective strategy given the Asian economies, with few exceptions, do not individually have the scale to transit from externally-driven to internally-driven growth. The market enlargement would also induce growth through greater competition amongst firms that will lead to productivity gains, and through efficiency gains for the consumers (both final and intermediate) by an increase in the range of product choice. Drawing on the European experience with the 1992 European Single Market Programme, measures that would need to taken include the adoption of a trade liberalization programme;14 lowering barriers to cross border public procurement; enforcement of competition policy in all sectors; and eliminating hindrances to free movement of labor, capital and services across member countries. Clearly, many hurdles to embarking on these initiatives such as historical legacy issues, territorial disputes, structural and institutional heterogeneity and economic diversity exist. Nonetheless, the probable muted recovery in the advanced industrialized countries might just provide the necessary impetus to overcome the political, economic and institutional challenges and accelerate efforts to establish a common market within Asia.
6. CONCLUSION In summary, overall gross national saving in the Asian tiger economies remained higher than overall gross investment and the S-I balance for the grouping widened only slightly over the past decade. As for the individual countries, the S-I gap in Hong Kong, China and Taipei,China widened steadily. While the increase in gross saving in Hong Kong, China was driven by the public sector, it was private saving that boosted gross saving for Taipei,China. Public investment slipped in both countries and private investment fell in Hong Kong, China as well. Meanwhile, the increase in S-I balance for Korea and Singapore reversed somewhat from 2006, with a pickup in gross investment. When the trend in the real effective exchange rate is superimposed on the S-I balance, a negative association is discernible between the levels of the two variables. However, cross-correlation coefficients suggest a depreciation in the real effective exchange rate in the Asian tigers may not necessarily be linked to a future increment in the S-I balance in the short run.
Although a key component of the rebalancing strategy is the implementation of structural policies that reduce the reliance on external demand, a new growth model that leverages more on the domestic economy is not suited for the small open economies of Hong Kong, China and Singapore. The high propensity to import in these countries limits the leverage that domestic demand components have on output growth and thereby, reduces the scope for them to become drivers of growth. In other words, the small size of these economies dictates that they remain open and reliant on foreign demand. Nonetheless, the authorities of the Asian tigers, particularly the larger economies of
14 At the current juncture, China, Japan and Korea have each arranged FTA agreements with the whole of ASEAN; the proposal here is to merge these bilateral FTAs into a region-wide FTA.
26
ADBI Working Paper 238 Chow
Korea and Taipei,China, should use domestic polices such as those aimed at raising the productivity and wages of workers in the services industry as well as the introduction of financial products that alleviate the need for precautionary saving to boost domestic consumer demand.
Nevertheless, it is crucial for all the Asian tiger economies to retain their openness and international orientation. Trans-Pacific rebalancing could also be fostered by gearing the trade structure of the Asian tigers in terms of trade in final goods towards regional markets. The rising affluence and living standards in the fast growing regional economies such as PRC offer potential as a strong source of independent end demand from within the region. In fact, the economic integration of “Greater China” economies of PRC; Hong Kong, China; and Taipei,China is already taking place and is likely to intensify. Indeed, the Asian countries should make greater efforts to advance the establishment of a common market to position themselves well to benefit from the growing consumer and service demand in its own prospering region.
Acknowledgement I would like to thank Weiwen Ng for excellent research assistance.
27
ADBI Working Paper 238 Chow
REFERENCES Adams, C. and D. Park. 2009. Causes and Consequences of Global Imbalances:
Perspectives from a Developing Asia. In Asian Development Review, vol. 26, no. 1, pp. 19-47.
ADB. 2007. Uncoupling Asia: Myth and Reality. In Asian Development Outlook 2007. Asian Development Bank, Manila.
ADB. 2009. Broadening Openness for a Resilient Asia. In Asian Development Outlook 2009 Update. Asian Development Bank, Manila
Cheung, Y.-W., M.D. Chinn, and E. Fujii. 2003. China, Hong Kong, and Taiwan: A Quantitative Assessment of Real and Financial Integration. China Economic Review 14, 281– 303.
Chuang, Y.-c. 1998. Learning by Doing, the Technology Gap, and Growth. International Economic Review, 39, 697-721.
Eichengreen, B. 2006. Global Imbalances: The Blind Men and the Elephant. Issues in Economic Policy 1. The Brookings Institution, Washington, DC.
Grossman, G.M. and E. Helpman. 1991. Innovation and Growth in the Global Economy. MIT Press, Cambridge, MA.
He, D., L. Cheung, & J. Chang. 2007. Sense and Nonsense on Asia's Export Dependency and the Decoupling Thesis. Hong Kong Monetary Authority Working Paper 03/2007.
IMF. 2005. Global Imbalances: A Saving and Investment Perspective. In World Economic Outlook: September 2005. International Monetary Fund, Washington, DC.
IMF. 2006a. The Consumer Finance Boom: Is it a Problem. In Asia and Pacific Regional Economic Outlook: May 2006. International Monetary Fund, Washington, DC.
IMF. 2006b. Rising Inequality and Polarization in Asia. In Asia and Pacific Regional Economic Outlook: September 2006. International Monetary Fund, Washington, DC.
IMF. 2009a. Asia’s Recovery in the Global Context. In Asia and Pacific Regional Economic Outlook: October 2009. International Monetary Fund, Washington, DC.
IMF. 2009b. Corporate Savings and Rebalancing in Asia. In Asia and Pacific Regional Economic Outlook: October 2009. International Monetary Fund, Washington, DC.
IMF. 2010. World Economic Outlook (Update). International Monetary Fund, Washington, DC.
Kawai, M. 2009. The Global Financial Crisis and Asia’s Rebalancing Agenda. Presented in the Plenary Session on Asia After the Global Financial and Economic Crisis. Singapore Economic Review Conference, August 2009, Singapore.
Loayza N., K. Schmidt-Hebbel, and L. Serven 2000. Saving in Developing Countires: An Overview. World Bank Economic Review 14(3): 393-414.
28
ADBI Working Paper 238 Chow
OECD 2002. Foreign Direct Investment for Development: Maximising Benefits, Minimising Costs. Paris.
Osada, H. 1998. Deepening Economic Interdependence in the APEC Region-Boom and Vulnerability through Trade Linkages. In Keiji Omura ed. The Deepening Economic Interdependence in the Pacific Region. Institute of Developing Economies, Tokyo.
Pula, G., and T.A. Peltonen. 2009. Has Emerging Asia Decoupled? An Analysis of Production and Trade Linkages using the International Input-Output Table. European Central Bank Working Paper Series No. 993.
Peebles G. and Wilson P. 2002. Economic Growth and Development in Singapore: Past and Future. UK: Edward Elgar.
Wang, Z. 2003. WTO Accession, the “Greater China” Free-trade Area, and Economic Integration Across the Taiwan Strait. China Economic Review, 14(3), 316-349.
Zhang, Z., and K. Sato. 2007. Whither A Currency Union in Greater China? Open Economies Review, 19, 355–370.
Zhang, Z., X. Xu and W.B. Zhang. 2003. The dynamics of political and economic interactions between Mainland China and Taiwan. Papers in Regional Science, 82, 373–388.