econstor www.econstor.eu Der Open-Access-Publikationsserver der ZBW – Leibniz-Informationszentrum Wirtschaft The Open Access Publication Server of the ZBW – Leibniz Information Centre for Economics Standard-Nutzungsbedingungen: Die Dokumente auf EconStor dürfen zu eigenen wissenschaftlichen Zwecken und zum Privatgebrauch gespeichert und kopiert werden. Sie dürfen die Dokumente nicht für öffentliche oder kommerzielle Zwecke vervielfältigen, öffentlich ausstellen, öffentlich zugänglich machen, vertreiben oder anderweitig nutzen. Sofern die Verfasser die Dokumente unter Open-Content-Lizenzen (insbesondere CC-Lizenzen) zur Verfügung gestellt haben sollten, gelten abweichend von diesen Nutzungsbedingungen die in der dort genannten Lizenz gewährten Nutzungsrechte. Terms of use: Documents in EconStor may be saved and copied for your personal and scholarly purposes. You are not to copy documents for public or commercial purposes, to exhibit the documents publicly, to make them publicly available on the internet, or to distribute or otherwise use the documents in public. If the documents have been made available under an Open Content Licence (especially Creative Commons Licences), you may exercise further usage rights as specified in the indicated licence. zbw Leibniz-Informationszentrum Wirtschaft Leibniz Information Centre for Economics Krüger, Jens Working Paper The Role of International Trade in Employment Growth in Micro- and Small Enterprises: Evidence from Developing Asia ADB Working Paper Series on Regional Economic Integration, No. 115 Provided in Cooperation with: Asian Development Bank (ADB), Manila Suggested Citation: Krüger, Jens (2013) : The Role of International Trade in Employment Growth in Micro- and Small Enterprises: Evidence from Developing Asia, ADB Working Paper Series on Regional Economic Integration, No. 115, http://hdl.handle.net/11540/2307 This Version is available at: http://hdl.handle.net/10419/109614
Transcript
econstor www.econstor.eu
Der Open-Access-Publikationsserver der ZBW – Leibniz-Informationszentrum WirtschaftThe Open Access Publication Server of the ZBW – Leibniz Information Centre for Economics
Standard-Nutzungsbedingungen:
Die Dokumente auf EconStor dürfen zu eigenen wissenschaftlichenZwecken und zum Privatgebrauch gespeichert und kopiert werden.
Sie dürfen die Dokumente nicht für öffentliche oder kommerzielleZwecke vervielfältigen, öffentlich ausstellen, öffentlich zugänglichmachen, vertreiben oder anderweitig nutzen.
Sofern die Verfasser die Dokumente unter Open-Content-Lizenzen(insbesondere CC-Lizenzen) zur Verfügung gestellt haben sollten,gelten abweichend von diesen Nutzungsbedingungen die in der dortgenannten Lizenz gewährten Nutzungsrechte.
Terms of use:
Documents in EconStor may be saved and copied for yourpersonal and scholarly purposes.
You are not to copy documents for public or commercialpurposes, to exhibit the documents publicly, to make thempublicly available on the internet, or to distribute or otherwiseuse the documents in public.
If the documents have been made available under an OpenContent Licence (especially Creative Commons Licences), youmay exercise further usage rights as specified in the indicatedlicence.
zbw Leibniz-Informationszentrum WirtschaftLeibniz Information Centre for Economics
Krüger, Jens
Working Paper
The Role of International Trade in EmploymentGrowth in Micro- and Small Enterprises: Evidencefrom Developing Asia
ADB Working Paper Series on Regional Economic Integration, No. 115
Provided in Cooperation with:Asian Development Bank (ADB), Manila
Suggested Citation: Krüger, Jens (2013) : The Role of International Trade in EmploymentGrowth in Micro- and Small Enterprises: Evidence from Developing Asia, ADB Working PaperSeries on Regional Economic Integration, No. 115, http://hdl.handle.net/11540/2307
This Version is available at:http://hdl.handle.net/10419/109614
The Role of International Trade in Employment Growth in Micro- and Small Enterprises: Evidence from Developing Asia
Jens Krüger No. 115 | August 2013
ADB Working Paper Series onRegional Economic Integration
Jens Krüger*
The Role of International Trade in Employment Growth in Micro- and Small Enterprises: Evidence from Developing Asia
ADB Working Paper Series on Regional Economic Integration
No. 115 August 2013
The author would like to thank Alisa DiCaprio, Nina Fenton, Stephan Klasen, Inmaculada Martínez-Zarzoso, Ramesh Subramaniam, and seminar participants in Göttingen and Manila for valuable comments.
*Research Associate, Asian International Economists Network, and Research Associate, GIGA German Institute of Global and Area Studies, Neuer Jungfernstieg 21, 20354 Hamburg, Germany. [email protected]
The ADB Working Paper Series on Regional Economic Integration focuses on topics relating to regional cooperation and integration in the areas of infrastructure and software, trade and investment, money and finance, and regional public goods. The Series is a quick-disseminating, informal publication that seeks to provide information, generate discussion, and elicit comments. Working papers published under this Series may subsequently be published elsewhere.
Disclaimer: The views expressed in this paper are those of the author and do not necessarily reflect the views and policies of the Asian Development Bank (ADB) or its Board of Governors or the governments they represent. ADB does not guarantee the accuracy of the data included in this publication and accepts no responsibility for any consequence of their use. By making any designation of or reference to a particular territory or geographic area, or by using the term ―country‖ in this document, ADB does not intend to make any judgments as to the legal or other status of any territory or area.
2.1 Empirical Evidence of Heterogeneous MSE Growth Patterns 2
2.2 What Constraints Impede MSE Growth? 3
2.2.1 Credit Constraints 4
2.2.2 Risk 4
2.2.3 Individual Characteristics 5
2.2.4 Access to Markets, Inputs, and Technology 5
3. Empirical Analysis 7
3.1 General Enterprise Characteristics 7
3.2 Enterprise Growth and the Role of Initial Firm Size 8
3.3 What Role Does Participating in International Trade Play in Employment Growth? 9
3.4 Who are the Top Performers in Terms of Employment Growth? 14
4. Conclusion and Policy Outlook 16
References 19
Appendix 31
ADB Working Paper Series on Regional Economic Integration 32
Tables
1. General Enterprise Characteristics 24
2. Employment Growth in Developing Asia 25
3. Employment Growth by Initial Size Quintiles 26
4. The Role of Trade for Employment Growth —OLS Estimates 27
5. Characteristics of Top Performers 28
6. Probit Estimates—Dependent Variable: Being a Top Performer 29
7. Top Performers by Sector 30
Figures
A1. First Stage Estimation Results 31
Abstract This paper examines the role of international trade in employment growth in micro- and small enterprises using a representative sample of manufacturing firms in six Southeast Asian countries. After controlling for firm and individual characteristics as well as country and sector dummies, participation in international trade plays a significant role in explaining this growth, boosting firm-level growth by 3% per year on average. The fact that firms start exporting quickly after their foundation suggests that reverse causality is not an issue for our estimates. However, biases arising from unobserved heterogeneity cannot be ruled out. Therefore, we exploit the fact that firms were exposed to unexpected variation in real exchange rates between 2005 and 2008 to investigate the causal relationship between trade and employment growth. The results are not conclusive, but they do not suggest that the relationship is driven by unobserved heterogeneity. Keywords: MSE graduation, trade, employment growth JEL Classification: O12, D22
The Role of International Trade in Employment Growth in Micro- and Small Enterprises | 1
1. Introduction The motivation for this paper stems from the importance of micro- and small enterprises (MSEs) as a source of employment in developing countries. Firms with six workers or fewer account for roughly 50% of all employment in Latin America and substantially more than half in Africa and Southeast Asia, with their most significant contributions being made in urban areas (Fajnzylber et al. 2006). Furthermore, it has been observed empirically that despite the severe constraints faced by MSEs in developing countries, a significant number of them have managed to expand, indicating that they do have potential to drive economic growth. However, based on the characteristics of these successful firms there appears to be a significant number of firms that have, so far, failed to realize their growth potential (Grimm et al. 2012). Helping MSEs to grow is desirable not only to provide employment, but also to provide better employment. Wages in small enterprises tend to be low and it is usually difficult for owners to provide workers with social security benefits unless the firm can graduate into a bigger and more efficient firm.1 In this context, it is important to understand what constraints prevent firms from realizing their growth potential. Lack of access to credit has been acknowledged by numerous authors as a fundamental constraint to business expansion, especially for MSEs (Dinh et al. 2010; Bigsten et al. 2003). However, there are other major constraints receiving less attention that are specific to MSEs, such as business risks and a lack of access to markets, inputs, and technology. This paper focuses on the role of international trade in employment growth, with a special focus on MSEs. There are several ways in which participating in international markets can, in theory, help firms to overcome growth constraints. Exporting is one important channel to overcome the small size of local markets and low elasticity of demand. Empirical evidence also shows that exporting helps firms to grow and boost productivity through learning effects and the exploitation of economies of scale (van Biesebroeck 2005; Fafchamps et al. 2004). Similarly, firms in developing countries may be constrained in input markets: many inputs are not produced locally and most equipment is imported from abroad. Using a representative sample of manufacturing firms in Indonesia, Malaysia, Lao People’s Democratic Republic (Lao PDR), Thailand, the Philippines, and Viet Nam, we find that since their foundation firms that started in the lowest quintile of the initial size distribution grew by about 20% annually, compared with about 10% for the average firm. Although their small initial size reduces their contribution to overall employment creation, they nonetheless account for a substantial 15% of total employment creation in the six countries during the period under review. We also find that after controlling for firm and individual characteristics as well as country and sector dummies, participating in international trade boosts employment growth by 3% annually on average. In order to control for potential unobserved heterogeneity, we employ an instrumental variable approach, exploiting the natural experiment created by unexpected variation in exchange rates between 2005 and 2008. Although the results are not conclusive, they
1 In this paper, we measure enterprise growth by the growth in full-time employees since enterprise
foundation.
2 | Working Paper Series on Regional Economic Integration No. 115
provide no evidence to suggest that the relationship between firm growth and participation in international trade is driven by endogeneity bias. To provide information for policymakers we define top performers as firms in the top quintile of the employment growth distribution. We find that about one-third of top performing firms started as an MSE and that participating in international trade or having an owner with a college degree increases the probability of being a top performer by about 10% and 5%, respectively. The remainder of the paper is organized as follows. Section 2 provides an overview of the recent economic literature on potential constraints faced by enterprises in developing countries and the role of MSEs. Section 3 describes the empirical findings and Section 4 concludes and derives policy implications.
2. Literature Review Evidence from around the world shows the importance of MSEs in generating employment, especially in developing countries.2 Firms with six workers or fewer account for roughly 50% of employment in Latin America and substantially more than half in Africa and Southeast Asia (Fajnzylber et al. 2006). Fox and Sohnesen (2012) find that small-scale household enterprises generated most new jobs outside agriculture and earnings from household enterprises have the same marginal effect on consumption as wage and salary employment. Given the magnitude of the MSE sector it is important to understand whether these enterprises are merely low-productivity, subsistence activities (Banerjee and Newman 1993; Lloyd–Ellis and Bernhardt 2000) or have the potential to grow and contribute to employment creation and economic growth (Grimm et al. 2012).
2.1 Empirical Evidence of Heterogeneous MSE Growth Patterns McMillan and Woodruff (2002) provide evidence of the potential of newly founded firms, mostly small firms, in transitional and developing economies such as the Russian Federation, People’s Republic of China (PRC), Poland, and Viet Nam. The example of Viet Nam, in particular, shows the potential of MSEs. Between 1992 and 1995, private sector employment in Viet Nam grew by about 2.5 million, almost all of which can be attributed to small manufacturing firms and the expansion of household enterprises in the retail and repair sectors. In the PRC, newly founded, mostly small enterprises contributed substantially to the fact that the share of industrial production of rural firms rose from 9% in 1978 to 30% in 1991. These two examples in developing countries demonstrate the potential for small firm growth in developing and transitional economies. Mead and Liedholm (1998) find that since their foundation MSEs created almost twice as many jobs as formally registered large-scale enterprises in Botswana, Kenya, Malawi, Swaziland, and Zimbabwe, although overall employment growth in these countries in the 1990s was slow. The study also finds MSE growth to be heterogeneous. The authors show that most of the MSE growth can be attributed to a minority of enterprises, although even these added only a few workers. They find average annual growth rates
2 MSEs are frequently defined as firms with up to five permanent workers (Nichter and Goldmark 2009;
Liedholm 2002).
The Role of International Trade in Employment Growth in Micro- and Small Enterprises | 3
of MSEs to be between 4% (Swaziland) and 24% (Kenya). Only 27% of all enterprises grew in size over the period under review, creating 0.14 jobs per year on average. The study also analyzes the income generated by MSEs and finds that returns to labor rise substantially for enterprises that consist of more than one person. This increase in efficiency is associated with higher levels of income for employees and enterprise owners. Another study examines firm growth between 2006 and 2010. Dinh et al. (2010) use data from the World Bank Enterprise Surveys (WBES) to examine determinants of average annual firm growth. The study uses a cross-sectional data set with almost 40,000 observations from 98 countries. The findings show that firm growth is highest for enterprises with fewer than 10 employees. Firms that had been established in the previous 5 years grew faster than older firms, and average enterprise growth was lowest in East Asia and the Pacific, and highest in South Asia.3 Following the growth diagnostic approach by Hausman et al. (2005), the study identifies financial constraints and informal sector competition as the most binding constraints to firm growth in developing countries. Though the study mentions firm heterogeneity between and within countries, the analysis does not include empirical results at the country level. Sleuwagen and Goedhuys (2002) analyze the firm growth process in Côte d’Ivoire using a representative sample of manufacturing firms. The empirical results show a negative relationship between firm growth and firm age and size in Côte d’Ivoire. However, comparing firm growth by enterprise size between Côte d’Ivoire and Germany shows differences in growth patterns between developed and developing countries. This is an extreme example as Germany is well known for its broad base of small and medium-sized enterprises, but similar results are also shown for other developed countries.4 Small enterprises grew relatively fast in Germany, as evidenced by the fact that 28% of Germany’s large and medium-sized firms (100 or more employees) started as micro enterprises (1–4 employees). In Côte d’Ivoire, only a few large firms started small but larger enterprises (with more than 50 employees) grew faster than in Germany. The findings are consistent with a ―missing middle‖’ in the firm size distribution in developing countries. To sum up, the reviewed empirical literature on firm growth in developing countries shows that such growth is heterogeneous, particularly for MSEs, which account for the majority of firms in most developing countries. Also in most countries, only a few MSEs show rapid growth. The next section sums up studies on different groups of constraints and identifies the research gap on for the role of trade for employment growth in MSEs in Southeast Asia.
2.2 What Constraints Impede MSE Growth? We assume that the relatively high concentration of MSEs in developing countries and the heterogeneous growth patterns of these firms can be explained by certain
3 The other subregional groups are Sub-Saharan Africa, Europe and Central Asia, Latin America and the
Caribbean, and the Middle East and North Africa. 4 See Stenkula (2006) for an overview of firm size distribution of European countries.
4 | Working Paper Series on Regional Economic Integration No. 115
constraints these enterprises face. An overview study by Nichter and Goldmark (2009) lends support to this hypothesis. The authors review the most influential studies on firm growth in developing countries over the past 50 years and identify four key factors associated with low growth in developing countries: (i) individual characteristics (e.g., education, gender, or work experience), (ii) firm characteristics (e.g. age, size, access to finance), (iii) relational factors (e.g., value chains or social networks), and (iv) contextual factors (e.g., business environment).
2.2.1 Credit Constraints One frequently studied and well-confirmed constraint to enterprise growth is a lack of access to finance due to credit market imperfections. Numerous studies have examined the role of credit constraints in hindering firm expansion (Tybout 1983; Dinh et al. 2010; Dollar et al. 2005). Bigsten et al. (2003) use firm data from Burundi, Côte d’Ivoire, Ghana, Kenya, and Zimbabwe and find that even though demand for credit in Africa seems small, the success rates in loan applications for bigger firms are substantially higher than success rates for small firms. The findings show that 33% of all firms in the sample are credit constrained. However, only 10% of large firms are credit constrained compared with 64% of micro-sized firms.5 In addition, there is some evidence that young and small firms are particularly affected by capital constraints (Beck et al. 2005; Evans and Jovanovic 1989). Taking together the findings on firm growth and capital constraints, it is reasonable to assume that capital constraints influence firm size distribution. Theoretical and empirical work show that credit constraints can skew firm size distribution toward smaller firms and that the skewedness decreases with firm age (Cooley and Quadrini 2001; Dinh et al. 2010; Angelini and Generale 2008). Finally, the finding of high returns to capital in MSEs in Latin America, Africa, and Asia confirms the presence of credit constraints in developing countries (McKenzie and Woodruff 2006; Udry and Anagol 2006; de Mel et al. 2008).
2.2.2 Risk Another important influence on firm growth that is particularly relevant for MSEs is business risk. Cash flow, especially for young MSEs in developing countries, can be volatile. Hence, risk-averse entrepreneurs might be reluctant to take the steps necessary to start capital accumulation, which in turn may prevent them from investing in new technologies that can boost efficiency (Binswanger and Rosenzweig 1986). Also, due to partially irreversible investments, firms might need a liquidity premium such as a level of precautionary savings deemed comfortable enough for the investment (Fafchamps and Pender 1997). As Fafchamps (1999) points out, ―true business risk‖ might be accompanied by opportunistic or contractual risk if no proper contract enforcement mechanisms are in place, which is likely to be the case in developing countries. In particular, in a risky environment where contract enforcement is difficult, it is easy to claim the inability to stick to obligations agreed to with a business counterpart. This
5 A credit-constrained firm is defined as a firm that requested a loan but was rejected.
The Role of International Trade in Employment Growth in Micro- and Small Enterprises | 5
example makes it clear that business risk is related to institutional and governance constraints such as contract enforcement. The effect of institutional weaknesses and corruption on firm growth has been quantified by Fisman and Svensson (2007) in the case of Uganda. The study finds that a 1% increase in bribery reduces firm growth by 3%.6 The empirical evidence of the effects of risk on marginal returns to capital is mixed as the expected positive effects cannot be confirmed (McKenzie and Woodruff 2006; de Mel et al. 2008; Grimm et al. 2011).
2.2.3 Individual Characteristics Besides credit constraints and risk, individual characteristics of the firm owner have also been found to influence firm growth. Often these individual characteristics are interlinked with other constraints such as a lack of access to credit. The educational attainment of enterprise heads or the entrepreneurial ability of owners may also interact with other constraints to MSE growth. It seems to be the case that a country-specific threshold needs to be reached before one can observe a positive correlation between educational attainment and firm performance (Nichter and Goldmark 2009; McKenzie and Woodruff 2006). Also, education may interact with other individual characteristics such as gender (de Mel et al. 2009). A recent stream of literature uses randomized experiments to analyze the success of MSEs from a gender perspective. The studies show how the impact of interventions, which aim to reduce barriers to firm growth such as credit constraints, also depends on individual characteristics. These experiments randomly allocate cash or in-kind transfers to enterprises and analyze the effects on the firms. Such experiments have been carried out in Ghana (Fafchamps et al. 2011), Sri Lanka (de Mel et al. 2009), and the Philippines (Karlan and Zinman 2009). The results from Ghana show no effect of randomly allocated grants in enterprises run by women with initial profits below the median. In Sri Lanka, men invest the randomly allocated grants and as a consequence profits rise by up to 14% of the grant amount. Women, by contrast, only invest large grants but do not earn any return on this investment. In the Philippines, randomly allocated microcredit increases profits only in male-led enterprises, which in turn use the extra money to send their children to school. The loans have no effect on profits in enterprises led by women.
2.2.4 Access to Markets, Inputs, and Technology Another set of constraints to MSE growth originates from demand-side issues, input unavailability, and a lack of technology. A small domestic market and, hence, limited domestic demand, potentially combined with low elasticity of demand for the particular products commonly produced by MSEs, may impede firms from growing (Lachaud 1990). Recent empirical evidence confirms the importance of this constraint (Böhme and Thiele 2012).
6 The question used to measure bribes was the following: ―Many business people have told us that firms
are often required to make informal payments to public officials to deal with customs, taxes, licenses, regulations, services, etc. Can you estimate what a firm in your line of business and of similar size and characteristics typically pays each year?‖ (Fisman and Svensson 2007, p. 68).
6 | Working Paper Series on Regional Economic Integration No. 115
Exporting is evidently an instrument to overcome the small size of local markets in developing countries (Bigsten et al. 2004; Diao et al. 2006). Empirical evidence from Asia and Africa shows that after entering the export market productivity increases occur, which can be largely attributed to the exploitation of scale economies (van Biesenbroeck 2005).7 Firms may also be constrained by input markets if certain inputs are not produced locally and most equipment used is imported from abroad. In addition to the traditional pattern of exporting (e.g., from a developing country that has comparative advantage in relatively low-skilled textile manufacturing to a developed country), falling transport costs and reduced trade barriers, as well as rapid advancements in production technology, have made it possible for large international firms to ―slice up the value chain‖ (Krugman et al. 1995). This relatively new phenomenon of regional and global production networks means that it can be easier for firms to start exporting since they can specialize in only one small step of the production process. This new trend is confirmed by the fact that production network trade has generally grown faster than total world trade in manufacturing (Athukorala 2011). Benefits from participating in global markets might also stem from the increasing presence of foreign firms in domestic markets. The evidence on whether the presence of foreign firms creates employment and boosts the success of domestic firms is ambiguous. As described by Markusen and Venables (1999) using the example of Taipei,China, it can be the case that foreign firms create additional demand for local products and services, boosting firm growth. On the other hand, it is argued that foreign firms compete with local firms both for markets and skilled workers, and hence crowd out local firms (Aitken and Harrison 1999; Backer and Sleuwaegen 2003). In addition to employment effects caused by the presence of foreign firms, there might also be positive skill or technology spillover effects.8 However, empirical evidence of these spillover effects is mixed (Görg and Greenaway 2004). Given the rapid growth of opportunities for participation in international trade via production networks, this paper will focus on the effects of engaging in international trade on employment growth in MSEs using data from six Southeast Asian economies. The MSE sector’s importance in Asia is evidenced by the fact that it accounts for substantially more than 50% of employment in the region. The constraint of access to markets, inputs, and technology is particularly relevant for the region as many countries either are plugged into, or would like to plug into, regional or global production networks. This paper tries to fill the research gap on the effects of trade and investment liberalization on employment growth. In particular we will examine the following questions:
(i) Can we observe employment growth in MSEs, and if so, do firms that started small contribute to overall employment growth?
(ii) What role does participating in international trade play in employment growth?
7 See also Wagner (2012) for an overview on empirical studies examining the relationship between
exporting and productivity. 8 One possible channel for such spillovers is the skill acquisition channel: foreign firms provide training to
workers and workers trained by foreign firms might at one point start working for a local firm.
The Role of International Trade in Employment Growth in Micro- and Small Enterprises | 7
What are the characteristics of firms that grew particularly fast and what are the implications for policymakers?
3. Empirical Analysis For our empirical analysis we use the World Bank enterprise surveys (WBES) from Malaysia and Thailand (2007), and Indonesia, Lao PDR, the Philippines, and Viet Nam (2009). The surveys are representative samples of registered manufacturing firms with five or more employees. The surveys in Indonesia, the Philippines, and Viet Nam also include firms in the services sector.
3.1 General Enterprise Characteristics Our sample comprises almost 5,400 firms in six Southeast Asian countries.9 Note that the employment growth rates and determinants of employment growth need to be interpreted with caution. Our data set is cross-sectional and therefore it includes only the firms that survived throughout until the date of the survey. Hence, all estimates for employment growth should be interpreted as upper bound figures.10 Enterprise growth is measured, for the purposes of this paper, by the growth of employment in firms. Measuring firm growth using other indicators such as profits or capital is not possible as these indicators are not measured consistently across countries. Table 1 summarizes the main characteristics of the enterprises under review. The results show significant employment growth. Firms in our sample started with 64 full-time employees on average and had 114 employees when the surveys were carried out. The median values of the firms’ initial and current sizes are considerably lower, with a starting size of 20 employees and a current size of 40 employees. This shows that a small proportion of firms heavily influence the average numbers. The firms in our sample are relatively old: around 16 years on average. The mean and median values of firm age are similar and do not vary substantially across countries. The orientation toward international markets is somewhat limited: about three-quarters of the output is sold domestically. The data allow us to further distinguish between direct and indirect exports. Directly exporting is the preferred mode, on average only 5% of overall output is exported indirectly through an intermediary, while about 20% is exported directly. Thailand and Malaysia show the highest share of production being exported with an average of 27% and 34%, respectively. We define firms that import inputs and also export as participants in international trade. Using this definition, about 21% of firms participate in international trade.
9 In order to avoid biased estimation results due to influential outliers, we excluded the top 2% of firms in
terms of absolute employment growth. This reduces the sample by about 160 observations. 10
We examined major enterprise characteristics by firm age. They do not differ substantially across firm age quintiles. This suggests that the bias caused by firms that did not survive might be limited.
8 | Working Paper Series on Regional Economic Integration No. 115
Only one-quarter of enterprise owners in our sample are female. The numbers do not vary substantially across countries. About 60% of all enterprise owners have a college degree. Indonesia is the only country where this number is lower than 35%. The average percentage of foreign ownership is roughly 15%. Taken together, the results of Table 1 show that, on average, firms grew, and that a considerable share of firms participates in international trade.
3.2 Enterprise Growth and the Role of Initial Firm Size Table 2 describes this employment growth, applying three different measures. The first two columns of Table 2 show the mean and median values of two employment growth measures used by Mead and Liedholm (1998). The third column shows the average number of jobs that have been created per year since foundation. Our preferred measure of employment growth is the compounded measure presented in column 2. Average annual growth rates range from 6% (Philippines) to 18% (Thailand). Median values of employment growth are about half of the average values, reflecting heterogeneity across firms. Malaysia is the only country where mean and median employment growth figures are roughly similar, suggesting that the employment growth distribution in Malaysia is relatively close to normal. Since foundation, the average firm in our sample created about four jobs per year. The countries where the firms grew the fastest also created the most jobs: in Thailand and Viet Nam an average of 10 and six jobs were created, respectively, per firm per year. Meanwhile, the average firm in the Philippines and Lao PDR only created about one job per year. In sum, Table 2 shows that enterprises in our sample have grown by about 10% since their foundation, but that growth patterns are heterogeneous between and within countries. The next section will examine differences in employment growth across the initial firm size distribution to examine how firms that started as MSEs contributed to employment growth. Do MSEs Contribute to Overall Employment Growth? Table 3 shows employment growth by initial size quintile.11 Firms that started in the bottom quintile of the initial size distribution grew by about 21% per year. In contrast, firms in the top quintile of the initial size distribution grew by only 1% per year. Columns 3 and 4 report the absolute number of jobs created by firms in our sample and the relative importance of the respective quintile for overall job creation. Overall, the firms in our sample created about 260,000 jobs since their foundation. Firms in the bottom quintile of the initial size distribution created about 41,000 jobs and accounted for about 15% of all jobs created. Based on the findings in Table 3, we conclude that firms in the bottom quintile of the initial size distribution contributed considerably to overall employment growth.
11
Note that the initial size quintiles are computed by country.
The Role of International Trade in Employment Growth in Micro- and Small Enterprises | 9
3.3 What Role Does Participating in International Trade Play in Employment Growth?
Having confirmed the hypothesis that firms that started small contribute substantially to overall employment growth, we now test the hypothesis that access to imported inputs and/or foreign markets enables firms to exploit economies of scale, thereby boosting employment growth.12 We use the following model to test this hypothesis: (1)
The dependent variable is enterprise growth in firm located in country .13 This is measured using the compounded measure of employment growth:
[(
) ⁄
] - (2)
in Equation (1) represents a vector of enterprise and individual characteristics. In
particular, includes the number of full-time employees at enterprise foundation, the
percentage of the firm that is owned by a foreign entity, a dummy that takes the value 1 if the enterprise owner is female, a dummy that takes the value 1 if the owner has a college degree, and the firm’s age. To measure the effect of participating in international trade on employment growth we include a dummy that takes the value 1 if a firm exports and also imports inputs.14 We also use export intensity (direct and indirect exports over sales) as a proxy for participation in international trade to check the robustness of the results. To make the interpretation of the coefficients straightforward, we will use the dummy variable specification when discussing the magnitude of the trade effect. Using different proxies for participation in international trade does not alter the results. Furthermore, we control for heterogeneity across sectors and countries using a set of dummies.15 Finally,
represents a random error term. Potential Biases It is important to be aware of a number of biases that may affect the estimation results. Measurement error will bias the results downwards and this tendency is likely to be exacerbated by the fact that the dependent variable used is a change over time. The
12
This hypothesis is supported by the fact that labor productivity is positively related to exporting in our sample.
13 Although the data are cross-sectional, respondents were asked how many workers were employed in
the firm when it was established. 14
The results are still robust with variations in this definition (e.g., using an exporter dummy) and when omitting explanatory variables such as the size at enterprise foundation.
15 The following sectors are summarized under other manufacturing: chemicals, auto parts, furniture,
office accounting and computing machinery, wood and wood products, non-metallic mineral products, basic metals, fabricated metal products, construction, and transport. The sector dummy for services includes the following sub-sectors: hotels and restaurants, information technology, wholesale, retail, and motor vehicle services.
10 | Working Paper Series on Regional Economic Integration No. 115
possibility of reverse causality between participating in international trade and employment growth should also be considered. The model we would like to test is that firms grow because of their participation in international trade, for example, because it allows them to exploit economies of scale. However, it is not implausible that firms are unable to export unless they are already profitable, and therefore growing, so the causality runs from growth to exports, rather than vice versa. If that were the case, our results would be biased upward. However, despite the cross-sectional character of our data set, we know in which year a firm started exporting. The majority of firms for which these data are provided started exporting in the year the enterprise was set up or 1 year later. This lends support to the view that reverse causality is not an issue for our estimation. The fact that most firms export shortly after foundation means that the issue of reverse causality between exporting and employment growth is unlikely to be a serious cause of bias. However, there is a strong possibility of endogeneity bias, which can make causal interpretation of results, and therefore policy implications, misleading. Endogeneity bias arises because it is difficult to isolate the causal effect of exporting on the employment growth of a firm from the effect of unobserved factors that are correlated with exporting. It is plausible that export status is correlated with unobserved factors such as motivation of the manager. Businesses run by highly motivated managers are likely to expand rapidly, even if they do not succeed in exporting, and the motivated managers will also put more effort into seeking out export opportunities. In this case, an apparently large impact of trade on enterprise growth could, in reality, be largely a reflection of the higher level of motivation among business owners and management. Similar issues of endogeneity bias have been addressed in empirical studies that examine the effects of participating in international trade on productivity. One remedy is using full information maximum likelihood (Clerides et al. 1998). However, as noted by Bigsten et al. (2004), this approach can be sensitive to the assumptions on the joint error distribution. Another approach is to use matching techniques (de Loecker 2007; Fernandes and Isgut 2005; Girma et al. 2004). The underlying idea behind this technique is to match starting exporters and non-exporters based on propensity score matching to get an idea of how a firm would have performed if it had not started exporting. However, matching approaches are able to eliminate biases based only on observables, not on observables. Further, given the cross-sectional nature of our data set it is not possible to use fixed-effects techniques to control for endogeneity. Therefore, we apply an instrumental variable (IV) approach, adapting the approach by Park et al. (2010) to our data set. The authors use the unforeseen exchange rate shocks in certain countries during the 1997/98 Asian financial crisis as a ―natural experiment.‖ Firms that exported to destination countries such as Thailand experienced heavy demand shocks due to exchange rate variations, whereas companies exporting to Europe, for example, did not experience large shocks. The weighted average real depreciation among a firm’s pre-crisis trade partners, which captures exchange rate shocks, is used as an instrument for the change in exports, in order to isolate the causal effect of exporting on productivity.
The Role of International Trade in Employment Growth in Micro- and Small Enterprises | 11
While Park et al. (2010) focused on the Asian financial crisis, we exploit the variation in exchange rates caused by the financial and economic crisis that started with the collapse of Lehman Brothers in mid-September 2008. As a consequence of this crisis, exchange rates, especially in the United States (US) and Europe fluctuated. The two most common export destinations for our sample firms are Japan and the US. A significant proportion of firms also export to Europe.16 As the main export destinations and the proportions received by each vary by firm, exposure to the shocks varies. The exchange rate shock variable is a suitable instrument if it is strongly related to export intensity, but unrelated to any unobserved factors. The latter is a reasonable assumption, as the exchange rate shocks experienced between 2005 and 2008 were largely unforeseen by firms (and indeed by economic analysts). Further, the firms in the sample had no significant influence over these economic events as the crisis originated in the US (Reinhart and Rogoff 2009). The first requirement will be met if trade intensity in 2008 is strongly related to the shock variable. This will be the case if firms that experience an exchange rate shock react by reducing the proportion of goods that they export. This is likely to occur if it is easier for them to re-orient sales toward the domestic market than to find new export partners in the short-term. In this case, the firms that experienced the bigger shocks would have lower export intensities than firms that experienced either no shock or a positive change.17 Exporting firms in three countries in our data set (Indonesia, the Philippines, and Viet Nam) reported information on their two most important export partners. In line with Park et al. (2010), we compute the exchange rate shock for each destination country as follows:
{[ ( ) - ]-[ ( ) - ]} (3)
In Equation (3), is the nominal exchange rate (local currency unit per unit of the
respective destination country currency) in year , and is the price level.18 We follow
the approach of Park et al. (2010) and create a firm-level indicator for exchange rate variations by weighting the exchange rate index by the share of sales destined for the respective destination country in 2008. We obtain a firm-level exchange rate index as follows:
(4)
16
About 40% of firms indicate either Japan or the US as their top export destination, while 10% of all firms report the European Union as their top export destination.
17 Firms in our data set report exports and the export shares of the two most important destination
countries in 2008. Due to contracts negotiated before the crisis that had to be fulfilled there could be some delay in the reaction of exporters. Hence, by using data from only 2008 it could be that we are underestimating the impact of the exchange rate shock on export intensities.
18 Exchange rate data stem from the United Nations Conference on Trade and Development (UNCTAD)
database. Data on consumer price indexes stem from the World Bank World Development Indicators (WDI).
12 | Working Paper Series on Regional Economic Integration No. 115
The shares of the destination countries of firm are represented by . The numbers
represent the two most important export destinations.19 If a firm only reports the share for the most important destination country, we give that country a weight of 100%. The larger the value of the
variable, the larger the increase in the price of
exported goods, on average, in the local currencies of the destination countries. Ceteris paribus, this would reduce exports. Using a firm-level variable as an instrument has the advantage that we can still include country and sector dummies in the IV estimation. Only cross-sectional data are available, so we focus on the relationship between the shock and export intensity in 2008, rather than on the change in exports between 2005 and 2008, as in the approach of Park et al. (2010). It should be noted that using this approach restricts the sample to firms that export, which is around 30% of the sample. As well as reducing the sample size significantly, this means that the equation captures only part of the effect of trade on firm growth. If there is a large benefit to exporting regardless of quantity (a non-linear effect), the IV approach will understate the benefits of exporting, as it is restricted only to those firms that export at least part of their production.20 Estimation Results The results are reported in Table 4. Columns 1 to 4 report the ordinary least squares (OLS) results. In the first specification we include only the export intensity variable and country and sector dummies, and use data from all six countries in the data set. In column 2 we add all control variables as described above. In the third column we use a dummy that takes the value 1 if a firm exports and also imports inputs as a proxy for participation in international trade. In column 4 we show the results using only data from the three countries that reported information on their export partners. These countries are the ones used in the IV estimates. In column 5 we report the results of the IV estimation, using the weighted exchange rate shock between 2005 and 2008 as an instrument for export intensity. In column 6 we report OLS estimates using the same sample that was used for the IV estimates. We use Viet Nam as the reference country and machinery and equipment as the reference sector. The first four specifications show highly significant coefficients for the trade variables, which are stable across all specifications. These results are robust for a number of variations in the key variables.21 Another finding that is robust across all specifications is that firms that started small expand faster, controlling for other factors.22 The foreign
19
Among all countries, about 74% of exports go to the two most important export destinations. Hence, the data constraint of having only data on the two most important export destinations is not critical for our analysis.
20 Note that the information on export destination shares is very noisy. Only half of all exporters report
consistent information on destination countries and/or their shares of exports. 21
The results remain stable when running the regression by size and age groups, and alternative definitions of employment growth (e.g., absolute growth of employment or a log specification of employment growth).
22 The sign and magnitude of the age variable is in line with other studies such as Dinh et al. (2010) and
Wignaraja (2012). One possible explanation for this result is that younger firms find it easier to adapt to
The Role of International Trade in Employment Growth in Micro- and Small Enterprises | 13
ownership variable is significant and positive in models 2, 3, and 4. The coefficient is positive and of similar magnitude in all other specifications. The coefficient on the gender of the enterprise owner is negative in most specifications, and is significant for the sample used in the IV specification (only exporting firms).23 The level of education of the owner seems to matter too as the dummy education variable is positive and significant in all specifications. Including control variables leads to a considerable increase in the adjusted R-squared, but has little effect on the trade variables. The estimates from the six-country sample are of similar magnitude as the results using the three-country sample. As could be expected from the descriptive statistics, the Thailand dummy (not reported) is significant and positive. The other country dummies show that after controlling for individual and enterprise characteristics, employment growth was significantly lower in Indonesia and the Philippines than in Viet Nam. Firms in the electronics sector show the highest growth rates after controlling for country effects and individual and enterprise characteristics. However, as described above, these results should be interpreted with caution because of the strong possibility that they are affected by endogeneity bias. Therefore, in column 5 we introduce the instrumental variable approach described above. We report the second stage IV estimates in column 5. The first stage estimates show the expected negative and highly significant (t-value of –2.61) relationship between export intensity and our exchange rate shock index (see Appendix for the complete results). The null hypothesis of under-identification is rejected at the 5% confidence level.24 However, an F Test of whether all excluded instruments are significant suggests that the instrument may be weak. This test in our data set has an F-value of 6.8. According to the thresholds defined in Stock et al. (2002), this means that the null hypothesis (the instrument is insignificant) can be rejected only at the 20% level.25 As explained by Stock et al. (2002), the presence of weak instruments leads to unreliable point estimates and confidence intervals. This means that the IV estimates should be interpreted with caution, and is likely to explain the fact that the IV specification provides only weak evidence for the impact of trade on employment growth. Neither specification shows a significant coefficient for trade intensity. However, the fact that the coefficient does not change signs and remains of a similar magnitude is encouraging. Large swings in the coefficient and implausible magnitudes are common characteristics of very weak instruments. The first stage results indicate that the exchange rate shocks did affect trade intensity, supporting the appropriateness of this
new and more efficient production technologies, which enables them to grow faster. We also detected some evidence of a non-linear age effect when including age squared in the specification.
23 This indicates that export firms headed by female entrepreneurs face particular barriers to employment
growth. Further investigation would be needed to identify the reasons for this finding. 24
See Baum et al. (2003) for details. In the case of one endogenous regressor and one instrument, the null hypothesis of this test is that the correlation matrix between this regressor and the instrument is nonzero.
25 The results do not change when using Tobit estimation techniques in the first stage regression or when
using the exchange rate shock between 2006 and 2008.
14 | Working Paper Series on Regional Economic Integration No. 115
instrument. Another factor behind the lack of a significant result in the IV specification is that the data on export destinations and export shares are very noisy, so many observations need to be dropped, resulting in a small sample size. Taken together, the evidence suggests, subject to the potential biases mentioned above, that participating in international trade raises employment growth. After controlling for sector and country effects as well as differences in firm and individual characteristics, employment growth in firms that export and import inputs was about 3% higher compared with all remaining firms. The results are robust for variations in the trade variable and also for variations in the countries included.26
3.4 Who are the Top Performers in Terms of Employment Growth? Firm Characteristics In order to derive suggestions for policy measures, we now examine the characteristics of the firms that have grown the most since their foundation. We define top performers as enterprises in the top quintile of enterprise growth. Table 5 shows differences in firm and individual characteristics between top performers and all remaining firms. Overall, the results show that top performers and the remaining firms differ significantly in all categories except for the education of the owner and the percentage of female owners.27 About one-quarter of top performers are participating in international trade, compared with one-fifth of firms that are not defined as top performers. Also top performers started significantly smaller, which is in line with the findings of Tables 3 and 4. Again, the median values for initial size are smaller than mean values, reflecting the skewed initial size distribution. The results also show that one-third of top performing firms started as MSEs with fewer than five employees. In addition, top performers are on average about 10 years younger. This may reflect higher capacity to adopt new technologies that increase productivity. However, this effect may also be caused by firms closing down if they did not grow fast enough. For top performers the experience of the owner exceeds the firm age, on average, whereas for the other firms the firm age exceeds the years of experience of the owner. So even if one assumes that the owner has worked in a top-performing enterprise since its foundation, she would have had on average about 3 years of experience when founding the company. For the remaining firms it could be that the recent owner who has less years of experience than the firm age took over the business from a family member. Such enterprises might find it harder to adopt new production technologies. The percentage of firms whose owner have a college degree or are female do not vary significantly between top performers and other firms. Finally, top performers have a significantly higher percentage of foreign ownership. This is plausible since being part of an international company may facilitate intra-firm knowledge spillovers.
26
We ran separate regressions including only Malaysia and Thailand, and regressions including only Indonesia, Lao PDR, the Philippines, and Viet Nam. The main findings were not altered.
27 The results are based on a T test assuming unequal differences between the groups.
The Role of International Trade in Employment Growth in Micro- and Small Enterprises | 15
To learn more about the relative importance of the determinants of being a top performer we run a probit model of the following form: (5)
The dependent variable in Equation (5) is a dummy that takes the value 1 if firm in
country is a top performer. The vector includes the control variables that were used in Table 5. The coefficients and marginal effects from estimating (5) are reported in Table 6. The pseudo R-squared shows that the chosen indicators are able to explain a substantial part of whether or not firms are top performers. The results show that the gender and expertise of the owner do not significantly influence the likelihood of being a top performer. Initial firm size and the percentage of foreign ownership show significant marginal effects, although the coefficients are very small. Furthermore, the results show that younger firms are more likely to be top performers. Since top performers and other firms do not differ substantially in terms of the owner’s education, the positive and significant coefficient on the college dummy is unexpected. However, this effect only occurs when we also control for firm age. Hence, the reason for the change of significance in the education variable is that more educated persons tend to be owners of older firms. This means that not considering firm age hides the effect of education. After controlling for firm age, having a college degree increases the probability of being a top performer by roughly 5%. The marginal effect of participating in international trade is even bigger. The results show that participating in international trade increases the probability of being in the top quintile of employment growth by about 10%. The country dummies show that, ceteris paribus, the probability of being a top performer is highest in Malaysia, which was chosen as the reference category. This result may be driven by the rapidly expanding rubber sector in Malaysia.28 The results from the sector dummies show that being in the machinery or services sector significantly lowers the probability of being a top performer. These findings need to be interpreted with caution as the hypothesis that the sector dummies are jointly zero can only be rejected at the 5% confidence level, according to a joint F test. The marginal effect estimates should also be interpreted with caution. The potential issues of reverse causality and unobserved heterogeneity discussed in the context of Table 4 apply also to the results presented in Table 6. In addition, our data set only includes firms that survived until the date of the survey. Not accounting for unsuccessful business ventures biases our result upwards. Nonetheless, the findings that education and participating in trade substantially increase the probability of being a top performer are both interesting and relevant for policymakers in Asia.
28
The results reported in Table 7 show that about one-fourth of top performing firms in Thailand and Malaysia can be found in the rubber sector.
16 | Working Paper Series on Regional Economic Integration No. 115
Sectoral Distribution of Top Performers To design targeted policies to foster employment growth it is also important to know which sectors are home to successful entrepreneurs. To examine the sectoral division of top performers, Table 7 shows the percentage of top performers by country group and sector. Sector definitions are identical in Indonesia, the Philippines, and Viet Nam, and very similar in Thailand and Malaysia. Therefore, we present the findings by country group.29 In Table 7 we sorted the sectors in descending order according to the percentage of top performers. The concentration of top performers is highest in Indonesia, the Philippines, and Viet Nam, where about 20% of all sectors include 50% of all top performers. In Malaysia and Thailand about 30% of all sectors account for 50% of the top performers. Note, however, that one-fourth of top performing firms are in the rubber sector in Malaysia and Thailand. Garment and food processing are among the top five sectors in both country groups. However, the share of top performers in high technology industries such as electronics is about 13% in Thailand and Malaysia. This is almost twice as high as in Indonesia, the Philippines, and Viet Nam.
4. Conclusion and Policy Outlook The motivation for this paper stems from the empirical observation that despite the severe constraints faced by MSEs in developing countries, an important number of them have the potential to grow (Grimm et al. 2012). In particular, we examine the role of participating in international trade in employment growth. Using firm-level data from World Bank Enterprise Surveys in Indonesia, Lao PDR, Malaysia, Thailand, the Philippines, and Viet Nam, we examine the following questions: Can we observe employment growth in MSEs? If so, do firms that started small contribute to overall employment growth? Using a compounded measure of employment growth, we find that firms in the bottom quintile of the initial size distribution grew on average by 20% per annum, which is significantly higher than the overall average employment growth rate of about 10%. Our results also show that 15% of all jobs created by firms in our sample were created by firms in the bottom quintile of the initial size distribution. Based on these results, we conclude that firms that started small contributed considerably to overall employment growth. How does participating in international trade contribute to employment growth? We find that after controlling for firm and individual characteristics, firms that export and also import inputs grew on average 3% faster per year than all remaining firms after controlling for country, sector, and individual characteristics.
29
The data on Lao PDR only distinguishes between services and manufacturing. The top performers are approximately evenly distributed between the two groups.
The Role of International Trade in Employment Growth in Micro- and Small Enterprises | 17
These results need to be interpreted with caution as the sample only includes firms that survived until the date of the survey. Not controlling for unsuccessful firms biases our results upward. Furthermore, given the variables included in our data set, we cannot rule out the issue of endogeneity between participating in international trade and employment growth. However, the fact that firms start exporting quickly after their foundation lends support to the hypothesis that participating in international trade causes employment growth and not vice versa. The results of the IV estimation do not show a significant effect of trade on employment growth, possibly because the only available instrument is somewhat weak. However, they provide no evidence to suggest that endogeneity is driving the relationship. Also, the first stage estimation results are very similar to Park et al. (2010) who successfully use exchange rate fluctuations during the 1997/98 Asian financial crisis as an instrument. Further investigation using this IV approach with a larger sample and more precise data could be fruitful. Our findings are in line with other studies, such as Dinh et al. (2010), and support the hypothesis that participating in international trade boosts employment growth. What are the characteristics of firms that grew particularly fast? We define top performing firms as firms in the top quintile of the employment growth distribution. The results show the high potential of MSEs, as one-third of top performing enterprises started with fewer than five employees. Using probit estimates, we show that in addition to participating in international trade, which is associated with a 10% boost in the likelihood of being a top performer, the education level of the enterprise owner matters. After controlling for country, sector, and other individual and firm characteristics, the results show that the owner having a college degree increases the likelihood of being a top performer by 5%. In addition to education of the owner and participating in trade, younger firms have a higher probability of being top performers. What does this mean for policymakers? The finding that MSEs and participating in international trade play an important role in employment growth suggests that policymakers could boost job creation by making it easier for firms to plug into international trade networks. A number of measures could be considered, such as simplification of customs procedures for MSEs or small export volumes, provision of information on customs procedures, or the offering of export credit or guarantee products designed to be accessible to MSEs. Given the finding that the education level of a firm’s owner increases employment growth, these sorts of measures are likely to be most effective if they are combined with training. Training could cover issues such as the regulations and norms that are necessary to participate in international trade (e.g., quality standards for exports or import regulations to obtain raw materials that cannot be sourced domestically). The findings also suggest that entrepreneurs who are already educated and have some experience are more likely to initiate successful enterprises and may therefore be more likely to benefit from training. Hence, training and information campaigns could be most effective if they are targeted at persons with a certain minimum level of education.
18 | Working Paper Series on Regional Economic Integration No. 115
The finding that most firms start exporting relatively quickly after their establishment also has policy implications. Advice and training on how to plug into international trade networks should be available to potential entrepreneurs even before the establishment of an enterprise. We observe that only one-quarter of all entrepreneurs in our sample are female. This may reflect the fact that due to social norms potentially talented female entrepreneurs lack the opportunity to establish enterprises. Overall, the data do not allow us to make specific recommendations for targeting either male or female entrepreneurs, but access to training or other interventions should certainly be open to both genders. Our results on the question of which sectors are promising are not conclusive. In general, the targeting of specific gender groups and sectors needs to be decided on a case-by-case basis and rely on a detailed analysis of the national context.
The Role of International Trade in Employment Growth in Micro- and Small Enterprises | 19
References A. Bigsten, P. Collier, S. Dercon, M. Fafchamps, B. Gauthier, J.-W. Gunning, M.
Soderbom, A. Oduro, R. Oostendorp, C. Patillo, F. Teal, and A. Zeufack. 2004. Do African Manufacturing Firms Learn from Exporting? Journal of Development Studies. 40(3). pp. 115–141.
———. 2003. Credit Constraints in Manufacturing Enterprises in Africa. Journal of
African Economies. 12(1). pp. 104–125. A.M. Fernandes and A.E. Isgut. 2005. Learning-by-Doing, Learning-by-Exporting, and
Productivity: Evidence from Colombia. Policy Research Working Paper Series. 3544. Washington, DC: The World Bank.
A. Park, D. Yang, X. Shi, and Y. Jiang. 2010. Exporting and Firm Performance: Chinese
Exporters and the Asian Financial Crisis. The Review of Economics and Statistics. 92(4). pp. 822–842.
A.V. Banerjee and A.F. Newman. 1993. Occupational Choice and the Process of
Development. Journal of Political Economy. 101(2). pp. 274–298. B.J. Aitken and A.E. Harrison. 1999. Do Domestic Firms Benefit from Direct Foreign
Investment? Evidence from Venezuela. The American Economic Review. 89(3). pp. 605–618.
C. Baum, E. Schaffer, and S. Stillman. 2003. Instrumental Variables and GMM:
Estimation and Testing. Stata Journal. 3(1). pp. 1–31. C. Liedholm. 2002. Small Firm Dynamics: Evidence from Africa and Latin America.
Small Business Economics. 18(1). pp. 225–240. C. Reinhart and K. Rogoff. 2009. The Aftermath of Financial Crises. American Economic
Review. 99(2). pp. 466–472. C. Udry and S. Anagol. 2006. The Return to Capital in Ghana. American Economic
Review. 96(2). pp. 388–393. D.A. Belsley, E. Kuh, and R.E. Welsch. 1980. Regression Diagnostics. New York: Wiley.
D. Dollar, M. Hallward–Driemeier, and T. Mengistae. 2005. Investment Climate and Firm Performance in Developing Economies. Economic Development and Cultural Change. 54(1). pp. 1–31.
D.S. Evans and B. Jovanovic. 1989. An Estimated Model of Entrepreneurial Choice
under Liquidity Constraints. Journal of Political Economy. 97(4). pp. 808–827.
20 | Working Paper Series on Regional Economic Integration No. 115
D. Karlan and J. Zinman. 2009. Expanding Microenterprise Credit Access: Randomized Supply Decisions to Estimate the Impacts in Manila. Department of Economics Working Paper. 68. New Haven: Yale University.
D.C. Mead and C. Liedholm. 1998. The Dynamics of Micro and Small Enterprises in
Developing Countries. World Development. 26(1). pp. 61–74. D.J. McKenzie and C. Woodruff. 2006. Do Entry Costs Provide an Empirical Basis for
Poverty Traps? Evidence from Mexican Microenterprises. Economic Development and Cultural Change. 55(1). pp. 3–42.
G. Wignaraja. 2012. Engaging Small and Medium Enterprises in Production Networks:
Firm-Level Analysis of Five ASEAN Economies. Asian Development Bank Institute Working Paper. 361. Tokyo: Asian Development Bank Institute (ADBI).
H.P. Binswanger and M.R. Rosenzweig. 1986. Behavioral and Material Determinants of
Production Relations in Agriculture. Journal of Development Studies. 22(3). pp. 503–539.
H.T. Dinh, D. Mavridis, and H. Nguyen. 2010. The Binding Constraint on Firms’ Growth
in Developing Countries. Policy Research Working Paper. 5485. Washington, DC: The World Bank.
H. Görg and D. Greenaway. 2004. Much Ado About Nothing? Do Domestic Firms Really
Benefit from Foreign Direct Investment? The World Bank Research Observer. 19(2). pp. 171–197.
H..Lloyd-Ellis and D..Bernhardt. 2000. Enterprise, Inequality, and Economic
Development. The Review of Economic Studies. 67(1). pp. 147–168. J.P. Lachaud. 1990. The Urban Informal Sector and the Labor Market in Sub-Saharan
Africa. In B. Salomé, A. Schwartz, and D. Turnham, eds. The Informal Sector Revisited. Paris: Organisation for Economic Co-operation and Development (OECD).
J. De Loecker. 2007. Do Exports Generate Higher Productivity? Evidence from Slovenia.
Journal of International Economics. 73(1). pp. 69–98. J.R. Markusen and A. Venables. 1999. Foreign Direct Investment as a Catalyst for
Industrial Development. European Economic Review. 43(2). pp. 335–356. J. McMillan and C. Woodruff. 2002. The Central Role of Entrepreneurs in Transition
Economies. The Journal of Economic Perspectives. 16(3). pp. 153–170. J. Stock, J. Wright, and M. Yogo. 2002. A Survey of Weak Instruments and Weak
Identification in Generalized Method of Moments. Journal of Business and Economic Statistics. 20(4). pp. 518–529.
The Role of International Trade in Employment Growth in Micro- and Small Enterprises | 21
J.R. Tybout. 1983. Credit Rationing and Investment Behavior in a Developing Country. The Review of Economics and Statistics. 65(4). pp. 598–607.
J. Van Biesebroeck. 2005. Exporting Raises Productivity in Sub-Saharan African
Manufacturing Firms. Journal of International Economics. 67(2). pp. 373–391. J. Wagner. 2012. International Trade and Firm Performance: A Survey of Empirical
Studies since 2006. Review of World Economics (Weltwirtschaftliches Archiv). 148(2). pp. 235–267.
K.D. Backer and L. Sleuwaegen. 2003. Does Foreign Direct Investment Crowd Out
Domestic Entrepreneurship? Review of Industrial Organization. 22(1). pp. 67–84. L. Fox and T. Sohnesen. 2012. Household Enterprises in Sub-Saharan Africa: Why They
Matter for Growth, Jobs, and Livelihoods. World Bank Policy Research Working Paper. 6184. Washington, DC: The World Bank.
L. Sleuwaegen and M. Goedhuys. 2002. Growth of Firms in Developing Countries,
Evidence from Côte d’Ivoire. Journal of Development Economics. 68(1). pp. 117–135.
M. Böhme and R. Thiele. 2012. Is the Informal Sector Constrained from the Demand
Side? Evidence for Six West African Capitals. World Development. 40(7). pp. 1369–1381.
M. Fafchamps. 1999. Rural Poverty, Risk, and Development. Oxford University, Center
for the Study of African Economies, Oxford. Report submitted to FAO. M. Fafchamps, D. McKenzie, S.R. Quinn, and C. Woodruff. 2011. When is Capital
Enough to Get Female Microenterprises Growing? Evidence from a Randomized Experiment in Ghana. National Bureau of Economic Research (NBER) Working Paper. 17207. Cambridge, MA: National Bureau of Economic Research.
M. Fafchamps J. and Pender. 1997. Precautionary Saving, Credit Constraints, and
Irreversible Investment: Theory and Evidence from Semiarid India. Journal of Business and Economic Statistics. 15(2). pp. 180–194.
M. Grimm, P. Knorringa, and J. Lay. 2012. Constrained Gazelles: High Potentials in
West Africa’s Informal Economy. World Development. 40(7). pp. 1352–1368. M. Grimm, J. Krüger, and J. Lay. 2011. Barriers to Entry and Returns to Capital in
Informal Activities: Evidence from Sub‐Saharan Africa. Review of Income and Wealth. 57(1). pp. 27–53.
M. Stenkula. 2006. The European Size Distribution of Firms and Employment. Working
Paper Series. 683. Stockholm: Research Institute of Industrial Economics (IFN).
22 | Working Paper Series on Regional Economic Integration No. 115
P. Angelini and A. Generale. 2008. On the Evolution of Firm Size Distributions. The American Economic Review. 98(1). pp. 426–438.
P. Athukorala. 2011. Production Networks and Trade Patterns in East Asia:
Regionalization or Globalization? Asian Economic Papers. 10(1). pp. 65–95. P. Fajnzylber, W.F. Maloney, and G.V.M. Rojas. 2006. Releasing Constraints to Growth
or Pushing on a String? The Impact of Credit, Training, Business Associations, and Taxes on the Performance of Mexican Micro-Firms. Policy Research Working Paper Series. 3807. Washington, DC: The World Bank.
P. Krugman, R.N. Cooper, and T. N. Srinivasan. 1995. Growing World Trade: Causes
and Consequences. Brookings Papers on Economic Activity. 1995(1). Washington, DC: Brookings Institution.
R. Fisman and J. Svensson. 2007. Are Corruption and Taxation Really Harmful to
Growth? Firm Level Evidence. Journal of Development Economics. 83(1). pp. 63–75.
R. Hausman, D. Rodrik, and A. Velasco. 2005. Growth Diagnostics. Mimeo. S.K. Clerides, S. Lach, and J.R. Tybout. 1998. Is Learning by Exporting Important?
Micro-Dynamic Evidence from Colombia, Mexico, and Morocco. The Quarterly Journal of Economics. 113(3). pp. 903–947.
S. Girma, D. Greenaway, and R. Kneller. 2004. Does Exporting Increase Productivity? A
Microeconometric Analysis of Matched Firms. Review of International Economics. 12(5). pp. 855–866.
S. de Mel, D. McKenzie, and C. Woodruff. 2009. Are Women More Credit Constrained?
Experimental Evidence on Gender and Microenterprise Returns. American Economic Journal: Applied Economics. 1(3). pp. 1–32.
S. de Mel, D. McKenzie, and C. Woodruff. 2008. Returns to Capital in Microenterprises:
Evidence from a Field Experiment. The Quarterly Journal of Economics. 123(4). pp. 1329–1372.
S. Nichter and L. Goldmark. 2009. Small Firm Growth in Developing Countries. World
Development. 37(9). pp. 1453–1464. T. Beck, A. Demirgüc-Kunt, and V. Maksimovic. 2005. Financial and Legal Constraints to
Growth: Does Firm Size Matter? The Journal of Finance. 60(1). pp. 137–177. T.F. Cooley and V. Quadrini. 2001. Financial Markets and Firm Dynamics. The American
Economic Review. 91(5). pp. 1286–1310. United Nations Conference on Trade and Development (UNCTAD). UNCTADStat.
The Role of International Trade in Employment Growth in Micro- and Small Enterprises | 23
World Bank. World Development Indicators. http://databank.worldbank.org/ddp/home.do ?Step=12andid=4andCNO=2
X. Diao, J. Rattsø, and H.E. Stokke. 2006. Learning by Exporting and Structural Change:
A Ramsey Growth Model of Thailand. Journal of Policy Modeling. 28(3). pp. 293–306.
Ta
ble
1:
Ge
ne
ral
En
terp
ris
e C
hara
cte
ris
tic
s
Co
un
try
F
irm
siz
e
(fu
ll-tim
e
em
plo
ye
es)
Init
ial
firm
s
ize
(fu
ll-tim
e
em
plo
ye
es)
Ou
tpu
t s
old
d
om
es
tic
all
y (
%)
Ou
tpu
t e
xp
ort
ed
d
irec
tly (
%)
Ou
tpu
t e
xp
ort
ed
in
dir
ec
tly
(%)
Fir
ms
th
at
imp
ort
in
pu
ts a
nd
e
xp
ort
(%
)
Fe
ma
le
ow
ne
r O
wn
er
wit
h
co
lle
ge
d
eg
ree
(%)
Fir
m a
ge
(ye
ars
)
Fo
reig
n
ow
ne
rsh
ip
(%)
Ph
ilip
pin
es
me
an
78
.72
58
.16
80
.94%
1
3.6
7%
5
.40
%
15
.75%
2
9.2
0%
8
9.2
0%
1
7.5
7
18
.52%
N
1
13
0
11
30
11
30
11
30
11
30
11
30
11
30
11
30
11
30
11
30
Ind
one
sia
m
ea
n
88
.86
51
.99
91
.04%
6
.89
%
2.0
8%
7
.16
%
25
.84%
3
2.7
1%
1
6.6
13
38
5.8
2%
N
1
07
6
10
76
10
76
10
76
10
76
10
76
10
76
10
76
10
76
10
70
Vie
t N
am
m
ea
n
14
3.1
0
10
9.5
9
71
.68%
1
9.9
6%
8
.36
%
23
.05%
2
1.6
1%
6
6.4
3%
1
0.2
7
13
.26%
N
6
94
69
4
69
4
69
4
69
4
69
4
69
4
69
4
69
4
69
4
Th
aila
nd
me
an
16
1.3
4
71
.94
73
.29%
2
3.8
1%
2
.90
%
29
.71%
3
3.0
9%
6
9.2
6%
1
4.0
2
21
.31%
N
9
76
97
6
97
6
97
6
97
6
97
6
97
6
97
6
97
6
61
9
Ma
laysia
m
ea
n
12
9.5
4
48
.84
66
.46%
2
8.8
2%
4
.72
%
36
.53%
8
.82
%
43
.51%
1
8.9
8
21
.47%
N
1
03
2
10
32
10
32
10
32
10
32
10
32
10
32
10
32
10
32
10
31
La
o P
DR
m
ea
n
64
.04
44
.46
80
.94%
9
.17
%
9.8
9%
9
.69
%
37
.89%
4
2.7
4%
1
0.8
6
14
.20%
N
3
51
35
1
35
1
35
1
35
1
35
1
35
1
35
1
35
1
35
0
To
tal
me
an
11
3.6
2
63
.50
77
.52%
1
7.6
7%
4
.81
%
21
.22%
2
4.8
1%
5
8.8
7%
1
5.5
8
15
.66%
N
5
25
9
52
59
52
59
52
59
52
59
52
59
52
59
52
59
52
59
48
94
Note
: T
o c
orr
ect fo
r outlie
rs w
e e
xclu
ded t
he t
op 2
% o
f firm
s t
hat show
ed t
he la
rgest
incre
ase in
full-t
ime e
mplo
yees.
Sourc
e: A
uth
or’s c
om
puta
tio
ns b
ased o
n W
BE
S.
24 | Working Paper Series on Regional Economic Integration No. 115
The Role of International Trade in Employment Growth in Micro- and Small Enterprises | 25
Table 2: Employment Growth in Developing Asia
Country Average annual
growth rate (simple averages)
Average annual growth rate
(compounded)
Average no. of added workers per enterprise per year
Philippines mean 18.80% 5.77% 0.78
median 3.52% 2.58% 0.36
N 1130 1130 1130
Indonesia mean 19.17% 8.77% 2.43
median 6.10% 4.14% 0.33
N 1076 1076 1076
Viet Nam mean 30.42% 11.85% 6.27
median 6.67% 5.20% 1.97
N 694 694 694
Thailand mean 51.92% 18.13% 9.76
median 20.00% 9.46% 4.27
N 976 976 976
Malaysia mean 28.72% 8.24% 5.11
median 10.61% 5.89% 1.76
N 1032 1032 1032
Lao PDR mean 23.80% 7.97% 1.40
median 5.56% 4.01% 0.37
N 351 351 351
Total mean 28.84% 10.11% 4.40
median 8.00% 5.14% 1.10
N 5259 5259 5259
Notes: 1. Average annual growth rate (simple averages) is defined as ⁄ 2. Average annual growth rate (compound) is defined as
[(( )⁄( ))^( ⁄( )) ]-1
Source: Author’s computations based on WBES.
26 | Working Paper Series on Regional Economic Integration No. 115
Table 3: Employment Growth by Initial Size Quintiles
Quintile of initial size distribution
Average annual growth rate
(simple averages)
Average annual growth rate
(compounded)
Jobs created (absolute)
Percentage of jobs created
First 62.70% 20.58% 40,773 15.47%
Second 28.85% 11.49% 36,385 13.80%
Third 21.08% 7.61% 51,267 19.45%
Fourth 15.35% 6.26% 78,299 29.71%
Fifth 5.53% 1.46% 56,852 21.57%
Total 28.84% 10.11% 263,576 100.00%
Notes: 1. Average annual growth rate (simple averages) is defined as ⁄ 2. Average annual growth rate (compound) is defined as [(( )⁄( ))^( ⁄( )) ]-1 Quintiles computed by country. Source: Author’s computations based on WBES.
Ta
ble
4:
Th
e R
ole
of
Tra
de f
or
Em
plo
ym
en
t G
row
th—
OL
S E
sti
ma
tes
(1
) (2
) (3
) (4
) (5
) (6
) (7
)
Me
tho
do
log
y
OL
S
OL
S
OL
S
OL
S
OL
S
IV
OL
S
Exp
ort
in
ten
sity
0.0
110
**
0.0
211
***
0
.01
85
***
0.0
31
3**
*
0
.063
8
0
.018
7
(0
.00
53
) (0
.00
54
)
(0.0
041
)
(0.0
09
3)
(0.1
089
)
(0.0
177
)
Tra
de
du
mm
y
0
.030
2**
*
(0
.00
47
)
Siz
e a
t fo
un
dation
-0.0
002
***
-0
.000
2**
* -0
.00
01
***
-
0.0
00
1**
*
-0
.00
01
***
-
0.0
001
***
(0.0
000
) (
0.0
000
)
(0.0
000
)
(0.0
00
0)
(0.0
000
)
(0.0
000
)
fore
ign
ow
ne
rship
, %
0.0
002
***
0
.000
2**
0
.00
02
***
0.0
00
1
0.0
00
2
0
.000
2
(0.0
001
) (
0.0
001
)
(0.0
000
)
(0.0
00
1)
(0.0
002
)
(0
.00
02
)
Colle
ge
0
.01
49
***
0
.012
7**
0
.01
12
***
0.0
11
7**
0
.038
7*
0
.037
1*
(0.0
039
) (
0.0
039
)
(0.0
031
)
(0.0
05
9)
(0.0
205
)
(0
.02
04
)
Fir
m a
ge
-0
.00
25
***
-0
.00
25
***
-0.0
019
***
-
0.0
01
9**
*
-0
.00
17
**
-
0.0
020
***
(0.0
002
) (0
.00
01
)
(0.0
001
)
(0.0
00
2)
(0.0
008
)
(0.0
006
)
Fe
male
GM
-0.0
036
-0
.00
26
-0.0
025
0.0
04
1
-
0.0
362
**
-0
.03
44
**
(0.0
042
) (0
.00
42
)
(0.0
032
)
(0.0
05
5)
(0.0
150
)
(0
.014
4)
Con
sta
nt
0.0
752
***
0.1
092
***
0
.108
3**
* 0
.08
88
***
0.0
75
2**
*
0
.045
8
0.0
66
8*
(0
.00
82
) (0
.00
83
) (0
.00
82
)
(0.0
060
)
(0.0
09
8)
(0.0
725
)
(0.0
37
0)
Cou
ntr
y d
um
mie
s
ye
s
ye
s
ye
s
ye
s
ye
s
ye
s
ye
s
Se
cto
r d
um
mie
s
ye
s
ye
s
ye
s
ye
s
ye
s
ye
s
ye
s
Te
st
for
und
er
ide
ntifica
tio
n (
p-v
alu
e)
0
.00
18
Te
st
for
we
ak id
en
tifica
tio
n (
F s
tatistic)
6
.81
40
N
53
27
49
33
49
30
48
43
26
79
30
8
30
8
Ad
juste
d R
-sq
ua
red
0.0
506
0.1
404
0.1
442
0.1
634
0.0
77
4
0
.13
68
0.1
505
N
ote
s:
1.
Robust sta
ndard
err
ors
in
pare
nth
eses.
2.
p<
0.1
0,
**p<
0.0
5, **
* p
<0.0
1.
3.
In a
ll re
gre
ssio
ns, w
e d
rop in
flu
entia
l outlie
rs fro
m o
ur
sam
ple
that
we id
entify
by t
he D
FIT
S-s
tatistic. A
s s
uggeste
d b
y B
els
ley e
t al. (
1980),
we u
se a
cuto
ff-v
alu
e
| |
√
⁄
with k
, th
e d
egre
es o
f fr
eedom
(plu
s 1
) and N
, th
e n
um
ber
of
observ
atio
ns. E
xport
in
tensity: sale
s/e
xport
s. In
str
um
ent
used: ln
of
weig
hte
d e
xchange r
ate
shock o
f th
e t
wo m
ost im
port
ant
expo
rt d
estin
atio
ns.
Sourc
e:
UN
CT
AD
(2013)
and W
orld
Bank (
2013)
for
exchange r
ate
and C
PI data
, and a
uth
or’s c
om
puta
tio
ns b
ased o
n
WB
ES
.
The Role of International Trade in Employment Growth in Micro- and Small Enterprises | 27
Ta
ble
5:
Ch
ara
cte
ris
tics
of
To
p P
erf
orm
ers
Part
icip
ati
ng
in
in
tern
ati
on
al
trad
e
(%)
Init
ial fi
rm
siz
e
% F
irm
s s
tart
ed
w
as M
SE
(f
ew
er
than
5 e
mplo
ye
es)
Fir
m a
ge
G
M
exp
ert
ise
Ow
ner
has
co
lleg
e
deg
ree
(%
)
Fem
ale
G
M (
%)
Fo
reig
n
ow
ners
hip
(%
)
Top p
erf
orm
ers
m
ean
25.5
0%
22.5
5
27.3
2%
8.4
7
11.0
4
59.9
8%
25.4
1%
20.7
6%
m
edia
n
0
10
0
7
9
1
0
0
N
1047
1047
1047
1047
1015
1047
1047
974
Rem
ain
ing
firm
s
mean
20.1
6%
73.6
8
9.4
5%
17.3
5
14.2
7
58.5
9%
24.6
7%
14.4
0%
m
edia
n
0
20
0
15
12
1
0
0
N
4212
4212
4212
4212
4101
4212
4212
3920
T test re
su
lt
**
* **
* **
* **
* **
*
**
*
Tota
l M
ean
21.2
2%
63.5
0
13.0
1%
15.5
8
13.6
3
58.8
7%
24.8
1%
15.6
6%
M
ed
ian
0
20
0
13
11
1
0
0
N
5259
5259
5259
5259
5116
5259
5259
4894
Note
: *
p<
0.1
0, **
p<
0.0
5,
***
p<
0.0
1 o
f T
test assum
ing u
nequal variances b
etw
een g
roups t
estin
g h
ypoth
esis
that th
e g
roup m
eans a
re e
qual.
Sourc
e: A
uth
or’s c
om
puta
tio
ns b
ased o
n W
BE
S.
28 | Working Paper Series on Regional Economic Integration No. 115
The Role of International Trade in Employment Growth in Micro- and Small Enterprises | 29
Table 6: Probit Estimates—Dependent Variable: Being a Top Performer
(1) (2)
Probit Marginal Effects
Participation in international trade 0.4325*** 0.0941***
(0.0688) (0.0147)
Firm size at foundation -0.0072*** -0.0016***
(0.0011) (0.0008)
Firms age -0.0917*** -0.0200***
(0.0045) (0.0008)
GM expertise 0.0028 0.0006
(0.0030) (0.0006)
Owner has college degree 0.2426*** 0.0528***
(0.0600) (0.0129)
Female GM -0.0701 -0.0152
(0.0569) (0.0124)
% of foreign ownership 0.0021*** 0.0004**
(0.0008) (0.0002)
Constant 0.5227***
(0.1007)
Country dummies yes yes
Sector dummies yes yes
N 4751 4751
Pseudo R-Squared 0.2261
Note: Robust standard errors in parentheses. Source: Author’s computations based on WBES.
Ta
ble
7:
To
p P
erf
orm
ers
by S
ecto
r
In
do
nesia
, P
hilip
pin
es, an
d V
iet
Nam
M
ala
ysia
an
d T
hailan
d
Ran
k
Secto
r %
of
top
perf
orm
ers
S
ecto
r %
of
top
perf
orm
ers
1
Garm
ents
14.7
0
Rubb
er
23.4
4
2
Food p
rocessin
g
14.5
3
Ele
ctr
onic
s
13.4
0
3
Non m
eta
llic m
inera
l pro
du
cts
11.6
6
Food p
rocessin
g
12.9
2
4
Textile
s
10.6
4
Furn
iture
11.9
6
5
Oth
er
manufa
ctu
ring
9.9
7
Garm
ents
9.8
1
6
Rubb
er
9.1
2
Auto
mobile
and p
art
s
9.5
7
7
Chem
icals
8.4
5
Machin
ery
7.1
8
8
Ele
ctr
ical m
achin
ery
and a
ppara
tus
6.2
5
Textile
s
6.2
2
9
Reta
il 4.7
3
Chem
icals
3.5
9
10
F
abricate
d m
eta
l pro
ducts
4.5
6
Wood a
nd w
ood p
rod
ucts
1.2
0
11
IT
1.1
8
Off
ice a
ccounting a
nd
com
putin
g m
achin
e
0.7
2
12
M
achin
ery
1.0
1
13
B
asic
meta
ls
0.8
4
14
T
ransport
0.8
4
15
C
onstr
uction
0.6
8
16
W
hole
sale
0.5
1
17
S
erv
ices o
f m
oto
r vehic
les
0.1
7
18
H
ote
l an
d r
esta
ura
nts
0.1
7
Tota
l
100.0
0
100.0
0
Sourc
e: A
uth
or’s c
om
puta
tio
ns b
ased o
n W
BE
S.
30 | Working Paper Series on Regional Economic Integration No. 115
The Role of International Trade in Employment Growth in Micro- and Small Enterprises | 31
Appendix
Table A1: First Stage Estimation Results
Dependent Variable: Export intensity
Exchange rate shock -0.684**
(0.262)
Size at foundation 0.000
(0.000)
Foreign ownership, % 0.001
(0.000)
College -0.049
(0.057)
Firm age -0.005*
(0.002)
Female GM 0.043
(0.041)
Constant 0.622***
(0.097)
Country dummies yes
Sector dummies yes
R-squared 0.196
N 308
Note: * p<0.05, ** p<0.01, *** p<0.001.
Source: Author’s computations based on WBES.
32 | Working Paper Series on Regional Economic Integration No. 115
ADB Working Paper Series on Regional Economic Integration*
1. ―The ASEAN Economic Community and the European Experience‖ by
Michael G. Plummer
2. ―Economic Integration in East Asia: Trends, Prospects, and a Possible Roadmap‖ by Pradumna B. Rana
3. ―Central Asia after Fifteen Years of Transition: Growth, Regional Cooperation, and Policy Choices‖ by Malcolm Dowling and Ganeshan Wignaraja
4. ―Global Imbalances and the Asian Economies: Implications for Regional Cooperation‖ by Barry Eichengreen
5. ―Toward Win-Win Regionalism in Asia: Issues and Challenges in Forming Efficient Trade Agreements‖ by Michael G. Plummer
6. ―Liberalizing Cross-Border Capital Flows: How Effective Are Institutional Arrangements against Crisis in Southeast Asia‖ by Alfred Steinherr, Alessandro Cisotta, Erik Klär, and Kenan Šehović
7. ―Managing the Noodle Bowl: The Fragility of East Asian Regionalism‖ by Richard E. Baldwin
8. ―Measuring Regional Market Integration in Developing Asia: A Dynamic Factor Error Correction Model (DF-ECM) Approach‖ by Duo Qin, Marie Anne Cagas, Geoffrey Ducanes, Nedelyn Magtibay-Ramos, and Pilipinas F. Quising
9. ―The Post-Crisis Sequencing of Economic Integration in Asia: Trade as a Complement to a Monetary Future‖ by Michael G. Plummer and Ganeshan Wignaraja
10. ―Trade Intensity and Business Cycle Synchronization: The Case of East Asia‖ by Pradumna B. Rana
11. ―Inequality and Growth Revisited‖ by Robert J. Barro
12. ―Securitization in East Asia‖ by Paul Lejot, Douglas Arner, and Lotte Schou-Zibell
The Role of International Trade in Employment Growth in Micro- and Small Enterprises | 33
13. ―Patterns and Determinants of Cross-border Financial Asset Holdings in East Asia‖ by Jong-Wha Lee
14. ―Regionalism as an Engine of Multilateralism: A Case for a Single East Asian FTA‖ by Masahiro Kawai and Ganeshan Wignaraja
15. ―The Impact of Capital Inflows on Emerging East Asian Economies: Is Too Much Money Chasing Too Little Good?‖ by Soyoung Kim and Doo Yong Yang
16. ―Emerging East Asian Banking Systems Ten Years after the 1997/98 Crisis‖ by Charles Adams
17. ―Real and Financial Integration in East Asia‖ by Soyoung Kim and Jong-Wha Lee
18. ―Global Financial Turmoil: Impact and Challenges for Asia’s Financial Systems‖ by Jong-Wha Lee and Cyn-Young Park
19. ―Cambodia’s Persistent Dollarization: Causes and Policy Options‖ by Jayant Menon
20. ―Welfare Implications of International Financial Integration‖ by Jong-Wha Lee and Kwanho Shin
21. ―Is the ASEAN-Korea Free Trade Area (AKFTA) an Optimal Free Trade Area?‖ by Donghyun Park, Innwon Park, and Gemma Esther B. Estrada
22. ―India’s Bond Market—Developments and Challenges Ahead‖ by Stephen Wells and Lotte Schou- Zibell
23. ―Commodity Prices and Monetary Policy in Emerging East Asia‖ by Hsiao Chink Tang
24. ―Does Trade Integration Contribute to Peace?‖ by Jong-Wha Lee and Ju Hyun Pyun
25. ―Aging in Asia: Trends, Impacts, and Responses‖ by Jayant Menon and Anna Melendez-Nakamura
26. ―Re-considering Asian Financial Regionalism in the 1990s‖ by Shintaro Hamanaka
34 | Working Paper Series on Regional Economic Integration No. 115
27. ―Managing Success in Viet Nam: Macroeconomic Consequences of Large Capital Inflows with Limited Policy Tools‖ by Jayant Menon
28. ―The Building Block versus Stumbling Block Debate of Regionalism: From the Perspective of Service Trade Liberalization in Asia‖ by Shintaro Hamanaka
29. ―East Asian and European Economic Integration: A Comparative Analysis‖ by Giovanni Capannelli and Carlo Filippini
30. ―Promoting Trade and Investment in India’s Northeastern Region‖ by M. Govinda Rao
31. ―Emerging Asia: Decoupling or Recoupling‖ by Soyoung Kim, Jong-Wha Lee, and Cyn-Young Park
32. ―India’s Role in South Asia Trade and Investment Integration‖ by Rajiv Kumar and Manjeeta Singh
33. ―Developing Indicators for Regional Economic Integration and Cooperation‖ by Giovanni Capannelli, Jong-Wha Lee, and Peter Petri
34. ―Beyond the Crisis: Financial Regulatory Reform in Emerging Asia‖ by Chee Sung Lee and Cyn-Young Park
35. ―Regional Economic Impacts of Cross-Border Infrastructure: A General Equilibrium Application to Thailand and Lao People’s Democratic Republic‖ by Peter Warr, Jayant Menon, and Arief Anshory Yusuf
36. ―Exchange Rate Regimes in the Asia-Pacific Region and the Global Financial Crisis‖ by Warwick J. McKibbin and Waranya Pim Chanthapun
37. ―Roads for Asian Integration: Measuring ADB's Contribution to the Asian Highway Network‖ by Srinivasa Madhur, Ganeshan Wignaraja, and Peter Darjes
38. ―The Financial Crisis and Money Markets in Emerging Asia‖ by Robert Rigg and Lotte Schou-Zibell
39. ―Complements or Substitutes? Preferential and Multilateral Trade Liberalization at the Sectoral Level‖ by Mitsuyo Ando, Antoni Estevadeordal, and Christian Volpe Martincus
The Role of International Trade in Employment Growth in Micro- and Small Enterprises | 35
40. ―Regulatory Reforms for Improving the Business Environment in Selected Asian Economies—How Monitoring and Comparative Benchmarking can Provide Incentive for Reform‖ by Lotte Schou-Zibell and Srinivasa Madhur
41. ―Global Production Sharing, Trade Patterns, and Determinants of Trade Flows in East Asia‖ by Prema-chandra Athukorala and Jayant Menon
42. ―Regionalism Cycle in Asia (-Pacific): A Game Theory Approach to the Rise and Fall of Asian Regional Institutions‖ by Shintaro Hamanaka
43. ―A Macroprudential Framework for Monitoring and Examining Financial Soundness‖ by Lotte Schou-Zibell, Jose Ramon Albert, and Lei Lei Song
44. ―A Macroprudential Framework for the Early Detection of Banking Problems in Emerging Economies‖ by Claudio Loser, Miguel Kiguel, and David Mermelstein
45. ―The 2008 Financial Crisis and Potential Output in Asia: Impact and Policy Implications‖ by Cyn-Young Park, Ruperto Majuca, and Josef Yap
46. ―Do Hub-and-Spoke Free Trade Agreements Increase Trade? A Panel Data Analysis‖ by Jung Hur, Joseph Alba, and Donghyun Park
47. ―Does a Leapfrogging Growth Strategy Raise Growth Rate? Some International Evidence‖ by Zhi Wang, Shang-Jin Wei, and Anna Wong
48. ―Crises in Asia: Recovery and Policy Responses‖ by Kiseok Hong and Hsiao Chink Tang
49. ―A New Multi-Dimensional Framework for Analyzing Regional Integration: Regional Integration Evaluation (RIE) Methodology‖ by Donghyun Park and Mario Arturo Ruiz Estrada
50. ―Regional Surveillance for East Asia: How Can It Be Designed to Complement Global Surveillance?‖ by Shinji Takagi
51. ―Poverty Impacts of Government Expenditure from Natural Resource Revenues‖ by Peter Warr, Jayant Menon, and Arief Anshory Yusuf
52. ―Methods for Ex Ante Economic Evaluation of Free Trade Agreements‖ by David Cheong
36 | Working Paper Series on Regional Economic Integration No. 115
53. ―The Role of Membership Rules in Regional Organizations‖ by Judith Kelley
54. ―The Political Economy of Regional Cooperation in South Asia‖ by V.V. Desai
55. ―Trade Facilitation Measures under Free Trade Agreements: Are They Discriminatory against Non-Members?‖ by Shintaro Hamanaka, Aiken Tafgar, and Dorothea Lazaro
56. ―Production Networks and Trade Patterns in East Asia: Regionalization or Globalization?‖ by Prema-chandra Athukorala
57. ―Global Financial Regulatory Reforms: Implications for Developing Asia‖ by Douglas W. Arner and Cyn-Young Park
58. ―Asia’s Contribution to Global Rebalancing‖ by Charles Adams, Hoe Yun Jeong, and Cyn-Young Park
59. ―Methods for Ex Post Economic Evaluation of Free Trade Agreements‖ by David Cheong
60. ―Responding to the Global Financial and Economic Crisis: Meeting the Challenges in Asia‖ by Douglas W. Arner and Lotte Schou-Zibell
61. ―Shaping New Regionalism in the Pacific Islands: Back to the Future?‖ by Satish Chand
62. ―Organizing the Wider East Asia Region‖ by Christopher M. Dent
63. ―Labour and Grassroots Civic Interests In Regional Institutions‖ by Helen E.S. Nesadurai
64. ―Institutional Design of Regional Integration: Balancing Delegation and Representation‖ by Simon Hix
65. ―Regional Judicial Institutions and Economic Cooperation: Lessons for Asia?‖ by Erik Voeten
66. ―The Awakening Chinese Economy: Macro and Terms of Trade Impacts on 10 Major Asia-Pacific Countries‖ by Yin Hua Mai, Philip Adams, Peter Dixon, and Jayant Menon
The Role of International Trade in Employment Growth in Micro- and Small Enterprises | 37
67. ―Institutional Parameters of a Region-Wide Economic Agreement in Asia: Examination of Trans-Pacific Partnership and ASEAN+α Free Trade Agreement Approaches‖ by Shintaro Hamanaka
68. ―Evolving Asian Power Balances and Alternate Conceptions for Building Regional Institutions‖ by Yong Wang
69. ―ASEAN Economic Integration: Features, Fulfillments, Failures, and the Future‖ by Hal Hill and Jayant Menon
70. ―Changing Impact of Fiscal Policy on Selected ASEAN Countries‖ by Hsiao Chink Tang, Philip Liu, and Eddie C. Cheung
71. ―The Organizational Architecture of the Asia-Pacific: Insights from the New Institutionalism‖ by Stephan Haggard
72. ―The Impact of Monetary Policy on Financial Markets in Small Open Economies: More or Less Effective During the Global Financial Crisis?‖ by Steven Pennings, Arief Ramayandi, and Hsiao Chink Tang
73. ―What do Asian Countries Want the Seat at the High Table for? G20 as a New Global Economic Governance Forum and the Role of Asia‖ by Yoon Je Cho
74. ―Asia’s Strategic Participation in the Group of 20 for Global Economic Governance Reform: From the Perspective of International Trade‖ by Taeho Bark and Moonsung Kang
75. ―ASEAN’s Free Trade Agreements with the People’s Republic of China, Japan, and the Republic of Korea: A Qualitative and Quantitative Analysis‖ by Gemma Estrada, Donghyun Park, Innwon Park, and Soonchan Park
76. ―ASEAN-5 Macroeconomic Forecasting Using a GVAR Model‖ by Fei Han and Thiam Hee Ng
77. ―Early Warning Systems in the Republic of Korea: Experiences, Lessons, and Future Steps‖ by Hyungmin Jung and Hoe Yun Jeong
78. ―Trade and Investment in the Greater Mekong Subregion: Remaining Challenges and the Unfinished Policy Agenda‖ by Jayant Menon and Anna Cassandra Melendez
38 | Working Paper Series on Regional Economic Integration No. 115
79. ―Financial Integration in Emerging Asia: Challenges and Prospects‖ by Cyn-Young Park and Jong-Wha Lee
80. ―Sequencing Regionalism: Theory, European Practice, and Lessons for Asia‖ by Richard E. Baldwin
81. ―Economic Crises and Institutions for Regional Economic Cooperation‖ by C. Randall Henning
82. ―Asian Regional Institutions and the Possibilities for Socializing the Behavior of States‖ by Amitav Acharya
83. ―The People’s Republic of China and India: Commercial Policies in the Giants‖ by Ganeshan Wignaraja
84. ―What Drives Different Types of Capital Flows and Their Volatilities?‖ by Rogelio Mercado and Cyn-Young Park
85. ―Institution Building for Africal Regionalism‖ by Gilbert M. Khadiagala
86. ―Impediments to Growth of the Garment and Food Industries in Cambodia: Exploring Potential Benefits of the ASEAN-PRC FTA‖ by Vannarith Chheang and Shintaro Hamanaka
87. ―The Role of the People’s Republic of China in International Fragmentation and Production Networks: An Empirical Investigation‖ by Hyun-Hoon Lee, Donghyun Park, and Jing Wang
88. ―Utilizing the Multiple Mirror Technique to Assess the Quality of Cambodian Trade Statistics‖ by Shintaro Hamanaka
89. ―Is Technical Assistance under Free Trade Agreements WTO-Plus?‖ A Review of Japan–ASEAN Economic Partnership Agreements‖ by Shintaro Hamanaka
90. ―Intra-Asia Exchange Rate Volatility and Intra-Asia Trade: Evidence by Type of Goods‖ by Hsiao Chink Tang
91. ―Is Trade in Asia Really Integrating?‖ by Shintaro Hamanaka
The Role of International Trade in Employment Growth in Micro- and Small Enterprises | 39
92. ―The PRC's Free Trade Agreements with ASEAN, Japan, and the Republic of Korea: A Comparative Analysis‖ by Gemma Estrada, Donghyun Park, Innwon Park, and Soonchan Park
93. ―Assessing the Resilience of ASEAN Banking Systems: The Case of the Philippines‖ by Jose Ramon Albert and Thiam Hee Ng
94. ―Strengthening the Financial System and Mobilizing Savings to Support More Balanced Growth in ASEAN+3" by A. Noy Siackhachanh
95. ‖Measuring Commodity-Level Trade Costs in Asia: The Basis for Effective Trade Facilitation Policies in the Region‖ by Shintaro Hamanaka and Romana Domingo
96. ―Why do Imports Fall More than Exports Especially During Crises? Evidence from Selected Asian Economies‖ by Hsiao Chink Tang
97. ―Determinants of Local Currency Bonds and Foreign Holdings: Implications for Bond Market Development in the People’s Republic of China‖ by Kee-Hong Bae
98. ―ASEAN–China Free Trade Area and the Competitiveness of Local Industries: A Case Study of Major Industries in the Lao People’s Democratic Republic‖ by Leebeer Leebouapao, Sthabandith Insisienmay, and Vanthana Nolintha
99. ―The Impact of ACFTA on People's Republic of China-ASEAN Trade: Estimates Based on an Extended Gravity Model for Component Trade‖ by Yu Sheng, Hsiao Chink Tang, and Xinpeng Xu
100. ―Narrowing the Development Divide in ASEAN: The Role of Policy‖ by Jayant Menon
101. ―Different Types of Firms, Products, and Directions of Trade: The Case of the People’s Republic of China‖ by Hyun-Hoon Lee, Donghyun Park, and Jing Wang
102. ―Anatomy of South–South FTAs in Asia: Comparisons with Africa, Latin America, and the Pacific Islands‖ by Shintaro Hamanaka
103. ―Japan's Education Services Imports: Branch Campus or Subsidiary Campus?‖ by Shintaro Hamanaka
40 | Working Paper Series on Regional Economic Integration No. 115
104. ―A New Regime of SME Finance in Emerging Asia: Empowering Growth-Oriented SMEs to Build Resilient National Economies‖ by Shigehiro Shinozaki
105. ―Critical Review of East Asia – South America Trade ‖ by Shintaro Hamanaka and Aiken Tafgar
106. ―The Threat of Financial Contagion to Emerging Asia’s Local Bond Markets: Spillovers from Global Crises‖ by Iwan J. Azis, Sabyasachi Mitra, Anthony Baluga, and Roselle Dime
107. ―Hot Money Flows, Commodity Price Cycles, and Financial Repression in the US and the People’s Republic of China: The Consequences of Near Zero US Interest Rates‖ by Ronald McKinnon and Zhao Liu
108. ―Cross-Regional Comparison of Trade Integration: The Case of Services‖ by Shintaro Hamanaka
109. ―Preferential and Non-Preferential Approaches to Trade Liberalization in East Asia: What Differences Do Utilization Rates and Reciprocity Make?‖ by Jayant Menon
110. ―Can Global Value Chains Effectively Serve Regional Economic Development in Asia?‖ by Hans-Peter Brunner
111. ―Exporting and Innovation: Theory and Firm-Level Evidence from the People’s Republic of China‖ by Faqin Lin and Hsiao Chink Tang
112. ―Supporting the Growth and Spread of International Production Networks
in Asia: How Can Trade Policy Help?” by Jayant Menon
113. ―On the Use of FTAs: A Review of Research Methodologies‖ by Shintaro Hamanaka
114. ―The People’s Republic of China’s Financial Policy and Regional Cooperation in the Midst of Global Headwinds‖ by Iwan J. Azis
*These papers can be downloaded from (ARIC) http://aric.adb.org/archives.php? section=0&subsection=workingpapers or (ADB) http://www.adb.org/publications/series/ regional-economic-integration-working-papers
The Role of International Trade in Employment Growth in Micro- and Small Enterprises Evidence from Developing Asia
This paper examines the role of international trade in employment growth, focusing on micro- and small enterprises in six Southeast Asian countries. The author finds that participation in international trade boosts firm-level growth by 3% per year on average, after controlling for firm and individual characteristics as well as country and sector dummies.
About the Asian Development Bank
ADB’s vision is an Asia and Pacific region free of poverty. Its mission is to help its developing member countries reduce poverty and improve the quality of life of their people. Despite the region’s many successes, it remains home to two-thirds of the world’s poor: 1.7 billion people who live on less than $2 a day, with 828 million struggling on less than $1.25 a day. ADB is committed to reducing poverty through inclusive economic growth, environmentally sustainable growth, and regional integration.
Based in Manila, ADB is owned by 67 members, including 48 from the region. Its main instruments for helping its developing member countries are policy dialogue, loans, equity investments, guarantees, grants, and technical assistance.
Asian Development Bank6 ADB Avenue, Mandaluyong City1550 Metro Manila, Philippineswww.adb.org/povertyPublication Stock No. WPS135858 Printed in the Philippines


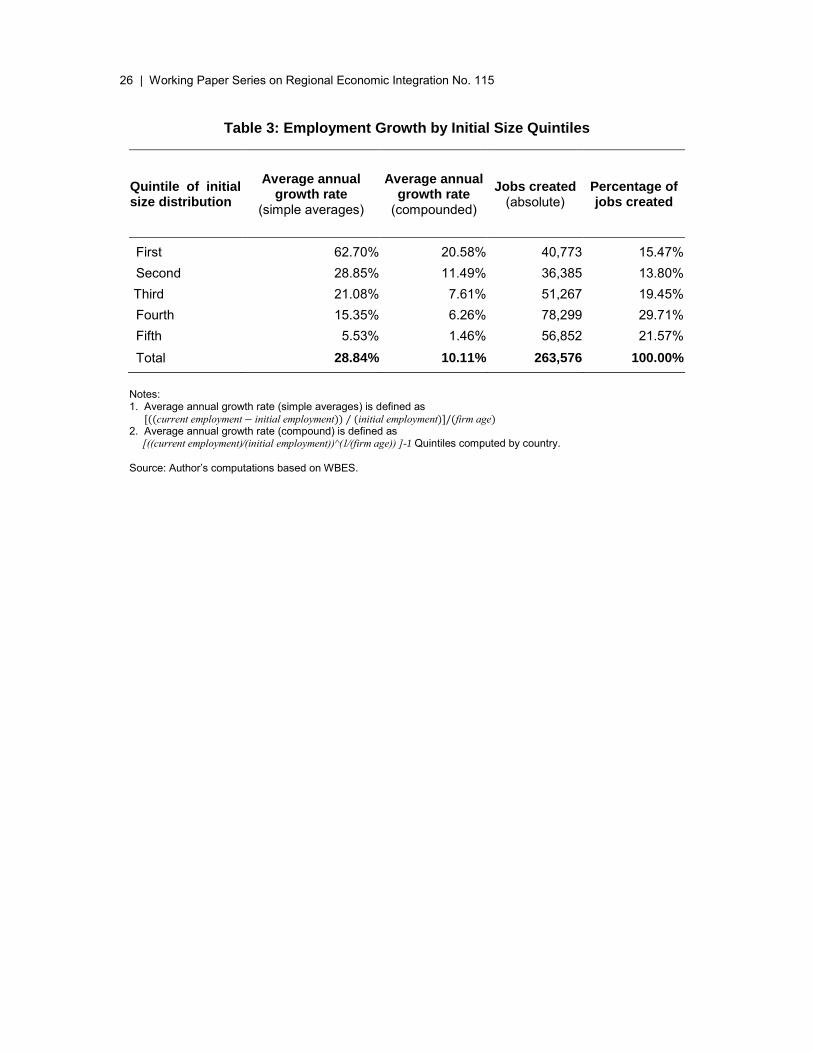
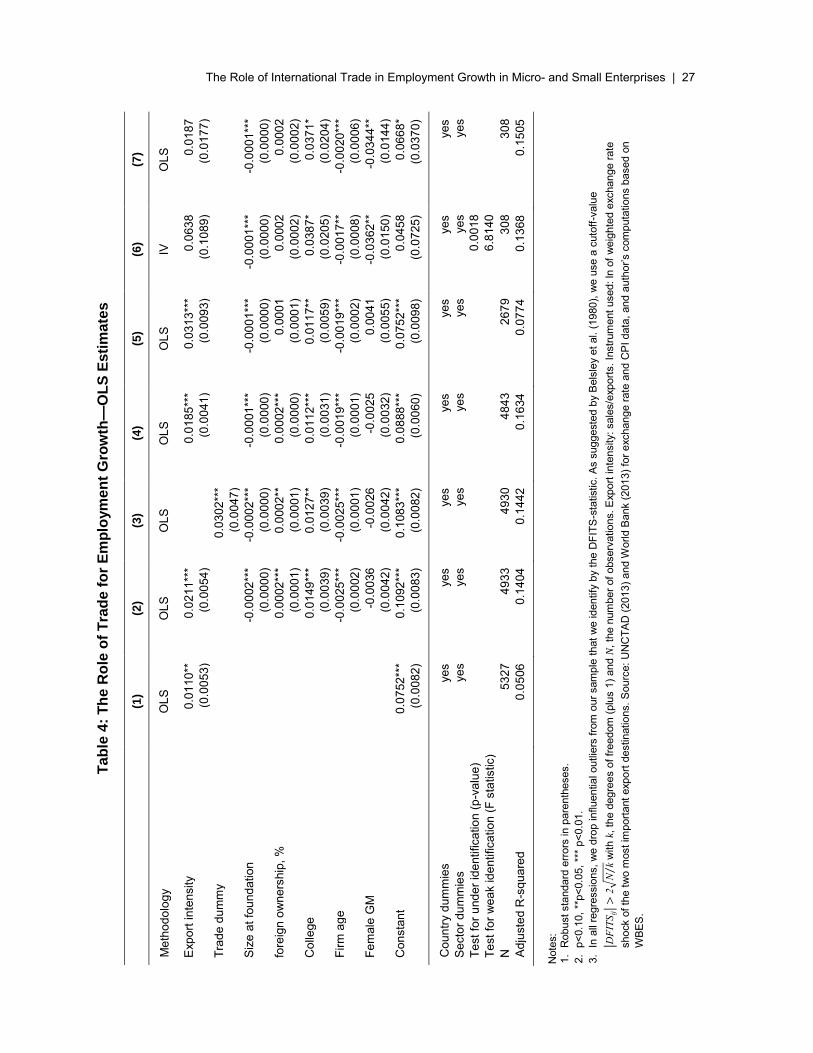


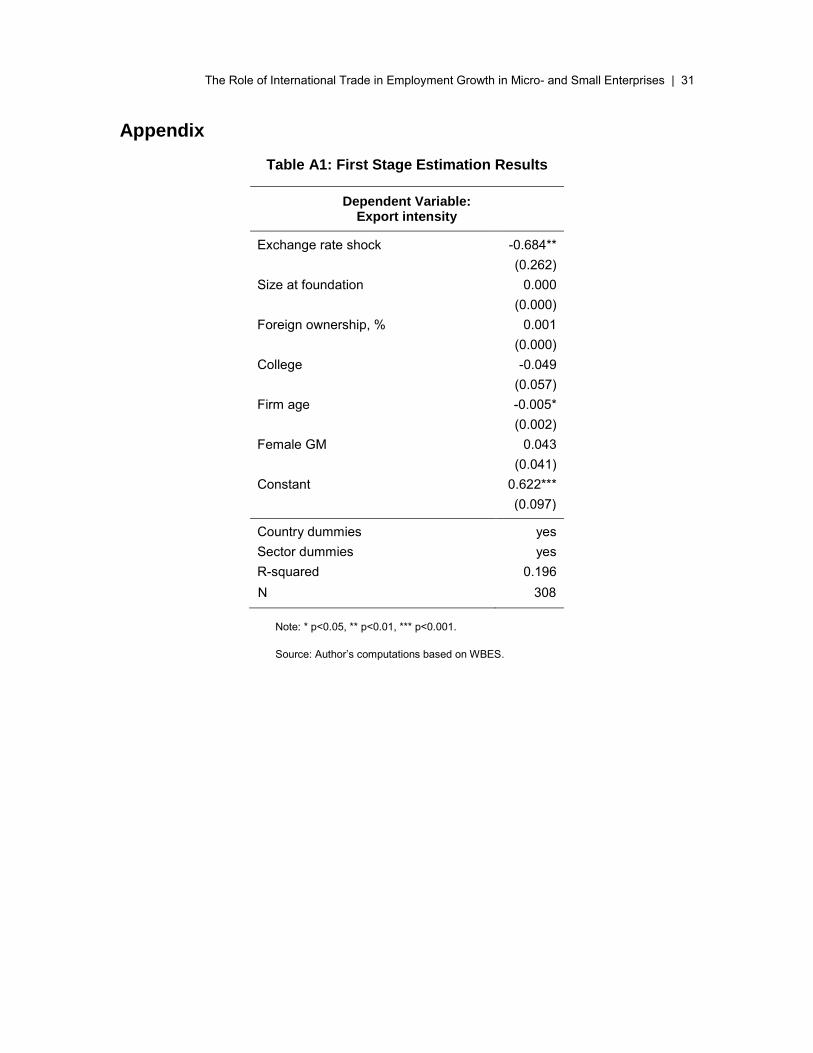


![Embedded Computing for IoT Using Simple Projects · things, internet of the future and intelligent cities [1] [7] [8]. IoT began to gain importance in the second half of the year](https://static.unterlagen.site/doc/80x56/5ec606cf05cd871bb730b527/embedded-computing-for-iot-using-simple-projects-things-internet-of-the-future.jpg)


