124
The DEBORA-Project: Development of Borehole Seals für High-Level Radioactive Waste - Phase II Final Report GRS - 161 Gesellschaft für Anlagen- und Reaktorsicherheit (GRS) mbH
The DEBORA-Project: Development of Borehole Seals für High-Level Radioactive Waste - Phase II
Final Report
GRS - 161
Gesellschaft für Anlagen- und Reaktorsicherheit (GRS) mbH

GRS - 161 QM 091 Rev. 2
Gesellschaft für Anlagen- und Reaktorsicherheit (GRS) mbH
The DEBORA-Project: Development of Borehole Seals for High-Level Radioactive Waste – Phase II Final Report
T. Rothfuchs H.-K. Feddersen K.-P. Kröhn R. Miehe K. Wieczorek With contributions of A. Poley (NRG – Petten/NL)
Braunschweig December 1999
Anmerkung: Die diesem Bericht zugrundelie-genden Arbeiten wurden mit Mitteln des Bundesministeriums für Wirt-schaft und Technologie (BMWi) unter dem Förderkennzeichen 02E8715 gefördert. Die Verantwortung für den Inhalt dieser Veröffentlichung liegt allein bei den Autoren.

Deskriptoren:
Endlager, Experiment, Geosphäre, Hochaktiver Abfall, Labor, Langzeitsicherheit, Modell, Salz, Technische Barriere
Foreword
During the phase I (1991 - 1995) of the DEBORA ("Development of Borehole Seals for
High-Level Radioactive Waste") project a theoretical desk study was performed to
identify the requirements for and the tasks of high-level waste (HLW) borehole seals.
Crushed salt was identified as the most suitable sealing material. According to model
calculations the crushed salt in the HLW disposal boreholes reaches the properties of
the surrounding undisturbed rock mass by convergence induced compaction within
very few years (< 10 years).
This report describes experimental and theoretical work performed within phase II of
the project to confirm and further improve the material models used to predict the
compaction behaviour of crushed rock salt in long-term safety analyses.
Two in-situ experiments simulating the relevant conditions in disposal boreholes were
performed in the Asse mine in Germany. The experiments were designed, installed and
evaluated by GRS-Braunschweig in co-operation with the Dutch Nuclear Research and
Consultancy Group (NRG).
The DEBORA project was part of the "Backfill and Material Behaviour in an
Underground Salt Repository (BAMBUS)" project. Within the framework of the
BAMBUS project NRG and the Universidad Polytécnica de Cataluna in
Barcelona (UPC) contributed to the DEBORA project by performing relevant
thermomechanical modelling.
The DEBORA project was funded under contract No. 02E8715 by the German
Bundesministerium für Wirtschaft und Technologie (BMWi) and co-sponsored within
the BAMBUS project under contract No. FI4W-CT95-0009 by the Commission of the
European Communities.
I
Abstract
The long-term safety of a repository for radioactive waste in deep geological formations
is to be ensured by a sealing system consisting of natural and technical barriers. Each
component of the technical barrier system has to meet specific requirements
depending on the layout of the repository.
Already in the early eighties, research and development works have been started to
investigate the sealing capability of crushed salt backfill in underground salt
repositories. Laboratory investigations served to investigate the compaction behaviour
and to determine the mechanical and hydrological material parameters. Material
models to be implemented in computer codes were developed on basis of the obtained
laboratory results. First numerical simulations of the long-term sealing behaviour of
crushed salt backfill in disposal boreholes containing heat producing high-level waste
have been performed in phase I of the DEBORA project.
The major objective of the project phase II was to confirm the obtained modelling
results by comparison with representative experimental data. Two in-situ experiments
in 15 m deep boreholes with a diameter of 0.6 m were thus performed in the Asse
mine. The experiment DEBORA 1 served for the investigation of the compaction
behaviour of crushed salt backfill in the annulus between the heat producing waste
canisters and the surrounding rock. In the experiment DEBORA 2 the crushed salt
compaction in the seal region above the canister stack was investigated. By electrical
heating maximum temperatures of 185 °C and 135 °C were achieved at the end of the
experiments. In both experiments a maximum backfill pressure of about 15 MPa was
measured. The convergence induced borehole closure amounted to 15.5 mm and
42.5 mm, respectively.
The general agreement between the measured and predicted compaction behaviour
was comparably good in both experiments but, the long-term relevant low compaction
rates in the final stage of both experiments were predicted even better. It is thus
concluded that the material models developed so far allow a satisfactory prediction of
the long-term sealing behaviour of crushed salt backfill. Hence, further large scale in-
situ experiments are not considered necessary. However, some more laboratory
investigations are considered useful in order to investigate discrepancies between
measurements and predictions observed in particular in the early compaction stage at
porosities above 20 %.
II
The hydraulic behaviour of the compacting crushed salt was investigated too. The
relation k = 1.9⋅10-8 φ5.27 m2 between the permeability k and the porosity φ was derived
from an evaluation of all in-situ and laboratory data. Former laboratory results are very
well confirmed by this relation.
In addition to the in-situ investigations brine intrusion and propagation of gas in sealed
disposal boreholes were investigated using geometrically simplified, numerical models.
The calculations show a complex displacement behaviour of the fluid phases which
cannot be captured by single-phase flow models. The results are sensitive to almost all
parameters. Thus, special attention should be paid to the material laws and the model
geometry for site specific predictions.
Kurzfassung
Die Langzeitsicherheit eines geologischen Endlagers soll nach internationaler
Übereinkunft durch ein System aus natürlichen und technischen Barrieren
gewährleistet werden. Dementsprechend wurde in Deutschland in den
"Sicherheitskriterien für die Endlagerung radioaktiver Abfälle in einem Bergwerk" des
Bundesministers des Innern aus dem Jahr 1983 als Maßnahme zur Verwirklichung der
Schutzziele ein Mehrbarrierenkonzept gefordert. Dabei muss jedes Teilsystem - zum
Beispiel Kammer- und Streckenverfüllungen, Bohrloch-, Schacht- oder
Kavernenverschlüsse - seinen spezifischen Beitrag liefern.
Forschungsarbeiten zur Untersuchung der Eignung von Salzgrus als
Verschlussmaterial für Endlagerhohlräume wurden bereits in den achtziger Jahren mit
der Aufnahme erster Laboruntersuchungen zur Ermittlung der relevanten
mechanischen und hydraulischen Stoffparameter begonnen. Auf Basis der
Laborergebnisse wurden erste Materialmodelle entwickelt, mit deren Hilfe dann in der
Phase I des DEBORA-Projektes Prognoserechnungen zum Langzeitverhalten des
Versatzmaterials Salzgrus in Endlagerbohrlöchern für hochradioaktive Abfälle aus der
Wiederaufarbeitung bestrahlter Brennelemente (high-level waste (HLW)) durchgeführt
wurden.
Das Ziel der Phase II des DEBORA-Projektes bestand darin, die Belastbarkeit der in
der Phase I gewonnenen theoretischen Ergebnisse durch geeignete In-situ-
III
Experimente mit begleitenden Laboruntersuchungen zu überprüfen, um das
vorgeschlagene Verschlusskonzept entweder zu bestätigen oder Hinweise auf
eventuell erforderliche Modifikationen zu ermitteln.
In den DEBORA-Versuchen wurde das Kompaktionsverhalten und die Durchlässigkeit
von Salzgrus im Ringspalt zwischen den wärmeproduzierenden Kokillen und dem
Gebirge (DEBORA 1) und im Verschlussbereich (DEBORA 2) oberhalb der
Kokillensäule untersucht. Beide Experimente wurden in 0,6 m durchmessenden ca.
15 m tiefen Bohrlöchern in einer Strecke auf der 800-m-Sohle der Asse durchgeführt.
Bei DEBORA 1 wurden die wärmeproduzierenden Kokillen durch eine beheizte
Verrohrung innerhalb des Bohrloches simuliert, während der Wärmeeintrag in den
Verschlussbereich bei DEBORA 2 durch vier außerhalb des Bohrloches bei 1,1 m
Radius installierte Erhitzer erfolgte. Innerhalb der jeweiligen Versuchsdauer von 12
bzw. 15 Monaten wurden maximale Salzgrustemperaturen von 185 °C bzw. 135 °C
erreicht. Die gemessenen maximalen Versatzdrücke lagen in beiden Versuchen bei
etwa 15 MPa. Die Bohrlochkonvergenz betrug im Versuchszeitraum maximal 25,5 mm
bzw. 42,5 mm.
Die Übereinstimmung der prognostizierten und gemessenen Ergebnisse ist in beiden
Experimenten etwa gleich gut. Insbesondere die für das Langzeitverhalten des
kompaktierenden Versatzes relevanten geringeren Kompaktionsraten gegen Ende der
Versuche wurden vergleichsweise gut prognostiziert, woraus der Schluss gezogen
wird, dass mit den verwendeten Materialmodellen für relativ homogenen Versatz eine
befriedigende Vorhersage des Kompaktionsverhaltens möglich ist. Weitere
großmaßstäbliche Untersuchungen werden daher nicht mehr als erforderlich
betrachtet. Einige weiterführende Laboruntersuchungen zur Klärung der Diskrepanzen
im Porositätsbereich oberhalb 20 % wären jedoch im Hinblick auf eine weitere
Verbesserung der Modelle wünschenswert.
Das Durchlässigkeitsverhalten des kompaktierenden Salzversatzes wurde im Rahmen
des DEBORA-Projektes erstmals in situ untersucht. Damit wurde ein wesentlicher
Beitrag zur Absicherung der in Langzeitsicherheitsanalysen verwendeten
Modellansätze geleistet. Aus allen im Labor und in situ gewonnenen Daten wurde
zwischen der Permeabilität k und der Porosität φ die für Langzeitsicherheitsanalysen
wichtige Relation k = 1.9⋅10-8 φ5.27 m2 abgeleitet, womit bereits früher ermittelte
Labordaten gut bestätigt werden.
IV

Anhand von Prinzipmodellen wurden ergänzend modelltheoretische Untersuchungen
zum Laugenzutritt und zur korrosionsbedingten Gasbildung in Endlagerbohrlöchern für
hochradioaktive Abfälle im Salz angestellt. Die Rechnungen lassen erwarten, dass die
gegenseitige Verdrängung der Fluide ein komplizierter Vorgang ist, der nicht mehr
durch Einphasenströmungsmodelle erfasst werden kann. Die Ergebnisse hängen dabei
empfindlich von praktisch allen Eingangsparametern ab, was besonders hohe
Anforderungen an die Genauigkeit stellt, mit der die Materialgesetze und die Geometrie
für solche Modelle beschrieben werden.
V

VI
Table of Contents
Foreword..................................................................................................... I
Abstract...................................................................................................... II
Kurzfassung ............................................................................................. III
Table of Contents....................................................................................VII
1 Introduction ............................................................................................... 1
1.1 Background ................................................................................................. 1
1.2 Issues and Objectives ................................................................................. 3
1.3 Work Programme ........................................................................................ 3
2 In-situ Investigations ................................................................................ 6
2.1 DEBORA 1 .................................................................................................. 6
2.1.1 Design ......................................................................................................... 6
2.1.2 Performance.............................................................................................. 11
2.1.3 Results ...................................................................................................... 13
2.2 DEBORA 2 ................................................................................................ 20
2.2.1 Design ....................................................................................................... 20
2.2.2 Performance.............................................................................................. 23
2.2.3 Results ...................................................................................................... 24
2.3 Conclusions............................................................................................... 31
3 Laboratory Investigations ...................................................................... 34
3.1 Backfill Compaction................................................................................... 34
3.1.1 Experimental Design ................................................................................. 35
3.1.2 Performance.............................................................................................. 38
3.1.3 Results ...................................................................................................... 41
3.2 Backfill Permeability .................................................................................. 45
3.2.1 Experimental Design ................................................................................. 46
3.2.2 Performance.............................................................................................. 46
VII
3.2.3 Results ...................................................................................................... 49
3.3 Conclusions............................................................................................... 55
4 Modelling ................................................................................................. 58
4.1 Thermomechanical Analyses .................................................................... 58
4.1.1 Analyses on Basis of Hein's Constitutive Model ....................................... 58
4.1.1.1 Features of Analysis.................................................................................. 58
4.1.1.2 Results ...................................................................................................... 59
4.1.1.3 Comparison Between Modelling Results and in-situ Measurements ........ 66
4.1.2 Analyses on Basis of Zhang's Constitutive Model..................................... 71
4.1.2.1 Features of Analysis.................................................................................. 72
4.1.2.2 Results ...................................................................................................... 73
4.1.3 Conclusions............................................................................................... 76
4.2 Hydraulical Analyses................................................................................. 77
4.2.1 Experiment Design Calculations ............................................................... 77
4.2.2 Estimation of Measuring Errors................................................................. 80
4.2.3 Determination of Backfill Porosity ............................................................. 82
4.2.4 Conclusions............................................................................................... 85
5 Analysis of Altered Evolution Scenarios .............................................. 86
5.1 Introduction ............................................................................................... 86
5.2 Numerical modelling.................................................................................. 87
5.3 Conclusions............................................................................................... 92
6 Problems Encountered and Lessons Learned..................................... 95
6.1 Experiment Execution ............................................................................... 95
6.2 Instrument Performance............................................................................ 95
6.3 Modelling................................................................................................... 96
7 Comparison of Objectives and Results ................................................ 99
7.1 Operational Objectives.............................................................................. 99
7.2 Scientific Objectives and Knowledge Gained.......................................... 100
8 Concluding Remarks and Recommendations.................................... 102
VIII

IX
8.1 Project Performance ............................................................................... 102
8.2 Recommendations for Future Work ........................................................ 102
References............................................................................................. 105
List of Figures ....................................................................................... 108
List of Tables ......................................................................................... 111
1 Introduction
1.1 Background
The long-term safety of a repository for radioactive waste in deep geological formations
is to be ensured by a sealing system consisting of natural and technical barriers. Each
component of the technical barrier system has to meet specific requirements
depending on the layout of the repository.
According to the German radioactive waste management concept steel canisters
containing vitrified High-Level Waste (HLW) originating from reprocessing of spent fuel
are to be disposed of in disposal boreholes located in deep geological salt formations.
As known from earlier investigations small amounts of natural fluids will be released
from the salt into the disposal boreholes because of heating and irradiation of the salt.
If the borehole would be sealed gastight this would lead to an increase in gas pressure.
The fluids may cause corrosion of the waste canisters thus increasing the generation of
gases and gas pressures. For reasons of safety, the borehole seals are to be designed
in such a manner that an unacceptable increase of the borehole gas pressure and an
uncontrolled release of gases and radionuclides into the repository are avoided. These
requirements seem contradictory in principle but have to be considered during the
development of borehole seals.
During the phase I of the DEBORA-project the conditions of state (gas pressure
increase, mechanical stresses in the salt formation, deformation of the salt formation)
in and around a disposal borehole have been analyzed in detail in order to quantify the
requirements of a borehole seal (Rothfuchs et al., 1996). Additionally, the suitability of
different sealing materials was analyzed.
Crushed salt was identified as the most suitable sealing material. The initial
permeability of crushed salt is high (ca. 10-12 m2) but as a consequence of the thermally
induced salt convergence it finally reaches very small values which are comparable to
those of the undisturbed surrounding rock mass (10-21 – 10-22 m2). Because of this
behaviour the amounts of fluids released into the borehole shortly after waste
emplacement can escape from the borehole thereby avoiding the development of high
gas pressures in the borehole. The long-term permeability, however, is low and limits a
1
possible escape of radionuclides on the one hand and a inrush of brine from the
repository on the other hand.
Because of the limited mechanical strength of the HLW waste canisters, the distribution
of their weight load is required in case of disposal in deep boreholes (Barnert et al.,
1994). This can be obtained by backfilling the annulus between the waste canisters
and the borehole wall with crushed salt during the emplacement procedure. Hence,
sealing of the disposal borehole will be performed simultaneously with canister
emplacement. After completion of the emplacement of the waste canisters and crushed
salt in a borehole, the remaining part between the uppermost canister and the disposal
drift - the seal region - will also be sealed with crushed salt.
In borehole seals the backfill material consists of crushed salt as received by drift
excavation, i.e., a coarsely grained material with a maximum grain size of 60 mm. The
backfill material used in the borehole annulus will be fine grained crushed salt with a
maximum grain size of 10 mm.
In the phase I of the DEBORA-project model calculations had been performed to
analyze the compaction and permeability behaviour of crushed salt. According to these
calculations the crushed salt in the annulus of HLW disposal boreholes reaches the
properties of the surrounding undisturbed rock mass within very few years (< 10 years).
However, the level of confidence in these numerical predictions was comparably low
because the used constitutive models were only based on some few laboratory
experiments. No in-situ experiments suitable for the validation of the models had been
performed so far.
In Phase II, the DEBORA project was one part of the project BAMBUS (Backfill and
Material Behaviour in Underground Salt Repositories) that was undertaken as a joint
project by BGR (DE), ENRESA (ES), FZK (DE), G.3S (FR), GRS (DE), NRG (NL), and
UPC (ES) between January 1996 and December 1998. The project was funded by the
European Commission and the national governments and authorities (Bechthold, et al.,
1999).
2

1.2 Issues and Objectives
The main issue at the beginning of the DEBORA project was, therefore, in how far the
models developed so far would be suitable to describe the mechanical and hydraulical
behaviour of crushed salt being used as a sealing material in nuclear repositories,
especially in heated high-level waste disposal boreholes. From the laboratory
investigations and the models developed it had been known that parameters as for
instance the temperature, the deformation rate, the grain size, and the moisture
contained in the material might have an impact on the compaction behaviour. Not all of
these parameters, however, were considered in the existing models, e.g., (Hein, 1991),
(Zhang et al., 1993), (Spiers et al., 1993).
The main objective of phase II of the DEBORA-project was, therefore, to perform in-situ
experiments with accompanying laboratory investigations in order to:
• to increase the data base on important phenomena and processes in backfilled
disposal boreholes,
• to expand the knowledge required for repository design and performance
assessments, and
• to test and refine Thermo-Hydro-Mechanical (THM) models for predicting the long-
term repository performance.
1.3 Work Programme
In order to enable the investigation of the impact of the different parameters, two
independent in-situ experiments were planned to represent the expected conditions in
sealed HLW boreholes.
The experiment DEBORA 1 focused on investigating the backfill behaviour in the
borehole annulus whereas in the experiment DEBORA 2 the backfill in the borehole
seal was investigated. It was considered necessary to carry out two separate
experiments because the boundary conditions in the two borehole regions differ
considerably. In comparison to the seal region above the canister stack, the higher
temperatures in the vicinity of the waste canisters lead to much faster compaction in
3
the borehole annulus. A further difference is caused by the fact that only fine-grained
crushed salt with a maximum grain size of about 10 mm can be used to fill the narrow
annulus, whereas crushed salt with maximum grain diameters of 60 mm - as received
from drift excavation - can be used as backfill in the seal region.
Thermomechanical and hydraulical design calculations (see Chapters 4.1 and 4.2)
were performed to determine the experimental conditions with regard to temperature,
stress, deformation, and gas flow in the rock and the crushed salt backfill.
The in-situ-investigations were accompanied by laboratory investigations necessary to
determine the material parameters of the backfill used in the experiments. With the
determined parameters the thermomechanical calculations were repeated and the
results of which were compared with the observed in-situ measuring data.
According to the design calculations of the phase I, the DEBORA experiments were
suitable to investigate the compaction of crushed salt and the resulting permeability
decrease over a fairly wide parameter range. Both experiments were performed in the
former HLW test field (Figure 1-1) at the 800-meter level of the Asse mine.
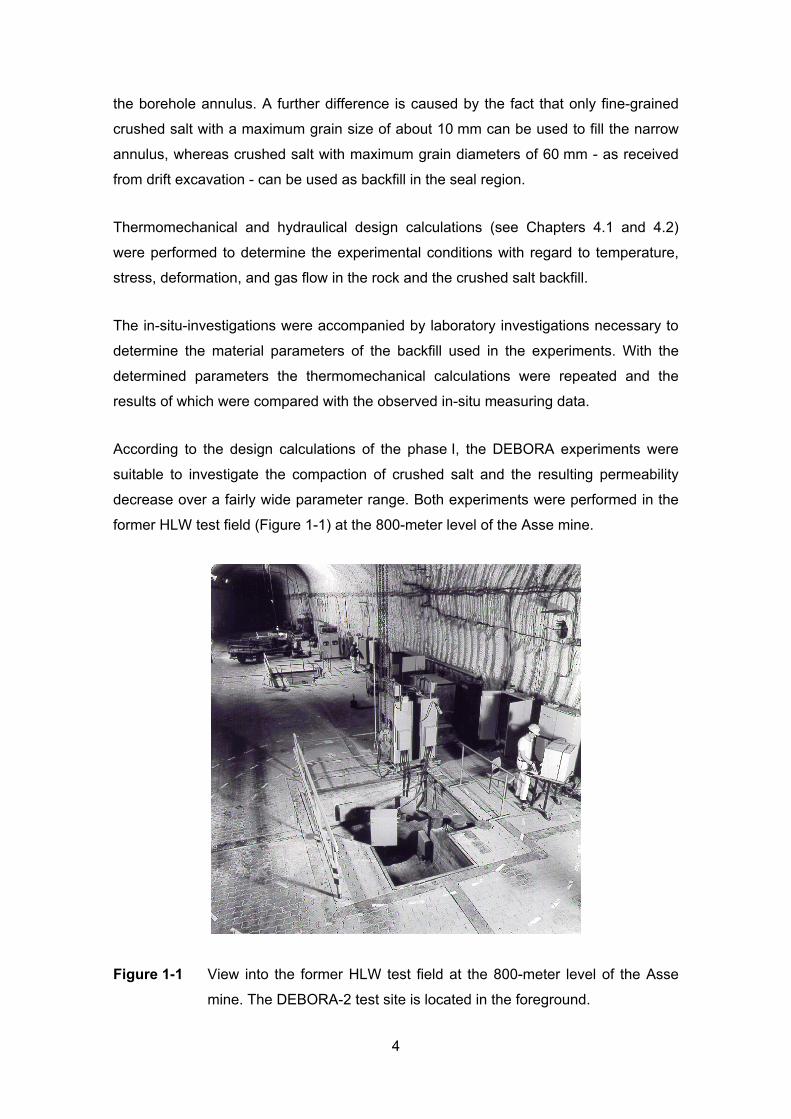
Figure 1-1 View into the former HLW test field at the 800-meter level of the Asse
mine. The DEBORA-2 test site is located in the foreground.
4
In addition to the experimental investigation of crushed salt compaction, hydraulical
model calculations (see Chapter 5) were performed within the framework of the project
in order to analyze brine intrusion and two-phase flow of brine and gas in sealed HLW
disposal boreholes. The calculations were done with the help of the two-phase flow
code MUFTE (Helmig et al., 1994). The main objective of this work was to analyze the
sensitivity of the considered processes in view of the high material parameter contrasts
at discontinuities like for instance shaft-drift interface or seal-drift-interface. Also the
dynamics of the processes were to be analysed in order to improve the understanding
of the principal mechanisms and the significance of the two-phase flow in a sealed
disposal borehole.
5
2 In-situ Investigations
2.1 DEBORA 1
2.1.1 Design
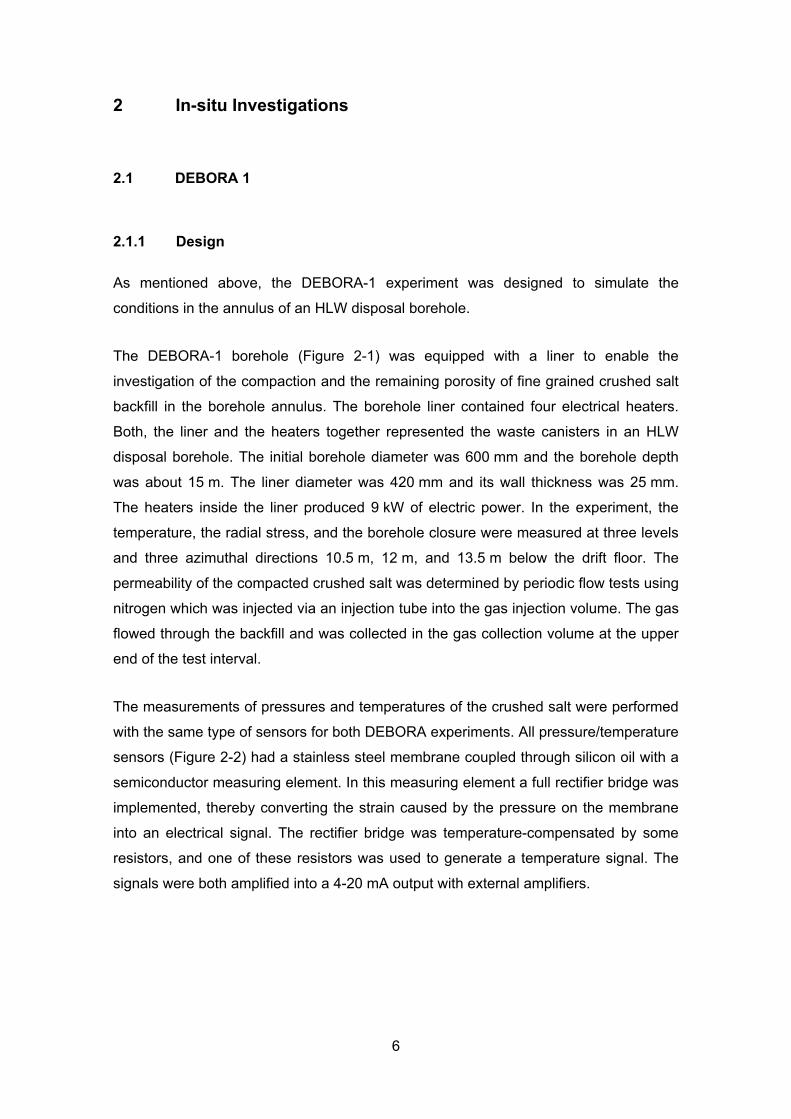
As mentioned above, the DEBORA-1 experiment was designed to simulate the
conditions in the annulus of an HLW disposal borehole.
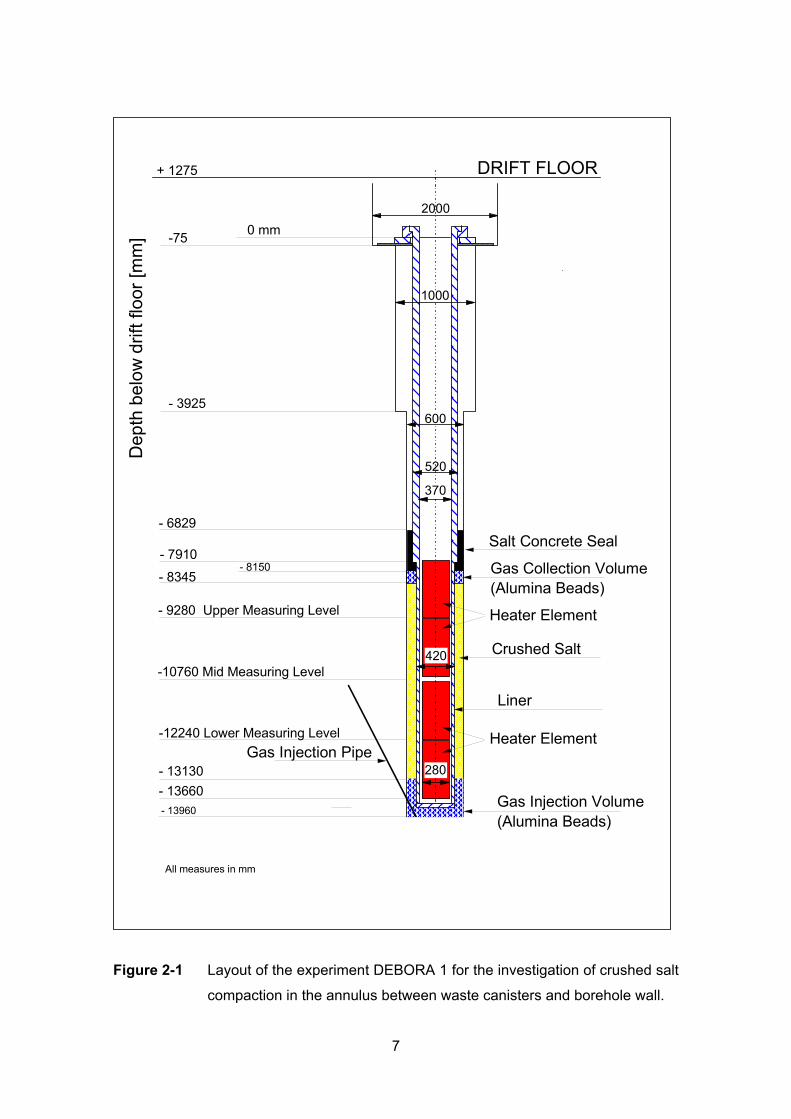
The DEBORA-1 borehole (Figure 2-1) was equipped with a liner to enable the
investigation of the compaction and the remaining porosity of fine grained crushed salt
backfill in the borehole annulus. The borehole liner contained four electrical heaters.
Both, the liner and the heaters together represented the waste canisters in an HLW
disposal borehole. The initial borehole diameter was 600 mm and the borehole depth
was about 15 m. The liner diameter was 420 mm and its wall thickness was 25 mm.
The heaters inside the liner produced 9 kW of electric power. In the experiment, the
temperature, the radial stress, and the borehole closure were measured at three levels
and three azimuthal directions 10.5 m, 12 m, and 13.5 m below the drift floor. The
permeability of the compacted crushed salt was determined by periodic flow tests using
nitrogen which was injected via an injection tube into the gas injection volume. The gas
flowed through the backfill and was collected in the gas collection volume at the upper
end of the test interval.
The measurements of pressures and temperatures of the crushed salt were performed
with the same type of sensors for both DEBORA experiments. All pressure/temperature
sensors (Figure 2-2) had a stainless steel membrane coupled through silicon oil with a
semiconductor measuring element. In this measuring element a full rectifier bridge was
implemented, thereby converting the strain caused by the pressure on the membrane
into an electrical signal. The rectifier bridge was temperature-compensated by some
resistors, and one of these resistors was used to generate a temperature signal. The
signals were both amplified into a 4-20 mA output with external amplifiers.
6
Salt Concrete Seal
Gas Collection Volume(Alumina Beads)
- 6829
- 8345
-10760 Mid Measuring Level
-12240 Lower Measuring Level
- 13660
- 8150- 7910
Crushed Salt
Liner
Heater Element
Gas Injection Volume(Alumina Beads)
Gas Injection Pipe- 13130
Dep
th b
elow
drif
t flo
or [m
m]
600
1000
520
370
420
280
2000
- 3925
-75
- 13960
- 9280 Upper Measuring Level
0 mm
DRIFT FLOOR
Heater Element
+ 1275
All measures in mm
Figure 2-1 Layout of the experiment DEBORA 1 for the investigation of crushed salt
compaction in the annulus between waste canisters and borehole wall.
7

8
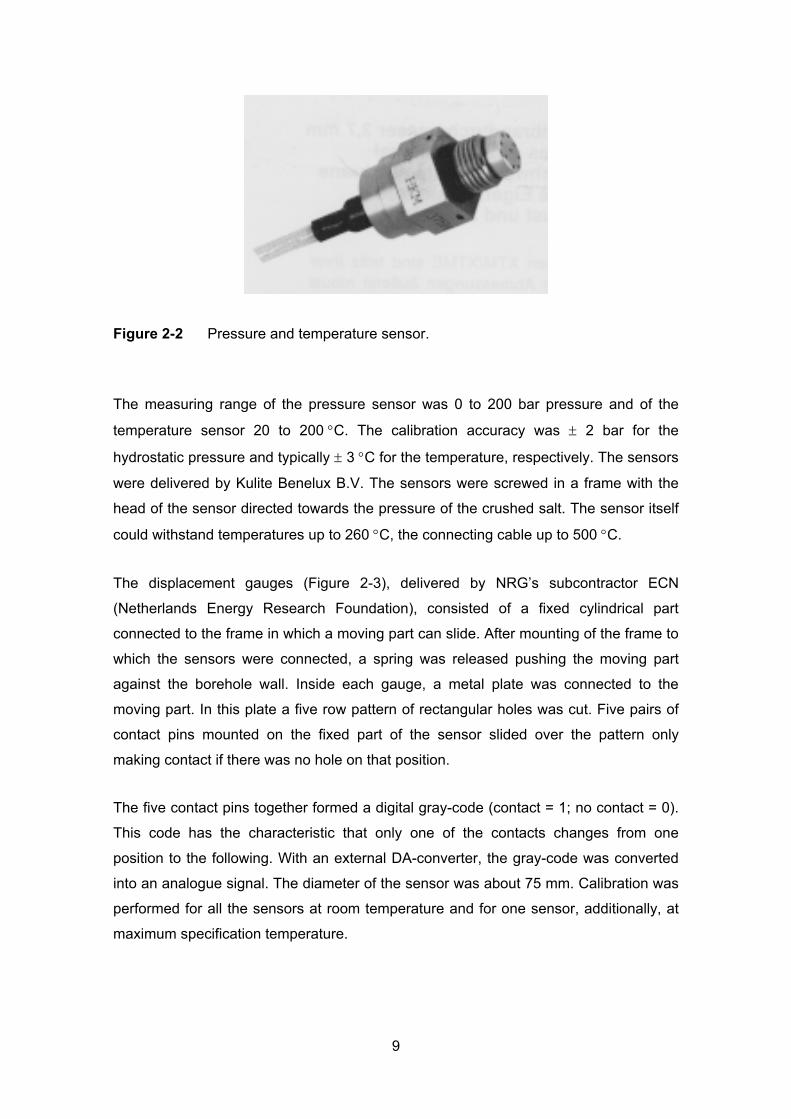
Figure 2-2 Pressure and temperature sensor.
The measuring range of the pressure sensor was 0 to 200 bar pressure and of the
temperature sensor 20 to 200 °C. The calibration accuracy was ± 2 bar for the
hydrostatic pressure and typically ± 3 °C for the temperature, respectively. The sensors
were delivered by Kulite Benelux B.V. The sensors were screwed in a frame with the
head of the sensor directed towards the pressure of the crushed salt. The sensor itself
could withstand temperatures up to 260 °C, the connecting cable up to 500 °C.
The displacement gauges (Figure 2-3), delivered by NRG’s subcontractor ECN
(Netherlands Energy Research Foundation), consisted of a fixed cylindrical part
connected to the frame in which a moving part can slide. After mounting of the frame to
which the sensors were connected, a spring was released pushing the moving part
against the borehole wall. Inside each gauge, a metal plate was connected to the
moving part. In this plate a five row pattern of rectangular holes was cut. Five pairs of
contact pins mounted on the fixed part of the sensor slided over the pattern only
making contact if there was no hole on that position.
The five contact pins together formed a digital gray-code (contact = 1; no contact = 0).
This code has the characteristic that only one of the contacts changes from one
position to the following. With an external DA-converter, the gray-code was converted
into an analogue signal. The diameter of the sensor was about 75 mm. Calibration was
performed for all the sensors at room temperature and for one sensor, additionally, at
maximum specification temperature.
9
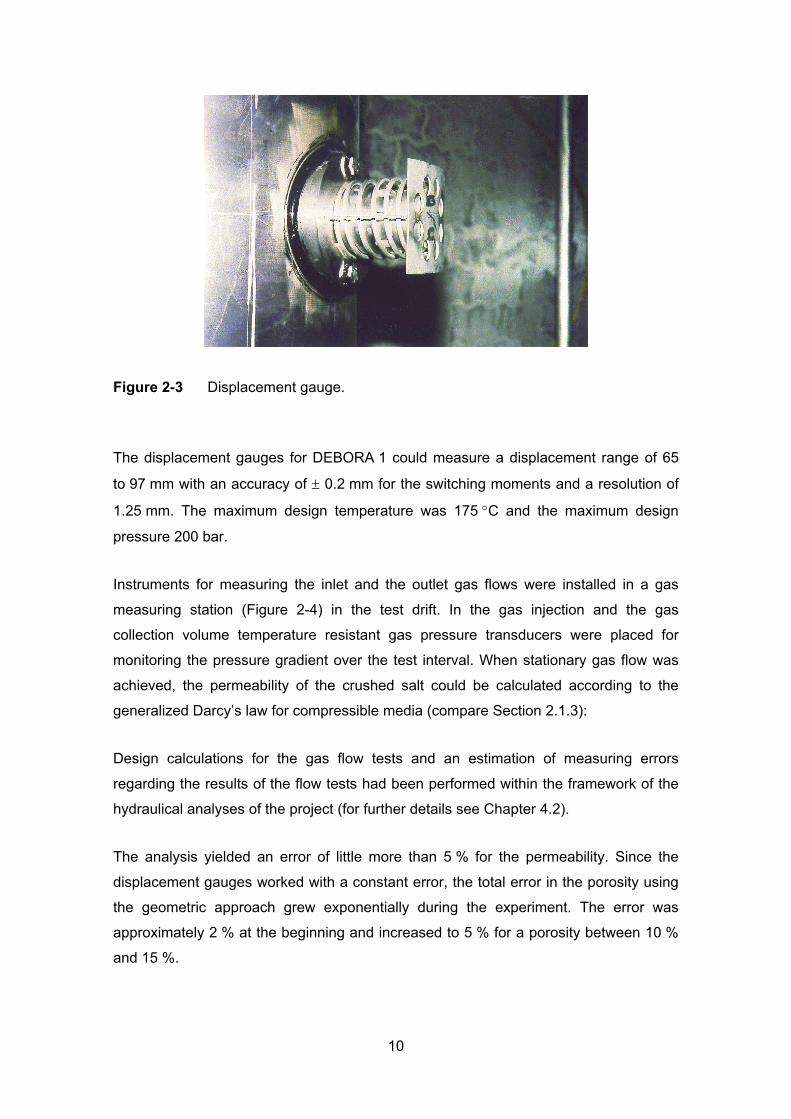
Figure 2-3 Displacement gauge.
The displacement gauges for DEBORA 1 could measure a displacement range of 65
to 97 mm with an accuracy of ± 0.2 mm for the switching moments and a resolution of
1.25 mm. The maximum design temperature was 175 °C and the maximum design
pressure 200 bar.
Instruments for measuring the inlet and the outlet gas flows were installed in a gas
measuring station (Figure 2-4) in the test drift. In the gas injection and the gas
collection volume temperature resistant gas pressure transducers were placed for
monitoring the pressure gradient over the test interval. When stationary gas flow was
achieved, the permeability of the crushed salt could be calculated according to the
generalized Darcy’s law for compressible media (compare Section 2.1.3):
Design calculations for the gas flow tests and an estimation of measuring errors
regarding the results of the flow tests had been performed within the framework of the
hydraulical analyses of the project (for further details see Chapter 4.2).
The analysis yielded an error of little more than 5 % for the permeability. Since the
displacement gauges worked with a constant error, the total error in the porosity using
the geometric approach grew exponentially during the experiment. The error was
approximately 2 % at the beginning and increased to 5 % for a porosity between 10 %
and 15 %.
10
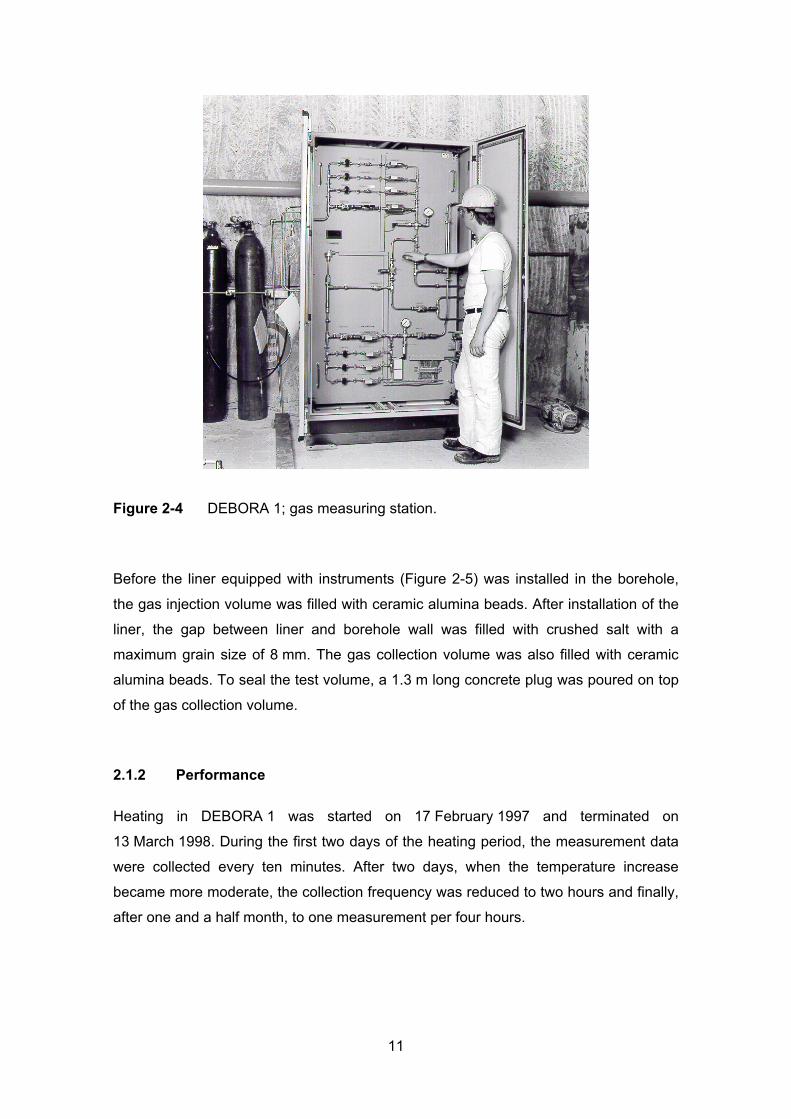
Figure 2-4 DEBORA 1; gas measuring station.
Before the liner equipped with instruments (Figure 2-5) was installed in the borehole,
the gas injection volume was filled with ceramic alumina beads. After installation of the
liner, the gap between liner and borehole wall was filled with crushed salt with a
maximum grain size of 8 mm. The gas collection volume was also filled with ceramic
alumina beads. To seal the test volume, a 1.3 m long concrete plug was poured on top
of the gas collection volume.
2.1.2 Performance
Heating in DEBORA 1 was started on 17 February 1997 and terminated on
13 March 1998. During the first two days of the heating period, the measurement data
were collected every ten minutes. After two days, when the temperature increase
became more moderate, the collection frequency was reduced to two hours and finally,
after one and a half month, to one measurement per four hours.
11
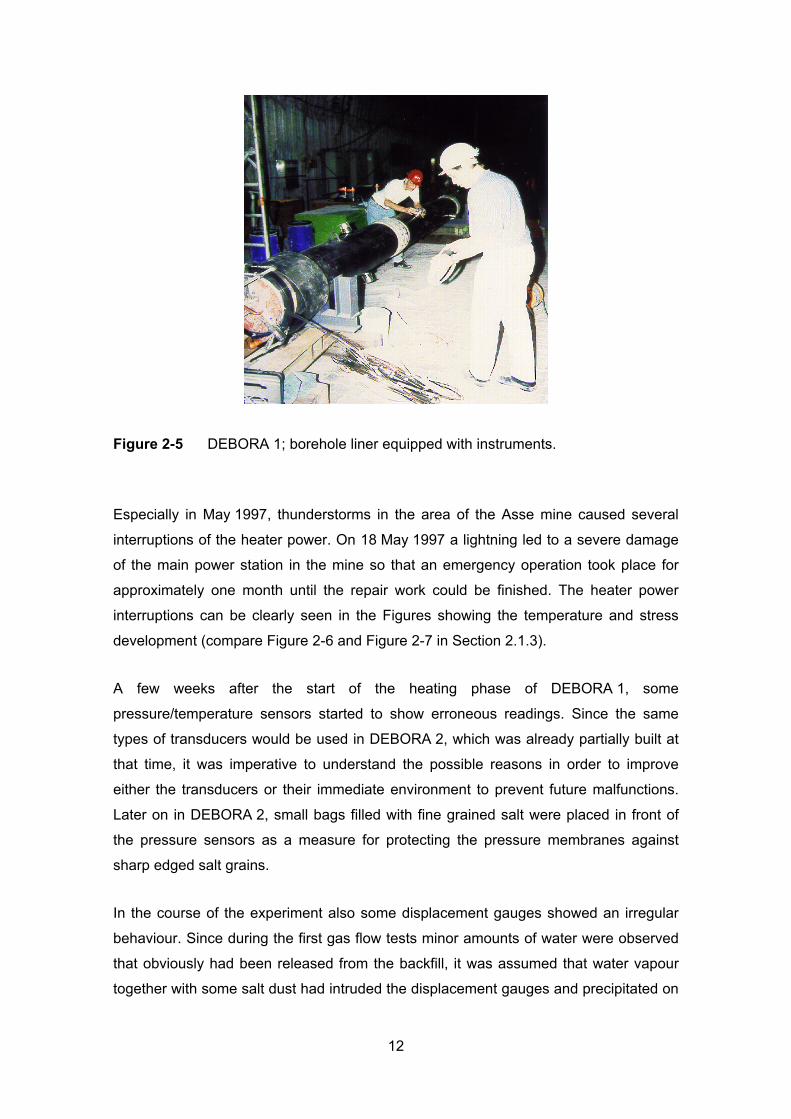
Figure 2-5 DEBORA 1; borehole liner equipped with instruments.
Especially in May 1997, thunderstorms in the area of the Asse mine caused several
interruptions of the heater power. On 18 May 1997 a lightning led to a severe damage
of the main power station in the mine so that an emergency operation took place for
approximately one month until the repair work could be finished. The heater power
interruptions can be clearly seen in the Figures showing the temperature and stress
development (compare Figure 2-6 and Figure 2-7 in Section 2.1.3).
A few weeks after the start of the heating phase of DEBORA 1, some
pressure/temperature sensors started to show erroneous readings. Since the same
types of transducers would be used in DEBORA 2, which was already partially built at
that time, it was imperative to understand the possible reasons in order to improve
either the transducers or their immediate environment to prevent future malfunctions.
Later on in DEBORA 2, small bags filled with fine grained salt were placed in front of
the pressure sensors as a measure for protecting the pressure membranes against
sharp edged salt grains.
In the course of the experiment also some displacement gauges showed an irregular
behaviour. Since during the first gas flow tests minor amounts of water were observed
that obviously had been released from the backfill, it was assumed that water vapour
together with some salt dust had intruded the displacement gauges and precipitated on
12
the electrical contacts, thus obscuring their signals. This assumption was supported by
the observation that the displacement gauges located in the upper borehole section
suffered more than those in the lower section. Furthermore, an immediately started
nitrogen flushing of DEBORA 1 led to an improvement of the performance of the
distance gauges.
The permeability measurements were carried out monthly or, in the later stage of the
experiment, each time when a sufficiently large progress of crushed salt compaction
was observed from the borehole wall displacement measurements. Each permeability
measurement was performed at different gas pressure levels of about 2, 4, 6 and
8 bars. This procedure enabled a Klinkenberg correction of the measured permeability
values.
2.1.3 Results
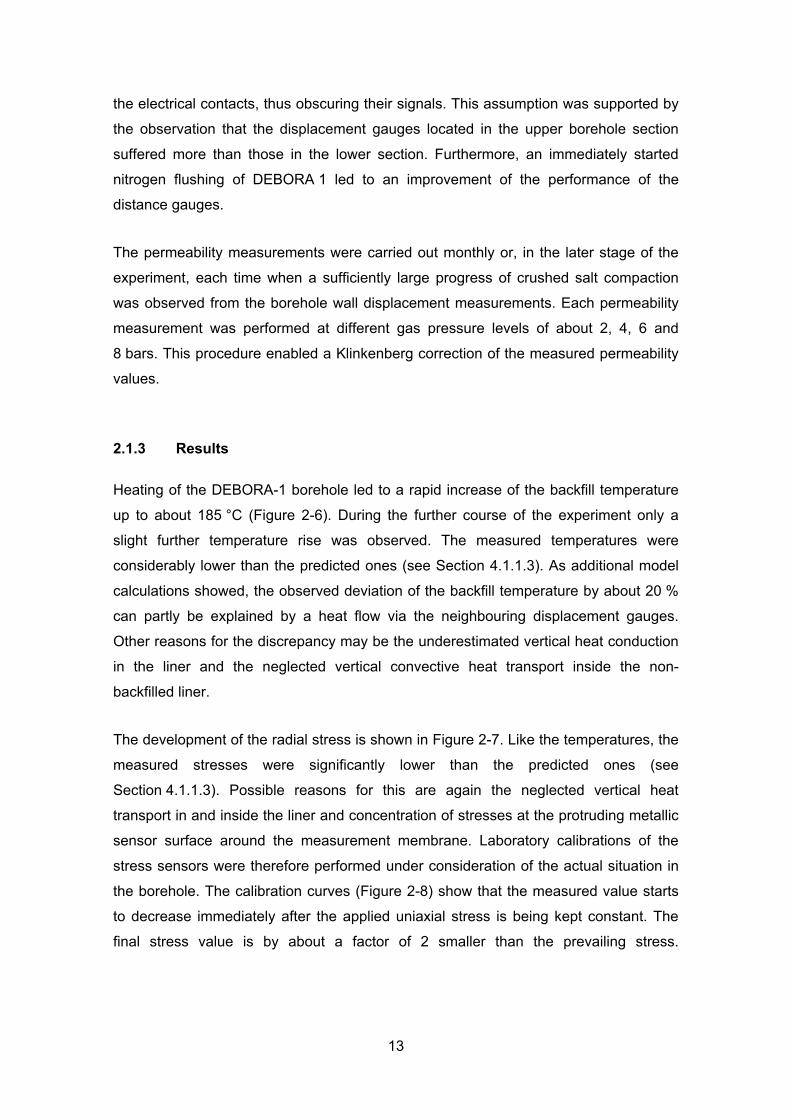
Heating of the DEBORA-1 borehole led to a rapid increase of the backfill temperature
up to about 185 °C (Figure 2-6). During the further course of the experiment only a
slight further temperature rise was observed. The measured temperatures were
considerably lower than the predicted ones (see Section 4.1.1.3). As additional model
calculations showed, the observed deviation of the backfill temperature by about 20 %
can partly be explained by a heat flow via the neighbouring displacement gauges.
Other reasons for the discrepancy may be the underestimated vertical heat conduction
in the liner and the neglected vertical convective heat transport inside the non-
backfilled liner.
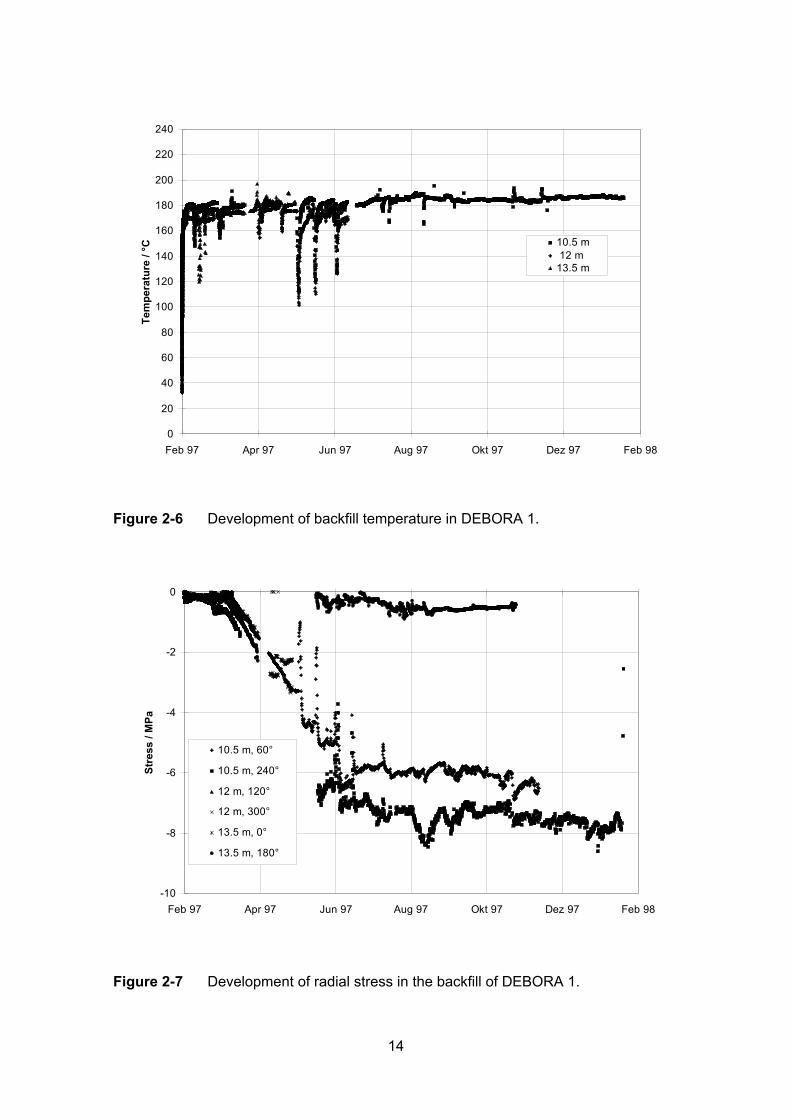
The development of the radial stress is shown in Figure 2-7. Like the temperatures, the
measured stresses were significantly lower than the predicted ones (see
Section 4.1.1.3). Possible reasons for this are again the neglected vertical heat
transport in and inside the liner and concentration of stresses at the protruding metallic
sensor surface around the measurement membrane. Laboratory calibrations of the
stress sensors were therefore performed under consideration of the actual situation in
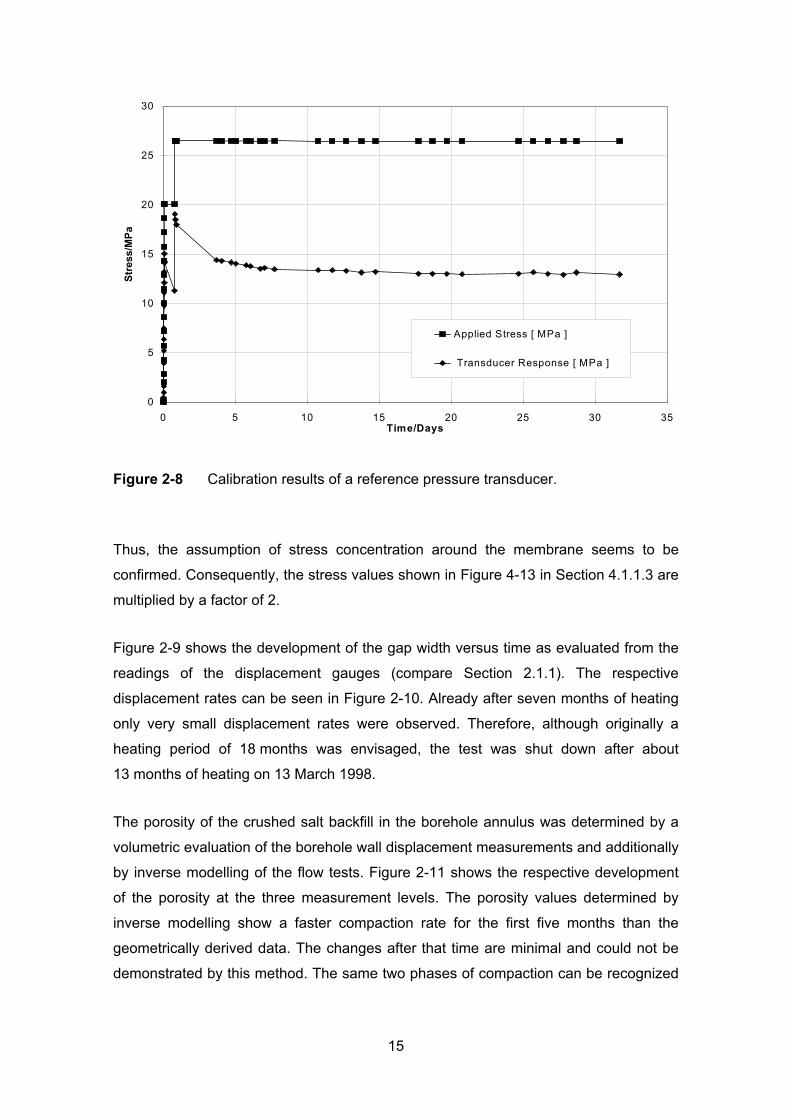
the borehole. The calibration curves (Figure 2-8) show that the measured value starts
to decrease immediately after the applied uniaxial stress is being kept constant. The
final stress value is by about a factor of 2 smaller than the prevailing stress.
13
0
20
40
60
80
100
120
140
160
180
200
220
240
Feb 97 Apr 97 Jun 97 Aug 97 Okt 97 Dez 97 Feb 98
Tem
pera
ture
/ °C 10.5 m
12 m13.5 m
Figure 2-6 Development of backfill temperature in DEBORA 1.
-10
-8
-6
-4
-2
0
Feb 97 Apr 97 Jun 97 Aug 97 Okt 97 Dez 97 Feb 98
Stre
ss /
MPa
10.5 m, 60°
10.5 m, 240°
12 m, 120°
12 m, 300°
13.5 m, 0°
13.5 m, 180°
Figure 2-7 Development of radial stress in the backfill of DEBORA 1.
14
0
5
10
15
20
25
30
0 5 10 15 20 25 30 35Time/Days
Stre
ss/M
Pa
Applied Stress [ MPa ]
Transducer Response [ MPa ]
Figure 2-8 Calibration results of a reference pressure transducer.
Thus, the assumption of stress concentration around the membrane seems to be
confirmed. Consequently, the stress values shown in Figure 4-13 in Section 4.1.1.3 are
multiplied by a factor of 2.
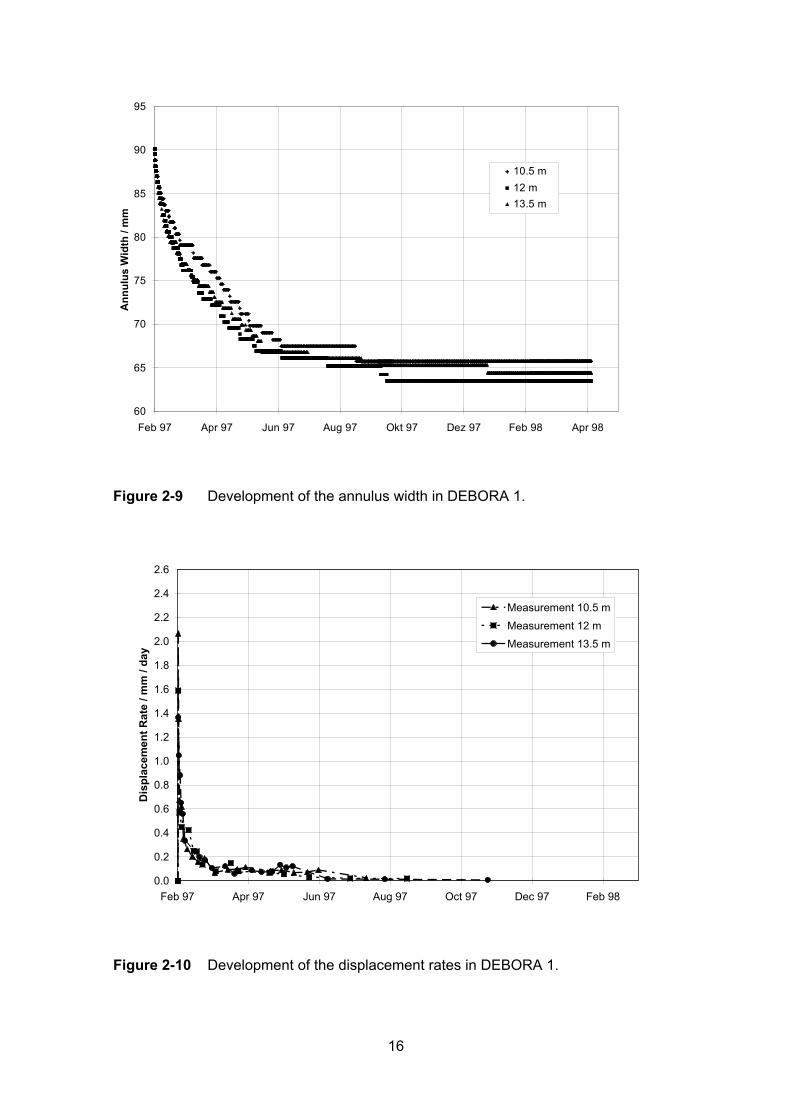
Figure 2-9 shows the development of the gap width versus time as evaluated from the
readings of the displacement gauges (compare Section 2.1.1). The respective
displacement rates can be seen in Figure 2-10. Already after seven months of heating
only very small displacement rates were observed. Therefore, although originally a
heating period of 18 months was envisaged, the test was shut down after about
13 months of heating on 13 March 1998.
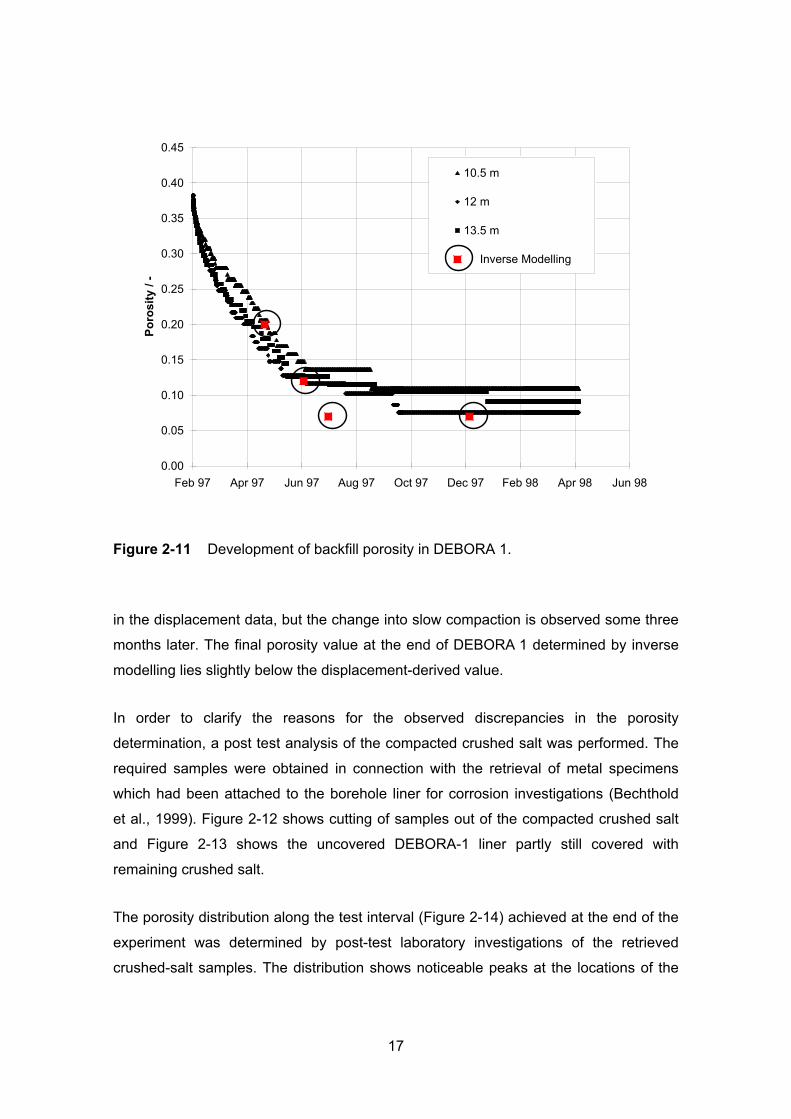
The porosity of the crushed salt backfill in the borehole annulus was determined by a
volumetric evaluation of the borehole wall displacement measurements and additionally
by inverse modelling of the flow tests. Figure 2-11 shows the respective development
of the porosity at the three measurement levels. The porosity values determined by
inverse modelling show a faster compaction rate for the first five months than the
geometrically derived data. The changes after that time are minimal and could not be
demonstrated by this method. The same two phases of compaction can be recognized
15
60
65
70
75
80
85
90
Feb 97 Apr 97 Jun 97 Aug 97 Okt 97 Dez 97 Feb 98 Apr 98
Ann
ulus
Wid
th /
mm
95
10.5 m12 m13.5 m
Figure 2-9 Development of the annulus width in DEBORA 1.
0.0
0.2
0.4
0.6
0.8
1.0
1.2
1.4
1.6
1.8
2.0
2.2
2.4
2.6
Feb 97 Apr 97 Jun 97 Aug 97 Oct 97 Dec 97 Feb 98
Dis
plac
emen
t Rat
e / m
m /
day
Measurement 10.5 m
Measurement 12 mMeasurement 13.5 m
Figure 2-10 Development of the displacement rates in DEBORA 1.
16
0.00
0.05
0.10
0.15
0.20
0.25
0.30
0.35
0.40
0.45
Feb 97 Apr 97 Jun 97 Aug 97 Oct 97 Dec 97 Feb 98 Apr 98 Jun 98
Poro
sity
/ -
10.5 m
12 m
13.5 m
Inverse Modelling
Figure 2-11 Development of backfill porosity in DEBORA 1.
in the displacement data, but the change into slow compaction is observed some three
months later. The final porosity value at the end of DEBORA 1 determined by inverse
modelling lies slightly below the displacement-derived value.
In order to clarify the reasons for the observed discrepancies in the porosity
determination, a post test analysis of the compacted crushed salt was performed. The
required samples were obtained in connection with the retrieval of metal specimens
which had been attached to the borehole liner for corrosion investigations (Bechthold
et al., 1999). Figure 2-12 shows cutting of samples out of the compacted crushed salt
and Figure 2-13 shows the uncovered DEBORA-1 liner partly still covered with
remaining crushed salt.
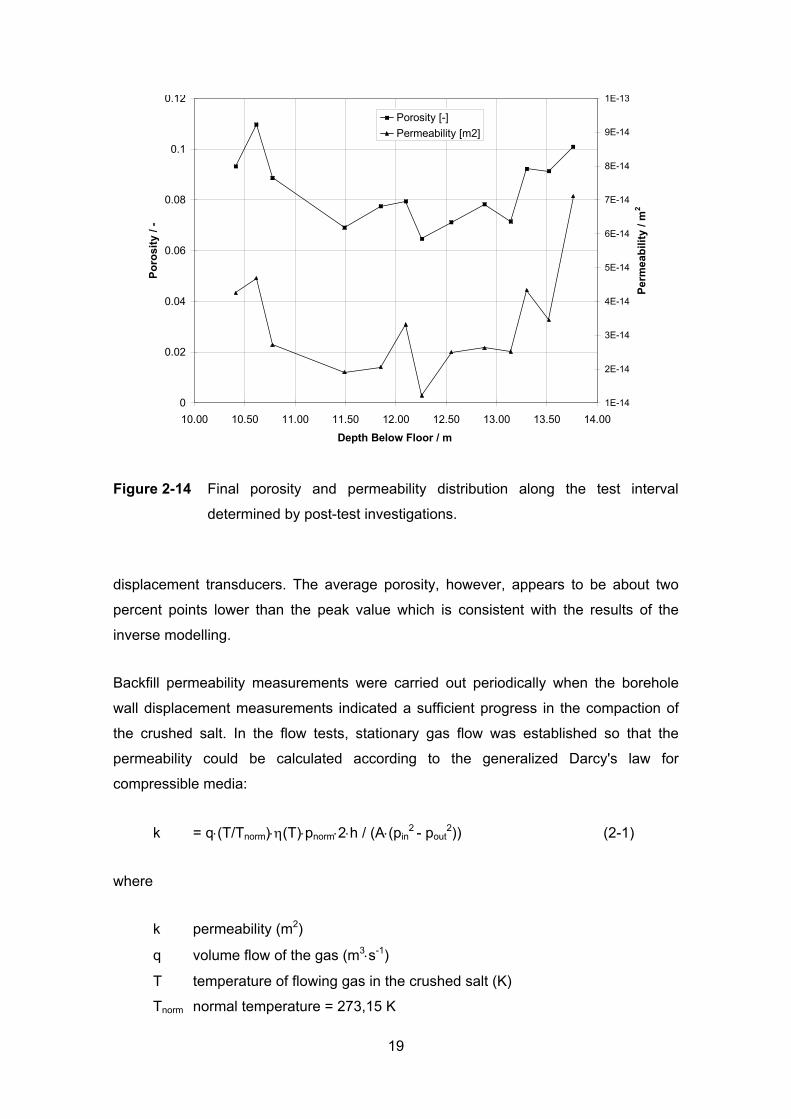
The porosity distribution along the test interval (Figure 2-14) achieved at the end of the
experiment was determined by post-test laboratory investigations of the retrieved
crushed-salt samples. The distribution shows noticeable peaks at the locations of the
17

displacement gauge
liner surface
Figure 2-12 Sawing of samples from the compacted crushed salt sticking at the
uncovered DEBORA-1 liner.
Figure 2-13 Uncovered DEBORA-1 liner.
18
0
0.02
0.04
0.06
0.08
0.1
0.12
10.00 10.50 11.00 11.50 12.00 12.50 13.00 13.50 14.00
Depth Below Floor / m
Poro
sity
/ -
1E-14
2E-14
3E-14
4E-14
5E-14
6E-14
7E-14
8E-14
9E-14
1E-13
Perm
eabi
lity
/ m2
Porosity [-]Permeability [m2]
Figure 2-14 Final porosity and permeability distribution along the test interval
determined by post-test investigations.
displacement transducers. The average porosity, however, appears to be about two
percent points lower than the peak value which is consistent with the results of the
inverse modelling.
Backfill permeability measurements were carried out periodically when the borehole
wall displacement measurements indicated a sufficient progress in the compaction of
the crushed salt. In the flow tests, stationary gas flow was established so that the
permeability could be calculated according to the generalized Darcy's law for
compressible media:
k = q⋅(T/Tnorm)⋅η(T)⋅pnorm⋅2⋅h / (A⋅(pin2 - pout
2)) (2-1)
where
k permeability (m2)
q volume flow of the gas (m3⋅s-1)
T temperature of flowing gas in the crushed salt (K)
Tnorm normal temperature = 273,15 K
19
η(T) temperature dependent dynamic viscosity of the test gas (Pa⋅s)
pnorm normal gas pressure = 101325 (Pa)
h length of the crushed salt interval (m)
A actual cross section of the crushed salt (m2)
pin gas pressure at the gas injection volume (Pa)
pout gas pressure at the gas collection volume (Pa).
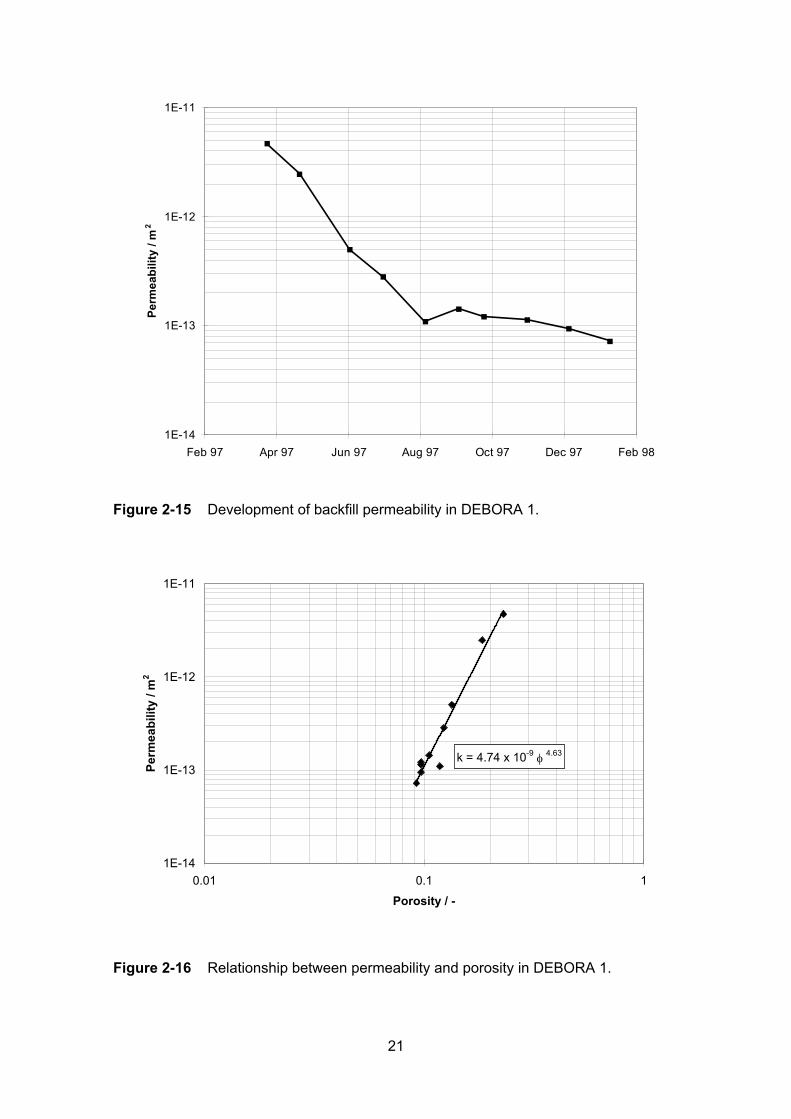
In DEBORA 1, the first reliable measurement was possible two months after start-up of
heating when a backfill porosity of 0.25 had been reached. Figure 2-15 shows the
decrease of the permeability over time. Within the experimental period, the permeability
decreased by almost two orders of magnitude from 4.7⋅10-12 m2 to 7.24⋅10-14 m2.
A compilation of the porosity and permeability data obtained in DEBORA 1 is shown in
Figure 2-16. The regression analysis of these data resulted in the relationship
k = 4.74 ⋅ 10-9 φ 4.63 between the permeability k and the porosity φ.
2.2 DEBORA 2
2.2.1 Design
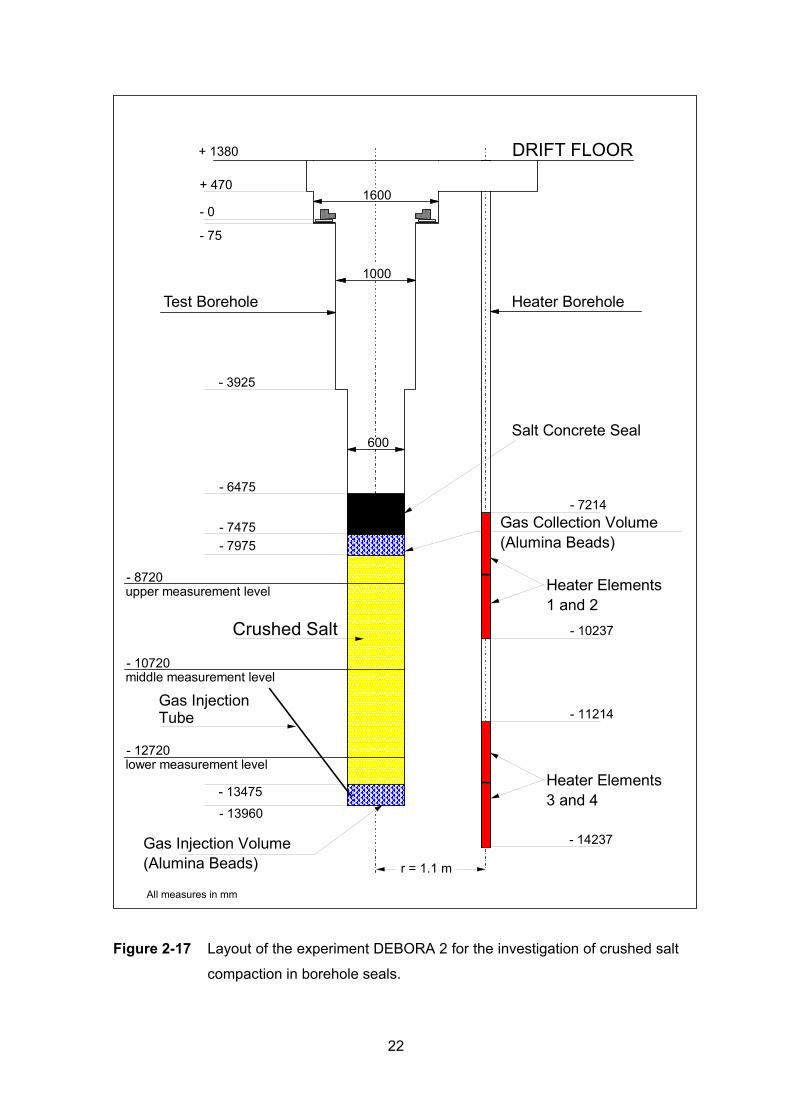
In the experiment DEBORA 2 (Figure 2-17) the backfill behaviour in the borehole seal
was investigated. As mentioned in Section 1.3, this experiment was considered to be
necessary in addition to DEBORA 1 firstly, because the temperature and thus the rock
convergence differ markedly in the borehole annulus and the seal region, and,
secondly, because the grain sizes of the backfill material differ significantly in the
borehole sections.
The experiment was carried out in a 600-mm-diameter and about 15-m-deep borehole
located 15 m away from the DEBORA-1 borehole. Crushed salt was filled into the lower
5.5 m of the borehole. This part, simulating the seal of an HLW disposal borehole, was
heated by four external peripheral heaters producing 3.5 kW each (14 kW in total). The
measurements in this experiment focused on the interrelationships between
temperature, rock convergence, backfill compaction, backfill pressure, and remaining
backfill permeability.
20
1E-14
1E-13
1E-12
1E-11
Feb 97 Apr 97 Jun 97 Aug 97 Oct 97 Dec 97 Feb 98
Perm
eabi
lity
/ m2
Figure 2-15 Development of backfill permeability in DEBORA 1.
k = 4.74 x 10⁻⁹ φ 4.63
1E-14
1E-13
1E-12
1E-11
0.01 0.1 1
Porosity / -
Perm
eabi
lity
/ m2
Figure 2-16 Relationship between permeability and porosity in DEBORA 1.
21
Salt Concrete Seal
Crushed Salt
- 14237
r = 1.1 m
Gas Injection Tube
DRIFT FLOOR
Gas Injection Volume(Alumina Beads)
Gas Collection Volume(Alumina Beads)
Heater Elements1 and 2
- 13475
- 13960
- 7475
- 6475
- 11214
- 10237
- 7214
600
1000
1600
- 3925
- 75
Heater BoreholeTest Borehole
Heater Elements3 and 4
- 0
+ 470
+ 1380
middle measurement level- 10720
upper measurement level- 8720
lower measurement level- 12720
All measures in mm
- 7975
Figure 2-17 Layout of the experiment DEBORA 2 for the investigation of crushed salt
compaction in borehole seals.
22
The flow tests for the determination of the backfill permeability were performed with the
same gas measuring station that also had been used in DEBORA 1.
Temperatures, stresses, and displacements were measured at three levels 10.1 m,
12.1 m, and 14.1 m below the floor. The gauges were mounted at different azimuthal
directions on a hollow frame located in the centre of the borehole. The diameter of the
frame was 0.114 m and all cables were guided inside the frame to avoid preferential
pathways for the nitrogen gas during the flow tests.
The pressure/temperature sensors had the same technical specifications as the
sensors used in DEBORA 1 (see Section 2.1.1). The only difference was that at each
measuring level in DEBORA 2 one pressure sensor was facing in axial direction and
one in radial direction. Temperature measurements were performed with all the
sensors.
The displacement gauges for DEBORA 2 were very similar to the gauges used in
DEBORA 1 (see Section 2.1.1). They could measure a displacement range of 193 to
253 mm with an accuracy of ± 0.2 mm for the switching moments and a resolution of
1.875 mm. The maximum design temperature was 200 °C and the maximum design
pressure was 200 bar.
2.2.2 Performance
DEBORA 2 became operational in September 1997 and was terminated on
4 December 1998. In contrast to DEBORA 1, the heater operation continued over the
experimental period without major disturbances.
Based on the experiences gained with the transducers in DEBORA 1, in order to
reduce the influence of intruding salt, the dimensions of the pressure release holes in
the displacement gauges were reduced, and the signal voltage differences over the
five-signal sliding contacts were increased.
In addition, with the purpose of maintaining a low water vapour content of the backfill
and of reducing the amount of water and salt dust which could enter the displacement
gauges, the test interval containing the crushed salt was continuously flushed with dry
nitrogen. Since obviously strengthening of the protective silicon layers of the pressure
23
sensors would lead to an unacceptable reduction of the sensibility of the pressure
sensors, the pressure membranes were protected against penetration of sharp-edged
salt grains (as observed in DEBORA 1) by strapping small bags filled with fine grained
salt in front of the pressure sensors.
During the experiment it turned out that the measures mentioned above were sufficient.
All displacement gauges and temperature sensors performed very well. A malfunction
of the axial pressure sensor at 10.1 m below the floor must be attributed to a short-
circuit of one of the signal cables during installation.
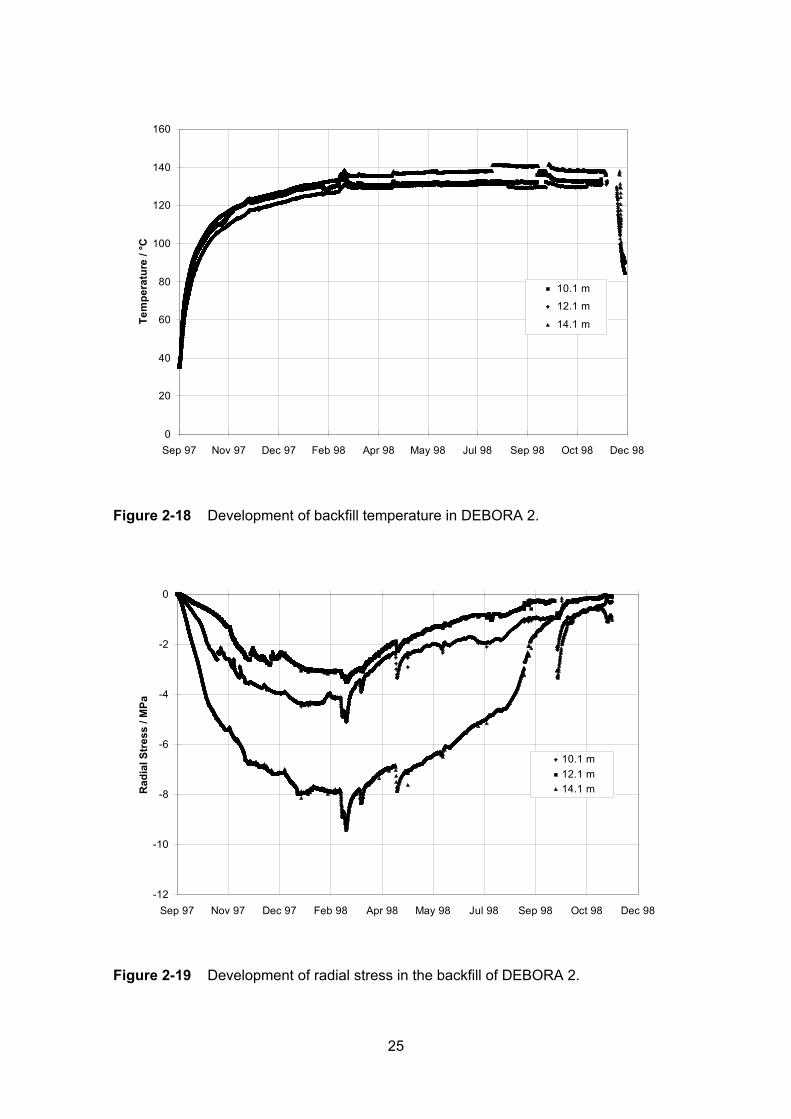
2.2.3 Results
The temperature development is shown in Figure 2-18. The initial temperature rise is
slower than in DEBORA 1, because in DEBORA 2 the heaters were located outside the
central borehole at a radial distance of 1.1 m. Compared with the DEBORA-1
experiment, a better agreement was achieved between predicted and measured
temperatures.
The development of the observed radial stress is shown in Figure 2-19. Like in
DEBORA 1, the measured stresses are lower than predicted. As already explained in
Section 2.3.1.3, stress concentrations at the protruding sensor surface around the
measurement membrane could have caused the measurement of reduced stress
values. According to the post-test laboratory calibrations of the stress sensors, also in
case of DEBORA 2 the stress values shown in Section 5.3 have been multiplied by a
factor of 2.
The pressure decrease since March 1998 may have various reasons. In early
March 1998, an unintended temporary power increase resulted in an increase in
temperature and stress. After the heater power had been corrected, both temperature
and stress decreased again. The resulting contraction of the salt may have caused a
separation of the backfill material from the sensor membrane. It is assumed that the
contact between backfill and sensor membrane was never fully established again. This
effect may have been assisted by the increasing rigidity of the compacting backfill.
Another reason for this deviating radial stress behaviour could be that due to
deformation of the initially circular borehole, caused by non-equal thermal expansion of
24
0
20
40
60
80
100
120
140
160
Sep 97 Nov 97 Dec 97 Feb 98 Apr 98 May 98 Jul 98 Sep 98 Oct 98 Dec 98
Tem
pera
ture
/ °C
10.1 m
12.1 m
14.1 m
Figure 2-18 Development of backfill temperature in DEBORA 2.
-12
-10
-8
-6
-4
-2
0
Sep 97 Nov 97 Dec 97 Feb 98 Apr 98 May 98 Jul 98 Sep 98 Oct 98 Dec 98
Rad
ial S
tres
s / M
Pa
10.1 m12.1 m14.1 m
Figure 2-19 Development of radial stress in the backfill of DEBORA 2.
25
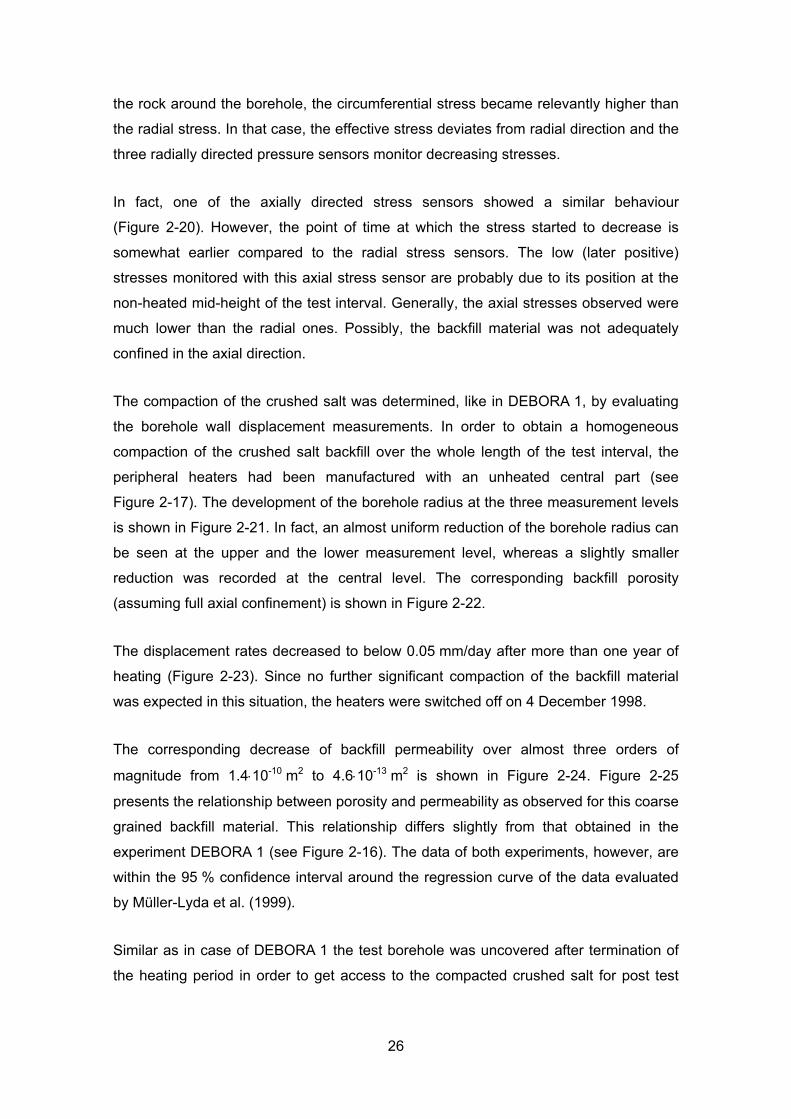
the rock around the borehole, the circumferential stress became relevantly higher than
the radial stress. In that case, the effective stress deviates from radial direction and the
three radially directed pressure sensors monitor decreasing stresses.
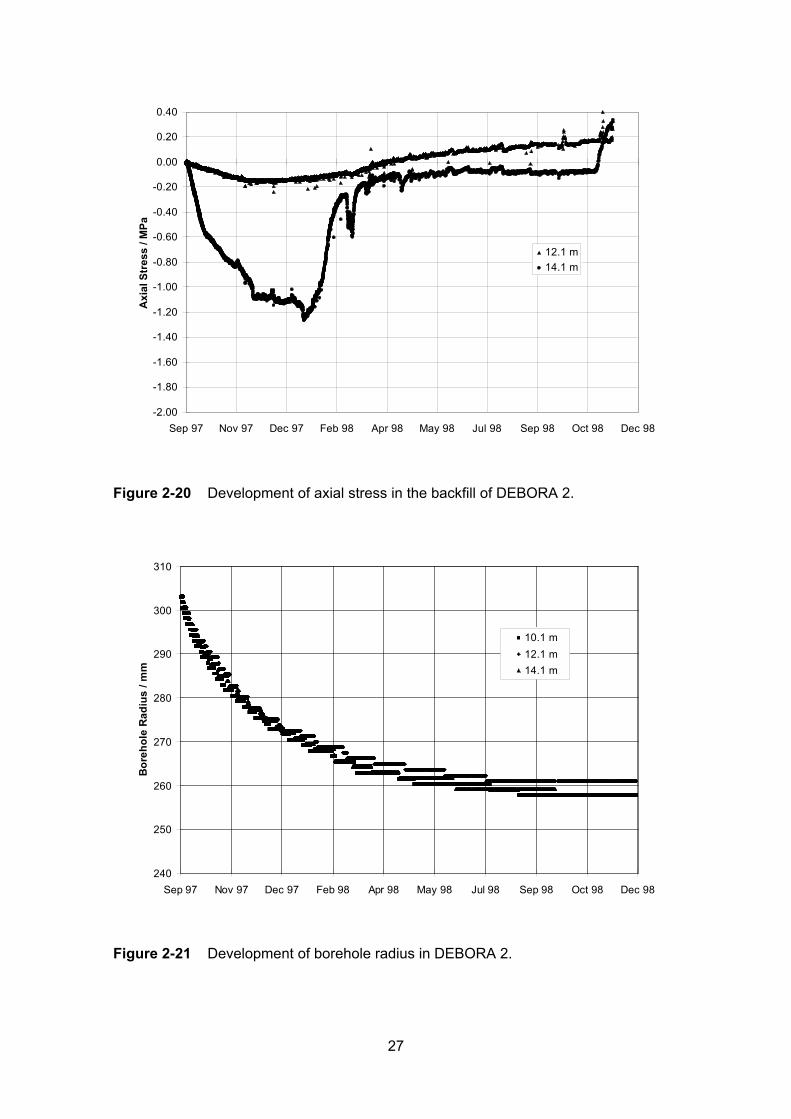
In fact, one of the axially directed stress sensors showed a similar behaviour
(Figure 2-20). However, the point of time at which the stress started to decrease is
somewhat earlier compared to the radial stress sensors. The low (later positive)
stresses monitored with this axial stress sensor are probably due to its position at the
non-heated mid-height of the test interval. Generally, the axial stresses observed were
much lower than the radial ones. Possibly, the backfill material was not adequately
confined in the axial direction.
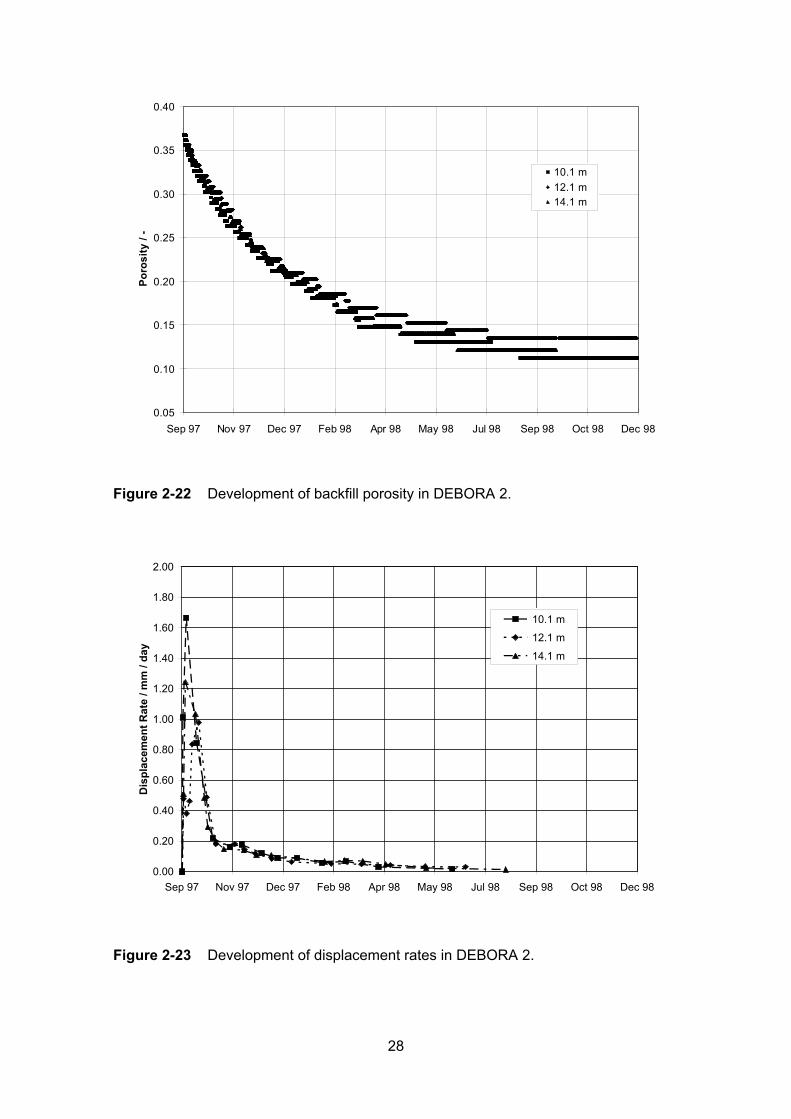
The compaction of the crushed salt was determined, like in DEBORA 1, by evaluating
the borehole wall displacement measurements. In order to obtain a homogeneous
compaction of the crushed salt backfill over the whole length of the test interval, the
peripheral heaters had been manufactured with an unheated central part (see
Figure 2-17). The development of the borehole radius at the three measurement levels
is shown in Figure 2-21. In fact, an almost uniform reduction of the borehole radius can
be seen at the upper and the lower measurement level, whereas a slightly smaller
reduction was recorded at the central level. The corresponding backfill porosity
(assuming full axial confinement) is shown in Figure 2-22.
The displacement rates decreased to below 0.05 mm/day after more than one year of
heating (Figure 2-23). Since no further significant compaction of the backfill material
was expected in this situation, the heaters were switched off on 4 December 1998.
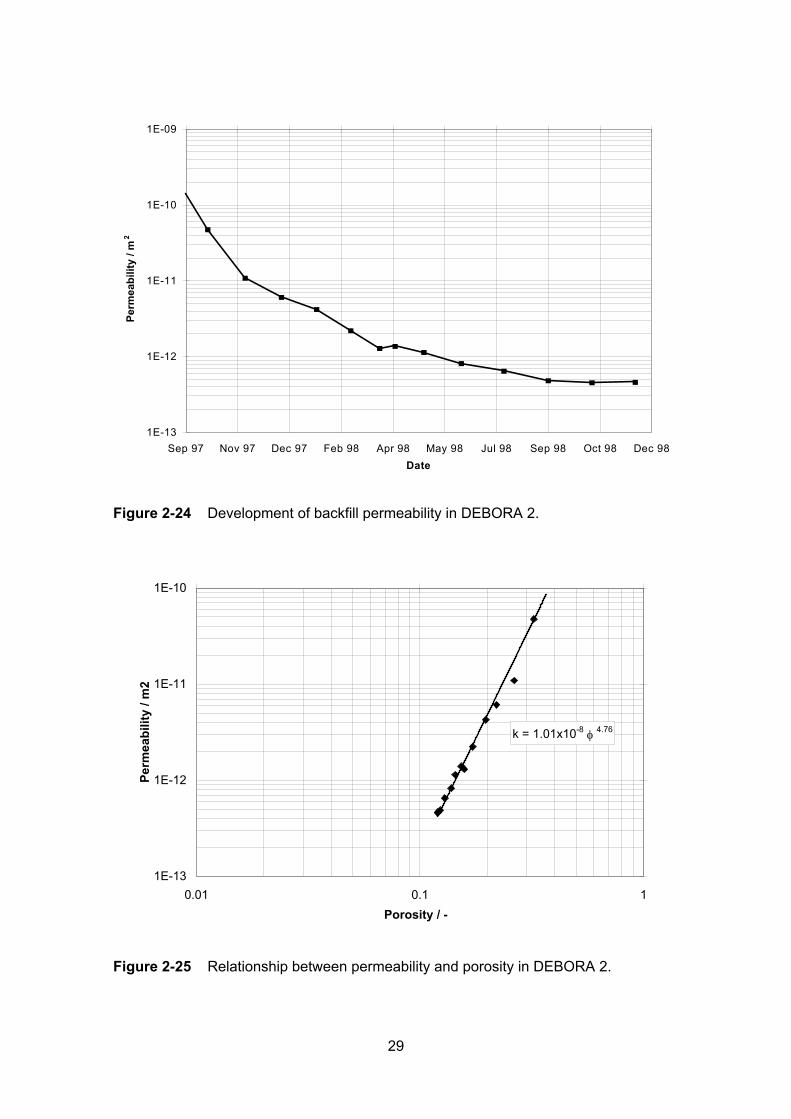
The corresponding decrease of backfill permeability over almost three orders of
magnitude from 1.4⋅10-10 m2 to 4.6⋅10-13 m2 is shown in Figure 2-24. Figure 2-25
presents the relationship between porosity and permeability as observed for this coarse
grained backfill material. This relationship differs slightly from that obtained in the
experiment DEBORA 1 (see Figure 2-16). The data of both experiments, however, are
within the 95 % confidence interval around the regression curve of the data evaluated
by Müller-Lyda et al. (1999).
Similar as in case of DEBORA 1 the test borehole was uncovered after termination of
the heating period in order to get access to the compacted crushed salt for post test
26
-2.00
-1.80
-1.60
-1.40
-1.20
-1.00
-0.80
-0.60
-0.40
-0.20
0.00
0.20
0.40
Sep 97 Nov 97 Dec 97 Feb 98 Apr 98 May 98 Jul 98 Sep 98 Oct 98 Dec 98
Axi
al S
tres
s / M
Pa
12.1 m14.1 m
Figure 2-20 Development of axial stress in the backfill of DEBORA 2.
240
250
260
270
280
290
300
310
Sep 97 Nov 97 Dec 97 Feb 98 Apr 98 May 98 Jul 98 Sep 98 Oct 98 Dec 98
Bor
ehol
e R
adiu
s / m
m
10.1 m12.1 m14.1 m
Figure 2-21 Development of borehole radius in DEBORA 2.
27
0.05
0.10
0.15
0.20
0.25
0.30
0.35
0.40
Sep 97 Nov 97 Dec 97 Feb 98 Apr 98 May 98 Jul 98 Sep 98 Oct 98 Dec 98
Poro
sity
/ -
10.1 m12.1 m14.1 m
Figure 2-22 Development of backfill porosity in DEBORA 2.
0.00
0.20
0.40
0.60
0.80
1.00
1.20
1.40
1.60
1.80
2.00
Sep 97 Nov 97 Dec 97 Feb 98 Apr 98 May 98 Jul 98 Sep 98 Oct 98 Dec 98
Dis
plac
emen
t Rat
e / m
m /
day
10.1 m
12.1 m
14.1 m
Figure 2-23 Development of displacement rates in DEBORA 2.
28
1E-13
1E-12
1E-11
1E-10
1E-09
Sep 97 Nov 97 Dec 97 Feb 98 Apr 98 May 98 Jul 98 Sep 98 Oct 98 Dec 98Date
Perm
eabi
lity
/ m2
Figure 2-24 Development of backfill permeability in DEBORA 2.
k = 1.01x10⁻⁸ φ 4.76
1E-13
1E-12
1E-11
1E-10
0.01 0.1 1Porosity / -
Perm
eabi
lity
/ m2
Figure 2-25 Relationship between permeability and porosity in DEBORA 2.
29
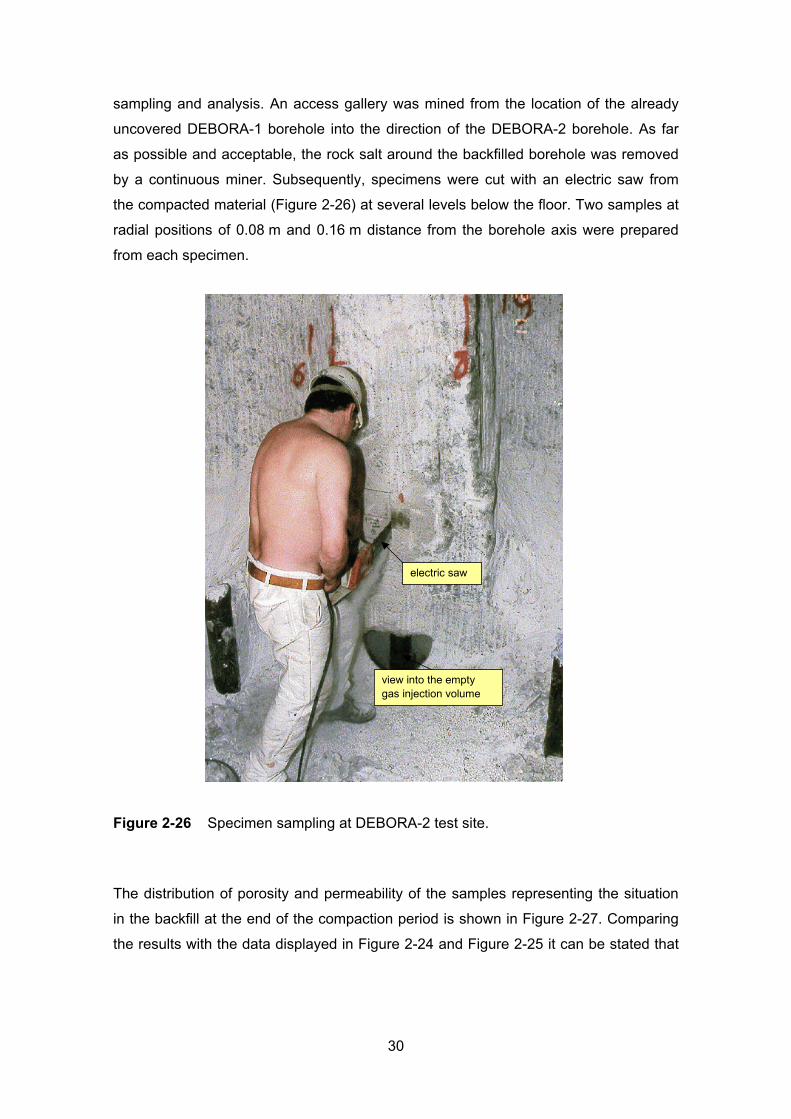
sampling and analysis. An access gallery was mined from the location of the already
uncovered DEBORA-1 borehole into the direction of the DEBORA-2 borehole. As far
as possible and acceptable, the rock salt around the backfilled borehole was removed
by a continuous miner. Subsequently, specimens were cut with an electric saw from
the compacted material (Figure 2-26) at several levels below the floor. Two samples at
radial positions of 0.08 m and 0.16 m distance from the borehole axis were prepared
from each specimen.
electric saw
view into the emptygas injection volume
Figure 2-26 Specimen sampling at DEBORA-2 test site.
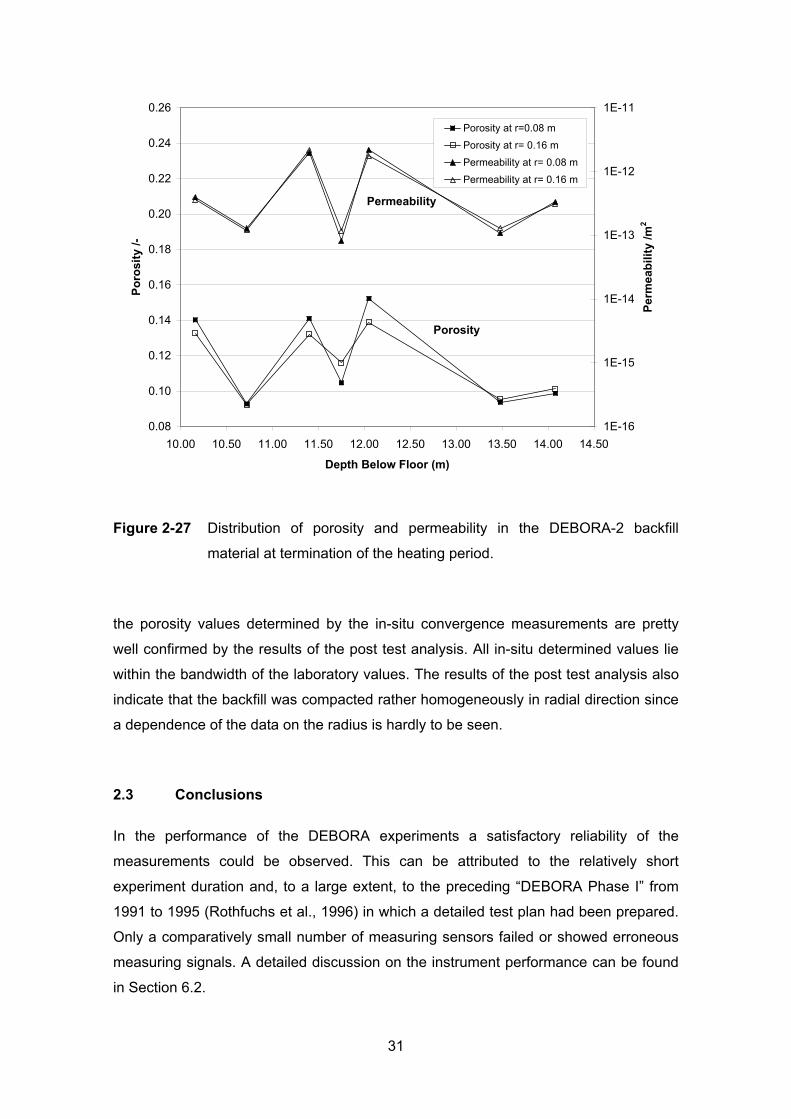
The distribution of porosity and permeability of the samples representing the situation
in the backfill at the end of the compaction period is shown in Figure 2-27. Comparing
the results with the data displayed in Figure 2-24 and Figure 2-25 it can be stated that
30
0.08
0.10
0.12
0.14
0.16
0.18
0.20
0.22
0.24
0.26
10.00 10.50 11.00 11.50 12.00 12.50 13.00 13.50 14.00 14.50
Depth Below Floor (m)
Poro
sity
/-
1E-16
1E-15
1E-14
1E-13
1E-12
1E-11
Perm
eabi
lity
/m2
Porosity at r=0.08 m
Porosity at r= 0.16 m
Permeability at r= 0.08 m
Permeability at r= 0.16 m
Porosity
Permeability
Figure 2-27 Distribution of porosity and permeability in the DEBORA-2 backfill
material at termination of the heating period.
the porosity values determined by the in-situ convergence measurements are pretty
well confirmed by the results of the post test analysis. All in-situ determined values lie
within the bandwidth of the laboratory values. The results of the post test analysis also
indicate that the backfill was compacted rather homogeneously in radial direction since
a dependence of the data on the radius is hardly to be seen.
2.3 Conclusions
In the performance of the DEBORA experiments a satisfactory reliability of the
measurements could be observed. This can be attributed to the relatively short
experiment duration and, to a large extent, to the preceding “DEBORA Phase I” from
1991 to 1995 (Rothfuchs et al., 1996) in which a detailed test plan had been prepared.
Only a comparatively small number of measuring sensors failed or showed erroneous
measuring signals. A detailed discussion on the instrument performance can be found
in Section 6.2.
31
In DEBORA 1, a maximum crushed salt temperature of about 185 °C was achieved
while the maximum temperature in DEBORA 2 amounted to about 135 °C. These
temperatures were more or less consistent with the concept for disposal of vitrified
high-level waste canisters in salt formations which allows a maximum temperature of
200 °C at the interface between the canister surface and the salt formation.
Caused by heating, an accelerated borehole closure and backfill compaction was
observed. In both experiments, the decrease of the borehole radius was measured at
three levels and azimuths. In DEBORA 1, the borehole radius decreased from initially
300 mm to 275 mm and in DEBORA 2 from initially 303 mm to 259 mm. The backfill
porosities were reduced from 38 % to 9 % and from 37 % to 12 %, respectively. The
backfill permeability was measured monthly. In DEBORA 1, the permeability decreased
from 5⋅10-12 m2 to 7⋅10-14 m2 and in DEBORA 2 from 1⋅10-10 m2 to 4⋅10-13 m2. The
corresponding relationships between permeability k and porosity φ were determined to
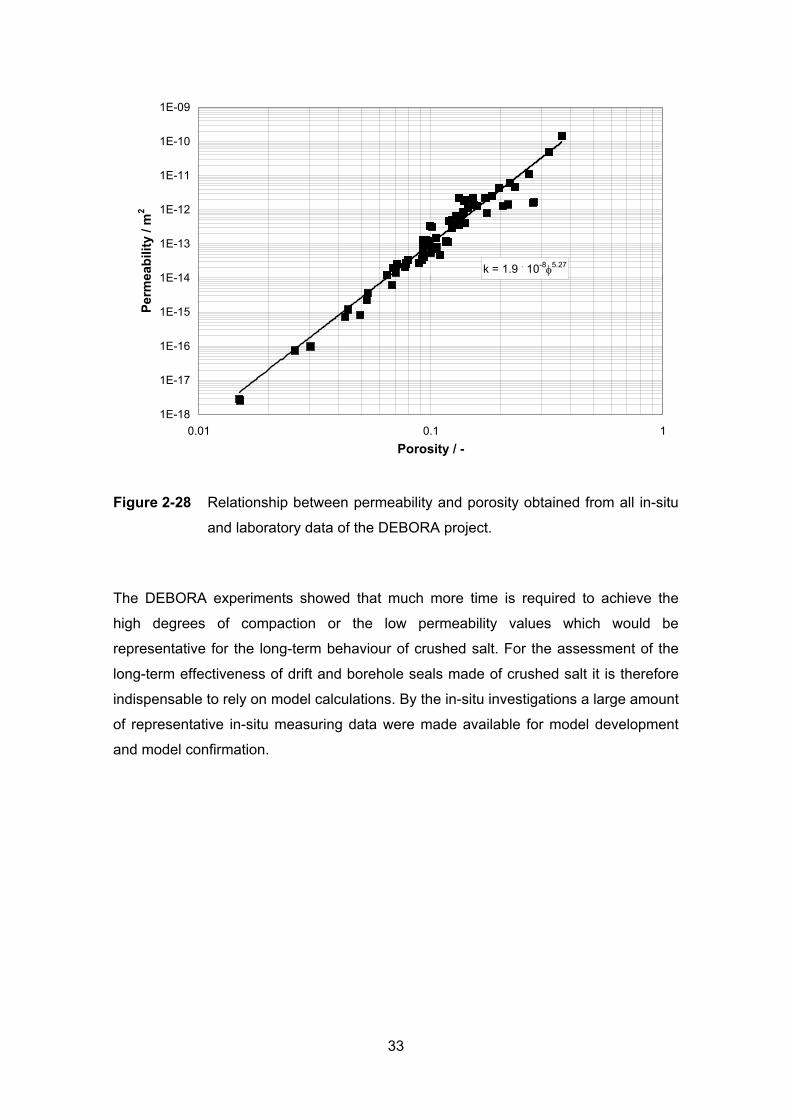
k = 4.74⋅10-9 φ 4.63 and k = 1.0⋅10-8 φ4.76, respectively. Comprising all project data, those
of the two in-situ experiments, of the post-test analyses, and of the parallel performed
laboratory investigations (see Section 3) the relationship was determined to
k = 1.9⋅10-8 φ5.27 (see Figure 2-28).
The achieved final permeabilities in both experiments were still rather high in
comparison to the very low permeabilities of less than 10-21 m2 measured by Wieczorek
et al. (1998) in situ in undisturbed rock salt in the Asse mine. It is questionable, whether
such permeabilities are achievable by simple mechanical compaction of dry crushed
salt. However, the relationship between permeability and porosity obtained from
DEBORA 1 seems to satisfy not only the observed upper permeability/porosity range of
interest, but also its lower part. Using the porosity of 0.004 given by Jockwer et al.
(1995) as a minimum value for Asse salt, the relationship yields a permeability of
5 ⋅10-22 m2 which is in good agreement with the in-situ data measured in undisturbed
rock salt.
The differences between the results obtained in DEBORA 1 and DEBORA 2 were
small. Despite of the different grain size distribution of the backfill used in the
experiments, the compaction behaviour seemed to be rather similar. The
permeability/porosity data of both experiments, for instance, are lying within the 95 %
confidence interval of the regression line determined by Müller-Lyda et al. (1996) on
the basis of respective data published earlier by several other investigators.
32
k = 1.9 . 10-8φ5.27
1E-18
1E-17
1E-16
1E-15
1E-14
1E-13
1E-12
1E-11
1E-10
1E-09
0.01 0.1 1Porosity / -
Perm
eabi
lity
/ m2
Figure 2-28 Relationship between permeability and porosity obtained from all in-situ
and laboratory data of the DEBORA project.
The DEBORA experiments showed that much more time is required to achieve the
high degrees of compaction or the low permeability values which would be
representative for the long-term behaviour of crushed salt. For the assessment of the
long-term effectiveness of drift and borehole seals made of crushed salt it is therefore
indispensable to rely on model calculations. By the in-situ investigations a large amount
of representative in-situ measuring data were made available for model development
and model confirmation.
33
3 Laboratory Investigations
The major objective of the laboratory experiments was to investigate the compaction
behaviour of fine- and coarse-grained crushed salt backfill. In addition to this, the
sealing capability of the backfill was to be determined by the investigation of the gas
permeability in dependence of the degree of compaction.
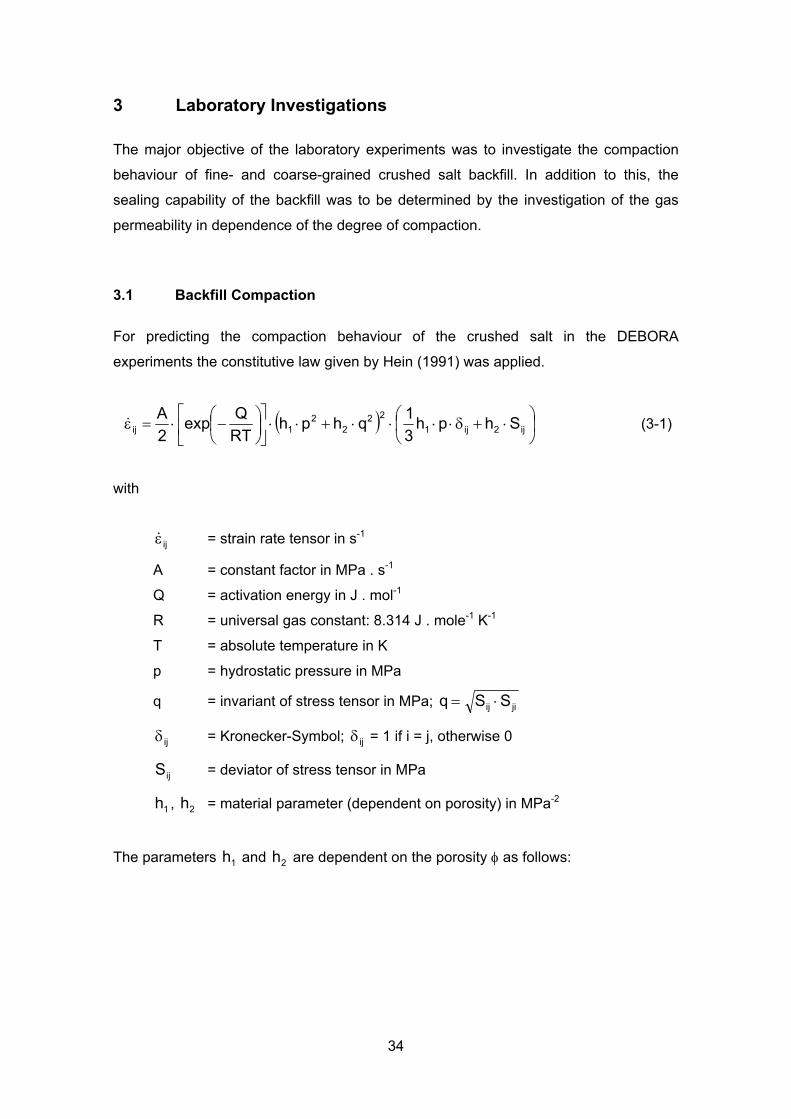
3.1 Backfill Compaction
For predicting the compaction behaviour of the crushed salt in the DEBORA
experiments the constitutive law given by Hein (1991) was applied.
( ) ⎟⎠⎞
⎜⎝⎛ ⋅+δ⋅⋅⋅⋅+⋅⋅⎥
⎦
⎤⎢⎣
⎡⎟⎠⎞
⎜⎝⎛−⋅=ε ij2ij1
222
21ij Shph
31qhph
RTQexp
2A
& (3-1)
with
= strain rate tensor in s-1
A = constant factor in MPa . s-1
Q = activation energy in J . mol-1
R = universal gas constant: 8.314 J . mole-1 K-1
T = absolute temperature in K
p = hydrostatic pressure in MPa
q = invariant of stress tensor in MPa;
ijε&
jiij SSq ⋅=
ij
= Kronecker-Symbol; ijδ δ = 1 if i = j, otherwise 0
= deviator of stress tensor in MPa
, h = material parameter (dependent on porosity) in MPa-2
ijS
1h 2
The parameters and are dependent on the porosity φ as follows: 1h 2h
34
( ) ( )2
05
4
23
1
111
15
⎟⎟
⎠
⎞
⎜⎜
⎝
⎛
⎟⎟
⎠
⎞
⎜⎜
⎝
⎛−⎟⎟
⎠
⎞⎜⎜⎝
⎛φ−φ−
⋅φ−=φ
c
cc
cdh , ( ) ( )φ⋅+=φ 1762 hcch (3-2)
with ( ) ( )φ⋅⋅=φ 21 cexpcd
ϕtan
being a further porosity dependent material parameter,
being the coefficient of internal friction (
3c
ϕ =angle of internal friction) and 0φ
being the initial porosity of the crushed salt.
The flow condition for crushed salt as given by Hein is presented in equation (3-3).
1qhphnqpd 2
22
1
2
=⋅+⋅+⎟⎟⎠
⎞⎜⎜⎝
⎛− (3-3)
In order to determine the porosity dependent parameters h1, h2 and d, pairs of the p,
q-values and the dilatancy factor n are determined by compaction tests in which the
transition from the elastic to the irreversible plastic behaviour is reached. By performing
three independent tests three linearly independent equations are obtained which
permits to solve equation (3-3) for a defined porosity. The coefficient of internal friction
which is explicitly contained in the factor of dilatancy must be determined in a separate
test.
For the experimental determination of the material parameters several crushed salt
compaction tests in two triaxial cells and in an oedometer were conducted.
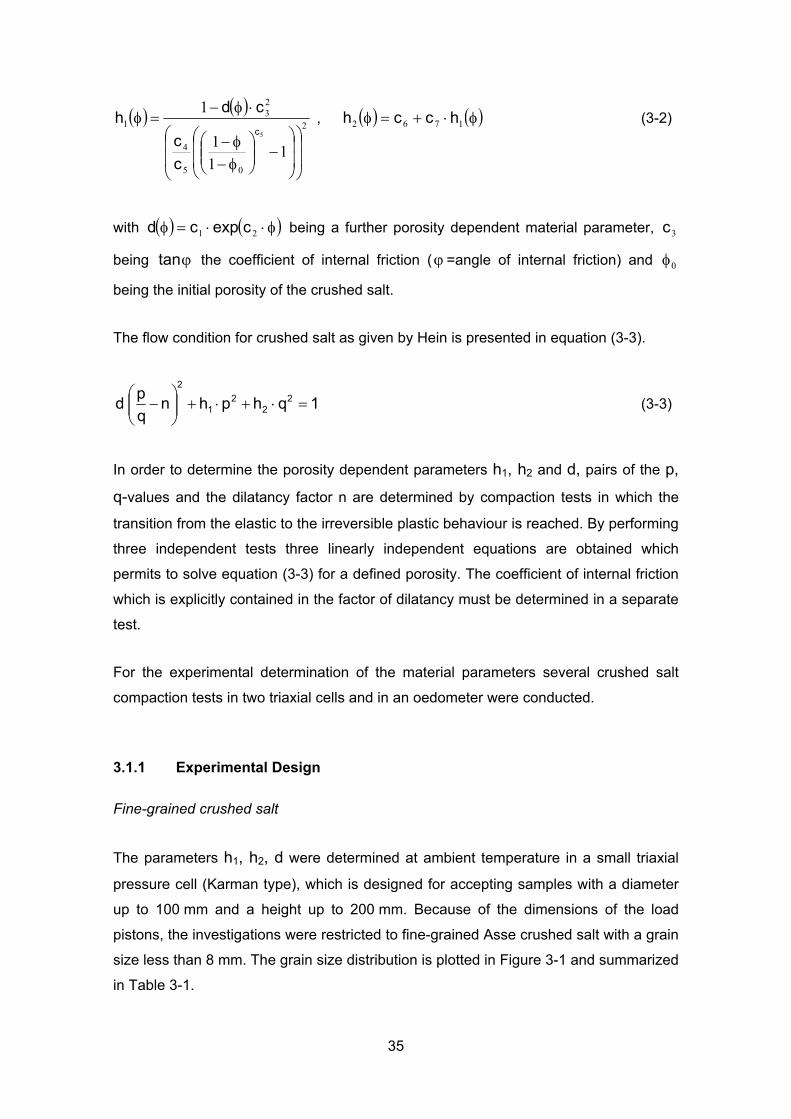
3.1.1 Experimental Design
Fine-grained crushed salt
The parameters h1, h2, d were determined at ambient temperature in a small triaxial
pressure cell (Karman type), which is designed for accepting samples with a diameter
up to 100 mm and a height up to 200 mm. Because of the dimensions of the load
pistons, the investigations were restricted to fine-grained Asse crushed salt with a grain
size less than 8 mm. The grain size distribution is plotted in Figure 3-1 and summarized
in Table 3-1.
35
0
20
40
60
80
100
120
0,001 0,01 0,1 1 10grain size [mm]
siev
e pa
ssag
e [%
]
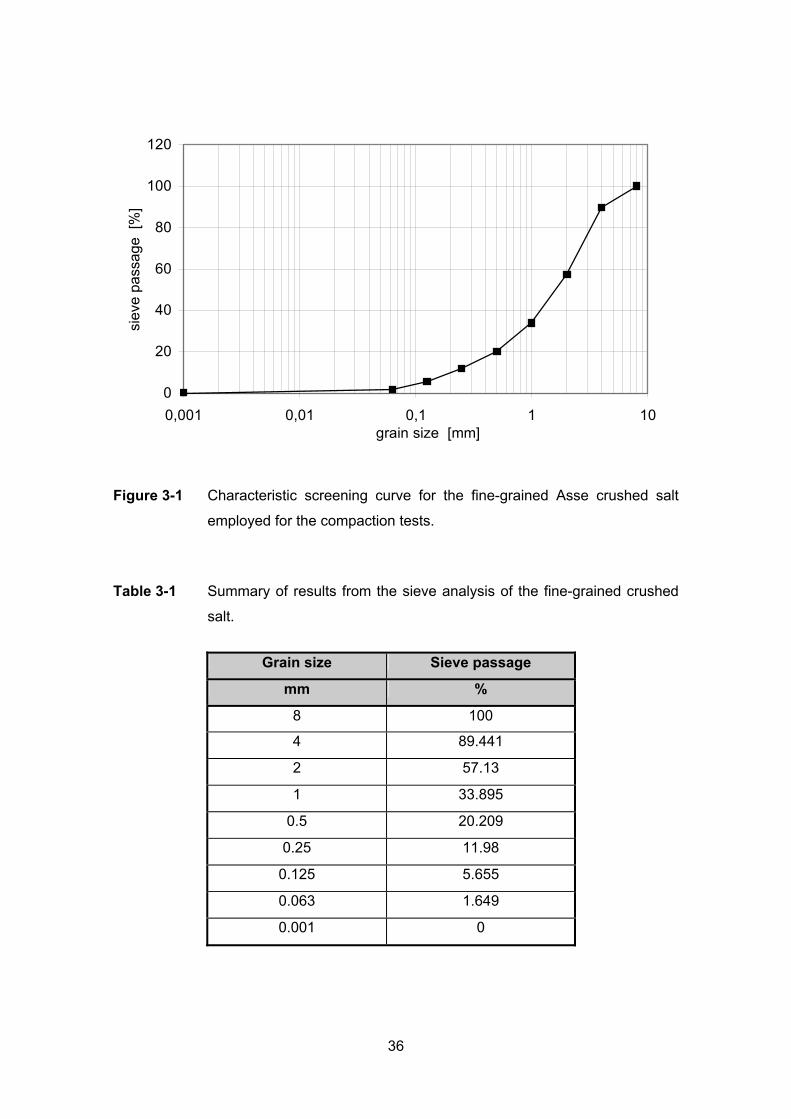
Figure 3-1 Characteristic screening curve for the fine-grained Asse crushed salt
employed for the compaction tests.
Table 3-1 Summary of results from the sieve analysis of the fine-grained crushed
salt.
Grain size Sieve passage
mm %
8 100
4 89.441
2 57.13
1 33.895
0.5 20.209
0.25 11.98
0.125 5.655
0.063 1.649
0.001 0
36
For determining the porosity, the grain density was always measured following the
specifications in DIN 18124 with the use of a Beckman air pycnometer. An important
requirement for all of these tests is the determination of the water content in the
material supplied. This measurement was performed by furnace drying following the
DIN 18121. For this purpose, a partial sample is dried at 105 °C for about 72 hours,
and the water content is determined by weighing. Furthermore, characteristic screening
curves are determined for the loose material. The axial deformation of the test
specimen is measured with the use of a displacement gauge. The volumetric
compressive strain can likewise be determined very accurately by means of an
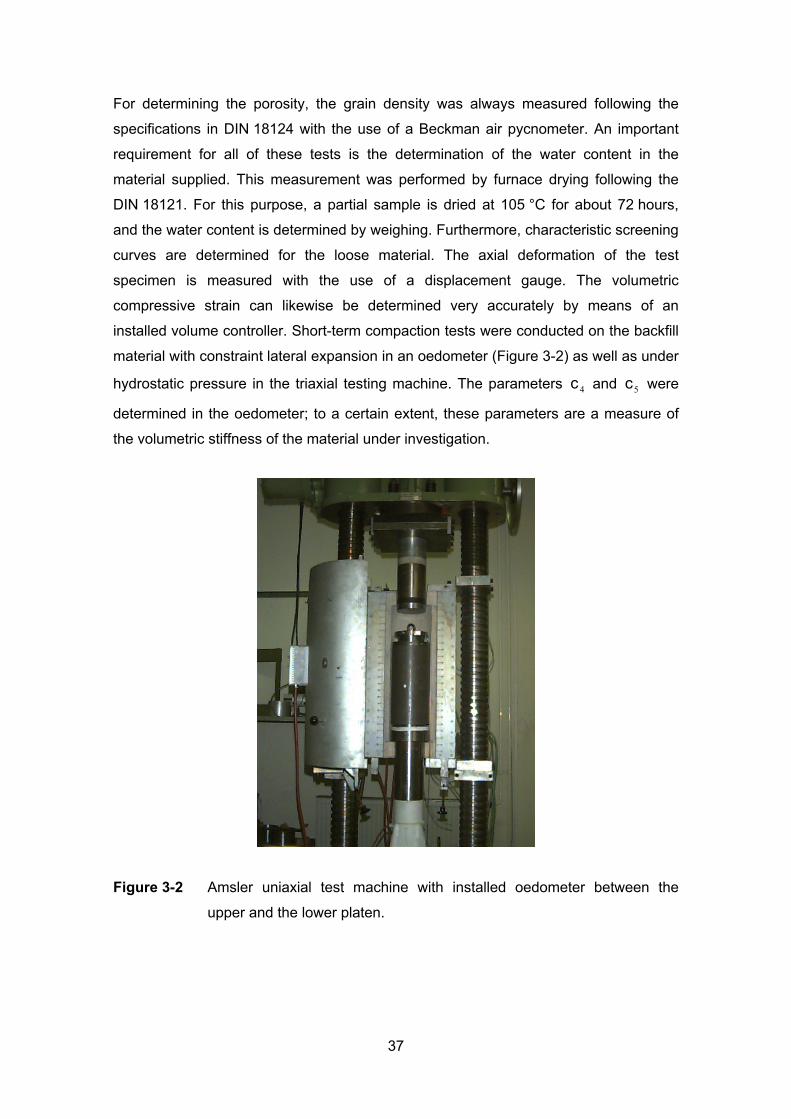
installed volume controller. Short-term compaction tests were conducted on the backfill
material with constraint lateral expansion in an oedometer (Figure 3-2) as well as under
hydrostatic pressure in the triaxial testing machine. The parameters c and c were
determined in the oedometer; to a certain extent, these parameters are a measure of
the volumetric stiffness of the material under investigation.
4 5
Figure 3-2 Amsler uniaxial test machine with installed oedometer between the
upper and the lower platen.
37
Also the coefficient of internal friction was determined by tests in the small triaxial
testing machine.
Coarse-grained crushed salt
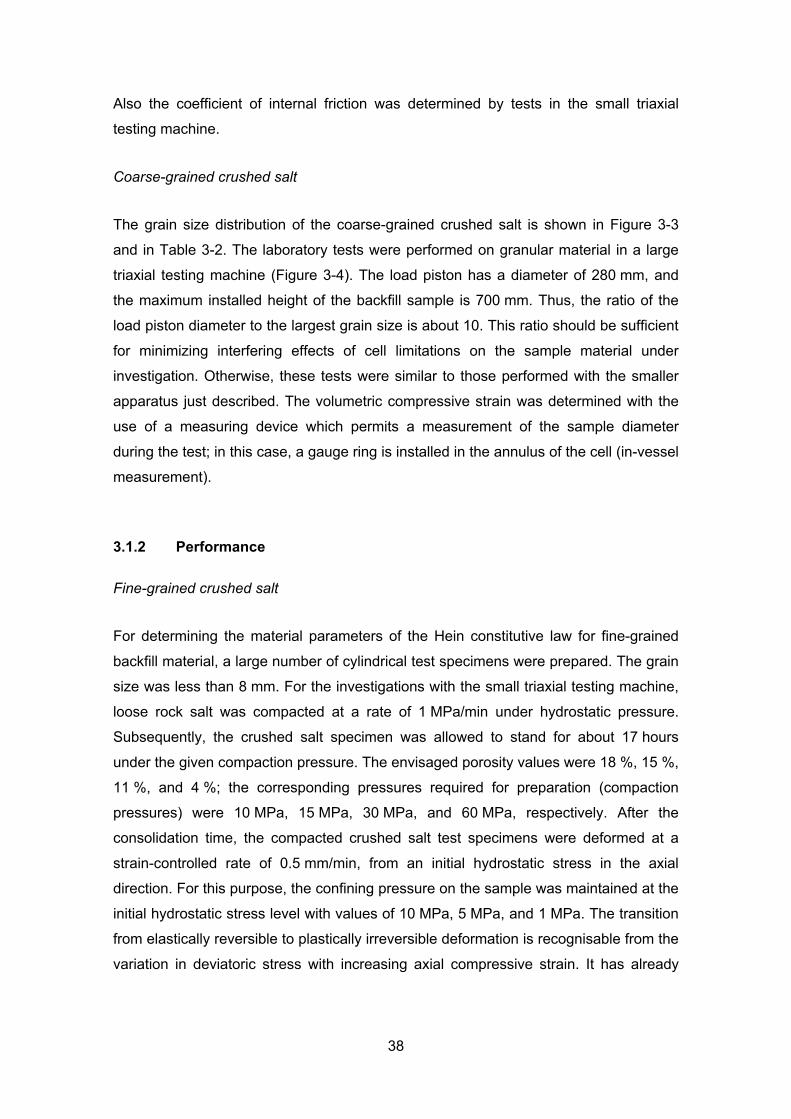
The grain size distribution of the coarse-grained crushed salt is shown in Figure 3-3
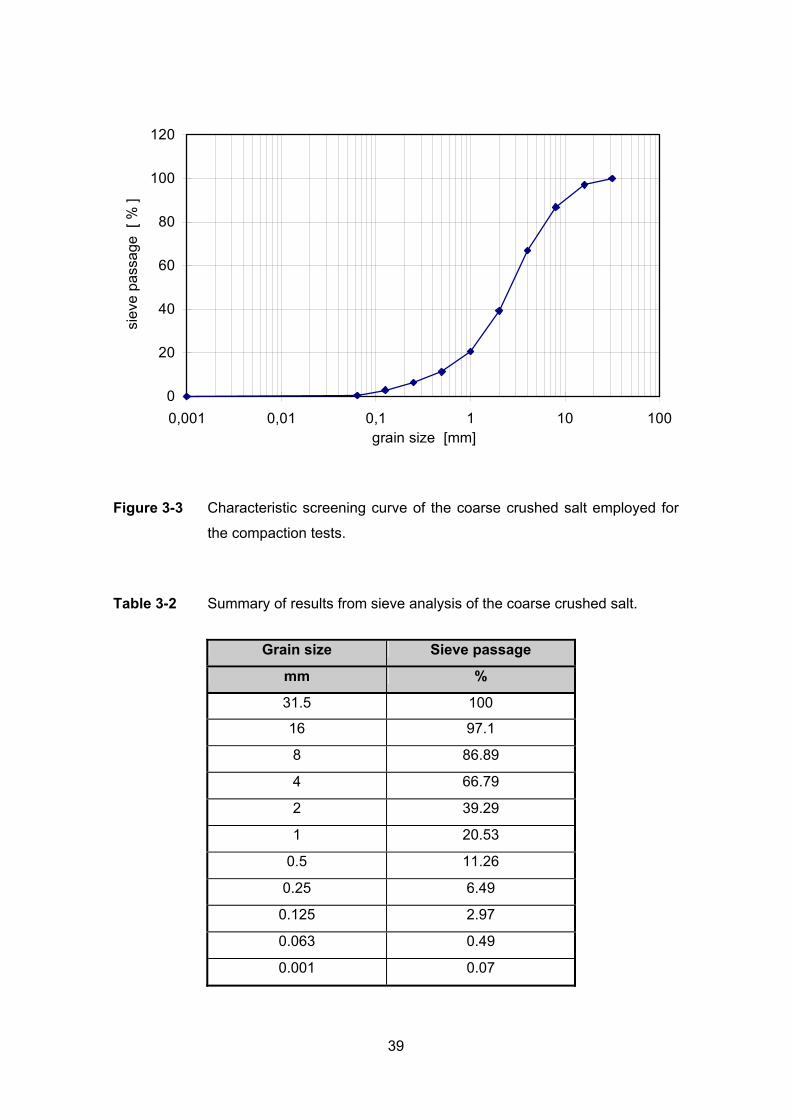
and in Table 3-2. The laboratory tests were performed on granular material in a large
triaxial testing machine (Figure 3-4). The load piston has a diameter of 280 mm, and
the maximum installed height of the backfill sample is 700 mm. Thus, the ratio of the
load piston diameter to the largest grain size is about 10. This ratio should be sufficient
for minimizing interfering effects of cell limitations on the sample material under
investigation. Otherwise, these tests were similar to those performed with the smaller
apparatus just described. The volumetric compressive strain was determined with the
use of a measuring device which permits a measurement of the sample diameter
during the test; in this case, a gauge ring is installed in the annulus of the cell (in-vessel
measurement).
3.1.2 Performance
Fine-grained crushed salt
For determining the material parameters of the Hein constitutive law for fine-grained
backfill material, a large number of cylindrical test specimens were prepared. The grain
size was less than 8 mm. For the investigations with the small triaxial testing machine,
loose rock salt was compacted at a rate of 1 MPa/min under hydrostatic pressure.
Subsequently, the crushed salt specimen was allowed to stand for about 17 hours
under the given compaction pressure. The envisaged porosity values were 18 %, 15 %,
11 %, and 4 %; the corresponding pressures required for preparation (compaction
pressures) were 10 MPa, 15 MPa, 30 MPa, and 60 MPa, respectively. After the
consolidation time, the compacted crushed salt test specimens were deformed at a
strain-controlled rate of 0.5 mm/min, from an initial hydrostatic stress in the axial
direction. For this purpose, the confining pressure on the sample was maintained at the
initial hydrostatic stress level with values of 10 MPa, 5 MPa, and 1 MPa. The transition
from elastically reversible to plastically irreversible deformation is recognisable from the
variation in deviatoric stress with increasing axial compressive strain. It has already
38
0
20
40
60
80
100
120
0,001 0,01 0,1 1 10 100grain size [mm]
siev
e pa
ssag
e [
% ]
Figure 3-3 Characteristic screening curve of the coarse crushed salt employed for
the compaction tests.
Table 3-2 Summary of results from sieve analysis of the coarse crushed salt.
Grain size Sieve passage
mm %
31.5 100
16 97.1
8 86.89
4 66.79
2 39.29
1 20.53
0.5 11.26
0.25 6.49
0.125 2.97
0.063 0.49
0.001 0.07
39
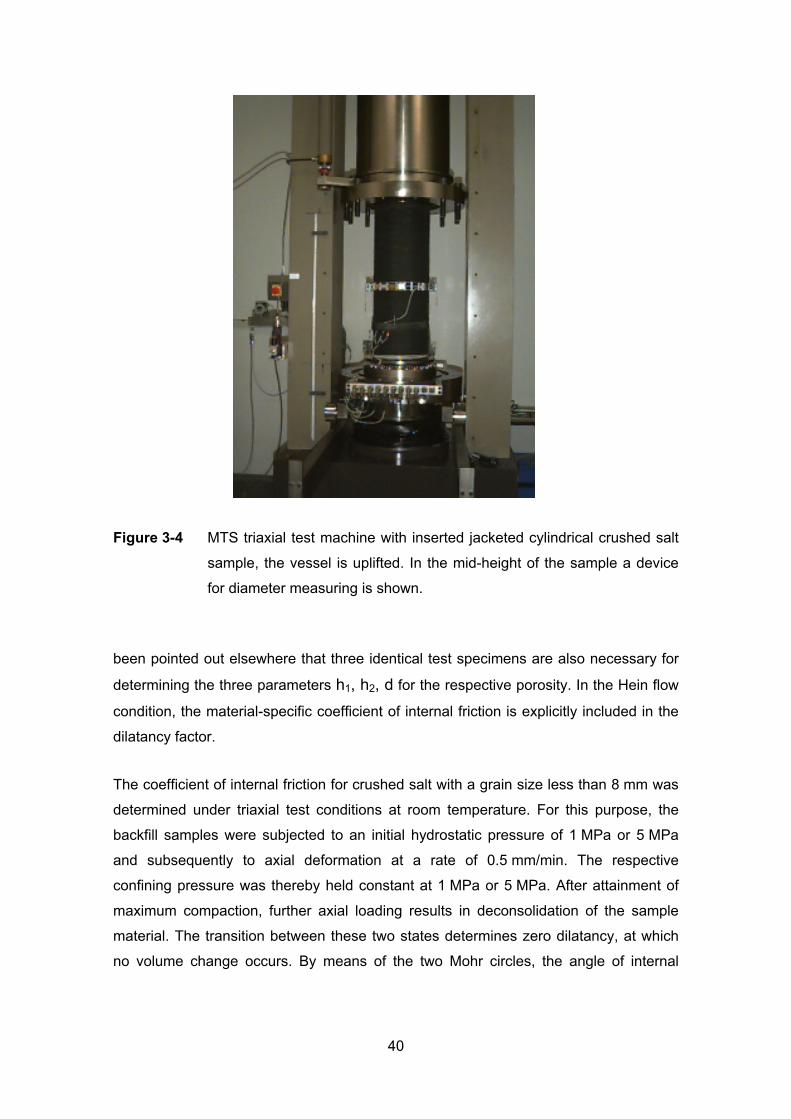
Figure 3-4 MTS triaxial test machine with inserted jacketed cylindrical crushed salt
sample, the vessel is uplifted. In the mid-height of the sample a device
for diameter measuring is shown.
been pointed out elsewhere that three identical test specimens are also necessary for
determining the three parameters h1, h2, d for the respective porosity. In the Hein flow
condition, the material-specific coefficient of internal friction is explicitly included in the
dilatancy factor.
The coefficient of internal friction for crushed salt with a grain size less than 8 mm was
determined under triaxial test conditions at room temperature. For this purpose, the
backfill samples were subjected to an initial hydrostatic pressure of 1 MPa or 5 MPa
and subsequently to axial deformation at a rate of 0.5 mm/min. The respective
confining pressure was thereby held constant at 1 MPa or 5 MPa. After attainment of
maximum compaction, further axial loading results in deconsolidation of the sample
material. The transition between these two states determines zero dilatancy, at which
no volume change occurs. By means of the two Mohr circles, the angle of internal
40
friction or the coefficient of internal friction can be determined in the well-known τ,σ-plot
after Mohr-Coulomb (Leibholz 1968).
For the compaction of backfill samples with defined porosity, certain preparation
pressures are necessary for short-term compacting. A functional relationship exists
between the irreversible volumetric compressive strain and the applied pressure; this
relationship depends on the initial porosity. The material parameters and which
describe this relationship have been determined in the laboratory. For the backfill
material of grain size less than 8 mm, the results have been obtained from oedometer
or triaxial tests (hydrostatic). In the oedometer, tests were performed at ambient
temperature and at 150 °C; the axial rate was 0.1 mm / min. The values for the heated
samples were lower by 30 % or 15 %.
4c 5c
4c 5c
Coarse-grained crushed salt
The tests conducted with the large triaxial test machine for determining the material
parameters, such as the angle of internal friction ϕ as well as and , were always
performed in the same manner as those with the smaller triaxial testing machine. The
dimensions allow testing of backfill samples with grain sizes of the order of 30 mm.
First tests for determining the parameters for the flow condition given by the Hein flow
rule have revealed that the samples with porosities of 17 % and 14 % under a
supporting confining pressure of 5 MPa have already lost their internal coherence at an
axial pressure of 6 MPa and 7 MPa, respectively.
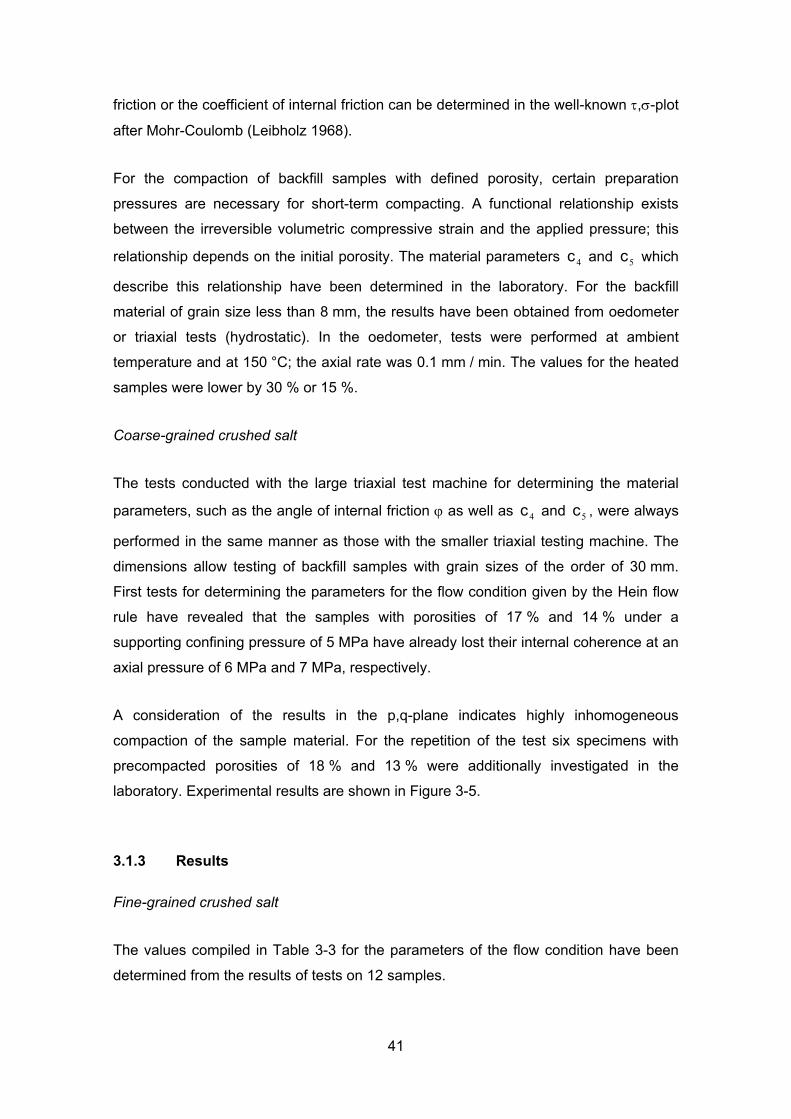
A consideration of the results in the p,q-plane indicates highly inhomogeneous
compaction of the sample material. For the repetition of the test six specimens with
precompacted porosities of 18 % and 13 % were additionally investigated in the
laboratory. Experimental results are shown in Figure 3-5.
3.1.3 Results
Fine-grained crushed salt
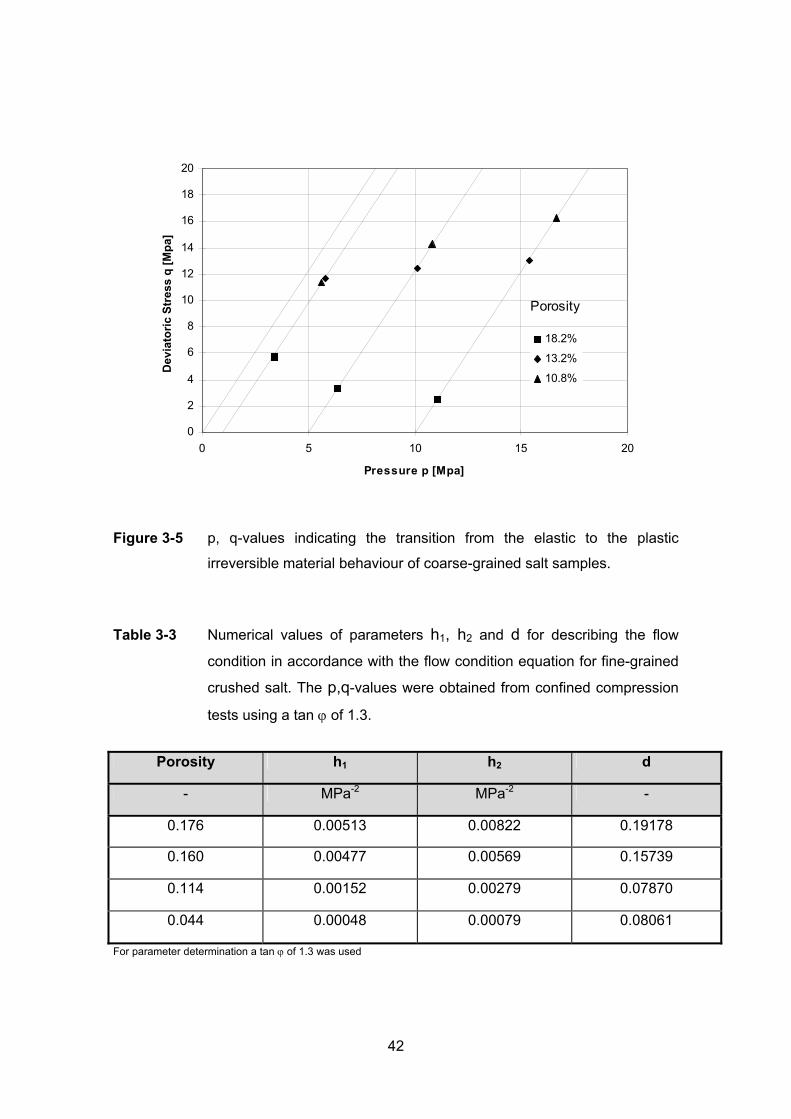
The values compiled in Table 3-3 for the parameters of the flow condition have been
determined from the results of tests on 12 samples.
41
0
2
4
6
8
10
12
14
16
18
20
0 5 10 15 20
Pressure p [Mpa]
Dev
iato
ric S
tres
s q
[Mpa
]
18.2%
13.2%
10.8%
Porosity
Figure 3-5 p, q-values indicating the transition from the elastic to the plastic
irreversible material behaviour of coarse-grained salt samples.
Table 3-3 Numerical values of parameters h1, h2 and d for describing the flow
condition in accordance with the flow condition equation for fine-grained
crushed salt. The p,q-values were obtained from confined compression
tests using a tan ϕ of 1.3.
Porosity h1 h2 d
- MPa-2 MPa-2 -
0.176 0.00513 0.00822 0.19178
0.160 0.00477 0.00569 0.15739
0.114 0.00152 0.00279 0.07870
0.044 0.00048 0.00079 0.08061
For parameter determination a tan ϕ of 1.3 was used
42
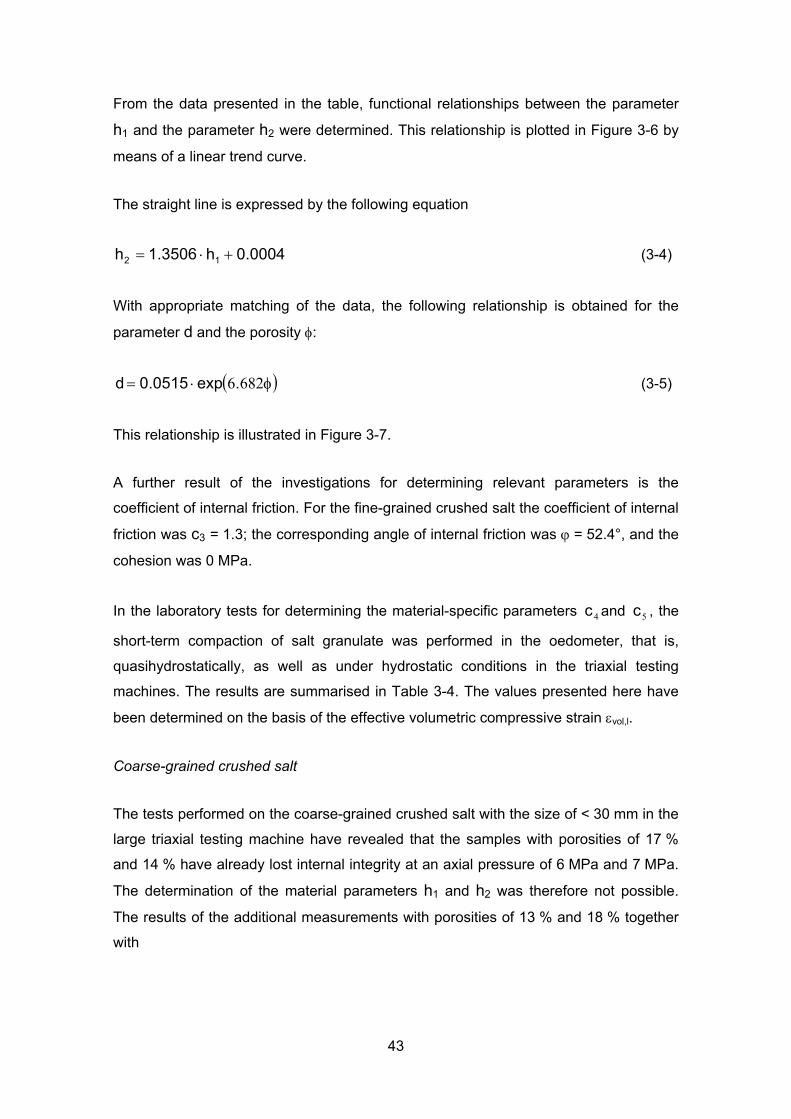
From the data presented in the table, functional relationships between the parameter
h1 and the parameter h2 were determined. This relationship is plotted in Figure 3-6 by
means of a linear trend curve.
The straight line is expressed by the following equation
0.0004h1.3506h 12 +⋅= (3-4)
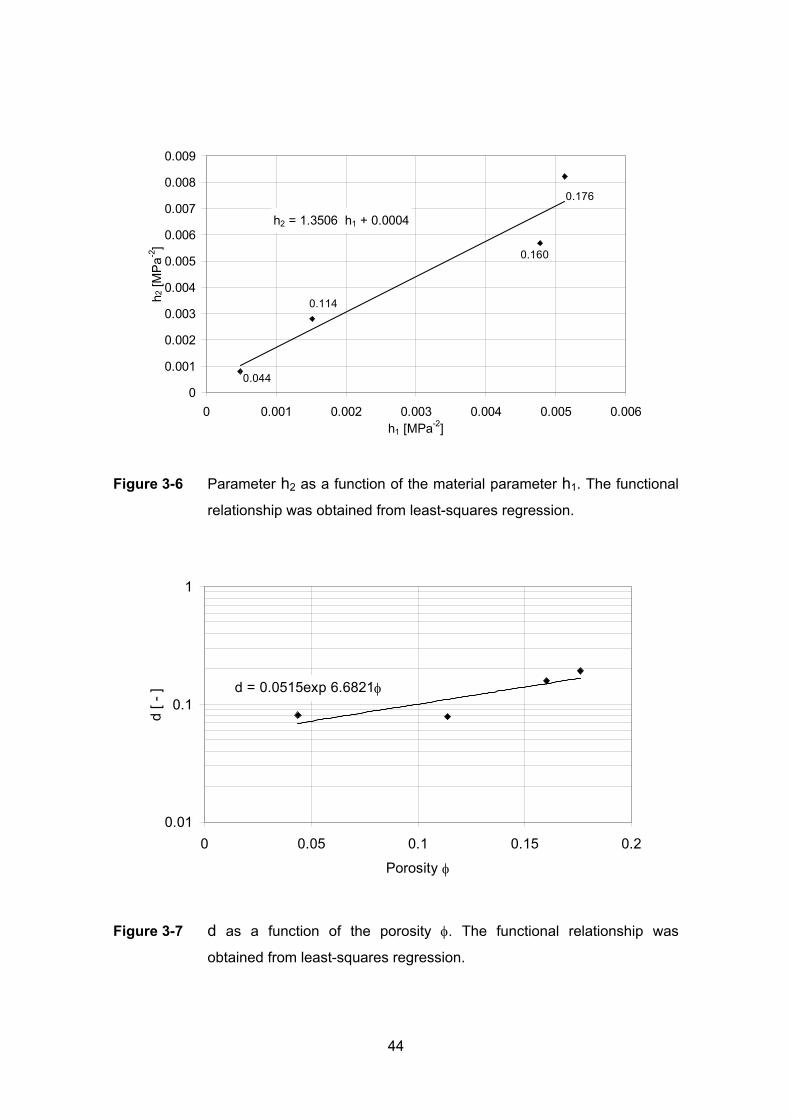
With appropriate matching of the data, the following relationship is obtained for the
parameter d and the porosity φ:
( φ⋅= 6826.exp0.0515d ) (3-5)
This relationship is illustrated in Figure 3-7.
A further result of the investigations for determining relevant parameters is the
coefficient of internal friction. For the fine-grained crushed salt the coefficient of internal
friction was c3 = 1.3; the corresponding angle of internal friction was ϕ = 52.4°, and the
cohesion was 0 MPa.
In the laboratory tests for determining the material-specific parameters and , the
short-term compaction of salt granulate was performed in the oedometer, that is,
quasihydrostatically, as well as under hydrostatic conditions in the triaxial testing
machines. The results are summarised in
4c 5c
Table 3-4. The values presented here have
been determined on the basis of the effective volumetric compressive strain εvol,l.
Coarse-grained crushed salt
The tests performed on the coarse-grained crushed salt with the size of < 30 mm in the
large triaxial testing machine have revealed that the samples with porosities of 17 %
and 14 % have already lost internal integrity at an axial pressure of 6 MPa and 7 MPa.
The determination of the material parameters h1 and h2 was therefore not possible.
The results of the additional measurements with porosities of 13 % and 18 % together
with
43
h2 = 1.3506 h1 + 0.0004
0
0.001
0.002
0.003
0.004
0.005
0.006
0.007
0.008
0.009
0 0.001 0.002 0.003 0.004 0.005 0.006h1 [MPa-2]
h 2 [M
Pa-2
]
0.044
0.114
0.160
0.176
Figure 3-6 Parameter h2 as a function of the material parameter h1. The functional
relationship was obtained from least-squares regression.
d = 0.0515exp 6.6821φ
0.01
0.1
1
0 0.05 0.1 0.15 0.2
Porosity φ
d [ -
]
Figure 3-7 d as a function of the porosity φ. The functional relationship was
obtained from least-squares regression.
44
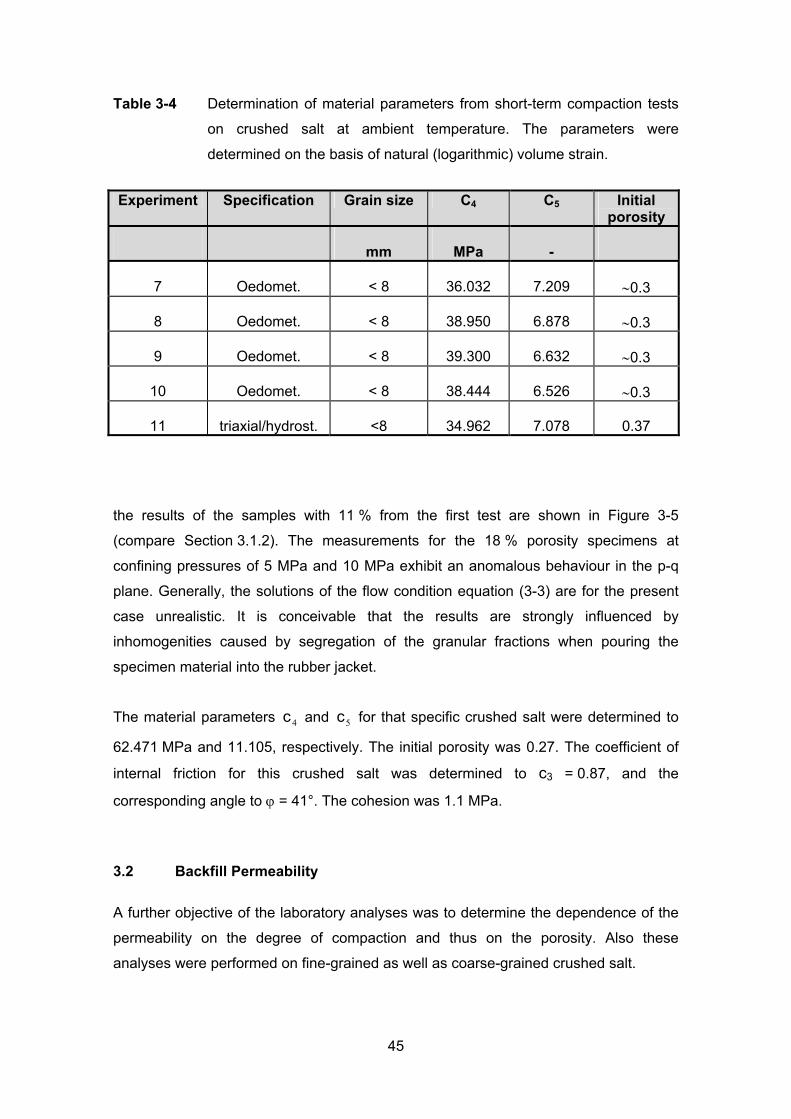
Table 3-4 Determination of material parameters from short-term compaction tests
on crushed salt at ambient temperature. The parameters were
determined on the basis of natural (logarithmic) volume strain.
Experiment Specification Grain size C4 C5 Initial porosity
mm MPa -
7 Oedomet. < 8 36.032 7.209 ∼0.3
8 Oedomet. < 8 38.950 6.878 ∼0.3
9 Oedomet. < 8 39.300 6.632 ∼0.3
10 Oedomet. < 8 38.444 6.526 ∼0.3
11 triaxial/hydrost. <8 34.962 7.078 0.37
the results of the samples with 11 % from the first test are shown in Figure 3-5
(compare Section 3.1.2). The measurements for the 18 % porosity specimens at
confining pressures of 5 MPa and 10 MPa exhibit an anomalous behaviour in the p-q
plane. Generally, the solutions of the flow condition equation (3-3) are for the present
case unrealistic. It is conceivable that the results are strongly influenced by
inhomogenities caused by segregation of the granular fractions when pouring the
specimen material into the rubber jacket.
The material parameters and for that specific crushed salt were determined to
62.471 MPa and 11.105, respectively. The initial porosity was 0.27. The coefficient of
internal friction for this crushed salt was determined to c3 = 0.87, and the
corresponding angle to ϕ = 41°. The cohesion was 1.1 MPa.
4c 5c
3.2 Backfill Permeability
A further objective of the laboratory analyses was to determine the dependence of the
permeability on the degree of compaction and thus on the porosity. Also these
analyses were performed on fine-grained as well as coarse-grained crushed salt.
45
3.2.1 Experimental Design
Fine-grained crushed salt
These measurements were also performed in the small triaxial testing machine which
accommodates test samples of dimensions up to 100 mm in diameter and 200 mm in
height. The radial and axial stresses could be controlled independently of one another.
The permeability measurements were performed with axial flow of nitrogen through the
test specimens. The gas injection pressure was determined with the use of pressure
transducers, and the gas flow rate was measured with thermal mass flow sensors. At
very low permeabilities, the volume flow rate of the gas was measurable only from the
displacement of water in a burette.
Coarse-grained crushed salt
The permeability determinations were performed in combination with the
measurements for determining the angle of internal friction and the parameters h1 and
h2 of the Hein's constitutive law. In order to avoid unnecessary interferences with these
measurements, the permeability was determined at the initial hydrostatic stresses
intended for these experiments or at the associated initial porosities.
The measurements were performed in the triaxial testing machine which
accommodates test samples of dimensions up to 280 mm in diameter and 700 mm in
height. Also here, the radial and axial stresses could be controlled independently of
one another. The permeability measurements were performed with axial flow of
nitrogen through the test specimens. Again, the gas injection pressure was determined
by use of pressure transducers, and the gas flow rate was measured with thermal
mass flow sensors.
3.2.2 Performance
Fine-grained crushed salt
The same fine-grained Asse crushed salt with a grain size less than 8 mm which was
used in the compaction tests (see Section 3.1.1) was employed for preparing the test
specimens.
46
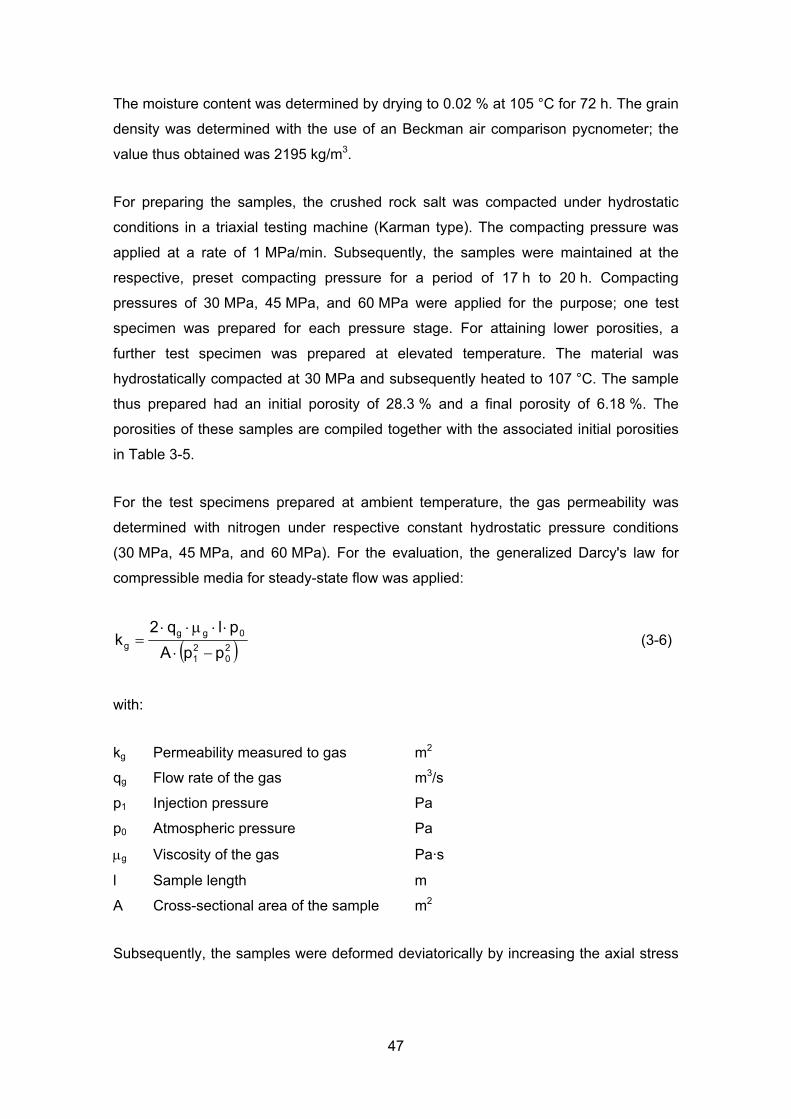
The moisture content was determined by drying to 0.02 % at 105 °C for 72 h. The grain
density was determined with the use of an Beckman air comparison pycnometer; the
value thus obtained was 2195 kg/m3.
For preparing the samples, the crushed rock salt was compacted under hydrostatic
conditions in a triaxial testing machine (Karman type). The compacting pressure was
applied at a rate of 1 MPa/min. Subsequently, the samples were maintained at the
respective, preset compacting pressure for a period of 17 h to 20 h. Compacting
pressures of 30 MPa, 45 MPa, and 60 MPa were applied for the purpose; one test
specimen was prepared for each pressure stage. For attaining lower porosities, a
further test specimen was prepared at elevated temperature. The material was
hydrostatically compacted at 30 MPa and subsequently heated to 107 °C. The sample
thus prepared had an initial porosity of 28.3 % and a final porosity of 6.18 %. The
porosities of these samples are compiled together with the associated initial porosities
in Table 3-5.
For the test specimens prepared at ambient temperature, the gas permeability was
determined with nitrogen under respective constant hydrostatic pressure conditions
(30 MPa, 45 MPa, and 60 MPa). For the evaluation, the generalized Darcy's law for
compressible media for steady-state flow was applied:
( )20
21
0ggg ppA
plq2k
−⋅
⋅⋅μ⋅⋅= (3-6)
with:
kg Permeability measured to gas m2
qg Flow rate of the gas m3/s
p1 Injection pressure Pa
p0 Atmospheric pressure Pa
μg Viscosity of the gas Pa·s
l Sample length m
A Cross-sectional area of the sample m2
Subsequently, the samples were deformed deviatorically by increasing the axial stress
47
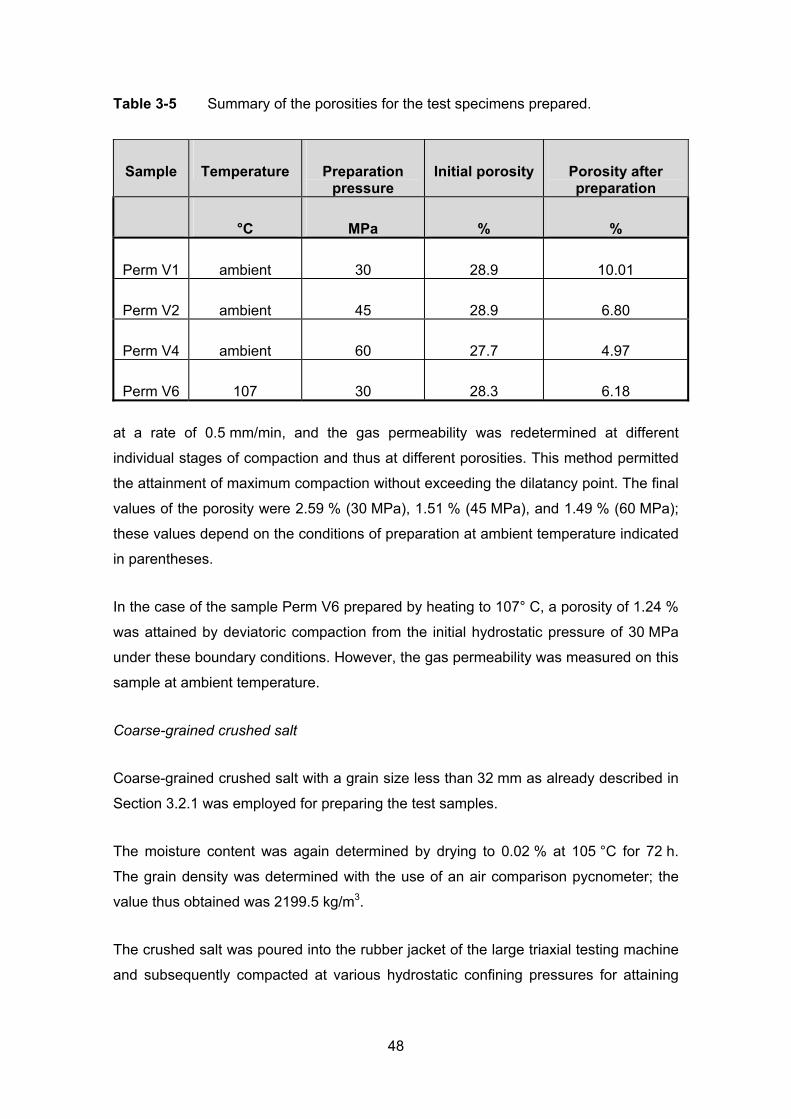
Table 3-5 Summary of the porosities for the test specimens prepared.
Sample Temperature Preparation pressure
Initial porosity Porosity after preparation
°C MPa % %
Perm V1 ambient 30 28.9 10.01
Perm V2 ambient 45 28.9 6.80
Perm V4 ambient 60 27.7 4.97
Perm V6 107 30 28.3 6.18
at a rate of 0.5 mm/min, and the gas permeability was redetermined at different
individual stages of compaction and thus at different porosities. This method permitted
the attainment of maximum compaction without exceeding the dilatancy point. The final
values of the porosity were 2.59 % (30 MPa), 1.51 % (45 MPa), and 1.49 % (60 MPa);
these values depend on the conditions of preparation at ambient temperature indicated
in parentheses.
In the case of the sample Perm V6 prepared by heating to 107° C, a porosity of 1.24 %
was attained by deviatoric compaction from the initial hydrostatic pressure of 30 MPa
under these boundary conditions. However, the gas permeability was measured on this
sample at ambient temperature.
Coarse-grained crushed salt
Coarse-grained crushed salt with a grain size less than 32 mm as already described in
Section 3.2.1 was employed for preparing the test samples.
The moisture content was again determined by drying to 0.02 % at 105 °C for 72 h.
The grain density was determined with the use of an air comparison pycnometer; the
value thus obtained was 2199.5 kg/m3.
The crushed salt was poured into the rubber jacket of the large triaxial testing machine
and subsequently compacted at various hydrostatic confining pressures for attaining
48
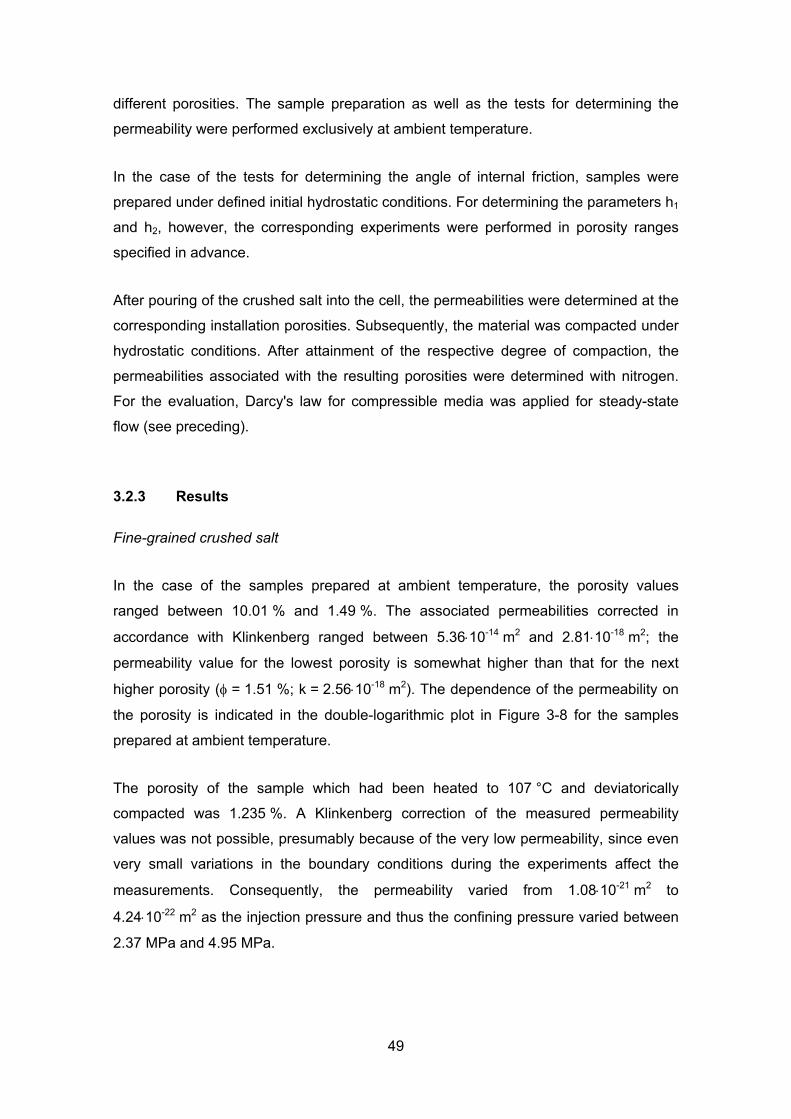
different porosities. The sample preparation as well as the tests for determining the
permeability were performed exclusively at ambient temperature.
In the case of the tests for determining the angle of internal friction, samples were
prepared under defined initial hydrostatic conditions. For determining the parameters h1
and h2, however, the corresponding experiments were performed in porosity ranges
specified in advance.
After pouring of the crushed salt into the cell, the permeabilities were determined at the
corresponding installation porosities. Subsequently, the material was compacted under
hydrostatic conditions. After attainment of the respective degree of compaction, the
permeabilities associated with the resulting porosities were determined with nitrogen.
For the evaluation, Darcy's law for compressible media was applied for steady-state
flow (see preceding).
3.2.3 Results
Fine-grained crushed salt
In the case of the samples prepared at ambient temperature, the porosity values
ranged between 10.01 % and 1.49 %. The associated permeabilities corrected in
accordance with Klinkenberg ranged between 5.36⋅10-14 m2 and 2.81⋅10-18 m2; the
permeability value for the lowest porosity is somewhat higher than that for the next
higher porosity (φ = 1.51 %; k = 2.56⋅10-18 m2). The dependence of the permeability on
the porosity is indicated in the double-logarithmic plot in Figure 3-8 for the samples
prepared at ambient temperature.
The porosity of the sample which had been heated to 107 °C and deviatorically
compacted was 1.235 %. A Klinkenberg correction of the measured permeability
values was not possible, presumably because of the very low permeability, since even
very small variations in the boundary conditions during the experiments affect the
measurements. Consequently, the permeability varied from 1.08⋅10-21 m2 to
4.24⋅10-22 m2 as the injection pressure and thus the confining pressure varied between
2.37 MPa and 4.95 MPa.
49
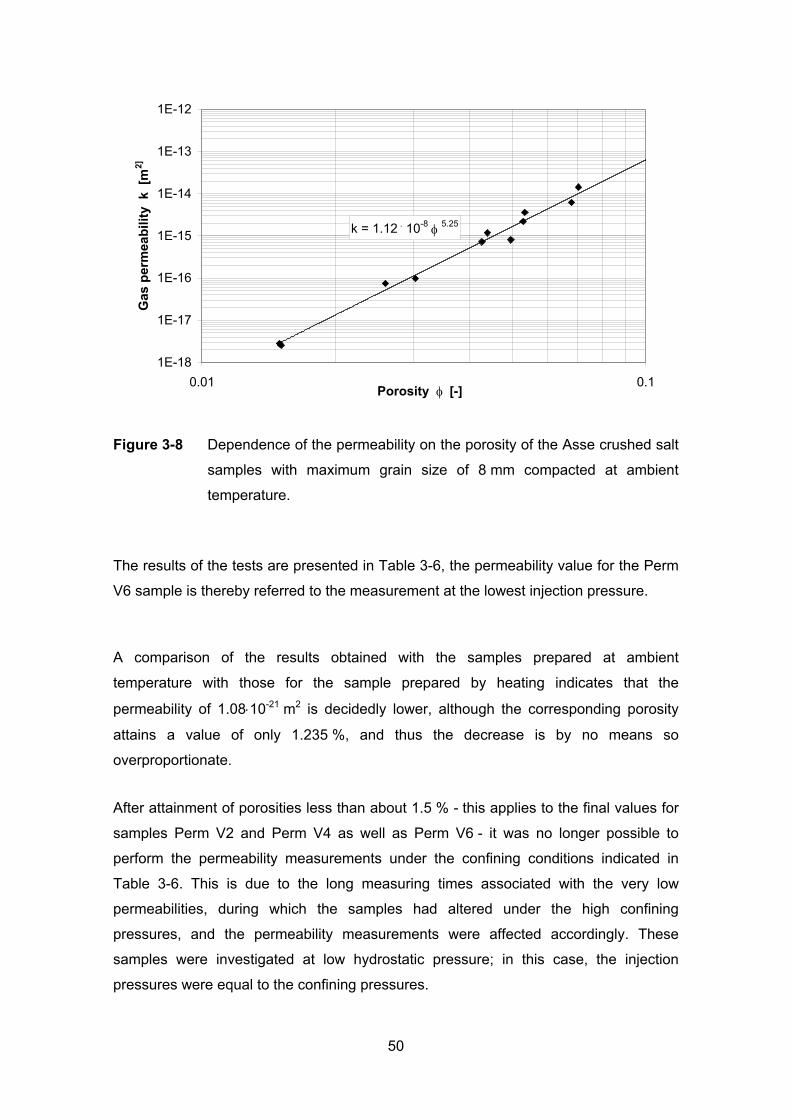
k = 1.12 . 10-8 φ 5.25
1E-18
1E-17
1E-16
1E-15
1E-14
1E-13
1E-12
0.01 0.1Porosity φ [-]
Gas
per
mea
bilit
y k
[m
2]
Figure 3-8 Dependence of the permeability on the porosity of the Asse crushed salt
samples with maximum grain size of 8 mm compacted at ambient
temperature.
The results of the tests are presented in Table 3-6, the permeability value for the Perm
V6 sample is thereby referred to the measurement at the lowest injection pressure.
A comparison of the results obtained with the samples prepared at ambient
temperature with those for the sample prepared by heating indicates that the
permeability of 1.08⋅10-21 m2 is decidedly lower, although the corresponding porosity
attains a value of only 1.235 %, and thus the decrease is by no means so
overproportionate.
After attainment of porosities less than about 1.5 % - this applies to the final values for
samples Perm V2 and Perm V4 as well as Perm V6 - it was no longer possible to
perform the permeability measurements under the confining conditions indicated in
Table 3-6. This is due to the long measuring times associated with the very low
permeabilities, during which the samples had altered under the high confining
pressures, and the permeability measurements were affected accordingly. These
samples were investigated at low hydrostatic pressure; in this case, the injection
pressures were equal to the confining pressures.
50
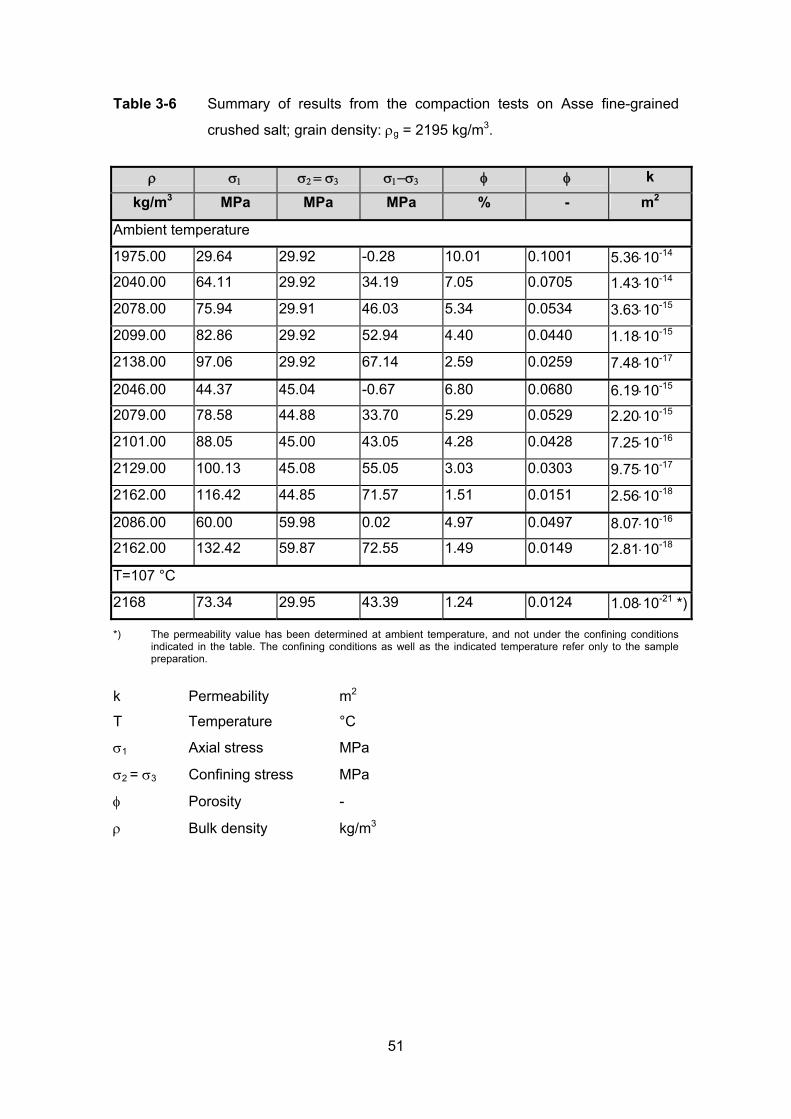
Table 3-6 Summary of results from the compaction tests on Asse fine-grained
crushed salt; grain density: ρg = 2195 kg/m3.
ρ σ1 σ2 = σ3 σ1−σ3 φ φ k
kg/m3 MPa MPa MPa % - m2
Ambient temperature
1975.00 29.64 29.92 -0.28 10.01 0.1001 5.36⋅10-14
2040.00 64.11 29.92 34.19 7.05 0.0705 1.43⋅10-14
2078.00 75.94 29.91 46.03 5.34 0.0534 3.63⋅10-15
2099.00 82.86 29.92 52.94 4.40 0.0440 1.18⋅10-15
2138.00 97.06 29.92 67.14 2.59 0.0259 7.48⋅10-17
2046.00 44.37 45.04 -0.67 6.80 0.0680 6.19⋅10-15
2079.00 78.58 44.88 33.70 5.29 0.0529 2.20⋅10-15
2101.00 88.05 45.00 43.05 4.28 0.0428 7.25⋅10-16
2129.00 100.13 45.08 55.05 3.03 0.0303 9.75⋅10-17
2162.00 116.42 44.85 71.57 1.51 0.0151 2.56⋅10-18
2086.00 60.00 59.98 0.02 4.97 0.0497 8.07⋅10-16
2162.00 132.42 59.87 72.55 1.49 0.0149 2.81⋅10-18
T=107 °C
2168 73.34 29.95 43.39 1.24 0.0124 1.08⋅10-21 *)
*) The permeability value has been determined at ambient temperature, and not under the confining conditions indicated in the table. The confining conditions as well as the indicated temperature refer only to the sample preparation.
k Permeability m2
T Temperature °C
σ1 Axial stress MPa
σ2 = σ3 Confining stress MPa
φ Porosity -
ρ Bulk density kg/m3
51
A closer consideration of the porosities generated under the individual differential
stresses reveals that only a kind of "limiting porosity", in this case about 1.5 %, is
evidently approached during short-term tests (duration: about 1 week) (Figure 3-9).
With this type of salt, this behaviour is observed under different confining conditions
and under the boundary conditions with respect to moisture, ambient temperature, and
test period.
Coarse-grained crushed salt
Since three individual measurements were performed for determining h1 and h2 in each
porosity range, the permeability was also determined for each of these individual
measurements. The values were averaged for all porosities and permeabilities in the
installation condition as well as for the individual porosity ranges. The results of the
permeability measurements performed in conjunction with the determination of the
angle of internal friction were also taken into account in calculating these averages.
A Klinkenberg correction was not possible for experimental reasons, since turbulent
flow effects presumably occurred at the very high permeabilities. Consequently, only
the permeabilities determined at the lowest injection pressure are considered.
The values of the installation porosity ranged between 30.8 % and 23.2 %. The
corresponding permeability values in the installation condition were 1.32⋅10-12 m2 and
3.29⋅10-12 m2. The porosities after hydrostatic compaction ranged from 10.58 % to
27.49 %. The associated permeabilities ranged between 7.77⋅10-14 m2 and
1.59⋅10-12 m2. The results are compiled in Figure 3-10.
A consideration of the results reveals that an appreciable decrease in permeability
occurs only at a porosity less than 20 %. Furthermore, slight variations in porosity
apparently do not decidedly affect the permeability. Thus, the permeability value at a
porosity of 13.91 %, for instance, was measured to be even somewhat higher than the
permeability at a porosity of 17.41 %, although this is higher by about 3.5 %-points.
52
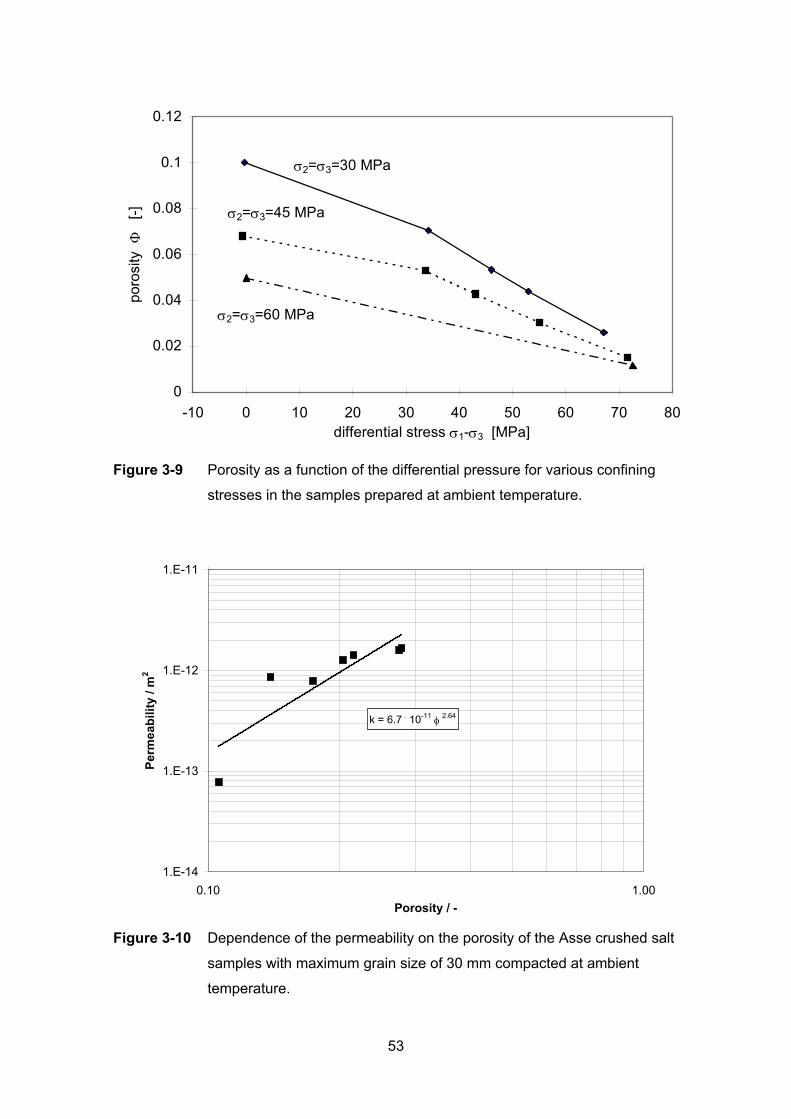
σ2=σ3=30 MPa
0
0.02
0.04
0.06
0.08
0.1
0.12
-10 0 10 20 30 40 50 60 70 80differential stress σ1-σ3 [MPa]
poro
sity
Φ
[-] σ2=σ3=45 MPa
σ2=σ3=60 MPa
Figure 3-9 Porosity as a function of the differential pressure for various confining
stresses in the samples prepared at ambient temperature.
k = 6.7 . 10-11 φ 2.64
1.E-14
1.E-13
1.E-12
1.E-11
0.10 1.00Porosity / -
Perm
eabi
lity
/ m2
Figure 3-10 Dependence of the permeability on the porosity of the Asse crushed salt
samples with maximum grain size of 30 mm compacted at ambient
temperature.
53

54
3.3 Conclusions
The crushed salt laboratory experiments were performed in order to determine the
material-specific parameters of Hein's constitutive law for granular backfill material.
The laboratory triaxial experiments were conducted using conventional triaxial cells
(Karman type) of different sizes and loading capacities and one oedometer cell. In
some cases, the experiments were performed at higher temperature.
For crushed salt with grain size less than 8 mm and an initial porosity of ~0,3 the
parameters and that determine the pressure dependent volumetric moduli of
compression ( is the initial compression modulus) was determined at ambient
temperature and at 150° C in an oedometer. From these experiments it is concluded
that for the granular salt used the temperature influences essentially the parameter
resulting in a reduction of about 30 % when the temperature rises to 125 °C. As a
consequence of this, the material behaves softer.
4c 5c
4c
4c
The experiments were repeated for coarse grained salt less than 31 mm in a large
triaxial testing machine under hydrostatic stress conditions and at ambient
temperature. The results gathered indicate a higher stiffness of the parameters in
comparison to the fine-grained material by a factor of about two.
The coefficient of internal friction was determined at ambient temperature for fine-
grained salt, at ambient temperature in an oedometer, and for coarse-grained salt
again in the large triaxial cell. From these experiments it was concluded that the
parameter is largely influenced by grain size distribution and the shape of the granular
material.
3c
The mentioned material parameters are involved in a more or less complex manner in
the determination of the parameters d, h1, h2 in the flow condition equation. For the
fine-granular salt the determined numerical values of these parameters satisfy the
equation for the given porosities but it could not be solved in case of the
coarse-grained salt, obviously because of local material inhomogeneities leading to
mechanical instabilities of the samples at higher porosities.
55
The major conclusion is that there is a need for more experimental work using carefully
controlled starting material to investigate the mechanisms that control the compaction
process.
The gas permeability has been successfully determined in dependence of the porosity
at increasing degree of compaction. In the case of fine-grained crushed salt, however,
sample preparation from dry material at ambient temperature was possible only for
porosities over 1 %. Especially during the tests on fine-grained crushed salt, it was
observed that a kind of "limiting porosity" is attained under the given boundary
conditions (ambient temperature, moisture) as the stress difference is increased. Even
with a sample prepared at elevated temperature, an appreciably lower porosity is not
attained. The regression analysis of the data obtained for the fine-grained material
resulted in the relationship k = 1.12 ⋅ 10-8 φ 5.25 between the permeability k and the
porosity φ.
The investigations on coarse-grained crushed salt were coupled with measurements
for determining the above mentioned material parameters. In order to avoid
unnecessary interference with these measurements, tests were performed under the
respective hydrostatic conditions for preparing the test specimens for these
measurements. For this reason, preparation was possible only at pressures up to about
30 MPa which corresponds to a porosity of about 10.58 %. The relationship between
permeability and porosity obtained for this material is k = 6.7 ⋅ 10-11 φ 2.64.
A comparison of the relationships obtained for both types of crushed salt is shown in
Figure 3-11. The relationship for the fine grained material agrees rather well with the
data obtained from the in-situ measurements (compare Figure 2-16 and Figure 2-25)
and also with the relationship for naturally moist crushed salt presented by Müller-Lyda
et al. (1999) after an evaluation of data of various investigators. According to Müller-
Lyda et al. (1999), the coarse grained material behaves obviously more like a very dry
material.
56
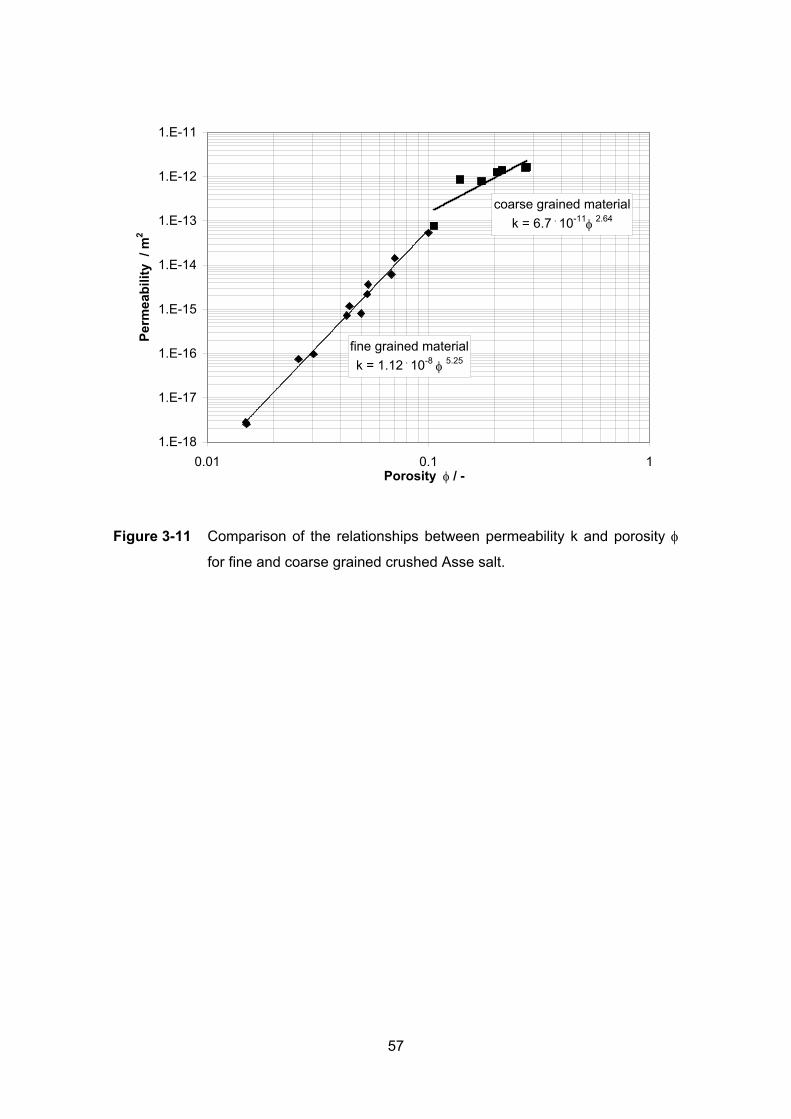
fine grained materialk = 1.12 . 10-8 φ 5.25
coarse grained materialk = 6.7 . 10-11φ 2.64
1.E-18
1.E-17
1.E-16
1.E-15
1.E-14
1.E-13
1.E-12
1.E-11
0.01 0.1 1Porosity φ / -
Perm
eabi
lity
/ m
2
Figure 3-11 Comparison of the relationships between permeability k and porosity φ
for fine and coarse grained crushed Asse salt.
57
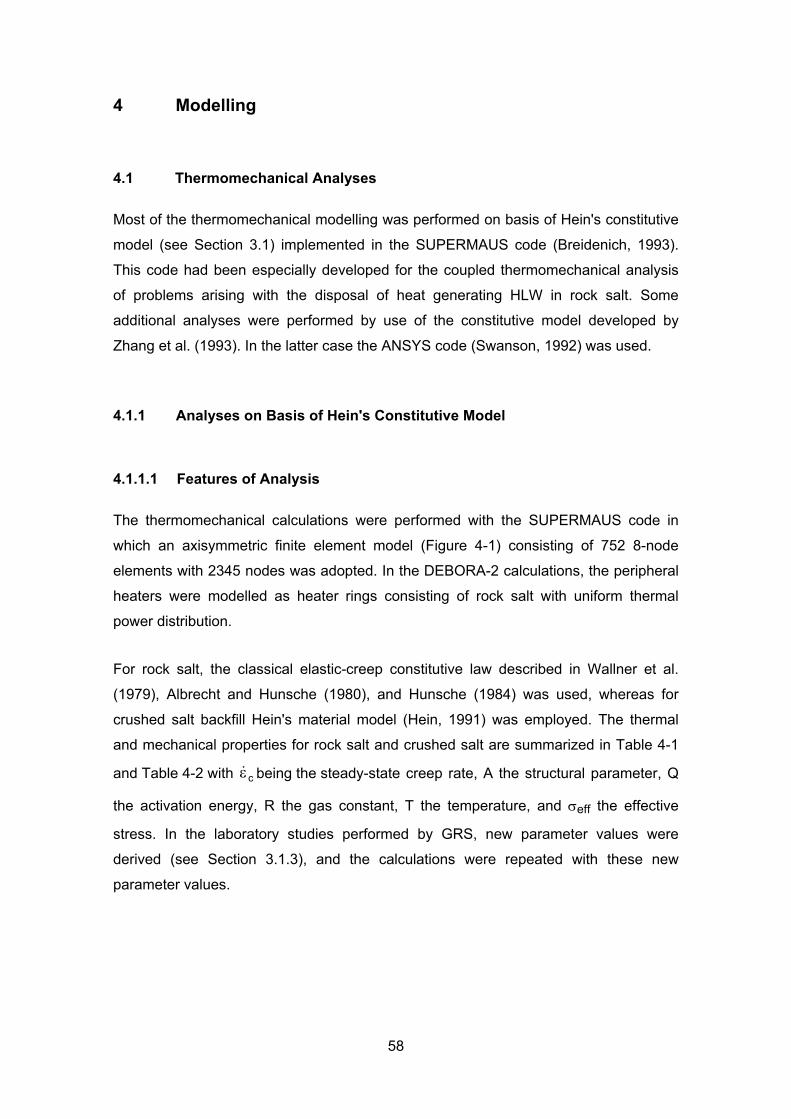
4 Modelling
4.1 Thermomechanical Analyses
Most of the thermomechanical modelling was performed on basis of Hein's constitutive
model (see Section 3.1) implemented in the SUPERMAUS code (Breidenich, 1993).
This code had been especially developed for the coupled thermomechanical analysis
of problems arising with the disposal of heat generating HLW in rock salt. Some
additional analyses were performed by use of the constitutive model developed by
Zhang et al. (1993). In the latter case the ANSYS code (Swanson, 1992) was used.
4.1.1 Analyses on Basis of Hein's Constitutive Model
4.1.1.1 Features of Analysis
The thermomechanical calculations were performed with the SUPERMAUS code in
which an axisymmetric finite element model (Figure 4-1) consisting of 752 8-node
elements with 2345 nodes was adopted. In the DEBORA-2 calculations, the peripheral
heaters were modelled as heater rings consisting of rock salt with uniform thermal
power distribution.
For rock salt, the classical elastic-creep constitutive law described in Wallner et al.
(1979), Albrecht and Hunsche (1980), and Hunsche (1984) was used, whereas for
crushed salt backfill Hein's material model (Hein, 1991) was employed. The thermal
and mechanical properties for rock salt and crushed salt are summarized in Table 4-1
and Table 4-2 with εc& being the steady-state creep rate, A the structural parameter, Q
the activation energy, R the gas constant, T the temperature, and σeff the effective
stress. In the laboratory studies performed by GRS, new parameter values were
derived (see Section 3.1.3), and the calculations were repeated with these new
parameter values.
58
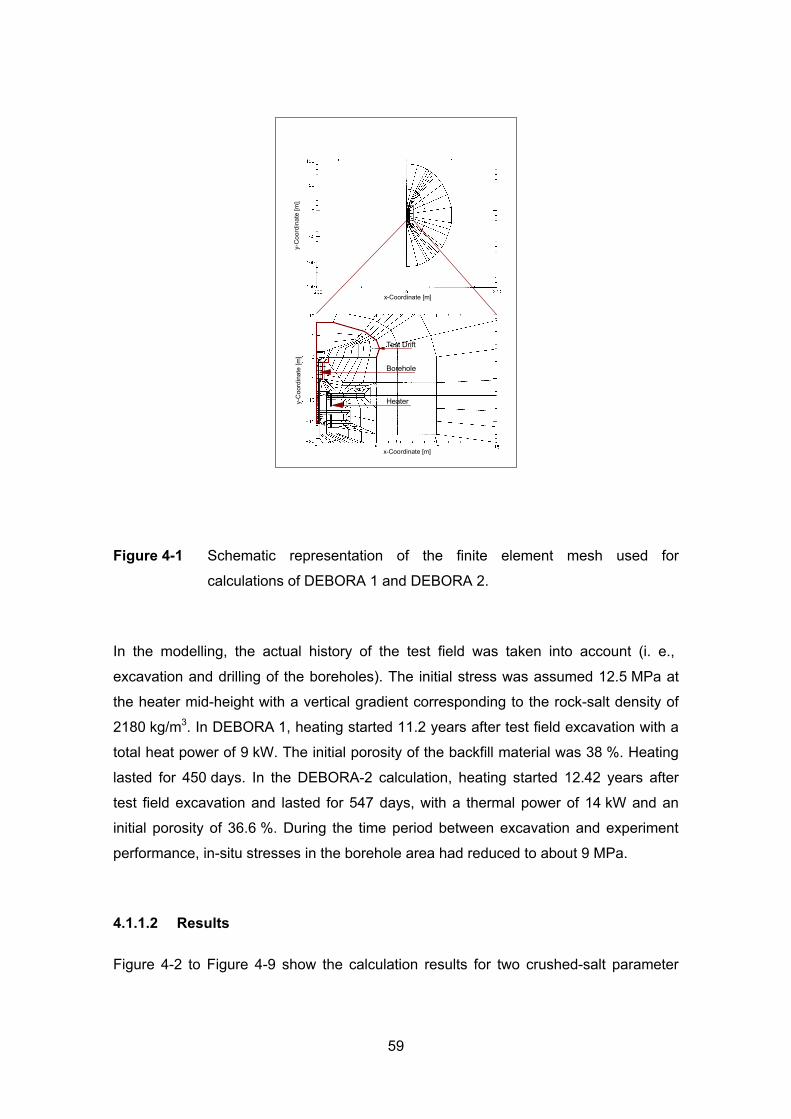
y-C
oord
inat
e [m
]y-
Coo
rdin
ate
[m]
x-Coordinate [m]
x-Coordinate [m]
Test Drift
Borehole
Heater
Figure 4-1 Schematic representation of the finite element mesh used for
calculations of DEBORA 1 and DEBORA 2.
In the modelling, the actual history of the test field was taken into account (i. e.,
excavation and drilling of the boreholes). The initial stress was assumed 12.5 MPa at
the heater mid-height with a vertical gradient corresponding to the rock-salt density of
2180 kg/m3. In DEBORA 1, heating started 11.2 years after test field excavation with a
total heat power of 9 kW. The initial porosity of the backfill material was 38 %. Heating
lasted for 450 days. In the DEBORA-2 calculation, heating started 12.42 years after
test field excavation and lasted for 547 days, with a thermal power of 14 kW and an
initial porosity of 36.6 %. During the time period between excavation and experiment
performance, in-situ stresses in the borehole area had reduced to about 9 MPa.
4.1.1.2 Results
Figure 4-2 to Figure 4-9 show the calculation results for two crushed-salt parameter
59
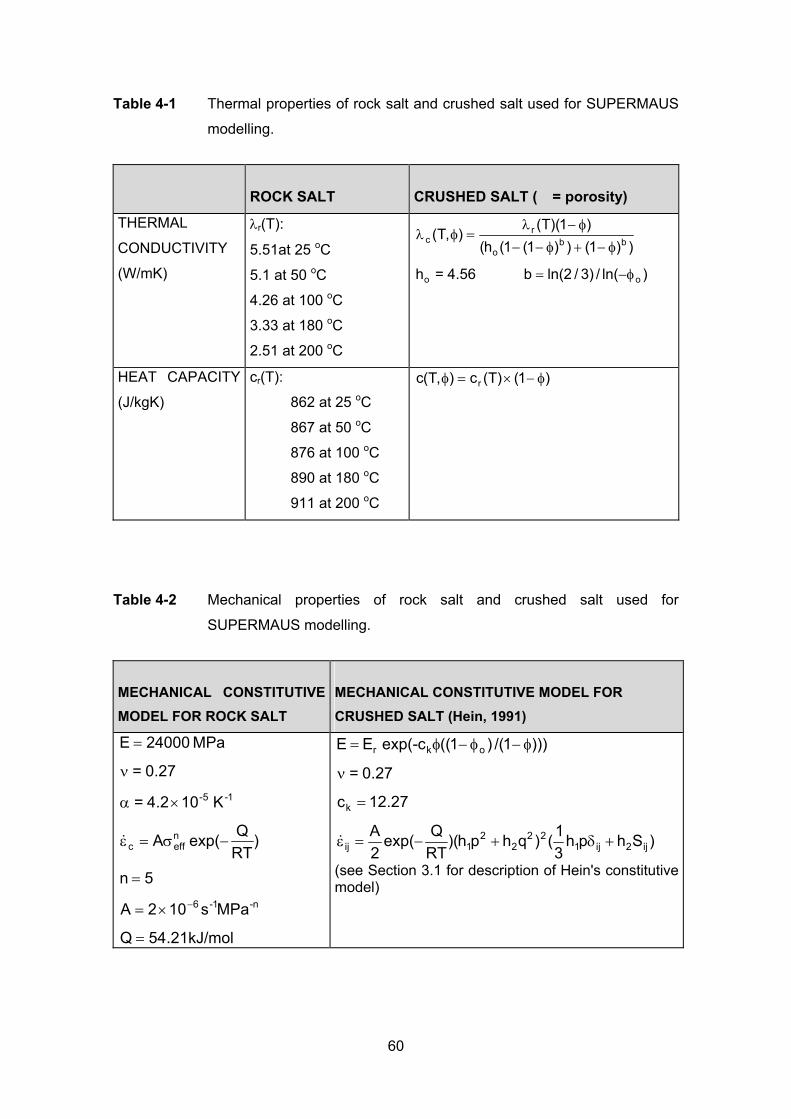
Table 4-1 Thermal properties of rock salt and crushed salt used for SUPERMAUS
modelling.
ROCK SALT CRUSHED SALT (� = porosity)
THERMAL
CONDUCTIVITY
(W/mK)
λr(T):
5.51at 25 oC
)ln(/)3/2ln(b 4.56=h
))1())1(1(h()1)(T(
),T(
oo
bbo
rc
φ−=
φ−+φ−−
φ−λ=φλ
5.1 at 50 oC
4.26 at 100 oC
3.33 at 180 oC
2.51 at 200 oC
HEAT CAPACITY
(J/kgK)
cr(T):
862 at 25 oC )1()T(c),T(c r= × − φ
867 at 50 oC
876 at 100 oC
890 at 180 oC
911 at 200 oC
φ
Table 4-2 Mechanical properties of rock salt and crushed salt used for
SUPERMAUS modelling.
MECHANICAL CONSTITUTIVE MECHANICAL CONSTITUTIVE MODEL FOR MODEL FOR ROCK SALT CRUSHED SALT (Hein, 1991)
kJ/mol 21.54Q
MPas102A
5n
)RTQexp(A
K 104.2=
0.27=
MPa 24000E
n-1-6
neffc
1-5-
=
×=
=
−σ=ε
×α
ν
=
−
& )Shph31()qhph)(
RTQexp(
2A
27.12c
0.27=
)))1/()1((cexp(- EE
ij2ij122
22
1ij
k
okr
+δ+−=ε
=
ν
φ−φ−φ=
&
(see Section 3.1 for description of Hein's constitutive model)
60
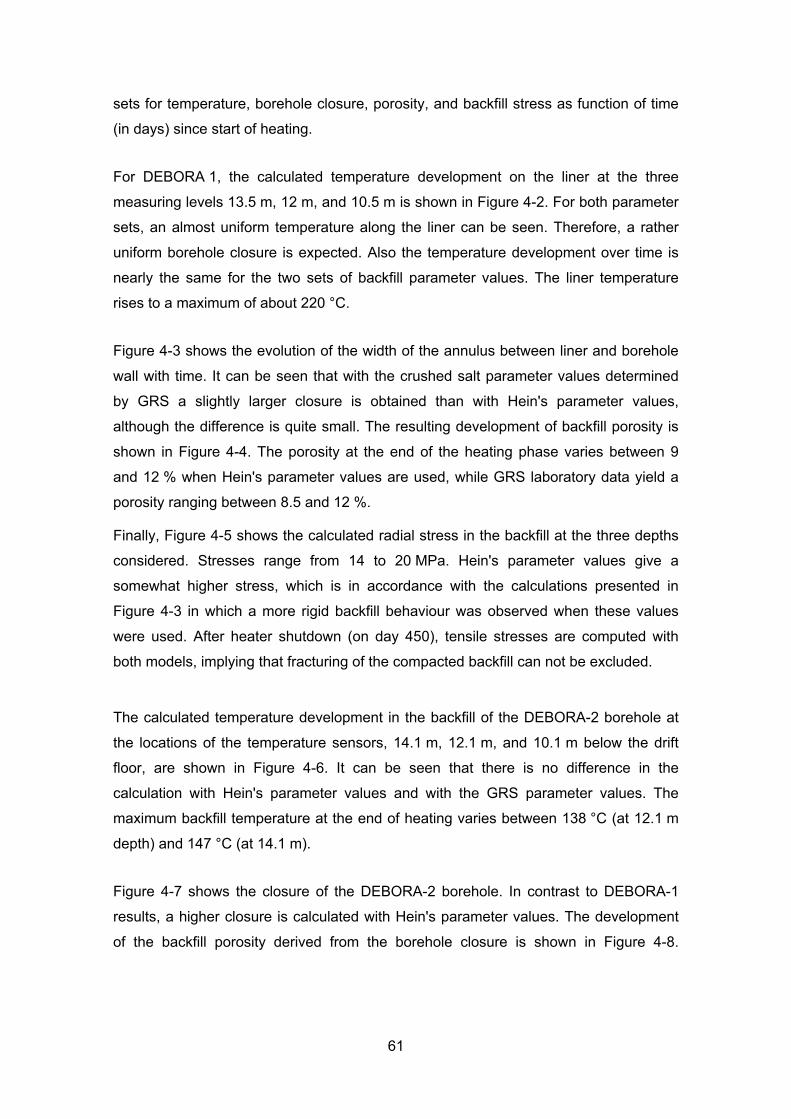
sets for temperature, borehole closure, porosity, and backfill stress as function of time
(in days) since start of heating.
For DEBORA 1, the calculated temperature development on the liner at the three
measuring levels 13.5 m, 12 m, and 10.5 m is shown in Figure 4-2. For both parameter
sets, an almost uniform temperature along the liner can be seen. Therefore, a rather
uniform borehole closure is expected. Also the temperature development over time is
nearly the same for the two sets of backfill parameter values. The liner temperature
rises to a maximum of about 220 °C.
Figure 4-3 shows the evolution of the width of the annulus between liner and borehole
wall with time. It can be seen that with the crushed salt parameter values determined
by GRS a slightly larger closure is obtained than with Hein's parameter values,
although the difference is quite small. The resulting development of backfill porosity is
shown in Figure 4-4. The porosity at the end of the heating phase varies between 9
and 12 % when Hein's parameter values are used, while GRS laboratory data yield a
porosity ranging between 8.5 and 12 %.
Finally, Figure 4-5 shows the calculated radial stress in the backfill at the three depths
considered. Stresses range from 14 to 20 MPa. Hein's parameter values give a
somewhat higher stress, which is in accordance with the calculations presented in
Figure 4-3 in which a more rigid backfill behaviour was observed when these values
were used. After heater shutdown (on day 450), tensile stresses are computed with
both models, implying that fracturing of the compacted backfill can not be excluded.
The calculated temperature development in the backfill of the DEBORA-2 borehole at
the locations of the temperature sensors, 14.1 m, 12.1 m, and 10.1 m below the drift
floor, are shown in Figure 4-6. It can be seen that there is no difference in the
calculation with Hein's parameter values and with the GRS parameter values. The
maximum backfill temperature at the end of heating varies between 138 °C (at 12.1 m
depth) and 147 °C (at 14.1 m).
Figure 4-7 shows the closure of the DEBORA-2 borehole. In contrast to DEBORA-1
results, a higher closure is calculated with Hein's parameter values. The development
of the backfill porosity derived from the borehole closure is shown in Figure 4-8.
61
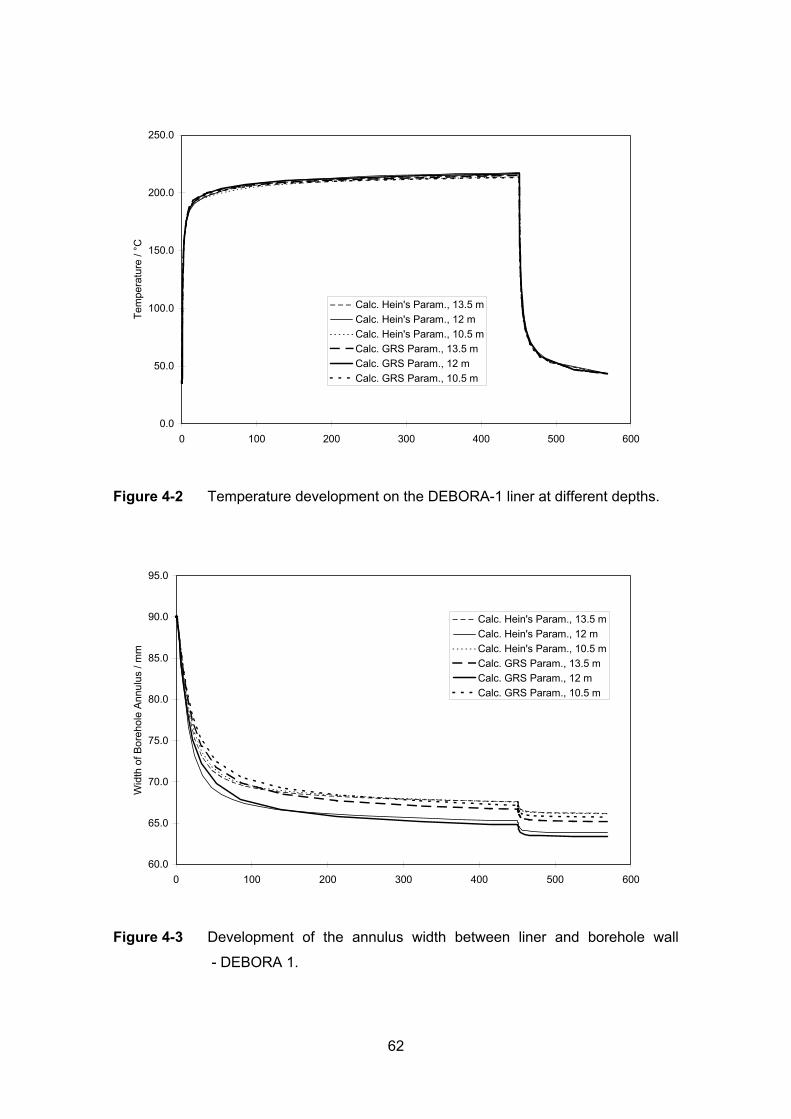
0.0
50.0
100.0
150.0
200.0
250.0
0 100 200 300 400 500 600
Tem
pera
ture
/ °C
Calc. Hein's Param., 13.5 mCalc. Hein's Param., 12 mCalc. Hein's Param., 10.5 mCalc. GRS Param., 13.5 mCalc. GRS Param., 12 mCalc. GRS Param., 10.5 m
Figure 4-2 Temperature development on the DEBORA-1 liner at different depths.
60.0
65.0
70.0
75.0
80.0
85.0
90.0
95.0
0 100 200 300 400 500 600
Wid
th o
f Bor
ehol
e A
nnul
us /
mm
Calc. Hein's Param., 13.5 mCalc. Hein's Param., 12 mCalc. Hein's Param., 10.5 mCalc. GRS Param., 13.5 mCalc. GRS Param., 12 mCalc. GRS Param., 10.5 m
Figure 4-3 Development of the annulus width between liner and borehole wall
- DEBORA 1.
62
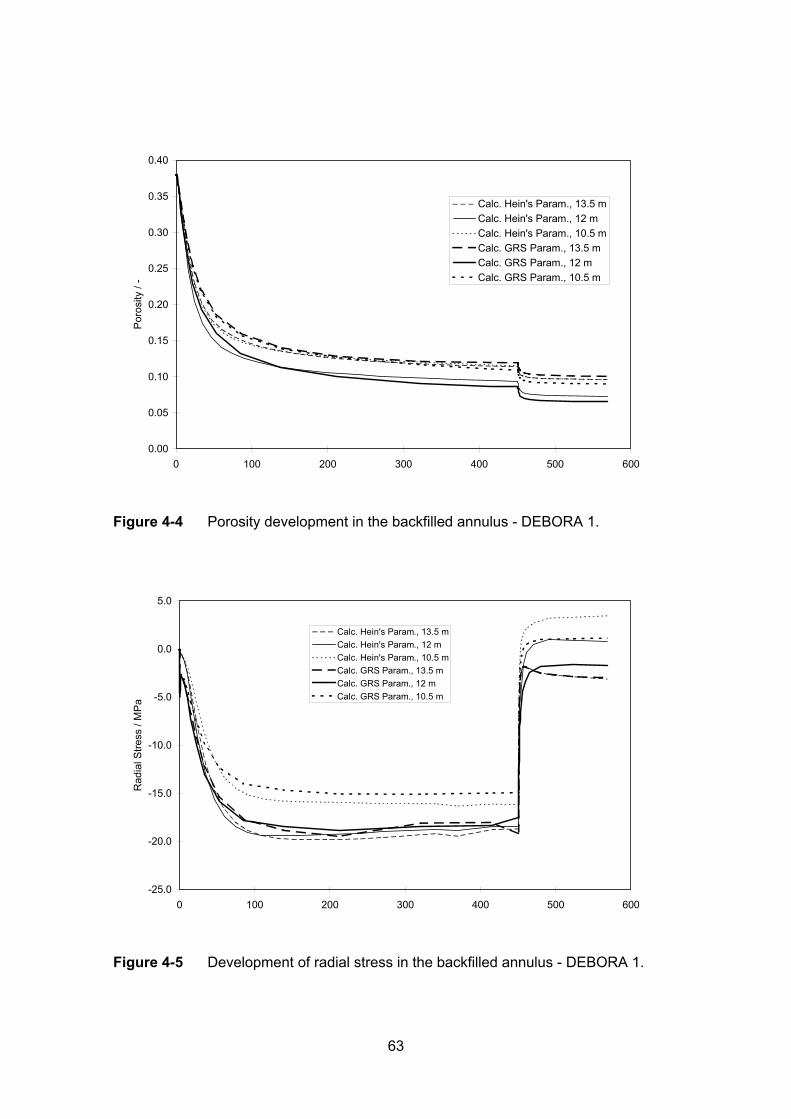
0.00
0.05
0.10
0.15
0.20
0.25
0.30
0.35
0.40
0 100 200 300 400 500 600
Por
osity
/ -
Calc. Hein's Param., 13.5 mCalc. Hein's Param., 12 mCalc. Hein's Param., 10.5 mCalc. GRS Param., 13.5 mCalc. GRS Param., 12 mCalc. GRS Param., 10.5 m
Figure 4-4 Porosity development in the backfilled annulus - DEBORA 1.
-25.0
-20.0
-15.0
-10.0
-5.0
0.0
5.0
0 100 200 300 400 500 600
Rad
ial S
tress
/ M
Pa
Calc. Hein's Param., 13.5 mCalc. Hein's Param., 12 mCalc. Hein's Param., 10.5 mCalc. GRS Param., 13.5 mCalc. GRS Param., 12 mCalc. GRS Param., 10.5 m
Figure 4-5 Development of radial stress in the backfilled annulus - DEBORA 1.
63
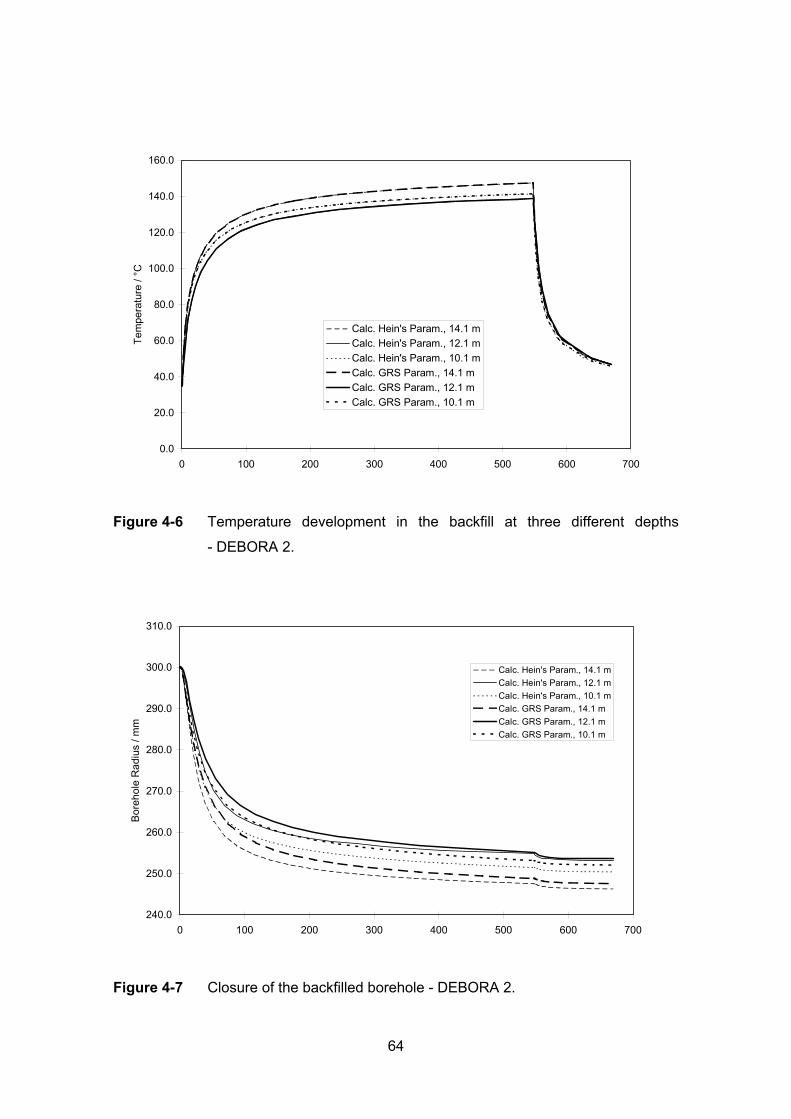
0.0
20.0
40.0
60.0
80.0
100.0
120.0
140.0
160.0
0 100 200 300 400 500 600 700
Tem
pera
ture
/ °C
Calc. Hein's Param., 14.1 mCalc. Hein's Param., 12.1 mCalc. Hein's Param., 10.1 mCalc. GRS Param., 14.1 mCalc. GRS Param., 12.1 mCalc. GRS Param., 10.1 m
Figure 4-6 Temperature development in the backfill at three different depths
- DEBORA 2.
240.0
250.0
260.0
270.0
280.0
290.0
300.0
310.0
0 100 200 300 400 500 600 700
Bor
ehol
e R
adiu
s / m
m
Calc. Hein's Param., 14.1 mCalc. Hein's Param., 12.1 mCalc. Hein's Param., 10.1 mCalc. GRS Param., 14.1 mCalc. GRS Param., 12.1 mCalc. GRS Param., 10.1 m
Figure 4-7 Closure of the backfilled borehole - DEBORA 2.
64
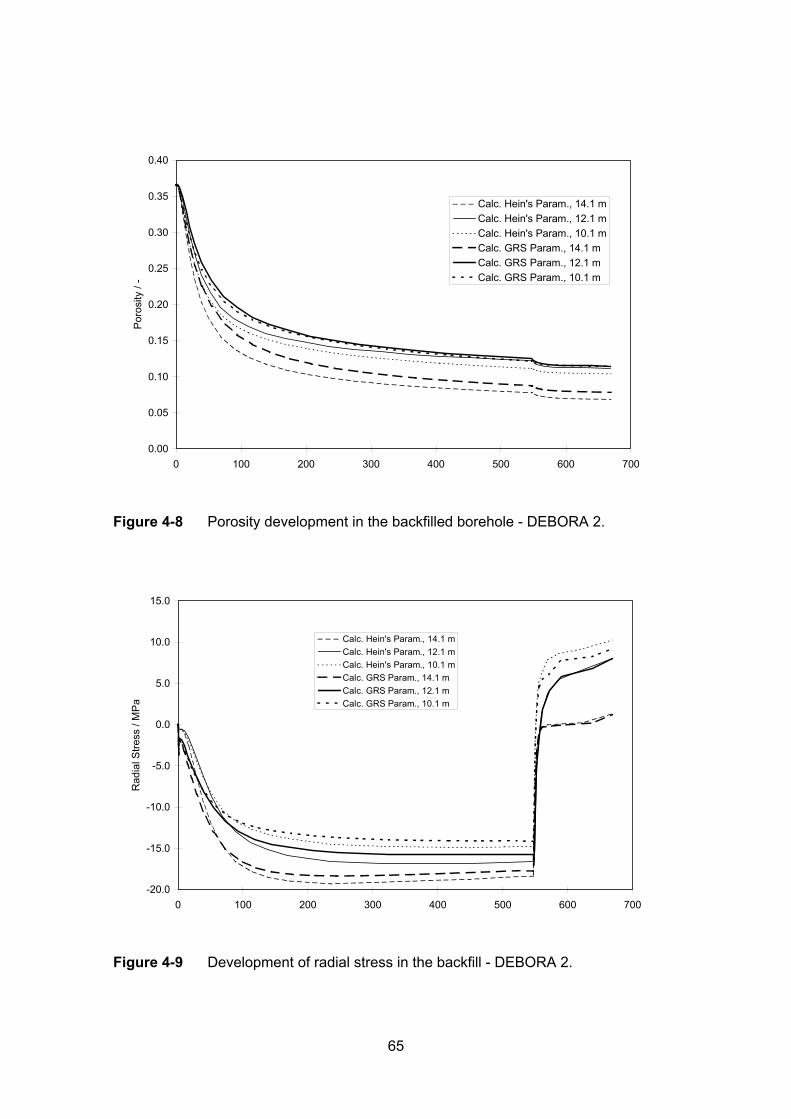
0.00
0.05
0.10
0.15
0.20
0.25
0.30
0.35
0.40
0 100 200 300 400 500 600 700
Por
osity
/ -
Calc. Hein's Param., 14.1 mCalc. Hein's Param., 12.1 mCalc. Hein's Param., 10.1 mCalc. GRS Param., 14.1 mCalc. GRS Param., 12.1 mCalc. GRS Param., 10.1 m
Figure 4-8 Porosity development in the backfilled borehole - DEBORA 2.
-20.0
-15.0
-10.0
-5.0
0.0
5.0
10.0
15.0
0 100 200 300 400 500 600 700
Rad
ial S
tress
/ M
Pa
Calc. Hein's Param., 14.1 mCalc. Hein's Param., 12.1 mCalc. Hein's Param., 10.1 mCalc. GRS Param., 14.1 mCalc. GRS Param., 12.1 mCalc. GRS Param., 10.1 m
Figure 4-9 Development of radial stress in the backfill - DEBORA 2.
65
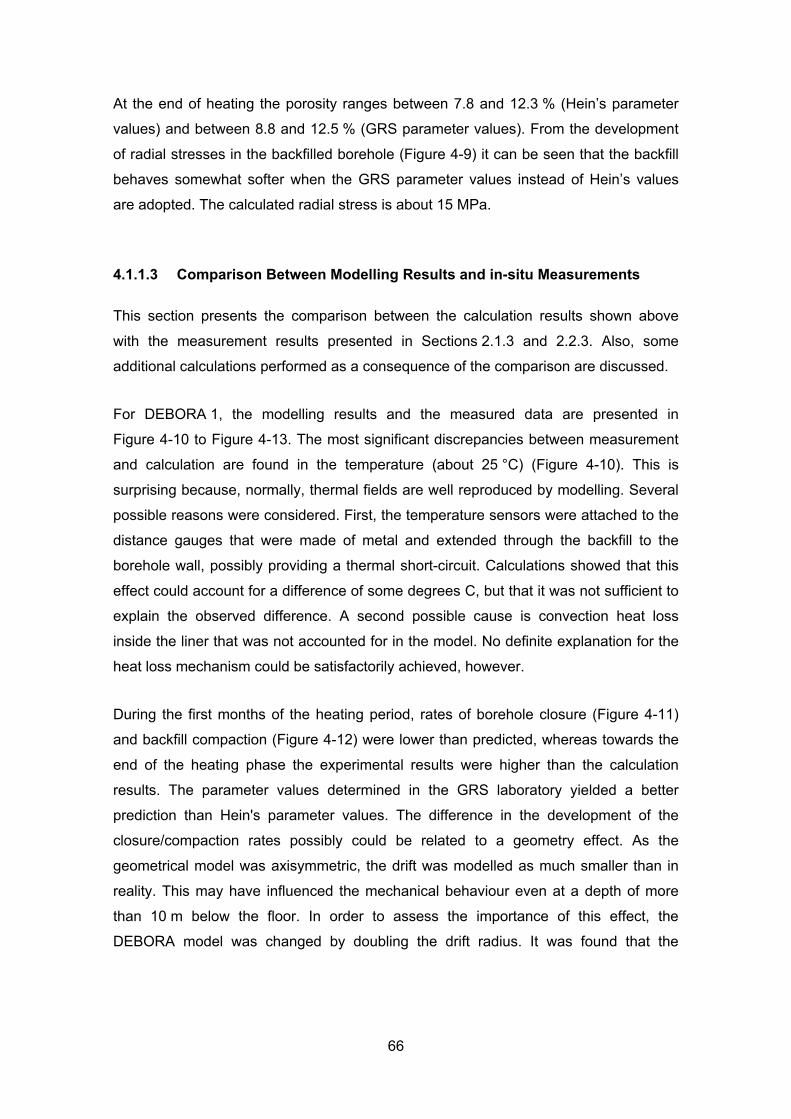
At the end of heating the porosity ranges between 7.8 and 12.3 % (Hein’s parameter
values) and between 8.8 and 12.5 % (GRS parameter values). From the development
of radial stresses in the backfilled borehole (Figure 4-9) it can be seen that the backfill
behaves somewhat softer when the GRS parameter values instead of Hein’s values
are adopted. The calculated radial stress is about 15 MPa.
4.1.1.3 Comparison Between Modelling Results and in-situ Measurements
This section presents the comparison between the calculation results shown above
with the measurement results presented in Sections 2.1.3 and 2.2.3. Also, some
additional calculations performed as a consequence of the comparison are discussed.
For DEBORA 1, the modelling results and the measured data are presented in
Figure 4-10 to Figure 4-13. The most significant discrepancies between measurement
and calculation are found in the temperature (about 25 °C) (Figure 4-10). This is
surprising because, normally, thermal fields are well reproduced by modelling. Several
possible reasons were considered. First, the temperature sensors were attached to the
distance gauges that were made of metal and extended through the backfill to the
borehole wall, possibly providing a thermal short-circuit. Calculations showed that this
effect could account for a difference of some degrees C, but that it was not sufficient to
explain the observed difference. A second possible cause is convection heat loss
inside the liner that was not accounted for in the model. No definite explanation for the
heat loss mechanism could be satisfactorily achieved, however.
During the first months of the heating period, rates of borehole closure (Figure 4-11)
and backfill compaction (Figure 4-12) were lower than predicted, whereas towards the
end of the heating phase the experimental results were higher than the calculation
results. The parameter values determined in the GRS laboratory yielded a better
prediction than Hein's parameter values. The difference in the development of the
closure/compaction rates possibly could be related to a geometry effect. As the
geometrical model was axisymmetric, the drift was modelled as much smaller than in
reality. This may have influenced the mechanical behaviour even at a depth of more
than 10 m below the floor. In order to assess the importance of this effect, the
DEBORA model was changed by doubling the drift radius. It was found that the
66
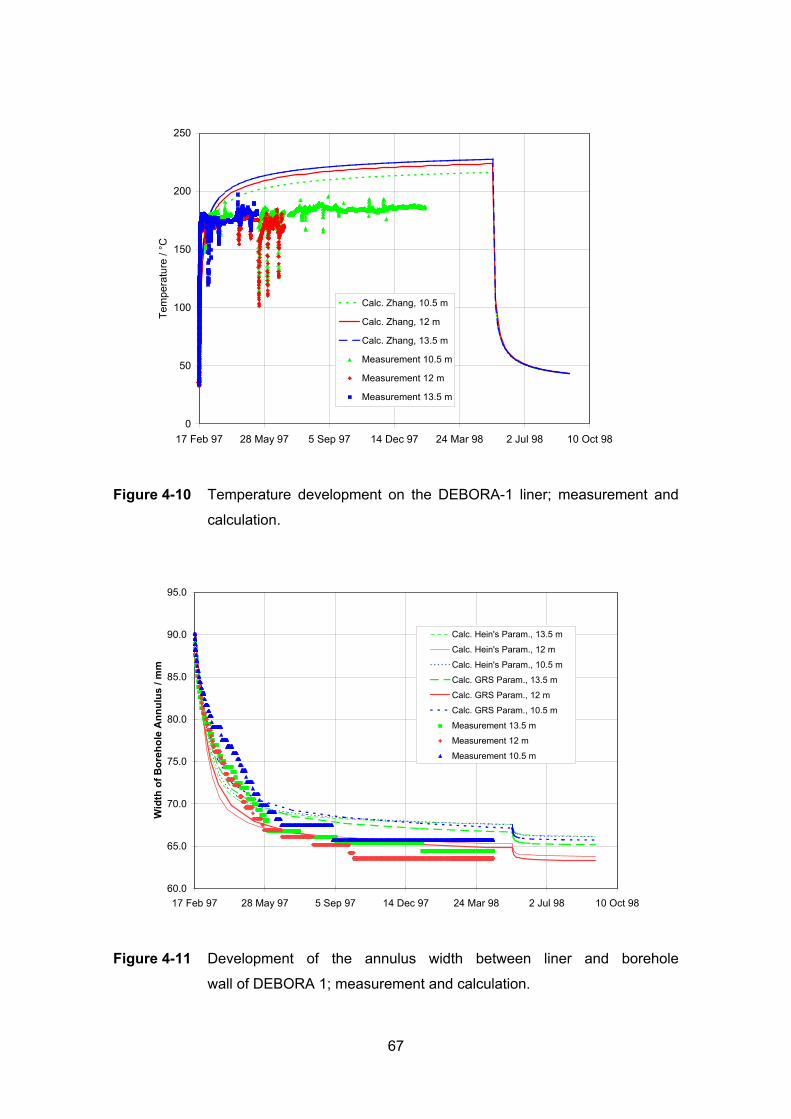
0
50
100
150
200
250
17 Feb 97 28 May 97 5 Sep 97 14 Dec 97 24 Mar 98 2 Jul 98 10 Oct 98
Tem
pera
ture
/ °C
Calc. Zhang, 10.5 m
Calc. Zhang, 12 m
Calc. Zhang, 13.5 m
Measurement 10.5 m
Measurement 12 m
Measurement 13.5 m
Figure 4-10 Temperature development on the DEBORA-1 liner; measurement and
calculation.
60.0
65.0
70.0
75.0
80.0
85.0
90.0
95.0
17 Feb 97 28 May 97 5 Sep 97 14 Dec 97 24 Mar 98 2 Jul 98 10 Oct 98
Wid
th o
f Bor
ehol
e A
nnul
us /
mm
Calc. Hein's Param., 13.5 m
Calc. Hein's Param., 12 m
Calc. Hein's Param., 10.5 m
Calc. GRS Param., 13.5 m
Calc. GRS Param., 12 m
Calc. GRS Param., 10.5 m
Measurement 13.5 m
Measurement 12 m
Measurement 10.5 m
Figure 4-11 Development of the annulus width between liner and borehole
wall of DEBORA 1; measurement and calculation.
67
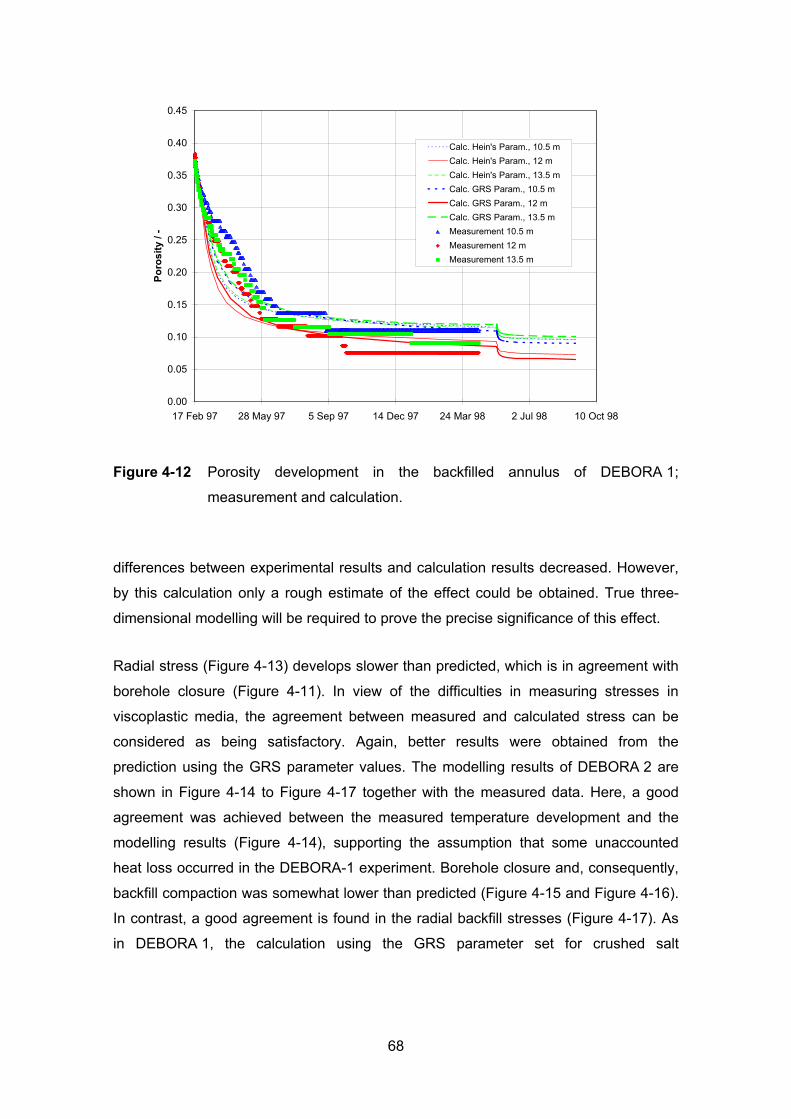
0.00
0.05
0.10
0.15
0.20
0.25
0.30
0.35
0.40
0.45
17 Feb 97 28 May 97 5 Sep 97 14 Dec 97 24 Mar 98 2 Jul 98 10 Oct 98
Poro
sity
/ -
Calc. Hein's Param., 10.5 mCalc. Hein's Param., 12 mCalc. Hein's Param., 13.5 mCalc. GRS Param., 10.5 mCalc. GRS Param., 12 mCalc. GRS Param., 13.5 mMeasurement 10.5 mMeasurement 12 mMeasurement 13.5 m
Figure 4-12 Porosity development in the backfilled annulus of DEBORA 1;
measurement and calculation.
differences between experimental results and calculation results decreased. However,
by this calculation only a rough estimate of the effect could be obtained. True three-
dimensional modelling will be required to prove the precise significance of this effect.
Radial stress (Figure 4-13) develops slower than predicted, which is in agreement with
borehole closure (Figure 4-11). In view of the difficulties in measuring stresses in
viscoplastic media, the agreement between measured and calculated stress can be
considered as being satisfactory. Again, better results were obtained from the
prediction using the GRS parameter values. The modelling results of DEBORA 2 are
shown in Figure 4-14 to Figure 4-17 together with the measured data. Here, a good
agreement was achieved between the measured temperature development and the
modelling results (Figure 4-14), supporting the assumption that some unaccounted
heat loss occurred in the DEBORA-1 experiment. Borehole closure and, consequently,
backfill compaction was somewhat lower than predicted (Figure 4-15 and Figure 4-16).
In contrast, a good agreement is found in the radial backfill stresses (Figure 4-17). As
in DEBORA 1, the calculation using the GRS parameter set for crushed salt
68
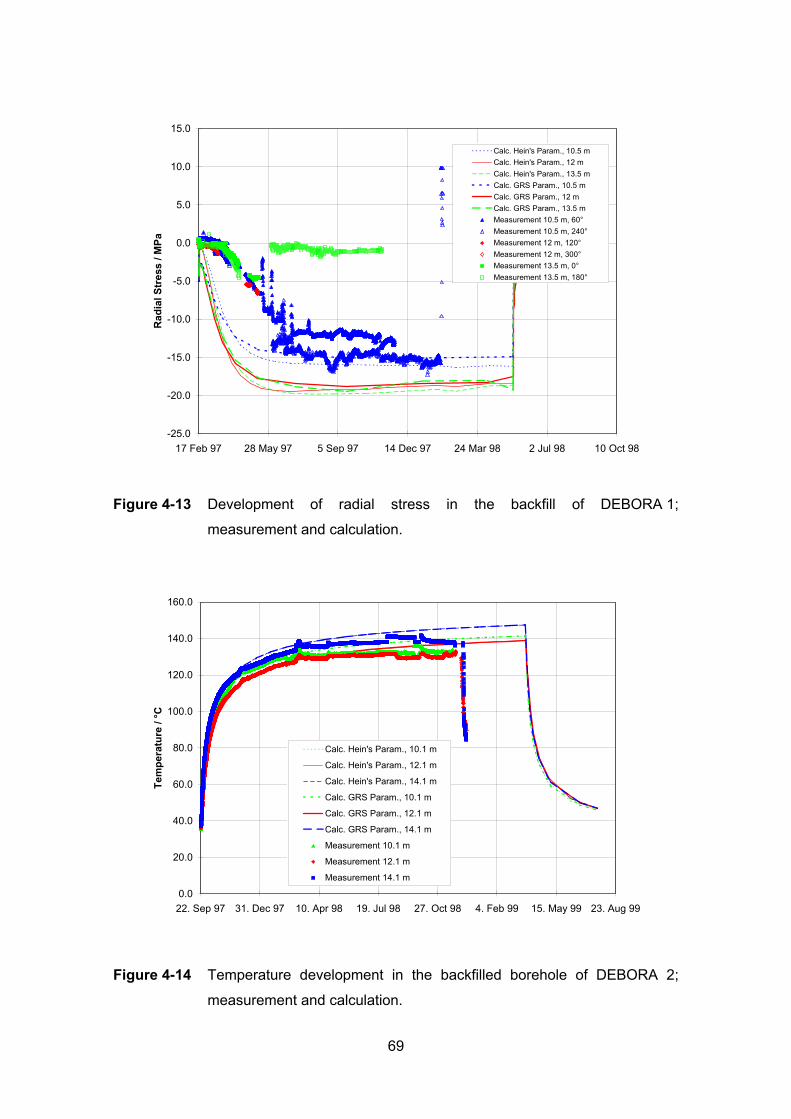
-25.0
-20.0
-15.0
-10.0
-5.0
0.0
5.0
10.0
15.0
17 Feb 97 28 May 97 5 Sep 97 14 Dec 97 24 Mar 98 2 Jul 98 10 Oct 98
Rad
ial S
tres
s / M
PaCalc. Hein's Param., 10.5 mCalc. Hein's Param., 12 mCalc. Hein's Param., 13.5 mCalc. GRS Param., 10.5 mCalc. GRS Param., 12 mCalc. GRS Param., 13.5 mMeasurement 10.5 m, 60°Measurement 10.5 m, 240°Measurement 12 m, 120°Measurement 12 m, 300°Measurement 13.5 m, 0°Measurement 13.5 m, 180°
Figure 4-13 Development of radial stress in the backfill of DEBORA 1;
measurement and calculation.
0.0
20.0
40.0
60.0
80.0
100.0
120.0
140.0
160.0
22. Sep 97 31. Dec 97 10. Apr 98 19. Jul 98 27. Oct 98 4. Feb 99 15. May 99 23. Aug 99
Tem
pera
ture
/ °C
Calc. Hein's Param., 10.1 m
Calc. Hein's Param., 12.1 m
Calc. Hein's Param., 14.1 m
Calc. GRS Param., 10.1 m
Calc. GRS Param., 12.1 m
Calc. GRS Param., 14.1 m
Measurement 10.1 m
Measurement 12.1 m
Measurement 14.1 m
Figure 4-14 Temperature development in the backfilled borehole of DEBORA 2;
measurement and calculation.
69
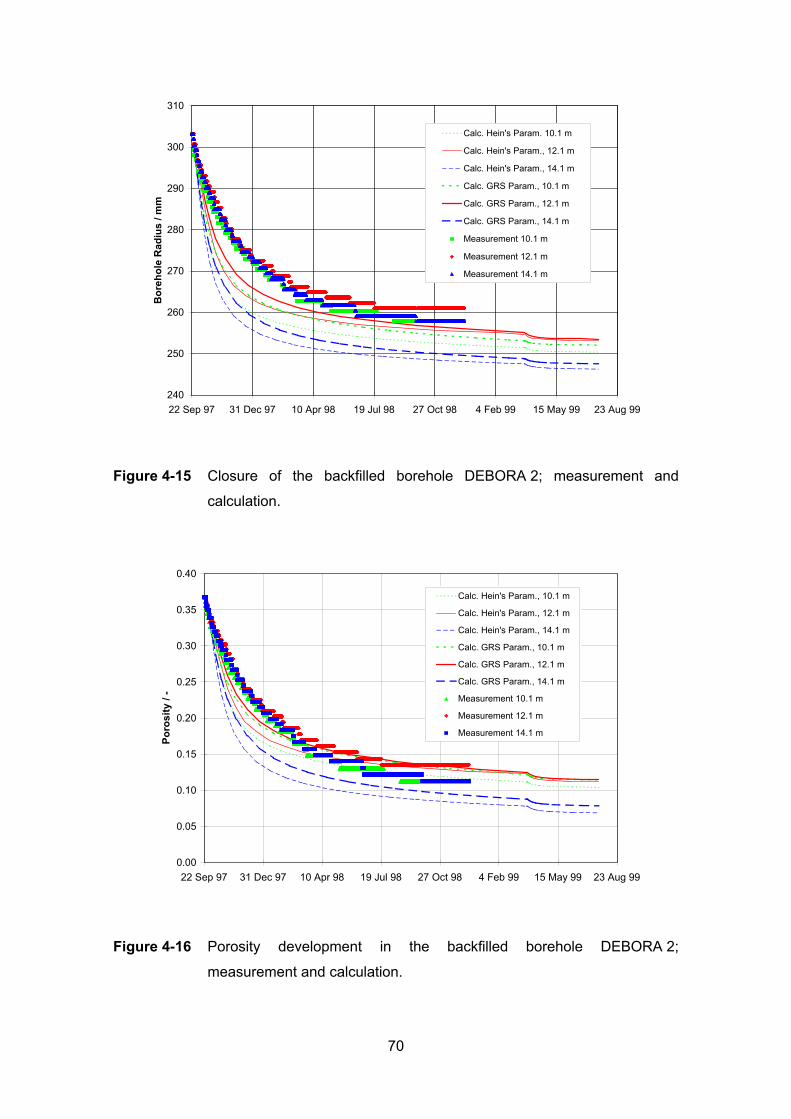
240
250
260
270
280
290
300
310
22 Sep 97 31 Dec 97 10 Apr 98 19 Jul 98 27 Oct 98 4 Feb 99 15 May 99 23 Aug 99
Bor
ehol
e R
adiu
s / m
m
Calc. Hein's Param. 10.1 m
Calc. Hein's Param., 12.1 m
Calc. Hein's Param., 14.1 m
Calc. GRS Param., 10.1 m
Calc. GRS Param., 12.1 m
Calc. GRS Param., 14.1 m
Measurement 10.1 m
Measurement 12.1 m
Measurement 14.1 m
Figure 4-15 Closure of the backfilled borehole DEBORA 2; measurement and
calculation.
0.00
0.05
0.10
0.15
0.20
0.25
0.30
0.35
0.40
22 Sep 97 31 Dec 97 10 Apr 98 19 Jul 98 27 Oct 98 4 Feb 99 15 May 99 23 Aug 99
Poro
sity
/ -
Calc. Hein's Param., 10.1 m
Calc. Hein's Param., 12.1 m
Calc. Hein's Param., 14.1 m
Calc. GRS Param., 10.1 m
Calc. GRS Param., 12.1 m
Calc. GRS Param., 14.1 m
Measurement 10.1 m
Measurement 12.1 m
Measurement 14.1 m
Figure 4-16 Porosity development in the backfilled borehole DEBORA 2;
measurement and calculation.
70
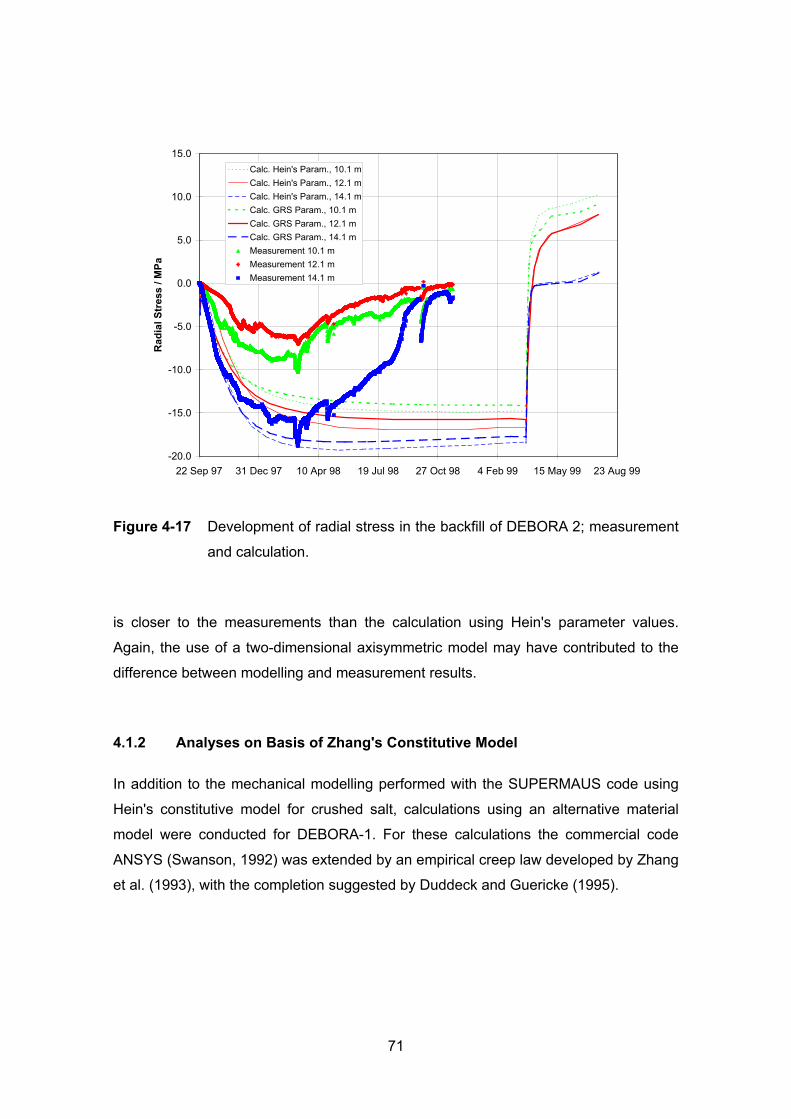
-20.0
-15.0
-10.0
-5.0
0.0
5.0
10.0
15.0
22 Sep 97 31 Dec 97 10 Apr 98 19 Jul 98 27 Oct 98 4 Feb 99 15 May 99 23 Aug 99
Rad
ial S
tres
s / M
PaCalc. Hein's Param., 10.1 mCalc. Hein's Param., 12.1 mCalc. Hein's Param., 14.1 mCalc. GRS Param., 10.1 mCalc. GRS Param., 12.1 mCalc. GRS Param., 14.1 mMeasurement 10.1 mMeasurement 12.1 mMeasurement 14.1 m
Figure 4-17 Development of radial stress in the backfill of DEBORA 2; measurement
and calculation.
is closer to the measurements than the calculation using Hein's parameter values.
Again, the use of a two-dimensional axisymmetric model may have contributed to the
difference between modelling and measurement results.
4.1.2 Analyses on Basis of Zhang's Constitutive Model
In addition to the mechanical modelling performed with the SUPERMAUS code using
Hein's constitutive model for crushed salt, calculations using an alternative material
model were conducted for DEBORA-1. For these calculations the commercial code
ANSYS (Swanson, 1992) was extended by an empirical creep law developed by Zhang
et al. (1993), with the completion suggested by Duddeck and Guericke (1995).
71
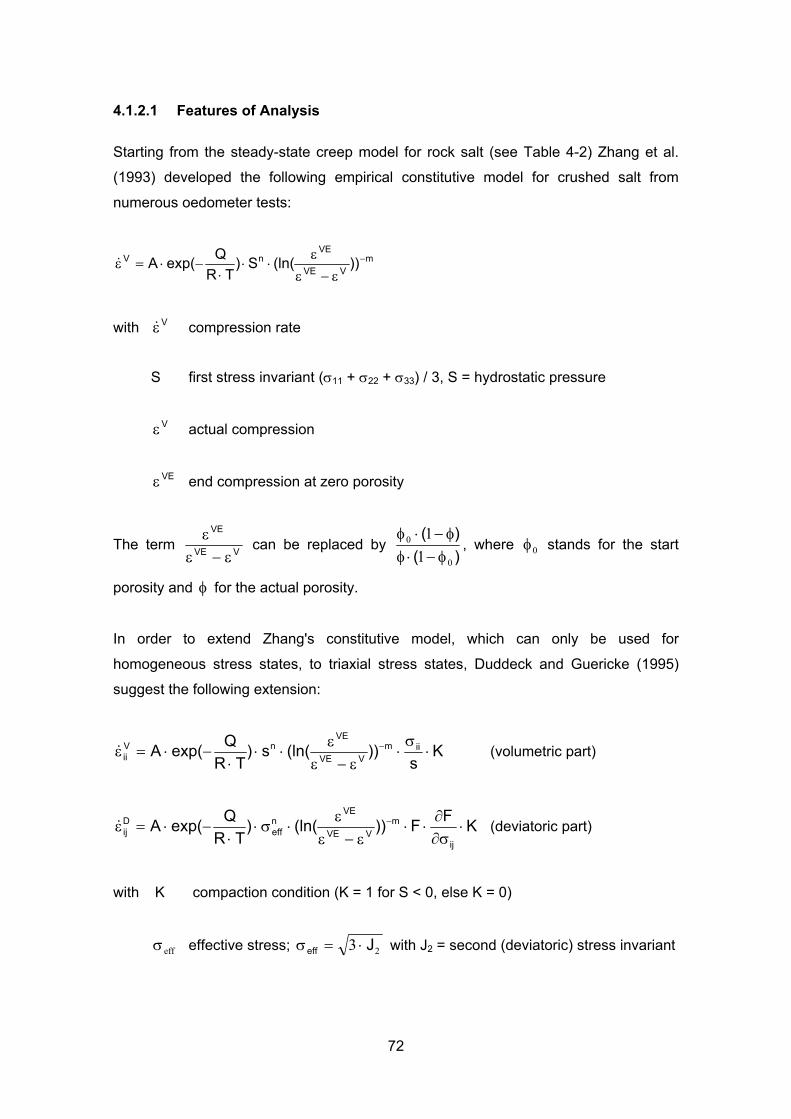
4.1.2.1 Features of Analysis
Starting from the steady-state creep model for rock salt (see Table 4-2) Zhang et al.
(1993) developed the following empirical constitutive model for crushed salt from
numerous oedometer tests:
mVVE
VEnV ))(ln(S)
TRQexp(A −
ε−εε
⋅⋅⋅
−⋅=ε&
with compression rate Vε&
S first stress invariant (σ11 + σ22 + σ33) / 3, S = hydrostatic pressure
actual compression Vε
end compression at zero porosity VEε
The term VVE
VE
ε−εε
can be replaced by )()(
0
0
11
φ−⋅φφ−⋅φ
, where 0φ stands for the start
porosity and φ for the actual porosity.
In order to extend Zhang's constitutive model, which can only be used for
homogeneous stress states, to triaxial stress states, Duddeck and Guericke (1995)
suggest the following extension:
Ks
))(ln(s)TR
Qexp(A iimVVE
VEnV
ii ⋅σ
⋅ε−ε
ε⋅⋅
⋅−⋅=ε −& (volumetric part)
KFF))(ln()TR
Qexp(Aij
mVVE
VEneff
Dij ⋅
∂σ∂
⋅⋅ε−ε
ε⋅σ⋅
⋅−⋅=ε −& (deviatoric part)
with K compaction condition (K = 1 for S < 0, else K = 0)
effective stress; effσ 23 Jeff ⋅=σ with J2 = second (deviatoric) stress invariant
72

F flow condition after von Mises; 02JF σ−= for 02J σ> , else F = 0
( is the uniaxial flow limit stress) 0σ
The above constitutive model was included in the finite element code ANSYS
(Swanson, 1992), Release 5.4.
For the DEBORA-1 calculation, an axisymmetric finite element model of 926 8-node
elements with 2863 nodes was used. Although ANSYS allows three-dimensional
modelling, an axisymmetric model was chosen, since the DEBORA-1 experiment is
appreciably axisymmetric, and also for better comparability with the SUPERMAUS
calculations using Hein's material law for crushed salt.
Except for crushed salt, the material parameters were the same as in the
SUPERMAUS calculations. The mechanical parameters for crushed salt were given by
Zhang: n = 7.1, m = 10.9, A = 5.903 ⋅ 10-49 s-1 Pa-n (equals 1.41 ⋅ 10-4 min-1 MPa-n, see
Zhang et al., 1993). Actually, these parameters would have had to be determined in
laboratory tests on the DEBORA backfill; for this first orientating calculation, however,
Zhang's parameters were thought to be sufficient.
There is no direct coupling between thermal parameters and porosity in the extended
ANSYS code. Therefore, averaged thermal parameters for crushed salt had to be
used. The chosen values are exact for a porosity of 10 %.
4.1.2.2 Results
Figure 4-18 to Figure 4-21 show the calculation results using Zhang's constitutive
model for crushed salt together with the measured data for temperature, deformation,
porosity, and stress, respectively.
The temperature of the backfill close to the borehole liner is shown in Figure 4-18. As in
the SUPERMAUS modelling, the calculated temperatures are considerably higher than
the measured ones. The temperature at the end of the heating period ranges between
216 °C and 227 °C, which is in sufficient agreement with the SUPERMAUS results
using Hein's material law. The temperature increase at early time is slower with the
ANSYS calculation (compare Figure 4-2 or Figure 4-10). This is a result of the
averaged thermal conductivity for crushed salt which is accurate for a porosity of 10 %.
73
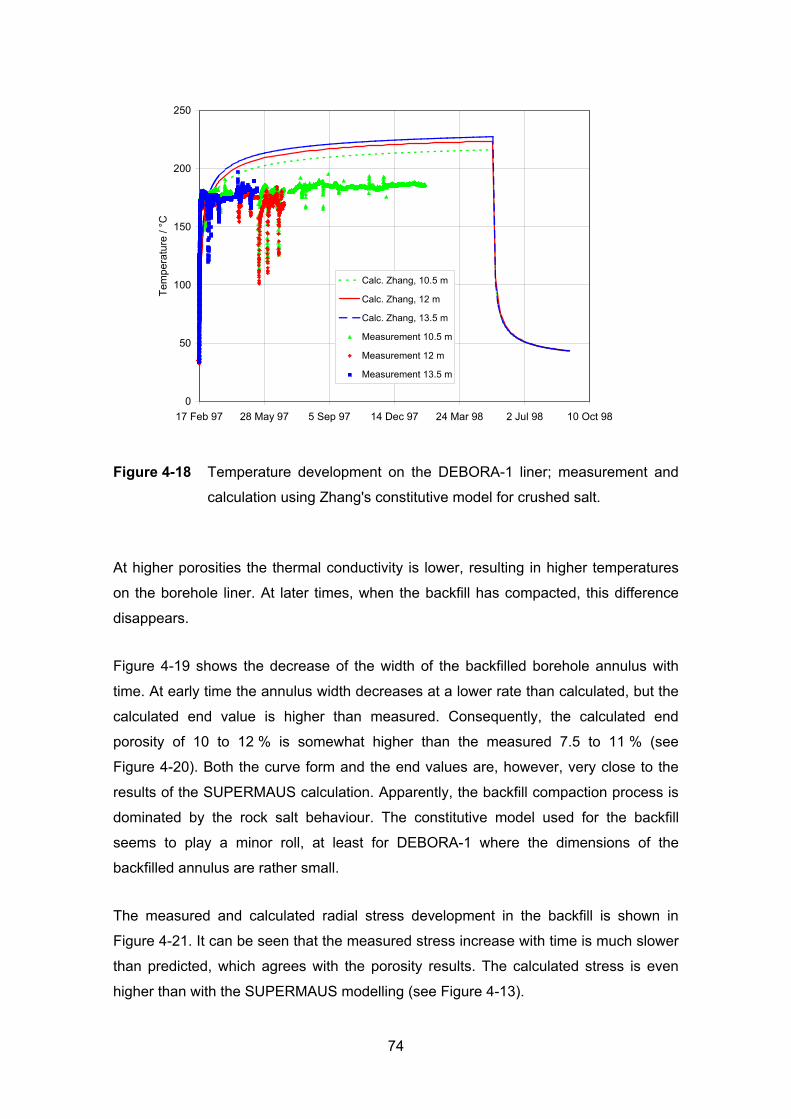
0
50
100
150
200
250
17 Feb 97 28 May 97 5 Sep 97 14 Dec 97 24 Mar 98 2 Jul 98 10 Oct 98
Tem
pera
ture
/ °C
Calc. Zhang, 10.5 m
Calc. Zhang, 12 m
Calc. Zhang, 13.5 m
Measurement 10.5 m
Measurement 12 m
Measurement 13.5 m
Figure 4-18 Temperature development on the DEBORA-1 liner; measurement and
calculation using Zhang's constitutive model for crushed salt.
At higher porosities the thermal conductivity is lower, resulting in higher temperatures
on the borehole liner. At later times, when the backfill has compacted, this difference
disappears.
Figure 4-19 shows the decrease of the width of the backfilled borehole annulus with
time. At early time the annulus width decreases at a lower rate than calculated, but the
calculated end value is higher than measured. Consequently, the calculated end
porosity of 10 to 12 % is somewhat higher than the measured 7.5 to 11 % (see
Figure 4-20). Both the curve form and the end values are, however, very close to the
results of the SUPERMAUS calculation. Apparently, the backfill compaction process is
dominated by the rock salt behaviour. The constitutive model used for the backfill
seems to play a minor roll, at least for DEBORA-1 where the dimensions of the
backfilled annulus are rather small.
The measured and calculated radial stress development in the backfill is shown in
Figure 4-21. It can be seen that the measured stress increase with time is much slower
than predicted, which agrees with the porosity results. The calculated stress is even
higher than with the SUPERMAUS modelling (see Figure 4-13).
74
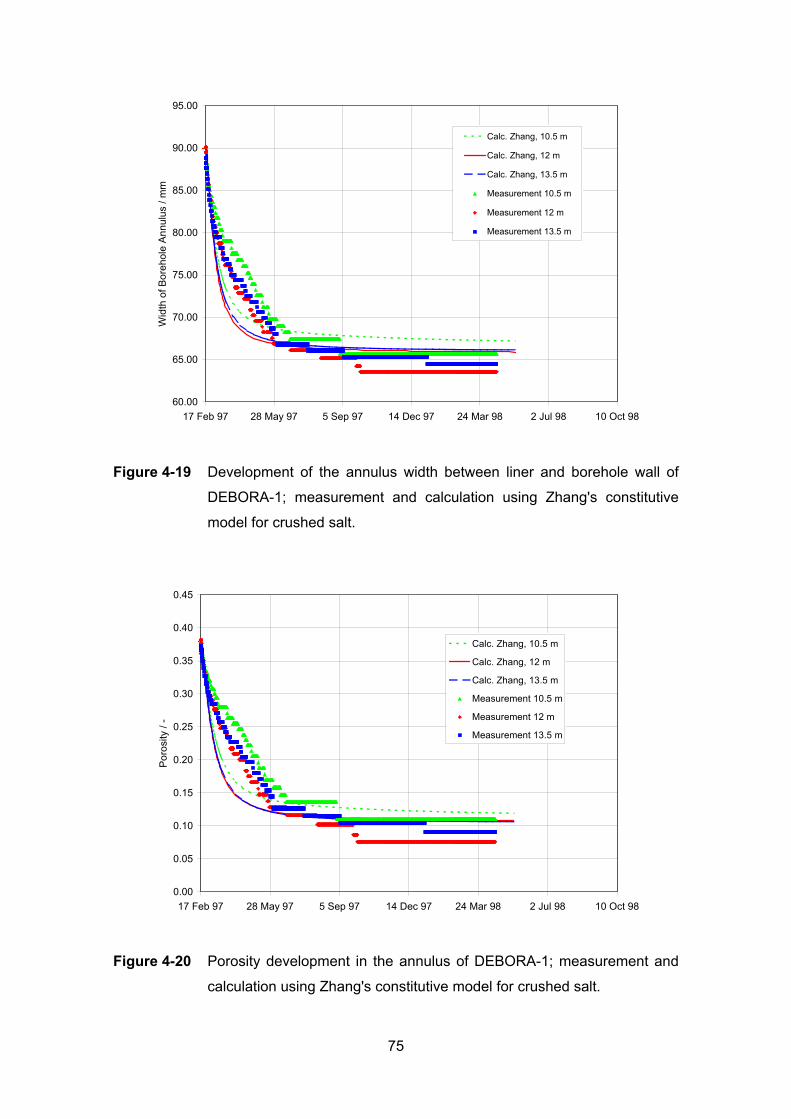
60.00
65.00
70.00
75.00
80.00
85.00
90.00
95.00
17 Feb 97 28 May 97 5 Sep 97 14 Dec 97 24 Mar 98 2 Jul 98 10 Oct 98
Wid
th o
f Bor
ehol
e A
nnul
us /
mm
Calc. Zhang, 10.5 m
Calc. Zhang, 12 m
Calc. Zhang, 13.5 m
Measurement 10.5 m
Measurement 12 m
Measurement 13.5 m
Figure 4-19 Development of the annulus width between liner and borehole wall of
DEBORA-1; measurement and calculation using Zhang's constitutive
model for crushed salt.
0.00
0.05
0.10
0.15
0.20
0.25
0.30
0.35
0.40
0.45
17 Feb 97 28 May 97 5 Sep 97 14 Dec 97 24 Mar 98 2 Jul 98 10 Oct 98
Por
osity
/ -
Calc. Zhang, 10.5 m
Calc. Zhang, 12 m
Calc. Zhang, 13.5 m
Measurement 10.5 m
Measurement 12 m
Measurement 13.5 m
Figure 4-20 Porosity development in the annulus of DEBORA-1; measurement and
calculation using Zhang's constitutive model for crushed salt.
75
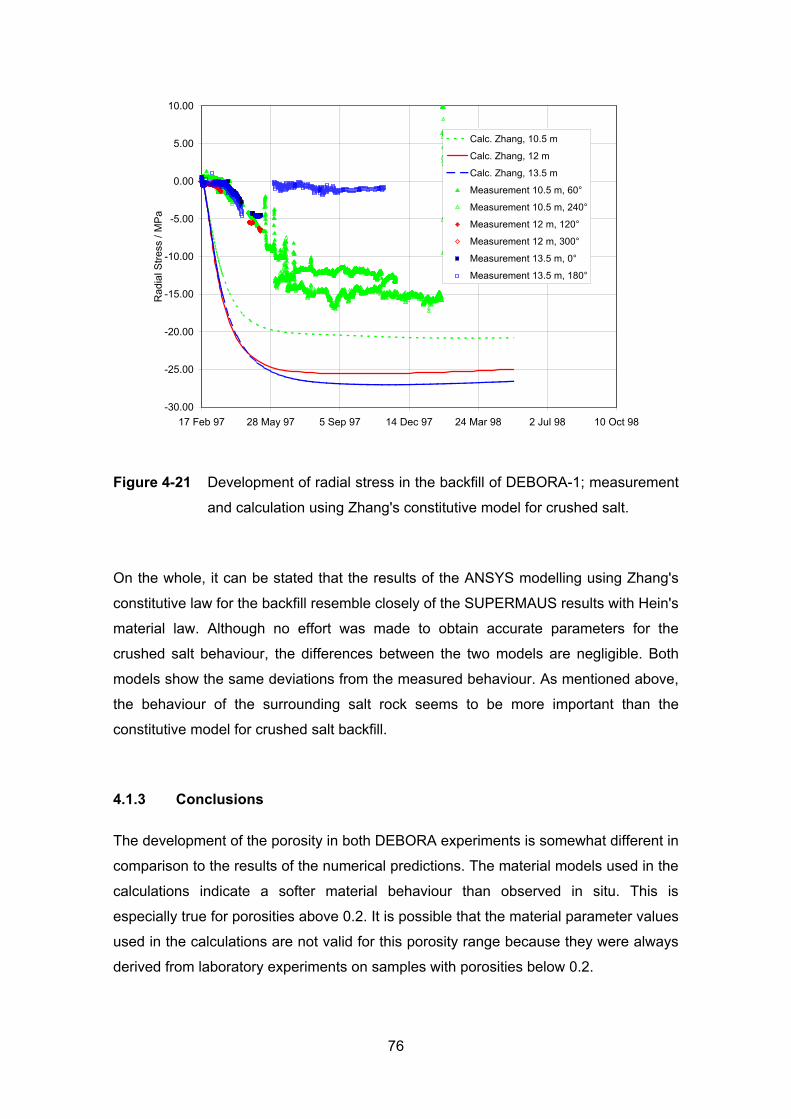
-30.00
-25.00
-20.00
-15.00
-10.00
-5.00
0.00
5.00
10.00
17 Feb 97 28 May 97 5 Sep 97 14 Dec 97 24 Mar 98 2 Jul 98 10 Oct 98
Rad
ial S
tress
/ M
Pa
Calc. Zhang, 10.5 m
Calc. Zhang, 12 m
Calc. Zhang, 13.5 m
Measurement 10.5 m, 60°
Measurement 10.5 m, 240°
Measurement 12 m, 120°
Measurement 12 m, 300°
Measurement 13.5 m, 0°
Measurement 13.5 m, 180°
Figure 4-21 Development of radial stress in the backfill of DEBORA-1; measurement
and calculation using Zhang's constitutive model for crushed salt.
On the whole, it can be stated that the results of the ANSYS modelling using Zhang's
constitutive law for the backfill resemble closely of the SUPERMAUS results with Hein's
material law. Although no effort was made to obtain accurate parameters for the
crushed salt behaviour, the differences between the two models are negligible. Both
models show the same deviations from the measured behaviour. As mentioned above,
the behaviour of the surrounding salt rock seems to be more important than the
constitutive model for crushed salt backfill.
4.1.3 Conclusions
The development of the porosity in both DEBORA experiments is somewhat different in
comparison to the results of the numerical predictions. The material models used in the
calculations indicate a softer material behaviour than observed in situ. This is
especially true for porosities above 0.2. It is possible that the material parameter values
used in the calculations are not valid for this porosity range because they were always
derived from laboratory experiments on samples with porosities below 0.2.
76
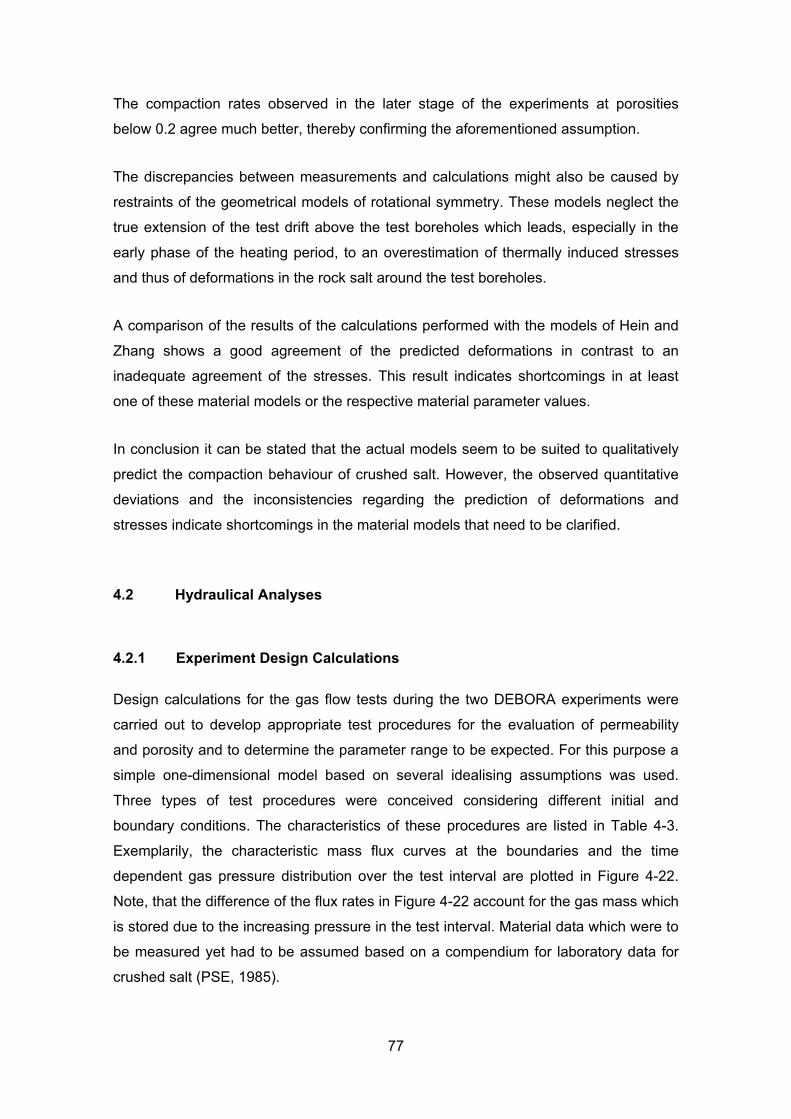
The compaction rates observed in the later stage of the experiments at porosities
below 0.2 agree much better, thereby confirming the aforementioned assumption.
The discrepancies between measurements and calculations might also be caused by
restraints of the geometrical models of rotational symmetry. These models neglect the
true extension of the test drift above the test boreholes which leads, especially in the
early phase of the heating period, to an overestimation of thermally induced stresses
and thus of deformations in the rock salt around the test boreholes.
A comparison of the results of the calculations performed with the models of Hein and
Zhang shows a good agreement of the predicted deformations in contrast to an
inadequate agreement of the stresses. This result indicates shortcomings in at least
one of these material models or the respective material parameter values.
In conclusion it can be stated that the actual models seem to be suited to qualitatively
predict the compaction behaviour of crushed salt. However, the observed quantitative
deviations and the inconsistencies regarding the prediction of deformations and
stresses indicate shortcomings in the material models that need to be clarified.
4.2 Hydraulical Analyses
4.2.1 Experiment Design Calculations
Design calculations for the gas flow tests during the two DEBORA experiments were
carried out to develop appropriate test procedures for the evaluation of permeability
and porosity and to determine the parameter range to be expected. For this purpose a
simple one-dimensional model based on several idealising assumptions was used.
Three types of test procedures were conceived considering different initial and
boundary conditions. The characteristics of these procedures are listed in Table 4-3.
Exemplarily, the characteristic mass flux curves at the boundaries and the time
dependent gas pressure distribution over the test interval are plotted in Figure 4-22.
Note, that the difference of the flux rates in Figure 4-22 account for the gas mass which
is stored due to the increasing pressure in the test interval. Material data which were to
be measured yet had to be assumed based on a compendium for laboratory data for
crushed salt (PSE, 1985).
77
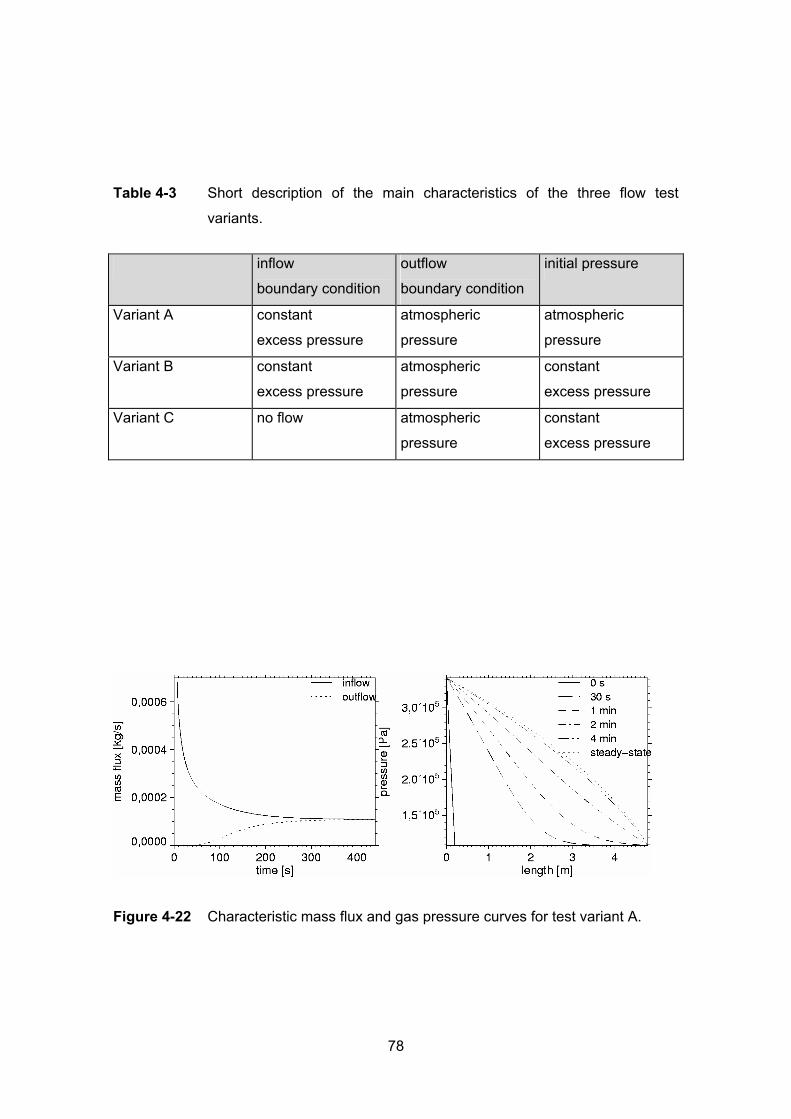
Table 4-3 Short description of the main characteristics of the three flow test
variants.
inflow
boundary condition
outflow
boundary condition
initial pressure
Variant A constant
excess pressure
atmospheric
pressure
atmospheric
pressure
Variant B constant
excess pressure
atmospheric
pressure
constant
excess pressure
Variant C no flow atmospheric
pressure
constant
excess pressure
Figure 4-22 Characteristic mass flux and gas pressure curves for test variant A.
78
Influence of the Klinkenberg effect
The measured gas permeability is usually divided by a factor of (1 + b/ p’) in order to
take the effect of slip flow into account. This factor contains the mean absolute gas
pressure p’ and the Klinkenberg constant b which can be exactly determined by
measurements only. However, in this case the constant was estimated from a
comprehensive compilation of measurements (Rieckmann, 1970).
The greatest influence of slip flow is observed for a low mean pressure and low
porosity values because the Klinkenberg constant b is inverse proportional to the free
path length of the gas molecules (Karman, 1956). In order to estimate the maximum
difference between apparent and absolute permeability it was assumed that a
hypothetical measurement was performed at a mean gas pressure of one bar and at a
permeability of 10-14 m2. This leads to a maximum value of 0.5 bar for the constant b
including uncertainties due to the natural data scattering in the compilation mentioned
above. Under these conditions the increase of the absolute permeability amounted to
33 %. This stated an upper boundary for the deviations to be expected and proved to
be a very good estimation for the data derived from the DEBORA experiments.
Comparison prediction-measurements
The predictions for the flow tests were not met precisely during the experiments. This is
mainly due to the fact that the permeability-porosity function derived from data of the
DEBORA experiments deviated from the function used for the design calculations.
Minor differences concerning the test parameters arose as well. Yet the main
conclusions from the design of the experiments proved to be valid in the actual tests:
- The porosity dependent steady-state mass flux rate changed over two orders of
magnitude for the porosity range observed when the same excess pressure was
used.
- The transient mass flux rate in a single flow test changed over about one order of
magnitude.
- The flow test duration lay on the order of ten minutes except for high porosity
values when it took considerable time to build up the pressure at the inflow
boundary.
79
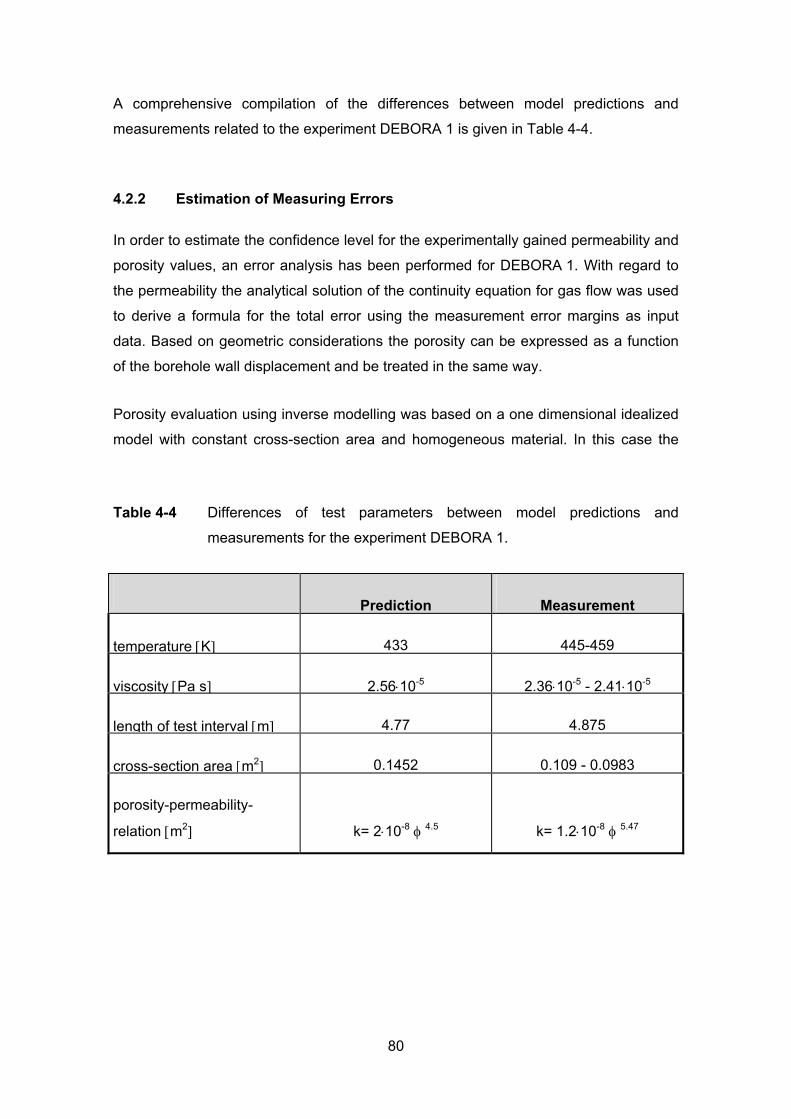
A comprehensive compilation of the differences between model predictions and
measurements related to the experiment DEBORA 1 is given in Table 4-4.
4.2.2 Estimation of Measuring Errors
In order to estimate the confidence level for the experimentally gained permeability and
porosity values, an error analysis has been performed for DEBORA 1. With regard to
the permeability the analytical solution of the continuity equation for gas flow was used
to derive a formula for the total error using the measurement error margins as input
data. Based on geometric considerations the porosity can be expressed as a function
of the borehole wall displacement and be treated in the same way.
Porosity evaluation using inverse modelling was based on a one dimensional idealized
model with constant cross-section area and homogeneous material. In this case the
Table 4-4 Differences of test parameters between model predictions and
measurements for the experiment DEBORA 1.
Prediction Measurement
temperature [K] 433 445-459
viscosity [Pa s] 2.56⋅10-5 2.36⋅10-5 - 2.41⋅10-5
length of test interval [m] 4.77 4.875
cross-section area [m2] 0.1452 0.109 - 0.0983
porosity-permeability-
relation [m2]
k= 2⋅10-8 φ 4.5
k= 1.2⋅10-8 φ 5.47
80
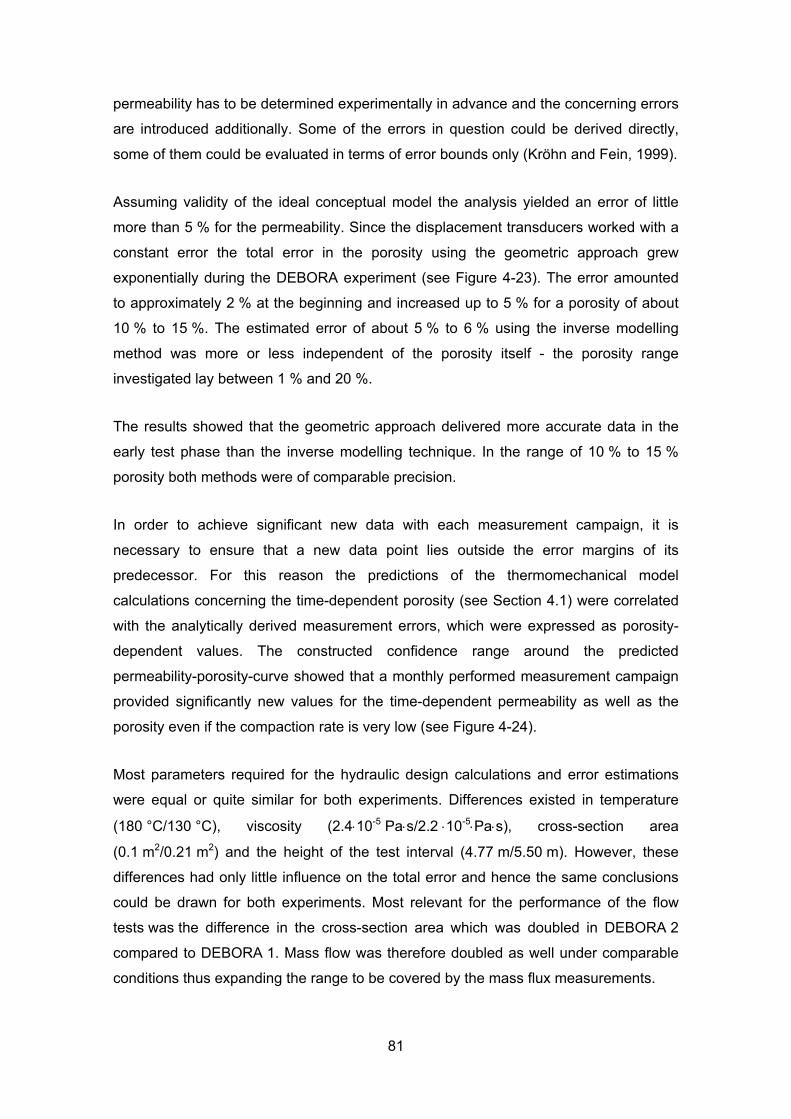
permeability has to be determined experimentally in advance and the concerning errors
are introduced additionally. Some of the errors in question could be derived directly,
some of them could be evaluated in terms of error bounds only (Kröhn and Fein, 1999).
Assuming validity of the ideal conceptual model the analysis yielded an error of little
more than 5 % for the permeability. Since the displacement transducers worked with a
constant error the total error in the porosity using the geometric approach grew
exponentially during the DEBORA experiment (see Figure 4-23). The error amounted
to approximately 2 % at the beginning and increased up to 5 % for a porosity of about
10 % to 15 %. The estimated error of about 5 % to 6 % using the inverse modelling
method was more or less independent of the porosity itself - the porosity range
investigated lay between 1 % and 20 %.
The results showed that the geometric approach delivered more accurate data in the
early test phase than the inverse modelling technique. In the range of 10 % to 15 %
porosity both methods were of comparable precision.
In order to achieve significant new data with each measurement campaign, it is
necessary to ensure that a new data point lies outside the error margins of its
predecessor. For this reason the predictions of the thermomechanical model
calculations concerning the time-dependent porosity (see Section 4.1) were correlated
with the analytically derived measurement errors, which were expressed as porosity-
dependent values. The constructed confidence range around the predicted
permeability-porosity-curve showed that a monthly performed measurement campaign
provided significantly new values for the time-dependent permeability as well as the
porosity even if the compaction rate is very low (see Figure 4-24).
Most parameters required for the hydraulic design calculations and error estimations
were equal or quite similar for both experiments. Differences existed in temperature
(180 °C/130 °C), viscosity (2.4⋅10-5 Pa⋅s/2.2 ⋅10-5⋅Pa⋅s), cross-section area
(0.1 m2/0.21 m2) and the height of the test interval (4.77 m/5.50 m). However, these
differences had only little influence on the total error and hence the same conclusions
could be drawn for both experiments. Most relevant for the performance of the flow
tests was the difference in the cross-section area which was doubled in DEBORA 2
compared to DEBORA 1. Mass flow was therefore doubled as well under comparable
conditions thus expanding the range to be covered by the mass flux measurements.
81
Figure 4-23 Relative error of the porosity using the inverse flow test modelling
method (rhombus) and using displacement transducer measurements
(plus).
4.2.3 Determination of Backfill Porosity
Data of the borehole wall displacement provided by six displacement transducers was
used to determine the crushed salt porosity. The porosity values at the six locations
were calculated based on geometric considerations and then averaged out. An
alternative method which evaluates an integral porosity value is given by means of
inverse modelling of the transient gas flow tests.
The analytically derived permeability value and the monitored pressure are used as
input data for a gas flow model which provides transient mass fluxes at the boundaries
of the crushed salt column. The calculated mass flux curves are then to be matched
with the measured mass fluxes by varying the only unknown parameter in the
continuity equation - the porosity.
82
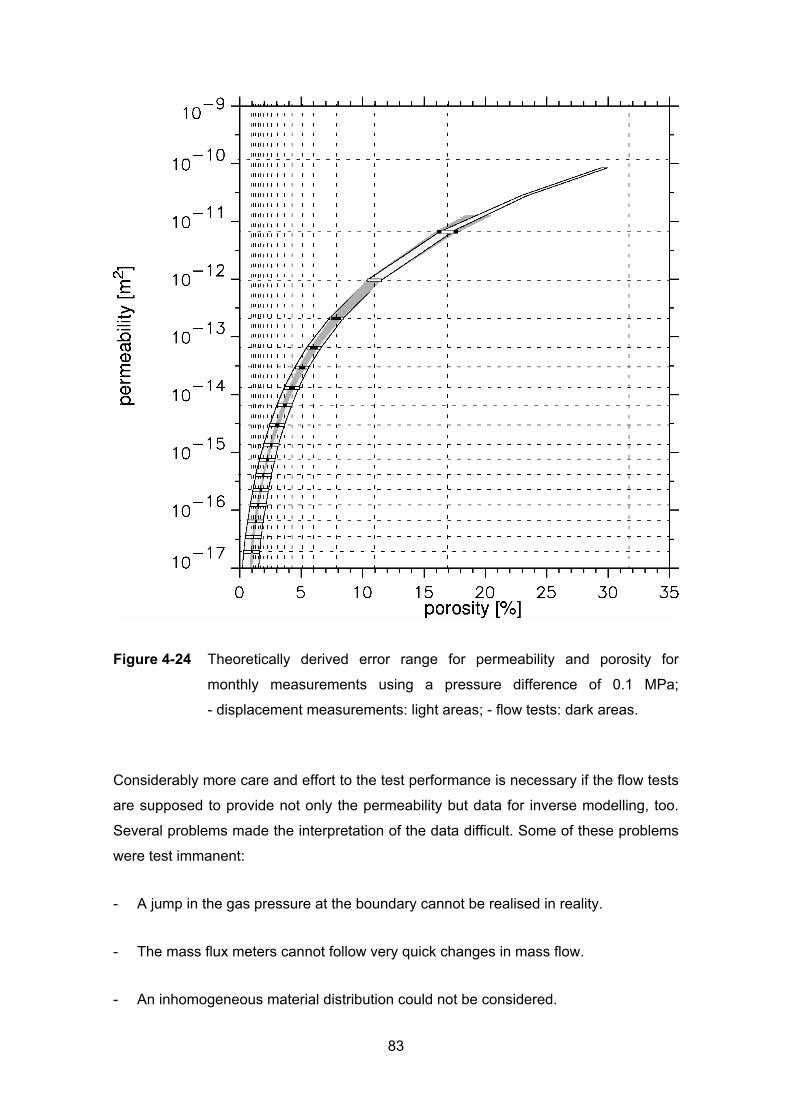
Figure 4-24 Theoretically derived error range for permeability and porosity for
monthly measurements using a pressure difference of 0.1 MPa;
- displacement measurements: light areas; - flow tests: dark areas.
Considerably more care and effort to the test performance is necessary if the flow tests
are supposed to provide not only the permeability but data for inverse modelling, too.
Several problems made the interpretation of the data difficult. Some of these problems
were test immanent:
- A jump in the gas pressure at the boundary cannot be realised in reality.
- The mass flux meters cannot follow very quick changes in mass flow.
- An inhomogeneous material distribution could not be considered.
83
Some others could be fixed when recognised:
- Temporarily the inflow pressure could not be kept constant due to equipment
failures.
- Humidity in the salt attacked the outflow mass flux meters making the measured
data unusable for porosity evaluation (especially DEBORA 2).
Despite of these difficulties it was possible to interpret the data from DEBORA 1 flow
tests measured in May, June, July and December 1997. All these tests followed a test
procedure according to variant A (see Table 4-3).
Model calculations based on the complete set of idealising assumptions and
measurements could not be matched, though. In order to determine the reason for the
discrepancy, several input parameters for the numerical model were varied extensively
within reasonable limits. It could be shown that inhomogeneity of the cross-section area
and therefore the porosity as well as inhomogeneity of the permeability and variable
temperature are of secondary importance to this problem. A sufficient match was not
possible until the gas injection volume was added to the model and the measured time
dependent input pressure was used as a boundary condition.
The porosity values determined by inverse modelling show a faster compaction rate for
the first five months than the geometrically derived data (see Figure 2-11 in
Section 2.1.3). The changes after that time are minimal and could not be demonstrated
by this method. The same two phases of compaction can be recognised in the
displacement data but the change into slow compaction is observed some three
months later. The final porosity value at the end of DEBORA 1 determined by inverse
modelling lies slightly below the displacement derived value.
However, the final porosity distribution along the crushed salt column was determined
by post-test laboratory investigations. This distribution shows noticeable peaks at the
location of the displacement transducers (see Figure 2-14 in Section 2.1.3). The
average porosity appears to be about two percent lower than the peak value which is
consistent with the results of the inverse modelling.
84
4.2.4 Conclusions
The design calculations proved to be a valuable tool in order to get a first impression
on the hydraulic conditions during the flow tests. The system behaviour was
qualitatively well described and the measured data deviated within reasonable
tolerances from the predictions. Based on the resulting conclusions the design of the
experiments could be successfully optimized.
The analysis of the errors introduced by tolerances of the measuring devices was of
great value, too. It demonstrated a high accuracy of the hydraulic parameters which
were derived from the in-situ measurements. Additionally, it showed that in order to
evaluate the porosity, the flow tests were an equally adequate alternative to the
geometric approach by measuring the annulus width.
The gas flow tests provided integral values of porosity as well as permeability. But the
evaluation of the porosity requires more care and effort concerning test performance
and data interpretation than determining the permeability. The permeability can be
calculated directly using an analytical solution for steady-state flow at any pressure
difference or mass flux rate, respectively. In order to evaluate the porosity, inverse
modelling of the transient gas flow using a numerical model is necessary. Well defined
initial conditions have to be established before starting the flow test and additionally,
the transient pressure and mass flux rates at the inflow and the outflow boundary have
to be monitored. However, the necessary instrumentation for the flow test is practically
the same for both needs.
Inverse modelling of the flow tests was very sensitive to certain violations of the
idealizing assumptions for the numerical model. But it proved to be a valuable addition
to the geometric approach which uses displacement measurements. It set the results of
the geometric method into perspective and gave reason for further investigations. With
respect to the final porosity in DEBORA 1 the discrepancies between the results of the
geometric method and inverse modelling were explained by the results of the post-test
investigations. The porosity value coming from the inverse modelling was thereby
confirmed.
85
5 Analysis of Altered Evolution Scenarios
5.1 Introduction
In addition to the experimental investigations, model calculations were performed within
the framework of the project in order to analyze brine intrusion and two-phase flow of
brine and gas in sealed HLW disposal boreholes. The calculations were done with the
help of the two-phase flow code MUFTE (Helmig et al., 1994). The main objective of
this work was to investigate the two-phase flow processes in view of the high material
parameter contrasts at discontinuities like for instance shaft-drift interface or seal-drift-
interface. The dynamics of the processes were to be analysed, in order to improve the
understanding of the principal mechanisms and the significance of the two-phase flow
in a sealed disposal boreholes. Specific problems with the numerical models for a
realistic repository in rock salt were anticipated. The behaviour of the code and the
reliability of the results were therefore to be identified and analyzed as well.
The considered system consisted of a short horizontal drift and a vertical borehole
which contains the waste canister stack and a seal (see Figure 5-1). Drift, seal, and
annulus around the canister stack were discretized using one-dimensional elements.
Each of the three parts of the model is assumed to be filled with crushed salt in a
different state of compaction. The material data used are based on laboratory
investigations of two-phase flow in compacted crushed salt samples (Cinar et al.,
1998). They are summarized in Table 5-1 together with the system geometry and the
initial and boundary conditions for the three models. Homogeneity and isothermal
conditions as well as constant porosity in the crushed salt were assumed in the model
while these properties are actually time dependent in reality.
Three altered evolution scenarios were investigated:
- brine inflow into the drift and subsequently into the borehole from an
instantaneously flooded 500-m-high shaft
- hydrogen production in a flooded borehole due to corrosion of the HLW steel
canisters
- spontaneous connection of an unexplored brine pocket with the bottom of the
borehole.
86
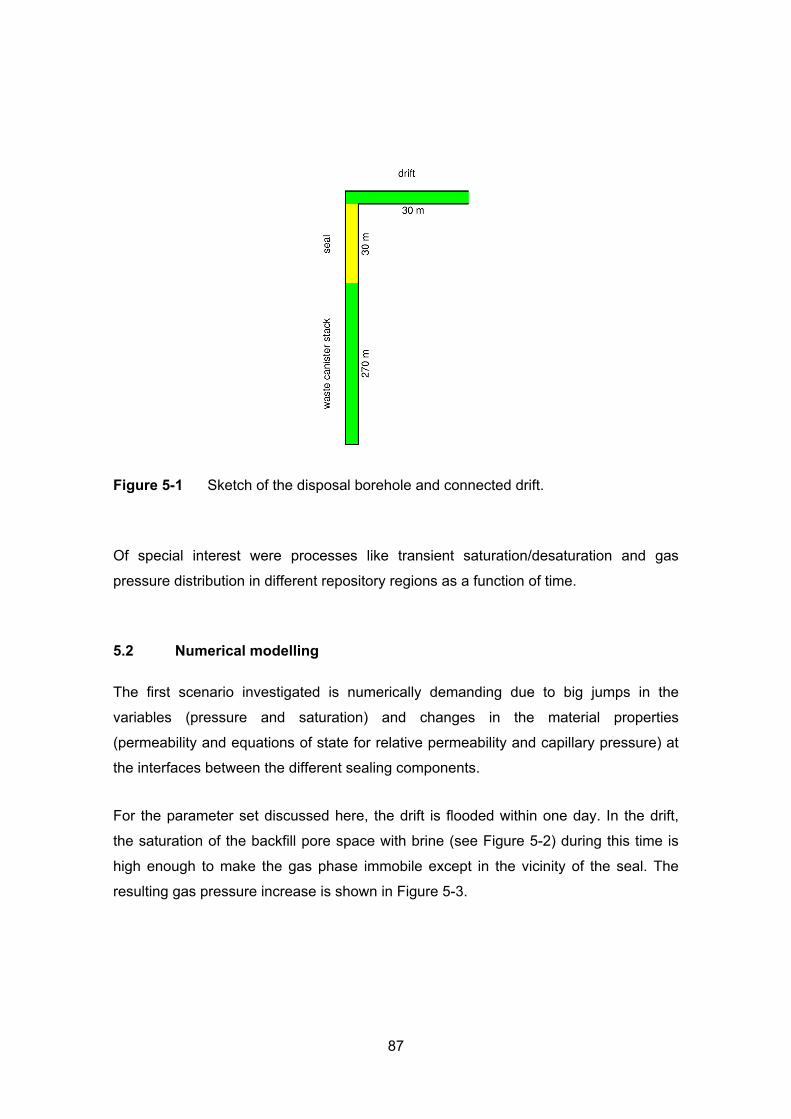
Figure 5-1 Sketch of the disposal borehole and connected drift.
Of special interest were processes like transient saturation/desaturation and gas
pressure distribution in different repository regions as a function of time.
5.2 Numerical modelling
The first scenario investigated is numerically demanding due to big jumps in the
variables (pressure and saturation) and changes in the material properties
(permeability and equations of state for relative permeability and capillary pressure) at
the interfaces between the different sealing components.
For the parameter set discussed here, the drift is flooded within one day. In the drift,
the saturation of the backfill pore space with brine (see Figure 5-2) during this time is
high enough to make the gas phase immobile except in the vicinity of the seal. The
resulting gas pressure increase is shown in Figure 5-3.
87
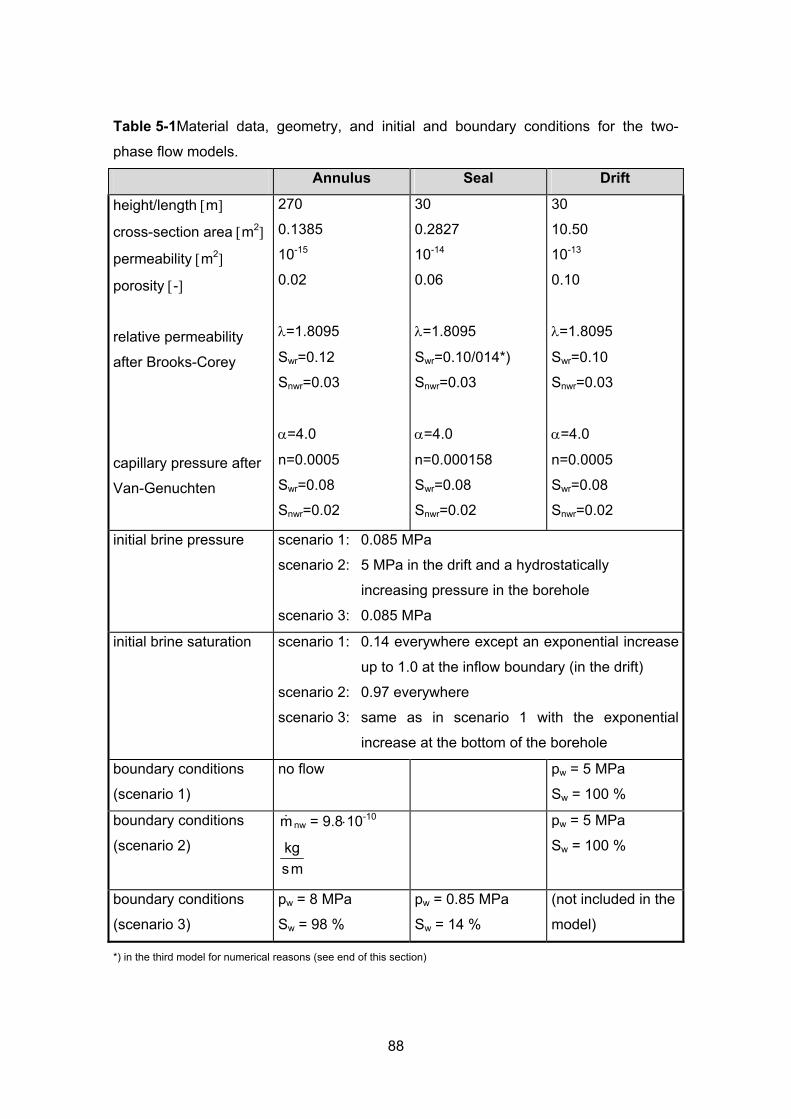
Table 5-1Material data, geometry, and initial and boundary conditions for the two-
phase flow models.
Annulus Seal Drift
height/length [m]
cross-section area [m2]
permeability [m2]
porosity [-]
relative permeability
after Brooks-Corey
capillary pressure after
Van-Genuchten
270
0.1385
10-15
0.02
λ=1.8095
Swr=0.12
Snwr=0.03
α=4.0
n=0.0005
Swr=0.08
Snwr=0.02
30
0.2827
10-14
0.06
λ=1.8095
Swr=0.10/014*)
Snwr=0.03
α=4.0
n=0.000158
Swr=0.08
Snwr=0.02
30
10.50
10-13
0.10
λ=1.8095
Swr=0.10
Snwr=0.03
α=4.0
n=0.0005
Swr=0.08
Snwr=0.02
initial brine pressure scenario 1: 0.085 MPa
scenario 2: 5 MPa in the drift and a hydrostatically
increasing pressure in the borehole
scenario 3: 0.085 MPa
initial brine saturation scenario 1: 0.14 everywhere except an exponential increase
up to 1.0 at the inflow boundary (in the drift)
scenario 2: 0.97 everywhere
scenario 3: same as in scenario 1 with the exponential
increase at the bottom of the borehole
boundary conditions
(scenario 1)
no flow pw = 5 MPa
Sw = 100 %
boundary conditions
(scenario 2) m& nw = 9.8⋅10-10
mskg
pw = 5 MPa
Sw = 100 %
boundary conditions
(scenario 3)
pw = 8 MPa
Sw = 98 %
pw = 0.85 MPa
Sw = 14 %
(not included in the
model)
*) in the third model for numerical reasons (see end of this section)
88
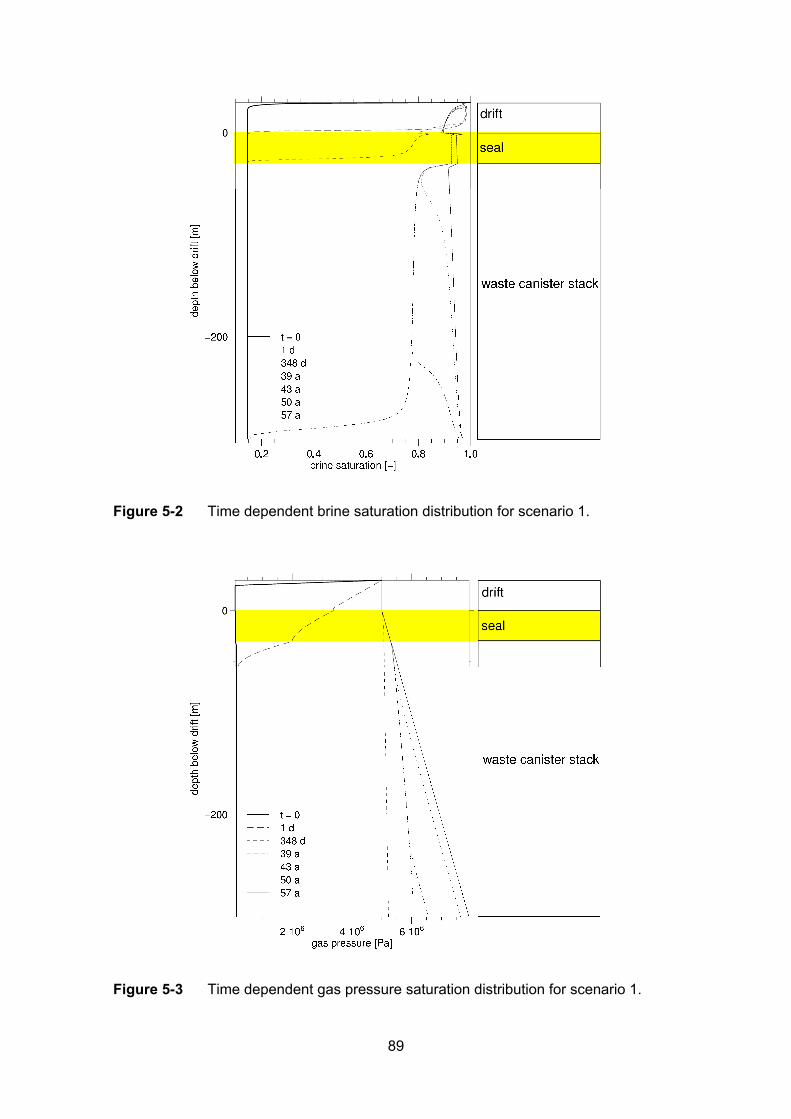
Figure 5-2 Time dependent brine saturation distribution for scenario 1.
Figure 5-3 Time dependent gas pressure saturation distribution for scenario 1.
89
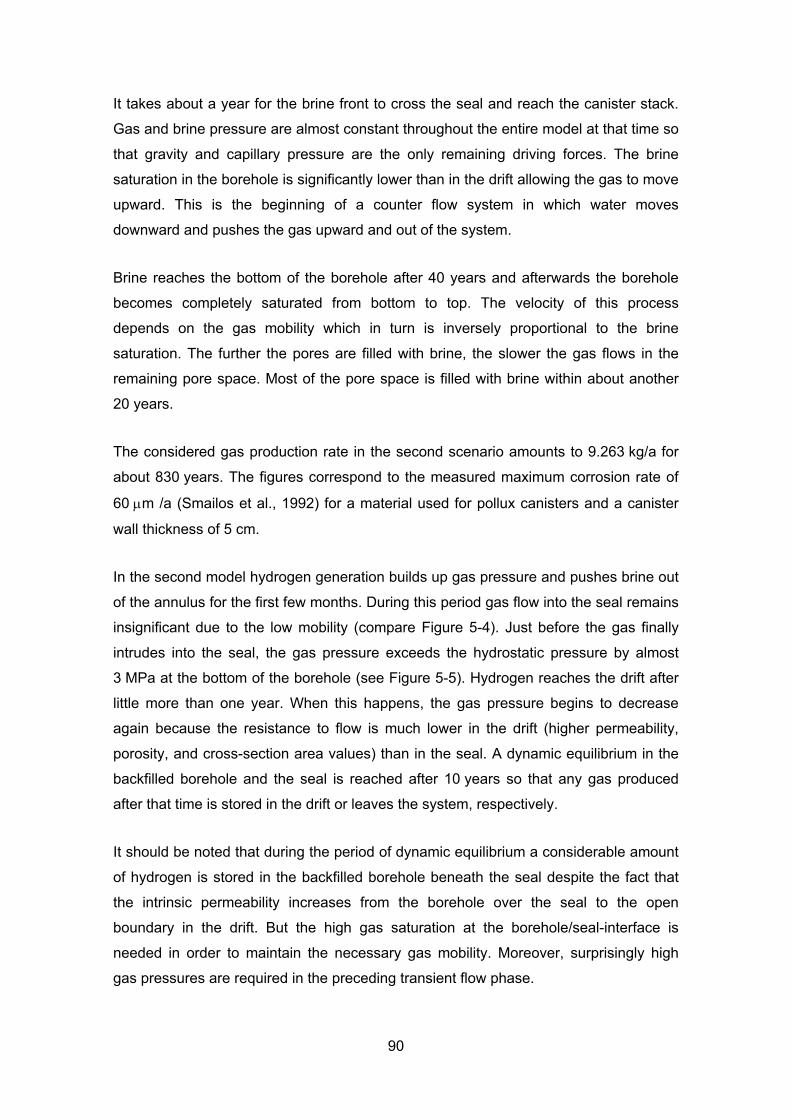
It takes about a year for the brine front to cross the seal and reach the canister stack.
Gas and brine pressure are almost constant throughout the entire model at that time so
that gravity and capillary pressure are the only remaining driving forces. The brine
saturation in the borehole is significantly lower than in the drift allowing the gas to move
upward. This is the beginning of a counter flow system in which water moves
downward and pushes the gas upward and out of the system.
Brine reaches the bottom of the borehole after 40 years and afterwards the borehole
becomes completely saturated from bottom to top. The velocity of this process
depends on the gas mobility which in turn is inversely proportional to the brine
saturation. The further the pores are filled with brine, the slower the gas flows in the
remaining pore space. Most of the pore space is filled with brine within about another
20 years.
The considered gas production rate in the second scenario amounts to 9.263 kg/a for
about 830 years. The figures correspond to the measured maximum corrosion rate of
60 μm /a (Smailos et al., 1992) for a material used for pollux canisters and a canister
wall thickness of 5 cm.
In the second model hydrogen generation builds up gas pressure and pushes brine out
of the annulus for the first few months. During this period gas flow into the seal remains
insignificant due to the low mobility (compare Figure 5-4). Just before the gas finally
intrudes into the seal, the gas pressure exceeds the hydrostatic pressure by almost
3 MPa at the bottom of the borehole (see Figure 5-5). Hydrogen reaches the drift after
little more than one year. When this happens, the gas pressure begins to decrease
again because the resistance to flow is much lower in the drift (higher permeability,
porosity, and cross-section area values) than in the seal. A dynamic equilibrium in the
backfilled borehole and the seal is reached after 10 years so that any gas produced
after that time is stored in the drift or leaves the system, respectively.
It should be noted that during the period of dynamic equilibrium a considerable amount
of hydrogen is stored in the backfilled borehole beneath the seal despite the fact that
the intrinsic permeability increases from the borehole over the seal to the open
boundary in the drift. But the high gas saturation at the borehole/seal-interface is
needed in order to maintain the necessary gas mobility. Moreover, surprisingly high
gas pressures are required in the preceding transient flow phase.
90
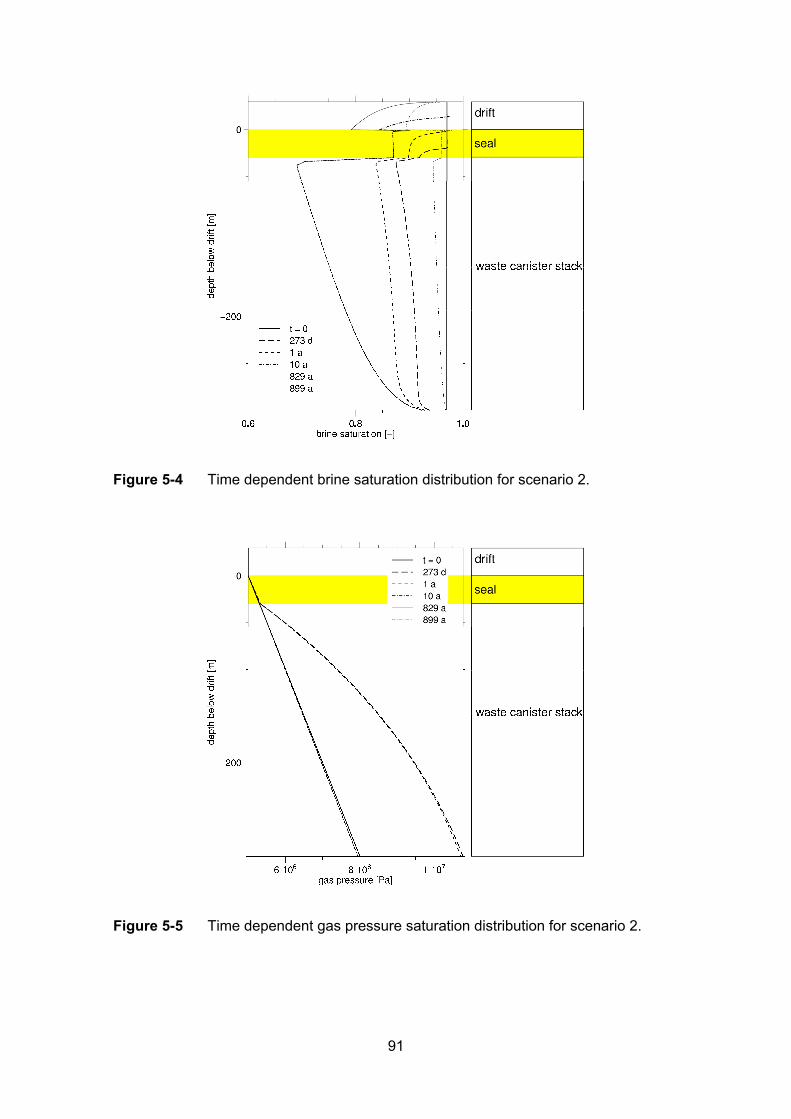
Figure 5-4 Time dependent brine saturation distribution for scenario 2.
Figure 5-5 Time dependent gas pressure saturation distribution for scenario 2.
91
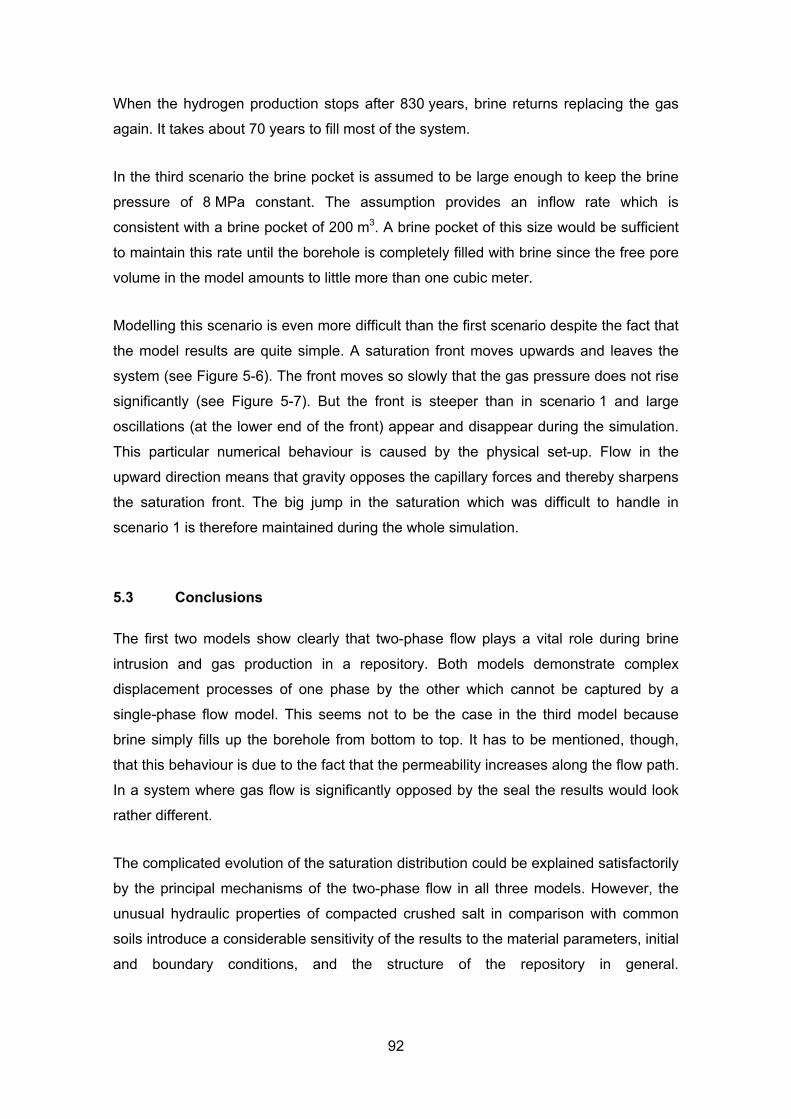
When the hydrogen production stops after 830 years, brine returns replacing the gas
again. It takes about 70 years to fill most of the system.
In the third scenario the brine pocket is assumed to be large enough to keep the brine
pressure of 8 MPa constant. The assumption provides an inflow rate which is
consistent with a brine pocket of 200 m3. A brine pocket of this size would be sufficient
to maintain this rate until the borehole is completely filled with brine since the free pore
volume in the model amounts to little more than one cubic meter.
Modelling this scenario is even more difficult than the first scenario despite the fact that
the model results are quite simple. A saturation front moves upwards and leaves the
system (see Figure 5-6). The front moves so slowly that the gas pressure does not rise
significantly (see Figure 5-7). But the front is steeper than in scenario 1 and large
oscillations (at the lower end of the front) appear and disappear during the simulation.
This particular numerical behaviour is caused by the physical set-up. Flow in the
upward direction means that gravity opposes the capillary forces and thereby sharpens
the saturation front. The big jump in the saturation which was difficult to handle in
scenario 1 is therefore maintained during the whole simulation.
5.3 Conclusions
The first two models show clearly that two-phase flow plays a vital role during brine
intrusion and gas production in a repository. Both models demonstrate complex
displacement processes of one phase by the other which cannot be captured by a
single-phase flow model. This seems not to be the case in the third model because
brine simply fills up the borehole from bottom to top. It has to be mentioned, though,
that this behaviour is due to the fact that the permeability increases along the flow path.
In a system where gas flow is significantly opposed by the seal the results would look
rather different.
The complicated evolution of the saturation distribution could be explained satisfactorily
by the principal mechanisms of the two-phase flow in all three models. However, the
unusual hydraulic properties of compacted crushed salt in comparison with common
soils introduce a considerable sensitivity of the results to the material parameters, initial
and boundary conditions, and the structure of the repository in general.
92
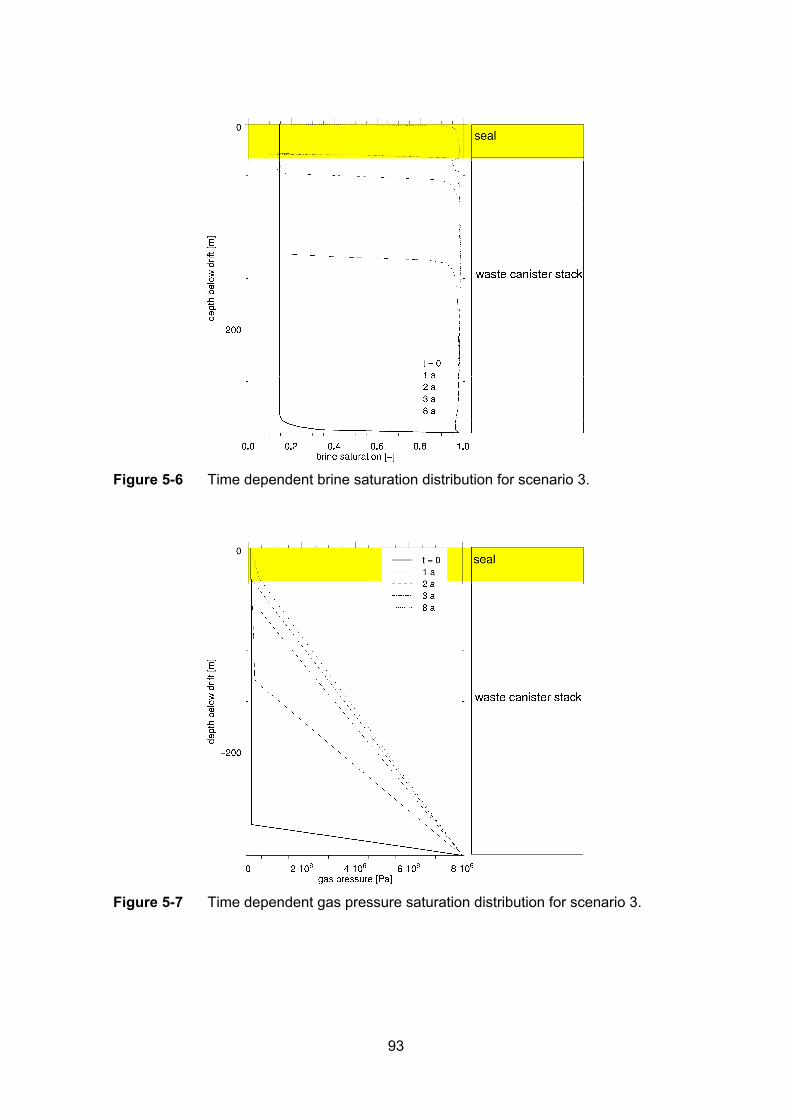
Figure 5-6 Time dependent brine saturation distribution for scenario 3.
Figure 5-7 Time dependent gas pressure saturation distribution for scenario 3.
93

In comparison to common soil the compacted crushed salt shows very low permeability
and porosity values. High contrasts exist between the materials in borehole seals and
backfilled drifts. Additionally, two of the three scenarios considered require big jumps
and high values of the primary and secondary two-phase flow variables. The modelling
of altered evolution scenarios implies therefore demanding conditions for the numerical
simulator. In this situation, it is not surprising that the results are sensitive to almost all
parameters. Actual predictions need therefore a profound understanding of the material
laws of compacting crushed salt and an adequate description of the repository layout.
94
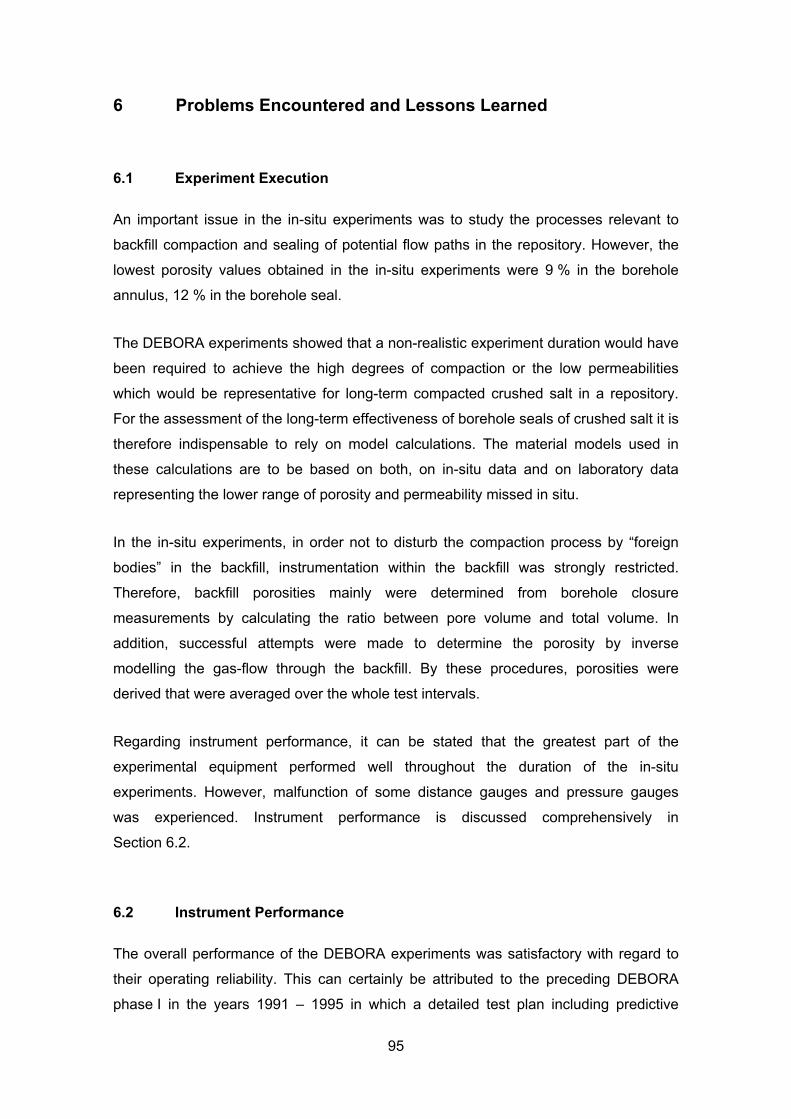
6 Problems Encountered and Lessons Learned
6.1 Experiment Execution
An important issue in the in-situ experiments was to study the processes relevant to
backfill compaction and sealing of potential flow paths in the repository. However, the
lowest porosity values obtained in the in-situ experiments were 9 % in the borehole
annulus, 12 % in the borehole seal.
The DEBORA experiments showed that a non-realistic experiment duration would have
been required to achieve the high degrees of compaction or the low permeabilities
which would be representative for long-term compacted crushed salt in a repository.
For the assessment of the long-term effectiveness of borehole seals of crushed salt it is
therefore indispensable to rely on model calculations. The material models used in
these calculations are to be based on both, on in-situ data and on laboratory data
representing the lower range of porosity and permeability missed in situ.
In the in-situ experiments, in order not to disturb the compaction process by “foreign
bodies” in the backfill, instrumentation within the backfill was strongly restricted.
Therefore, backfill porosities mainly were determined from borehole closure
measurements by calculating the ratio between pore volume and total volume. In
addition, successful attempts were made to determine the porosity by inverse
modelling the gas-flow through the backfill. By these procedures, porosities were
derived that were averaged over the whole test intervals.
Regarding instrument performance, it can be stated that the greatest part of the
experimental equipment performed well throughout the duration of the in-situ
experiments. However, malfunction of some distance gauges and pressure gauges
was experienced. Instrument performance is discussed comprehensively in
Section 6.2.
6.2 Instrument Performance
The overall performance of the DEBORA experiments was satisfactory with regard to
their operating reliability. This can certainly be attributed to the preceding DEBORA
phase I in the years 1991 – 1995 in which a detailed test plan including predictive
95
calculations had been set up (Rothfuchs et al., 1996). Based on these pre-
investigations the measuring sensors were selected under consideration of the relevant
measuring ranges and under consideration of the environmental conditions partly
predicted by preceding model calculations.
The permeability measurements in the compacted crushed salt were, therefore,
excellently reproducible and provided in-situ data on the relationship between
permeability and porosity for the first time. This is important because this relationship is
being used in long-term safety analyses considering the radionuclide transport in salt
repositories.
Concerning the general applicability of the selected measuring sensors, it was found,
that problems may occur if the gauges are used under severe environmental conditions
as observed in DEBORA 1. Here, the underestimated corrosive atmosphere in the pore
space of the backfill as well as the high stresses in the crushed salt led to a failure of
some of the temperature/stress sensors and to a decrease of the signal quality of the
displacement gauges during the testing period. Especially the measuring membranes
of the stress sensors were damaged by the sharp edges of the salt grains pressed
against the membranes. In addition, laboratory calibrations of the stress sensors, which
were originally designed for measuring the pressure of fluids, showed that the sensor
readings are to be corrected by about a factor of 2 when being used in crushed salt.
The uncovering of the DEBORA-1 liner enabled post-test investigations on the
compacted crushed salt. These investigations revealed that the range of the
displacement gauges was not large enough to evaluate the finally achieved degree of
compaction at the end of the experiment.
The results of the post-test investigations confirmed that it is extremely valuable, if not
indispensable, to perform, as far as possible, a final quality check of the obtained
measuring data at the termination of an in-situ experiment, either by recalibration of the
used measuring equipment or by post-test analyses of the considered materials.
6.3 Modelling
In the THM modelling studies there were some difficulties in quantitatively simulating
the backfill compaction process and the overall experiment performance. Generally, in-
96
situ backfill compaction and pressure build-up was slower than predicted. Several
factors were identified that may have caused these problems:
One reason for the problems in quantitatively predicting backfill compaction rates was
the 3D test set-up that was modelled with the existing two - dimensional computer
codes that had to be used because of the extreme computer time required for three -
dimensional thermomechanical calculations. The models used were models of
rotational symmetry and for the borehole geometry they represented quasi 3D models.
However, the 60 m long drift above the boreholes is being modelled as a mushroom-
shaped round opening with a diameter of about 5 m. This limited extension of the room
in the model might cause a certain overestimation of stresses and hence of
deformation especially in the early phase of the heating period.
Measurement accuracy and reliability may be a factor for problems associated with
comparisons of in-situ measurement results and calculations. During the execution of
the in-situ experiments most of the measurement values were obtained remotely, and
drifting of the readings could neither be measured nor excluded. From these direct
measurements, other values related to, for example, backfill porosity and the
volumetric backfill compaction process were derived. Therefore, the question needs to
be answered of how reliable the measured values are. In DEBORA 1 an attempt was
made to determine the backfill porosity by a second procedure in which the porosity
was calculated from the results of gas-flow tests. The porosity determined by this
procedure was slightly lower than the porosity calculated from the measurements of the
annulus width. Post-test measurements of the compacted backfill and sensor
calibration revealed a higher accuracy of the flow-test procedure. This finding
underlines the need to perform post-test investigations aimed at re-evaluating the
experiment and assessing the measurement accuracy (see above).
Regardless of these findings, the data obtained constitute a firm basis for
extrapolations in space and time and for assessments of the repository performance,
provided the relevant parameter values are used.
Inverse modelling of the gas flow tests was very sensitive to violations of the idealizing
assumptions for the numerical model. But, it proved to be a valuable addition to the
geometric method which uses displacement measurements. Discrepancies between
the results of the geometric method and inverse modelling were observed which gave
reason for further investigations. With respect to the final porosity achieved in
97
DEBORA 1, the differences were explained by the results of the post-test
investigations. The porosity value coming from the inverse modelling was thereby
confirmed.
Predictive two-phase flow calculations for repositories in rock salt are different from
modelling conventional soil systems mainly due to the hydrologic parameters of the
porous media involved. The salt grit is typically rather tight and shows relatively high
capillary pressures. The contrast of the material properties between different sections
in the repository - like borehole seal and gallery – can easily exceed the differences
between layers of natural soil formations. The results are therefore sensitive to almost
all relevant model parameters: the material parameters especially the equations of
state, the model geometry and the initial and boundary conditions for the considered
scenarios. This implies that it is very important to know the uncertainties of the
quantities mentioned above, too. Due to the strong non-linearity of the differential
equations it is not possible to anticipate the sensitivity of a two-phase flow system to
changes of the input parameters. Additional parameter variations are therefore
necessary for a reliable interpretation of predictive model calculations.
98
7 Comparison of Objectives and Results
7.1 Operational Objectives
From an operational point of view, the overall objectives of the project had been
separated in three work packages. In work package 1, “In-situ investigations”, the tasks
were to study the backfill performance in borehole seals and in the borehole annulus.
Work package 2, “Laboratory Investigations”, comprised tasks addressing backfill
compaction and permeability. In work package 3, “Modelling”, codes and material
models for computing the thermomechanical and hydraulical behaviour of crushed salt
being used as backfill in disposal boreholes including heat sources and of the
surrounding rock mass were tested and improved. As will be shown in this section, the
operational objectives were achieved, and as described in Chapters 2 to 5, the tasks
were carried out in accordance with planning:
The two in-situ experiments DEBORA 1 and 2 were completed within the contract
period. The experiment DEBORA 1 was carried out from 17 February 1997 to
13 March 1998 and DEBORA 2 from 22 September 1997 to 4 December 1998. Heating
in both experiments was terminated when almost stable conditions had been reached
and the measurements showed only very minor alterations.
In the laboratory investigations, important parameters in material models for crushed
salt were quantified using two triaxial test devices. Additional test were carried out to
measure the development of permeability in dependence of backfill compaction.
In the THM modelling studies, the thermomechanical codes SUPERMAUS, ANSYS
and MUFTE were evaluated as to their capability to simulate the behaviour of backfill
and host rock under repository conditions. Additionally, the codes were employed to
support the experiments’ design and to support the interpretation of in-situ
measurements. By numerical simulations of the in-situ experiments using the material
parameter values determined in the laboratory and by comparing the calculation results
with measurements the applied models were continuously improved.
99
7.2 Scientific Objectives and Knowledge Gained
The main objective of phase II of the DEBORA-project was to provide the necessary
experimental data and experiences needed for the valuation and confirmation of the
used models.
To achieve these objectives, in-situ experiments with accompanying laboratory
investigations were carried out that were aimed at evaluating the impact of heat and
stress on backfill behaviour, at quantifying important parameters describing the
processes, and at characterizing and modelling the thermomechanical processes in
and around disposal boreholes. So it was possible to significantly improve the
understanding of the processes in backfilled emplacement cavities and to increase the
capability to simulate these processes numerically.
In addition, measurements were conducted in the in-situ experiments on gas transport
in backfilled boreholes. In the DEBORA experiments, for the first time permeability
measurements in crushed salt backfill were performed under in-situ conditions. The
results obtained show that the permeability decreases by two to three orders of
magnitude when the porosity decreases from e.g. 35 % to 9 % (see Sections 2.1.3 and
2.2.3). The permeability values obtained were successfully fitted to the relationship
between permeability and porosity achieved from a synthesis of data of several other
investigators.
The majority of the permeability measurements was performed in laboratory tests. The
lowest porosity was 1.24 % (Section 3.2.3). These measurements served to complete
the existing data base and to generate a relationship which could be fitted to a
significant number of results from tests carried out under a wide range of temperatures
and pressures. In a double-logarithmic diagram (Figure 2-28), the relationship between
permeability and porosity could be fitted to a straight line. The following general
relationship between permeability k and porosity φ was derived:
k = 1.9⋅10-8 φ5.27 m2
100
In addition, it was realized that at the lowest porosities achieved the permeability still is
several orders of magnitude higher than that of compact rock salt. Therefore it is to be
assumed that the final transition to rock salt takes place by solution-precipitation
processes, or by long-term creep of the grains, or that extremely high pressures are
required.
In addition to the experimental investigations, model calculations were performed within
the framework of the project in order to analyze brine intrusion and two-phase flow of
brine and gas in sealed HLW disposal boreholes. The calculations were done with the
help of the two-phase flow code MUFTE (Helmig et al., 1994). The analyses show that
complex displacement processes of the fluid phases are to be expected in the
boreholes. These processes cannot be captured sufficiently by single-phase flow
models. Consideration of realistic big jumps and high values of the primary and
secondary two-phase flow variables lead to demanding conditions for the numerical
simulator. The results are therefore sensitive to almost all parameters. Actual
predictions need therefore a profound understanding of the material laws of
compacting crushed salt and a precise description of the repository layout.
101
8 Concluding Remarks and Recommendations
8.1 Project Performance
In the investigations carried out in the DEBORA project, the most important issues
were to determine how heat from the emplaced wastes will affect the rock surrounding
the repository, how backfilled boreholes in a repository will be closed, and how the
porosity / permeability of the backfill material is reduced under the effect of heat and
rock stress. These are issues that are closely related to the most relevant parameters
in assessments of radionuclide release from a repository in rock salt (Storck, 1993).
The scientific results are described in detail in the relevant Chapters 2 to 4. A brief
summary of the knowledge gained is given in Chapter 7. This section discusses the
conclusions and recommendations derived from the execution of the project, and an
attempt is made to demonstrate the benefits of executing a project integrating in-situ
experiments, laboratory studies, and modelling studies.
In the in-situ experiments the complex processes and the interactions between heating,
room closure, and backfill compaction were studied, whereas in the laboratory tests
single parameter values were determined that could not be measured exactly in situ.
Moreover, in laboratory tests the measuring ranges could be extended to values which
were not achievable in situ, for example, to very low porosities. These values were
required to develop material models that are valid over a wide range. On the other
hand, the laboratory generated values could be verified by evaluating in-situ
measurements.
8.2 Recommendations for Future Work
A few items were found, related both to the experimental and the modelling studies,
that require further research because they may have been the reasons for deviations
between calculation results and measurements. They are discussed in Chapter 6
“Problems Encountered and Lessons Learned”. In a strongly compressed version
these limitations to the outcome of the project can be summarized as follows:
• achieved backfill porosities did not match long-term repository conditions,
102
• two-dimensional THM codes are not sufficient to simulate three-dimensional
experiment behaviour,
• instrumentation accuracy and reliability could not be checked in situ,
The recommendations derived from these items are discussed below.
The lowest porosities achieved in the in-situ experiments were considerably higher
than the porosities expected in a repository. In view of the duration of the in-situ
experiments performed in the DEBORA project and the fact that the porosity at the end
of the experiments decreased very slowly, it is evident that residual porosities of about
1 % cannot be achieved in in-situ experiments in rock salt. To gain better
understanding of the final stages of backfill compaction, laboratory tests should be
performed in which backfill material samples taken from the experimental boreholes
and drifts are compacted further. In these tests it would be advantageous to use drill
cores or cutted samples from the preconsolidated backfill. Since, as shown in the
laboratory tests (Chapter 3), very high pressures and/or temperatures are required to
reach residual porosities, concurrently to the tests in an iterative process mathematical
models should be used to extrapolate forward the test results to the final compaction
stages.
Even at the lowest backfill porosities of about 1 % achieved in the laboratory tests, the
permeability was still several orders of magnitude higher than that of intact rock salt. In
order to study the transition from granulated material to intact salt, additional tests are
required in which processes like chemical interactions in the presence of humidity and
long-term creep of salt graines should be studied in detail. Since it is considered
unfeasible to reach backfill compactions similar to that of rock salt at realistic
compression pressures and using dry crushed salt, the transition presumably has to be
investigated under moisted conditions. The tests should be supported by numerical
simulations in which the consecutive steps in the consolidation process are predicted.
Most of the instruments performed well in the experiments. However, some failures
occurred and some measurement results were difficult to interpret. To guarantee high
measurement reliability, it is important already in the conceptual-design phase of an
experiment to define and to rank the most important parameters to be investigated and
to design the monitoring system accordingly. In the design not only the feasibility of
redundancy, diversity, and symmetry should be taken into account, but also the
103
intrinsic maximum accuracy of the measurement system. In the experiment design
concept also the effects of limited experiment dimensions, i.e., three - dimensional
behaviour and boundary effects should be taken into account. Since during the
experiment execution a drifting of the instruments’ reading cannot be excluded, the
measurement stability should be assessed by re-calibrating the instruments in-line, that
is during the experiment execution, or after terminating the experiment.
Several tasks mentioned previously could only be accomplished by post test analyses
which consisted of entering the experimental areas and dismantling the test set-up. In
this programme, samples were taken from the backfill and instruments were retrieved
for re-calibration. Additional components of a dismantling and validation programme
were laboratory tests on the recovered backfill material. The post test analyses were
found to be extremely useful since they helped to solve questions raised by deviating
measuring and calculation results. In future in-situ experiments, a post-test analysis
programme should therefore always be considered as a central component, already in
the planning phase.
Numerical simulations of two-phase flow of gas and brine in backfilled HLW disposal
boreholes suffered of missing parameter functions for relative permeability and
capillary pressure of crushed salt. As a first attempt, existing data for common soil were
used to perform an analysis of the considered processes and to conclude on their
significance. In order to confirm the obtained results on dynamics and consequences of
brine intrusion into an HLW repository, laboratory determination of the respective two-
phase flow parameters is indispensable.
104
References
Albrecht, H., Hunsche, U., (1980): “Gebirgsmechanische Aspekte bei der Endlagerung
radioaktiver Abfälle in Salzdiapiren unter besonderer Berücksichtigung des
Fließverhaltens von Steinsalz”, Fortschr. Miner., 58(2): 212-247, Stuttgart.
Barnert, E., Brücher, H., Kroth, K., (1994): "Abschlußbericht zum Forschungsvorhaben
"MAW- und HTR-BE-Versuchseinlagerung in Bohrlöchern - Teilprojekt Einlagerungs-
und Bohrlochverschlußtechnik", KFA-Forschungszentrum Jülich GmbH, Jülich.
Bechthold, W., Rothfuchs, T., Poley, A., Ghoreychi, M., Heusermann, S., Gens, A.,
Olivella, S., (1999): “Backfilling and Sealing of Underground Repositories for
Radioactive Waste in Salt (BAMBUS Project)”, EUR 19124 EN, CEC, Luxembourg
Breidenich, G., (1993): "Gekoppelte Berechnung der thermomechanischen Feldgrößen
in einer Steinsalzformation infolge der Einlagerung radioaktiver wärmefreisetzender
Abfälle", doctoral thesis, RWTH Aachen.
Cinar, Y., Müler, W., Pusch, G., Reitenbach, V., (1998): "Gas Migration in Salt, Part II:
Experimental Work". In European Commission Report: Projects on the Effect of Gas in
Underground Storage Facilities for Radioactive Waste (Pegasus Project), Proceedings
of a progress meeting in Naantali, Finland, DOC XII/276/98-EN.
Duddeck, H., Guericke, B., (1995): "Der Einfluß des interaktiven Verhaltens von
Gebirge und Deponat auf die geotechnische Standsicherheitsbeurteilung unterirdischer
Entsorgungsanlagen", Proceedings of "Untertätige Entsorgung - Zweites
Projektstatusgespräch des PTE zu BMBF-geförderten FuE-Vorhaben zur untertägigen
Entsorgung chemisch-toxischer Abfälle am 5. und 6. Oktober 1995 in der Technischen
Universität Freiberg", Forschungszentrum Karlsruhe GmbH, Karlsruhe.
Hein, H. J., (1991): "Ein Stoffgesetz zur Beschreibung des thermomechanischen
Verhaltens von Salzgranulat", doctoral thesis RWTH Aachen.
105
Helmig, R., Braun, C., Emmert, M., (1994): "MUFTE - A numerical model for simulation
of multiphase flow processes in porous and fractured-porous media",
Programmdokumentation (HG 208). Technical Report 94/3, Institut für Wasserbau,
Universität Stuttgart.
Hunsche, U., (1984): “Results and Interpretation of Creep Experiments in Rock Salt”.
In: The Mechanical Behaviour of Salt, Proc. of the First Conf. Univ. Park (USA), Eds.:
Hardy, H. R. Jr. & Langer, M., Trans Tech Publications, Clausthal, 159-167.
Jockwer, N., Rothfuchs, T., (1995): “Investigations and modelling of fluid release from
rock salt at elevated temperature”, Proc. Workshop Testing and Modelling od Thermal,
Mechanical and Hydrogeological Properties of Host Rocks for Deep Geological
Disposal of Radioactive Waste, EUR 16219 EN, CEC, Brussels
Karman, P.C., (1956): “Flow of Gases through Porous Media”, Butterworths Scientific
Publications, London.
Kröhn, K.-P., Fein, E., (1999): "Einfluß von Meßtoleranzen auf den Gesamtfehler bei
der Bestimmung von Permeabilität und Porosität am Beispiel des DEBORA-
Experiments 1", GRS-Bericht, (in Vorbereitung).
Leibholz, H., (1968): "Einführung in die Elastizitätstheorie", Reihe Wissenschaft und
Technik, Verlag G. Braun, Karlsruhe.
Müller-Lyda, I., Birthler, H., Fein, E., (1999): "Ableitung von Permeabilitäts-
Porositätsrelationen für Salzgrus", Gesellschaft für Anlagen- und Reaktorsicherheit
(GRS) mbH, GRS-148, Köln
PSE: Projekt Sicherheitsstudien Entsorgung (PSE), (1985): "Entwicklung eines
sicherheitsanalytischen Instrumentariums für das geologische Endlager für radioaktive
Abfälle in einem Salzstock", zusammenfassender Abschlußbericht, Hahn Meitner
Institut für Kernforschung, Berlin.
Rieckmann, M., (1970): "Untersuchungen von Turbulenzerscheinungen beim Fließen
von Gasen durch Speichergesteine unter Berücksichtigung der Gleitströmung", Erdöl-
Erdgas-Zeitschrift, Bd. 86, Heft 2.
106
Rothfuchs, T., Prij, J., Kröhn, K.-P., van den Horn, B.A., Wieczorek, K., (1996): "The
DEBORA-Project Phase 1: Development of Borehole Seals for High-Level Radioactive
Waste Repositories in Salt Formations", Final Report, EUR 16928 EN, CEC, Brussels.
Smailos, E., Schwarzkopf, W., Kienzler, B., Köster, R., (1992): "Corrosion of Carbon-
Steel Containers for Heat-Generating Nuclear Waste in Brine Environments Relevant
for a Rock-Salt Repository", Mat. Res. Soc. Symp. Vol. 257.
Spiers, C. J., Bzesowsky, R.H., (1993): "Densification Behaviour of Wet Granulat Salt:
Theory versus Experiment", Universität Utrecht.
Storck, R., (1993): “Langzeitsicherheitsnachweise unter Berücksichtigung von
Unsicherheiten”, Atomwirtschaft, 38, 285.
Swanson Analysis Systems, (1992): "ANSYS User's Manual, Houston".
Wallner, M., Caninenberg, C., Gonther, H., (1979): “Ermittlung zeit- und
temperaturabhängiger mechanischer Kennwerte von Steinsalz”, Proc. 4th Int. Congress
Rock Mechanic, Vol 1, Montreux, 313.
Wieczorek, K., Zimmer, U., (1998): "Untersuchungen zur Auflockerungszone um
Hohlräume im Steinsalzgebirge", Abschlußbericht, Gesellschaft für Anlagen- und
Reaktorsicherheit (GRS) mbH, GRS-A-2651, Köln
Zhang, C., Schmidt, M. W., Staupendahl, G., Heemann, U., (1993): "Entwicklung eines
Stoffansatzes zur Beschreibung des Kompaktionsverhaltens von Salzgrus", Bericht Nr.
93-73 des Instituts für Statik der Technischen Universität Braunschweig, gemeinsame
Veröffentlichung mit dem GSF-Institut für Tieflagerung Braunschweig.
107
List of Figures
Figure 1-1 View into the former HLW test field at the 800-meter level of the Asse mine. The DEBORA-2 test site is located in the foreground. ......... 4
Figure 2-1 Layout of the experiment DEBORA 1 for the investigation of crushed salt compaction in the annulus between waste canisters and borehole wall. .......................................................................................... 7
Figure 2-2 Pressure and temperature sensor. .......................................................... 9
Figure 2-3 Displacement gauge.............................................................................. 10
Figure 2-4 DEBORA 1; gas measuring station. ...................................................... 11
Figure 2-5 DEBORA 1; borehole liner equipped with instruments.......................... 12
Figure 2-6 Development of backfill temperature in DEBORA 1. ............................. 14
Figure 2-7 Development of radial stress in the backfill of DEBORA 1. ................... 14
Figure 2-8 Calibration results of a reference pressure transducer.......................... 15
Figure 2-9 Development of the annulus width in DEBORA 1. ................................ 16
Figure 2-10 Development of the displacement rates in DEBORA 1. ........................ 16
Figure 2-11 Development of backfill porosity in DEBORA 1..................................... 17
Figure 2-12 Sawing of samples from the compacted crushed salt sticking at the uncovered DEBORA-1 liner................................................................... 18
Figure 2-13 Uncovered DEBORA-1 liner. ................................................................. 18
Figure 2-14 Final porosity and permeability distribution along the test interval determined by post-test investigations. ................................................. 19
Figure 2-15 Development of backfill permeability in DEBORA 1. ............................. 21
Figure 2-16 Relationship between permeability and porosity in DEBORA 1. ........... 21
Figure 2-17 Layout of the experiment DEBORA 2 for the investigation of crushed salt compaction in borehole seals............................................ 22
Figure 2-18 Development of backfill temperature in DEBORA 2. ............................. 25
Figure 2-19 Development of radial stress in the backfill of DEBORA 2. ................... 25
Figure 2-20 Development of axial stress in the backfill of DEBORA 2. .................... 27
Figure 2-21 Development of borehole radius in DEBORA 2..................................... 27
Figure 2-22 Development of backfill porosity in DEBORA 2..................................... 28
Figure 2-23 Development of displacement rates in DEBORA 2. .............................. 28
Figure 2-24 Development of backfill permeability in DEBORA 2. ............................. 29
Figure 2-25 Relationship between permeability and porosity in DEBORA 2. ........... 29
Figure 2-26 Specimen sampling at DEBORA-2 test site. ......................................... 30
Figure 2-27 Distribution of porosity and permeability in the DEBORA-2 backfill material at termination of the heating period. ........................................ 31
Figure 2-28 Relationship between permeability and porosity obtained from all in-situ and laboratory data of the DEBORA project. .............................. 33
108
Figure 3-1 Characteristic screening curve for the fine-grained Asse crushed salt employed for the compaction tests. ................................................ 36
Figure 3-2 Amsler uniaxial test machine with installed oedometer between the upper and the lower platen. ............................................................. 37
Figure 3-3 Characteristic screening curve of the coarse crushed salt employed for the compaction tests.............................................................................. 39
Figure 3-4 MTS triaxial test machine with inserted jacketed cylindrical crushed salt sample, the vessel is uplifted. In the mid-height of the sample a device for diameter measuring is shown. ........................................... 40
Figure 3-5 p, q-values indicating the transition from the elastic to the plastic irreversible material behaviour of coarse-grained salt samples. ........... 42
Figure 3-6 Parameter h2 as a function of the material parameter h1. The functional relationship was obtained from least-squares regression. .... 44
Figure 3-7 d as a function of the porosity φ. The functional relationship was obtained from least-squares regression. ............................................... 44
Figure 3-8 Dependence of the permeability on the porosity of the Asse crushed salt samples with maximum grain size of 8 mm compacted at ambient temperature. ............................................................................ 50
Figure 3-9 Porosity as a function of the differential pressure for various confining stresses in the samples prepared at ambient temperature. .. 53
Figure 3-10 Dependence of the permeability on the porosity of the Asse crushed salt samples with maximum grain size of 30 mm compacted at ambient temperature....................................................... 53
Figure 3-11 Comparison of the relationships between permeability k and porosity φ for fine and coarse grained crushed Asse salt ...................... 57
Figure 4-1 Schematic representation of the finite element mesh used for calculations of DEBORA 1 and DEBORA 2. ......................................... 59
Figure 4-2 Temperature development on the DEBORA-1 liner at different depths...................................................................................... 62
Figure 4-3 Development of the annulus width between liner and borehole wall - DEBORA 1. ................................................................................. 62
Figure 4-4 Porosity development in the backfilled annulus - DEBORA 1. .............. 63
Figure 4-5 Development of radial stress in the backfilled annulus - DEBORA 1. ......................................................................................... 63
Figure 4-6 Temperature development in the backfill at three different depths - DEBORA 2. ......................................................................................... 64
Figure 4-7 Closure of the backfilled borehole - DEBORA 2.................................... 64
Figure 4-8 Porosity development in the backfilled borehole - DEBORA 2.............. 65
Figure 4-9 Development of radial stress in the backfill - DEBORA 2...................... 65
Figure 4-10 Temperature development on the DEBORA-1 liner; measurement and calculation................................................................ 67
Figure 4-11 Development of the annulus width between liner and borehole wall of DEBORA 1; measurement and calculation. ............................... 67
109
Figure 4-12 Porosity development in the backfilled annulus of DEBORA 1; measurement and calculation................................................................ 68
Figure 4-13 Development of radial stress in the backfill of DEBORA 1; measurement and calculation................................................................ 69
Figure 4-14 Temperature development in the backfilled borehole of DEBORA 2; measurement and calculation................................................................ 69
Figure 4-15 Closure of the backfilled borehole DEBORA 2; measurement and calculation.............................................................................................. 70
Figure 4-16 Porosity development in the backfilled borehole DEBORA 2; measurement and calculation................................................................ 70
Figure 4-17 Development of radial stress in the backfill of DEBORA 2; measurement and calculation................................................................ 71
Figure 4-18 Temperature development on the DEBORA-1 liner; measurement and calculation using Zhang's constitutive model for crushed salt. ....... 74
Figure 4-19 Development of the annulus width between liner and borehole wall of DEBORA-1; measurement and calculation using Zhang's constitutive model for crushed salt. ....................................................... 75
Figure 4-20 Porosity development in the annulus of DEBORA-1; measurement and calculation using Zhang's constitutive model for crushed salt. ....... 75
Figure 4-21 Development of radial stress in the backfill of DEBORA-1; measurement and calculation using Zhang's constitutive model for crushed salt. .......................................................................................... 76
Figure 4-22 Characteristic mass flux and gas pressure curves for test variant A..... 78
Figure 4-23 Relative error of the porosity using the inverse flow test modelling method (rhombus) and using displacement transducer measurements (plus)............................................................................. 82
Figure 4-24 Theoretically derived error range for permeability and porosity for monthly measurements using a pressure difference of 0.1 MPa; - displacement measurements: light areas; - flow tests: dark areas........ 83
Figure 5-1 Sketch of the disposal borehole and connected drift............................. 87
Figure 5-2 Time dependent brine saturation distribution for scenario 1.................. 89
Figure 5-3 Time dependent gas pressure saturation distribution for scenario 1..... 89
Figure 5-4 Time dependent brine saturation distribution for scenario 2.................. 91
Figure 5-5 Time dependent gas pressure saturation distribution for scenario 2..... 91
Figure 5-6 Time dependent brine saturation distribution for scenario 3.................. 93
Figure 5-7 Time dependent gas pressure saturation distribution for scenario 3..... 93
110
111
List of Tables
Table 3-1 Summary of results from the sieve analysis of the fine-grained crushed salt. .......................................................................................... 36
Table 3-2 Summary of results from sieve analysis of the coarse-crushed salt...... 39
Table 3-3 Numerical values of parameters h1, h2 and d for describing the flow condition in accordance with the flow condition equation for fine- grained crushed salt. The p,q-values were obtained from confined compression tests using a tan ϕ of 1.3.................................................. 42
Table 3-4 Determination of material parameters from short-term compaction tests on crushed salt at ambient temperature. The parameters were determined on the basis of natural (logarithmic) volume strain. ............ 45
Table 3-5 Summary of the porosities for the test specimens prepared. ................ 48
Table 3-6 Summary of results from the compaction tests on Asse fine-grained crushed salt; grain density: ρg = 2195 kg/m3. ........................................ 51
Table 4-1 Thermal properties of rock salt and crushed salt used for SUPERMAUS modelling. ...................................................................... 60
Table 4-2 Mechanical properties of rock salt and crushed salt used for SUPERMAUS modelling. ...................................................................... 60
Table 4-3 Short description of the main characteristics of the three flow test variants. ................................................................................................. 78
Table 4-4 Differences of test parameters between model predictions and measurements for the experiment DEBORA 1...................................... 80
Table 5-1 Material data, geometry, and initial and boundary conditions for the two-phase flow models. ................................................................... 88

Gesellschaft für Anlagen- und Reaktorsicherheit (GRS) mbH
Schwertnergasse 150667 Köln
Telefon +49 221 2068-0Telefax +49 221 2068-888
Forschungsinstitute85748 Garching b.München
Telefon +49 89 32004-0Telefax +49 89 32004-300
Kurfürstendamm 200 10719 Berlin
Telefon +49 30 88589-0Telefax +49 30 88589-111
Theodor-Heuss-Straße 438122 Braunschweig
Telefon +49 531 8012-0Telefax +49 531 8012-200
www.grs.de
ISBN 3-931995-26-7


