Page 1
Aus der Landessaatzuchtanstalt
der Universität Hohenheim
apl. Prof. Dr. Thomas Miedaner
Quantitative-trait loci (QTL) mapping of
important agronomical traits of the grain and
biomass production in winter rye
(Secale cereale L.)
Dissertation
zur Erlangung des Grades eines Doktors
der Agrarwissenschaften
vorgelegt
der Fakultät Agrarwissenschaften
von
Diplom-Agrarbiologe
Stefan Haffke
aus
Salzgitter-Lebenstedt
Stuttgart‐Hohenheim
2015
Page 2
2
Die vorliegende Arbeit wurde am 14. April 2015 von der Fakultät Agrarwissenschaften
der Universität Hohenheim als „Dissertation zur Erlangung des Grades eines Doktors
der Agrarwissenschaften“ angenommen.
Tag der mündlichen Prüfung 12. Juni 2015
1. Prodekan Prof. Dr. M. Rodehutscord
Berichterstatter 1. Prüfer apl. Prof. Dr. T. Miedaner
Mitberichterstatterin, 2. Prüferin apl. Prof. Dr. B. Haussmann
3. Prüfer Prof. Dr. F. Asch
Page 3
Table of contents
3
Table of contents
Abbreviations ....................................................................................................................... 5
1. General introduction ................................................................................................... 6
1.1. Rye as a renewable energy source .............................................................................. 6
1.2. Drought tolerance and yield stability ......................................................................... 7
1.3. Quantitative trait loci mapping in rye ......................................................................10
2. Publication I: Analysis of covariation of grain yield and dry matter yield for
breeding dual use hybrid rye .....................................................................................12
3. Publication II: Quantitative-trait loci (QTL) analyses for selection of dual use
hybrid rye ...................................................................................................................14
3.1. Introduction ...............................................................................................................14
3.2. Material and methods ................................................................................................15
3.2.1.Plant material ............................................................................................................15
3.2.2.Field experiments ......................................................................................................15
3.2.3.Statistical analysis .....................................................................................................16
3.2.4.Genetic linkage map construction .............................................................................17
3.2.5.QTL analyses .............................................................................................................17
3.3. Results ........................................................................................................................18
3.4. Discussion ..................................................................................................................21
3.4.1. QTL for agronomic traits ...........................................................................................22
3.4.2. Grain yield QTL with high effect ..............................................................................24
3.4.3. Plant height and heading time are components of biomass yield ............................25
3.4.4. Conclusions for breeding dual use hybrid rye ...........................................................26
3.5. Supplementary tables ................................................................................................28
4. Publication III: Yield stability of hybrid rye under normal and managed drought
stress conditions towards selection of broadly adapted germplasm .........................31
5. General discussion .....................................................................................................33
5.1. QTL analysis on grain and biomass yield .................................................................34
5.2. Improving yield stability and drought tolerance in hybrid rye ................................37
5.3. Conclusions for hybrid rye breeding ..........................................................................42
6. Summary ....................................................................................................................46
7. Zusammenfassung .....................................................................................................48
8. References ..................................................................................................................50
Page 4
Table of contents
4
9. Danksagung ...............................................................................................................65
10. Curriculum vitae ........................................................................................................67
11. Erklärung ...................................................................................................................69
Page 5
Abbreviations
5
Abbreviations
ANOVA analysis of variance
BBCH decimal code of phenological growth stages, which is divided into
principal and secondary growth stages based on the cereal code
developed by Zadoks et al. (1974); the abbreviation BBCH derives
from Biologische Bundesanstalt, Bundessortenamt and Chemical
industry (Meier 2001)
cM centimorgan
CMS cytoplasmic male sterile
CV cross validation
DA discrimination ability
DArT Diversity Arrays Technology
DMY dry matter yield
EG early growth
GBS genotyping by sequencing
G x E genotype by environment interaction
G x I genotype by irrigation interaction
G x I x E genotype by irrigation by environment interaction
GS genomic selection
GY grain yield
H201 parent 1 of Pop-D
H202 parent 2 of Pop-D
HT heading time
LOD limit of detection
LSD least significant difference
MAS marker assisted selection
MET multi-environment trial
NIL near isogenic lines
PA prediction ability
PH plant height
PH 1 plant height measured in EC 32
PH 2 plant height measured in EC51-55
PH 3 plant height measured before harvest
Pop-A population developed by KWS CEREALS GmbH, intrapool
Pop-B population developed by KWS CEREALS GmbH, intrapool
Pop-C population developed by KWS CEREALS GmbH, interpool
Pop-D population developed by HYBRO Saatzucht GmbH, interpool
QTL quantitative trait loci
R² phenotypic variance explained by detected QTL
RFLP restriction fragment length polymorphism
SNP single nucleotide polymorphisms
SPM spikes per square meter
SSR simple sequence repeats
TGW thousand-grain weight
Page 6
General introduction
6
1. General introduction
Rye (Secale cereale L.) is an important crop in Central and Eastern Europe
and mainly grown in temperate regions, such as Germany, Russia, Belarus,
Ukraine, and Poland with approximately 5.4 million hectares worldwide in 2012
(“FAO,” 2014). The highest production quantity was obtained in 2012 in Germany
and Poland with 3.9 and 2.87 million tones, respectively. The largest area
designated to rye was 1.4 million hectares in 2012 in the Russian Federation.
(“FAO,” 2014). Rye is primarily cultivated as a winter cereal in regions with
sandy and marginal soils. In comparison to other crops rye has a relatively highly
tolerance to biotic and abiotic stress factors, which mainly occur on light soils
(“ECOPORT Database, Secale cereale,” 2002; Hoffmann, 2008). Two heterotic
groups (Petkus and Carsten pool) and an effective system of cytoplasmatic male
sterility (CMS) with high pollen fertilization offers effective hybrid breeding
(Geiger and Miedaner, 1999). Today more than 70% are hybrid varieties in
Germany, which are used for food and feed and, more recently, became important
for biogas production (Geiger and Miedaner, 2009). These variations in utilization
demand different requirements for breeding goals. Besides increasing grain yield
(GY) for food-related products, traits such as baking quality, sprouting
resistance, thousand-grain weight (TGW), and composition of grain ingredients
are important. For feed a high protein content is preferred, while pentosan
content should be low (Boros, 2007). For biogas production high dry matter yield
(DMY) with a high methane yield per hectare is important (Amon et al., 2007;
Hübner et al., 2011).
1.1. Rye as a renewable energy source
The importance of renewable bioenergy resources will increase in the future. Due
to climate change and finite fossil resources, the use of plants, plant products and
plant waste for energy production will play an important role. Thus, the EU is
projected to generate one-third of their energy from sustainable and regional
biomass sources (European Commission, 2008).
Maize (Zea mays L.) is the most important energy crop in Germany with making
up to 79% of the total biomass and 0.8 million hectares in 2013 (Weiland, 2006;
Page 7
General introduction
7
“Deutsches Maiskomitee e.V. (DMK),” 2014). With the use of other crops, such as
sugar beet, triticale and rye, for bioenergy production new opportunities have
arisen. Moreover, it is favorable to use a wide range of different energy crops for
regions where crop rotation is utilized, maize monocultures are not economic and
two harvests annually could increase the total biomass yield per hectare (Hübner
et al., 2011). Even though rye will never reach the yield potential of maize if both
crops are grown under normal or good soil and climate conditions (Oslaj et al.,
2010; Hübner et al., 2011), in regions where it is not economic to grow maize for
bioenergy production rye is an alternative. In this case rye would also not conflict
with the production of food related agriculture crops. Furthermore, the use of
winter hybrid rye varieties provides the opportunity to increase total biomass
yield per year and decrease the erosion of soils and nutrient loss compared to
maize cultivation in the summer only.
Successful production of biogas is dependent on the methane yield per hectare
(Amon et al., 2007). Harvest at late milk ripening results in the highest DMY and
methane yield combined with low lignin content. Consequently, breeding goals
for high DMY are important for the effective use of rye for biogas production
(Hübner et al., 2011). Rye has a wide range of genetic variation for biomass yield
(Miedaner et al., 2010, 2012b), but little is known in modern breeding programs
about an effective way to improve biomass yield for the use of biogas.
1.2. Drought tolerance and yield stability
Climate change has a worldwide effect on the agricultural production systems
and an influence on cultivated crops (Ceccarelli et al., 2007). Despite climate
change being controversial and different studies not being able to accurately
predict the local climate condition in future, the effects of extreme weather events
on cereal crop production have increased during the last decade and Europe has
been effected more often by regional heatwaves and rainfall deficit, which has
caused yield reduction (Ciais et al., 2005). The average winter conditions are
predicted to get wetter while summer terms are predicted to get dryer and hotter
(DWD, 2014). Particularly dry spring seasons have a strong negative influence on
crop development and yield. This effect is even stronger on light and sandy soils
Page 8
General introduction
8
as predominant in Lower Saxony and East Germany, where rye is predominantly
cultivated (Hoffmann, 2008). Dry spring and summer seasons do not regularly
occur but in the last two decades they have become more prevalent. In 1996,
2007, 2009, 2010 and 2011 and 2014 April was among the driest months within
the last two decades, compared to the long term average (DWD, 2014). In general
an ideal drought tolerant genotype should give high yields under stress as well as
high response under optimum growing conditions (Keim and Kronstad, 1981;
Rajaram et al., 1996). Improving drought tolerance in crops is difficult for the
following reasons (Richards, 1996): Drought-resistance mechanisms have been
more related to survival mechanisms under drought conditions than to
productivity. They are inappropriate to the “normal” target environment and are
temporal and, therefore, likely to have minimal impact on growth and yield over
the entire lifecycle. Hence, it is important to breed crop varieties that are high
yielding stable under non-stress conditions, whilst performing equally well under
drought conditions with little yield reduction. Yield stability is important for
breeders to adapt varieties to a large number of environments and to furthermore
alleviate climate effects, such as less rainfall or higher temperatures.
Yield stability concept can be determined as being dynamic or static (Becker and
Leon, 1988). Static concepts assume those genotypes as stable having the same
yield independent of environmental effects while dynamic concepts consider those
genotypes as stable, which perform close to the general response to the growing
conditions. For the selection of high GY, the dynamic concept is most beneficial
because genotypes are using optimal environmental resources. The most common
approach for examining yield stability is to further partition the genotype by
environment (G x E) interaction using an analysis of variance (ANOVA) into
linear trends (bi) and a deviation from linear regression (S²di) (Finlay and
Wilkinson, 1963; Eberhart and Russell, 1966; Becker and Leon, 1988).
Drought tolerance in plants is caused by many different physiological
mechanisms (Reynolds and Sawkins, 2005). Three important aspects of drought
tolerance are water uptake, water-use efficiency and harvest index (Passioura,
1997). Water uptake is most important for improving the yield potential in
drought prone environments, while stable harvest index is associated with higher
Page 9
General introduction
9
yield potential (Blum, 2009; Salekdeh et al., 2009). A further challenge for
genotype selection under heavy drought stress conditions is that many important
drought related traits generally have lower heritability. Especially those traits,
which respond positively under normal years, will be hindered, such as resistance
to diseases, tolerance to pre-harvest sprouting and other important objectives.
Therefore, an alternating selection in favourable and less favourable conditions
facilitates the selection of genotypes that combine both attributes, high yields
under stress (water input efficiency) and high yield responsiveness (water input
responsiveness) under improved growing conditions but may reduce selection
gain (Richards, 1996; Rizza et al., 2004; Kirigwi et al., 2007; Cattivelli et al.,
2008).
Much work has been done on several crops to improve drought tolerance and
implement genetic resources. Many studies were carried out to detect or improve
drought tolerance and implemented genetic resources in different important
crops. Several studies deal with wheat (Fischer and Maurer, 1978; Fischer and
Sanchez, 1979; Fischer and Wood, 1979; Hoffmann, 2008; Changhai et al., 2010;
Fleury et al., 2010; Golabadi et al., 2011), with maize (Bolanos and Edmeades,
1993a; b, 1996; Edmeades et al., 1999; Campos et al., 2004, 2006; Messmer et al.,
2009, 2011; Bunce, 2010), with rice (Maclean et al., 2002) and with barley
(Thomas et al., 1995; Rizza et al., 2004). The foci of these studies were the
semiarid and arid regions of the world, where drought is both regular and
intense.
There are different ways to test current breeding material using managed
drought stress trials. On the one hand, greenhouse trials or rain-out shelters
enable well managed drought stress trials, but are cost and labor intensive and
only a small sample of genotypes can be tested (Fay et al., 2000; Yahdjian and
Sala, 2002). On the other hand by trials with natural occurring drought stress
allow for screening high number of genotypes, but it is not assured that the stress
intensity is high enough and that it appears at each test site (Hübner et al.,
2013). Direct selection under drought conditions is complicated due to low
heritability, polygenic control, epistasis, and significant G x E interaction (Fleury
et al., 2010; Golabadi et al., 2011; Weber et al., 2012).
Page 10
General introduction
10
1.3. Quantitative trait loci mapping in rye
The implementation of genetic markers within the last two decades initiated new
strategies for plant breeding. Besides identification of heterotic groups and
characterization of plant genetic resources, the main focus was to detect
monogenic traits and quantitative trait loci (QTL). A lot of work has been done on
most major agricultural crops and beyond model organisms, such as Arabidopsis
thaliana. However, QTL studies in rye lag behind other major agriculture crops.
Some QTL studies based on different marker technologies exist. Börner et al.
(1999) published the first QTL study based on “Restriction fragment length
polymorphism” (RFLP) markers and detected QTL in a F2 mapping population
for different agronomic traits, such as plant height (PH), peduncle length, spike
length, and major dwarfing gene Ddw1. QTL for plant height were found on
chromosomes 2R and 5R (Börner et al., 1999, 2000). QTL for α-amylase activity
and connected quality traits have been reported (Masojć and Milczarski, 2005,
2008) and major QTL for TGW were found on chromosome 5R and 7R (Wricke,
2002). High-density maps were constructed after “Single Nucleotide
Polymorphisms” (SNP) and “Diversity Arrays Technology” (DArT) became
available. Up to now, however, only one genome wide QTL study was published
for important agronomic traits within the Petkus gene pool (Miedaner et al.,
2012a). QTL for all important traits were described for this intrapool population.
QTL for GY, TGW, test weight, falling number, protein, total and soluble
pentosan and starch contents were detected. Furthermore in related species, such
as triticale (× Triticosecale Wittmack) high affecting QTL were detected on
chromosome 5R explaining 42% of genotypic variance for PH and 36% for
biomass yield (Alheit et al., 2014), which may represent the dominant rye gene
Ddw1 (Korzun, 1996; Börner et al., 1999; Kalih et al., 2014).
Page 11
General introduction
11
Objectives of this study were to
1. Covariation of grain and biomass yield (Publication I)
1.1. Establish population parameters for experimental interpool hybrids
for grain and biomass yield use
1.2. Estimate genetic correlations between grain yield, biomass yield and
secondary traits
1.3. Test important agronomic traits for prediction of dry matter yield
2. QTL analysis (Publication II)
2.1. Map QTL for quantitatively inherited traits with a focus on grain
and biomass yield and correlated traits
2.2. Constitute the genetic architecture of plant height during growing
season
2.3. Detect common QTL for correlated traits
3. Yield stability (Publication III)
3.1. Investigate effects of managed-drought stress on grain yield and
heritability
3.2. Evaluate differences in yield stability parameters among three
populations with each of 218-220 testcrosses
3.3. Examine the potential of hybrid rye for combining high yield
potential with superior yield stability
Page 12
Publication I - Covariation of grain and biomass yield
12
2. Publication I: Analysis of covariation of grain yield and dry
matter yield for breeding dual use hybrid rye
S. Haffke,B. Kusterer, F. J. Fromme, S. Roux, B. Hackauf, T. Miedaner
S. Haffke and T. Miedaner, State Plant Breeding Institute, University of
Hohenheim,
70593 Stuttgart, Germany
B. Kusterer and F.J. Fromme, HYBRO Saatzucht GmbH & Co. KG, 17291,
Schenkenberg, Germany
S. Roux and B. Hackauf, Institute for Breeding Research on Agricultural Crops,
Julius
Kühn-Institut, Federal Research Centre for Cultivated Plants,Groß Lüsewitz,
18190, Sanitz, Germany
Bionenergy Research, 2013
DOI 10.1007/s12155-013-9383-7
The orginal publication is avaiable at
BioEnergy Research
March 2014, Volume 7, Issue 1, pp. 424-429
Page 13
Publication I - Covariation of grain and biomass yield
13
Abstract
Winter rye (Secale cereale L.) becomes more important as substrate for biogas
production. This leads to a focus on varieties high yielding in dry matter. In this
study, we analyzed the covariation between important agronomic traits for their
correlation to dry matter yield and calculated the direct and indirect selection
gain for increasing dry matter yield. We tested a set of 258 experimental hybrids
for dry matter yield, grain yield and further agronomic important traits at six to
eight environments (locations x year combination). We observed a wide range of
dry matter yield (10–24 Mg ha−1) and grain yield (6–15 Mg ha−1) among testcross
progenies. Genetic variances were significantly (P < 0.01) different from zero for
all traits. The indirect selection for high dry matter yield using second (EC 51-55)
and third (EC 73) plant height measurements was more effective than to using
grain yield. Direct selection for dry matter yield was comparable to the indirect
selection by the third plant height measurement. Consequently, plant height is a
good, non-destructive predictor of dry matter yield, whereas lodging resistance
should receive more attention.
Page 14
Publication II - QTL analysis
14
3. Publication II: Quantitative-trait loci (QTL) analyses for
selection of dual use hybrid rye
3.1. Introduction
Rye (Secale cereale L.) is an important cereal crop mainly grown in Central
and Eastern Europe. Traditionally, rye is used for baking and feeding, but it
became more important for biogas production in the last decade. As genotypic
differences for methane yield were negligible, DMY is the most important trait
(Hübner et al., 2011). In Germany, hybrid cultivars are most widely used and the
importance of hybrids in Austria and Poland is also increasing steadily. Hybrid
breeding is successful due to two heterotic groups (Petkus and Carstens pool) and
the effective use of a CMS system with pollen-fertilization restoration (Geiger
and Miedaner, 1999). Rye is adapted to adverse biotic and abiotic stress factors
which allow cultivation on poor soils with deficits in water and nutrients.
Therefore, rye is an interesting alternative for biogas production in regions where
maize production is not economically viable (Hübner et al., 2011). PH could be
used as an indirect trait in order to achieve varieties with high biomass yield
(Haffke et al., 2014).
QTL can help to accelerate and alleviate breeding steps for the development of
new hybrid rye varieties. Until recently, however, genomics-based breeding was
largely unexplored in rye due to missing genomic tools. This has changed with
the advent of DArT and SNP genotypic arrays. So far, only one genome-wide QTL
analysis has been published for important agronomic traits for testcross progeny
of the Petkus gene pool (Miedaner et al., 2012a). One to nine QTL were detected
for GY, TGW, test weight, falling number, protein, total and soluble pentosan
and starch contents. Total genetic variation explained by QTL ranged from 84%
(starch content) to 5% (GY). For all traits, a high G x E interaction was observed.
Further, QTL mapping studies exist for individual agronomic traits in rye. For
PH, QTL were found on chromosomes 2R and 5R (Börner et al., 1999, 2000). QTL
for α-amylase activity and connected quality traits had been reported (Masojć and
Milczarski, 2005, 2008). Major QTL for TGW were found on chromosome 5R and
Page 15
Publication II - QTL analysis
15
7R (Wricke, 2002). A study on triticale (× Triticosecale Wittmack) detected a
major QTL on chromosome 5R explaining 42% of genotypic variance for PH and
36% for biomass yield (Alheit et al., 2014). This QTL seems to represent the
dominant rye dwarfing gene Ddw1 (Korzun, 1996; Börner et al., 1999; Kalih et
al., 2014).
The exploitation of high biomass yielding rye hybrid cultivars holds great
potential, but until now nothing is known about the genetics of biomass yield in
rye. We report the first genome-wide QTL study of an elite interpool (Petkus x
Carsten) population for important agronomic traits, including grain and biomass
yield. Therefore, our objectives were (1) to identify QTL of quantitatively
inherited complex agronomic traits, focused on GY, biomass yield and correlated
traits, (2) to identify the genetic architecture for PH through different growth
stages and (3) to detect potential colocated QTL for analyzed traits.
3.2. Material and methods
3.2.1. Plant material
A biparental cross between two inbred parents from the Carsten (pollinator) gene
pool (H201 and H202) was established by Hybro Saatzucht GmbH & Co. KG and
forwarded by single-seed descent to F2:3 lines. In total, 258 F2:3 lines were crossed
with a CMS single cross tester of the Petkus (seed parent) gene pool resulting in
258 three-way hybrids. They were tested along with both testcrossed parents
(each parent repeated four times) and the six released hybrid varieties Minello,
Visello, Palazzo, Brasetto, SU Drive and SU Stakkato as checks. Plant material
development was already described in detail in section I.
3.2.2. Field experiments
Field experiments were conducted in 2011 and 2012 in Hohenheim, Baden
Württemberg (48°72‘N, 9°20‘W), Groß Lüsewitz, Mecklenburg-Western
Pomerania (54°07‘N, 12°33‘W), Wulfsode, Lower Saxony (53°06‘N, 10°24‘W) and
in Bornhof, Brandenburg (53°49’N,12°89’W). The experiment in Bornhof 2012
failed due to severe pre-summer drought stress. Entries were grown on drilled
Page 16
Publication II - QTL analysis
16
plots of 5 to 6 m² size in two experiments grown adjacent to each other: Biomass
harvest (exp. 1) and grain harvest (exp. 2). The experimental design within each
experiment was a randomized incomplete block design (= alpha design, 34 blocks
x 8 entries) with two replications.
For DMY all plots of the first experiment were harvested by a commercial plot
chopper at milk ripening (EC 72–77 according to BBCH, exp. 1). The second
experiment was harvested with a traditional plot harvester at full ripening (EC
92) for GY. GY is reported as dt ha-1 at 14% moisture and DMY is reported as
dt ha-1 and calculated on a 100 % dry matter basis throughout section II.
Additional traits recorded for all plots were EG (1–9, 1= very scarce, 9 = very
vigorous), HT (1–9, = very early, 9 = very late) SPM and PH at three growth
stages (PH 1 at jointing stage EC 32, PH 2 at heading stage EC 51–55 and PH 3
at milk ripening stage EC 73 and before harvest, respectively). These traits were
recorded separately for both experiments. For statistical analyses the means of
both experiments were calculated as no significant (P > 0.05) difference among
experiments was found.
3.2.3. Statistical analysis
Statistical analyses were based on plot data of 258 testcross progenies. Checks
were calculated separately. All statistical computations were performed with the
PLABSTAT software package in a two-step procedure (Utz, 2010). Analyses of
variance were firstly performed for all traits in each environment separately. The
adjusted entry means from each location were used in a second step to estimate
variance components based on the following linear model:
y = G + E + G x E,
where G and E denote genotype and environment, respectively. Both factors were
treated as random effects. Heritability (h2) on an entry-mean basis was estimated
from the variance components as the ratio of genotypic to phenotypic variance
(Fehr, 1987). Simple correlation coefficients (r) were calculated among all traits
based on entry means. Significance of r was tested by using tabulated values
based on Fischer’s z transformation (Fischer, 1921).
Page 17
Publication II - QTL analysis
17
3.2.4. Genetic linkage map construction
Genomic DNA was extracted from individual F2 plants. They were genotyped by
SSR and DArT (http://www.diversityarrays.com) markers. Polymorphic markers
were transformed into genotype codes according to their parental score for the
construction of the genetic linkage map. For quality checks a pre-selection with
regard to their deviation from expected segregation ratio was performed. The
genetic linkage map was constructed with the software JoinMap® 4.1 (van Oojen,
2006). Based on previously published maps (Bolibok et al., 2007; Milczarski et al.,
2011; Miedaner et al., 2012a), we created seven linkage groups concerning the
chromosomes (Hackauf, pers. commun.). Genetic distance in centimorgan (cM)
and order of each locus were calculated with the maximum likelihood algorithm
using Kosambi’s mapping function (Kosambi, 1943).
3.2.5. QTL analyses
QTL analyses were based on the genetic linkage map and adjusted entry means
using software PLABMQTL (Utz, 2011). Markers with a distance below 1 cM
were excluded automatically by the software. Based on testcross performance of
F2:3 testcross progenies, we can detect the main effect QTL for each trait
contributing to the additive-genetic variation. A 1-limit of detection (LOD)
support interval was specified around each QTL. Critical LOD thresholds were
analyzed empirically for each trait according to Churchill and Doerge (1994)
using 2,000 permutation runs. It turned out that critical LOD thresholds
corresponding to genome-wide error rates of α ≤ 10% were similar for all
agronomic traits. Therefore, the highest LOD threshold (DMY = 3.1) was used for
all agronomic traits. The proportion of genetic variance explained by the
regression model was calculated as pG = R2adj/h2 where R2
adj is the adjusted
proportion of phenotypic variance explained by the model. Additionally, 1,000
cross validation runs were applied to determine the bias of R². For this the data
was independently re-sampled 200 times at 5-fold cross-validations (CV). A five-
fold CV was performed as follows: The entire data set (DS) was split into five
genotypic subsamples, means from four out of five subsamples were used as
estimation set (ES) for QTL detection, localization and estimation of genetic
Page 18
Publication II - QTL analysis
18
effects. The remaining data group is considered as test set (TS) and was used to
conduct a separate QTL analysis. Out of this analysis, we reported the frequency
of recovery, i.e. the percentage of validation runs detecting the respective QTL,
and the mean QTL effects in ES and TS for comparison.
3.3. Results
Phenotypic data of both parental progenies were similar; testcross progenies
represented the mean value of their parents in most instances (Table 4). All
traits showed significant (P < 0.01) genotypic and G x E interaction variances.
The estimates of broad-sense heritability (h2) ranged from 0.5 for GY and DMY to
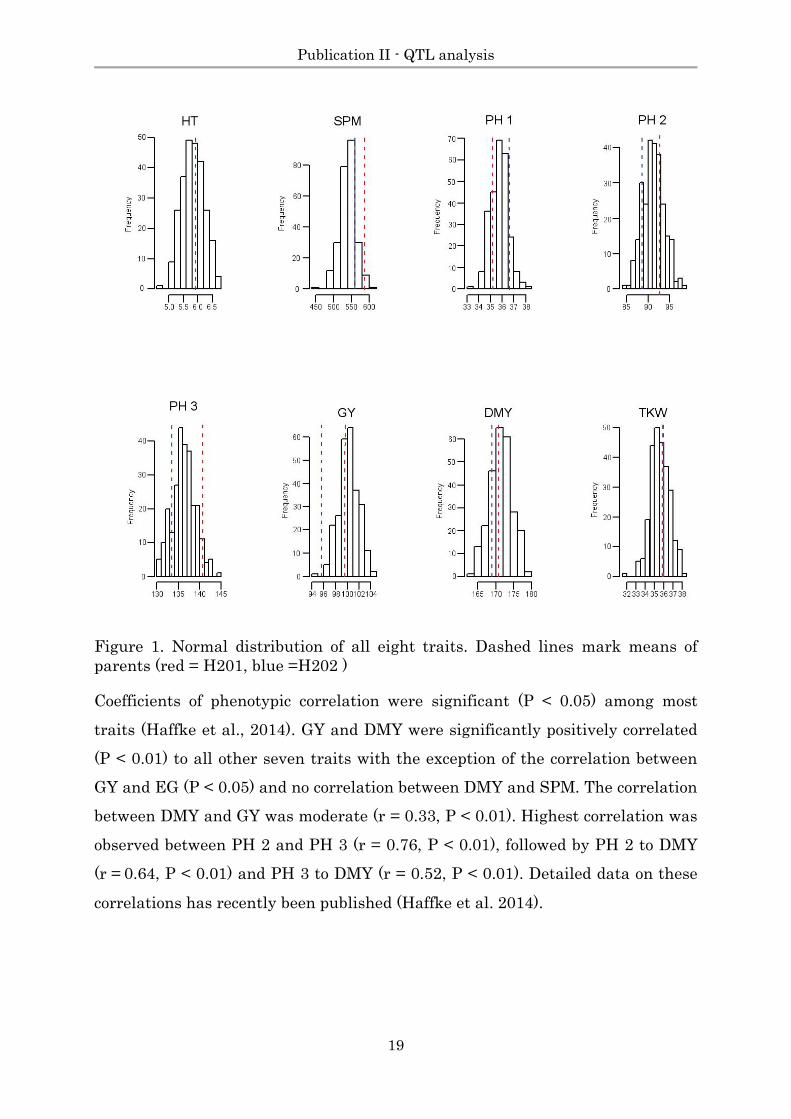
0.94 for PH 3. Only SPM had a lower h2 of 0.35 (Table 4). All traits followed a
normal distribution (Figure 3). H202 showed mostly lower values. For HT and
TGW both parents had the same values.
Page 19
Publication II - QTL analysis
19
Figure 1. Normal distribution of all eight traits. Dashed lines mark means of
parents (red = H201, blue =H202 )
Coefficients of phenotypic correlation were significant (P < 0.05) among most
traits (Haffke et al., 2014). GY and DMY were significantly positively correlated
(P < 0.01) to all other seven traits with the exception of the correlation between
GY and EG (P < 0.05) and no correlation between DMY and SPM. The correlation
between DMY and GY was moderate (r = 0.33, P < 0.01). Highest correlation was
observed between PH 2 and PH 3 (r = 0.76, P < 0.01), followed by PH 2 to DMY
(r = 0.64, P < 0.01) and PH 3 to DMY (r = 0.52, P < 0.01). Detailed data on these
correlations has recently been published (Haffke et al. 2014).
Page 20
Publication II - QTL analysis
20
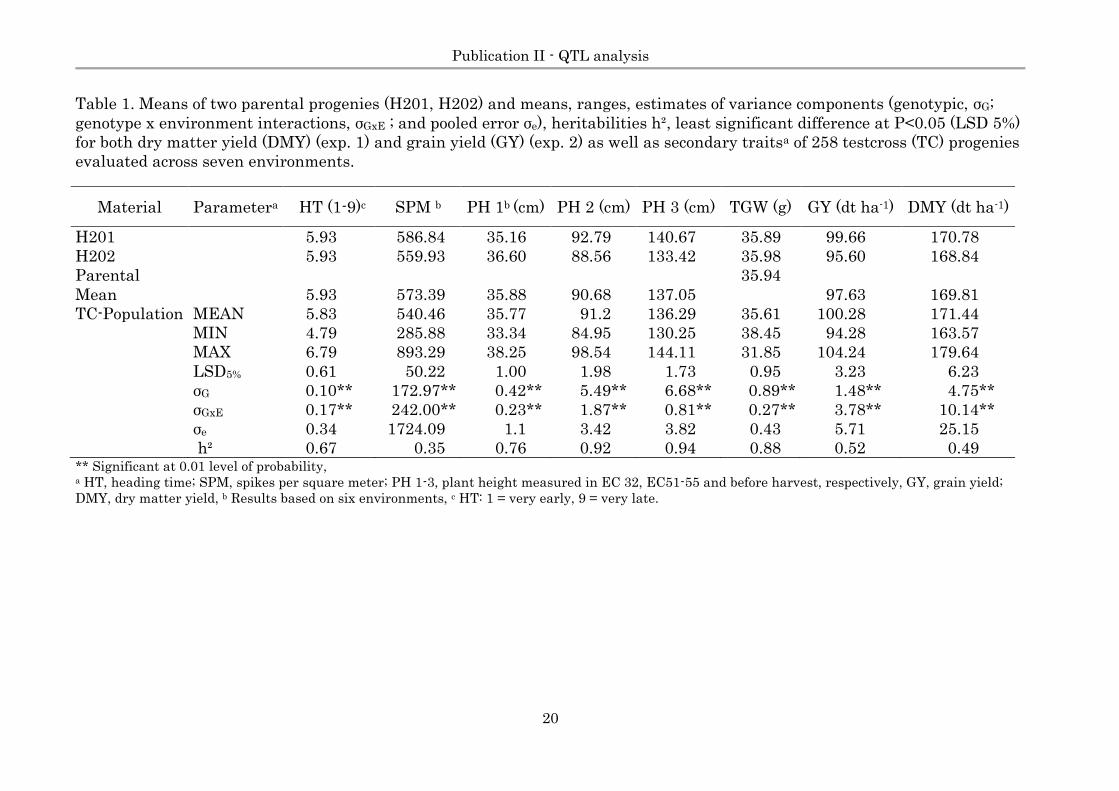
Table 1. Means of two parental progenies (H201, H202) and means, ranges, estimates of variance components (genotypic, σG;
genotype x environment interactions, σGxE ; and pooled error σe), heritabilities h², least significant difference at P<0.05 (LSD 5%)
for both dry matter yield (DMY) (exp. 1) and grain yield (GY) (exp. 2) as well as secondary traitsa of 258 testcross (TC) progenies
evaluated across seven environments.
Material Parametera HT (1-9)c SPM b PH 1b (cm) PH 2 (cm) PH 3 (cm) TGW (g) GY (dt ha-1) DMY (dt ha-1)
H201
5.93 586.84 35.16 92.79 140.67 35.89 99.66 170.78
H202
5.93 559.93 36.60 88.56 133.42 35.98 95.60 168.84
Parental
Mean 5.93 573.39 35.88 90.68 137.05
35.94
97.63 169.81
TC-Population MEAN 5.83 540.46 35.77 91.2 136.29 35.61 100.28 171.44
MIN 4.79 285.88 33.34 84.95 130.25 38.45 94.28 163.57
MAX 6.79 893.29 38.25 98.54 144.11 31.85 104.24 179.64
LSD5% 0.61 50.22 1.00 1.98 1.73 0.95 3.23 6.23
σG 0.10** 172.97** 0.42** 5.49** 6.68** 0.89** 1.48** 4.75**
σGxE 0.17** 242.00** 0.23** 1.87** 0.81** 0.27** 3.78** 10.14**
σe 0.34 1724.09 1.1 3.42 3.82 0.43 5.71 25.15
h² 0.67 0.35 0.76 0.92 0.94 0.88 0.52 0.49 ** Significant at 0.01 level of probability, a HT, heading time; SPM, spikes per square meter; PH 1-3, plant height measured in EC 32, EC51-55 and before harvest, respectively, GY, grain yield;
DMY, dry matter yield, b Results based on six environments, c HT: 1 = very early, 9 = very late.
Page 21
Publication II - QTL analysis
21
The genetic linkage map comprised a total length of 964 cM with an average
marker density of 1.06 cM. The seven rye chromosomes had a total length
ranging 105 to 166 cM. The majority of markers had a distance of less than 1 cM.
In total, 43 QTL were detected with a LOD threshold ≥ 3.10 (Table 5). Most QTL
were found for TGW (10) and HT (7), for SPM only one QTL was significant. The
explained genotypic variance of individual QTL ranged from 3% to 46%.
Explained genotypic variance for HT with all seven detected QTL simultaneously
reached 85%. For the other traits, this estimate ranged from 42% for SPM to 81%
for PH 3. Several major QTL (PG 20%) were detected for HT, SPM, PH 2, PH 3,
GY, and DMY. Interestingly, two major QTL for DMY and PH were found in the
same positions on chromosomes 2R and 5R (Figure 4, Supplementary-Table S1).
A large QTL for GY (PG = 40%) was also detected on chromosome 2R about 20 cM
apart (Figure 4).
3.4. Discussion
In this study we analyzed an elite testcross population of 258 lines to reveal the
genetic architecture of eight important agronomic traits in hybrid rye. Phenotypic
data were collected on each of four locations in 2011 and 2012, excluding Bornhof
in 2012. We observed significant genetic variation (P < 0.01) for all traits.
Heritabilities ranged from 0.35 to 0.94. For the three PH measurements (PH 1,
PH 2, PH 3) we observed the highest heritabilities (0.76, 0.92, 0.94, respectively),
which agrees with other results in rye (Miedaner et al., 2010, 2012b). For GY and
DMY we obtained moderate heritabilities of 0.52 and 0.49, respectively. In both
biparental populations of the Petkus gene pool, the heritability estimates for
grain yield are slightly higher (0.70)(Miedaner et al., 2012a). Similar results were
obtained for triticale (ranging from 0.77 – 0.91) and barley (ranging from 0.72 –
0.92), while results for wheat was comparable to our results (ranging from 0.41 –
0.58) (Mühleisen et al., 2014). The parental mean did not differ from progeny
mean in all traits, except for HT and TGW, indicating a predominantly additive
inheritance.
The use of DArT makers resulted in a map with a total length of 964 cM and
average an marker density of 1.06 cM that is comparable to other studies in rye
Page 22
Publication II - QTL analysis
22
(Bolibok et al., 2007; Milczarski et al., 2011) and one population of the Petkus
gene pool (Miedaner et al., 2012a). The genetic map of the other population of the
Petkus gene pool resulted in much longer chromosomes, but results are
comparable because of several identical makers (Miedaner et al., 2012a). For
QTL studies, marker distances of 15–20 cM are adequate (Piepho, 2000).
Therefore, we consider QTL that are closer linked than 20 cM as having the same
chromosomal position.
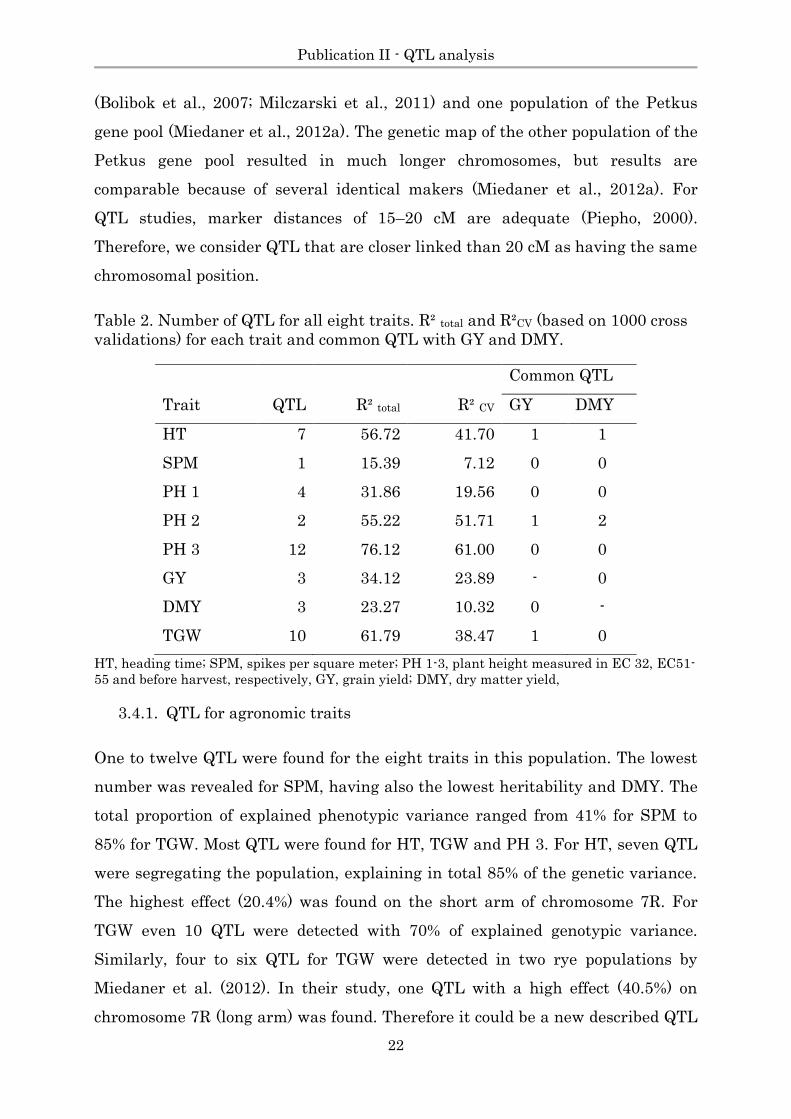
Table 2. Number of QTL for all eight traits. R² total and R²CV (based on 1000 cross
validations) for each trait and common QTL with GY and DMY.
Common QTL
Trait QTL R² total R² CV GY DMY
HT 7 56.72 41.70 1 1
SPM 1 15.39 7.12 0 0
PH 1 4 31.86 19.56 0 0
PH 2 2 55.22 51.71 1 2
PH 3 12 76.12 61.00 0 0
GY 3 34.12 23.89 - 0
DMY 3 23.27 10.32 0 -
TGW 10 61.79 38.47 1 0
HT, heading time; SPM, spikes per square meter; PH 1-3, plant height measured in EC 32, EC51-
55 and before harvest, respectively, GY, grain yield; DMY, dry matter yield,
3.4.1. QTL for agronomic traits
One to twelve QTL were found for the eight traits in this population. The lowest
number was revealed for SPM, having also the lowest heritability and DMY. The
total proportion of explained phenotypic variance ranged from 41% for SPM to
85% for TGW. Most QTL were found for HT, TGW and PH 3. For HT, seven QTL
were segregating the population, explaining in total 85% of the genetic variance.
The highest effect (20.4%) was found on the short arm of chromosome 7R. For
TGW even 10 QTL were detected with 70% of explained genotypic variance.
Similarly, four to six QTL for TGW were detected in two rye populations by
Miedaner et al. (2012). In their study, one QTL with a high effect (40.5%) on
chromosome 7R (long arm) was found. Therefore it could be a new described QTL
Page 23
Publication II - QTL analysis
23
or belong to one of the major QTL, which were already described (Wricke, 2002).
Comparison of QTL positions in detail is possible in general, but both studies
provide only a few common markers although both were constructed with about
1,000 DArT markers (Miedaner et al., 2012a).
For PH, we found a total of 11 QTL over all three developmental stages. All
detected QTLs for PH 1-3 were dynamic during plant growth except for one QTL
(chromosome 2R, position 85 – 88), which was found in developing stages PH 2
and PH3. This indicates that most of the detected QTLs controlling PH are highly
dynamic, which is consistent with the theory of developmental genetics that
several genes control the same quantitative trait and are expressed at different
development stages. Our findings agree well with results in other crops. In
maize, eight dynamic QTL were described while only three QTL were commonly
detected during subsequent developing stages (Yan, 2003). Analogous results
were described in rice (Yan et al., 1998; Cao et al., 2001) and wheat (Zhang et al.,
2013). A QTL for GY (PG = 12.8%) was co-localized with a QTL for TGW (3.2%) on
chromosome 5RL, however, the effect of the TGW-QTL was small. Most QTL
underlined a significant QTL x environment interaction. This is typical for
quantitative traits and makes selection more difficult. To report only those QTL
that surmount the threshold across seven environments may have also
contributed to a low number of QTL per trait. However, only environmentally
stable QTL are useful for breeding.
Page 24
Publication II - QTL analysis
24
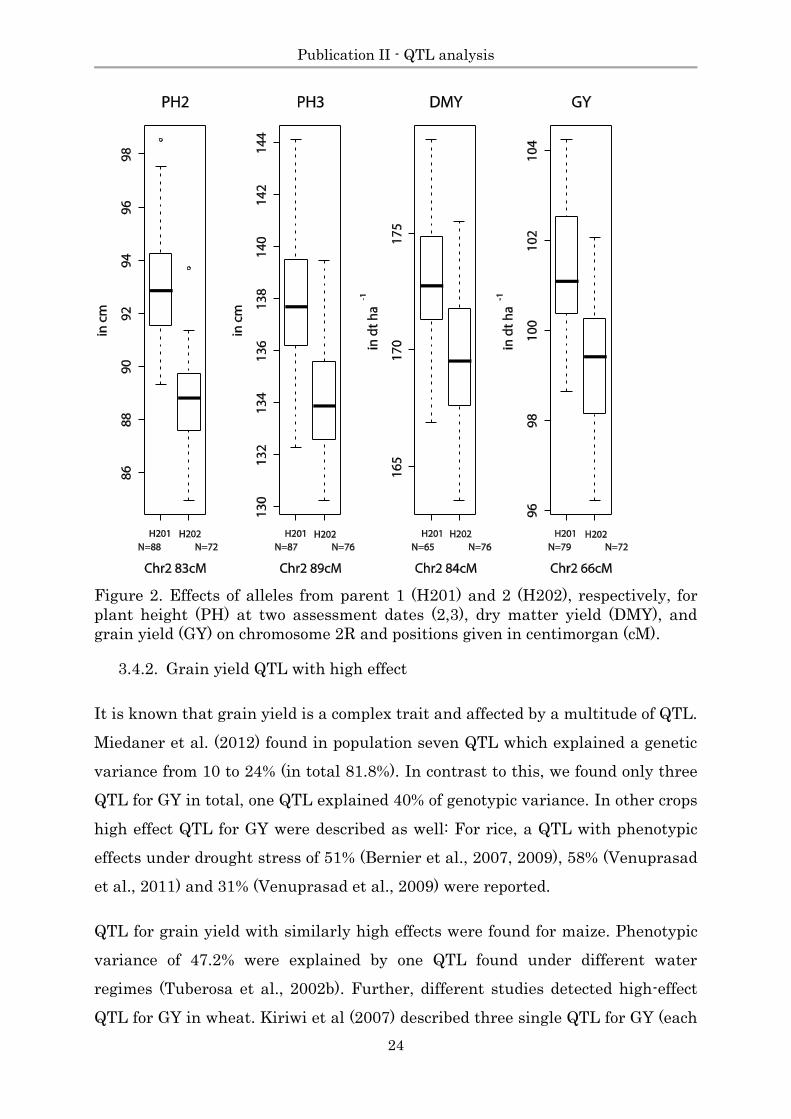
Figure 2. Effects of alleles from parent 1 (H201) and 2 (H202), respectively, for
plant height (PH) at two assessment dates (2,3), dry matter yield (DMY), and
grain yield (GY) on chromosome 2R and positions given in centimorgan (cM).
3.4.2. Grain yield QTL with high effect
It is known that grain yield is a complex trait and affected by a multitude of QTL.
Miedaner et al. (2012) found in population seven QTL which explained a genetic
variance from 10 to 24% (in total 81.8%). In contrast to this, we found only three
QTL for GY in total, one QTL explained 40% of genotypic variance. In other crops
high effect QTL for GY were described as well: For rice, a QTL with phenotypic
effects under drought stress of 51% (Bernier et al., 2007, 2009), 58% (Venuprasad
et al., 2011) and 31% (Venuprasad et al., 2009) were reported.
QTL for grain yield with similarly high effects were found for maize. Phenotypic
variance of 47.2% were explained by one QTL found under different water
regimes (Tuberosa et al., 2002b). Further, different studies detected high-effect
QTL for GY in wheat. Kiriwi et al (2007) described three single QTL for GY (each
Page 25
Publication II - QTL analysis
25
explained of 15–20% R²) and DMY (each explained of 29–32% R²) located on the
same chromosomal positions. High effect QTL for GY with R² ranging from 15%–
34% were described in recombinant inbred lines of wheat (Rustgi et al., 2013).
Furthermore, the fact that the plant material was based on current breeding
material for high yielding hybrid varieties may have an influence on the genetic
architecture and therefore, an effect of single QTL with high effects.
Consequently, further research is needed to investigate the genetic analysis of
QTL for complex traits in rye.
3.4.3. Plant height and heading time are components of biomass yield
A significant positive correlation between DMY and PH 2 (r = 0.64) has been
found in this hybrid rye population (Haffke et al., 2014). It is known that QTL of
correlated traits often map together. In fact two QTL for DMY (42.56%) and two
QTL for PH 2 (60.02%) were found at the same position on chromosome 2R and
5R. The frequency of recovery in CV for both QTL was higher for PH (94% and
92%) than for DMY (44% and 71%).
PH is obviously an important component of biomass yield. PH is inherited either
by single dwarfing loci with high effects, that have been extensively used in
wheat (Worland et al., 1998; Korzun et al., 1998), barley (Wang et al., 2010; Vu et
al., 2010; Chandler and Harding, 2013), and triticale (Oettler, 2005) or by a large
array of QTL each with small effects. An analysis of an introgression library with
primitive rye, a likely progenitor of cultivated rye, showed that 59 out of 72 lines
had chromosomal segments increasing PH in per se performance (Miedaner et
al., 2010). In this study, we also found 18 QTL responsible for PH 1–3 with
proportions of explained genotypic variance ranging from 3 to 16% and one QTL
on chromosome 2 with even 46%. Because heritability was high, this QTL still
explained 42% of phenotypic variance. The same locus (or a cluster of linked loci)
on chromosome 2R also reduced biomass yield (-1.6 dt ha-1) and made the
progenies later in heading time (Figure 4). The effects of this QTL were large
with the allele from parent H202 reducing PH 2 by 4.32 cm, PH 3 by 3.76 cm and
DMY by 3.32 dt ha-1. Indeed, Börner et al. (1996) described a dwarfing gene on
Page 26
Publication II - QTL analysis
26
chromosome 2R (dw2) in the centromeric region. However, this gene is inherited
recessively and thus, no candidate for the large-effect QTL is described here.
Similarly, Alheit et al. (2013) found a QTL with high effect on plant height (-11,4
cm) in triticale, which considerably reduces biomass yield (-14.4 dt ha-1), most
likely representing the dominant rye dwarfing gene Ddw 1 (Kalih et al., 2014).
Obviously, height-reducing genes for QTL are counterproductive for maximizing
biomass yield. QTL on chromosome 2R also affecting HT illustrates that earlier
progenies tended to have higher biomass. This was also obvious when tested in
testcrosses with rye germplasm resources (Miedaner et al., 2010), where
significant correlations between EG and DMY were reported.
Another QTL affecting several traits in parallel is located on chromosome 5RL.
The allele of parent H201 resulted in earlier (HT), taller (PH 1–2) progeny with
higher DMY. However, effects and recovery frequencies in the CV of the QTL on
chromosome 5RL were smaller. A QTL for GY is located in vicinity of this QTL on
5R.
3.4.4. Conclusions for breeding dual use hybrid rye
Selection for short-strawed progenies is a common goal among rye breeders to
achieve higher lodging resistance (Geiger and Miedaner, 2009). However the
selection cannot be as strong as in wheat because the stem plays a larger role in
contributing assimilates to the head compared to wheat. Selection for high
biomass yield affords a new course in this breeding goal.
For GY and DMY we detected no common QTL. However, both QTL for DMY on
chromosomes 2R and 5R were in vicinity of two QTL for GY with a distance of 17
and 20 cM, respectively. Given the high error of chromosomal localization of QTL
(Utz et al., 2000), this might still represent the same locus. On the other hand,
we found only a low correlation of GY vs. DMY (r = 0.33, Haffke et al. 2014). This
could be a hint, that either the QTL are different for both traits or that more co-
localized QTL for both traits are available in this population that could not be
mapped due to gaps in the genetic map (e.g. on chromosome 3R), QTL x
environment interaction or by the fact that some QTL are not exceeding the
Page 27
Publication II - QTL analysis
27
threshold. However, the low genotypic correlation between GY and DMY
supports the first explanation. In contrast, higher correlations between GY and
DMY were found in barley (r = 0.76, Boukerro et al. 1990), triticale (r = 0.65,
Gowda et al. 2010) and wheat under drought stress (r = 0.77 (Leilah and Al-
Khateeb, 2005) and r = 0.69 (Saleem, 2003)). That will lead to a focus on two
main breeding goals in hybrid rye breeding programs. On the one hand, classical
breeding goals as GY, TGW, short straw, and further quality traits have to be
followed, on the other, hand maximal DMY must be considered.
We already suggested selecting high biomass yielding varieties by indirect
selection on PH (Haffke et al. 2014). On the other hand, yield tallness is an
excellent indirect selection criterion for improving biomass, yielding a higher
indirect selection gain than the direct selection on DMY (Haffke et al. 2014). This
conclusion is supported by our QTL results. The old Polish cultivar Danko is a
perfect example of a genotype with superior lodging resistance despite tallness.
Because the correlation between GY and DMY is not negative, hybrids for dual
use can be achieved (Haffke et al., 2014). However, they have to be tested for both
traits separately. In a multistep approach, GY could be selected in the first test
for combining ability and subsequently DMY in the next test among the GY-
selected progenies. When PH is already considered in the first test, an indirect
selection gain for DMY can already be exploited. In future, genomic selection
should make it easier to select for contrasting traits in the same run. Selection in
high biomass should result in higher gains because lower traits have to be
considered. Caused by the previously explained greater genetic variance and
higher recovery frequency of CV for PH QTL it is superior to select indirectly by
MAS on high biomass yielding varieties by avoiding height reducing QTL alleles
like the prominent PH QTL on chromosome 2R and favoring height inducing QTL
like that on chromosome 5R. When selecting for taller plants to increase biomass
yield it is important to focus on better lodging resistance.
Page 28
Publication II - QTL analysis
28
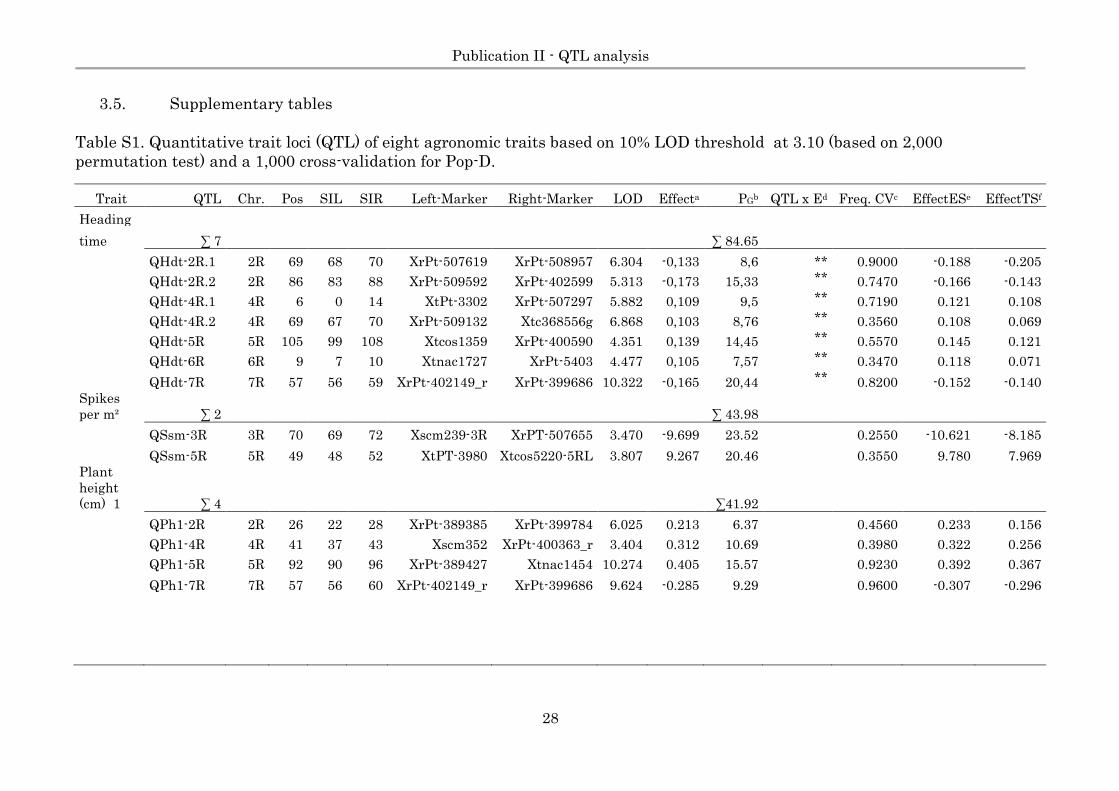
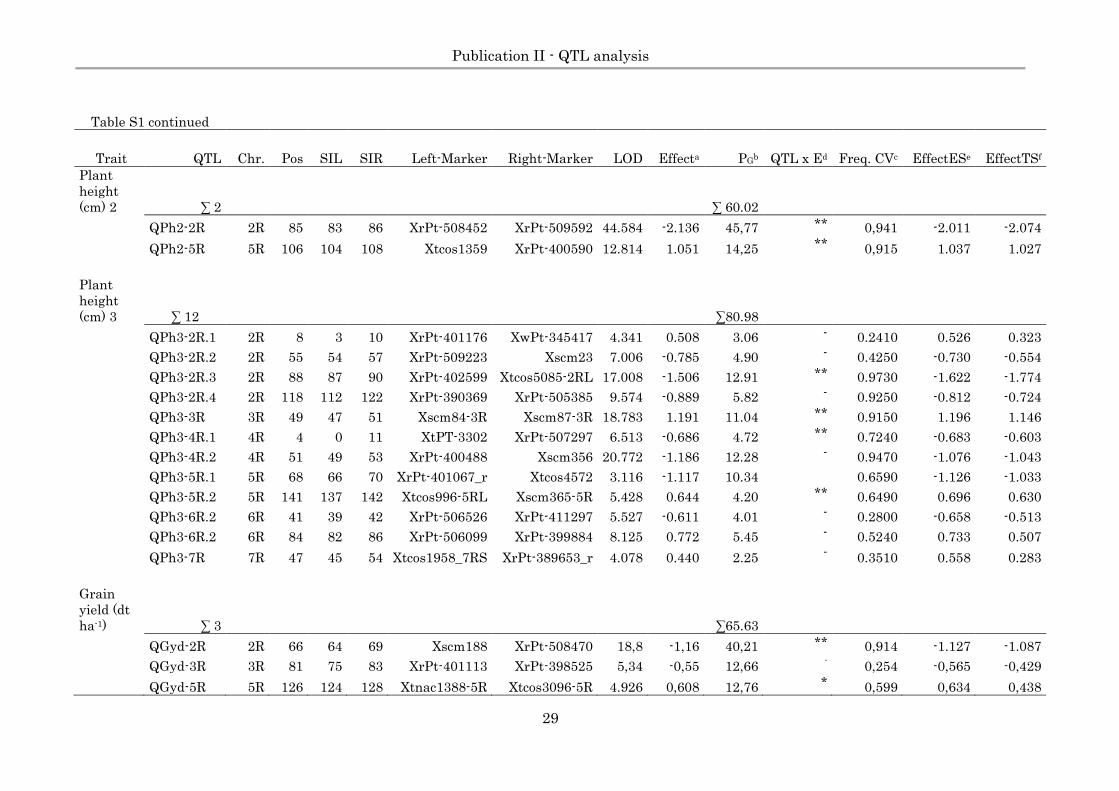
3.5. Supplementary tables
Table S1. Quantitative trait loci (QTL) of eight agronomic traits based on 10% LOD threshold at 3.10 (based on 2,000
permutation test) and a 1,000 cross-validation for Pop-D.
Trait QTL Chr. Pos SIL SIR Left-Marker Right-Marker LOD Effecta PGb QTL x Ed Freq. CVc EffectESe EffectTSf
Heading
∑ 7 ∑ 84.65
time
QHdt-2R.1 2R 69 68 70 XrPt-507619 XrPt-508957 6.304 -0,133 8,6 ** 0.9000 -0.188 -0.205
QHdt-2R.2 2R 86 83 88 XrPt-509592 XrPt-402599 5.313 -0,173 15,33 ** 0.7470 -0.166 -0.143
QHdt-4R.1 4R 6 0 14 XtPt-3302 XrPt-507297 5.882 0,109 9,5 ** 0.7190 0.121 0.108
QHdt-4R.2 4R 69 67 70 XrPt-509132 Xtc368556g 6.868 0,103 8,76 ** 0.3560 0.108 0.069
QHdt-5R 5R 105 99 108 Xtcos1359 XrPt-400590 4.351 0,139 14,45 ** 0.5570 0.145 0.121
QHdt-6R 6R 9 7 10 Xtnac1727 XrPt-5403 4.477 0,105 7,57 ** 0.3470 0.118 0.071
QHdt-7R 7R 57 56 59 XrPt-402149_r XrPt-399686 10.322 -0,165 20,44 ** 0.8200 -0.152 -0.140
Spikes
per m² ∑ 2 ∑ 43.98
QSsm-3R 3R 70 69 72 Xscm239-3R XrPT-507655 3.470 -9.699 23.52 0.2550 -10.621 -8.185
QSsm-5R 5R 49 48 52 XtPT-3980 Xtcos5220-5RL 3.807 9.267 20.46 0.3550 9.780 7.969
Plant
height
(cm) 1 ∑ 4 ∑41.92
QPh1-2R 2R 26 22 28 XrPt-389385 XrPt-399784 6.025 0.213 6.37 0.4560 0.233 0.156
QPh1-4R 4R 41 37 43 Xscm352 XrPt-400363_r 3.404 0.312 10.69 0.3980 0.322 0.256
QPh1-5R 5R 92 90 96 XrPt-389427 Xtnac1454 10.274 0.405 15.57 0.9230 0.392 0.367
QPh1-7R 7R 57 56 60 XrPt-402149_r XrPt-399686 9.624 -0.285 9.29 0.9600 -0.307 -0.296
Page 29
Publication II - QTL analysis
29
Table S1 continued
Trait QTL Chr. Pos SIL SIR Left-Marker Right-Marker LOD Effecta PGb QTL x Ed Freq. CVc EffectESe EffectTSf
Plant
height
(cm) 2 ∑ 2 ∑ 60.02
QPh2-2R 2R 85 83 86 XrPt-508452 XrPt-509592 44.584 -2.136 45,77 ** 0,941 -2.011 -2.074
QPh2-5R 5R 106 104 108 Xtcos1359 XrPt-400590 12.814 1.051 14,25 ** 0,915 1.037 1.027
Plant
height
(cm) 3 ∑ 12 ∑80.98
QPh3-2R.1 2R 8 3 10 XrPt-401176 XwPt-345417 4.341 0.508 3.06 - 0.2410 0.526 0.323
QPh3-2R.2 2R 55 54 57 XrPt-509223 Xscm23 7.006 -0.785 4.90 - 0.4250 -0.730 -0.554
QPh3-2R.3 2R 88 87 90 XrPt-402599 Xtcos5085-2RL 17.008 -1.506 12.91 ** 0.9730 -1.622 -1.774
QPh3-2R.4 2R 118 112 122 XrPt-390369 XrPt-505385 9.574 -0.889 5.82 - 0.9250 -0.812 -0.724
QPh3-3R 3R 49 47 51 Xscm84-3R Xscm87-3R 18.783 1.191 11.04 ** 0.9150 1.196 1.146
QPh3-4R.1 4R 4 0 11 XtPT-3302 XrPt-507297 6.513 -0.686 4.72 ** 0.7240 -0.683 -0.603
QPh3-4R.2 4R 51 49 53 XrPt-400488 Xscm356 20.772 -1.186 12.28 - 0.9470 -1.076 -1.043
QPh3-5R.1 5R 68 66 70 XrPt-401067_r Xtcos4572 3.116 -1.117 10.34 0.6590 -1.126 -1.033
QPh3-5R.2 5R 141 137 142 Xtcos996-5RL Xscm365-5R 5.428 0.644 4.20 ** 0.6490 0.696 0.630
QPh3-6R.2 6R 41 39 42 XrPt-506526 XrPt-411297 5.527 -0.611 4.01 - 0.2800 -0.658 -0.513
QPh3-6R.2 6R 84 82 86 XrPt-506099 XrPt-399884 8.125 0.772 5.45 - 0.5240 0.733 0.507
QPh3-7R 7R 47 45 54 Xtcos1958_7RS XrPt-389653_r 4.078 0.440 2.25 - 0.3510 0.558 0.283
Grain
yield (dt
ha-1) ∑ 3 ∑65.63
QGyd-2R 2R 66 64 69 Xscm188 XrPt-508470 18,8 -1,16 40,21 ** 0,914 -1.127 -1.087
QGyd-3R 3R 81 75 83 XrPt-401113 XrPt-398525 5,34 -0,55 12,66 - 0,254 -0,565 -0,429
QGyd-5R 5R 126 124 128 Xtnac1388-5R Xtcos3096-5R 4.926 0,608 12,76 * 0,599 0,634 0,438
Page 30
Publication II - QTL analysis
30
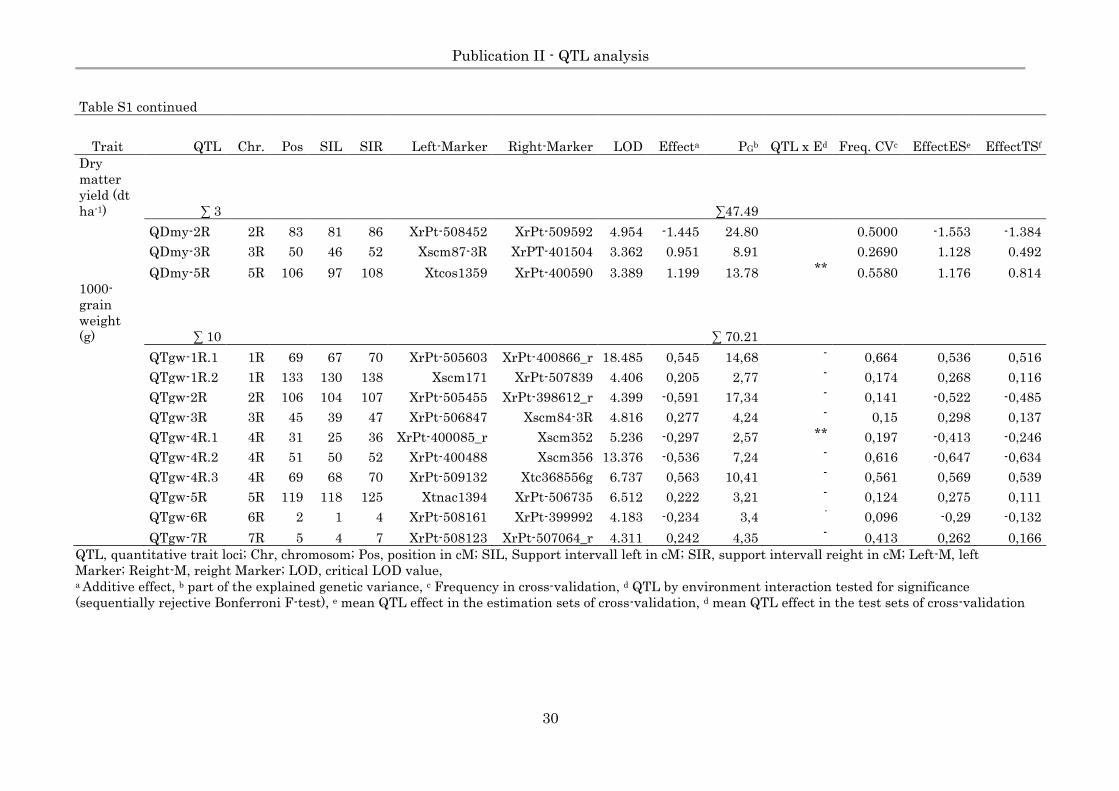
Table S1 continued
Trait QTL Chr. Pos SIL SIR Left-Marker Right-Marker LOD Effecta PGb QTL x Ed Freq. CVc EffectESe EffectTSf
Dry
matter
yield (dt
ha-1) ∑ 3 ∑47.49
QDmy-2R 2R 83 81 86 XrPt-508452 XrPt-509592 4.954 -1.445 24.80 0.5000 -1.553 -1.384
QDmy-3R 3R 50 46 52 Xscm87-3R XrPT-401504 3.362 0.951 8.91 0.2690 1.128 0.492
QDmy-5R 5R 106 97 108 Xtcos1359 XrPt-400590 3.389 1.199 13.78 ** 0.5580 1.176 0.814
1000-
grain
weight
(g) ∑ 10 ∑ 70.21
QTgw-1R.1 1R 69 67 70 XrPt-505603 XrPt-400866_r 18.485 0,545 14,68 - 0,664 0,536 0,516
QTgw-1R.2 1R 133 130 138 Xscm171 XrPt-507839 4.406 0,205 2,77 - 0,174 0,268 0,116
QTgw-2R 2R 106 104 107 XrPt-505455 XrPt-398612_r 4.399 -0,591 17,34 - 0,141 -0,522 -0,485
QTgw-3R 3R 45 39 47 XrPt-506847 Xscm84-3R 4.816 0,277 4,24 - 0,15 0,298 0,137
QTgw-4R.1 4R 31 25 36 XrPt-400085_r Xscm352 5.236 -0,297 2,57 ** 0,197 -0,413 -0,246
QTgw-4R.2 4R 51 50 52 XrPt-400488 Xscm356 13.376 -0,536 7,24 - 0,616 -0,647 -0,634
QTgw-4R.3 4R 69 68 70 XrPt-509132 Xtc368556g 6.737 0,563 10,41 - 0,561 0,569 0,539
QTgw-5R 5R 119 118 125 Xtnac1394 XrPt-506735 6.512 0,222 3,21 - 0,124 0,275 0,111
QTgw-6R 6R 2 1 4 XrPt-508161 XrPt-399992 4.183 -0,234 3,4 - 0,096 -0,29 -0,132
QTgw-7R 7R 5 4 7 XrPt-508123 XrPt-507064_r 4.311 0,242 4,35 - 0,413 0,262 0,166
QTL, quantitative trait loci; Chr, chromosom; Pos, position in cM; SIL, Support intervall left in cM; SIR, support intervall reight in cM; Left-M, left
Marker; Reight-M, reight Marker; LOD, critical LOD value, a Additive effect, b part of the explained genetic variance, c Frequency in cross-validation, d QTL by environment interaction tested for significance
(sequentially rejective Bonferroni F-test), e mean QTL effect in the estimation sets of cross-validation, d mean QTL effect in the test sets of cross-validation
Page 31
Publication III - Yield stability
31
4. Publication III: Yield stability of hybrid rye under normal and
managed drought stress conditions towards selection of broadly
adapted germplasm
S. Haffke, P. Wilde, B. Schmidchen , B. Hackauf, S. Roux, M. Gottwald, T.
Miedaner
S. Haffke, M. Gottwald, T. Miedaner, State Plant Breeding Institute, University
of Hohenheim,
70593 Stuttgart, Germany
Present adress of M. Gottwald: Syngenta Agro, 63477 Maintal, Germany
P. Wilde and B. Schmiedchen
KWS LOCHOW GmbH, 29296 Bergen
S. Roux and B. Hackauf, Institute for Breeding Research on Agricultural Crops,
Julius-Kühn-Institut, Federal Research Centre for Cultivated Plants, Groß
Lüsewitz, 18190, Sanitz, Germany
DOI 10.2135/cropsci2014.08.0532
The orginal publication is avaiable at
Crop Science
2015, Volume 55, No. 3, pp. 1026-1034
Page 32
Publication III - Yield stability
32
Abstract
Extreme weather events, induced by global climate change, will affect crop
production and create a demand for ecologically stable and high-yielding
varieties. Winter rye (Secale cereale L.) is mainly grown in marginal
environments in Central and Eastern Europe, where varying weather conditions
have an even stronger impact on grain yield. Therefore yield stability is an
important breeding goal. Our objectives were to describe phenotypic diversity for
genotype by irrigation interaction (GII) under managed drought stress and to
analyze the possibility of combining high grain yield and maximal yield stability
of hybrid rye. We observed two intrapool (each of 220 testcross progenies) and one
interpool (218 testcross progenies) population at 16 to 18 environments (location
by year combination), while managed drought stress trials were conducted at six
of these environments. We observed a wide range of grain yield, from 4.9 to 11.5
Mg ha−1. In the managed drought-stress experiments yield reduction in the
rainfed regime ranged from 2 to 41% with an average of 18%. In most
environments yield reduction was significant, while only a few environments
showed significant GII. High genotypic correlations between irrigated and
rainfed regimes (0.8–1.0) indicate already stable hybrid rye genotypes under
differing water conditions. The coefficient of linear regression (bi) was not
significantly different from 1 among progenies. Mean square deviation from
linear regression (S2di), however, varied significantly (P < 0.01). Although modern
rye breeding materials show already high yield potential and stability, it is
proposed to include managed drought stress environments in selection process to
ensure a broad adaptability in future.
Page 33
General discussion
33
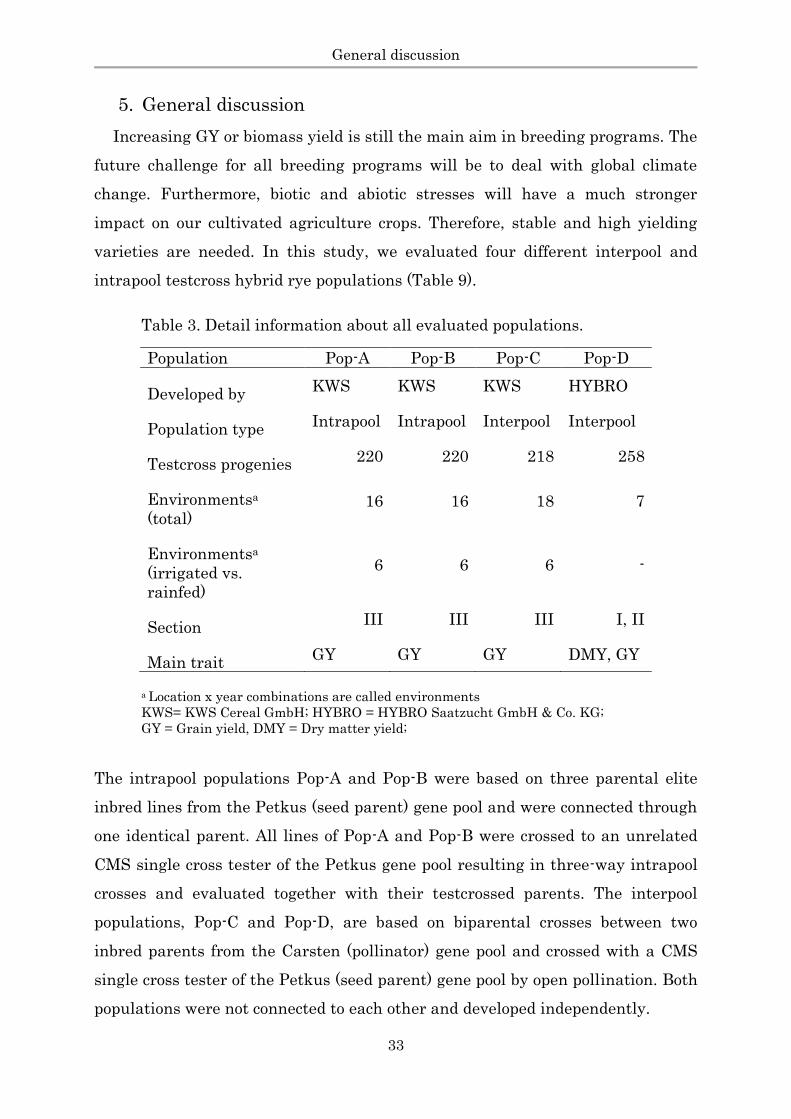
5. General discussion
Increasing GY or biomass yield is still the main aim in breeding programs. The
future challenge for all breeding programs will be to deal with global climate
change. Furthermore, biotic and abiotic stresses will have a much stronger
impact on our cultivated agriculture crops. Therefore, stable and high yielding
varieties are needed. In this study, we evaluated four different interpool and
intrapool testcross hybrid rye populations (Table 9).
Table 3. Detail information about all evaluated populations.
Population Pop-A Pop-B Pop-C Pop-D
Developed by KWS KWS KWS HYBRO
Population type Intrapool Intrapool Interpool Interpool
Testcross progenies 220 220 218 258
Environmentsa
(total) 16 16 18 7
Environmentsa
(irrigated vs.
rainfed)
6 6 6 -
Section III III III I, II
Main trait GY GY GY DMY, GY
a Location x year combinations are called environments
KWS= KWS Cereal GmbH; HYBRO = HYBRO Saatzucht GmbH & Co. KG;
GY = Grain yield, DMY = Dry matter yield;
The intrapool populations Pop-A and Pop-B were based on three parental elite
inbred lines from the Petkus (seed parent) gene pool and were connected through
one identical parent. All lines of Pop-A and Pop-B were crossed to an unrelated
CMS single cross tester of the Petkus gene pool resulting in three-way intrapool
crosses and evaluated together with their testcrossed parents. The interpool
populations, Pop-C and Pop-D, are based on biparental crosses between two
inbred parents from the Carsten (pollinator) gene pool and crossed with a CMS
single cross tester of the Petkus (seed parent) gene pool by open pollination. Both
populations were not connected to each other and developed independently.
Page 34
General discussion
34
5.1. QTL analysis on grain and biomass yield
Due to the increasing demand for renewable energy produced using plant
biomass, high biomass yielding rye varieties have become more important in
agricultural production systems. Recently, it was demonstrated that different
sources of rye germplasm possess a great potential for improving biomass yield
production (Miedaner et al., 2010) and therefore, increasing the amount of energy
produced per hectare. Although hybrid rye has a high potential as a bioenergy
crop and shows large DMYs, methane yield per hectare is the most important
trait for economic biogas production. Therefore, when using hybrid rye as a
bioenergy resource for biogas production, high DMY is the most important trait.
DMY and methane yield were highly correlated (r = 0.95, P < 0.01), while harvest
time only had an influence on DMY and was highest during harvest at late milk
ripening (Hübner et al., 2011). Similar correlations (r = 0.90) between DMY and
methane yield were reported for maize (Grieder et al., 2012b). Different hybrid
rye varieties have been released within the last years, which could be used for
both production schemes - GY or DMY.
We analyzed Pop-D at four locations in 2011 and 2012 and phenotypic data were
collected for important agronomic traits. Further, we calculated a linkage map
based on approximately 1200 SSR and DArT markers. Phenotypic results pointed
out that a simultaneous selection for GY and DMY is not adequate due to the
rather low correlation between both traits. For a successful indirect selection,
genetic correlation coefficients of >0.65 should exist between the trait of interest
and the trait for selection (Harrer and Utz, 1990). The highest genetic
correlations to DMY were observed for PH 2 and 3 (r = 0.89, and r = 0.89,
respectively). The stem had a higher influence on DMY than the ear. Due to high
correlation and high heritability of PH, it is more efficient to select indirectly for
high DMY by using PH. Furthermore, an indirect selection of DMY using GY or
vice versa would not be advisable and would lead to a low response to selection
due to the low phenotypic correlation between these traits with only r = 0.33 in
our study (see section I). The relative efficiencies for selection of DMY estimated
by PH 2 and PH 3 were 1.24 and 0.98 respectively, compared to 0.52 for GY
Page 35
General discussion
35
(Haffke et al., 2014). In contrast to this, higher correlations between GY and
DMY were found for barley r = 0.76 (Boukerrou and Rasmusson, 1990) and
triticale r = 0.65 (Gowda et al., 2011). Gowda et al. (2011) used an index of traits
to predict the biomass yield. Generally, PH can be considered as a good proxy for
biomass production (here DMY). High correlation between PH and DMY ranging
from r = 0.64 to r = 0.81 were found in maize (Lübberstedt et al., 1997; Strigens
et al., 2012; Grieder et al., 2012a; b), r = 0.68 – 0.70 in sorghum (Murray et al.,
2008) and slightly higher correlations of r = 0.86 in triticale (Alheit et al., 2014).
The genetic results were in agreement with our phenotypic results, because
similar QTL for PH and DMY where obtained, while no overlapping QTL
between GY and DMY were found. QTL for PH and DMY were co-localized on
chromosome 2R and 5R with R² of 60.0% and 42.9%, respectively. Co-localized
QTL for PH and DMY were also reported in maize (Lübberstedt et al., 1997). Due
to its high correlation, higher heritability and higher relative selection
efficiencies as mentioned above focusing on PH for improving high dry matter
yielding varieties is more successful.
To achieve high yielding biomass rye populations it will be necessary to focus on
taller plants (Salas Fernandez et al., 2009). This is contrary to classical breeding
targets, which aim at short plant types with high GY. Traditional aims were to
develop short, lodging tolerant and high grain yielding varieties which were
adapted to the mechanical harvest (Sakamoto and Matsuoka, 2004; Geiger and
Miedaner, 2009). New breeding aims for high biomass yielding varieties should
mainly focus on increased PH in order to exploit the positive correlation with
DMY. This goes along with a different harvest index. Modern varieties of most
intensively cultivated grain crops have a harvest index range between 0.4 and
0.6, when focusing on high grain yielding varieties. An altered harvest index can
have a positive influence on high yielding biomass varieties.
In order to achieve high biomass yielding hybrid varieties, selection within the
two gene pools is necessary. Breeders should focus on line per se performance
evaluation on PH and DMY. Moderate to high phenotypic correlations were found
Page 36
General discussion
36
for two rye populations between line per se and testcross performance for PH of
r = 0.40 and r = 0.70, respectively (Miedaner et al., 2014).
A further opportunity would be the use of genetic resources (Haussmann et al.,
2004). Within germplasm resources for forage rye and grain rye high phenotypic
correlations of r = 0.60, r = 0.84 and r = 0.79 between line per se and testcross
performance for PH were found, respectively (Miedaner et al., 2010).
Additionally, high correlations (r = 0.70) were obtained for forage rye between
line per se and testcross performance for DMY. Also phenotypic correlation of PH
and methane yield between line per se and testcross performance of r = 0.61 was
reported in maize (Grieder et al., 2012a).
Since tall genotypes can often be found in exotic genetic resources, one
opportunity to improve both, PH and DMY, could be achieved by exploiting these
resources. A few putative QTL for PH were already described in Iranian
primitive rye populations and could be introgressed into high yielding modern rye
genotypes (Falke et al., 2009a; b; Miedaner et al., 2011). Nevertheless, using
genetic resources bears further obstacles, since these genotypes possess mostly
very poor agronomic performance and might lead to genomic distortions due to
their genetic distance compared to our current rye breeding pools (Haussmann et
al., 2004).
An increase in DMY in hybrid rye varieties by increasing PH needs better lodging
resistance. Generally better lodging tolerance is highly correlated to short
varieties and has been reported for rye (Oehme, 1989), barley (Stanca et al.,
1979; Murthy and Rao, 1980) and wheat (Pinthus, 1967) to achieve a favorable
harvest index and, hence higher GY for biomass rye breeding. It is therefore,
necessary to evaluate other agronomic traits, which might improve lodging
resistance apart from PH reduction. Several possibilities were described in other
crops to improve lodging resistance besides using PH. In wheat, the spreading
angle of roots in a horizontal direction was positively correlated to lodging
tolerance (Pinthus, 1967). Further, the culm stiffness (Keller et al., 1999) and
thicker and heavier stems may lead to less lodging in varieties (Zuber et al.,
1999). In Sorghum larger diameters of basal internodes, a thicker rind, higher
Page 37
General discussion
37
total non-structural carbohydrates and lower stalk potassium and protein
concentrations lead to more lodging tolerant varieties (Esechie et al., 1977). QTL
for lodging resistance in rice (Kashiwagi and Ishimaru, 2004) and wheat (Keller
et al., 1999) have already been described.
5.2. Improving yield stability and drought tolerance in hybrid rye
Released varieties are destined for a wide range of environments. Equally as
important as different breeding aims, such as high GY or DMY, is the importance
of breeding for stable varieties over a wide range of environments and different
years (Kang and Magari, 1996).
Rye is grown in various agroecological zones under different soil conditions. It is
mainly grown in Northern Europe stretching from Germany to the Ural
Mountains in the east, covering a range of continental to oceanic climate
conditions. Such a wide range of environmental conditions poses a great
challenge to rye breeders. In order to set up an efficient breeding program with
maximum response to selection, breeders need to define target environments
based on G x E interactions and exemplary geographical regions, weather events
and growing conditions. Estimating and understanding the extent of G x E
interaction can guide breeders in their decision on whether a breeding strategy
for either specific or wide adaptation should be pursued, which depends on the
expression of stability under limited or wide ranges of environments (Romagosa
and Fox, 1993; Yue et al., 1997). Generally, breeding for widely adapted
genotypes would be an advantage, but the question is how broadly new varieties
should be adapted (Ceccarelli, 1989). Ceccarelli (1989) suggested two different
approaches for success. On the one hand, one could select for low G x E
interaction and high yield. On the other hand, one could select for maximum
yield and stability within macro-environments. Subdivided target environments
have also been suggested (Atlin et al., 2000). Generally, hybrids have been
reported to be more stable across environments than inbred lines as shown for
several auto- and allogameous crops (Lewis, 1954; Adams and Shank, 1959;
Shank and Adams, 1960; Allard, 1961; Becker et al., 1982; Mühleisen et al.,
2014). Individual and collective buffering is part of the genetic structure and
Page 38
General discussion
38
heterozygous and heterogeneous types in rye provide both. The heterozygosity of
most loci causes individual buffering while segregation of loci within the variety
causes the collective buffering. The advantages of heterogeneous crops increases,
when water and nutrient increases (Frey and Maldonado, 1967). Therefore,
hybrid rye should already be highly stable and genetically flexible (Phillips and
Wolfe, 2005).
We tested 658 rye genotypes from three populations of both heterotic groups in
16 – 18 different environments, covering a wide range of climatic and soil
conditions. In six out of these 16-18 environments we conducted managed
drought-stress field trials and evaluated each population. A high environmental
variation was confirmed by a high variation in GY. A high proportion of G x E
interaction variance at the total variance also confirmed the environmental
differences. For all three populations the interaction variance (G x E) was two
times larger than the genotypic variance calculated over all environments. With
a low G x E interaction the optimum number of environments can be reduced and
more candidates can be evaluated to increase the selection gain. If the G x E
interaction variance is high, more environments should be included while fewer
candidates can be tested. The impact of the G x E variance leads to the choice of
the appropriate breeding strategy to develop varieties for a given range of target
environments (Tomerius, 2001). Tomerius (2001) mentioned two options for
breeding strategies: (1) to develop new varieties for specific environments in
smaller breeding programs, or (2) to run only one breeding program to develop
varieties adapted to the whole range of environments. The G x E interaction
variance will increase with increasing environmental heterogeneity of the target
environment. It is advantageous to employ one breeding program across two
zones as long as the increase of the G x E is not too strong (assuming a 1.5 fold
increase of the interaction variance). The number of candidates can be twice as
large and the number of locations can also be higher in comparison to site specific
breeding programs, assuming the same budget.
We focused on important agronomic traits, but GY was the most sensitive trait
compared to TGW, PH and HT. In 15 out of 18 managed drought-stress
Page 39
General discussion
39
environments we observed significantly lower GY (2–40%, see section III), but
only nine environments showed a significant G x I interaction. Our observed low
G x I interaction (see section III) also shows that rye is well adapted to marginal
environments, which has already been observed in other publications (Hoffmann,
2008; Hübner et al., 2013). For breeders significant G x I interaction variance
would be interesting for developing more drought tolerant genotypes. The G x I
variance represent only a small part of the total variance. And even though the G
x E x I interaction variance also includes the G x I interaction, this part is not
utilized by the breeder. The significant G x E x I interaction variance indicated,
that every environment suffered from different drought stress.
We observed highly stable genotypes for GY over a wide range of test
environments. Almost all genotypes were highly stable (653 out of 658 genotypes)
over 16 – 18 environments (section III). All three populations were already
adapted similarly to both low and high yielding environments with almost all
progenies. Breeding on less fertile and sandy soils led to stress tolerant hybrids.
However, the range of genotypes above and below average in yield stability
enables breeders to select for high yield stability. An important objective is the
difference between morphological and physiological characters. Different studies
in wheat and barley under drought stress pointed out that several morphological
and physiological characters differ among high yielding varieties under stress
and under optimum conditions (Ceccarelli et al., 1991; Ceccarelli and Grando,
1996).
Improvement of yield stability could be achieved by selecting for constitutive
characters with low G x E interaction. Traits such as root number were already
described in barley (Ceccarelli and Grando, 1991). In maize the use of optimal
and managed drought stress environments is recommended in order to select for
the broadest adaptation possible (Chapman et al., 1997). Chapman et al. (1997)
recommend selection of broad adaptation (higher mean yield) and thereby
increasing the specific adaptation to drought environments.
In general, drought stress is not as important as there is less G x I interaction
and a high correlation of close to 1 of traits, such as PH, GY and TGW between
Page 40
General discussion
40
rainfed and irrigated conditions (see section III). This could suggest, that the elite
rye material is already stress tolerant (Hoffmann, 2008; Hübner et al., 2013) or
that the drought stress was not strong enough (Blum, 2005). This allows a
combination of all environments into one analysis in order to improve conclusions
on genetic variation for yield stability.
It is therefore, not necessary to develop special breeding programs for European
rye production in dry environments, as long as drought does not occur regularly
and yield reduction stays below 50 % (Blum, 2005). But selection and testing in
different environments with diverse fertility and precipitation and managed-
drought stress conditions should be conducted to achieve promising and stable
rye varieties. They should also be capable of buffering high climate fluctuations
that might occur in future climates.
Additional studies already exist for other crops to detect QTLs under drought
conditions and there are promising possibilities to improve drought tolerance
with marker information. A QTL on chromosome 4AL for wheat was found to
have a significant influence on performance under reduced moisture. The QTL,
which is associated with the microsatellite locus Xwmc89 had a significant
influence on GY, grain filling rate, spike density, grains m-2, biomass production,
biomass production rate and drought susceptibility index (Kirigwi et al., 2007).
One study detected 42 QTL for GY and growth traits on genome A and B
(Maccaferri et al., 2008) and 16 QTL for GY and growth traits on genome A, B
and D (Mathews 2008).
For barley, favorable QTL alleles from wild barley accession germplasm (HOR
11508) were identified by an advanced backcross QTL analysis (Talamè et al.,
2004). Additionally a high number of QTL for GY, growth traits and other
agronomic traits were detected in barley germplasm (Teulat et al., 2001; Baum et
al., 2003; von Korff et al., 2008). QTL for GY were found in rice on chromosome 2
and 3 (Venuprasad et al., 2009) and chromosome 12 (Bernier et al., 2007, 2009).
Several studies detected QTL in maize. 81 QTL were found for yield components
and secondary traits (Messmer et al., 2009), 20 QTL for GY and yield components
(Xiao 2005) and further 56 QTL for root characteristics, drought tolerance index
Page 41
General discussion
41
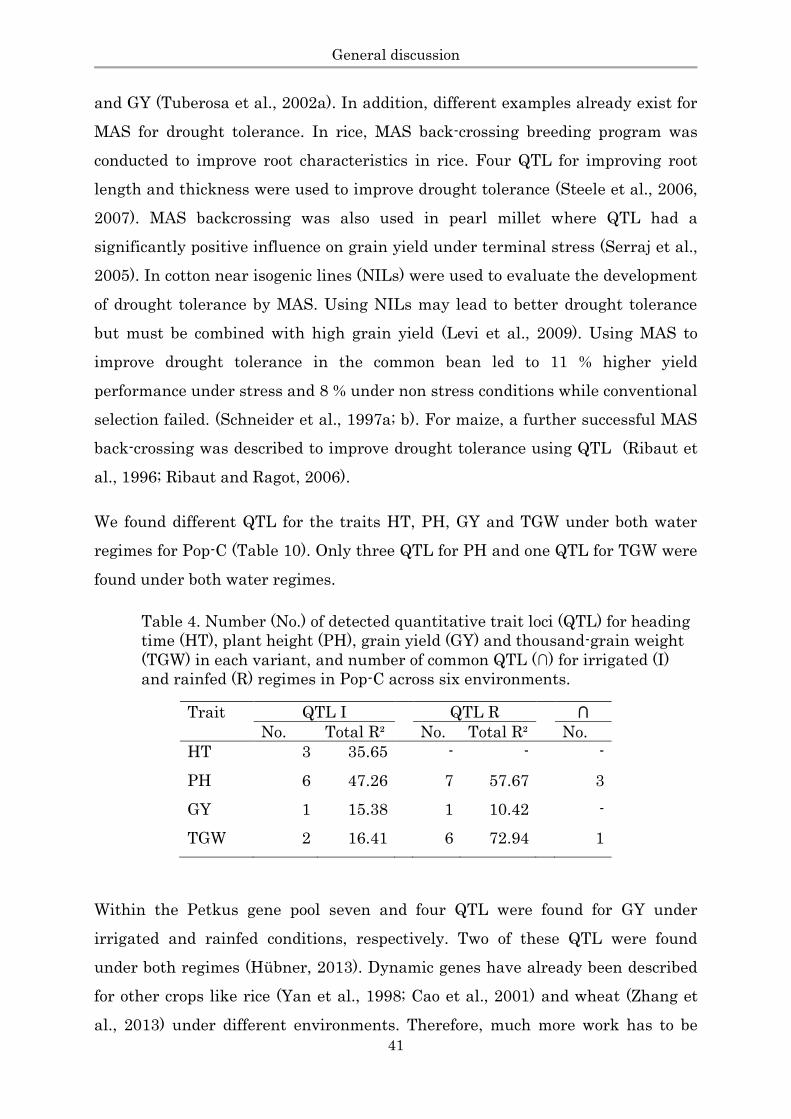
and GY (Tuberosa et al., 2002a). In addition, different examples already exist for
MAS for drought tolerance. In rice, MAS back-crossing breeding program was
conducted to improve root characteristics in rice. Four QTL for improving root
length and thickness were used to improve drought tolerance (Steele et al., 2006,
2007). MAS backcrossing was also used in pearl millet where QTL had a
significantly positive influence on grain yield under terminal stress (Serraj et al.,
2005). In cotton near isogenic lines (NILs) were used to evaluate the development
of drought tolerance by MAS. Using NILs may lead to better drought tolerance
but must be combined with high grain yield (Levi et al., 2009). Using MAS to
improve drought tolerance in the common bean led to 11 % higher yield
performance under stress and 8 % under non stress conditions while conventional
selection failed. (Schneider et al., 1997a; b). For maize, a further successful MAS
back-crossing was described to improve drought tolerance using QTL (Ribaut et
al., 1996; Ribaut and Ragot, 2006).
We found different QTL for the traits HT, PH, GY and TGW under both water
regimes for Pop-C (Table 10). Only three QTL for PH and one QTL for TGW were
found under both water regimes.
Table 4. Number (No.) of detected quantitative trait loci (QTL) for heading
time (HT), plant height (PH), grain yield (GY) and thousand-grain weight
(TGW) in each variant, and number of common QTL (∩) for irrigated (I)
and rainfed (R) regimes in Pop-C across six environments.
Trait QTL I QTL R ∩
No. Total R² No. Total R² No.
HT 3 35.65 - - -
PH 6 47.26 7 57.67 3
GY 1 15.38 1 10.42 -
TGW 2 16.41 6 72.94 1
Within the Petkus gene pool seven and four QTL were found for GY under
irrigated and rainfed conditions, respectively. Two of these QTL were found
under both regimes (Hübner, 2013). Dynamic genes have already been described
for other crops like rice (Yan et al., 1998; Cao et al., 2001) and wheat (Zhang et
al., 2013) under different environments. Therefore, much more work has to be
Page 42
General discussion
42
done to identify stable QTL for GY over a wide range of environments. Further,
much more work has to be done to find also dynamic drought tolerant QTL
within both heterotic groups, which would be an advantage to improve the yield
level under drought conditions. In order to avoid drought stress, it could be
promising to have QTL, which buffer dry spring and summer seasons by
switching on drought-tolerant gene regions. Therefore we could concentrate and
identify special QTL to buffer drought stress, as already described for other crops
and mentioned above.
5.3. Conclusions for hybrid rye breeding
Modern hybrid rye varieties have great potential as an alternative biogas
substrate. Either in regions where other crops are not economically feasible,
agronomic diversity in crop rotation needs to be increased or for increasing the
total biomass yield by harvesting two crops annually. In our studies we identified
a high phenotypic correlation between PH and DMY. GY showed only a moderate
correlation to DMY. Using PH as an indirect selection criterion will successfully
increase DMY in modern rye breeding programs. The genotypic results
underlined the phenotypic results by evidence of similar QTL for PH and DMY,
due to the fact that both traits were highly correlated. Attention should be paid to
highly dynamic QTL. We found different QTL for all PH (1-3) measurements,
while only one QTL was found in common for PH 2 and PH 3. Introducing all
dynamic QTL in new varieties could be difficult and time consuming. Therefore,
one QTL (in PH 2 and PH 3) can be used to accelerate the breeding steps and
modify PH. Above all, avoiding dwarf genes would be the simplest and fastest
way to influence PH by using MAS (Alheit et al., 2014; Kalih et al., 2014). MAS is
one opportunity, but it ignores the effect of small and intermediate QTL
(Bernardo, 2008; Heffner et al., 2009). Therefore, genomic selection (GS) is
suggested as an extension of MAS (Meuwissen et al., 2001). One study in rye
pointed out, that GS is superior to MAS in selection of closely related candidates
to the evaluated plant material (Wang et al., 2014a). Therefore, work has to be
done to improve the accuracy of genotypic information and the application within
Page 43
General discussion
43
modern breeding programs. Whether or not these results lead to a paradigm shift
in modern plant breeding programs, it is possible to increase DMY for modern
hybrid rye varieties. Therefore, breeders have to concentrate on taller plants with
a stronger focus on lodging resistance. In other crops already different phenotypic
traits and also QTL were described to improve lodging resistance without
decreasing PH (see chapter 5.1).
We showed that modern hybrid rye varieties are already stable over a wide range
of different environments differing in climatic and soil conditions. Managed-
drought stress trials showed high correlations between irrigated and rainfed
conditions for all genotypes and agronomic traits. Significant yield reduction
occurred in most environments. We observed yield reductions up to 40% between
both water regimes, but only a few environments showed a significant G x I
interaction. Drought tolerance is one the most important traits in modern
breeding programs and should be included in their selection process. It is possible
that our drought stress was not intense enough (Blum, 2005a) or rye is already
drought tolerant (Hübner et al., 2013; see section III). Nevertheless, it will be
essential to test modern hybrid rye varieties for drought tolerance as extreme
weather events will have a stronger influence on our cultivated crops in the
future (Ciais et al., 2005). Therefore we have to increase drought stress in field
trials and discover when drought stress has the highest influence on grain and
biomass yield. Currently, drought stress does not occur regularly or for long
periods of time, but concentrating on high yielding and highly stable genotypes
under these conditions will be important for future varieties. Generally,
genotypes showed no difference between both water regimes, but it would be
useful to include managed-drought stress trials in modern breeding programs to
test advanced candidates under both regimes to confirm their above average
yield. With modern breeding material, selection for highly stable genotypes for a
wide range of environments is possible and should be carried out to achieve
favourable high yielding varieties for GY and DMY.
It is important to specify and combine phenotypic and genotypic data for a better
understanding of mechanisms that are responsible for high yields and stability in
Page 44
General discussion
44
hybrid rye. We have to improve and specify two factors: on one hand the
collection of phenotypic data and, on the other hand the effective use of genetic
markers and their genotypic information. First, phenotypic data collection should
become more precise. Collection of phenotypic data has reached a new level with
the introduction of phenotyping platforms where a multiplicity of data can be
collected at once. Phenotyping platforms may be a promising tool for increasing
the accuracy of phenotypic data. A new tractor-pulled multi-sensor phenotyping
platform for small grain cereals allows the observation of various agronomic
traits, such as plant moisture content, lodging, tiller density or biomass yield
(Busemeyer et al., 2013) and provides a great opportunity for applying non-
destructive phenotyping for crop improvement and plant genetic studies.
Secondly, the quantity and quality of genotypic data in rye has to be improved.
Marker technologies have become faster and cheaper and gaining in importance
as well as applicability in all plant breeding programs. For most of the major
crops more sophisticated and complex methods (e.g. genomic selection, novel
transgenics), are being developed and increasingly introduced into commercial
breeding programs. Although large numbers of genetic markers are now
available for most of the main cereal crops (e.g. a rice already 44k SNP chip
(Zhao et al., 2011), a maize 600k SNP (Unterseer et al., 2014) and a wheat 90k
SNP chip (Wang et al., 2014b) already exist), only a 5k SNP chip for rye is
currently available (Haseneyer et al., 2011) and a 20k SNP will soon be available
(Bauer, pers. commun.). For rice and maize a 700k SNP chip will be introduced
soon. Another opportunity would be genotyping by sequencing (GBS), which is a
cost-efficient, technically simple, and highly multiplex-able method feasible for
high diversity and large genome species. The method is used to reduce genome
complexity with restriction enzymes. Fragments of specific size are sequenced
and representing a part of the whole genome. Due to the reduction of the genome
more individuals can be sequenced together. GBS will facilitate the use of
genomic-assisted breeding on novel germplasm without developing prior
molecular tools and determining population structure even in the absence of a
reference genome (Elshire et al., 2011; Poland et al., 2012).
Page 45
General discussion
45
Our results for different QTL under irrigated and rainfed conditions give a hint
that different genes are expressed under different environments. Up to now we
are far behind in understanding the mechanisms, which are exploited under
different water regimes. Therefore, we have to concentrate on traits in detail and
plant physiological aspects in order to specify single and complex plant
mechanisms under different drought conditions. Out of it we can define key
traits, which play an important role in drought tolerance mechanisms (Cooper et
al., 2014). In consideration of these aspects the genotypic information by markers
should be enlarged in order to perform accurate genetic evaluation of plant
material for selection in all stages of the breeding program (Cooper et al., 2014).
These points will lead to high and stable yielding varieties and will contribute to
enhance food production in our agricultural systems.
Page 46
Summary
46
6. Summary
Rye is an important crop in Northern and Eastern Europe and mainly used for
food and feed and became most recently important for biogas production. Hybrid
rye varieties dominate the cultivated area, which is mainly on light and sandy
soils, because rye has a relatively high tolerance to biotic and abiotic stress
factors. Climate change will also affect Central Europe, causing higher
temperatures and less precipitation in spring and summer. Rye will be influenced
more by these effects than other cereals because it is mainly grown on marginal
environments.
Rye has a high potential for being used as a biogas substrate, but detailed
information on improving this trait in hybrid rye is missing. Until now, no study
that analyzed phenotypic and genotypic agronomic traits for using rye for biogas
production exists. Further, there is only one study, which dealt with the influence
of periodic drought stress in rye cultivated areas. Beside this, we analyzed yield
stability over a wide range of environments in consideration of drought stress in
Central Europe.
We analyzed an interpool hybrid population (Pop-D) in 2011 and 2012 at seven
environments in Germany for the biomass yield and grain yield (Publication I).
This study showed low correlations between grain yield and dry matter yield
(r = 0.33). Higher correlations were obtained with two plant height
measurements (at heading time, r = 0.64; before harvest, r = 0.52) and dry matter
yield. The indirect selection via plant height was superior in contrast to the direct
selection of dry matter yield by factor 1.24. Genotypic results confirmed
phenotypic results as no overlapping QTL for grain yield and dry matter yield
were detected (Publication II). However, we identified common gene regions for
plant height and dry matter yield due to the high correlation between both. Plant
height is a promising trait for indirectly selecting high biomass yielding varieties.
The paradigm shift from shorter plants with high grain yield to taller hybrids as
a resource for biogas substrate needs additional breeding efforts for lodging
resistance.
In Publication III we analyzed two intrapool populations (Pop-A and -B) and one
interpool population (Pop-C) at 16 – 18 environments (location x year
Page 47
Summary
47
combinations) under irrigated and rainfed conditions in Germany and Poland.
Yield stability was high over a wide range of environments, even when drought
stress environments were included. This illustrates the adaption of rye to
marginal and drought stress environments. The analyzed populations showed no
differences within yield stability, but yield differences between inter- (Pop-C) and
intra-pool (Pop-A and -B) crosses were visible. Selection for yield stability is
possible due to the genetic variance for this trait within all three populations.
Therefore, it is important to select genotypes with low genotype x environment
interaction. All three populations showed high yield stability on a high yield level
and were already well adapted to extreme weather events caused by climate
change. It is recommended to use highly diverse environments with irrigated and
rainfed conditions to select on yield stability and high yielding varieties under
optimum and drought conditions.
Page 48
Zusammenfassung
48
7. Zusammenfassung
Roggen ist eine Kulturart des nord- und osteuropäischen Raumes und neben
seiner Hauptnutzung als Brot- und Futtergetreide wird Roggen auch zunehmend
zur Biogasproduktion verwendet. Hybridsorten dominieren den Anbau, der meist
auf leichten und sandigen Böden erfolgt, da Roggen biotischen und abiotischen
Stress besser als andere Kulturarten toleriert. Durch den weltweiten
Klimawandel ist auch Zentraleuropa von zunehmenden Wetterextrema betroffen,
die höhere Temperaturen und weniger Niederschlag im Frühjahr und Sommer
hervorrufen, Roggen wird von diesem Einfluss stärker als andere Kulturarten
betroffen sein, da der Anbau meist auf marginalen Böden erfolgt.
Roggen weist ein hohes Potential zur bioenergetischen Nutzung auf, allerdings
existiert bisher keine Studie, die phänotypische und genotypische Parameter zur
Nutzung von Roggen zur Biogasproduktion näher untersucht hat. Ebenso gibt es
bisher nur eine Studie, die sich genauer mit dem periodischen Einfluss von
Trockenstress auf den Roggenanbau befasst hat. Daher untersuchten wir die
Ertragsstabilität über eine Vielzahl an Umwelten in Zentraleuropa unter der
Berücksichtigung von reduziertem Wasserangebot.
Wir untersuchten eine Interpool-Population (Pop-D) in 2011 und 2012 in sieben
Umwelten in Deutschland auf ihre Biomasse- und Kornertragsleistung
(Publikation I). Die Korrelation zwischen Kornertrag und Trockenmasseertrag
mit r = 0.33 war gering. Höhere Korrelationen wurden zwischen zwei
Wuchshöhemessungen zum Zeitpunkt des Ährenschiebens (r = 0.64) und der
Abreife (r = 0.52) und dem Trockenmasseertrag bestimmt. Die indirekte
Selektion auf Wuchshöhe war der direkten Selektion auf Trockenmasseertrag
relativ um den Faktor 1,24 überlegen.
Die genetische Architektur dieser Merkmale untermauerte die phänotypisch
dargestellten Ergebnisse (Publikation II). Wir identifizierten Quantitative-Trait
Loci (QTL), die für die Ausprägung der Wuchshöhe und der Trockenmasse
verantwortlich sind, wobei es keine Übereinstimmungen zwischen Trockenmasse
und Kornertrag gab. Das Merkmal Wuchshöhe eignet sich besonders für eine
indirekte Selektion auf biomassestarke Typen. Der damit verbundene
Paradigmenwechsel von kürzeren und standfesten Hochertragssorten für den
Page 49
Zusammenfassung
49
Kornertrag hin zu wuchsstarken Hybriden für die Biogasproduktion muss aber
mit einem verstärkten Focus auf Standfestigkeit einhergehen.
In Publikation III wurden zwei Intrapool-Populationen (Pop-A und -B) und eine
Interpool-Kreuzung (Pop-C) an insgesamt 16 – 18 Umwelten (Ort x Jahr
Kombinationen) in Deutschland und Polen unter bewässerten und
unbewässerten (regenabhängigen) Bedingungen analysiert.
Die Ertragsstabilität der Hybriden über die Vielzahl an Umwelten war hoch,
sogar wenn Trockenstressumwelten in die Analyse einflossen. Dies verdeutlichte
die Anpassung von Roggen an marginale und Trockenstressumwelten. Zwischen
den untersuchten Populationen gab es dabei keine Unterschiede in der
Ertragsstabilität, allerdings zeigte sich der Ertragsunterschied zwischen der
Interpool-Kreuzungen (Pop-C) und den Intrapool-Kreuzungen (Pop-A und Pop-B).
Züchterisch kann in dem untersuchten Elitematerial allerdings noch auf
Ertragsstabilität selektiert werden, da beim Kornertrag innerhalb der
Populationen eine genetische Variation vorhanden ist. Für die weitere Züchtung
ist es daher wichtig Genotypen mit einer geringen Genotyp x Umwelt Interaktion
zu selektieren. Insgesamt zeigten die drei untersuchten Populationen bereits eine
hohe Ertragsstabilität auf einem hohen Ertragsniveau und sind an
Wetterextreme, die durch den Klimawandel häufiger auftreten angepasst. Es
wird vorgeschlagen in Zukunft unterschiedliche Umwelten mit bewässerten und
unbewässerten Bedingungen zu kombinieren, um auf Ertragsstabilität und
Hochertragstypen unter optimalen und Trockenstressbedingungen zu
selektieren.
Page 50
References
50
8. References
Adams, M.W., and D.B. Shank. 1959. The relationship of heterozygosity to
homeostasis in maize hybrids. Genetics 44: 777–786.
Alheit, K. V, L. Busemeyer, W. Liu, H.P. Maurer, M. Gowda, V. Hahn, S.
Weissmann, A. Ruckelshausen, J.C. Reif, and T. Würschum. 2014. Multiple-
line cross QTL mapping for biomass yield and plant height in triticale (×
Triticosecale Wittmack). Theor. Appl. Genet. 127: 251–260.
Allard, R.W. 1961. Relationship between genetic diversity and consistency of
performance in different environments. Crop Sci. 1: 127–133.
Amon, T., B. Amon, V. Kryvoruchko, A. Machmu, K. Hopfner-sixt, V. Bodiroza,
and R. Hrbek. 2007. Methane production through anaerobic digestion of
various energy crops grown in sustainable crop rotations. Bioresour. Technol.
98: 3204–3212.
Atlin, G.N., R.J. Baker, K.B. Mcrae, and X. Lu. 2000. Selection response in
subdivided target regions. Crop Sci. 40: 7–13.
Baum, M., S. Grando, G. Backes, A. Jahoor, A. Sabbagh, and S. Ceccarelli. 2003.
QTLs for agronomic traits in the Mediterranean environment identified in
recombinant inbred lines of the cross “Arta” x H. spontaneum 41-1. Theor.
Appl. Genet. 107: 1215–1225.
Becker, H.C. 1987. Zur Heritabilität statistischer Maßzahlen für die
Ertragssicherheit. Vor. zur Pflanzenzüchtung 12: 134–144.
Becker, H.C., H.H. Geiger, and K. Morgenstern. 1982. Performance and
phenotypic stability of different hybrid types in winter rye. Crop Sci. 22: 340–
344.
Becker, H.C., and J. Leon. 1988. Stability analysis in plant breeding. Plant
Breed. 101: 1–23.
Bernardo, R. 2008. Molecular markers and selection for complex traits in plants:
Learning from the last 20 years. Crop Sci. 48: 1649–1664.
Bernier, J., A. Kumar, V. Ramaiah, D. Spaner, and G. Atlin. 2007. A large-effect
QTL for grain yield under reproductive-stage drought stress in upland rice.
Crop Sci. 47: 507–518.
Bernier, J., R. Serraj, A. Kumar, R. Venuprasad, S. Impa, R. P. Verresh Gowda,
R. Oane, D. Spaner, and G. Atlin. 2009. The large-effect drought-resistance
QTL qtl12.1 increases water uptake in upland rice. F. Crop. Res. 110: 139–
146.
Page 51
References
51
Blum, A. 2005. Drought resistance, water-use efficiency, and yield potential —
are they compatible, dissonant, or mutually exclusive? Aust. J. Agric. Res.
56: 1159–1168.
Blum, A. 2009. Effective use of water (EUW) and not water-use efficiency (WUE)
is the target of crop yield improvement under drought stress. F. Crop. Res.
112: 119–123.
Bolanos, J., and G.O. Edmeades. 1993a. Eight cycles of selection for drought
tolerance in lowland tropical maize. II. Responses in reproductive behavior.
F. Crop. Res. 31: 253–268.
Bolanos, J., and G.O. Edmeades. 1993b. Eight cycles of selection for drought
tolerance in lowland tropical maize. I. Responses in grain yield , biomass ,
and radiation utilization. F. Crop. Res. 31: 233–252.
Bolanos, J., and G.O. Edmeades. 1996. The importance of the anthesis-silking
interval in breeding for drought tolerance in tropical maize. F. Crop. Res. 48:
65–80.
Bolibok, H., A. Gruszczyńska, A. Hromada-Judycka, and M. Rakoczy-
Trojanowska. 2007. The identification of QTLs associated with the in vitro
response of rye (Secale cereale L.). Cell. Mol. Biol. Lett. 12: 523–35.
Börner, A., V. Korzun, A.V. Voylokow, and W.E. Weber. 1999. Detection of
quantitative trait loci on chromosome 5R of rye (Secale cereale L.). Theor.
Appl. Genet. 98: 1087–1090.
Börner, A., V. Korzun, A.V. Voylokow, A.J. Worland, and W.E. Weber. 2000.
Genetic mapping of quantitative trait loci in rye (Secale cereale L.).
Euphytica 116: 203–209.
Boros, D. 2007. Quality aspects of rye for feed purposes. Vor. zur
Pflanzenzüchtung: 80–85.
Boukerrou, L., and D.C. Rasmusson. 1990. Breeding for high biomass yield in
spring barley. Crop Sci. 30: 31–35.
Bunce, J.A. 2010. Leaf transpiration efficiency of some drought-resistant maize
lines. Crop Sci. 50: 1409–1413.
Busemeyer, L., D. Mentrup, K. Möller, E. Wunder, K. Alheit, V. Hahn, H.P.
Maurer, J.C. Reif, T. Würschum, J. Müller, F. Rahe, and A. Ruckelshausen.
2013. BreedVision-a multi-sensor platform for non-destructive field-based
phenotyping in plant breeding. Sensors 13: 2830–2847.
Campos, H., M. Cooper, G.O. Edmeades, C. Loffler, J.R. Schussler, and M.
Ibanez. 2006. Changes in drought tolerance in maize associated with fifty
years of breeding for yield in the US Corn Belt. Maydica 51: 369-381.
Page 52
References
52
Campos, H., M. Cooper, J.E. Habben, G.O. Edmeades, and J.R. Schussler. 2004.
Improving drought tolerance in maize: a view from industry. F. Crop. Res.
90: 19–34.
Cao, G., J. Zhu, C. He, Y. Gao, J. Yan, and P. Wu. 2001. Impact of epistasis and
QTL×environment interaction on the developmental behavior of plant height
in rice (Oryza sativa L.). Theor. Appl. Genet. 103: 153–160.
Cattivelli, L., F. Rizza, F.W. Badeck, E. Mazzucotelli, A.M. Mastrangelo, E.
Francia, C. Mare, A. Tondelli, and A.M. Stanca. 2008. Drought tolerance
improvement in crop plants: An integrated view from breeding to genomics.
F. Crop. Res. 105: 1–14.
Ceccarelli, S. 1989. Wide adaptation: How wide? Euphytica 40: 197–205.
Ceccarelli, S., E. Acevedo, and S. Grando. 1991. Breeding for yield stability in
unpredictable environments: single traits, interaction between traits, and
architecture of genotypes. Euphytica 56: 169–185.
Ceccarelli, S., and S. Grando. 1991. Selection environment and environmental
sensitivity in barley. Euphytica 57: 157–167.
Ceccarelli, S., and S. Grando. 1996. Drought as a challenge for the plant breeder.
Plant Growth Regul. 20: 149–155.
Ceccarelli, S., S. Grando, and M. Baum. 2007. Participatory plant breeding in
water-limited environments. Exp. Agric. 43: 411–435.
Chandler, P.M., and C.A. Harding. 2013. “Overgrowth” mutants in barley and
wheat: new alleles and phenotypes of the “Green Revolution” DELLA gene. J.
Exp. Bot. 64: 1603–1613.
Changhai, S., D. Baodi, Q. Yunzhou, L. Yuxin, S. Lei, L. Mengyu, and L. Haipei.
2010. Physiological regulation of high transpiration efficiency in winter
wheat under drought conditions. Plant Soil Environ. 56: 340–347.
Chapman, S.C., J. Crossa, and G.O. Edmeades. 1997. Genotype by environment
effects and selection for drought tolerance in tropical maize. I. Two mode
pattern analysis of yield. Euphytica 95: 1–9.
Churchill, G.A., and R.W. Doerge. 1994. Empirical threshold values for
quantitative trait mapping. Genetics 1: 963–971.
Ciais, P., M. Reichstein, N. Viovy, A. Granier, J. Ogée, V. Allard, M. Aubinet, N.
Buchmann, C. Bernhofer, A. Carrara, F. Chevallier, N. De Noblet, A. D.
Friend, P. Friedlingstein, T. Grünwald, B. Heinesch, P. Keronen, A. Knohl,
G. Krinner, D. Loustau, G. Manca, G. Matteucci, F. Miglietta, J.M. Ourcival,
D. Papale, K. Pilegaard, S. Rambal, G. Seufert, J.F. Soussana, M.J. Sanz,
E.D. Schulze, T. Vesala, and R. Valentini. 2005. Europe-wide reduction in
Page 53
References
53
primary productivity caused by the heat and drought in 2003. Nature 437:
529–533.
Cochran, W.G., and G.M. Cox. 1957. Experimental Design. 2nd ed. Wiley, New
York.
Cooper, M., C.D. Messina, D. Podlich, L.R. Totir, A. Baumgarten, N.J.
Hausmann, D. Wright, and G. Graham. 2014. Predicting the future of plant
breeding: Complementing empirical evaluation with genetic prediction. Crop
Pasture Sci. 65: 311–336.
Crossa, J. 1990. Statistical analysis of multilocation trials (NC Brady, Ed.). Adv.
Agron. 44: 55–85.
Deutscher Wetterdienst (DWD). 2014. Available at
http://www.dwd.de/bvbw/appmanager/bvbw/dwdwwwDesktop?_nfpb=true&_
pageLabel=_dwdwww_klima_umwelt_klimadaten_deutschland&T82002gsb
DocumentPath=Navigation%2FOeffentlichkeit%2FKlima__Umwelt%2FKlim
adaten%2Fkldaten__kostenfrei%2Fdaten__gebietsmittel__node.html%3F__n
nn%3Dtrue. Accessed 14 Dec. 2014.
Deutsches Maiskomitee e.V. (DMK). 2014. Available at
http://www.maiskomitee.de/web/intranetNews.aspx. Accessed 14 Dec. 2014.
DWD. 2011. Drought conditions in Europe 2011. Issued by WMO RA VI Pilot Rcc
on Climate Monitoring, Lead Centre DWD, Offenbach, Germany.
DWD. 2014. Klimawandel - Aktuelles. Available at
http://www.dwd.de/klimawandel. Accessed 14 Dec. 2014.
Eberhart, S.A., and W.A. Russell. 1966. Stability parameters for comparing
varieties. Crop Sci. 6: 36–40.
ECOPORT Database, Secale cereale. 2002. Available at
http://ecoport.org/ep?Plant=1929&entityType=PL****&entityDisplayCategor
y=full. Accessed 7 Oct. 2013.
Edmeades, G.O., J. Bolanos, S.C. Chapman, H.R. Lafitte, and M. Banziger. 1999.
Selection improves drought tolerance in tropical maize populations: I. Gains
in biomass, grain yield, and harvest index. Crop Sci. 39: 1306-1315.
Elshire, R.J., J.C. Glaubitz, Q. Sun, J. a Poland, K. Kawamoto, E.S. Buckler, and
S.E. Mitchell. 2011. A robust, simple genotyping-by-sequencing (GBS)
approach for high diversity species. PLoS One 6: e19379.
Esechie, H.A., J.W. Maranville, and W.M. Ross. 1977. Relationship of stalk
morphology and chemical composition to lodging resistance in sorghum. Crop
Sci. 17: 609–612.
Page 54
References
54
European Commission. 2008. Directive of the European parliament and of the
council on the promotion of the use of energy from renewable sources.
Available at
http://ec.europa.eu/energy/climate_actions/doc/2008_res_directive_en.pdf.
Accessed 14 Dec. 2014.
Fachagentur Nachwachsende Rohstoffe e.V. 2013. Available at
http://mediathek.fnr.de/grafiken/daten-und-
fakten/bioenergie/biogas/massebezogener-substrateinsatz-nachwachsender-
rohstoffe-in-biogasanlagen.html.
Falconer, D.S. 1989. Introduction to Quantitative Genetics. 3rd ed. Longman
Scienticif and Technical, New York.
Falke, K.C., Z. Susić, P. Wilde, H. Wortmann, J. Möhring, H.-P. Piepho, H.H.
Geiger, and T. Miedaner. 2009a. Testcross performance of rye introgression
lines developed by marker-assisted backcrossing using an Iranian accession
as donor. Theor. Appl. Genet. 118: 1225–1238.
Falke, K.C., P. Wilde, H. Wortmann, H.H. Geiger, and T. Miedaner. 2009b.
Identification of genomic regions carrying QTL for agronomic and quality
traits in rye (Secale cereale L.) introgression libraries. Plant Breed. 128:
615–623.
FAO. 2014. Available at http://faostat3.fao.org/faostat-
gateway/go/to/download/Q/QC/E. Accessed 01 Aug. 2014.
FAOSTAT Database. 2013. Available at
http://faostat.fao.org/site/567/DesktopDefault.aspx?PageID=567#ancor.Acces
sed 7 Oct. 2013.
Fay, P.A., J.D. Carlisle, A.K. Knapp, J.M. Blair, and S.L. Collins. 2000. Altering
rainfall timing and quantity in a mesic grassland ecosystem: Design and
performance of rainfall manipulation shelters. Ecosystems 3: 308–319.
Fehr, W.R. 1987. Heritability. p. 95–105. In Fehr, W.R. (ed.), Principles of
cultivar development. Volume 1. Theory and technique, Macmillan, New
York.
Finlay, K.W., and G.N. Wilkinson. 1963. The analysis of adaptation in a plant-
breeding programme. Aust. J. Agric. Res. 14: 742–754.
Fischer, R.A. 1921. On the “probable error” of a coefficient of correlation deduced
from a small sample. Metron 1: 1–32.
Fischer, R.A., and R. Maurer. 1978. Drought resistance in spring wheat cultivars.
I. Grain yield responses. Aust. J. Agric. Res. 29: 897–912.
Page 55
References
55
Fischer, R.A., and M. Sanchez. 1979. Drought resistance in spring wheat
cultivars. II. Effects on plant water relations. Aust. J. Agric. Res. 30: 801–
814.
Fischer, R.A., and J.T. Wood. 1979. Drought resistance in spring wheat cultivars.
III. Yield associations with morpho-physiological traits. Aust. J. Agric. Res.
30: 1001–1020.
Fleury, D., S. Jefferies, H. Kuchel, and P. Langridge. 2010. Genetic and genomic
tools to improve drought tolerance in wheat. J. Exp. Bot. 61: 3211–3222.
Frey, K.J., and U. Maldonado. 1967. Relative productivity of homogeneous and
heterogeneous oat cultivars in optimum and suboptimum environments.
Crop Sci. 7: 532–535.
Geiger, H.H., and T. Miedaner. 1999. Hybrid rye and heterosis. p. 439–450. In
Coors, J.G., Pandey, S. (eds.), The Genetics and Exploitation of Heterosis in
Crops. Crop Science Society of America, Madison.
Geiger, H.H., and T. Miedaner. 2009. Rye Breeding. p. 157–181. In Carena, M.J.
(ed.), Cereals (Handbook of Plant Breeding Vol. 3). Springer, New York.
Golabadi, M., A. Arzani, S.A.M. Mirmohammadi Maibody, B.E. Sayed
Tabatabaei, and S.A. Mohammadi. 2011. Identification of microsatellite
markers linked with yield components under drought stress at terminal
growth stages in durum wheat. Euphytica 177: 207–221.
Gonçalves, P. de S., M.L. Teixeira de Moraes, L.R. Lima Gouvea, A.T. da Eira
Aguiar, and E.J. Scallopi Júnior. 2008. Temporal stability for unpredictable
annual climatic variability for hevea genotype selection. Brazil Arch. Biol.
Technol. 51: 11–18.
Gowda, M., V. Hahn, J.C. Reif, C.F.H. Longin, K. Alheit, and H.P. Maurer. 2011.
Potential for simultaneous improvement of grain and biomass yield in
Central European winter triticale germplasm. F. Crop. Res. 121: 153–157.
Grieder, C., B.S. Dhillon, W. Schipprack, and A.E. Melchinger. 2012a. Breeding
maize as biogas substrate in Central Europe: II. Quantitative-genetic
parameters for inbred lines and correlations with testcross performance.
Theor. Appl. Genet. 124: 981–988.
Grieder, C., B.S. Dhillon, W. Schipprack, and A.E. Melchinger. 2012b. Breeding
maize as biogas substrate in Central Europe: I. Quantitative-genetic
parameters for testcross performance. Theor. Appl. Genet. 124: 971–980.
Haffke, S., B. Kusterer, F.J. Fromme, S. Roux, B. Hackauf, and T. Miedaner.
2014. Analysis of covariation of grain yield and dry matter yield for breeding
dual use hybrid rye. Bioenergy Res. 7: 424-429.
Page 56
References
56
Harrer, S., Utz, H.F. 1990. Modellstudie zur Züchtung von Low-Input-Sorten am
Beispiel des Maises. Arbeitstagung der “Arbeitsgemeinschaft der
Saatzuchtleiter innerhalb der Vereinigung der österreichischer
Pflanzenzüchter” Gumpenstein, Österreich, 20-22 November. Pp. 9–19
Haseneyer, G., T. Schmutzer, M. Seidel, R. Zhou, M. Mascher, C.-C. Schön, S.
Taudien, U. Scholz, N. Stein, K.F. Mayer, and E. Bauer. 2011. From RNA-
seq to large-scale genotyping - genomics resources for rye (Secale cereale L.).
BMC Plant Biol. 11: 131–134.
Haussmann, B.I.G., H.K. Parzies, T. Presterl, Z. Susic, and T. Miedaner. 2004.
Plant genetic resources in crop improvement. Plant Genet. Resour 2: 3–21.
Heffner, E.L., M.E. Sorrells, and J.-L. Jannink. 2009. Genomic selection for crop
improvement. Crop Sci. 49: 1–12.
Hoffmann, B. 2008. Alteration of drought tolerance of winter wheat caused by
translocation of rye chromosome segment 1RS. Cereal Res. Commun. 36:
269–278.
Hübner, M. 2013. Dissertation: Phenotypic and molecular analyses of grain and
biomass productivity under irrigated and rainfed conditions in hybrid rye.
Institute of Plant Breeding, Seed Science and Population Genetics,
University of Hohenheim, Germany
Hübner, M., H. Oechsner, S. Koch, A. Seggl, H. Hrenn, B. Schmiedchen, P. Wilde,
and T. Miedaner. 2011. Impact of genotype, harvest time and chemical
composition on methane yield of winter rye for biogas production. Biomass
and Bioenergy 35: 4316–4323.
Hübner, M., P. Wilde, B. Schmiedchen, P. Dopierala, M. Gowda, J.C. Reif, and T.
Miedaner. 2013. Hybrid rye performance under natural drought stress in
Europe. Theor. Appl. Genet. 126: 475–482.
Jørgensen, J.R., L.C. Deleuran, and B. Wollenweber. 2007. Prospects of whole
grain crops of wheat, rye and triticale under different fertilizer regimes for
energy production. Biomass and Bioenergy 31: 308–317.
Kalih, R., H.P. Maurer, B. Hackauf, and T. Miedaner. 2014. Effect of a rye
dwarfing gene on plant height, heading stage, and Fusarium head blight in
triticale (×Triticosecale Wittmack). Theor. Appl. Genet. 127: 1527–1536.
Kang, M.S., and R. Magari. 1996. New developments in selecting for phenotypic
stability in crop breeding. p. 1–14. In Gauch, H.G., Kang, M.S. (eds.),
Genotype-by-Environment Interaction. CRC Press, Inc., Boca Raton, FL.
Kashiwagi, T., and K. Ishimaru. 2004. Identification and functional analysis of a
locus for improvement of lodging resistance in rice. Plant Physiol. 134: 676–
683.
Page 57
References
57
Keim, D.L., and W.E. Kronstad. 1981. Drought response of winter wheat
cultivars grown under field stress conditions. Crop Sci. 21: 11–15.
Keller, M., C. Karutz, J.E. Schmid, P. Stamp, M. Winzeler, B. Keller, and M.M.
Messmer. 1999. Quantitative trait loci for lodging resistance in a segregating
wheat x spelt population. Theor. Appl. Genet. 98: 1171–1182.
Kirigwi, F.M., M. Ginkel, G. Brown-Guedira, B.S. Gill, G.M. Paulsen, and a. K.
Fritz. 2007. Markers associated with a QTL for grain yield in wheat under
drought. Mol. Breed. 20: 401–413.
Von Korff, M., S. Grando, A. Del Greco, D. This, M. Baum, and S. Ceccarelli.
2008. Quantitative trait loci associated with adaptation to Mediterranean
dryland conditions in barley. Theor. Appl. Genet. 117: 653–669.
Korzun, V. 1996. RFLP mapping of the dwarfing (Ddw1) and hairy peduncle (Hp)
genes on chromosome 5 of rye (Secale cereale L.). Theor. Appl. Genet. 92:
1073–1077.
Korzun, V., M.S. Röder, M.W. Ganal, a. J. Worland, and C.N. Law. 1998. Genetic
analysis of the dwarfing gene ( Rht8 ) in wheat. Part I. Molecular mapping of
Rht8 on the short arm of chromosome 2D of bread wheat (Triticum aestivum
L.). Theor. Appl. Genet. 96: 1104–1109.
Kosambi, D.D. 1943. The estimation of mapp distances from recombination
values. Ann. Eugen. 12: 172–175.
Laidig, F., T. Drobek, and U. Meyer. 2008. Genotypic and environmental
variability of yield for cultivars from 30 different crops in German official
variety trials. Plant Breed. 127: 541–547.
Leilah, A.A., and S.A. Al-Khateeb. 2005. Statistical analysis of wheat yield under
drought conditions. J. Arid Environ. 61: 483–496.
Levi, A., A.H. Paterson, V. Barak, D. Yakir, B. Wang, P.W. Chee, and Y. Saranga.
2009. Field evaluation of cotton near-isogenic lines introgressed with QTLs
for productivity and drought related traits. Mol. Breed. 23: 179–195.
Lewis, D. 1954. Gene-environment interaction: A relationship between
dominance, heterosis, phenotypic stability and variability. Heredity (Edinb).
8: 333–356.
Lin, C. S., Binns, M. R., Lefkovitch, L.P. 1986. Stability analysis: Where do we
stand? Crop Sci. 26: 894-900.
Lübberstedt, T., A.E. Melchinger, C.C. Schon, H.F. Utz, and D. Klein. 1997. QTL
mapping in testcrosses of euorpean flint lines of maize: I. Comparison of
different testers for forage yield traits. Crop Sci. 37: 921–931.
Page 58
References
58
Maccaferri, M., P. Mantovani, R. Tuberosa, E. DeAmbrogio, S. Giuliani, A.
Demontis, A. Massi, and M. Sanguineti. 2008. A major QTL for durable leaf
rust resistance widely exploited in durum wheat breeding programs maps on
the distal region of chromosome arm 7BL. Theor. Appl. Genet. 117: 1225–
1240.
Maclean, E.J.L., D.C. Dawe, B. Hardy, and G.P. Hettel. 2002. Rice Almanac. 3rd
ed. CABI Publishing, Wallingford.
Masojć, P., and P. Milczarski. 2005. Mapping QTLs for alpha-amylase activity in
rye grain. J. Appl. Genet. 46: 115–123.
Masojć, P., and P. Milczarski. 2008. Relationship between QTLs for preharvest
sprouting and alpha-amylase activity in rye grain. Mol. Breed. 23: 75–84.
Messmer, R., Y. Fracheboud, M. Bänziger, P. Stamp, and J.-M. Ribaut. 2011.
Drought stress and tropical maize: QTLs for leaf greenness, plant
senescence, and root capacitance. F. Crop. Res. 124: 93–103.
Messmer, R., Y. Fracheboud, M. Bänziger, M. Vargas, P. Stamp, and J.-M.
Ribaut. 2009. Drought stress and tropical maize: QTL-by-environment
interactions and stability of QTLs across environments for yield components
and secondary traits. Theor. Appl. Genet. 119: 913–930.
Meuwissen, T.. H.E., B.J. Hayes, and M.E. Goddard. 2001. Prediction of total
genetic value using genome-wide dense marker maps. Genecits 157: 1819–
1829.
Miedaner, T., M. Hübner, S. Koch, A. Seggl, and P. Wilde. 2010. Biomass yield of
self-incompatible germplasm resources and their testcrosses in winter rye.
Plant Breed. 129: 369–375.
Miedaner, T., M. Hübner, V. Korzun, B. Schmiedchen, E. Bauer, G. Haseneyer, P.
Wilde, and J.C. Reif. 2012a. Genetic architecture of complex agronomic traits
examined in two testcross populations of rye (Secale cereale L.). BMC
Genomics 13: 1–13.
Miedaner, T., S. Koch, A. Seggl, B. Schmiedchen, and P. Wilde. 2012b.
Quantitative genetic parameters for selection of biomass yield in hybrid rye.
Plant Breed. 131: 100–103.
Miedaner, T., B.U. Müller, H.-P. Piepho, and K.C. Falke. 2011. Genetic
architecture of plant height in winter rye introgression libraries. Plant
Breed. 130: 209–216.
Miedaner, T., D.D. Schwegler, P. Wilde, and J.C. Reif. 2014. Association between
line per se and testcross performance for eight agronomic and quality traits
in winter rye. Theor. Appl. Genet. 127: 33–41.
Page 59
References
59
Milczarski, P., H. Bolibok-Brągoszewska, B. Myśków, S. Stojałowski, K. Heller-
Uszyńska, M. Góralska, P. Brągoszewski, G. Uszyński, A. Kilian, and M.
Rakoczy-Trojanowska. 2011. A high density consensus map of rye (Secale cereale L.) based on DArT markers. PLoS One 6: e28495.
Mühleisen, J., H.-P. Piepho, H.P. Maurer, C.F.H. Longin, and J.C. Reif. 2014.
Yield stability of hybrids versus lines in wheat, barley, and triticale. Theor.
Appl. Genet. 127: 309–316.
Muller, A. 2008. Sustainable agriculture and the production of biomass for
energy use. Clim. Change 94: 319–331.
Murray, S.C., W.L. Rooney, S.E. Mitchell, A. Sharma, P.E. Klein, J.E. Mullet,
and S. Kresovich. 2008. Genetic improvement of sorghum as a biofuel
feedstock: II. QTL for stem and leaf structural carbohydrates. Crop Sci. 48:
2245–2253.
Murthy, B.N., and M. V. Rao. 1980. Evolving suitable index for lodging resistance
in barley. Indian J. Genet. Plant Breed. 40: 253–261.
N., N. 2012a. Besondere Ernte- und Qualitätsermittlung (BEE).
Bundesministerium für Ernährung, Landwirtschaft und Verbraucherschutz,
Bonn. http://berichte.bmelv-statistik.de/EQB-1002000-2012.pdf
N., N. 2012b. Beschreibende Sortenliste Getreide , Mais Öl- und Faserpflanzen
Leguminosen Rüben Zwischenfrüchte. Bundessortenamt. http://www.
bundessortenamt.de/internet30/index.php?id=23&L=0. Accessed 7 Oct. 2013.
N., N. 2001. Growth stages of mono-and dicotyledonous plants BBCH
Monograph. Fed. Biol. Res. Cent. Agric. For.. Available at
http://www.bba.de/veroeff/bbch/bbcheng.pdf.
Oehme, F. 1989. Untersuchungen zur Standfestigkeit bei Winterroggen. Arch.
Züchtungsforsch. 19: 407–414.
Oettler, G. 2005. The fortune of a botanical curiosity – Triticale: past, present
and future. J. Agric. Sci. 143: 329–346.
Van Oojen, J.W. 2006. JoinMap 4.1: Software for the calculation of genetic
linkage maps in experimental populations.Wageningen, Netherlands.
Oslaj, M., B. Mursec, and P. Vindis. 2010. Biogas production from maize hybrids.
Biomass and Bioenergy 34: 1538–1545.
Passioura, J.B. 1997. Drought and drought tolerance. p. 1–5. In Belhassen, E.
(ed.), Drought tolerance in higher plants: Genetical, physiological and
molecular biological analysis. Springer Netherlands.
Page 60
References
60
Phillips, S.L., and M.S. Wolfe. 2005. Evolutionary plant breeding for low input
systems. J. Agric. Sci. 143: 245–254.
Piepho, H.-P. 1998. Methods for comparing the yield stability of cropping systems
- a review. J. Agron. Crop Sci. 180: 193–213.
Piepho, H.P. 2000. Optimal marker density for interval mapping in a backcross
population. Heredity (Edinb). 84: 437–440.
Pinthus, M.J. 1967. Spread of the root system as indicator for evaluating lodging
resistance of wheat. Crop Sci. 7: 107–110.
Poland, J., J. Endelman, J. Dawson, J. Rutkoski, S. Wu, Y. Manes, S.
Dreisigacker, J. Crossa, H. Sánchez-Villeda, M. Sorrells, and J.-L. Jannink.
2012. Genomic selection in wheat breeding using genotyping-by-sequencing.
Plant Genome J. 5: 103–113.
Rajaram, S., H.-J. Braun, and M. van Ginkel. 1996. CIMMYT’s approach to breed
for drought tolerance. Euphytica 92: 147–153.
Reimann-Philipp, R. 1995. Breeding perennial rye. p. 265–292. In Janick, J. (ed.),
Plant breeding reviews. 13th ed. John Wiley & Sons, Inc, New York.
Reynolds, M.P., and M. Sawkins. 2005. Prospects for utilising plant-adaptive
mechanisms to improve wheat and other crops in drought- and salinity-prone
environments. Ann. Appl. Biol. 146: 239–259.
Ribaut, J.M., D.A. Hoisington, J.A. Deutsch, C. Jiang, and D. Gonzalez-de-Leon.
1996. Identification of quantitative trait loci under drought conditions in
tropical maize. 1. Flowering parameters and the anthesis-silking interval.
Theor. Appl. Genet. 92: 905–914.
Ribaut, J.-M., and M. Ragot. 2006. Marker-assisted selection to improve drought
adaptation in maize: the backcross approach, perspectives, limitations, and
alternatives. J. Exp. Bot. 58: 351–360.
Richards, R.A. 1996. Defining selection criteria to improve yield under drought.
Plant Growth Regul. 20: 157–166.
Rizza, F., F.W. Badeck, L. Cattivelli, O. Lidestri, N. Di Fonzo, and A.M. Stanca.
2004. Use of a water stress index to identify barley genotypes adapted to
rainfed and irrigated conditions. Crop Sci. 44: 2127–2137.
Romagosa, I., and P.N. Fox. 1993. Genotype x environment interaction and
adaption. p. 373–390. In Hayward, M.D., Bosemark, N.O., Romagosa, I.
(eds.), Plant Breeding: principles and prospects. Chapman & Hall, London.
Roux, S.R., and H. Wortmann. 2010. Züchterisches Potenzial von Roggen (Secale cereale L .) für die Biogaserzeugung. J. für Kult. 62: 173–182.
Page 61
References
61
Rowe, P.R., and R.H. Andrew. 1964. Phenotypic stability for a systematic series
of corn genotypes. Crop Sci. 4: 563–567.
Rustgi, S., M.N. Shafqat, N. Kumar, P.S. Baenziger, M.L. Ali, I. Dweikat, B.T.
Campbell, and K.S. Gill. 2013. Genetic dissection of yield and its component
traits using high-density composite map of wheat chromosome 3A: bridging
gaps between QTLs and underlying genes. PLoS One 8: e70526.
Sakamoto, T., and M. Matsuoka. 2004. Generating high-yielding varieties by
genetic manipulation of plant architecture. Curr. Opin. Biotechnol. 15: 144–
147.
Salas Fernandez, M.G., P.W. Becraft, Y. Yin, and T. Lübberstedt. 2009. From
dwarfs to giants? Plant height manipulation for biomass yield. Trends Plant
Sci. 14: 454–461.
Saleem, M. 2003. Response of durum and bread wheat genotypes to drought
stress: Biomass and yield components. Asian J. Plant Sci. 2: 209–293.
Salekdeh, G.H., M. Reynolds, J. Bennett, and J. Boyer. 2009. Conceptual
framework for drought phenotyping during molecular breeding. Trends Plant
Sci. 14: 488–496.
Schneider, K. a., M.E. Brothers, and J.D. Kelly. 1997a. Marker-assisted selection
to improve drought resistance in common bean. Crop Sci. 37: 51–60.
Schneider, K.A., R. Rosales-Serna, F. Ibarra-Perez, B. Cazares-Enriquez, J.A.
Acosta-Gallegos, P. Ramirez-Vallejo, N. Wassimi, and J.D. Kelly. 1997b.
Improving common bean performance under drought stress. Crop Sci. 37:
43–50.
Serraj, R., C.T. Hash, S.M.H. Rizvi, A. Sharma, R.S. Yadav, and F.R. Bidinger.
2005. Recent advances in marker-assisted selection for drought tolerance in
pearl millet. Plant Prod. Sci. 8: 334–337.
Shank, D.B., and M.W. Adams. 1960. Environmental variability within inbred
lines and single crosses of maize. J. Genet. 57: 119–126.
Stanca, A.M., G. Jenkins, and P.R. Hanson. 1979. Varietal responses in spring
barley to natural and artificial lodging and to a growth regulator. J. Agric.
Sci. 93: 449–457.
Steele, K.A., A.H. Price, H.E. Shashidhar, and J.R. Witcombe. 2006. Marker-
assisted selection to introgress rice QTLs controlling root traits into an
Indian upland rice variety. Theor. Appl. Genet. 112: 208–221.
Steele, K.A., D.S. Virk, R. Kumar, S.C. Prasad, and J.R. Witcombe. 2007. Field
evaluation of upland rice lines selected for QTLs controlling root traits. F.
Crop. Res. 101: 180–186.
Page 62
References
62
Strigens, A., C. Grieder, B.I.G. Haussmann, and A.E. Melchinger. 2012. Genetic
variation among inbred lines and testcrosses of maize for early growth
parameters and their relationship to final dry matter yield. Crop Sci. 52:
1084-1092.
Talamè, V., M.C. Sanguineti, E. Chiapparino, H. Bahri, M. Ben Salem, B.P.
Forster, R.P. Ellis, S. Rhouma, W. Zoumarou, R. Waugh, and R. Tuberosa.
2004. Identification of Hordeum spontaneum QTL alleles improving field
performance of barley grown under rainfed conditions. Ann. Appl. Biol. 144:
309–319.
Teulat, B., O. Merah, I. Souyris, and D. This. 2001. QTLs for agronomic traits
from a Mediterranean barley progeny grown in several environments. Theor.
Appl. Genet. 103: 774–787.
Thomas, S. Fukai, and G.L. Hammer. 1995. Growth and yield response of barley
and chickpea to water stress under three environments in southeast
Queensland. II* Root growth and soil water extraction pattern. Aust. J.
Agric. Res. 46: 35–48.
Tomerius, A.-M. 2001. Dissertation: Optimizing the development of seed-parent
lines in hybrid rye breeding. Institute of Plant Breeding, Seed Science and
Population Genetics, University of Hohenheim, Germany.
Tuberosa, R., S. Salvi, M.C. Sanguinetti, P. Landi, M. Maccaferri, and S. Conti.
2002a. Mapping QTLs regulating morpho-physiological traits and yield: Case
studies, shortcomings and perspectives in drought-stressed maize. Ann. Bot.
89: 941–963.
Tuberosa, R., M.C. Sanguineti, P. Landi, M.M. Giuliani, S. Salvi, and S. Conti.
2002b. Identification of QTLs for root characteristics in maize grown in
hydroponics and analysis of their overlap with QTLs for grain yield in the
field at two water regimes. Plant Mol. Biol. 48: 697–712.
Unterseer, S., E. Bauer, G. Haberer, M. Seidel, C. Knaak, M. Ouzunova, T.
Meitinger, T.M. Strom, R. Fries, H. Pausch, C. Bertani, A. Davassi, K.F.
Mayer, and C.-C. Schön. 2014. A powerful tool for genome analysis in maize:
development and evaluation of the high density 600 k SNP genotyping array.
BMC Genomics 15: 1–15.
Utz, H.F. 2010. PLABSTAT: A computer program for statistical analysis of plant
breeding experiments. Institute of Plant Breeding, Seed Science and
Population Genetics, University of Hohenheim, Germany.
Utz, H.F. 2011. PlabMQTL-Software for meta-QTL analysis with composite
interval mapping. : Institute of Plant Breeding, Seed Science and Population
Genetics, University of Hohenheim, Germany.
Page 63
References
63
Utz, H.F., A.E. Melchinger, and C.C. Schön. 2000. Bias and sampling error of the
estimated proportion of genotypic variance explained by quantitative trait
loci determined from experimental data in maize using cross validation and
validation with independent samples. Genetics 154: 1839–1849.
Venuprasad, R., M.E. Bool, L. Quiatchon, M.T. Sta Cruz, M. Amante, and G.N.
Atlin. 2011. A large-effect QTL for rice grain yield under upland drought
stress on chromosome 1. Mol. Breed. 30: 535–547.
Venuprasad, R., C.O. Dalid, M. Del Valle, D. Zhao, M. Espiritu, M.T. Sta Cruz,
M. Amante, A. Kumar, and G.N. Atlin. 2009. Identification and
characterization of large-effect quantitative trait loci for grain yield under
lowland drought stress in rice using bulk-segregant analysis. Theor. Appl.
Genet. 120: 177–190.
Vu, G.T.H., T. Wicker, J.P. Buchmann, P.M. Chandler, T. Matsumoto, A. Graner,
and N. Stein. 2010. Fine mapping and syntenic integration of the semi-
dwarfing gene sdw3 of barley. Funct. Integr. Genomics 10: 509–521.
Wang, Y., M.F. Mette, T. Miedaner, M. Gottwald, P. Wilde, J.C. Reif, and Y.
Zhao. 2014a. The accuracy of prediction of genomic selection in elite hybrid
rye populations surpasses the accuracy of marker-assisted selection and is
equally augmented by multiple field evaluation locations and test years.
BMC Genomics 15: 556.
Wang, S., D. Wong, K. Forrest, A. Allen, S. Chao, B.E. Huang, M. Maccaferri, S.
Salvi, S.G. Milner, L. Cattivelli, A.M. Mastrangelo, A. Whan, S. Stephen, G.
Barker, R. Wieseke, J. Plieske, M. Lillemo, D. Mather, R. Appels, R.
Dolferus, G. Brown-Guedira, A. Korol, A.R. Akhunova, C. Feuillet, J. Salse,
M. Morgante, C. Pozniak, M.-C. Luo, J. Dvorak, M. Morell, J. Dubcovsky, M.
Ganal, R. Tuberosa, C. Lawley, I. Mikoulitch, C. Cavanagh, K.J. Edwards,
M. Hayden, and E. Akhunov. 2014b. Characterization of polyploid wheat
genomic diversity using a high-density 90 000 single nucleotide
polymorphism array. Plant Biotechnol. J. 12: 787–796.
Wang, J., J. Yang, D.L. McNeil, and M. Zhou. 2010. Identification and molecular
mapping of a dwarfing gene in barley (Hordeum vulgare L.) and its
correlation with other agronomic traits. Euphytica 175: 331–342.
Warzecha, T., T. Adamski, Z. Kaczmarek, M. Surma, J. Chełkowski, H.
Wiśniewska, K. Krystkowiak, and A. Kuczyńska. 2011. Genotype-by-
environment interaction of barley DH lines infected with Fusarium culmorum (W.G.Sm.) Sacc. F. Crop. Res. 120: 21–30.
Weber, V.S., A.E. Melchinger, C. Magorokosho, D. Makumbi, M. Bänziger, and
G.N. Atlin. 2012. Efficiency of managed-stress screening of elite maize
hybrids under drought and low nitrogen for yield under rainfed conditions in
Southern Africa. Crop Sci. 52: 1011–1020.
Page 64
References
64
Weiland, P. 2006. Biomass digestion in agriculture: A successful pathway for the
energy production and waste treatment in Germany. Energ. Life Sci. 3: 302–
309.
Worland, A.J., V. Korzun, M.S. Ro, M.W. Ganal, and C.N. Law. 1998. Genetic
analysis of the dwarfing gene Rht8 in wheat . Part II. The distribution and
adaptive significance of allelic variants at the Rht8 locus of wheat as
revealed by microsatellite screening. Theor. Appl. Genet. 96: 1110–1120.
Wricke. 2002. Two major genes for kernel weight in rye. Plant Breed. 28: 26–28.
Yahdjian, L., and O. Sala. 2002. A rainout shelter design for intercepting
different amounts of rainfall. Oecologia 133: 95–101.
Yan, J. 2003. Dynamic analysis of QTL for plant height at different
developmental stages in maize (Zea mays L.). Chinese Sci. Bull. 48: 2601–
2607.
Yan, J., J. Zhu, C. He, M. Benmoussa, and P. Wu. 1998. Molecular dissection of
developmental behavior of plant height in rice (Oryza sativa L.). Genetics
150: 1257–1265.
Yue, G.L., K.L. Roozeboom, W.T. Schapaugh, and G.H. Liang. 1997. Evaluation of
soybean cultivars using parametric and nonparametric stability estimates.
Plant Breed. 116: 271–275.
Zhang, B., W. Shi, W. Li, X. Chang, and R. Jing. 2013. Efficacy of pyramiding
elite alleles for dynamic development of plant height in common wheat. Mol.
Breed. 32: 327–338.
Zhao, K., C.-W. Tung, G.C. Eizenga, M.H. Wright, M.L. Ali, A.H. Price, G.J.
Norton, M.R. Islam, A. Reynolds, J. Mezey, A.M. McClung, C.D. Bustamante,
and S.R. McCouch. 2011. Genome-wide association mapping reveals a rich
genetic architecture of complex traits in Oryza sativa. Nat. Commun. 2: 467.
Zuber, H., H. Winzeler, M.M. Messmer, M. Keller, B. Keller, J.E. Schmid, and P.
Stamp. 1999. Morphological traits associated with lodging resistance of
spring wheat (Triticum aestivum L.). J. Agron. Crop Sci. 182: 17–24.
Page 65
Danksagung
65
9. Danksagung
Diese vorliegende Arbeit wäre ohne die Unterstützung, Geduld und den
Austausch mit den Menschen, die mich über die Jahre begleitet haben, nicht
möglich gewesen. Auch wenn das persönliche Wort mehr zählt, möchte ich
versuchen allen hier an dieser Stelle danken.
Zu allererst bin ich Herrn apl. Prof. Dr. Thomas Miedaner sehr dankbar, dass er
mir die Möglichkeit gegeben hat meine Dissertation in seiner Arbeitsgruppe an
der Landessaatzuchtanstalt (LSA) zu schreiben. Ich danke ihm für seine
Ratschläge, seine Ideen, die Freiheit für Tätigkeiten neben der eigentlichen
Promotion und seine ständige und sehr detailreiche Unterstützung während
meiner Zeit an der LSA.
Ein besonderer Dank gilt natürlich der Roggenarbeitsgruppe, die mit Sigrid
Eraht, Heike Goßlau, Lore Handt, Silvia Koch, Bärbel Lieberherr, Mark Raith
und Marlene Warsow eine wunderbare Unterstützung war. Dazu zählte neben
der Feldarbeit und der Arbeit im Labor vor allem aber auch die wundervolle Zeit
und herzliche und ehrliche Arbeitsatmosphäre.
Eine sehr wertvolle Unterstützung war während meiner Zeit für statistische,
QTL- und PLABSTAT- Fragen und für sehr allgemeingültige Diskussionen Herr
Prof. Dr. H. F. Utz, bei dem ich mich hierfür sehr herzlich bedanken möchte.
Meinen Projektpartnern möchte ich vor allem für ihr Engagement, ihre fachliche
Expertise und natürlich für ihre Arbeit danken ohne die diese vorliegende Arbeit
nicht möglich gewesen wäre. Ein besonderer Dank gilt Peer Wilde, Brigitta
Schmiedchen und Britta Rose von der KWS Cereals GmbH; Barbara Kusterer
und Franz-Joachim Fromme von der HYBRO Saatzucht GmbH & Co. KG; und
Eike Lornsen, Steffen Roux und Bernd Hackauf vom Julius Kühn Institut in
Groß-Lüsewitz.
Diese Zeit war aber nicht nur von Feldversuchen, statistischen Berechnungen
und schriftlichen Ausführungen der Ergebnisse geprägt, sondern auch im
Besonderen von vielen meiner Kolleginnen und Kollegen im
„Kompetenzzentrum“, die ebenfalls an Ihrer Promotion gearbeitet haben oder
damit noch immer beschäftigt sind und die Zeit unvergesslich gemacht haben.
Dies gilt insbesondere für Juliane, Sebastian, Anna, Valeriha, Dorcus, Manje,
Linda, Marlen, Rasha, Simon, Dominik, Jose, Jonathan, Thomas, Elfadil,
Christian, Pascal, Diana, Alexander und zum guten Schluss für eine wundervolle
und intensive Zeit, Diskussionen über alle möglichen Fragen und der Tatsache
einen besonderen Freund zu haben, Willmar Leiser.
Darüber hinaus möchte ich allen Mitgliedern des „Kompetenzzentrums“
bedanken und besonders jene erwähnen, die das Arbeitsumfeld bereichert haben.
Page 66
Danksagung
66
Vielen Dank an Heide Beck, Hannelore Brandt, Beate Devezi Savula, Hartwig
Geiger, Johannes Häge, Beate Kurka, Helga Kößling Margit Lieb, Hans-Peter
Maurer, Susanne Meyer, Tobias Schrag, Herbert Stelz, Tobias Würschum und
natürlich auch Jochen, Franz und Heralt.
Für ausgiebige Diskussionen zu Feldversuchen am anderen Ende der Welt,
wirklich starken Trockenstress zu bewerten und vieles mehr, möchte ich Rohan
ganz herzlich danken.
Für kritische Anmerkungen, Inspiration und einem offenem Ohr für Dinge die
über eine Promotion hinausgehen möchte ich mich sehr herzlich bei Folkard,
Christian, Arne, Bernhard, Rainer, Bettina, Tobias, Ibrahim, Martin, Katie,
Shirel, Francesco, Anne, Joachim, Bruno, Sabine und Ulrike bedanken.
An dieser Stelle müsste es darüber hinaus auch einen längeren Absatz für die
prägenden Personen geben, die mich während meiner langen Zeit an der
Universität Hohenheim begleitet haben und diesen Abschnitt in meinen Leben so
besonders gemacht haben – dies wäre aber bei weitem zu langwierig.
In Erinnerung an Heiko K. Parzies möchte ich mich für die gemeinsame Zeit
bedanken. Für Deinen Enthusiasmus in der Pflanzenzüchtung, der Diskussion
über essentielle Fragen und Deiner Freundschaft bin ich Dir sehr dankbar,
Heiko.
Zum Schluss möchte ich meiner Familie für ihre lange und immerwährende
Unterstützung während meines Studiums und der Promotion an der Universität
Hohenheim danken. Es würde aber dabei den Rahmen dieser Arbeit sprengen
um all die Dinge zu erwähnen, die diesen Teil meines Lebens ausgemacht haben,
wichtig waren und einen Einfluss auf mich hatten, der aber ohne sie nicht
möglich gewesen wären – daher halte ich mich an dieser Stelle kurz –
Danke!
Page 67
Curriculm vitae
67
10. Curriculum vitae
P E R S O N A L
Born on 17.12.1982 in Salzgitter Lebenstedt
E D U C A T I O N A N D C A R E E R
Consultant 01.2015 - today
National and International Variety and Seed Affairs
Coordination Centre for the Ministry of Food and Agriculture Federal Plant Variety Office – Hannover
PhD 02.2011 - 06.2015
Topic: “Quantitative-trait loci (QTL) mapping of important
agronomical traits of the grain and biomass production in winter rye” State Plant Breeding Institute – University of Hohenheim
Teacher in the area of crop production 01.2012 - 07.2013
State school for horticulture and agriculture, Stuttgart Hohenheim
Diploma in Agricultural Biology 10.2005 - 02.2011
Diploma thesis: “Assessment of different methods of farmer-participatory selection in
diversified pearl millet populations at three pilot sites in Niger” University of Hohenheim
Employment as a banker 01.2005 - 09.2005
Special department for the implementation of the merger
Hypoveinsbank AG – Vereins- und WestBank AG HVB-Profil AG, Hamburg
Training as a banker 08.2002 - 01.2005 Vereins- und Westbank AG, Braunschweig, Hamburg, Hannover, Hildesheim
School education (Degree: Abitur) 08.1995 - 07.2002 Gymnasium Groß Ilsede
P R A C T I C A L A C T I V I T I E S
Department of pearl millet breeding 08.2009 - 11.2009 International Crop Research Institute of the Semiarid Tropics (ICRISAT) Niamey - Niger
Student assistant in the Laboratory of Plant Breeding Institute 04.2009 - 07.2009 Universität Hohenheim
Department of blant breeding of rapeseed 07.2008 - 09.2008 Limagrain Germany GmbH, Breeding station Rosenthal – Lower Saxony
Volunteer training program 08.2007 Southern African Wildlife College, Krüger Nationalpark, Southafrica
Employee at winery 08.2006 - 10.2006 Weinbau Maier, Schwaikheim – Baden Württemberg
Page 68
Curriculm vitae
68
U N I V E R S I T Y P O L I T I C A L C O M M I T M E N T
Member of the Research Committee 06.2012 - 09.2014
Member of the Senate 10.2007 - 09.2009
Chairman of the General Student Committee 06.2007 - 09.2009
Member of the General Student Committee 10.2006 - 09.2009
Member of the Commission Tuition 10.2006 - 09.2008
Member of Student Union Agricultural Biology 04.2006 - 02.2011 I T A N D L A N G U A G E S
MS Office, statistical packages (PLABSTAT, Genstat, R) Joinmap
German - mother tongue, English - fluent, French - basics
S C H O L A R S H I P S / A W A R D S
Fellow of Ulm Panis Foundation Support of diploma thesis
Award for outstanding student commitment University of Hohenheim
Page 69
Erklärung
69
11. Erklärung
Eidesstattliche Versicherung gemäß § 8 Absatz 2 der Promotionsordnung der
Universität Hohenheim zum Dr.sc.agr.
Bei der eingereichten Dissertation zum Thema
“Quantitative-trait loci (QTL) mapping of important agronomical traits
of the grain and biomass production in winter rye (Secale cereale L.)”
handelt es sich um meine eigenständig erbrachte Leistung.
Ich habe nur die angegebenen Quellen und Hilfsmittel benutzt und mich keiner
unzulässigen Hilfe Dritter bedient. Insbesondere habe ich wörtlich oder
sinngemäß aus anderen Werken übernommene Inhalte als solche kenntlich
gemacht.
Ich habe nicht die Hilfe einer kommerziellen Promotionsvermittlung oder
-beratung in Anspruch genommen.
Die Bedeutung der eidesstattlichen Versicherung und der strafrechtlichen Folgen
einer unrichtigen oder unvollständigen eidesstattlichen Versicherung sind mir
bekannt.
Die Richtigkeit der vorstehenden Erklärung bestätige ich. Ich versichere an
Eides statt, dass ich nach bestem Wissen die reine Wahrheit erklärt und nichts
verschwiegen habe.
Stefan Haffke