econstor www.econstor.eu Der Open-Access-Publikationsserver der ZBW – Leibniz-Informationszentrum Wirtschaft The Open Access Publication Server of the ZBW – Leibniz Information Centre for Economics Standard-Nutzungsbedingungen: Die Dokumente auf EconStor dürfen zu eigenen wissenschaftlichen Zwecken und zum Privatgebrauch gespeichert und kopiert werden. Sie dürfen die Dokumente nicht für öffentliche oder kommerzielle Zwecke vervielfältigen, öffentlich ausstellen, öffentlich zugänglich machen, vertreiben oder anderweitig nutzen. Sofern die Verfasser die Dokumente unter Open-Content-Lizenzen (insbesondere CC-Lizenzen) zur Verfügung gestellt haben sollten, gelten abweichend von diesen Nutzungsbedingungen die in der dort genannten Lizenz gewährten Nutzungsrechte. Terms of use: Documents in EconStor may be saved and copied for your personal and scholarly purposes. You are not to copy documents for public or commercial purposes, to exhibit the documents publicly, to make them publicly available on the internet, or to distribute or otherwise use the documents in public. If the documents have been made available under an Open Content Licence (especially Creative Commons Licences), you may exercise further usage rights as specified in the indicated licence. zbw Leibniz-Informationszentrum Wirtschaft Leibniz Information Centre for Economics Auriol, Emmanuelle; Biancini, Sara Working Paper Powering up developing countries through integration? CESifo Working Paper: Industrial Organisation, No. 3872 Provided in Cooperation with: Ifo Institute – Leibniz Institute for Economic Research at the University of Munich Suggested Citation: Auriol, Emmanuelle; Biancini, Sara (2012) : Powering up developing countries through integration?, CESifo Working Paper: Industrial Organisation, No. 3872 This Version is available at: http://hdl.handle.net/10419/61029
Transcript
econstor www.econstor.eu
Der Open-Access-Publikationsserver der ZBW – Leibniz-Informationszentrum WirtschaftThe Open Access Publication Server of the ZBW – Leibniz Information Centre for Economics
Standard-Nutzungsbedingungen:
Die Dokumente auf EconStor dürfen zu eigenen wissenschaftlichenZwecken und zum Privatgebrauch gespeichert und kopiert werden.
Sie dürfen die Dokumente nicht für öffentliche oder kommerzielleZwecke vervielfältigen, öffentlich ausstellen, öffentlich zugänglichmachen, vertreiben oder anderweitig nutzen.
Sofern die Verfasser die Dokumente unter Open-Content-Lizenzen(insbesondere CC-Lizenzen) zur Verfügung gestellt haben sollten,gelten abweichend von diesen Nutzungsbedingungen die in der dortgenannten Lizenz gewährten Nutzungsrechte.
Terms of use:
Documents in EconStor may be saved and copied for yourpersonal and scholarly purposes.
You are not to copy documents for public or commercialpurposes, to exhibit the documents publicly, to make thempublicly available on the internet, or to distribute or otherwiseuse the documents in public.
If the documents have been made available under an OpenContent Licence (especially Creative Commons Licences), youmay exercise further usage rights as specified in the indicatedlicence.
zbw Leibniz-Informationszentrum WirtschaftLeibniz Information Centre for Economics
Auriol, Emmanuelle; Biancini, Sara
Working Paper
Powering up developing countries throughintegration?
CESifo Working Paper: Industrial Organisation, No. 3872
Provided in Cooperation with:Ifo Institute – Leibniz Institute for Economic Research at the University ofMunich
Suggested Citation: Auriol, Emmanuelle; Biancini, Sara (2012) : Powering up developingcountries through integration?, CESifo Working Paper: Industrial Organisation, No. 3872
This Version is available at:http://hdl.handle.net/10419/61029
Powering Up Developing Countries through Integration?
Emmanuelle Auriol Sara Biancini
CESIFO WORKING PAPER NO. 3872 CATEGORY 11: INDUSTRIAL ORGANISATION
JUNE 2012
An electronic version of the paper may be downloaded • from the SSRN website: www.SSRN.com • from the RePEc website: www.RePEc.org
• from the CESifo website: Twww.CESifo-group.org/wp T
Powering Up Developing Countries through Integration?
Abstract Power market integration is analyzed in a two countries model with nationally regulated firms and costly public funds. If generation costs between the two countries are too similar negative business-stealing outweighs efficiency gains so that following integration welfare decreases in both regions. Integration is welfare-enhancing when the cost difference between the two regions is large enough. The benefit from export profits increases total welfare in the exporting country, while the importing country benefits from lower prices. This is a case where market integration also improves the incentives to invest compared to autarky. The investment levels remain inefficient though. With generation facilities over-investment occurs sometimes, while systematic under-investment occurs for transportation facilities. Free-riding reduces the incentives to invest in these public-good components, while business-stealing tends to reduce the capacity for financing new investment.
May 30, 2012 The authors are grateful for the financial support of the French Development Agency (AFD). Part of the paper has been realized while Sara Biancini was a research fellow at the European University Institute. We thank for their help and comments seminar audiences at the University of Cergy-Pontoise, at the University of Milan, at the French Development Agency (AFD), at the 2008 EUDN conference, and at the JEI 2009 in Vigo. We are also extremely grateful for the insightful comments and suggestions of Claude Crampes, Rafael Moner and Yannick Perez on early versions of the paper, as well as comments and suggestions by Aymeric Blanc and Alexis Bonnel.
1 Introduction
World electricity demand is projected to double by year 2030 (International Electricity
Agency, 2006). Financing the volume of investment required to meet this demand rise is a
real challenge for developing countries.1 With scarce public resources, little commitment
from the private sector and limited aid,2 they try to cope with their investment needs by
creating regional power markets. Integrated power pools should allow for a better use of
existing resources and infrastructures between the different countries involved, and also
for the realization of projects that would otherwise be oversized for an isolated country.
These benefits are conditional on the countries ability to efficiently coordinate production
levels and investment. The problem is that in the absence of a legitimate supranational
authority regulation still acts nationally. The paper studies the cost and benefit of such
partial economic integration. It shows that coordination problems between independent
regulators prevent them from using efficiently the stock of existing infrastructure and
distort countries’ incentives to invest in new generation and, more importantly, in in-
terconnection facilities. In a nutshell, countries’ competition for the sector rents yields
inefficiencies that limit the benefit of integration. Because of these losses, the difference
in countries generation costs has to be large for a regional power pool to successfully
emerge.
Consistently with the theory, cost complementarities in generation are the main engine
of integration in electricity markets. For instance in South America, countries that have
large demand, such as Brazil or Chile, do not have sufficient energy resources, while
countries with smaller markets, such as Paraguay, Venezuela, Bolivia, and Peru have
large supply potential, in terms of hydropower, heavy oil and gas. Several generation
1The total cumulative investment in power generation, transmission and distribution necessary tomeet this rise in demand is estimated to be $11.3 trillion by the International Electricity Agency, 2006.This amount covers investments in OECD countries, in fast-growing developing countries, such as Indiaand China, as well as investments necessary to relieve the acute power penury experienced by some ofthe world’s poorest nations, especially in Sub-Saharan Africa (International Electricity Agency, 2006).
2The share of infrastructure assistance in the energy and communications sectors has dramaticallydeclined in the last years (Estache and Iimi, 2008). At the same time, as Estache and Wren-Lewis(2009) note, “for many countries, particularly those with the lowest income, private-sector participationhas been disappointing”. As rich countries emerge from the global financial crisis with high debt, it isunlikely that development assistance will increase significantly in the near future, and there is a risk thataid to large infrastructure project could be reduced. Yet in 2000, only 40% of the population of lowincome countries had access to electricity, and the percentage dropped to 10% for the poorest quintile(Estache and Wren-Lewis, 2009).
2
and interconnection projects have been launched to exploit efficiency gains between these
unevenly endowed countries. Similarly in the Greater Mekong Subregion countries with
large demand, such as Thailand and Vietnam, want to integrate with countries with large
supply potential in terms of hydropower and gas resources and smaller markets, such as
Laos and Myanmar. This is also to exploit the potential gains from cross-border trade and
to increase their systems efficiency that African countries, sustained by the World Bank,
have created several regional power pools: the South African power pool (SAPP), West
African power pool (WAPP), Central African Power Pool (CAPP), East African Power
Pool (EAPP), to which add interconnection initiatives in North Africa with ties to the
Middle East. The pools, created to overcome Sub-Saharan acute shortage problems,3 are
supposed to foster the emergence of major projects such as large hydroelectric-generation
facilities. These projects are unlikely to be achieved otherwise, as they are oversized for
an isolated country. For instance in West Africa 91% of the hydroelectric potential is
concentrated in only five countries. The hydro potential of the Democratic Republic of
Congo alone is estimated to be sufficient to provide three times as much power as Africa
currently consumes. Large hydroelectric projects, such as the Grand Inga in the region of
the Congo River and the projects for the Senegal River basin, could hence be beneficial
to all countries in the region, provided they manage to find a way to finance them.4
Despite the potential benefits of regional power pools, coordination problems tend to
undermine their implementation. In practice governments focus on domestic welfare and
are not indifferent between local and foreign producers. They favor the domestic firm,
usually the (former) public monopoly,5 over its foreign competitors. The government
cares about the national firm’s revenue as it seizes its profits when they are positive and
subsidizes its losses when they are negative. As a result, conflicts between governments
3Although Africa is endowed with abundant energy sources access to electricity, estimated at 24% ofthe population by the International Energy Agency, is the lowest in the world. Most African utilitiesoperate below efficient level of scale, due to the limited size of their markets. For instance Tovar andTrujillo (2004), studying electricity generation between 1998 and 2001 in 13 countries (mostly EastAfrican), show that inefficiencies of scale are in the order of 24%.
4The region possesses some of the largest water courses in the world (Nile, Congo, Niger, Volta andZambezi river). Oil and gas reserves are concentrated in the north and west, coal reserves are in thesouth. Geothermal resources are largely in the Red Sea Valley and the Rift Valley. For West Africa,Sparrow et al. (2002) estimate between 5 and 20% the potential cost reduction associated with marketintegration (the estimation refers to the cost of expansion of the thermal and hydroelectric capacities).
5In 2004, 60% of less developed countries had no significant private participation in electricity, Estacheet al., 2005
3
often arise and slow down integration. For instance, since its creation in 1991, MERCO-
SUR has promoted energy market integration of its member countries (Argentina, Brazil,
Paraguay and Uruguay). Several large bi-national hydro-projects have been started in
the region.6 By 2025 the full integration of their electricity markets is supposed to be
achieved. However, recurrent conflicts between governments keep delaying the process.
Countries’ representatives, who meet occasionally in informal working groups, focus on
their national interest and on the promotion of their major state-owned operator such as
YPF (Argentina), Endesa (Chile), UTE (Uruguay), ANDE (Paraguay), and Eletrobras
(Brazil). Achieving further integration will require the creation of a central body to co-
ordinate the regulation of these different national electricity firms and markets (Pineau,
Hira, and Froschauer, 2004).
The paper studies the welfare implications of sectorial integration in a two countries
model with nationally regulated firms. It shows that market integration through the
creation of a regional power pool is welfare-enhancing when the cost difference between
the two regions is large enough. First, if the foreign firm is significantly less efficient
than the national firm, the benefits from increased export profit (due to the possibility of
serving also foreign demand) increase total welfare in the exporting country. Second, if
the foreign firm is significantly more efficient than the national firm, the domestic market
benefits from the reduction in price caused by importation, which enhances consumer
surplus in the importing country. By contrast sectorial integration is not likely to occur
if the cost difference between the two countries is small. When the two firms have similar
costs, competition for the market shares is fierce so that prices decrease in both countries.
The negative business-stealing effect out-weighs the efficiency gains: welfare decreases in
both regions following integration. It is worth noting that even if the efficiency gains
from integration are large enough so that both countries win from integration, opposition
might still subsist internally. Indeed, market integration has redistributive effects. For
instance, when the prices converge after integration at some “average” of the two closed-
economy prices, consumers in the formerly low-price region are worse off and might thus
oppose it.
6Brazil and Paraguay share the Itaipu hydroelectric facility, one of the world’s largest operating hydrocomplex. Argentina and Paraguay jointly own Ente Binacional Yacyreta (EBY) a hydroelectric dam onthe Parana River and are also considering another hydro complex on the Parana River at Corpus.
4
The paper next studies the impact of regional integration on the countries’ incentives
to invest in new infrastructure. It distinguishes cost-reducing investment (e.g., a new
generation facility) from investment in interconnection infrastructure (e.g., high voltage
links). Compared to autarky, market integration improves the incentives to invest in cost-
reducing technology. First, when one country is much more efficient than the other, a case
where integration is particularly appealing, the level of sustainable investment increases
with regional integration. It remains suboptimal because the country endowed with the
low-cost technology does not fully internalize the foreign country consumers’ surplus (i.e.,
it only internalizes sales), but it rises compared to autarky. Moreover, the incentives to
invest in obsolete technology decrease, while the incentives to invest in efficient technology
increase. Second, when the two countries’ technologies are not sufficiently differentiated,
the firms that have to fight for their market shares, might overinvest compared to the
optimal solution. In practice the risk of over-investment is limited as countries will resist
the creation of a common power pool when their costs difference is not large enough.
For infrastructures that constitute a public good, such as interconnection or trans-
portation facilities, there is a major risk of under-investment. Free-riding behavior re-
duces the incentives to invest, and business stealing reduces the capacity of financing
new investment, especially in the importing country. The problem is sometimes so severe
that global investment decreases compared to autarky. That is, when the two firms are
not sufficiently differentiated in terms of productivity the maximal level of investment in
public-good facilities is not only suboptimal but it is also smaller than in autarky. In
practice this risk is limited as the inefficient country will resist integration when costs
difference is not large enough. However, even when the two countries have significantly
different potential generation costs which implies that market enlargement benefits both
of them, the investment level in the public good components of the network remains sub-
optimal. This structural under-investment problem has important policy implications.
Several programs supported by the World Bank in Bangladesh, Pakistan and Sri-Lanka
have failed because they omitted to address the interconnection problem. The Bank
supported lending to generators through the Energy Fund, in the spirit of Public Pri-
vate Partnerships. Investment in generation was made and the production of kilowatts
rose. However, due to poor transmission and distribution infrastructures, the plants were
5
kept well-below efficient production levels. On the one hand, power consumption stag-
nated because power was largely stuck at production sites. On the other hand, public
subsidies to the industry rose because generation investment had been committed under
take-or-pay Power Purchase Agreements (see Manibog and Wegner, 2003). In the end
both consumers and taxpayers were worse off.
Our results show that the countries involved in the creation of a power pool should
setup at an early stage a supra-national body to deal with the financing and the man-
agement of interconnection links and other transmission infrastructures. A good example
of a supra-national authority that has been created to address interconnection problems
is given by the Electric Interconnection Project of Central America (SIEPAC). The six
countries involved in the project (i.e., Guatemala, Nicaragua, El Salvador, Honduras,
Panama, Costa Rica) have established a common regulatory body, the Regional Com-
mission of Electricity Interconnection (CRIE). To attract investment and increase infras-
tructure capacity a new company (EPL) has been created with the goal to build a new
regional interconnection line. It is controlled by the national transmission companies with
the participation of the Spanish ENDESA. EPL’s investment program has been financed
through loans obtained from several European banks, together with the contributions
of the member countries. CRIE is now in charge of setting the access tariffs needed to
repay the loans that financed the investment. It is clear that the role of the regional
regulator is crucial to ensure the viability of the transmission infrastructure and to create
a favorable environment for new investments. Based on the CRIE experience the West
African power pool (WAPP) is working on the creation of a regional regulatory body,
“Organe de Regulation Regionale” (ORR), which should promote market integration and
cooperation among national regulators (and/or governments). The analysis below shows
that power markets integration is much likely to succeed with such a common regulator.
1.1 Relationship with the literature
Starting with the seminal paper of Brander and Spencer (1983), the literature on the
interaction between public intervention and market integration has concentrated on the
6
strategic effect of trade subsidization policies.7 Subsidies have a rent-shifting effect that
makes the domestic firm more aggressive in the common market. The strategic reaction
of the rival government creates a prisoner’s dilemma, with the consequence that firms
would benefit from jointly reducing the subsidies. This classical trade-policy result is
obtained under the assumptions that public funds are not costly and that domestic and
foreign producers are identical. Neary (1994) enriches the analysis by showing that, when
public funds are costly, the optimal unit subsidy is often negative and that, when the
firms differ in productivity, it is in generally optimal to pay higher subsidies to the most
efficient one (i.e. to increase its market share in the common market). Collie (2000) who
adds consumer surplus to the analysis (but restricts the attention to the case of identical
firms), shows that banning unit subsidies may increase welfare, offering a theoretical
argument for the prohibition of state aids in the European Union. Since they focus on
the desirability of allowing (or banning) trade subsidies, these contributions take as a
starting point that the economies are already open to trade.
By contrast this paper, which focuses on electricity markets, studies the integration
process.8 The relevant analytical framework is that of asymmetric regulation. This
framework has been first introduced in the literature by Caillaud (1990) and Biglaiser
and Ma (1995) to study the liberalization of regulated industries. Both papers focus on
the effects of unregulated competition in a closed economy.9 Since market integration is
generally a process of reciprocal market opening, the present paper extends the analysis
to the case where the unregulated entrant is the incumbent of the foreign market, and
the regulated national firm is also allowed to serve foreign demand. Considering both
7For more details about the strategic trade policy literature, see Brander (1997).8It is not enough to sign free trade agreement, nor even to be part of the same free exchange zone, to
create a common market in electricity. For instance the European Commission promotes the formationof an integrated market and defines the programmatic lines of action for member countries. However,governments and national regulators retain jurisdiction over specific choices, while respecting the overallframework designed by the Commission. Despite the common framework given in the Commission’sdirectives, in practice electricity market integration proceeds at different speeds in different regions. Theintegration of electricity markets is advanced between France and neighbor countries (Italy, Spain, UnitedKingdom) and the Nord Pool (regional market of the Scandinavian countries), while other countries aremuch less active in the development of cross-border networks and, more generally, less opened to theentry of foreign producers.
9Caillaud (1990) studies a regulated market in which a dominant incumbent is exposed to competitionfrom an unregulated, competitive fringe, pricing at marginal cost. Biglaiser and Ma (1995) extend theanalysis to the case where a dominant regulated firm is exposed to competition from a single strategiccompetitor. Allowing for horizontal and vertical differentiation, they find that competition helps toextract the information rent of the regulated firm, but allocative inefficiency arises in equilibrium.
7
countries simultaneously hence permits to open the black box of sectorial integration in
non competitive industries. It help us to predict in which case such integration is likely
to be consensual and successful, and in which cases it is doomed to fail.
We study a country’s incentives to integrate its power market with its neighbor by
comparing welfare in the case of integration with the case of autarky. With costly public
funds the optimal autarky tariff is a Ramsey price so that taxation by regulation emerges.
The operating profits of the regulated firm help covering the fixed costs of investment
and reducing the total subsidies to the sector. In this context unregulated competition
can have the adverse effect of undermining the tax base (Armstrong and Sappington,
2005). In light of the volume of investment required to power up developing countries
this negative fiscal effect is a major concern.10
As it studies investment in an integrated market, this paper is also related to the
work of Haaland and Kind (2008), which looks at R&D subsidies for national firms com-
peting in a third market. Haaland and Kind (2008) focus on the strategic motive for
research subsidies: governments could pay excessive subsidies in order to strengthen the
position of the national firm in the common market. In a similar framework, Leahy and
Neary (2009) find that investment subsidies could end up being on the contrary too low
if investment has positive spillovers (i.e. investment also increases the profits of the ri-
val), and particularly if the social planner takes consumer welfare into account. In the
tradition of the trade and competition literature, these papers concentrate on the de-
sirability of subsidies in an international context, while assuming that public funds are
not costly and producers identical. By contrast, the present paper analyzes the con-
sequences of regional integration on investment incentives, when the domestic and the
foreign technologies are different and public funds are costly. We hence stress the role of
cost asymmetries in affecting the incentives to invest. The impact of market integration
on investment incentives depends crucially on these asymmetries. As in Leahy and Neary
(2009), we distinguish between different types of investments with different impacts on
a competitor’s costs and profits (in our case, these would be generation technologies
10In 2000, only 40% of the population of low income countries had access to electricity, and thepercentage dropped to 10% for the poorest quintile (Estache and Wren-Lewis, 2009). Investments haveto be financed either by consumers or taxpayers. To find the right balance between the two, it is necessaryto take into account the opportunity cost of public funds.
8
and transportation/interconnection infrastructures). Since the power industry has some
substantial public good components (i.e., transmission and distribution facilities) it con-
stitutes what Besley and Ghatak (2001, 2006) defined as a “market augmenting public
good”, a case where even a well-functioning market will not provide the correct level of
provision.11 In our analysis the under-investment problem is amplified by the fact that
regulation is asymmetric. Market integration erodes the possibility of conducting taxa-
tion by regulation because regulators do not control foreign firms. This in turns might
undermine further investment possibilities.
2 A model of sectorial integration with independently
regulated firms
We consider two symmetrical countries, identified by i = 1, 2. The inverse demand in
each country is given by:12
pi = d−Qi (1)
Where Qi is the home demand in country i = 1, 2. Before market integration, there is
a monopoly in each country. In a closed economy, Qi corresponds thus to qi, the quantity
produced by the national monopoly, also identified by i ∈ {1, 2}. When markets are
integrated, Qi can be produced by both firms 1 and 2 (i.e. Qi = qii + qji, i = j, where
qij, is the quantity sold by firm i in country j). Total demand in the integrated market
is given by:
p = d− Q
2(2)
where Q = Q1 +Q2 is the total demand in the integrated market, which can be satisfied
by firm 1 or 2 (i.e. Q = q1 + q2).
11Besley and Ghatak (2001, 2006) deal with the optimal institutional arrangements for public goodsprovision in the form of regulation with transfers and/or public-private partnerships. Since we focus onthe integration process, we abstract from this optimal institutional choice. We refer the reader to theircontribution for this important practical question.
12For the use of linear demand models in international oligopoly contexts, one can refer to Neary(2003), who also discusses the interpretation of these models and their natural extension to a generalequilibrium framework.
9
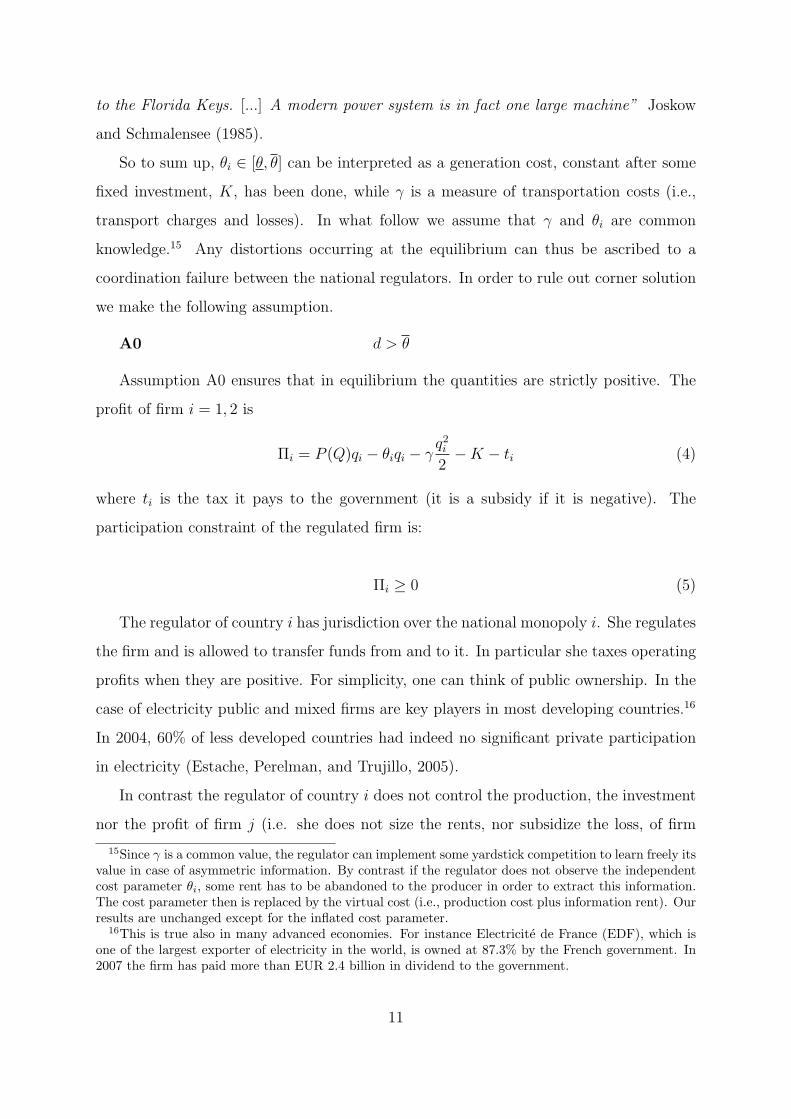
On the production side, firm i = 1, 2 incurs a fixed cost which measures the economies
of scale in the industry. The fixed cost is sunk so that it does not play a role in the optimal
production choices.13 The firm also incurs a variable cost function given by:
c(θi, qi) = θiqi + γq2i2. (3)
The variable cost function includes both a linear term θi ∈ [θ, θ], which represents
the production cost, and an additional quadratic term, weighted by γ, which represents
a transportation cost. Indeed, the cost function (3) can be generated from an horizontal
differentiation model a la Hotelling with linear transportation cost in which Firm 1 is
located at the left extremity and Firm 2 at the right extremity of the unit interval. The
linear market is first separated in two contiguous segments (the “national markets”).
Market integration corresponds to the unification of the two segments: the common
market is then represented by the full Hotelling line. To serve consumers, firms, that
sell the good at an uniform price, have to cover the transportation cost. This Hotelling
model generates exactly the cost function in (3), allowing the interpretation of γ as a
transportation cost (see Auriol, 1998).14
The model supposes that the cost is increasing in the distance between the producer
and the consumer. This assumption is legitimate in the electricity example because of
the Joule effect and the associated transport charges and losses. Moreover in the inter-
connected network the transportation cost γ is the same for domestic and international
consumers. This assumption is also consistent with the physical characteristics of elec-
tric networks. This physical unity, which comes from the fact that electricity cannot be
routed, is what differentiates electric systems from other systems of distribution of goods
and services. “All components of an electric power system are physically connected, and
all can be dramatically affected by events elsewhere in the system. [...] The failure of a
single AC-DC converter in a Florida Power and Light Co. nuclear plant in December
1982, for instance, triggered loss of power to 556,000 customers from the Georgia border
13Since it is already sunk at the time countries choose (or not) integration and their production levels,it does not play a role in decisions. We thus avoid introducing new notation for this sunk cost.
14That is, assume that consumers are uniformly distributed over [0, 1]. To deliver one unit to aconsumer located at q ∈ [0, 1] transportation cost is γq for firm 1 and γ(1− q) for firm 2. The variableproduction cost of firm i with market share equal to qi can then be written c(θi, qi) =
∫ qi0(θi + γ q)dq,
or equivalently c(θi, qi) = θiqi + γq2i2 (i = 1, 2).
10
to the Florida Keys. [...] A modern power system is in fact one large machine” Joskow
and Schmalensee (1985).
So to sum up, θi ∈ [θ, θ] can be interpreted as a generation cost, constant after some
fixed investment, K, has been done, while γ is a measure of transportation costs (i.e.,
transport charges and losses). In what follow we assume that γ and θi are common
knowledge.15 Any distortions occurring at the equilibrium can thus be ascribed to a
coordination failure between the national regulators. In order to rule out corner solution
we make the following assumption.
A0 d > θ
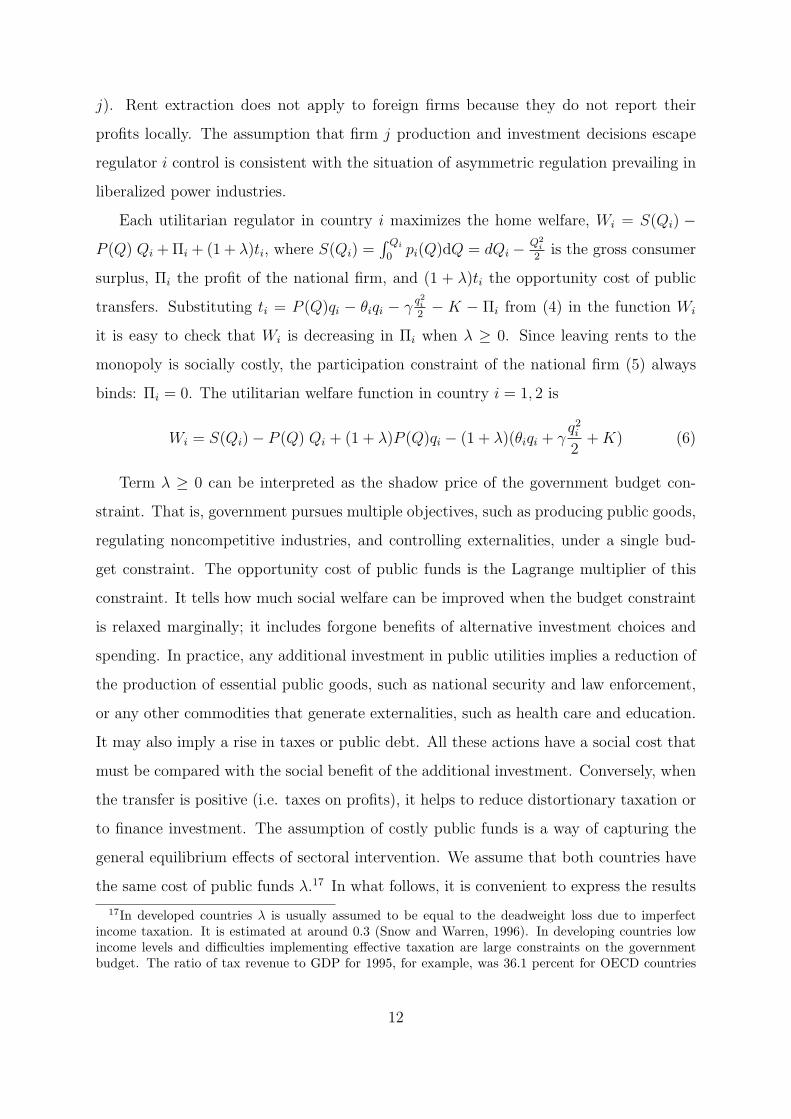
Assumption A0 ensures that in equilibrium the quantities are strictly positive. The
profit of firm i = 1, 2 is
Πi = P (Q)qi − θiqi − γq2i2
−K − ti (4)
where ti is the tax it pays to the government (it is a subsidy if it is negative). The
participation constraint of the regulated firm is:
Πi ≥ 0 (5)
The regulator of country i has jurisdiction over the national monopoly i. She regulates
the firm and is allowed to transfer funds from and to it. In particular she taxes operating
profits when they are positive. For simplicity, one can think of public ownership. In the
case of electricity public and mixed firms are key players in most developing countries.16
In 2004, 60% of less developed countries had indeed no significant private participation
in electricity (Estache, Perelman, and Trujillo, 2005).
In contrast the regulator of country i does not control the production, the investment
nor the profit of firm j (i.e. she does not size the rents, nor subsidize the loss, of firm
15Since γ is a common value, the regulator can implement some yardstick competition to learn freely itsvalue in case of asymmetric information. By contrast if the regulator does not observe the independentcost parameter θi, some rent has to be abandoned to the producer in order to extract this information.The cost parameter then is replaced by the virtual cost (i.e., production cost plus information rent). Ourresults are unchanged except for the inflated cost parameter.
16This is true also in many advanced economies. For instance Electricite de France (EDF), which isone of the largest exporter of electricity in the world, is owned at 87.3% by the French government. In2007 the firm has paid more than EUR 2.4 billion in dividend to the government.
11
j). Rent extraction does not apply to foreign firms because they do not report their
profits locally. The assumption that firm j production and investment decisions escape
regulator i control is consistent with the situation of asymmetric regulation prevailing in
liberalized power industries.
Each utilitarian regulator in country i maximizes the home welfare, Wi = S(Qi) −
P (Q) Qi +Πi + (1 + λ)ti, where S(Qi) =∫ Qi
0pi(Q)dQ = dQi − Q2
i
2is the gross consumer
surplus, Πi the profit of the national firm, and (1 + λ)ti the opportunity cost of public
transfers. Substituting ti = P (Q)qi − θiqi − γq2i2− K − Πi from (4) in the function Wi
it is easy to check that Wi is decreasing in Πi when λ ≥ 0. Since leaving rents to the
monopoly is socially costly, the participation constraint of the national firm (5) always
binds: Πi = 0. The utilitarian welfare function in country i = 1, 2 is
Wi = S(Qi)− P (Q) Qi + (1 + λ)P (Q)qi − (1 + λ)(θiqi + γq2i2+K) (6)
Term λ ≥ 0 can be interpreted as the shadow price of the government budget con-
straint. That is, government pursues multiple objectives, such as producing public goods,
regulating noncompetitive industries, and controlling externalities, under a single bud-
get constraint. The opportunity cost of public funds is the Lagrange multiplier of this
constraint. It tells how much social welfare can be improved when the budget constraint
is relaxed marginally; it includes forgone benefits of alternative investment choices and
spending. In practice, any additional investment in public utilities implies a reduction of
the production of essential public goods, such as national security and law enforcement,
or any other commodities that generate externalities, such as health care and education.
It may also imply a rise in taxes or public debt. All these actions have a social cost that
must be compared with the social benefit of the additional investment. Conversely, when
the transfer is positive (i.e. taxes on profits), it helps to reduce distortionary taxation or
to finance investment. The assumption of costly public funds is a way of capturing the
general equilibrium effects of sectoral intervention. We assume that both countries have
the same cost of public funds λ.17 In what follows, it is convenient to express the results
17In developed countries λ is usually assumed to be equal to the deadweight loss due to imperfectincome taxation. It is estimated at around 0.3 (Snow and Warren, 1996). In developing countries lowincome levels and difficulties implementing effective taxation are large constraints on the governmentbudget. The ratio of tax revenue to GDP for 1995, for example, was 36.1 percent for OECD countries
12
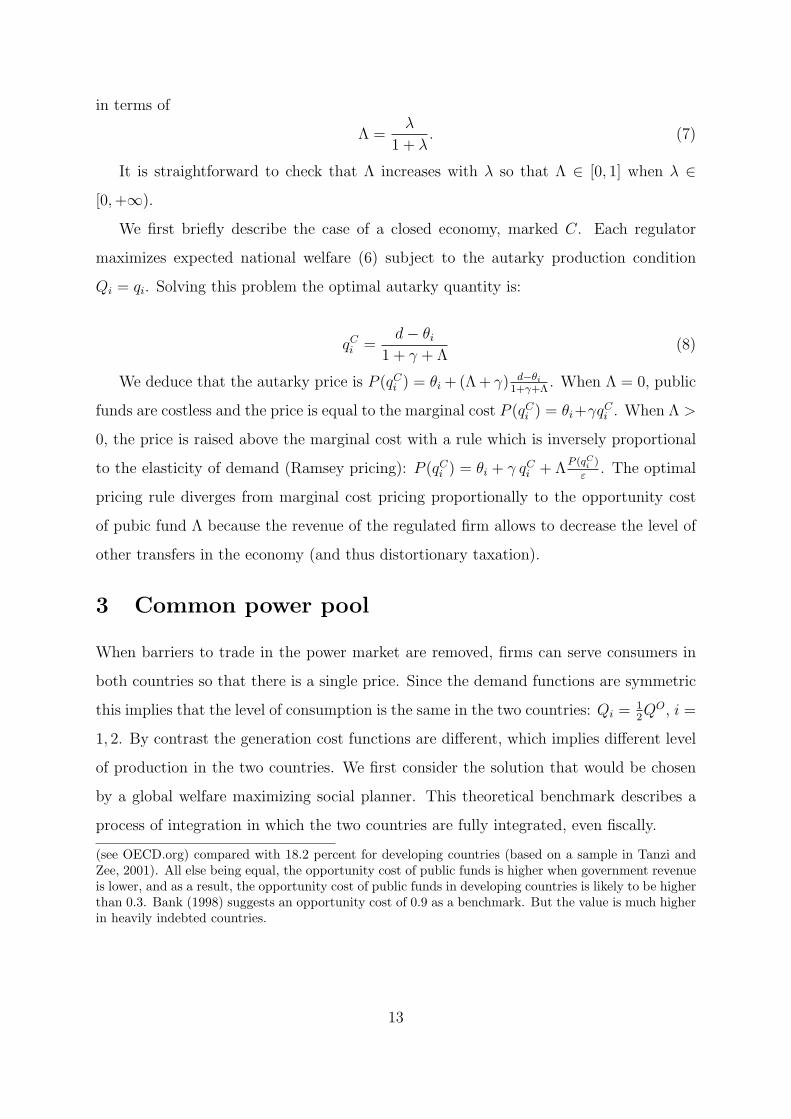
in terms of
Λ =λ
1 + λ. (7)
It is straightforward to check that Λ increases with λ so that Λ ∈ [0, 1] when λ ∈
[0,+∞).
We first briefly describe the case of a closed economy, marked C. Each regulator
maximizes expected national welfare (6) subject to the autarky production condition
Qi = qi. Solving this problem the optimal autarky quantity is:
qCi =d− θi
1 + γ + Λ(8)
We deduce that the autarky price is P (qCi ) = θi + (Λ+ γ) d−θi1+γ+Λ
. When Λ = 0, public
funds are costless and the price is equal to the marginal cost P (qCi ) = θi+γqCi . When Λ >
0, the price is raised above the marginal cost with a rule which is inversely proportional
to the elasticity of demand (Ramsey pricing): P (qCi ) = θi + γ qCi + ΛP (qCi )
ε. The optimal
pricing rule diverges from marginal cost pricing proportionally to the opportunity cost
of pubic fund Λ because the revenue of the regulated firm allows to decrease the level of
other transfers in the economy (and thus distortionary taxation).
3 Common power pool
When barriers to trade in the power market are removed, firms can serve consumers in
both countries so that there is a single price. Since the demand functions are symmetric
this implies that the level of consumption is the same in the two countries: Qi =12QO, i =
1, 2. By contrast the generation cost functions are different, which implies different level
of production in the two countries. We first consider the solution that would be chosen
by a global welfare maximizing social planner. This theoretical benchmark describes a
process of integration in which the two countries are fully integrated, even fiscally.
(see OECD.org) compared with 18.2 percent for developing countries (based on a sample in Tanzi andZee, 2001). All else being equal, the opportunity cost of public funds is higher when government revenueis lower, and as a result, the opportunity cost of public funds in developing countries is likely to be higherthan 0.3. Bank (1998) suggests an opportunity cost of 0.9 as a benchmark. But the value is much higherin heavily indebted countries.
13
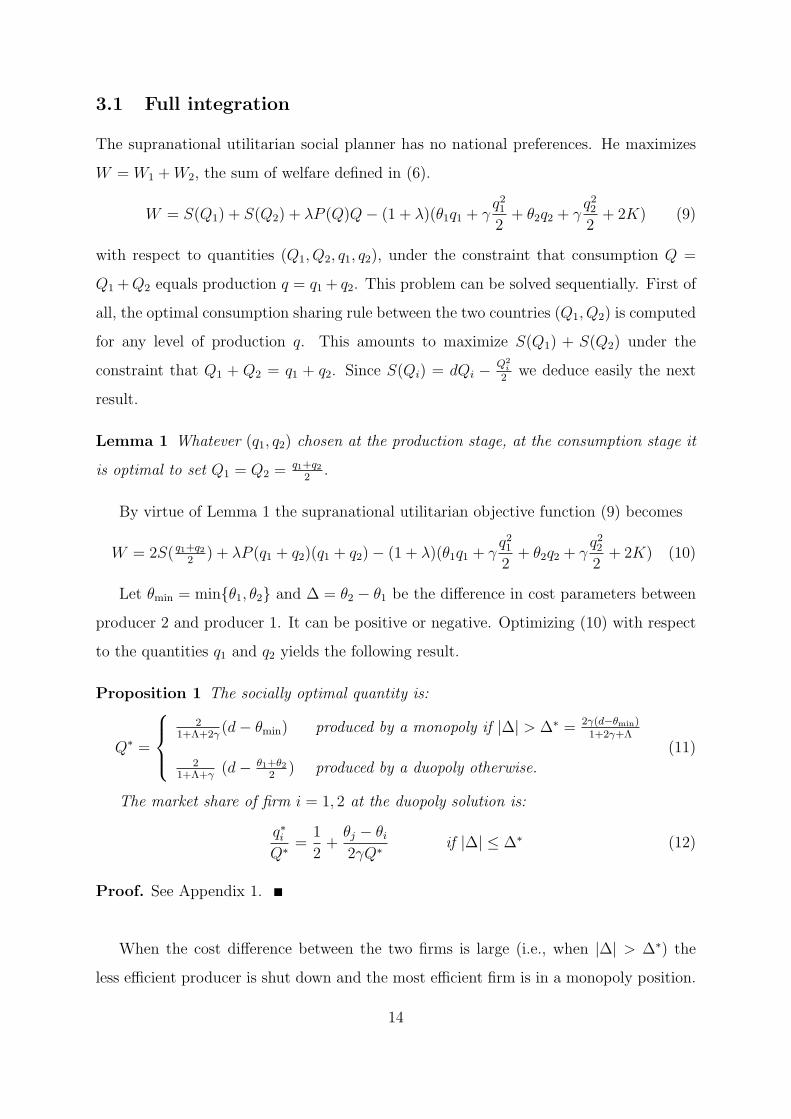
3.1 Full integration
The supranational utilitarian social planner has no national preferences. He maximizes
W = W1 +W2, the sum of welfare defined in (6).
W = S(Q1) + S(Q2) + λP (Q)Q− (1 + λ)(θ1q1 + γq212
+ θ2q2 + γq222
+ 2K) (9)
with respect to quantities (Q1, Q2, q1, q2), under the constraint that consumption Q =
Q1 +Q2 equals production q = q1 + q2. This problem can be solved sequentially. First of
all, the optimal consumption sharing rule between the two countries (Q1, Q2) is computed
for any level of production q. This amounts to maximize S(Q1) + S(Q2) under the
constraint that Q1 + Q2 = q1 + q2. Since S(Qi) = dQi − Q2i
2we deduce easily the next
result.
Lemma 1 Whatever (q1, q2) chosen at the production stage, at the consumption stage it
is optimal to set Q1 = Q2 =q1+q2
2.
By virtue of Lemma 1 the supranational utilitarian objective function (9) becomes
W = 2S( q1+q22
) + λP (q1 + q2)(q1 + q2)− (1 + λ)(θ1q1 + γq212
+ θ2q2 + γq222+ 2K) (10)
Let θmin = min{θ1, θ2} and ∆ = θ2 − θ1 be the difference in cost parameters between
producer 2 and producer 1. It can be positive or negative. Optimizing (10) with respect
to the quantities q1 and q2 yields the following result.
Proposition 1 The socially optimal quantity is:
Q∗ =
2
1+Λ+2γ(d− θmin) produced by a monopoly if |∆| > ∆∗ = 2γ(d−θmin)
1+2γ+Λ
21+Λ+γ
(d− θ1+θ22
) produced by a duopoly otherwise.
(11)
The market share of firm i = 1, 2 at the duopoly solution is:
q∗iQ∗ =
1
2+
θj − θi2γQ∗ if |∆| ≤ ∆∗ (12)
Proof. See Appendix 1.
When the cost difference between the two firms is large (i.e., when |∆| > ∆∗) the
less efficient producer is shut down and the most efficient firm is in a monopoly position.
14
This implies that when there is no transportation cost (i.e., γ = 0), the first best contract
always prescribes to shut down the less efficient firm. However the “shut down” result is
upset with the introduction of transportation cost. When γ is positive both firms produce
whenever |∆| ≤ ∆∗. The most efficient firm (i.e., the firm with the cost parameter θmin)
has a larger market share than its competitor (see 12). However, the market share
differences decreases with γ.
In practice sectorial integration generally excludes fiscal and political institutions,
which remain decentralized at the country level.18 Sovereign governments and regulators
do not share profits and tariff revenues among themselves. Taxpayers enjoy taxation by
regulation insofar as the rents come from their national firms. The next section studies
the non-cooperative equilibrium between the two governments.
3.2 Sectorial integration with asymmetric regulation
In the case of sectoral integration, marked O, national regulators simultaneously fix
the quantity produced by the national firm, qOi , maximizing expected national welfare
(6). The system of reaction functions of the regulators determine the non cooperative
equilibrium of the model.
Proposition 2 The quantity produced at the non cooperative equilibrium of the sectorial
integration game is:
QO =
4
3+4γ+Λ(d− θmin) by a monopoly if |∆| > ∆O = 2(1+2γ)(d−θmin)
3+4γ+Λ;
42(1+γ)+Λ
(d− θ1+θ22
) by a duopoly otherwise.
(13)
The market share of firm i = 1, 2 at the duopoly solution is:
qOiQO
=1
2+
θj − θi(1 + 2γ)QO
if |∆| ≤ ∆O (14)
Proof. See Appendix 2.
18The solution chosen by a global welfare maximizing social planner corresponds to perfect integration.Such fusion of regulatory bodies and fiscal systems is rarely achieved. The German reunification is anexception. The East and West German economic systems have been unified under the same government.Consistently with the theory, many firms have been shut down in the East. The reallocation of productiontowards more efficient units has been sustained by transfers from the West.
15
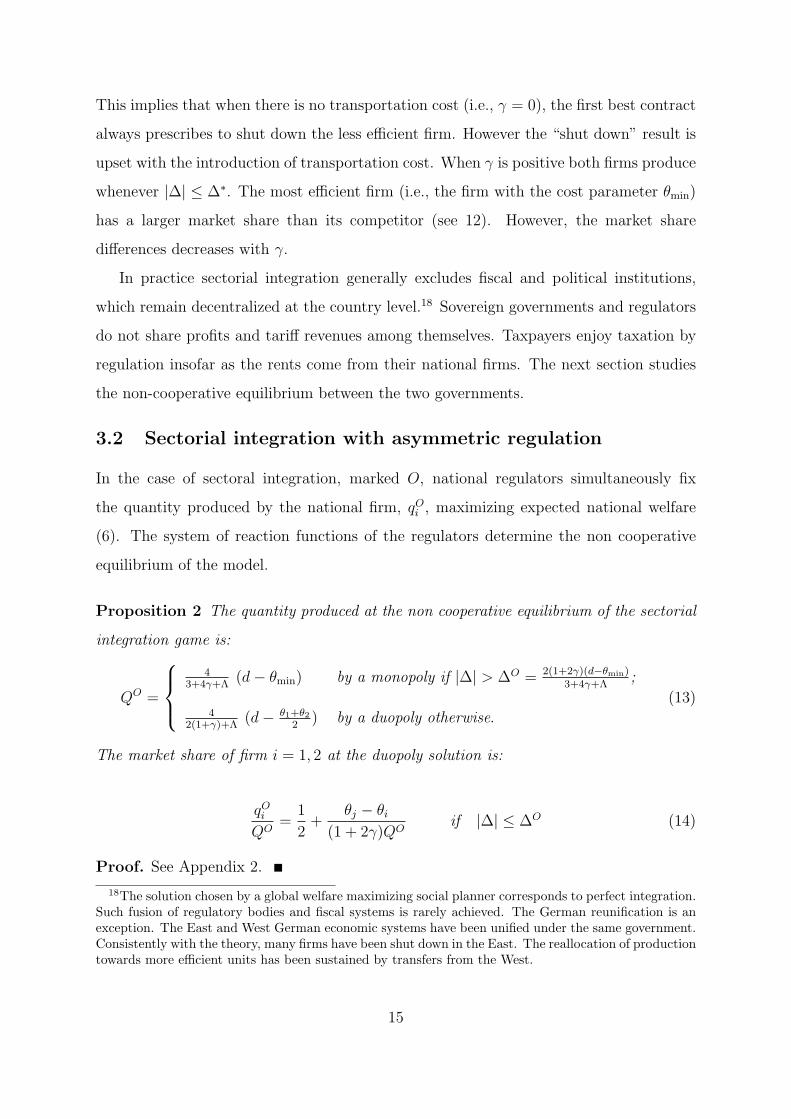
Comparing equations (13) and (11) the equilibrium solution implies that the shut
down of the less efficient firm occurs less often than in the socially optimal solution.
That is, ∆O ≥ ∆∗ under assumption A0. This result is illustrated in Figure 1. The
solid lines represent the equilibrium shut down threshold of the less efficient firm in the
integrated market with independent regulators. The dotted lines represent the optimal
threshold.19
Figure 1: Shut down threshold of the less efficient firm. Dotted line: optimal threshold, Solidline: non-cooperative equilibrium.
Comparing the quantities produced in the common market with the quantities pro-
duced in a closed economy, it is straightforward to check that QO defined equation (13)
is always larger than QC = qC1 +qC2 defined equation (8). The fact that the total quantity
increases under market integration does not necessarily imply a welfare improvement. In-
deed when |∆| ≤ ∆∗, it is easy to check that QC = Q∗ defined equation (11). We deduce
19The figure is plotted for d = 1, Λ = 0.3, γ = 0.5, θi ∈ [0, 1] and θmin = 0. The same shape is obtained
for any support such as θ − θ > 2γ(d−θmin)1+2γ+Λ .
16
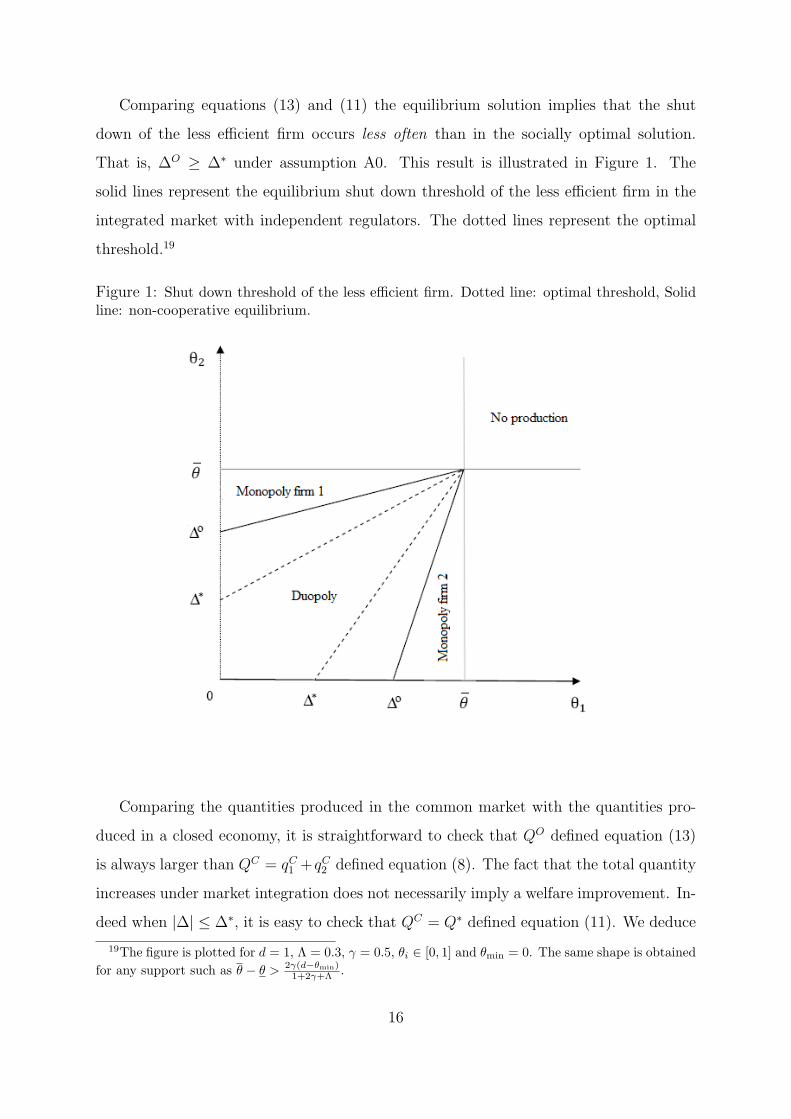
that excessive production occurs in the common market. To be more specific comparing
QO and Q∗ yields
QO ≥ Q∗ ⇔ |∆| ≤ ∆O/∗ = (2γ+Λ)(d−θmin)1+2γ+Λ
. (15)
Figure 2: Total Quantities Q∗, QO and QC in function of |∆|
Figure 2 illustrates the results. It represents for a given θmin the quantity levels Q∗, QO
and QC in function of |∆| ∈ [0, d]. The flat sections correspond to the shut down of the
less efficient producer. When |∆| is smaller than ∆O/∗, regulators fight to maintain their
market shares by boosting domestic production. Aggregate quantities are then larger in
the common market than at the optimum. In a closed economy, the regulator with the
less efficient technology chooses a small quantity to enjoy high Ramsey margin. However,
in the open economy, the Ramsey margin is eroded by competition and producing such
a small quantity is no longer optimal. It only reduces the market share of the domestic
firm. In his attempt to mitigate the business stealing effect the regulator increases the
17
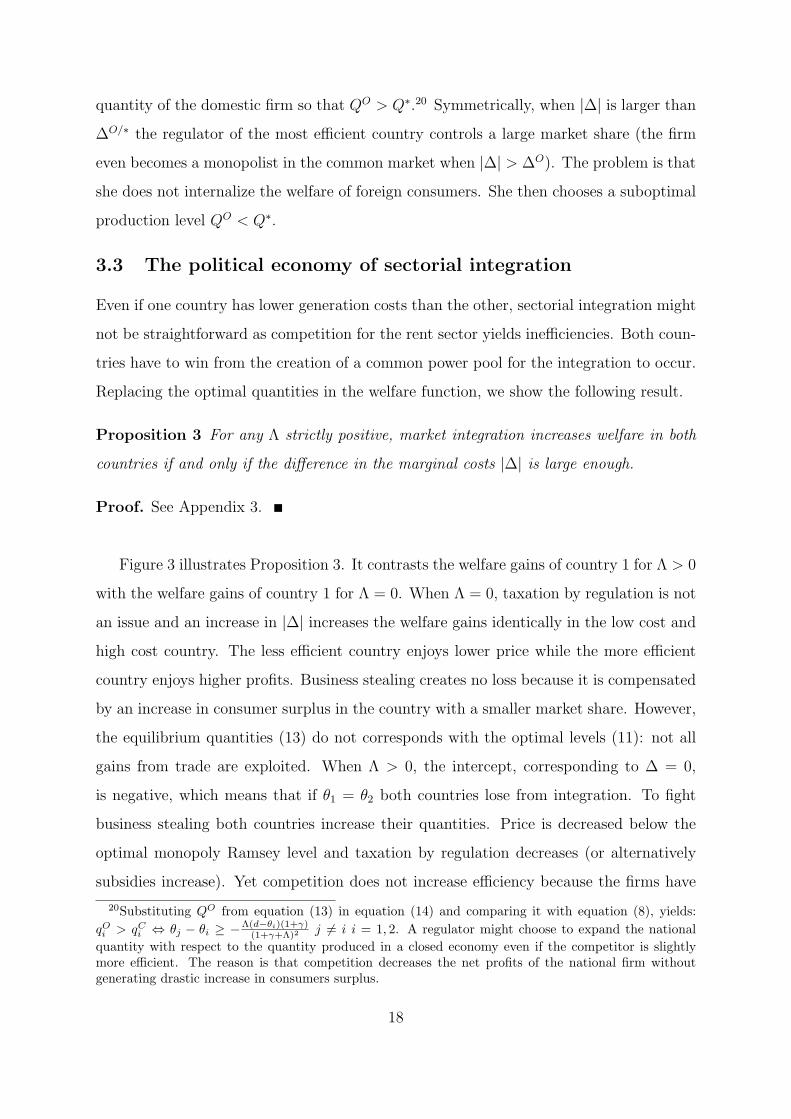
quantity of the domestic firm so that QO > Q∗.20 Symmetrically, when |∆| is larger than
∆O/∗ the regulator of the most efficient country controls a large market share (the firm
even becomes a monopolist in the common market when |∆| > ∆O). The problem is that
she does not internalize the welfare of foreign consumers. She then chooses a suboptimal
production level QO < Q∗.
3.3 The political economy of sectorial integration
Even if one country has lower generation costs than the other, sectorial integration might
not be straightforward as competition for the rent sector yields inefficiencies. Both coun-
tries have to win from the creation of a common power pool for the integration to occur.
Replacing the optimal quantities in the welfare function, we show the following result.
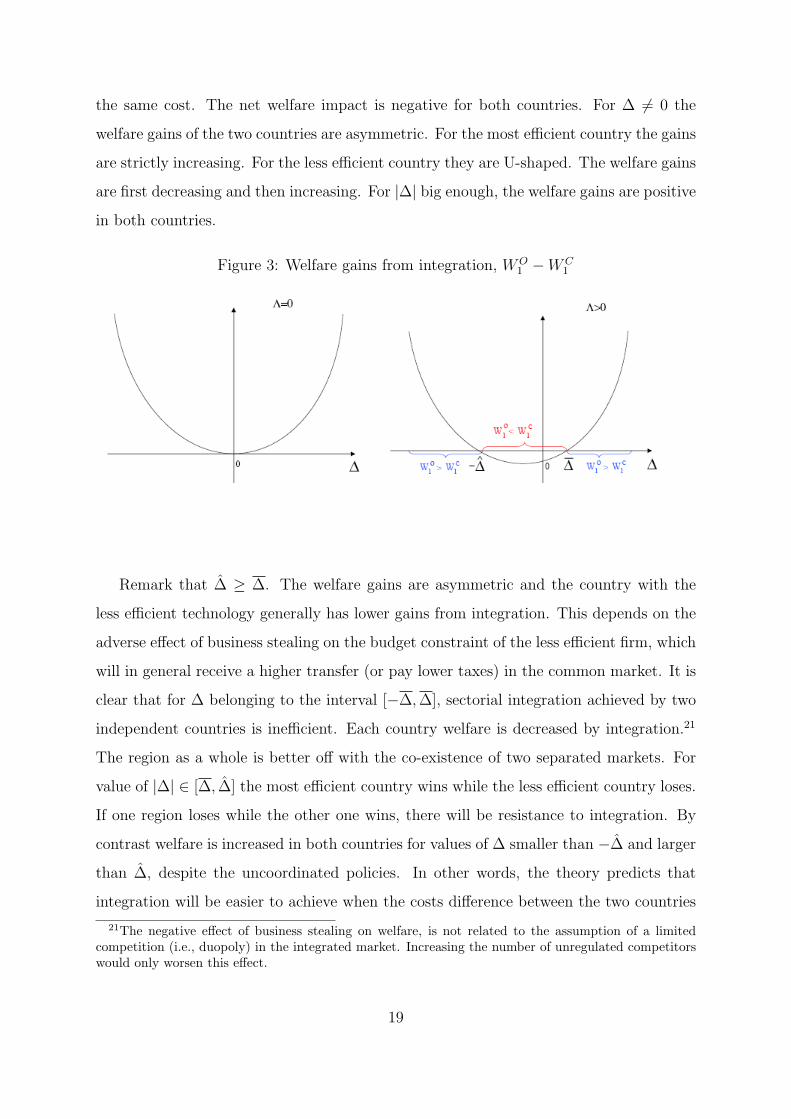
Proposition 3 For any Λ strictly positive, market integration increases welfare in both
countries if and only if the difference in the marginal costs |∆| is large enough.
Proof. See Appendix 3.
Figure 3 illustrates Proposition 3. It contrasts the welfare gains of country 1 for Λ > 0
with the welfare gains of country 1 for Λ = 0. When Λ = 0, taxation by regulation is not
an issue and an increase in |∆| increases the welfare gains identically in the low cost and
high cost country. The less efficient country enjoys lower price while the more efficient
country enjoys higher profits. Business stealing creates no loss because it is compensated
by an increase in consumer surplus in the country with a smaller market share. However,
the equilibrium quantities (13) do not corresponds with the optimal levels (11): not all
gains from trade are exploited. When Λ > 0, the intercept, corresponding to ∆ = 0,
is negative, which means that if θ1 = θ2 both countries lose from integration. To fight
business stealing both countries increase their quantities. Price is decreased below the
optimal monopoly Ramsey level and taxation by regulation decreases (or alternatively
subsidies increase). Yet competition does not increase efficiency because the firms have
20Substituting QO from equation (13) in equation (14) and comparing it with equation (8), yields:
qOi > qCi ⇔ θj − θi ≥ −Λ(d−θi)(1+γ)(1+γ+Λ)2 j = i i = 1, 2. A regulator might choose to expand the national
quantity with respect to the quantity produced in a closed economy even if the competitor is slightlymore efficient. The reason is that competition decreases the net profits of the national firm withoutgenerating drastic increase in consumers surplus.
18
the same cost. The net welfare impact is negative for both countries. For ∆ = 0 the
welfare gains of the two countries are asymmetric. For the most efficient country the gains
are strictly increasing. For the less efficient country they are U-shaped. The welfare gains
are first decreasing and then increasing. For |∆| big enough, the welfare gains are positive
in both countries.
Figure 3: Welfare gains from integration, WO1 −WC
1
Remark that ∆ ≥ ∆. The welfare gains are asymmetric and the country with the
less efficient technology generally has lower gains from integration. This depends on the
adverse effect of business stealing on the budget constraint of the less efficient firm, which
will in general receive a higher transfer (or pay lower taxes) in the common market. It is
clear that for ∆ belonging to the interval [−∆,∆], sectorial integration achieved by two
independent countries is inefficient. Each country welfare is decreased by integration.21
The region as a whole is better off with the co-existence of two separated markets. For
value of |∆| ∈ [∆, ∆] the most efficient country wins while the less efficient country loses.
If one region loses while the other one wins, there will be resistance to integration. By
contrast welfare is increased in both countries for values of ∆ smaller than −∆ and larger
than ∆, despite the uncoordinated policies. In other words, the theory predicts that
integration will be easier to achieve when the costs difference between the two countries
21The negative effect of business stealing on welfare, is not related to the assumption of a limitedcompetition (i.e., duopoly) in the integrated market. Increasing the number of unregulated competitorswould only worsen this effect.
19
is large.
As in the trade and competition literature (starting with Brander and Spencer, 1983),
the welfare losses arise because of the two countries rivalry over the market shares. This
literature shows that, when considering trade subsidies to identical firms, the welfare
losses can be reduced by jointly banning the subsidies and commit to a laissez-faire
policy (Brander and Spencer, 1983, Collie, 2000). We can recover this result by setting
specific values of the parameters in our model. As show in Appendix 7, when firms are
identical the countries could avoid the prisoner dilemma related to market share rivalry
by banning quantity regulation for some values of Λ (as in the case studied in Collie,
2000) but the result does not hold in general for heterogeneous firms.22
In addition to the global welfare impact, the creation of an integrated market with
common price P (QO) has redistributive effects. To see this point let focus on |∆| ≤ ∆O.
We can then show that market integration induces a price reduction in country i = 1, 2
if and only if the costs difference is not too large.23 That is,
P (QO) ≤ P (qci ) ⇔ θj − θi ≤Λ(d− θi)
1 + γ + Λj = i i = 1, 2 (16)
Price convergence is usually considered positively, because it is a sign of effective
market integration. However, for some countries it can imply that prices are higher after
integration than in the closed economy. Indeed equation (16) shows that if |∆| > Λ(d−θmin)1+γ+Λ
then the price decreases in the less efficient region and increases in the more efficient
one.24 Consumers of the relatively efficient region are then worse off after integration.
This can be a source of social discontent and opposition towards sectorial integration. The
interests of the national firm/taxpayers are conflicting with the interests of the domestic
consumers. Market integration increases the profit opportunities of the efficient firm, by
increasing the number of potential consumers. If the government is able to extract a fair
22When firms have different production costs, abandoning quantity regulation can improve welfare forthe country with a relatively efficient firm but not for the other one.
23Substituting QO from equation (13) in the inverse demand function yields the equilibrium price
P (QO) =d(Λ
2 +γ)+θ1+θ2
2
1+γ+Λ2
if |∆| ≤ ∆O(θmin). Comparing this price with the price in the closed economy,
24For instance when Λ = 0 the price in the integrated market is equal to the average marginal cost.Since the average marginal cost is the average of the prices in the two closed economies, the price increasesin the more efficient country and decreases in the less efficient one.
20
share of these new market rents, it can use them to finance new investments or cross
subsidies for the benefit of taxpayers. If the government is unable to size the firm’s rents,
both domestic taxpayers and consumers are worse off (shareholders are the only winner).
By contrast if the firms are not drastically different (i.e., if |∆| ≤ Λ(d−θmin)1+γ+Λ
) prices
decrease in both countries because of the business stealing effect. Benevolent regulators
are willing to increase their transfers to the national firm to sustain low prices so that
taxation by regulation decreases. The negative fiscal effect is a major concern in develop-
ing countries where tariffs play an important role in raising funds (see Laffont, 2005 and
Auriol and Picard, 2007). When public funds are scarce and other sources of taxation are
distortionary or limited, market integration, which has a negative impact on taxpayers
and on the industry ability to finance new investments, induces welfare losses.
4 Investment
The proponent of regional power pools claim that, by fostering the emergence of a larger
market, they will stimulate investments. However, it is not clear that the model of inte-
gration favored by many regions in the world, especially by the African Union, provides
an adequate framework for investment incentives. Unless the costs difference between two
regions is sufficiently large, market integration with asymmetric regulation can decrease
the aggregate capacity of financing new investment. Yet electricity demand is on the rise
everywhere, and in many regions aging generation and transportation facilities need ur-
gently to be upgraded and expanded. For instance in Sub-Saharan Africa the annualized
investment costs required simply to maintain in 2015 current access rate (less than 30%
of the population) are estimated to be around 5 percent of the region GDP. Moreover,
specific investment, such as transportation and interconnection facilities, are required to
achieve market integration. It is estimated that some 26 GW of interconnectors, for a
cost of $ 500 million per year, are lacking for the creation of a regional power-trading
market in SSA (Rosnes and Vennemo, 2008). Similarly the vast hydropower potential of
the continent is unexploited because of the lack of investment.
This section studies the investments made by firms subjected to asymmetric regu-
lation. Our analysis focuses on two types of investment. The first type reduces the
21
production cost of the investing firm (e.g., generation facilities). It is referred to as “pro-
duction cost reducing” or “θ-reducing” investment. It only benefits the investing producer
and makes it more aggressive in the common market. We assume that this investment
is only possible in one country, by convention country 1, because of the availability of a
specific input or technology. One can think of a dam. Hydropower potentials (but also
natural resources such as oil or gas) are unevenly distributed across countries. Country
1 can reduce its production cost from θ1 to δ θ1 (δ < 1) by investing a fixed amount Iθ.
The second type of investment decreases the transportation cost γ. We refer to this
kind of investment as “transportation cost reducing” or “γ-reducing” investment. In the
integrated market the competitor of the investing firm also benefit from the investment.
One can think of investment in transmission, interconnection, or interoperability facilities.
We assume that both countries can reduce the collective transportation cost from γ to
sγ with s ∈ (0, 1) by investing a fixed amount Iγ > 0.
For both types of investment we focus on interior solutions. Cost difference is assumed
to be small enough so that the production of the two firms is positive in the common
market. The following assumption ensures that there is no shut down in the first best
case (see ∆∗ in equation (11)).25
A1 |θ2 − δθ1| ≤ 2sγ(d−min{δθ1,θ2})1+2sγ+Λ
.
4.1 Investment in generation
We start by considering the solution induced by the global welfare maximizer of Section
3.1. Let q∗Iθi be the quantity produced by firm i = 1, 2 in the case of θ-reducing investment
by firm 1. The optimal quantities are given by equations (11) and (12) where θ1 is replaced
by δθ1 (δ < 1). Substituting the quantities q∗Iθi (i = 1, 2) in the welfare function defined
equation (10), the gross utilitarian welfare is W ∗Iθ = W (q∗Iθ1 , q∗Iθ2 ). The welfare gain of
the investment, W ∗Iγ −W ∗, has to be compared with the social cost of the investment
(1 + λ)Iθ. The social cost of investment Iθ is weighted by the opportunity cost of public
funds because devoting resources to investment decreases the firm’s operating profit and
25Assumption A1 ensures that both firms produce in all possible cases. As illustrated by the analysis ofSection 3 this assumption is not crucial. Our results are preserved when shut down cases are considered(computations are available on request). Yet it simplifies greatly their exposition.
22
thus the revenue of the government by Iθ, which has an opportunity cost of (1+ λ). The
global welfare maximizer regulator invests if and only if W ∗Iθ − W ∗ ≥ (1 + λ)Iθ. Let
denote I∗θ the maximal level of investment which satisfies this inequality:
I∗θ =1
1 + λ[W ∗Iθ −W ∗] (17)
The non cooperative equilibrium quantities in the case of sectoral integration, qOIθi ,
and the quantities in the case of a closed economy, qCIθi , are derived in a similar way
from equations (13) and (8) respectively where θ1 is replaced by δθ1. Substituting the
quantities qkIθi (i = 1, 2 and k = O,C) in the welfare function of country 1 defined
equation (6), the regulator of country 1 invests if and only if W kIθ1 − W k
1 ≥ (1 + λ)Iθ.
We deduce the maximal level of investment that country 1 is willing to commit in the
common market and in the closed economy:
Ikθ =1
1 + λ[W kIθ
1 −W k1 ] k = O,C (18)
Proposition 4 Let I∗θ and ICθ , IOθ be defined equation (17) and (18) respectively. Let
Λ > 0, ∆ = θ2 − θ1 and δ ∈ (0, 1). There are 3 thresholds values ∆1 < ∆2 < ∆3 such
that:
• IOθ > ICθ ⇔ 0 > ∆ > ∆1.
• I∗θ > ICθ ⇔ 0 > ∆ > ∆2.
• I∗θ > IOθ ⇔ ∆ > ∆3.
Proof. See Appendix 4.
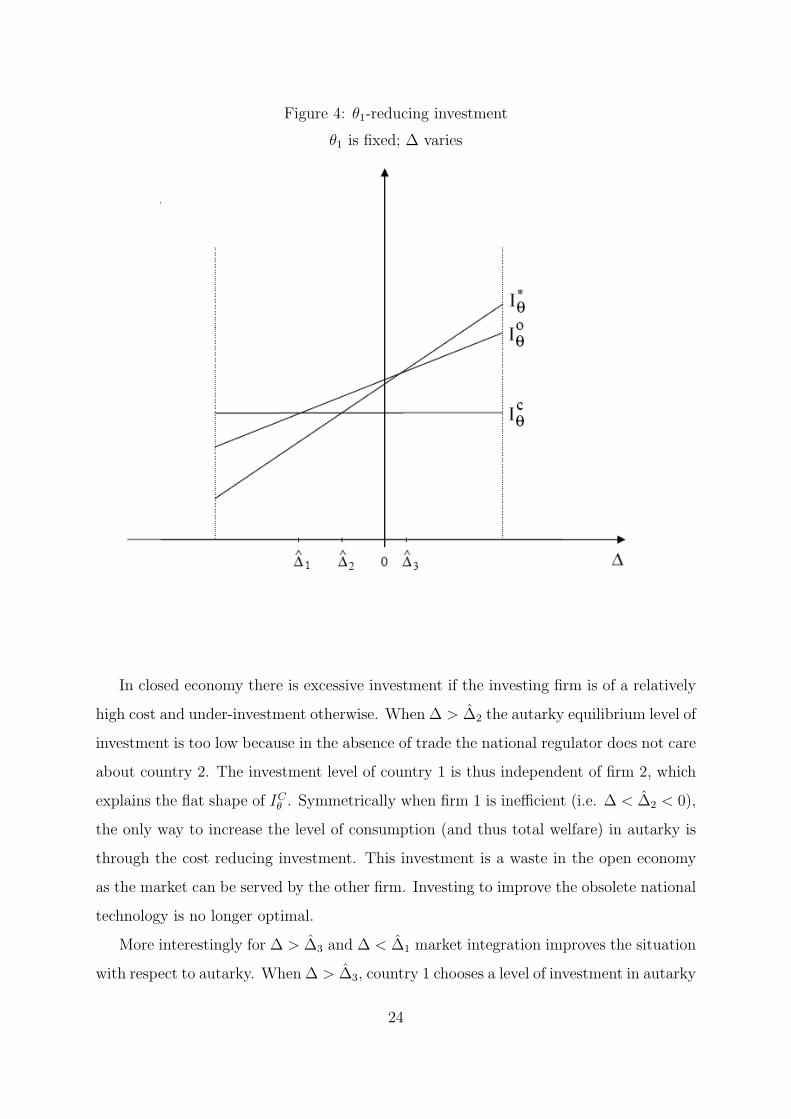
Figure 4 illustrates the results of Proposition 4. It is drawn for a fixed value of
δθ1. The static comparative parameter is ∆. When Λ = 0, business stealing has no
adverse impact on national welfare so that ∆1 = ∆2 = ∆3 =(1−δ)θ1
2. In this case market
integration unambiguously reduces the gap between optimal and equilibrium level of
investment. However when Λ > 0, the threshold ∆1 and ∆3 shifts to the left and to the
right respectively while ∆2 is not affected (see Appendix 4).26 When Λ is large enough
∆3 becomes positive.
26When Λ increases, all thresholds IOθ , I∗θ ICθ are shifted downwards because the social cost of invest-ment increases. However, IOθ decreases less because investment becomes important to reduce businessstealing effect in the common market. As a result, the region of overinvestment increases.
23
Figure 4: θ1-reducing investment
θ1 is fixed; ∆ varies
In closed economy there is excessive investment if the investing firm is of a relatively
high cost and under-investment otherwise. When ∆ > ∆2 the autarky equilibrium level of
investment is too low because in the absence of trade the national regulator does not care
about country 2. The investment level of country 1 is thus independent of firm 2, which
explains the flat shape of ICθ . Symmetrically when firm 1 is inefficient (i.e. ∆ < ∆2 < 0),
the only way to increase the level of consumption (and thus total welfare) in autarky is
through the cost reducing investment. This investment is a waste in the open economy
as the market can be served by the other firm. Investing to improve the obsolete national
technology is no longer optimal.
More interestingly for ∆ > ∆3 and ∆ < ∆1 market integration improves the situation
with respect to autarky. When ∆ > ∆3, country 1 chooses a level of investment in autarky
24
that is too low. Without an access to the foreign market, the investment is oversized for
the domestic demand. Market integration helps to increase the level of investment that
country 1 is willing to sustain by enlarging the market size. Symmetrically, in the closed
economy, when ∆ < ∆1 country 1 overinvests in marginal improvements of its technology
because it has no access to the foreign technology. In the common market, the national
consumers can be served by the foreign firm at a lower price. Investing to improve the
inefficient national technology is not attractive anymore. Market opening improves the
situation with respect to autarky by reducing the level of wasteful investments. However
it does not restore the first best level. When ∆ > ∆3 the open market equilibrium of
investment is too low because the investing country does not fully internalize the increase
in the foreign consumer surplus (it internalizes sales). Symmetrically, when ∆ ≤ ∆3 it is
too high: the possibility to reduce its cost gap and to expand its market share by serving
foreign consumers makes a high level of investment attractive.
For ∆1 < ∆ < ∆2, there is excessive investment both under closed and open economy.
However the over-investment problem is more severe in the open economy. This would be
a case in which market integration worsen the incentives to invest with respect to autarky.
When ∆ > ∆1 a production cost reducing investment raises the relative efficiency of the
national firm. It invests to strengthen its position in the common market and to reduce
the business stealing problem. It does not internalize the cost it imposes on country 2
and overinvests with respect to autarky. However, the values of ∆ corresponding to this
situation, [∆1, ∆2] are generally included in the interval [−∆,∆], for which the country
with the less efficient technology would not accept integration in the first place (see
Section 3).27
We conclude that when it occurs without pressure from the outside (i.e., when the
costs difference between the two regions is large enough), power markets integration tends
to improve the incentives to invest in efficient generation facilities. It allows more projects
to be financed, as argued by its proponents.
27It is not easy to compare the relevant thresholds analytically. We have tested many values of theparameters by way of simulations and the intervals ∆1, ∆2 always fell in [−∆, 0]. For instance, for d = 2,Λ = 0.15, θ1 = 1/2, δ = 9/10, and s = 9/10, we have that −∆ = −0.5, ∆ = 0.01, ∆1 = −0.23,∆2 = −0.08 and ∆3 = 0.02. Finally, the admissible values for ∆ under Assumption A1 are in theinterval [−1.0, 0.57]
25
4.2 Transportation Cost Reducing Investment
In this section we study the case where the collective transportation cost can be reduced
from γ to sγ with s ∈ (0, 1) by an investment of Iγ > 0. We first consider the level
of investment induced by the global welfare maximizer of Section 3.1. Let q∗Iγi be the
quantity produced by firm i = 1, 2 in the case of investment. The optimal quantities
are obtained by substituting sγ in equations (11) and (12). The gross utilitarian welfare
in the case of investment is the welfare function defined equation (10) evaluated at the
actualized quantities: W ∗Iγ = W (q∗Iγ1 , q
∗Iγ2 ). The global welfare maximizer chooses to
invest if and only if: W ∗Iγ −W ∗ ≥ (1 + λ)Iγ. Let I∗γ be the maximal level of investment
which satisfy this inequality:
I∗γ =1
1 + λ[W ∗Iγ −W ∗] (19)
The non cooperative equilibrium investment level of market integration is obtained
in a similar way. The quantity produced by firm i after investment, qOIγi , is obtained
by substituting sγ in equation (13). Let WOIγi be country i = 1, 2 welfare function (6)
evaluated at (qOIγ1 , q
OIγ2 ). The maximum level of investment that country i is willing to
make in the common market is:
IOγi = max
[0,
1
1 + λ[W
OIγi −WO
i ]
](20)
Intuitively transportation cost reducing technology increases the business stealing
effect. Although this has an adverse effect on both countries, the negative impact is
larger for the high cost firm. One can hence check equation (14) that the market share of
the less efficient country decreases after the investment. For this reason, the welfare effect
generated by the transportation cost reducing investment in the less efficient country can
be negative so that IOγi can be equal to zero. In particular, this occur for large values of
Λ (see Appendix 5 for details). By contrast the investment always increases the gross
welfare of the most efficient country. The maximal level of investment for the more
efficient firm is always positive and higher than the maximal level of investment for the
less efficient one. Since γ-reducing investment benefit equally the two producers, in the
26
common market the level of investment that each country is willing to finance depends
on the investment choice by the other country.
Lemma 2 Let IO
γ be the maximal level of investment for the more efficient firm and IOγ
the maximal level of investment for the less efficient one as defined in (20). Then, if
Iγ > IO
γ there is no investment. If IOγ < Iγ ≤ IO
γ , the more efficient firm invests and the
less efficient one does not. If Iγ ≤ IOγ there are two Nash equilibria in pure strategies in
which one of the firm invests and the other does not.28
Proof. See Appendix 5.
By virtue of Lemma 2 the decision of the more efficient firm determines the maxi-
mal equilibrium level of investment attainable in the common market. Comparing the
maximum investment level in open economy with the optimal level yields the following
result.
Proposition 5 In the integrated market the investment level in γ-reducing technology is
always suboptimal:
IO
γ ≤ IO
γ + IOγ ≤ I∗γ ∀∆,Λ ≥ 0 (21)
Proof. See Appendix 5.
In our specification, γ-reducing investment increases the efficiency of all firms. Since it
reduces the transportation costs both in investing and non-investing countries, a reduction
in γ has a public good nature. It is thus intuitive that investment level IO
γ is sub-optimal.
The investing country does not take into account the impact of the investment on the
foreign country. However the under-investment problem goes deeper than simple free-
riding. Even if each country was willing to contribute up to the point where the cost of
investment outweighs the welfare gains generated by investment (i.e., without free-riding
on the investment made by the other) the total investment level IO
γ + IOγ would still be
28We focus on pure strategies. Yet there is a mixed strategy equilibrium in which firm i, i = j invests
with probability πi =W
OIγj −(1+λ)Iγ−WO
j
WOIγj −WO
j
. This equilibrium is inefficient because with positive probability
both firms invest, or alternatively, no firm invests.
27
sub-optimal. To analyze the origin of this inefficiency we study countries’ incentives to
invest in a closed economy.
Let qCIγi be the quantity produced by firm i in the case of investment in a closed
economy. It is obtained by substituting sγ in equation (8). Let WCIγi be the country
i = 1, 2 welfare function (6) evaluated at qCIγi . Investment is optimal in country i if and
only if WCIγi −WC
i ≥ (1 + λ)Iγ so that:
ICγi =1
1 + λ[W
CIγi −WC
i ]. (22)
Comparing (22) with (20) yields the next proposition.
Proposition 6 Let ICγ be the maximal amount that the most efficient country is willing
to invest to reduce transportation costs in the closed economy and IOγ be the maximal
amount it is willing to invest in the common market. There exists ∆ > 0 such that
IOγ > ICγ if and only if |∆| > ∆.
Proof. See Appendix 6.
The maximal level of investment sustainable in the open economy is lower than in
the case of autarky if ∆ is relatively small. Indeed investment reduces the costs of the
competitor and makes it more aggressive in the common market. The business stealing
effect, while reducing investing country total welfare, also reduces its capacity to finance
new investment. Market integration may thus generate an insufficient level of γ-reducing
investment for two reasons. The first reason is that investment has a public good feature.
The investing country does not internalize the benefits on foreign stakeholders. The
second reason is that investment decreases the costs of the competitor, worsening the
business stealing effect.29
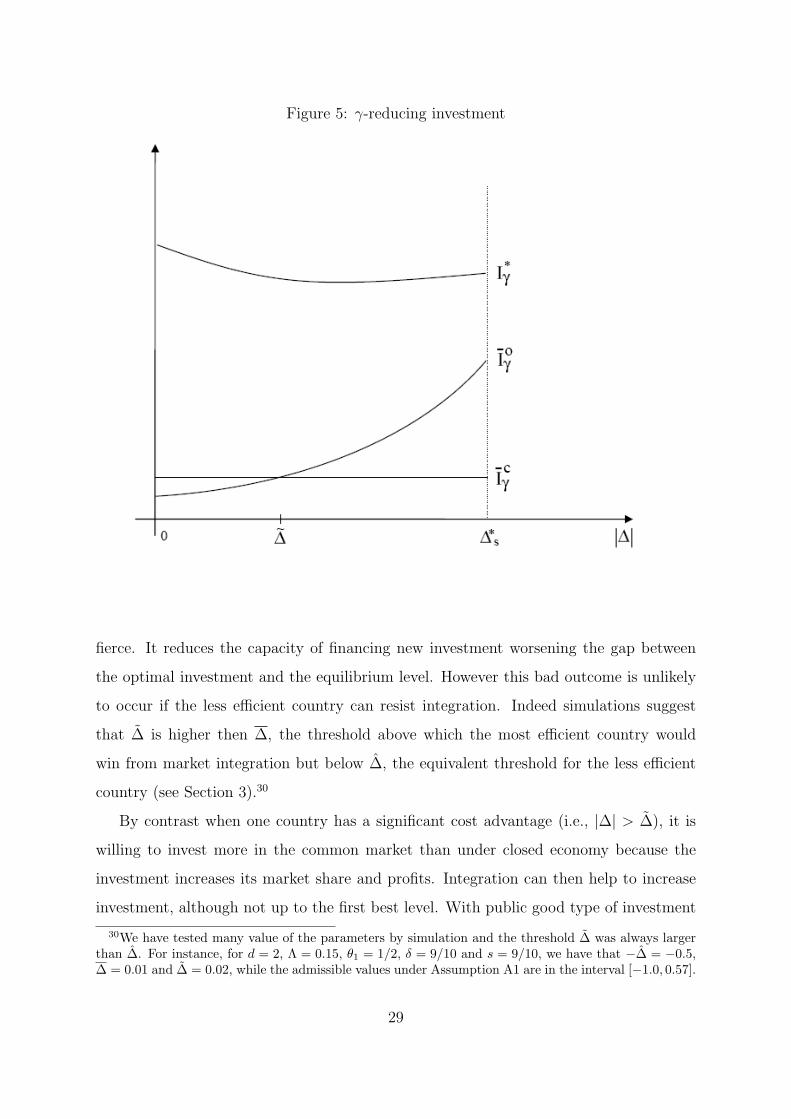
Figure 5 illustrates the results of Propositions 5 and 6.
Under market integration, when ∆ is relatively small (i.e., (|∆| ≤ ∆), the maximal
level of investment is not only sub-optimal, but it is also smaller than under a closed
economy. When the two regions’ cost are not drastically different business stealing is
29By contrast for Λ = 0, IOγ > ICγ ∀∆ ≥ 0 and IOγ − ICγ is an increasing function of ∆. When publicfunds are free business stealing is no longer a problem so that market integration always increases thelevel of sustainable investment compared to a closed economy.
28
Figure 5: γ-reducing investment
fierce. It reduces the capacity of financing new investment worsening the gap between
the optimal investment and the equilibrium level. However this bad outcome is unlikely
to occur if the less efficient country can resist integration. Indeed simulations suggest
that ∆ is higher then ∆, the threshold above which the most efficient country would
win from market integration but below ∆, the equivalent threshold for the less efficient
country (see Section 3).30
By contrast when one country has a significant cost advantage (i.e., |∆| > ∆), it is
willing to invest more in the common market than under closed economy because the
investment increases its market share and profits. Integration can then help to increase
investment, although not up to the first best level. With public good type of investment
30We have tested many value of the parameters by simulation and the threshold ∆ was always largerthan ∆. For instance, for d = 2, Λ = 0.15, θ1 = 1/2, δ = 9/10 and s = 9/10, we have that −∆ = −0.5,∆ = 0.01 and ∆ = 0.02, while the admissible values under Assumption A1 are in the interval [−1.0, 0.57].
29
there is always under-investment. This is in sharp contrast with investment in generation,
where sectorial integration might lead to over-investment.31
5 Conclusion
Market integration has complex welfare implications in non-competitive industries con-
trolled by national regulators. Unless the difference in production costs between two
regions is large, economic integration achieved by sovereign countries is unlikely to be
successful. When the two national champions are not sufficiently differentiated in terms
of productivity, the competition for market shares induced by the integration process is
welfare-degrading in both countries. Even when the efficiency gains from integration are
large enough so that both countries win from integration, opposition might still subsist
internally. Indeed market integration has redistributive effects. For instance, when the
cost difference between the two countries is large enough, the possible adverse impact of
price convergence on consumers in the low-price region will be a source of opposition and
discontent toward the integration process.
Integration of market economies is generally presented by its proponents as a powerful
tool in stimulating investment in infrastructure industries. Intuitively, some investments
that are oversized for a country should be profitable in an enlarged market. When the
costs difference between the two countries is large enough market integration tends indeed
to increase the level of sustainable investment. However, the investment level remains
suboptimal because the countries endowed with cheap power (e.g., hydropower) do not
fully internalize the surplus of the consumers in the foreign countries; They internalize
the sales only. Symmetrically when the investing country is less efficient than its competi-
tor it overinvests to close its productivity gap and win market shares. With generation
facilities, there is under-investment in efficient technologies and over-investment in inef-
31When the initial level of costs difference between the two regions is not large enough the businessstealing effect tilts the investment incentives in the wrong direction. For instance if −∆2 < θ1 − θ2 <min{∆,−∆2} with ∆ being defined Proposition 6, then under market integration country 2 under-investsin γ-reducing technology while country 1 over-invests in θ-reducing technology. The latter investmentreduces the gap between the two regions production costs, which reduces further the incentives of country2 to invest in transportation and interconnection facilities. By virtue of Proposition 3 welfare decreasesin both regions.
30
ficient ones. This is in contrast with the systematic under-investment problem arising
for interconnection and transportation facilities, and other public-good components of
the industry, such as reserve margins. Free-riding reduces the incentives to invest, while
business-stealing reduces the capacity for financing new investment, especially in the im-
porting country. This result is important for policy purpose. The issue of how to finance
these essential facilities needs to be addressed upfront. This is clearly a case where inter-
national organizations/agencies can play an important role in coordinating sustainable
level of investment.
References
M. Armstrong and D. Sappington. Recent developments in the theory of regulation.Handbook of Industrial Organization, 3, 2005.
E. Auriol. Deregulation and quality. International Journal of Industrial Organization, 16(2):169–194, 1998.
E. Auriol and P.M. Picard. Infrastructure and Public Utilities Privatization in DevelopingCountries. The World Bank Economic Review, 2007.
The World Bank. World Development Indicators 1998. World Bank, Washington, D.C.,1998.
T. Besley and M. Ghatak. Government versus private ownership of public goods*. Quar-terly Journal of Economics, 116(4):1343–1372, 2001.
T. Besley and M. Ghatak. Public goods and economic development. Understandingpoverty, page 285, 2006.
G. Biglaiser and C.A. Ma. Regulating a dominant firm, unknown demand and industrystructure. RAND Journal of Economics, 26:1–19, 1995.
J. Brander. Strategic Trade Theory. Handbook of International Economics, 3, 1997.
J.A. Brander and B.J. Spencer. International R & D Rivalry and Industrial Strategy.The Review of Economic Studies, 50(4):707–722, 1983.
B. Caillaud. Regulation, competition and asymmetric information. Journal of EconomicTheory, 52:87–100, 1990.
D.R. Collie. State aid in the European Union: The prohibition of subsidies in an inte-grated market. International Journal of Industrial Organization, 18(6):867–884, 2000.
A. Estache and A. Iimi. Procurement efficiency for infrastructure development and fi-nancial needs reassessed. World, 2008.
31
A. Estache and L. Wren-Lewis. Toward a theory of regulation for developing countries:Following jean-jacques laffont’s lead. Journal of Economic Literature, 47(3):729–770,2009.
A. Estache, S. Perelman, and L. Trujillo. Infrastructure performance and reform indeveloping and transition economies: evidence from a survey of productivity measures.Policy Research Working Paper Series, 2005.
J.I. Haaland and H.J. Kind. R&D policies, trade and process innovation. Journal ofInternational Economics, 74(1):170–187, 2008.
International Electricity Agency. World Energy Outlook. 2006.
P.L. Joskow and R. Schmalensee. Markets for Power. MIT Press, 1985.
J.J. Laffont. Regulation and Development. Cambridge University Press, 2005.
D. Leahy and J.P. Neary. Multilateral subsidy games. Economic Theory, 41(1):41–66,2009.
R Manibog, F. Dominguez and S. Wegner. Power for Development- A Review of theWorld Bank Group’s Experience with Private Participation in the Electricity sector.The International Bank for Reconstruction and Development, The World Bank, 2003.
J.P. Neary. Cost asymmetries in international subsidy games: should governments helpwinners or losers? Journal of International Economics, 37:197–218, 1994.
J.P. Neary. Globalization and Market Structure. Journal of the European EconomicAssociation, 1(2-3):245–271, 2003.
P.O. Pineau, A. Hira, and K. Froschauer. Measuring international electricity integration:a comparative study of the power systems under the Nordic Council, MERCOSUR,and NAFTA. Energy Policy, 32(13):1457–1475, 2004.
O. Rosnes and H. Vennemo. Powering Up: Costing Power Infrastructure InvestmentNeeds in Southern and Eastern Africa. AICD, Background Paper, World Bank, 2008.
A. Snow and R.S. Warren. The marginal welfare cost of public funds: Theory andestimates. Journal of Public Economics, 61(2):289–305, 1996.
F.T. Sparrow, W. Masters, and B.H. Bowen. Electricity Trade and Capacity ExpansionOptions in West Africa. Purdue University, 2002.
V. Tanzi and H. Zee. Tax policy for developing countries, volume 27. InternationalMonetary Fund, 2001.
B. Tovar and L. Trujillo. A Short Note on the Economic Efficiency of East AfricanElectricity Operators. The World Bank, 2004.
32
Appendix 1
The supra-national regulator i maximizes welfare (10) with respect to qi, i ∈ {1, 2}. Thefirst order condition gives:
(1 + λ)(d− qi(1 + γ)− qj − θi) +qi + qj
2= 0 (23)
Consider first the interior solution. Solving the system characterized in (23) for i = 1, 2and letting Λ = λ
1+λwe obtain:
q∗i =d− θ1+θ2
2
1 + Λ + γ+
θj − θi2γ
(24)
In this case, the total quantity Q is given by:
Q∗ = q1 + q2 = 2d− θ1+θ2
2
1 + Λ + γ
We now consider the shut down case qi = 0. This arises when θi − θj ≥ 2γ(d−θj)
1+Λ. In this
case, only the most efficient firm j is allowed to produce and the total quantity is givenby:
q∗j = Q∗ = 2(d− θj)
1 + 2γ + Λ
If θi < θj, a symmetric condition describes the shut down case for firm j, i = j, i.e.
θj − θi ≥ 2γ(d−θi)1+Λ
. Letting θmin = min{θ1, θ2} and |∆| = |θ2 − θ1| = |θ1 − θ2|, Equation(11) resumes the results. Substituting in the inverse demand function (2) we then obtainthe expression for the price.
Appendix 2
Maximizing the welfare function (6) we obtain the first order condition:
(1 + λ)(d− θi)−1
4[qj(1 + 2λ) + qi(3 + 4λ+ 4γ(1 + λ))] = 0 (25)
Rearranging terms and taking letting Λ = λ1+λ
, we obtain the reaction function of regu-lator i to the quantity induced by regulator j (i = j), namely qi(qj):
qi(qj) =4(d− θi)− qj(1 + Λ)
3 + Λ + 4γ(26)
The equilibrium is given by the intersection of the two best response functions character-ized in (26) (taking into account that quantities must be non negative). If the intersectionis reached when both quantities are positive, we have:
qOi = 4d− θ1+θ2
2
2(1 + γ) + Λ+
θj − θi1 + 2γ
(27)
33
In this case, the total quantity Q is given by:
QO = qO1 + qO2 = 4d− θ1+θ2
2
2(1 + γ) + Λ
However, we also have to consider the shut down case qi = 0. This arises when qj ≥ 4d−θi1+Λ
,
or equivalently θi − θj ≥ 2(1+2γ)(d−θi)3+4γ+Λ
< 0. The shut down case thus writes, for θi > θj:
QO = qj(qi = 0) = 4d− θj
3 + 4γ + Λ
If θi < θj, a symmetric condition describes the shut down case for firm j, i = j. Lettingθmin = min{θ1, θ2} and |∆| = |θ2− θ1| = |θ1− θ2|, the expression for the optimal quantityis thus reassumed in (13). Substituting in the inverse demand function (2) we then obtainthe expression for the price given in (13).
Appendix 3
Consider country 1 (the same holds for country 2 inverting θ1 and θ2 and replacing ∆with −∆ in all expressions). Replacing for the participation constraint of the nationalfirm, welfare in country 1 in the case of closed economy writes:
WC1 = S(qC1 ) + λP (qC1 )q
C1 − (1 + λ)(θ1 + γ
qC12)qC1 − (1 + λ)K (28)
Substituting for the value of the quantities (8) and (13) in (28) and (5) respectively, wecompute the welfare gains from integration WO
i −WCi . Rearranging terms we obtain:
WO1 −WC
1 = ∆2Λ1 +∆(d− θ1)Λ2 + (d− θ1)2Λ3
Where:
Λ1 =
2
(3+4γ+Λ)2, if ∆ < −2(1+2γ)(d−θ2)
3+4γ+Λ;
(1+γ(1−Λ))(3+4γ+Λ)2(1+2γ)2(1−Λ)(2(1+γ)+Λ)2
, if −2(1+2γ)(d−θ2)3+4γ+Λ
≤ ∆ ≤ 2(1+2γ)(d−θ1)3+4γ+Λ
;
0, if ∆ > 2(1+2γ)(d−θ1)3+4γ+Λ
.
Λ2 =
− 8
(3+4γ+Λ)2, if ∆ < −2(1+2γ)(d−θ2)
3+4γ+Λ;
Λ(3+4γ+Λ)(1+2γ)(1+Λ)(2(1+γ)+Λ)2
, if −2(1+2γ)(d−θ2)3+4γ+Λ
≤ ∆ ≤ 2(1+2γ)(d−θ1)3+4γ+Λ
;
0, if ∆ > 2(1+2γ)(d−θ1)3+4γ+Λ
.
Λ3 =
15+16γ2+4γ(5+3Λ)+Λ(6+5Λ)2(1−Λ)(1+γ+Λ)(3+4γ+Λ)2
, if ∆ < −2(1+2γ)(d−θ2)3+4γ+Λ
;
− Λ2
2(1−Λ)(1+γ+Λ)(2(1+γ)+Λ)2, if −2(1+2γ)(d−θ2)
3+4γ+Λ≤ ∆ ≤ 2(1+2γ)(d−θ1)
3+4γ+Λ;
1+3Λ2(1−Λ)(1+γ+Λ)(3+4γ+Λ)
, if ∆ > 2(1+2γ)(d−θ1)3+4γ+Λ
.
WO1 −WC
1 is a U shaped function of ∆. For Λ = 0, WO1 −WC
1 is always non negative,with a the minimum ∆ = 0, where WO
1 −WC1 = 0. For Λ > 0 the minimum is attained in
34
∆ = −Λ(1+2γ)(d−θ1)1+γ(1+Λ)
< 0. In this case, in ∆ = 0, WO1 −WC
1 = − Λ2
2(1−Λ)(1+γ+Λ)(2(1+γ)+Λ)2< 0.
The U shape and the condition |∆| ≤ d ensure the behavior described in Proposition 3.
Appendix 4
The maximal levels of investment are derived with the same methodology used in Ap-pendix 4 for the case of γ-investment. We have:
2 are positive ∀s ∈ (0, 1),Λ ∈ [0, 1). IOγi is a upward sloping parabola with
axis of symmetry in ∆ = −Λii2 (d−θi)
2Λii1
< 0. This implies the following result:
Result 1 IOγ1 > IOγ2 if and only if θ1 < θ2.
Which by definition implies: IO
γ > IOγ .
This result is useful to prove Lemma 2.
Proof of Lemma 2
Since investment reduces the costs of both firms, if one firm invests, the best response ofthe other is not to invest. However, if one firm does not invest, the best response of the
other firm is to invest whenever Iγ < IOγi. From Result 1, we know that IO
γ > IOγ . Then,
for IOγ < Iγ < IO
γ the less efficient firm never invests and the more efficient does. For
Iγ < IOγ a firm invests if and only if the other does not.
Before comparing the maximum level of investment IO
γ with the optimal level I∗γ and
the closed economy I∗γ, we prove that γ-investment can reduce the welfare of the less
efficient country. We have:∂IOγ1∂∆
= 2∆Λii1 + (d− θ1)Λ
ii2 . Then, I
O
γ is strictly positive and
increasing in |∆|, while IOγ is U shaped. The sign of IOγ is thus ambiguous. Let WIγ1 −W1
36
be the impact of γ-reducing investment country 1 when ∆ < 0 (i.e. θ2 < θ1). By thedefinition of IOγ we can write:
WIγ1 −W1 =
IOγ1− Λ
.
Then, the welfare gains of country 1 are positive if and only if IOγ is positive. In ∆ = 0,
IOγ is positive and decreasing in |∆|. We have to prove that IOγ might be negative for
Replacing for the relevant quantities and rearranging terms we obtain:
I∗γ = ∆2Λi1 + (d− θmin)|∆|Λi
2 + (d− θmin)2Λi
3
Where:
Λi1 =
1− s
4γ
[1
s+
γ2
(1 + sγ + Λ)(1 + γ + Λ)
]Λi
2 = − (1− s)γ
(1 + γ + Λ)(1 + sγ + Λ)
Λi3 =
(1− s)γ
(1 + γ + Λ)(1 + sγ + Λ)
I∗γ is symmetric with respect to the origin (∆ = 0), because at the global optimumproduction is always reallocated in favor of the most efficient firm. Moreover, for both∆ > 0 and ∆ < 0 it has an U shape in ∆ (Λi
1 > 0, ∀s ∈ (0, 1),Λ ∈ [0, 1)).
We now compare the thresholds I∗γ and IOγ .
37
I∗γ − IOγ = ∆2Λiii1 + (d− θi)∆Λiii
2 − (d− θi)2Λiii
3
Λiii1 =
1
sγ+
1
1 + sγ + Λ− 2(1 + sγ(1− Λ))(3 + 4sγ + Λ)
(2(1 + sγ))(2(1 + sγ) + Λ)2
−1
γ− 1
1 + γ + Λ+
2(1 + γ(1− Λ))(3 + 4γ + Λ)
(2(1 + γ))(2(1 + γ) + Λ)2
Λiii2 = − 1
1 + 2sγ− 1
1 + sγ + Λ+
4(1 + sγ)2 + Λ
(1 + 2sγ)((2(1 + sγ) + Λ)2)
+1
1 + 2γ+
1
1 + γ + Λ− 4(1 + γ)2 + Λ
(1 + 2γ)((2(1 + γ) + Λ)2)
Λiii3 =
1
1 + sγ + Λ− 2(1 + sγ)
(2(1 + sγ) + Λ)2− 1
1 + γ + Λ+
2(1 + γ)
(2(1 + γ) + Λ)2
Λiii1 is positive for all s ∈ (0, 1),Λ ∈ [0, 1). Then, I∗γ − IOγ is a U shaped function of
∆. Moreover, one can easily show that I∗γ − IOγ decreases with Λ. An increase in Λ shiftsthe U curve downwards. Than, a sufficient condition for I∗γ − IOγ to be always positive isto have a positive minimum when Λ = 1. Since I∗γ − IOγ is a convex function of ∆, the
minimum is obtained from the first order condition∂(I∗γ−IOγ )
Λv1 is positive s ∈ (0, 1),Λ ∈ [0, 1), then I∗γ − IJγ is a convex U-shaped function of
∆. Moreover, one can verify that the difference I∗γ − IJγ is decreasing with Λ. Then, thedifference is minimal in Λ = 0, where:
I∗γ − IO
γ − IOγ =γ(1 + 2γ)2 − sγ(1 + 2sγ)2
4γ(1 + 2γ)2(1 + 2sγ)2> 0, ∀ s ∈ (0, 1)
Then, I∗γ − IO
γ − IOγ is always positive.
Appendix 6
In the case of closed economy, welfare with no investment is given by (28). If Iγ isinvested, the welfare function becomes:
WCIγi = S(q
CIγi ) + λP (q
CIγi )− (1 + λ)(θi + sγ
qCi2)q
CIγi − (1 + λ)K − (1 + λ)Iγ
Then, replacing for the expression for the quantities and using equation (22), themaximal investment regulator i is willing to under closed economy can be written:
ICγi =(1− s)γ(d− θi)
2
2(1 + γ + Λ)(1 + sγ + Λ)
We first check that ICγ is smaller than I∗γ . Because I∗γ is a convex function of ∆,while ICγ is constant, IOγ − ICγ is also convex in ∆. In particular, it attains a minimum in
Where N stands for “no regulation”. As in appendix 3, we consider country 1 (thesame holds for country 2 inverting θ1 and θ2 and replacing ∆ with −∆ in all expressions).Replacing the quantities qN1 and qN1 in the welfare function (6) and letting θ2 = θ1 + ∆gives:
WN1 = ∆2ΛN
1 +∆(d− θ1)ΛN2 + (d− θ1)
2ΛN3 − 1
1− ΛK
Where:
ΛN1 =
1
8(1+γ)2, if ∆ < −(1 + 2γ)(d− θ1);
(4γ(γ(1−Λ)+2−Λ)+5−Λ)2(4γ(γ+2)+3)2(1−Λ)
, if −(1 + 2γ)(d− θ1) ≤ ∆ ≤ (1 + 2γ)(d− θ2);
0, if ∆ > (1 + 2γ)(d− θ2).
ΛN2 =
1
4(1+γ2), if ∆ < (1 + 2γ)(d− θ1);
2(1+2γΛ+Λ)(1+2γ)(3+2γ)2(1−Λ)
, if −(1 + 2γ)(d− θ1) ≤ ∆ ≤ (1 + 2γ)(d− θ2);
0, if ∆ > (1 + 2γ)(d− θ2).
ΛN3 =
1
8(1+γ2), if ∆ < −(1 + 2γ)(d− θ1);
4γ(γ(1−Λ)+2−Λ)+5−Λ2(3+4γ(γ+2))2(1−Λ)
, if (1 + 2γ)(d− θ1) ≤ ∆ ≤ (1 + 2γ)(d− θ2);5+4γ−Λ
8(1+γ)2(1−Λ), if ∆ > (1 + 2γ)(d− θ1).
40
We compare this function with the welfare of country i in our base case computed re-placing in (6) the quantities derived in Appendix 2:
WO1 = ∆2ΛO
1 +∆(d− θ1)ΛO2 + (d− θ1)
2ΛO3 − 1
1− ΛK
Where:
ΛO1 =
2
(3+4γ+Λ)2, if ∆ < −2(1+2γ)(d−θ2)
3+4γ+Λ;
(1−γ(1−Λ))(4γ+Λ+3)2(2γ+1)2(1−Λ)(2+2γ+Λ)2
, if −2(1+2γ)(d−θ2)3+4γ+Λ
≤ ∆ ≤ 2(1+2γ)(d−θ1)3+4γ+Λ
;
0, if ∆ > 2(1+2γ)(d−θ1)3+4γ+Λ
.
ΛO2 =
4
(3+4γ+Λ)2, if ∆ < −2(1+2γ)(d−θ2)
3+4γ+Λ;
Λ(4γ+Λ+3)(1+2γ)(1−Λ)(1+2γ+Λ)2
, if −2(1+2γ)(d−θ2)3+4γ+Λ
≤ ∆ ≤ 2(1+2γ)(d−θ1)3+4γ+Λ
;
0, if ∆ > 2(1+2γ)(d−θ1)3+4γ+Λ
.
ΛO3 =
2
(3+4γ+Λ)2, if ∆ < −2(1+2γ)(d−θ2)
3+4γ+Λ;
2(2+γ)(1−Λ)(2γ+Λ+2)2
, if −2(1+2γ)(d−θ2)3+4γ+Λ
≤ ∆ ≤ 2(1+2γ)(d−θ1)3+4γ+Λ
;2
(1−Λ)(3+4γ+Λ), if ∆ > 2(1+2γ)(d−θ1)
3+4γ+Λ.
One can check that both welfare WN1 and WO
1 are U-shape. Moreover, if ∆ = 0, we caneasily calculate:
WN1 −WO
1 = −2(d− θ1)2(1 + γ(1− 3Λ)− Λ(3 + Λ))
(3 + 2γ)2(2 + 2γ + Λ)2
This is positive if and only if Λ ≥ ΛN = 12
(√13 + 9γ2 + 22γ − 3(1 + γ)
). For each
γ ≥ 0, the threshold ΛN is included in the interval [0.3, 0.33]. Then, for Λ greaterthan ΛN ≈ 1/3, banning quantity regulation would increase welfare in both countries.For Λ lower than ΛN , keeping quantity regulation is Pareto-improving. The result is areminiscence of the findings of Collie (2000), although it is not exactly identical due tothe difference in the policy considered (Collie, 2000 considers unit trades subsidies insteadof quantity regulation and find a closed interval of values of Λ for which banning thesesubsidies is Pareto-improving).However the result does not necessarily hold for ∆ = 0. Take for instance the interiorsolution which arises when −(1 + 2γ)(d − θ1) ≤ ∆ ≤ (1 + 2γ)(d − θ2). In this case,
WN1 > WO
1 if and only if ∆ > 2(1+2γ)(d−θ1)(1+γ(1−3Λ)−Λ(3+Λ)7+6γ2(1−Λ)+γ(13−Λ(7+2Λ))−Λ2 . This can be positive or
negative depending on the values of γ and Λ. In any case, when |∆| is sufficiently large,the less efficient country prefers to keep quantity regulation while the more efficient prefersderegulation.For the cases in which WN
i > WOi for both countries i = {1, 2}, the shape of the welfare
gains with respect to autarky is not qualitatively affected. Comparing WNi and WC
i
with the same methodology as in Appendix 3, a similar result arises: even after allowingfor quantity deregulation, integration increases welfare in both countries if and only ifproduction costs are sufficiently different.