Policy Effectiveness Review of Innovation and Business Support Programs PART I: PORTFOLIO MAPPING, ASSESSMENT OF QUALITY OF POLICY MIX, AND FUNCTIONAL AND GOVERNANCE REVIEW Public Disclosure Authorized Public Disclosure Authorized Public Disclosure Authorized Public Disclosure Authorized
Transcript
Policy EffectivenessReview of Innovation and Business Support Programs
PART I: PORTFOLIO MAPPING,ASSESSMENT OF QUALITY OF POLICY MIX,AND FUNCTIONAL AND GOVERNANCE REVIEW
Pub
lic D
iscl
osur
e A
utho
rized
Pub
lic D
iscl
osur
e A
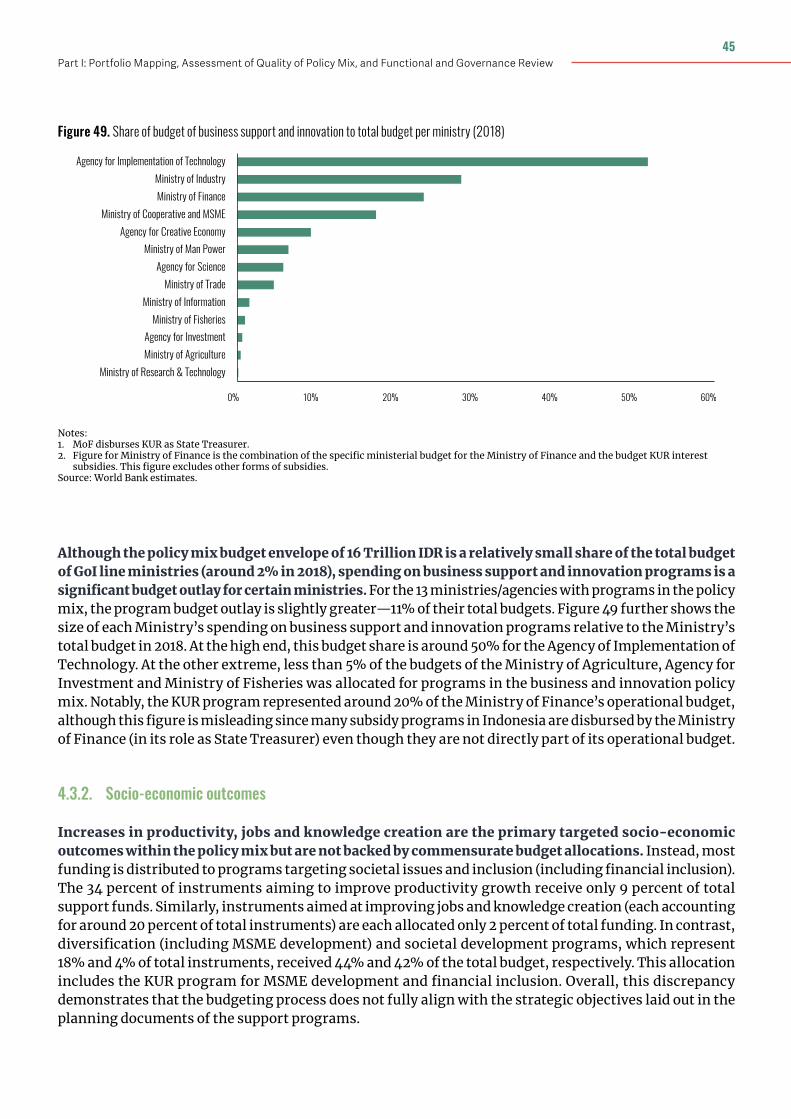
utho
rized
Pub
lic D
iscl
osur
e A
utho
rized
Pub
lic D
iscl
osur
e A
utho
rized
ACKNOWLEDGEMENTS 4
EXECUTIVE SUMMARY 5
1. INTRODUCTION 11
2. STRATEGIC VISION AND PRIORITIES 13
3. PRIVATE SECTOR PERFORMANCE AND PRODUCTIVITY CHALLENGES
16
3.1. Productivity, innovation, and entrepreneurship outcomes
18
3.1.1. Productivity 183.1.2. Innovation 213.1.3. Entrepreneurship and self-employment
22
3.2. Key input determinants of productivity 243.2.1. Operating environment 243.2.2. Human capital and knowledge 28
3.3. COVID-19 impacts on private sector 323.3.1. Impact on firms 323.3.2. Responses by firms 333.3.3. Policy support 34
3.4. Summary of key private sector innovation and business support needs
36
4. ASSESSMENT OF THE QUALITY OF THE POLICY MIX
37
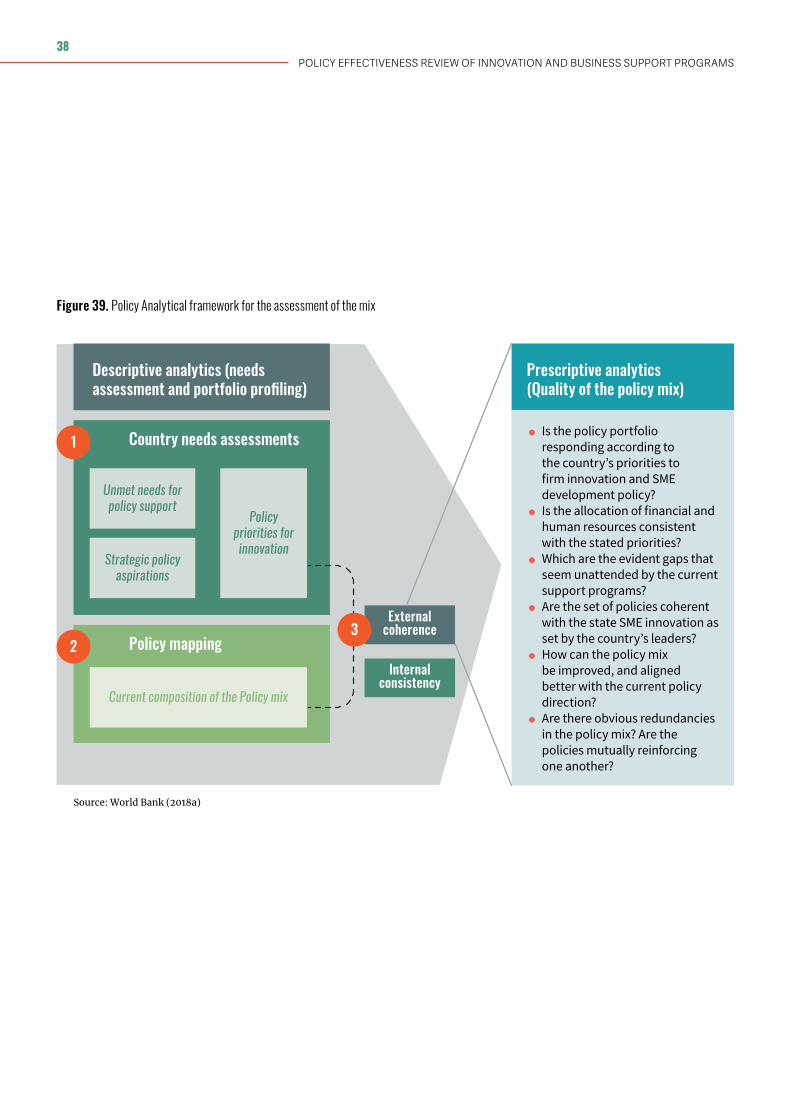
4.1. Approach 374.2. Policy mapping 39
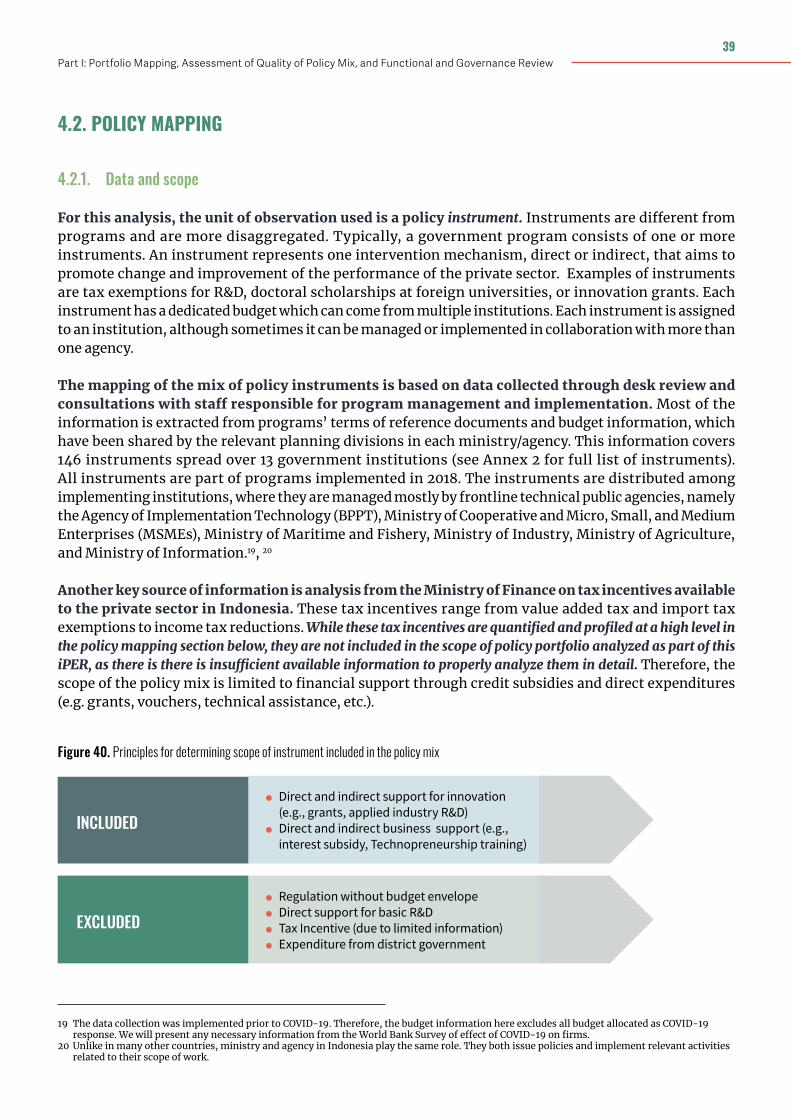
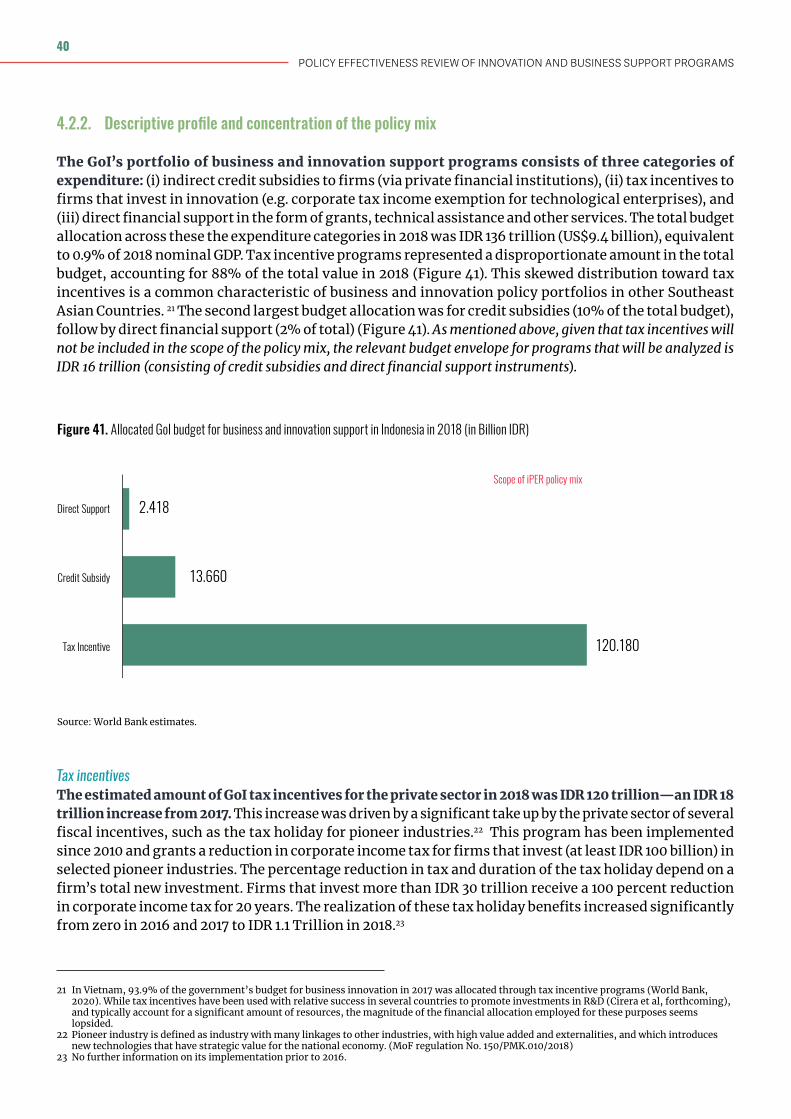
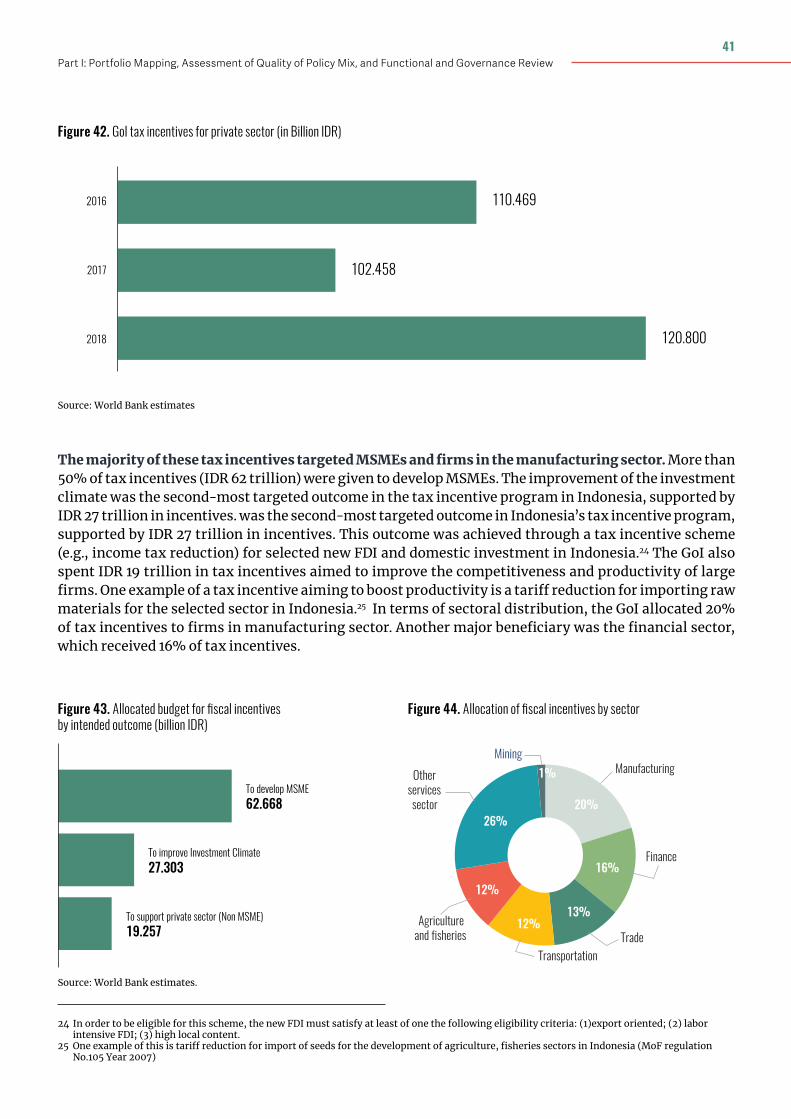
4.2.1. Data and scope 394.2.2. Descriptive profile and concentration of the policy mix
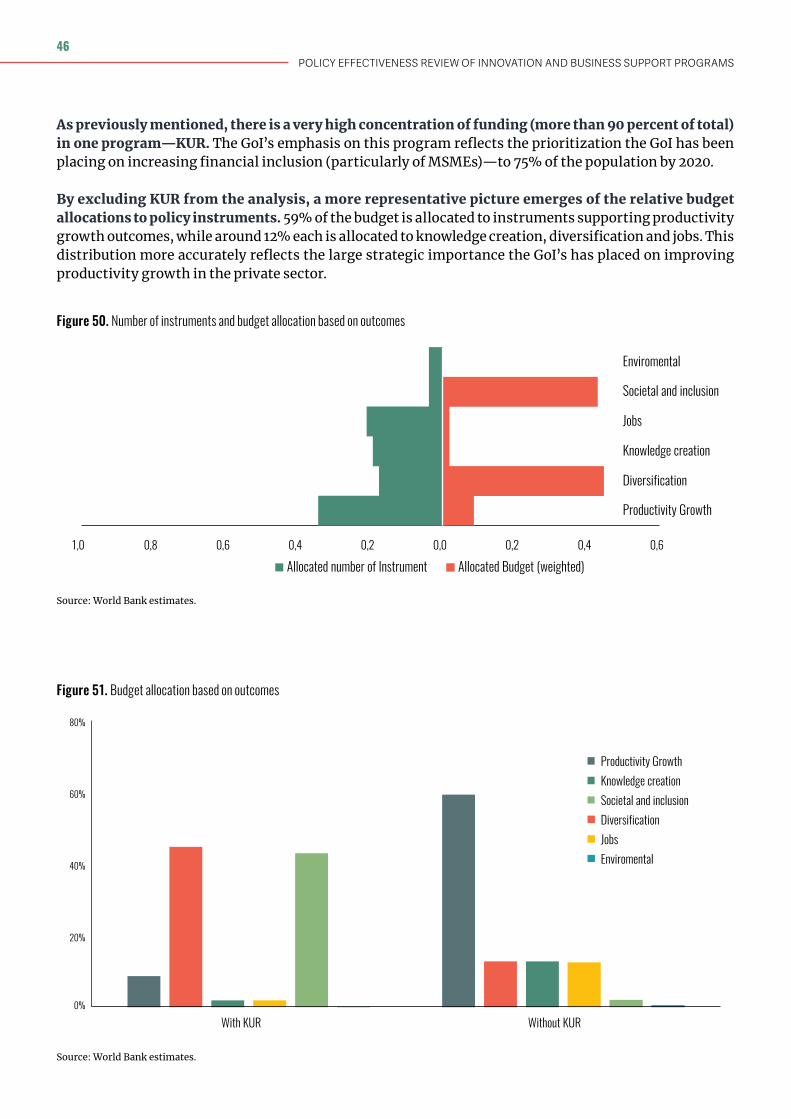
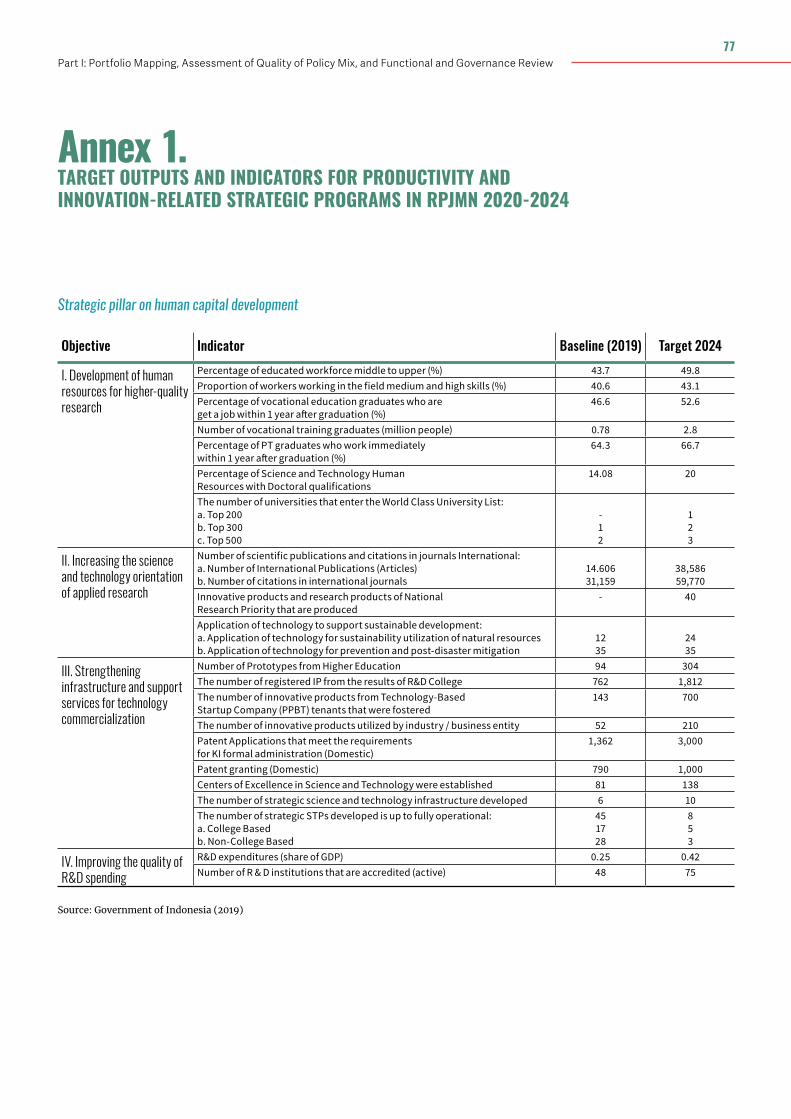
ANNEX 1: Target outputs and indicators for productivity and innovation-related strategic programs in RPJMN 2020-2024
77
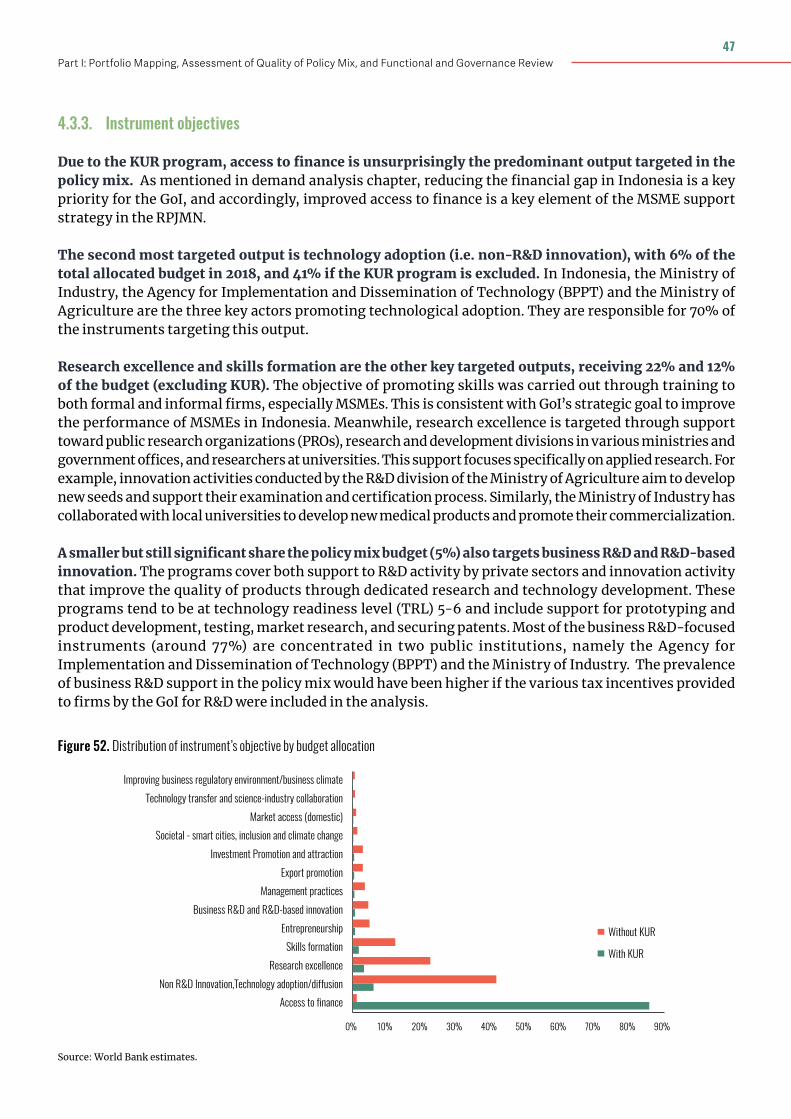
ANNEX 2: Background context on MSMEs in Indonesia
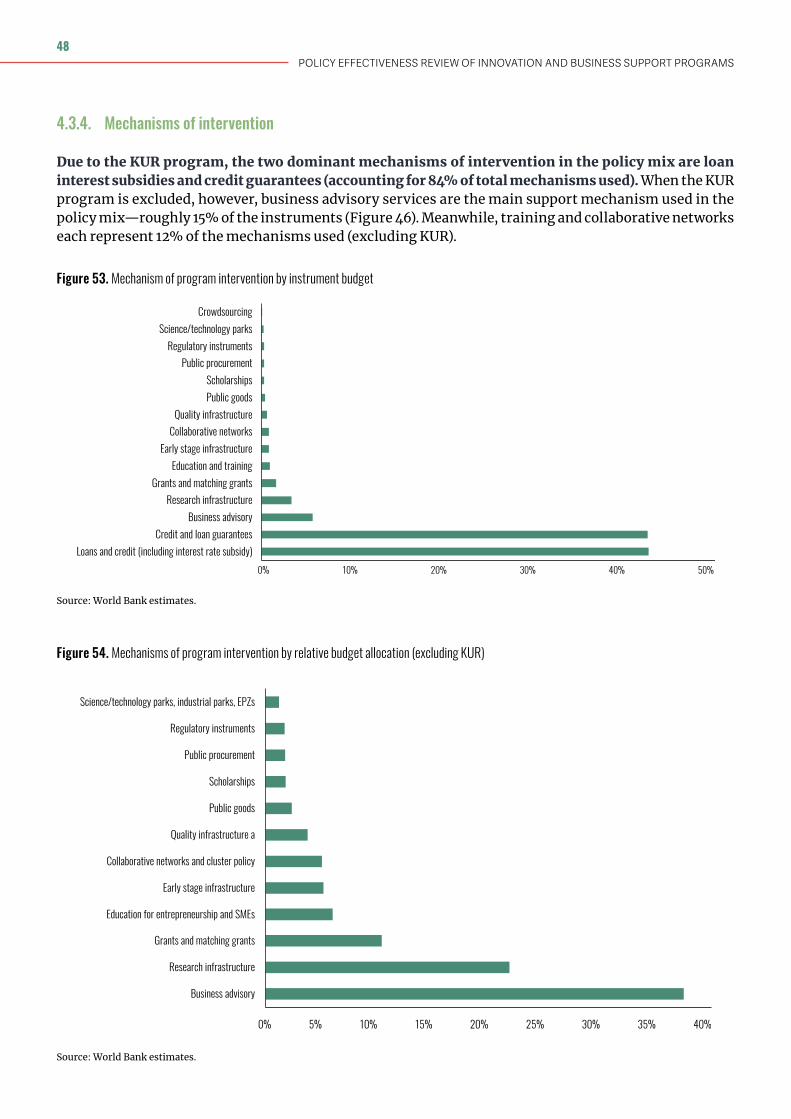
80
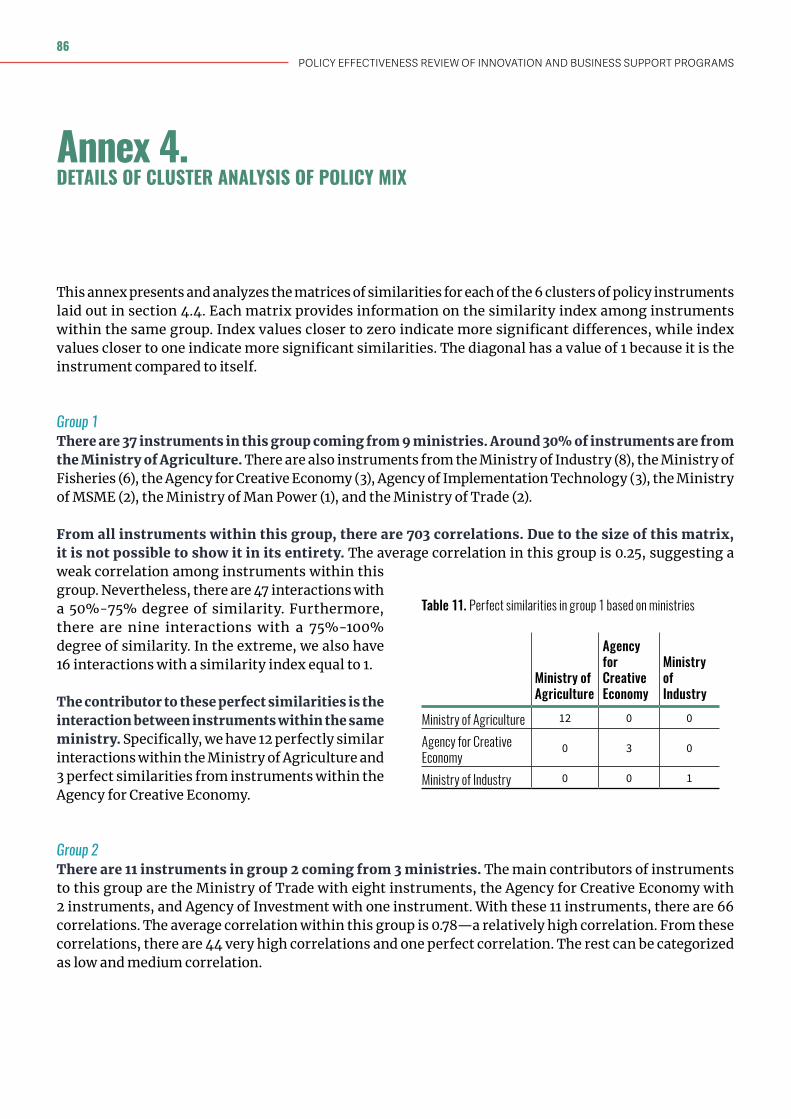
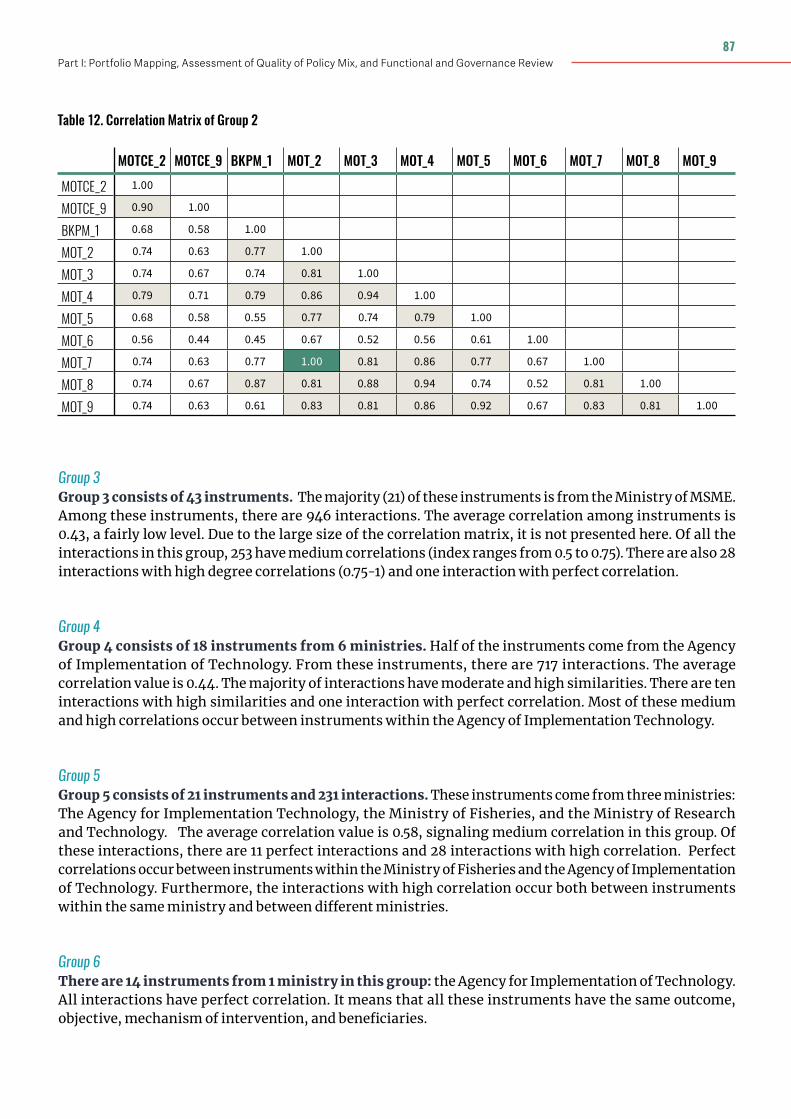
ANNEX 3: List of instruments in the policy mix 83ANNEX 4: Details of cluster analysis of policy mix
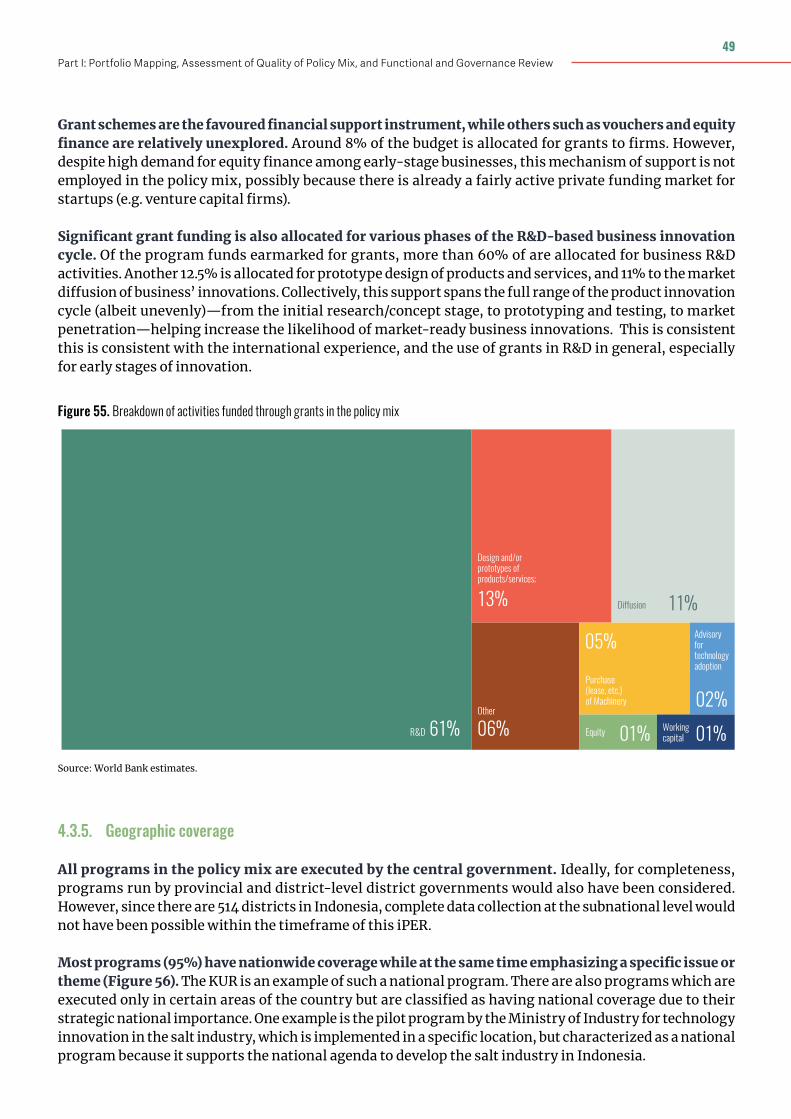
86
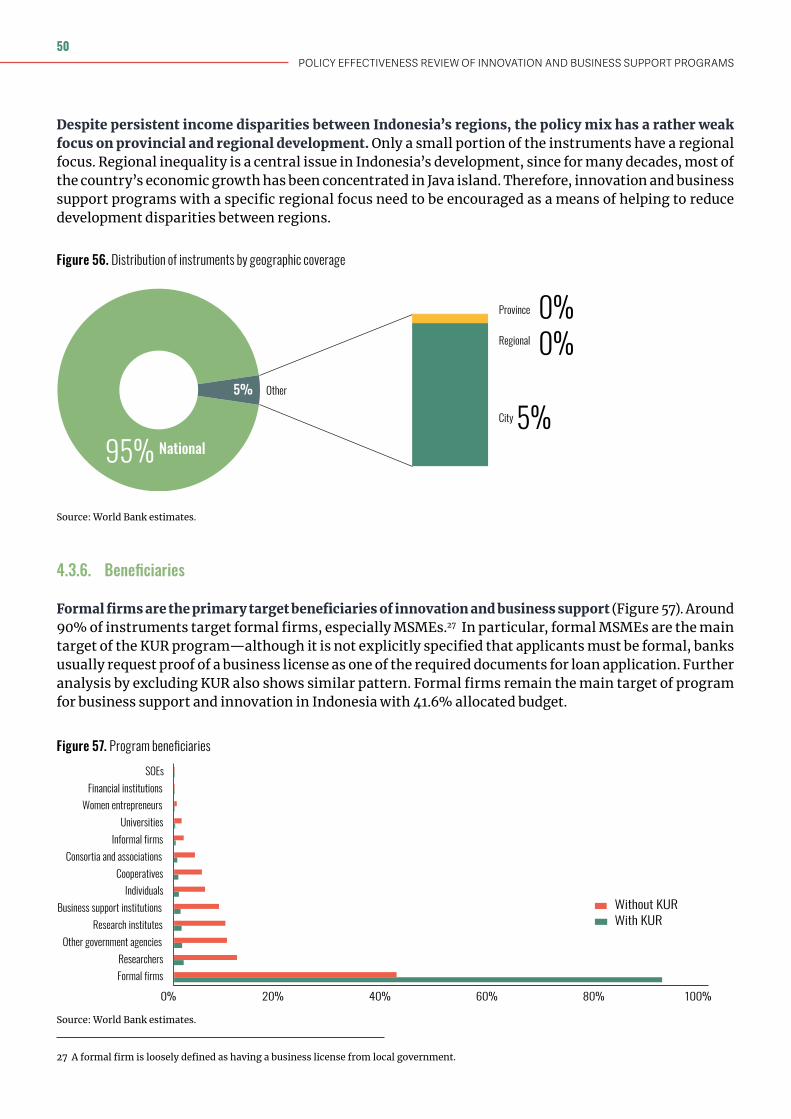
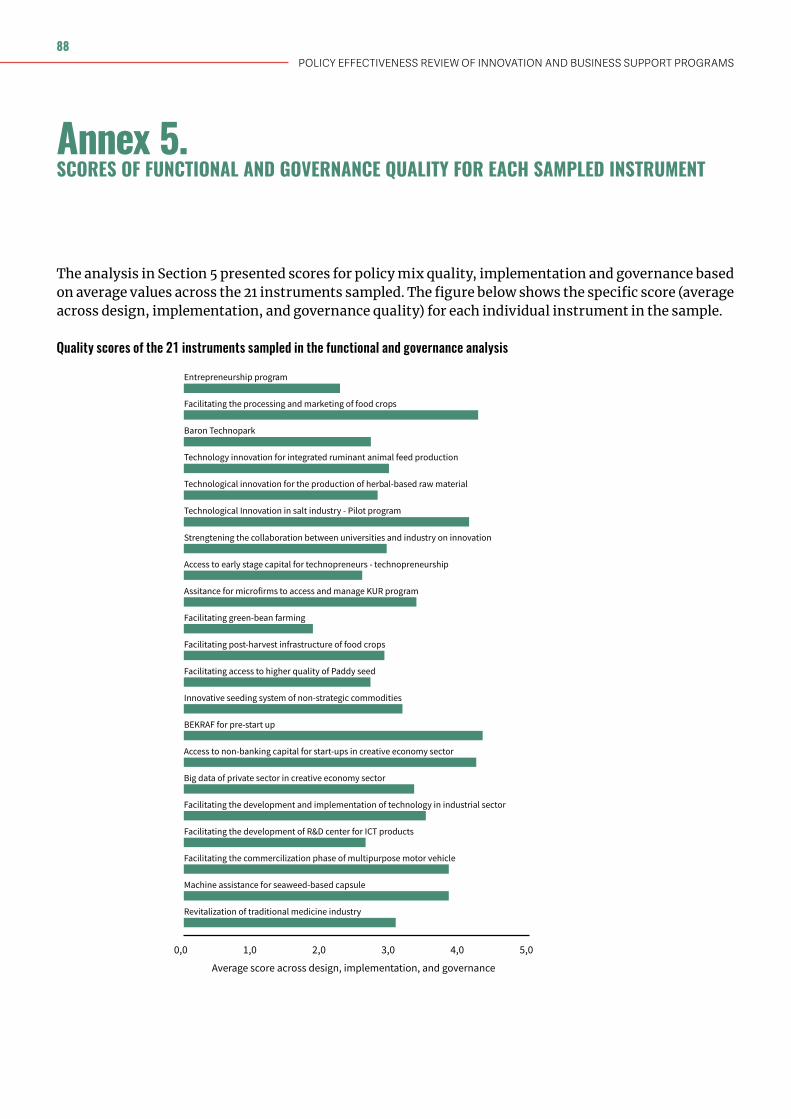
ANNEX 5: Scores of functional and governance quality for each sampled instrument
88
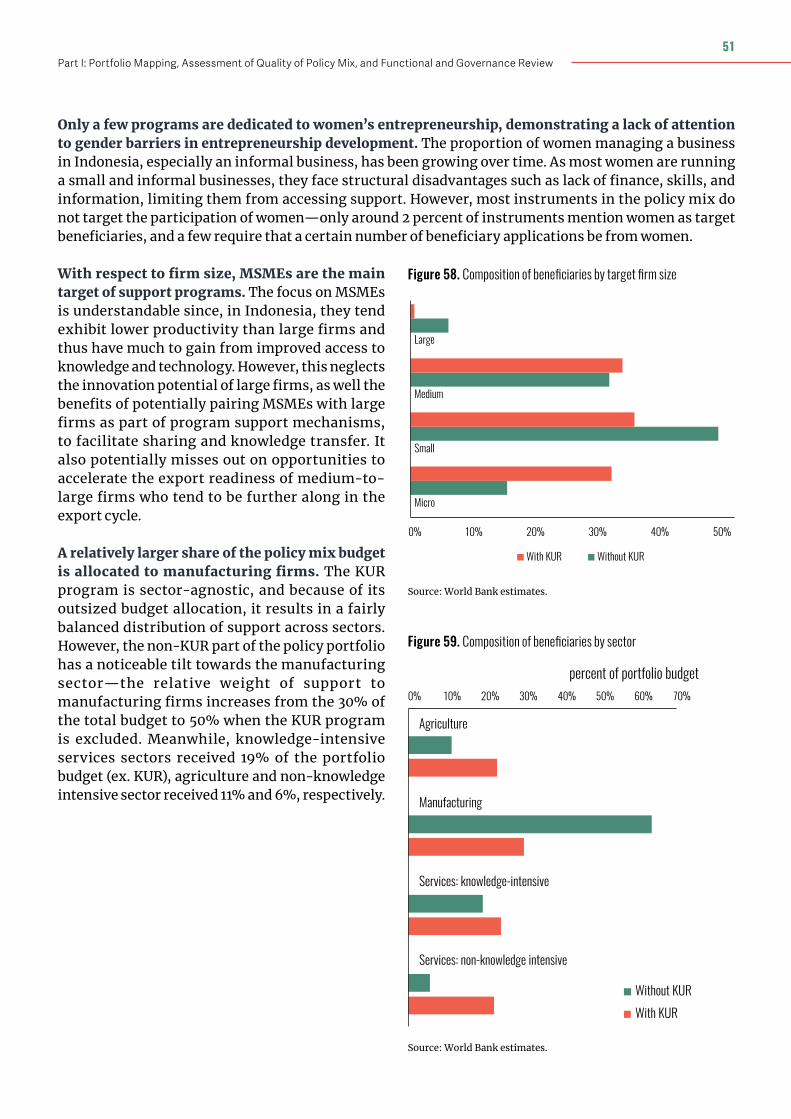
Table of Contents
Policy EffectivenessReview of Innovation and Business Support Programs
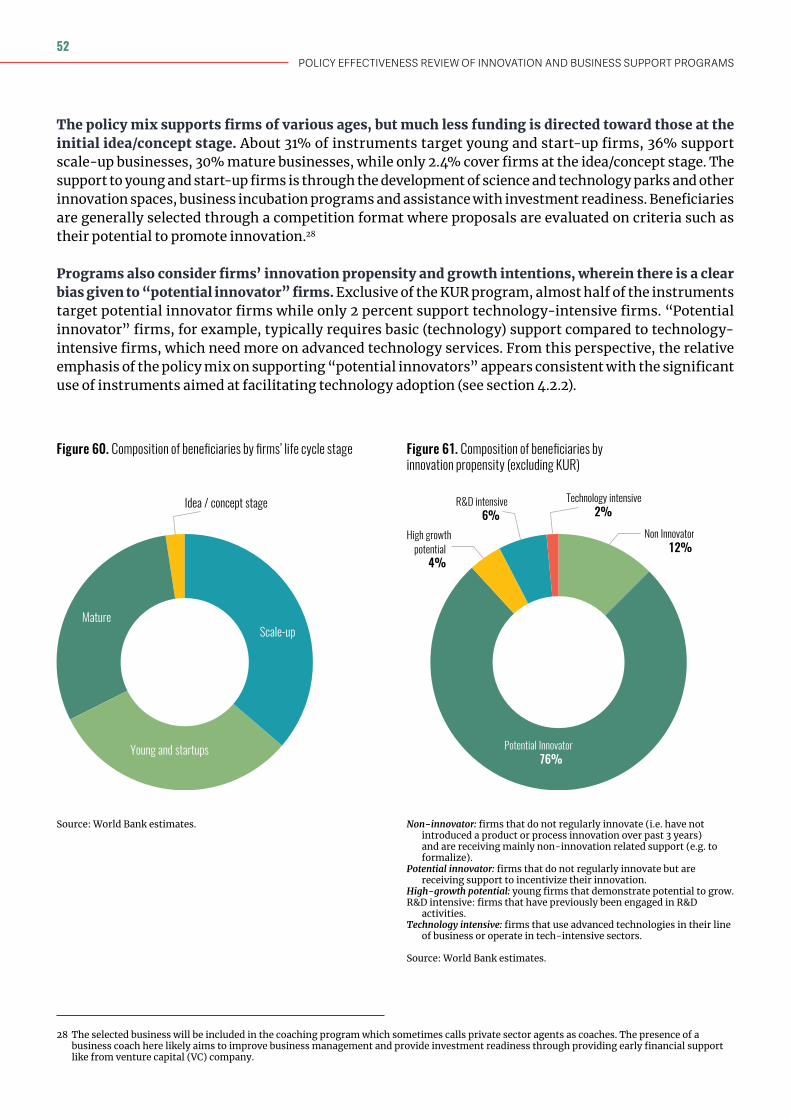
PART I: PORTFOLIO MAPPING,ASSESSMENT OF QUALITY OF POLICY MIX,AND FUNCTIONAL AND GOVERNANCE REVIEW
Acknowledgements
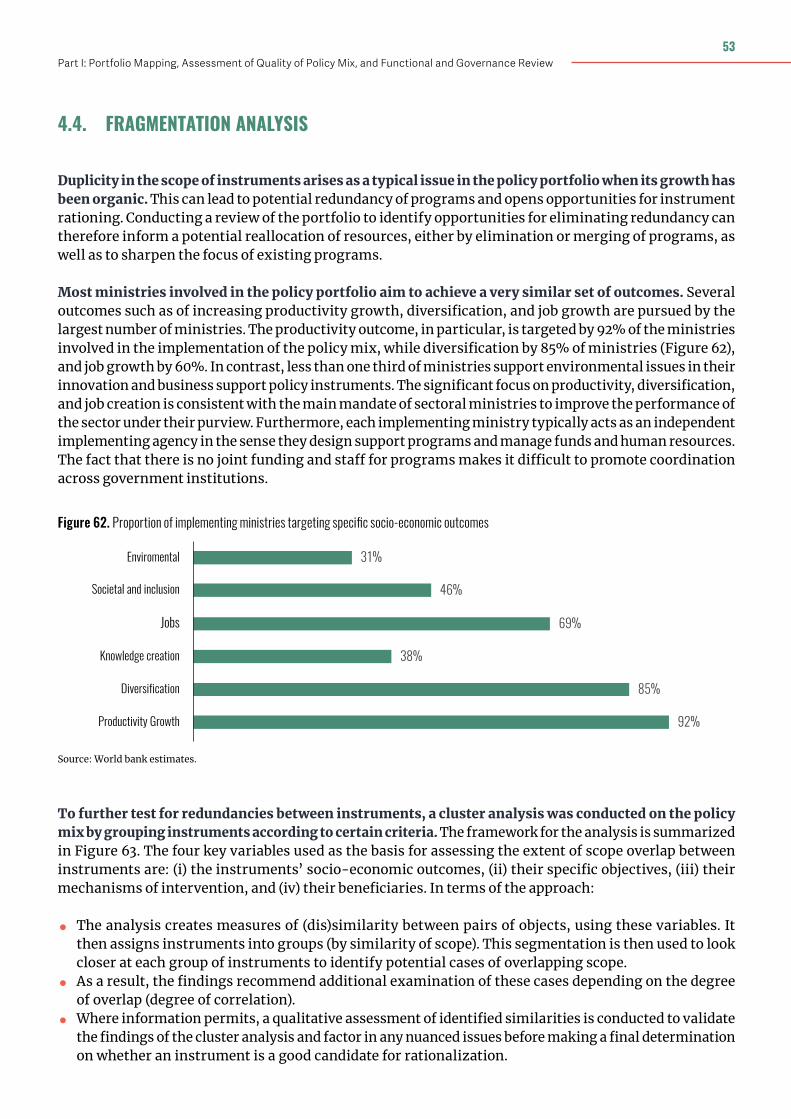
The report was prepared by a team from the World Bank’s Finance, Competitiveness, and Innovation (FCI) Global Practice, in collaboration with Indonesia’s Ministry of National Development Planning (Bappenas). The team was co-led by Aufa Doarest (Private Sector Specialist) and Nikola Kojucharov (Senior Economist), who are the report’s principal authors, and included Bertine Kamphuis (Lead Country Economist), Xavier Cirera (Senior Economist), Ainul Huda (Consultant) and Wisnu Nugroho (Consultant).
The team greatly benefitted from comments and suggestions by Jaime Frias (Senior Economist), Asya Akhlaque (Lead Economist), Anwar Aridi (Senior Private Sector Specialist), and Maja Andjelkovic (Senior Private Sector Specialist), and from the overall guidance of Satu Kakhonen (World Bank Country Director for Indonesia and Timor Leste) and Cecile Thioro Niang (Practice Manager).
The World Bank team would like to express its appreciation to all counterparts in the Government of Indonesia who supported the preparation of this report, including through providing data and background materials, arranging meetings, and sharing feedback and insights.
POLICY EFFECTIVENESS REVIEW OF INNOVATION AND BUSINESS SUPPORT PROGRAMS
4
Executive Summary
Strengthening private sector innovation and productivity is a cornerstone of Indonesia’s medium-term economic development strategy. The Government of Indonesia (GoI), in its Medium-term Development Plan 2020-2024 (RPJMN), has articulated a set of strategic priorities related to boosting private sector productivity, which are based on improvements to the human capital base (workforce skills and scientific research) and firm-level innovation and technology adoption, particularly among MSMEs. These, in turn, underpin related desired economic outcomes such as higher-value exports and employment opportunities, and improved competitiveness in industrial and creative economy sectors.
A critical part of delivering on these strategic objectives is a strong understanding of the relevance, efficiency and effectiveness of existing government policy and investment efforts in these areas. The GoI has a large portfolio of business support programs and instruments (frequently referred to hereafter as the “policy mix”) aimed at fostering firm-level productivity and innovation—146 policy instruments as of 2018 with a combined budget of roughly IDR 16 Trillion, based on the portfolio analysis conducted as part of this study. Together with fiscal incentive for private sector, this spending represents 0.9% of GDP. The policy interventions are deployed across 13 ministries/agencies1 (accounting for 11% of their combined budgets) and target a range of beneficiaries in multiple sectors across Indonesia. With a portfolio of this scale and scope, especially one that has grown organically over the years, there are inherent risks of: (i) inefficiencies emerging from a duplication and/or fragmentation of policy efforts; and (ii) of diminished effectiveness due to program design and implementation features or a misalignment with the strategic objectives the interventions are intended to advance.
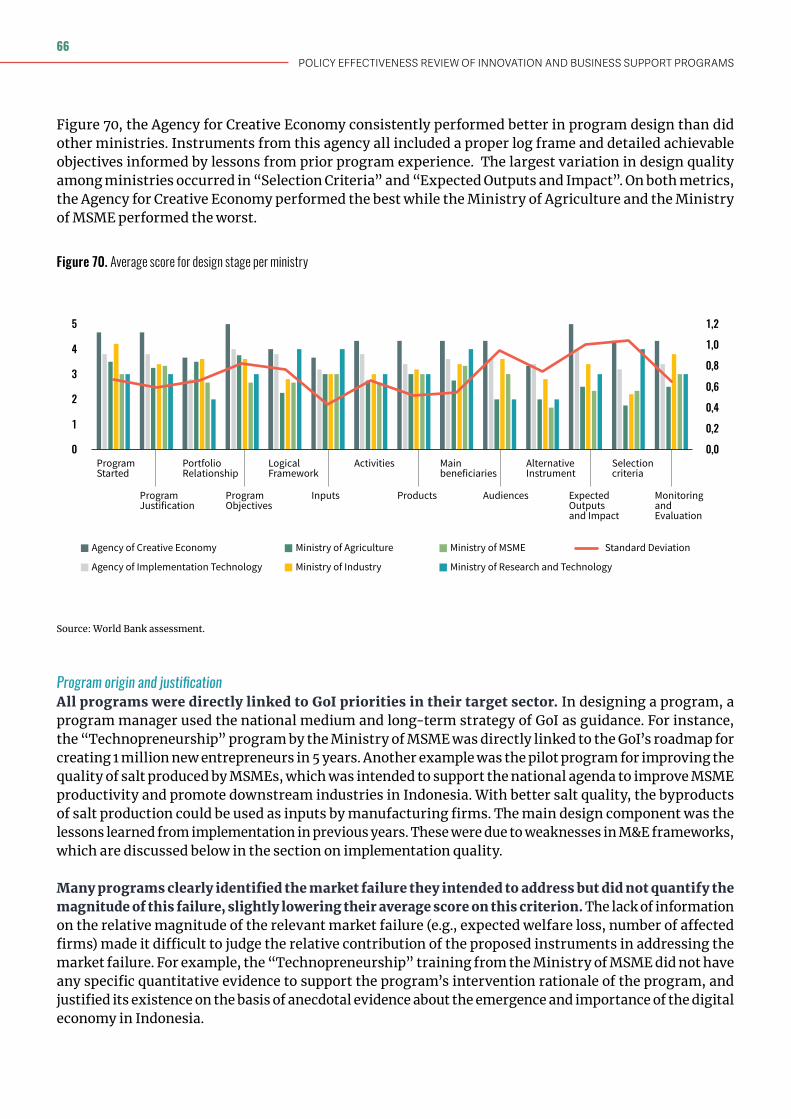
In this context, the purpose of the Policy Effectiveness Review on Innovation and Business Support Programs (iPER) is to holistically assess the consistency of GoI’s current policy mix and recommend potential adjustments to maximize its performance and impact going forward. This is part of a broader agenda to help improve the quality and efficiency of government spending in Indonesia. This iPER exercise, which is conducted jointly by the World Bank and Bappenas, consist of four key phases, the first two of which are covered in this report (Part 1), with the remaining two (Part 2) planned to be carried out at a later date: (i) mapping of the GoI’s portfolio of relevant support programs and analysis of how well it aligns to the challenges faced by Indonesia’s private sector and the GoI’s strategic priorities in the areas of innovation and productivity; (ii) functional analysis of the quality of design and implementation of the policy mix and its governance arrangements; (iii) analysis of the efficiency of the policy mix in achieving intended outputs and outcomes; and (iv) measurement of the impact (i.e. effectiveness) of the policy mix on the private sector’s innovation and productivity performance.
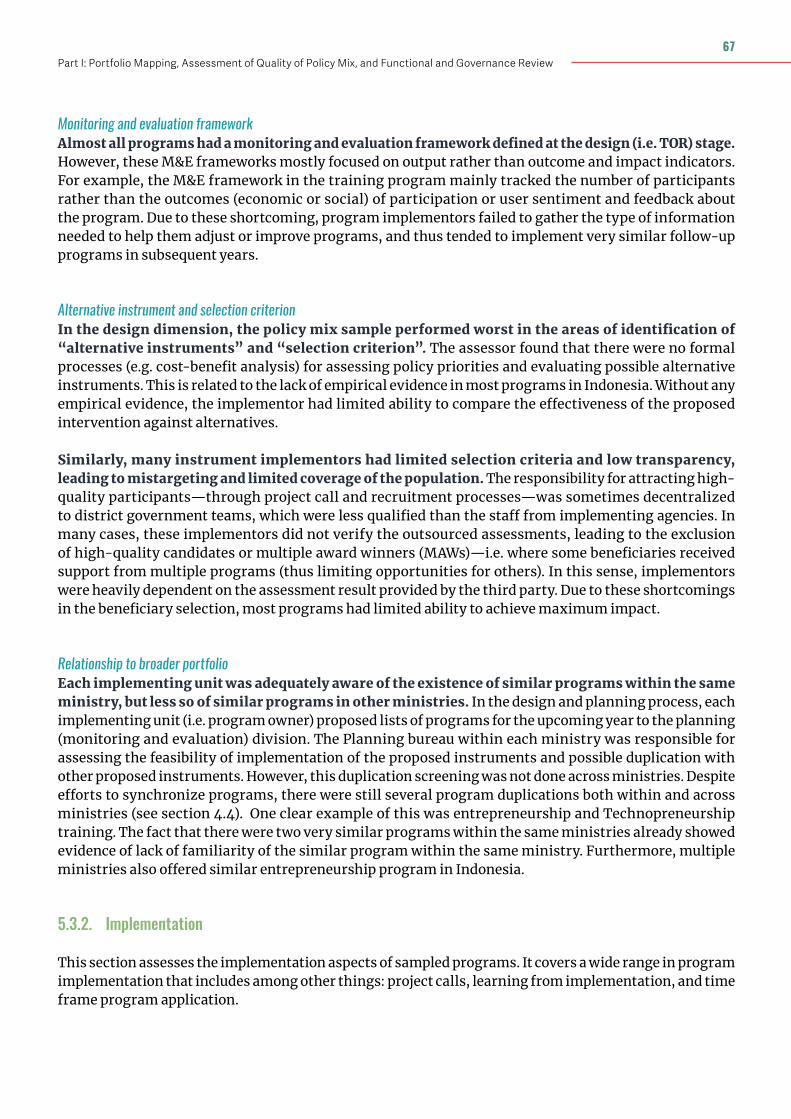
The key analysis and findings of this Part 1 of the iPER are summarized below, along with a menu of recommendations for strengthening the strategic alignment and functional and governance features of the GoI’s policy mix.
1 Unlike common practice in other countries, both Ministries and Agencies have program implementation functions in Indonesia and are thus treated equivalently for the purposes of this iPER analysis.
5Part I: Portfolio Mapping, Assessment of Quality of Policy Mix, and Functional and Governance Review
Private sector performance and productivity challenges
The assessment of private sector challenges in Indonesia potentially addressable through the GoI’s policy mix is based on the analytical framework of productivity developed in Cusolito and Maloney (2018). In this framework, Indonesia’s productivity outcomes can be viewed as a summation of three key constituent dynamics: (i) the reallocation of labor and capital towards from less productive firms to more productive ones; (ii) within-firm productivity improvements; and (iii) productivity-enhancing business churn—i.e. the entry of high-productivity and exit of low-productivity firms. These three productivity dynamics are, in turn, a function of various factors affecting firms’ operating environment and internal capabilities.
Indonesia’s total factor productivity (TFP) growth since 2008 has slowed considerably compared to its high rate in the decade preceding the 1998 Asian financial crisis, and economy-wide productivity levels are significantly lower than regional peer countries and other middle-income comparators.Relative to the 30% increase in TFP achieved between 1988 and 1997, TFP growth from 2008-2015 was only a cumulative 13%. This slowdown mainly reflected weaker contributions from “within-firm” productivity improvements and from firm entry-exit dynamics. A further decomposition also suggests price-markups, rather than increases in true technical efficiency, were the predominant driver of changes in TFP, suggesting a lack of market competition and weak incentives for incumbents with large market power to invest in productivity improvements. Overall, these productivity dynamics have left Indonesia with an average economy-wide labor productivity level that is less than one-third the level observed in regional comparators such as Vietnam and the Philippines, and only 15% of the level in middle-income peers such as Turkey. Indonesia’s innovation outcomes also compare unfavorably, on average, to the rest of the East Asia region. Innovation represents one of the most critical determinants of productivity growth, particularly the components related to within-firm improvements and new firm creation/entry. However, the share of Indonesian firms that engage in product or process innovation is among the smallest in the region, as is the proportion of firms that invest in research and development (R&D). In contrast, Indonesia is the top performer on certain measures of technology adoption (e.g. the licensing of technologies from foreign firms), although the share of firms engaging in such adoption is still only around 20%.
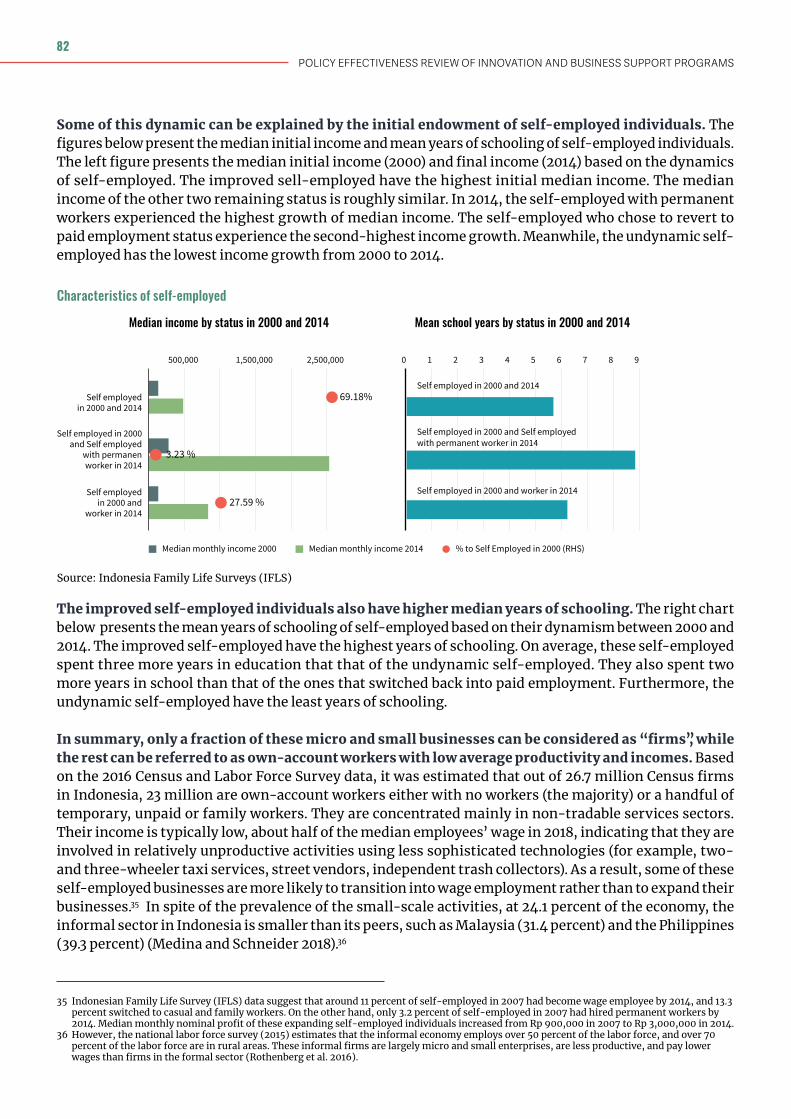
Meanwhile, entrepreneurship dynamics in Indonesia are characterized by predominance of micro firms—which are effectively self-employed workers—with low growth trajectories and limited employment generation. Longitudinal studies of self-employed entrepreneurs running family-owned businesses show that, over a 15-year period from 2000-2014, nearly 70% of these entrepreneurs remained self-employed with unpaid/family workers in their business (implying little to no business growth), while only 3% grew their business to a point of hiring permanent workers. Meanwhile, around 28% abandoned self-employment (presumably due to poor performance or failure of their business) and switched back into paid employment as their primary source of income.
Among the various input determinants of these productivity outcomes, some of key operating environment factors are:
• Constrained access to materials inputs, which stems from the steady increase in barriers to goods and services imports over the past decade, including tariffs and non-tariff measures (NTMs), thereby raising costs, reducing quality of inputs and negatively affecting productivity;
• Limited availability of finance: Access to bank credit is particularly difficult for micro, small and medium enterprises (MSMEs), which is evidenced by the low share of these firms that apply for bank loans compared to MSMEs in peer countries such as Vietnam and the Philippines. Meanwhile, the
POLICY EFFECTIVENESS REVIEW OF INNOVATION AND BUSINESS SUPPORT PROGRAMS
6
availability of equity finance from abroad is constrained by the various foreign investment barriers Indonesia imposes, particularly in services sectors such as transport, communication, education and health. Such restrictions on FDI limit potential positive technological spillovers to firms in Indonesia;
• Weak market competition: Indonesia scores below the average of the East Asia and Pacific (EAP) region in terms of perceptions of the intensity of local competition and the prevalence of market dominance. The anti-competitive practices are often in intermediate sectors, thus further dragging down competitiveness by raising the cost of inputs to production. This lack of competition also creates rents for a few incumbent firms, which often adopt a rent-seeking approach vis-à-vis the government to ensure restrictions to competition stay in place.
Weaknesses in the quality of human capital are the other major productivity constraints, and include:
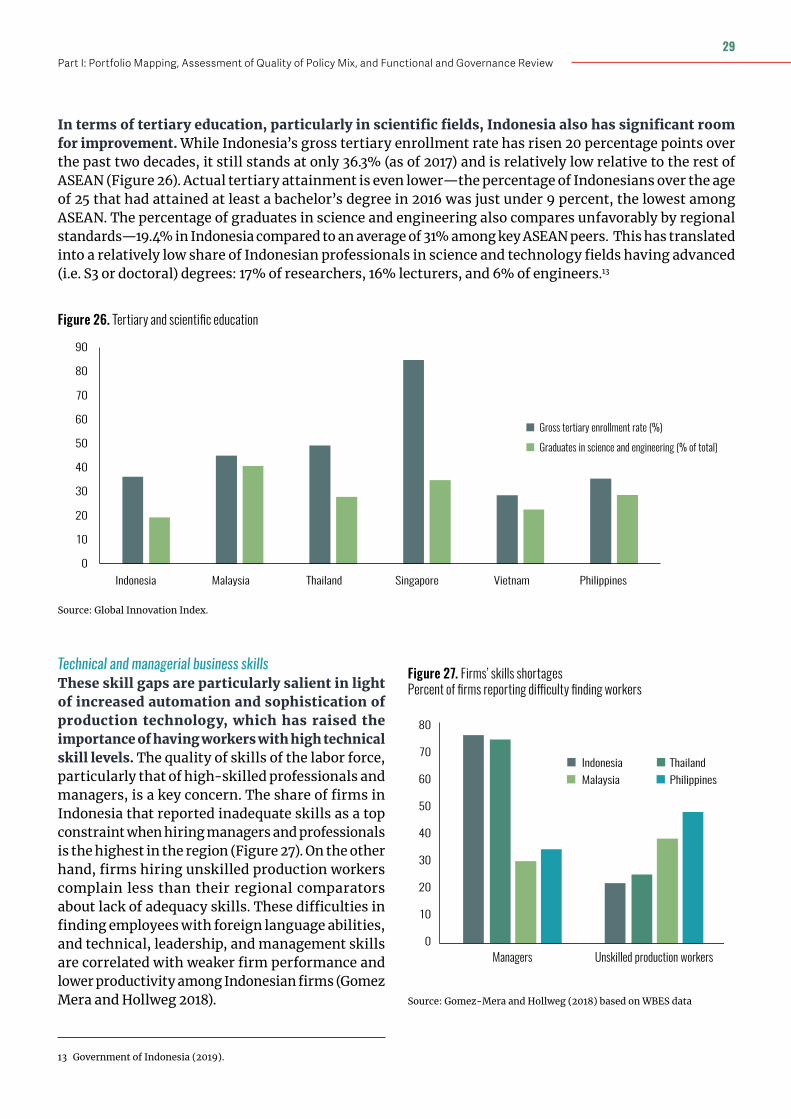
• Education: Despite improvements in access to education in recent years, when adjusted to the quality of skills learned, young Indonesians still receive less years of schooling than youth in similar-income country peers, which limits their subsequent productivity in the labor force. In terms of tertiary education, Indonesia also lags the rest of ASEAN (figure X), both in terms of gross enrollment and attainment rates. The percentage of graduates in science and engineering also compares unfavorably by regional standards—19.4% in Indonesia compared to an average of 31% among key ASEAN peers.
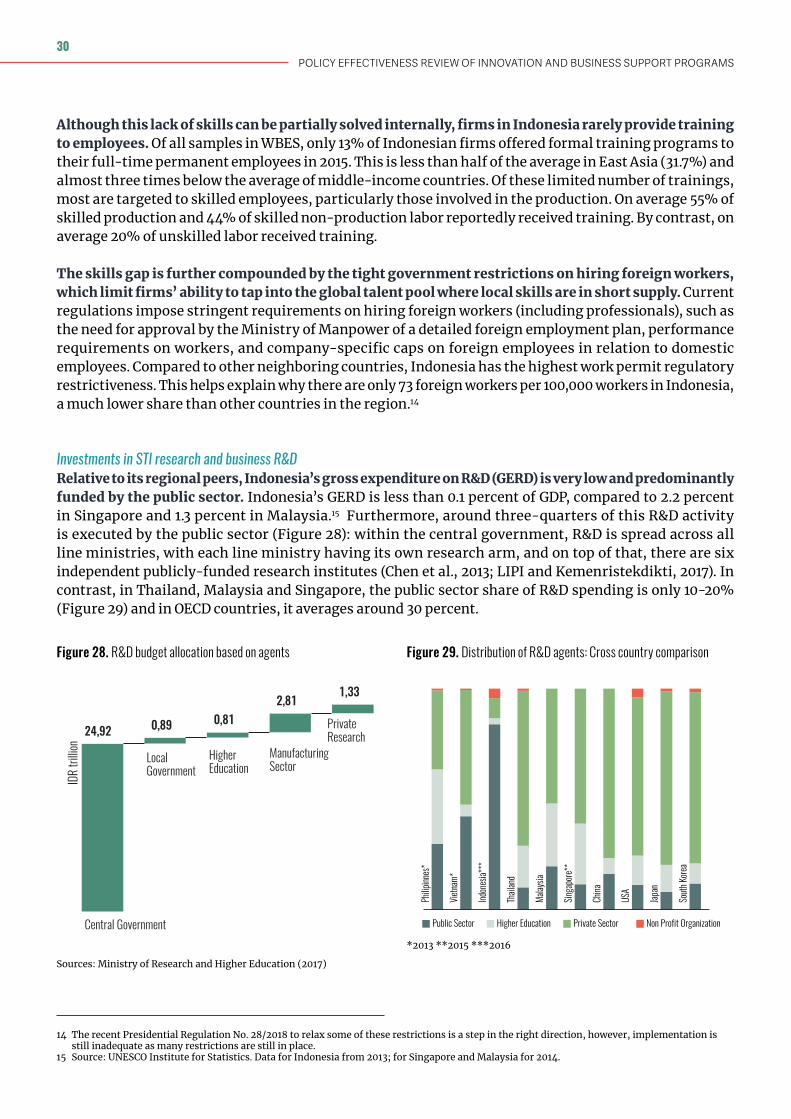
• Technical and managerial business skills: the share of firms in Indonesia that reported inadequate skills as a top constraint when hiring managers and professionals is the highest in the EAP region (Figure 13). These skill gaps are particularly salient in light of the growing automation and sophistication of production technologies, which has raised the importance of having workers with high technical skill levels. Tight government restrictions on hiring foreign workers further exacerbate skills shortages, limiting firms’ ability to tap into the global talent pool for the skills they demand.
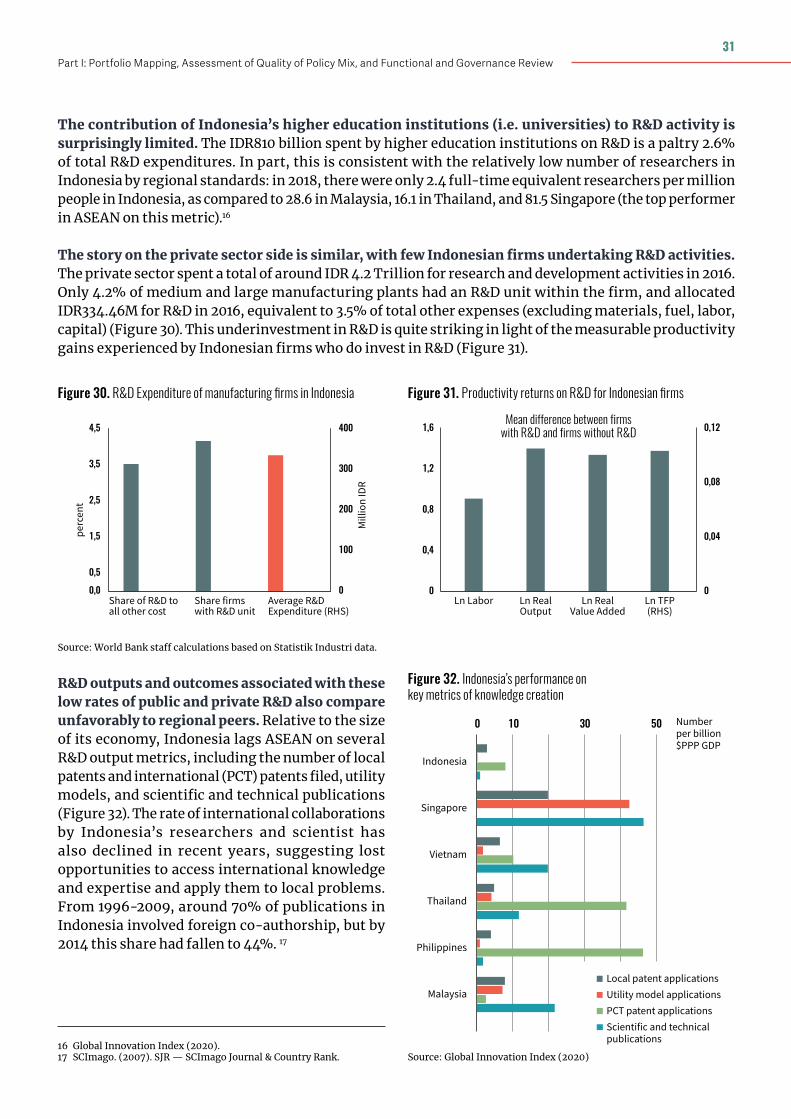
• Investments in STI research and R&D. Relative to its regional neighbors, Indonesia’s overall R&D spending as a share of GDP is quite low—less than 0.1 percent compared to 2.2 percent in Singapore and 1.3 percent in Malaysia. Moreover, around three quarters of this R&D is publicly funded and executed (far exceeding international benchmark levels), whereas firm-level R&D activities are rather limited. R&D outputs and outcomes associated with these low spending rates also compare unfavorably to regional peers—relative to the size of its economy, Indonesia lags ASEAN on R&D output metrics such as the number of local patents and international (PCT) patents filed, utility models, and scientific and technical publications.
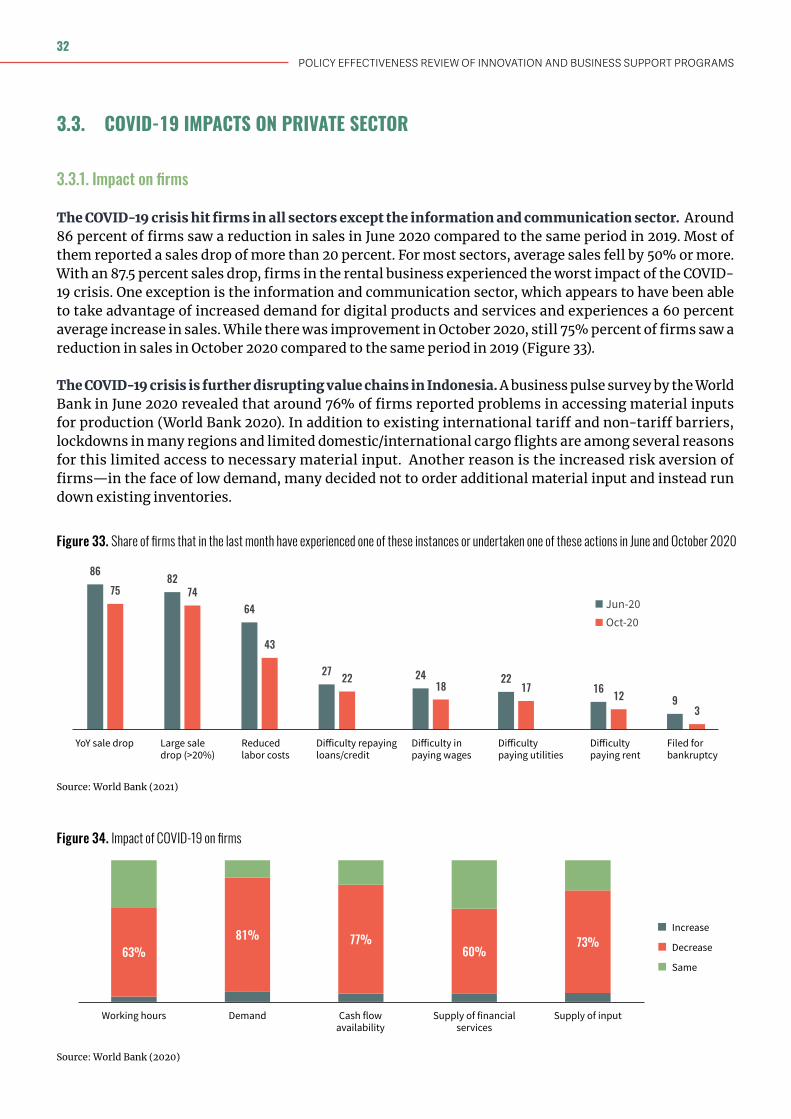
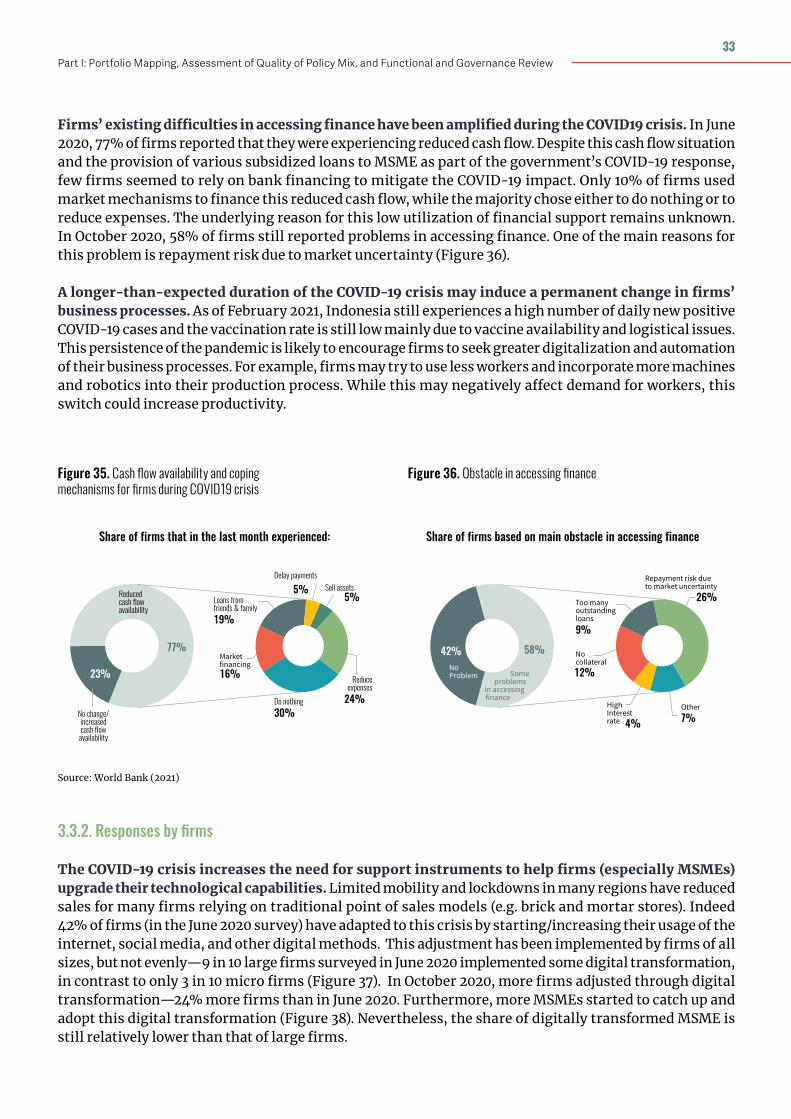
The COVID-19 crisis has exacerbated many of the productivity challenges already faced by Indonesia’s private sector. The crisis has hit firms in all sectors except the information and communication sector, with nearly 90 percent of all firms reporting a drop in sales during 2020 in magnitudes of 20-90 percent (relative to 2019). Lockdowns in many of Indonesia’s regions and limited domestic/international cargo flights have also compounded the challenges that many firms already faced in cost-effectively sourcing materials inputs due to import tariff and non-tariff barriers. Furthermore, firms’ existing difficulties in accessing finance have been amplified, with a majority reporting continued cash flow and financing constraints.
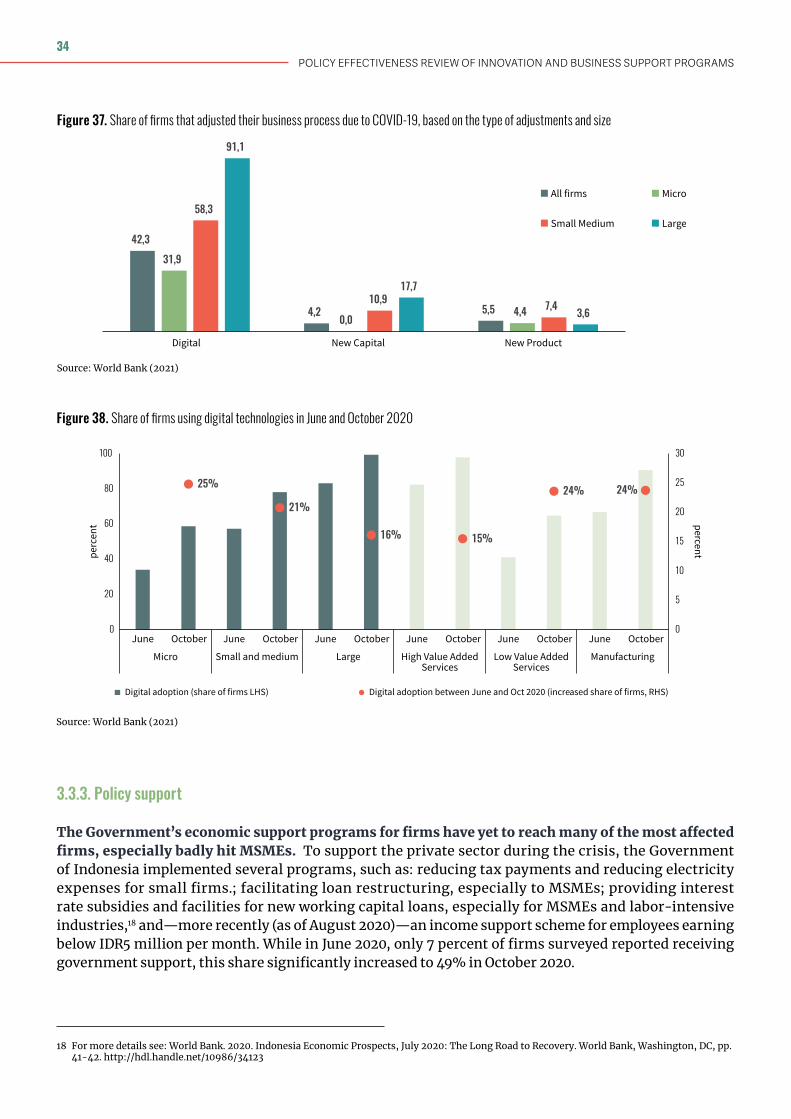
Greater pressures for digitalization in the pandemic context have also increased the need for support instruments to help firms (especially MSMEs) adapt and upgrade their technological capabilities. Many Indonesian firms have adapted to this crisis by starting/increasing their usage of the internet, social media and other digital methods. The longer that pandemic-related restrictions on mobility and international travel persist, the stronger the incentives for firms to seek greater digitalization and automation of their business processes. Stronger public support for firms in this area will thus become increasingly important, drawing on lessons from the design and delivery of current support programs, many of which have suffered from low uptake.
7Part I: Portfolio Mapping, Assessment of Quality of Policy Mix, and Functional and Governance Review
Assessment of the quality of the policy mix
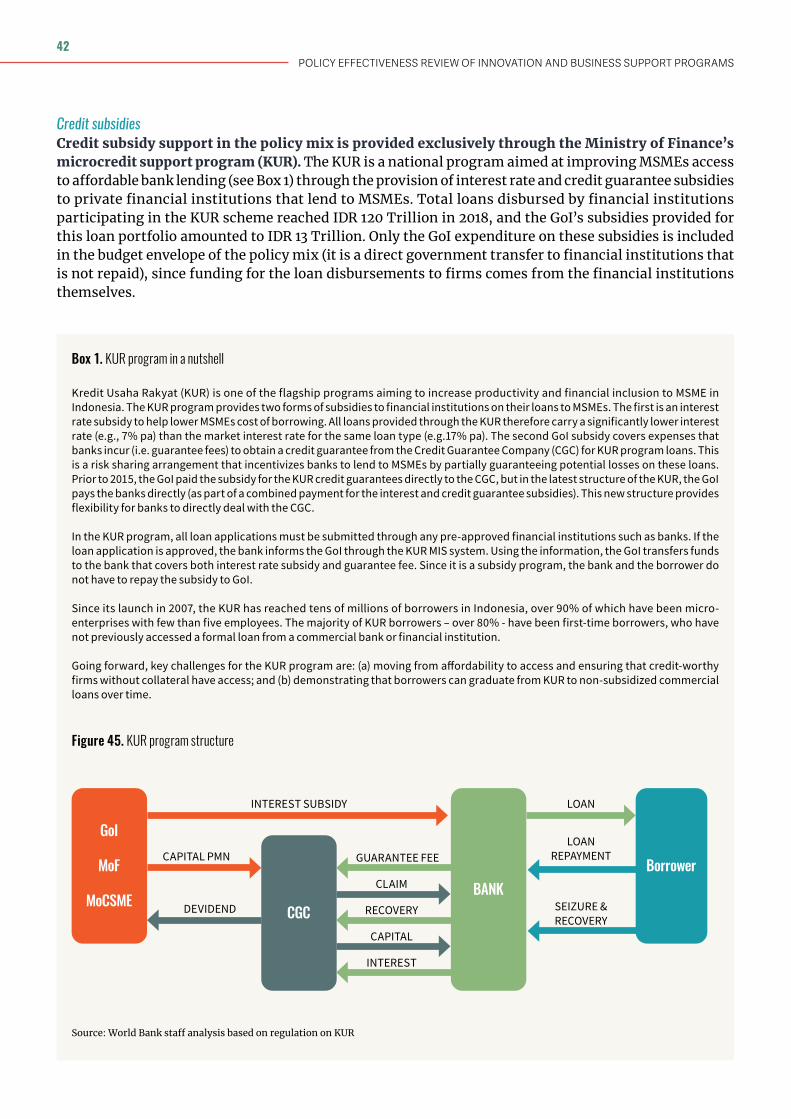
The mapping of the GoI’s innovation and business support instruments reveals a policy mix targeting a broad set of economic outcomes through a range of intervention mechanisms, with nation-wide coverage and a focus on MSMEs. As a share of the total policy mix budget, societal inclusion and economic diversification are the primary targeted high-level outcomes of the policy mix. In terms of instrument objectives, access to finance is the most common, reflecting the large budget allocation (90% of the total) to the Ministry of Finance’s microcredit program (KUR), followed by technology adoption and excellence in applied research. Program support is provided predominantly through credit subsidies (again a reflection of the KUR program), as well as business advisory services. Most programs have nationwide coverage and mainly target formal MSMEs, especially in the manufacturing sector. Support is spread evenly across firms of different ages and stages of the life cycle, with the exception of very young idea/concept stage firms.
The internal consistency analysis of this policy mix reveals an important misalignment between the budgetary resources allocated to programs/instruments and their targeted outcomes. Increases in productivity and knowledge creation are the outcomes targeted by the greatest number of instruments but are not backed by commensurate budget allocations. Conversely, diversification (including MSME development) and societal inclusion (including financial inclusion) objectives represent a small share of instruments but collectively receive around 90% of the budget (in large part due to the KUR program).
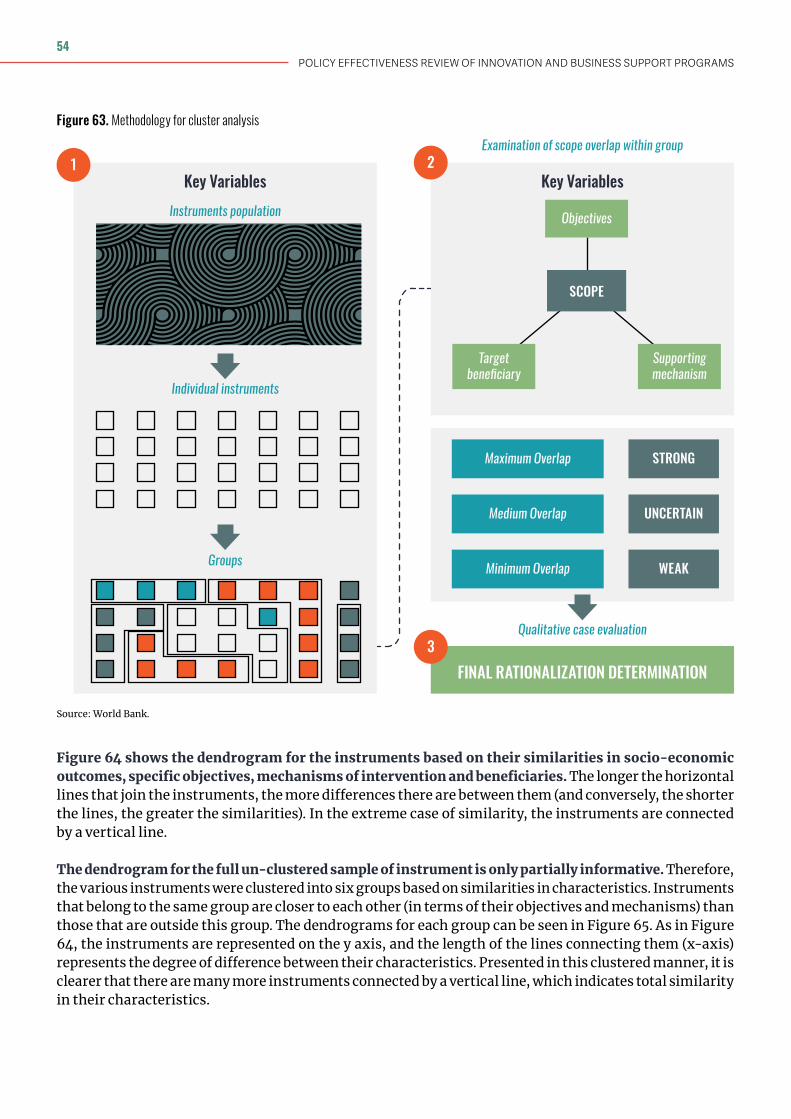
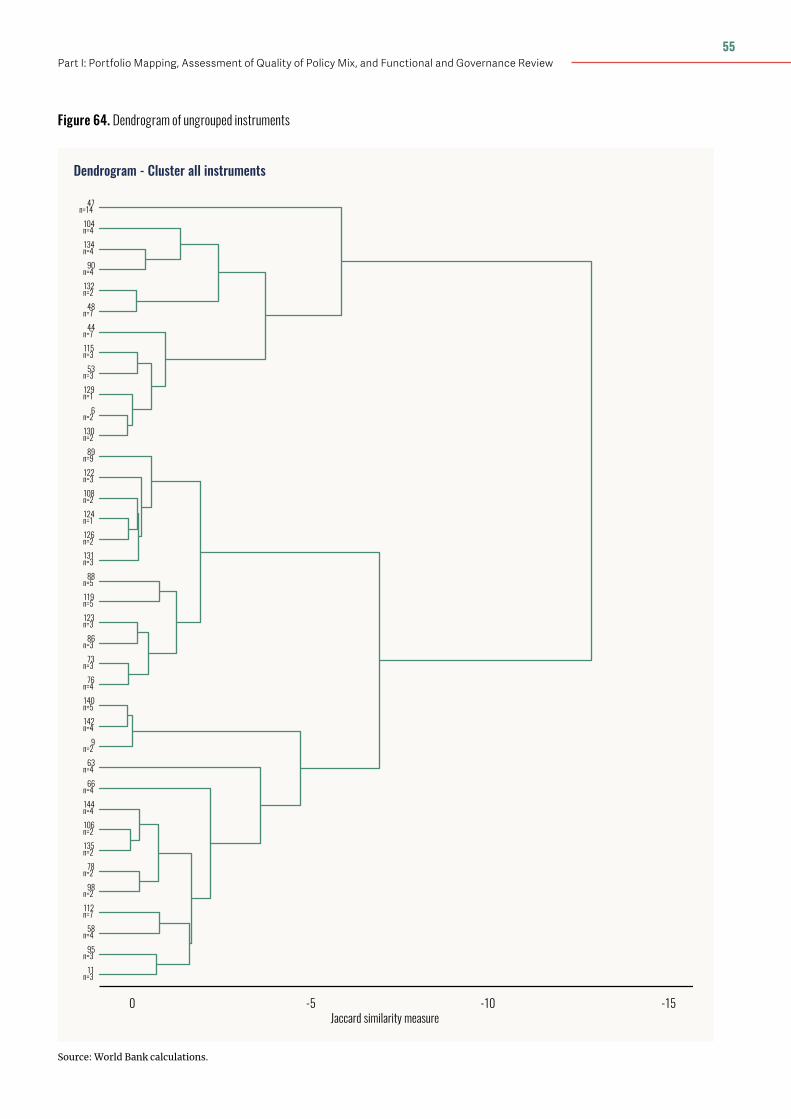
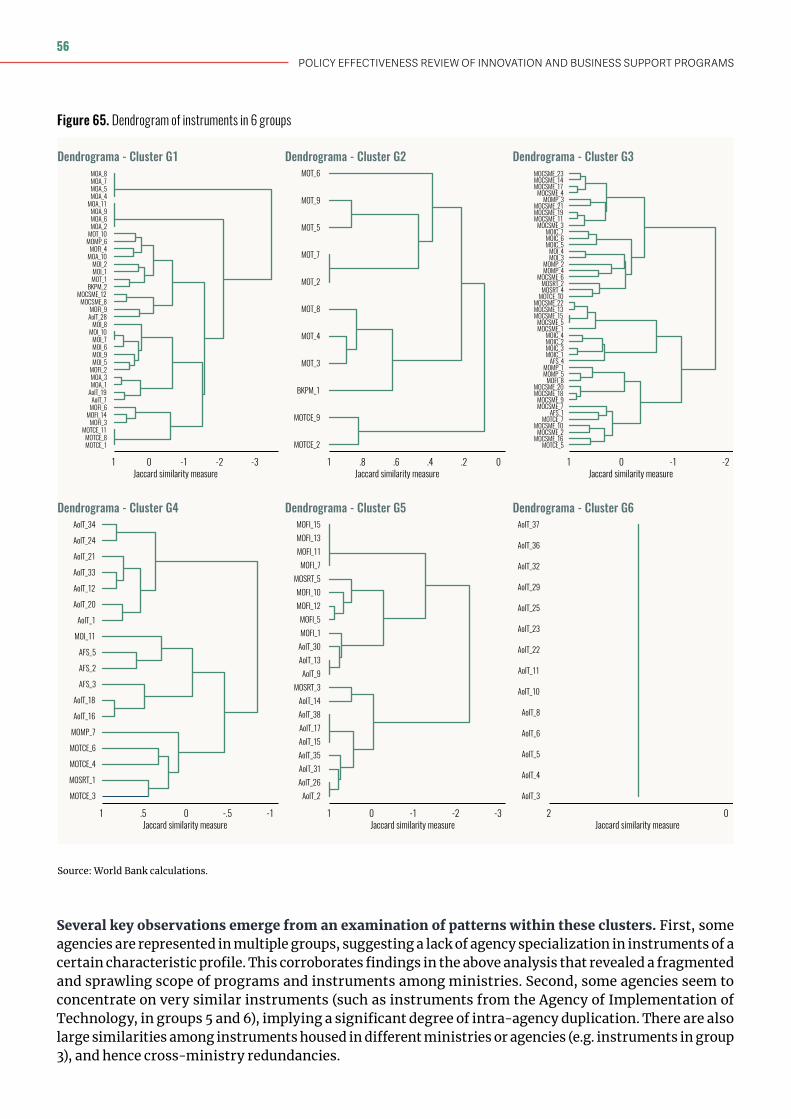
There is also a high degree of redundancy in multiple instruments, both within and across ministries/agencies. Many instruments across the policy mix are very similar (and in some cases nearly identical) in their key features—intended socio-economic outcomes, specific objectives, mechanisms of intervention and target beneficiaries. This is the case both for instruments within the same ministries/agencies, as well as those implemented by different ministries/agencies.
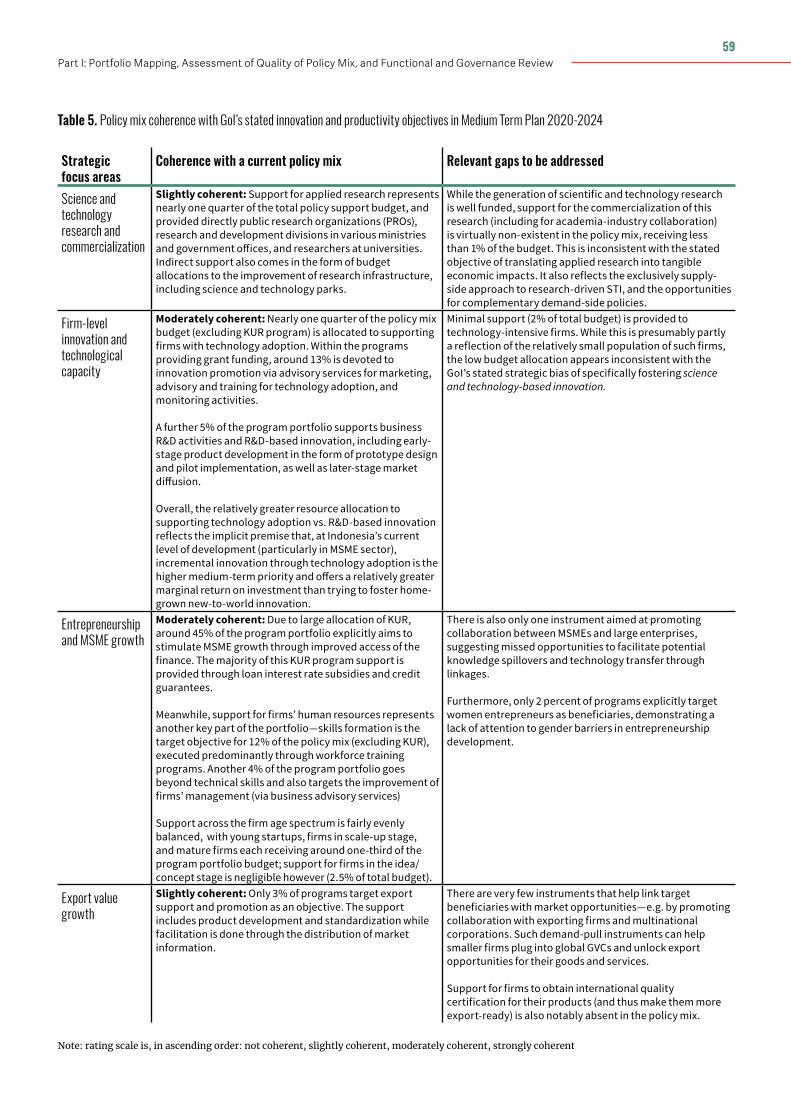
In terms of its alignment with the GoI’s strategic priorities for private sector development, the policy mix exhibits modest coherence with respect to export value growth and STI research objectives. The share of the policy mix devoted to supporting firms with export capabilities is limited and sub-optimally targeted, which represents a missed opportunity to contribute to boosting Indonesia’s low number of firms that export or can compete in international markets. Meanwhile, although the generation of scientific and technology research is well funded, support for the commercialization of this research and diffusion, including through academia-industry collaboration, is virtually non-existent in the policy mix. This is inconsistent with the stated GoI objectives of translating applied research into tangible economic impacts.
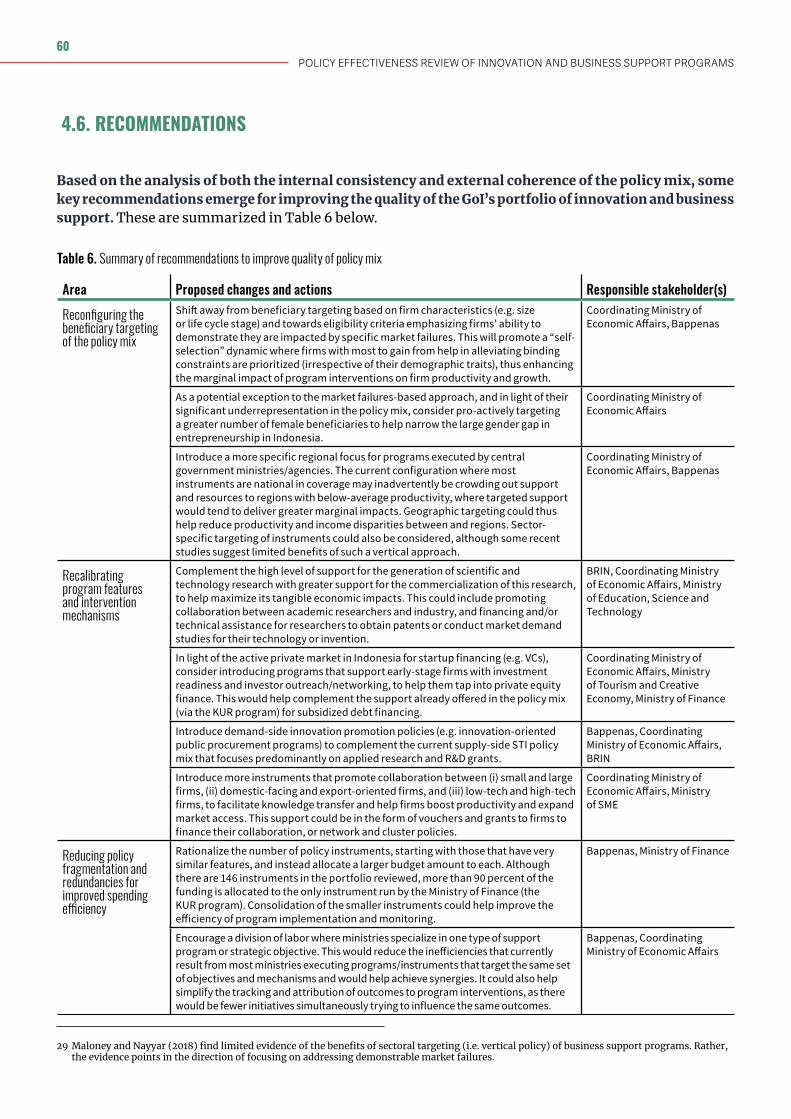
Some key recommendations emerging from this analysis of the internal and external consistency of the policy mix include:
• Reconfiguring the beneficiary targeting of the policy mix, particularly by: (i) shifting away from targeting based on firm characteristics (e.g. size or life cycle stage) and towards eligibility criteria emphasizing firms’ ability to demonstrate they are impacted by specific market failures; (ii) as an important exception to this market-failures principle, pro-actively targeting a greater number of female beneficiaries to help narrow the large gender gap in entrepreneurship in Indonesia; and (iii) adopting a more specific regional focus for certain instruments to help reduce productivity and income disparities between Indonesia’s regions;
• Recalibrating certain program features and intervention mechanisms, such as: (i) increasing support for the commercialization of science and technology research, to help maximize its tangible economic impacts; (ii) adding demand-side innovation promotion policies (e.g. innovation-oriented public procurement programs) to complement the current supply-side STI policy mix that focuses predominantly on applied research and R&D grants; (iii) introducing more instruments that promote collaboration between small and large firms, domestic-facing and export-oriented firms, and low-tech
POLICY EFFECTIVENESS REVIEW OF INNOVATION AND BUSINESS SUPPORT PROGRAMS
8
and high-tech firms, to facilitate knowledge transfer and help firms boost productivity and expand market access; and (iv) providing support to early-stage firms with investment readiness and investor outreach/networking to help them tap into private equity finance, thus complementing the subsidized debt financing assistance already offered in the policy mix (via the KUR program).
• Reducing instrument redundancies and fragmentation to improve spending efficiency, with a focus on: (i) rationalizing the number of policy instruments, starting with those that have very similar features, and possibly allocating a larger budget amount to each; and (ii) establishing a division of labor where ministries specialize in one type of support program or strategic objective, thus helping to reduce inefficiencies resulting from the high rates of program/instrument duplication across ministries.
Functional and Governance Analysis
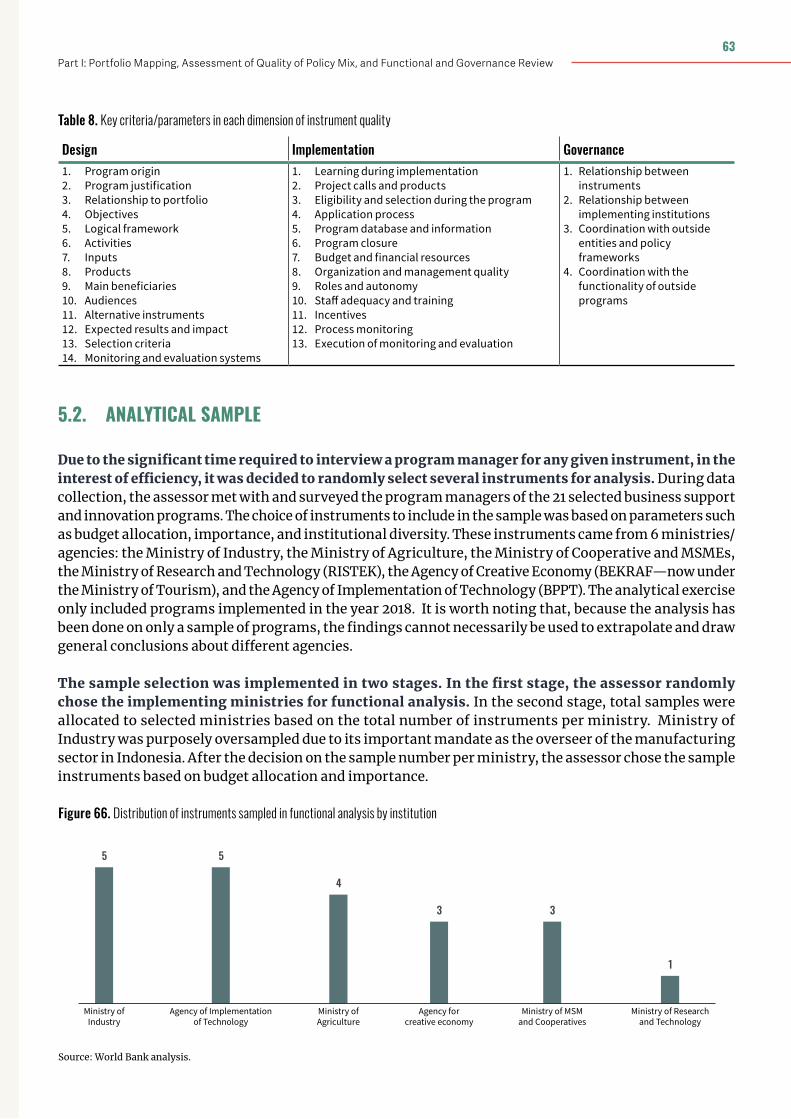
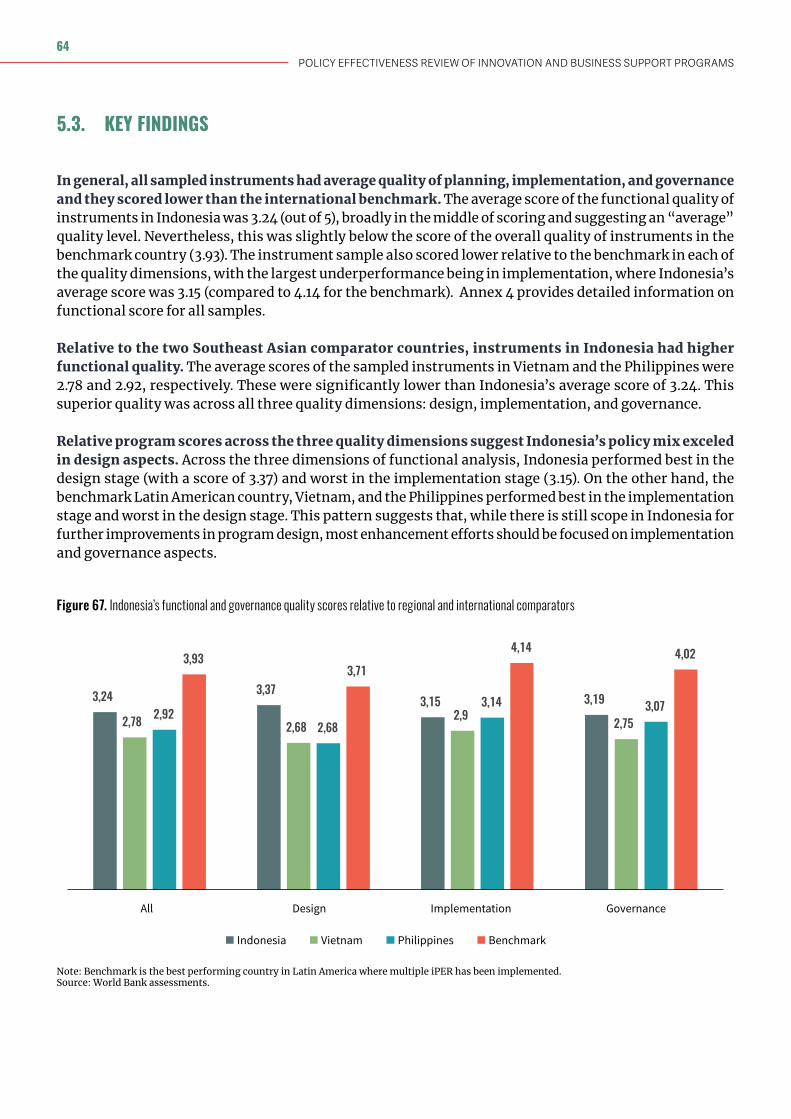
Based on a sample of 21 instruments from 6 ministries, the assessment of the quality of design, implementation and governance of the GoI’s policy mix revealed opportunities for improvement. The average score of the functional quality of program instruments in Indonesia was 3.24 (out of 5), below the average quality score of the international benchmark (i.e. the top performing country in Latin America, a region where the most iPERs have been conducted, to date). The instrument sample also scored lower relative to the benchmark in each of the quality dimensions, with the largest underperformance being in implementation. However, compared to Vietnam and the Philippines, instruments in Indonesia still performed better in all dimension of the functional analysis.
Within each of the three quality dimensions, the analysis uncovered the following shortcomings that will need to be addressed:
• Design: The Ministry of Finance’s guidance on program TORs has helped ensure a high level of design quality for most programs, including a clear intervention rationale, expected activities and outputs, and log frame. The main weakness in the majority of instruments was the inability to demonstrate the superiority of the chosen instrument over alternative approaches. Another weak point was the transparency of the project application calls to potential beneficiaries. This led to a low participation rate and decreased the overall quality of program participants.
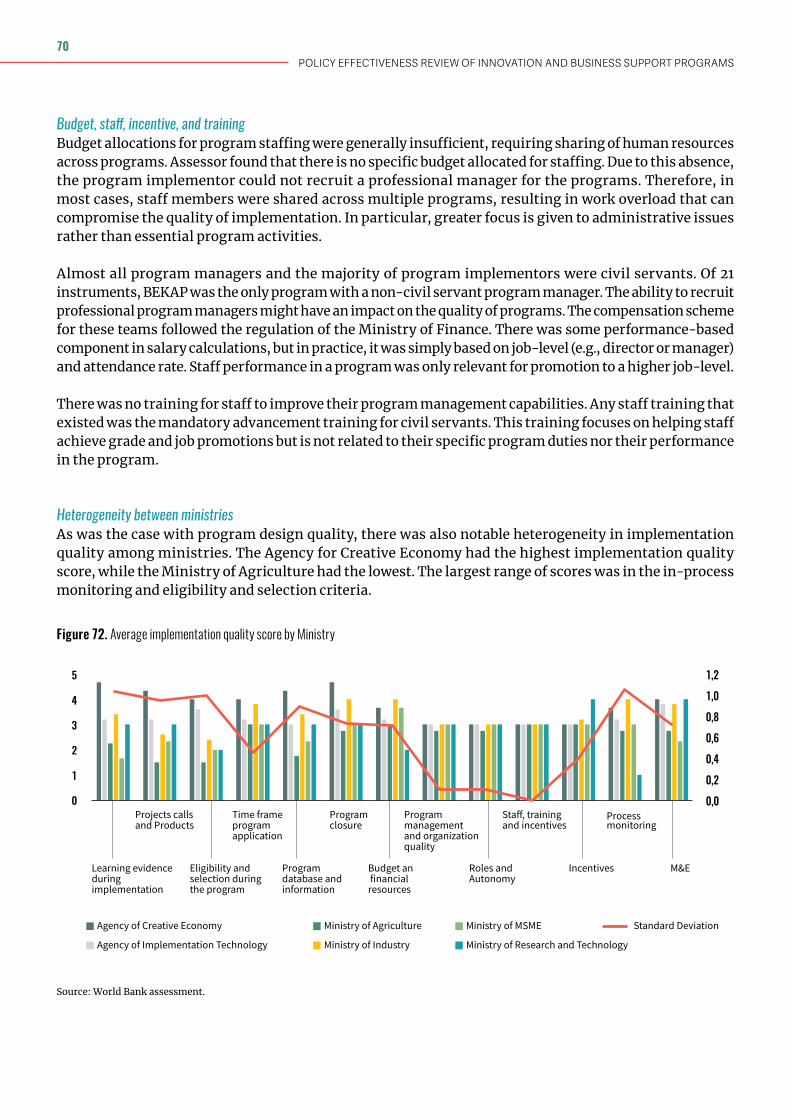
• Implementation: All instruments provided project closure reports at the end of their relevant fiscal years. However, most programs had limited Information Management and Monitoring and Evaluation systems. On top of that, there was a lack of mechanisms for user feedback during implementation. These shortcomings constrained managers’ ability to gauge what was and was not working and to make mid-course program corrections and adjustments. There was no specific budget for hiring professional program managers, and most implementation teams consisted of staff that were shared across multiple programs, resulting in work overload that compromised the quality of implementation. There were also no performance-based incentives nor program-specific training for staff. Furthermore, greater focus was given to administrative issues rather than the delivery of essential program activities.
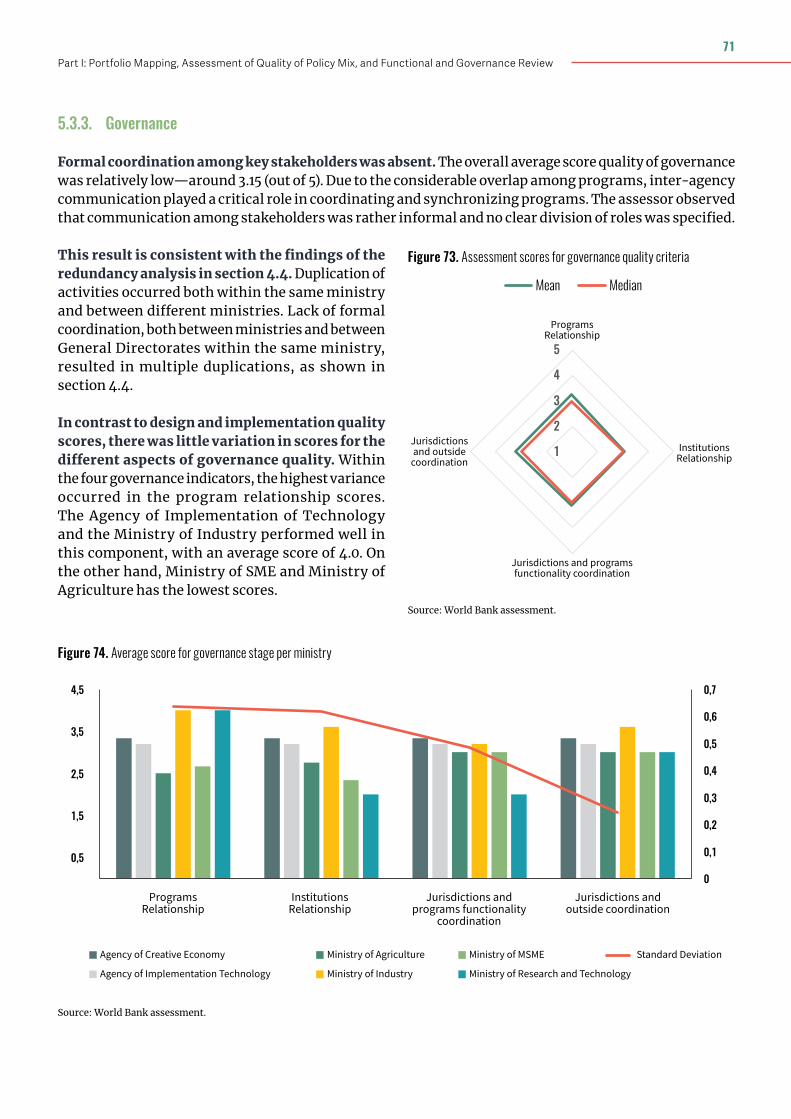
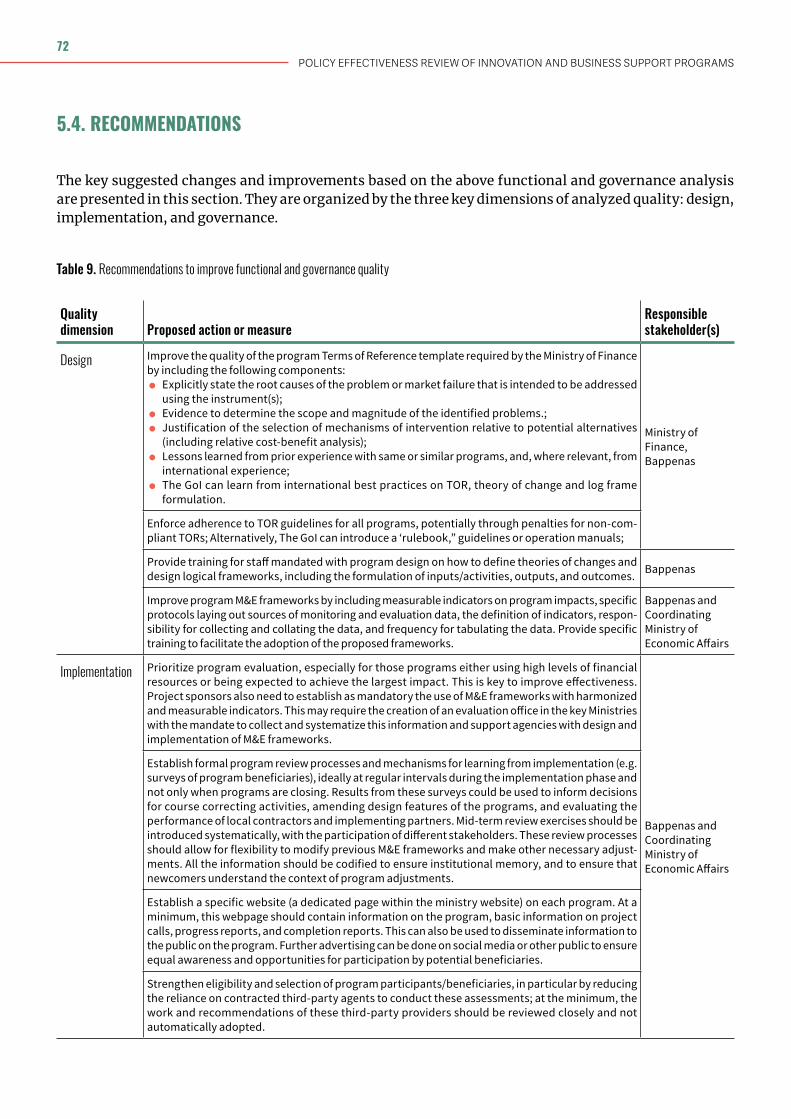
• Governance: There was limited formal coordination between different ministries and between different directorates under the same ministries during program design and implementation. These led to duplication of intervention instruments both within the same ministry and between ministries.
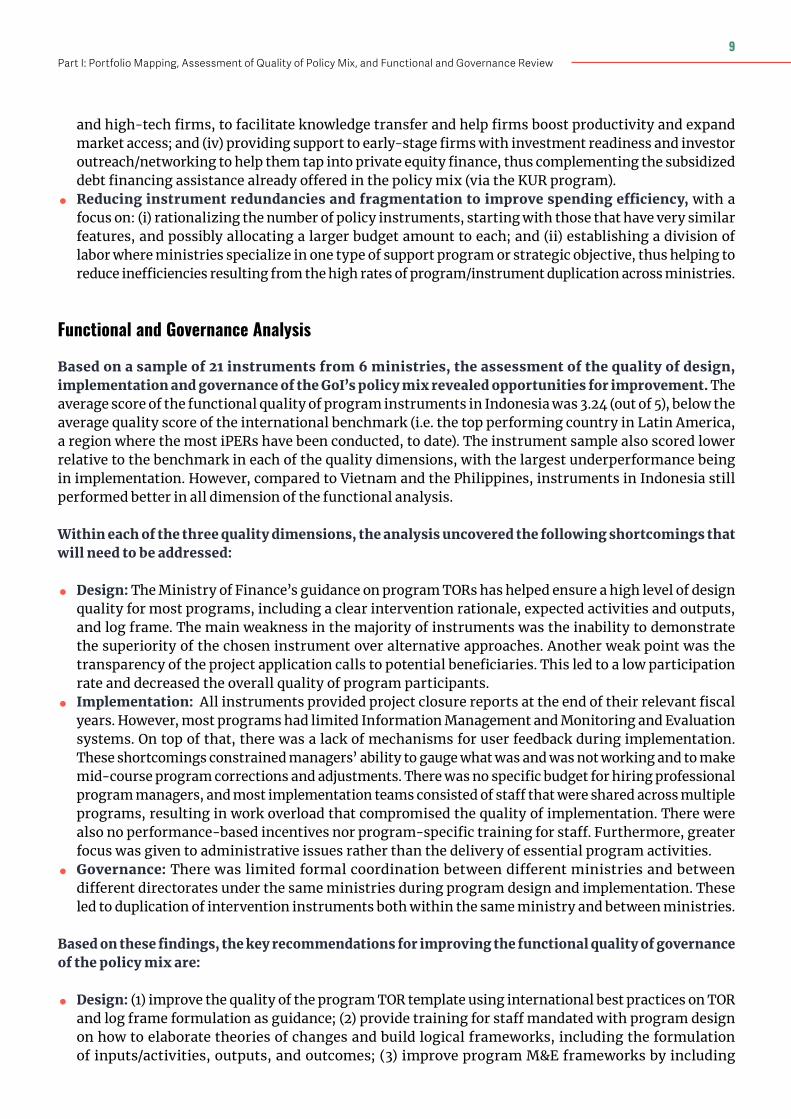
Based on these findings, the key recommendations for improving the functional quality of governance of the policy mix are:
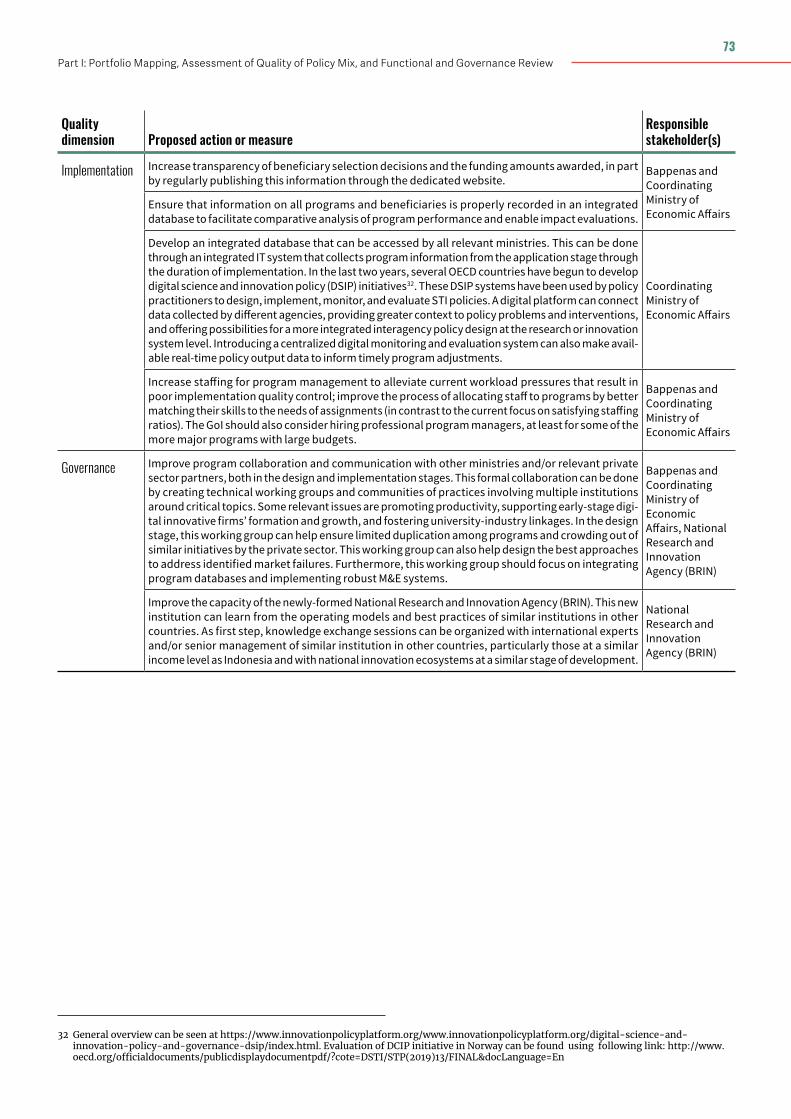
• Design: (1) improve the quality of the program TOR template using international best practices on TOR and log frame formulation as guidance; (2) provide training for staff mandated with program design on how to elaborate theories of changes and build logical frameworks, including the formulation of inputs/activities, outputs, and outcomes; (3) improve program M&E frameworks by including
9Part I: Portfolio Mapping, Assessment of Quality of Policy Mix, and Functional and Governance Review
measurable indicators on program impacts. For example, the GoI can introduce a ‘rulebook,” guidelines or operation manuals.
• Implementation: (1) establish formal program review processes and mechanisms for learning from implementation, including regular beneficiary surveys to obtain feedback; (2) increase transparency of beneficiary selection decisions and the funding amounts awarded, in particular by regularly publishing this information through the websites of implementing ministries; (3) increase knowledge sharing among related ministries by developing an integrated Management Information System that collects program information from the application stage through the duration of implementation; (4) improve systems for M&E implementation and incorporate impact evaluations, especially for those programs either using high level of financial resources or expected to achieve the largest impact.
• Governance: (1) improve program collaboration and communication among ministries and/or relevant private sector partners both in the design and implementation stage, in part through technical working groups on critical topics and communities of practices involving multiple institutions; and (2) strengthen the capacity of the newly-established National Research and Innovation Agency (BRIN) in Indonesia, starting with knowledge exchanges with international experts and managers from similar agencies in other countries.
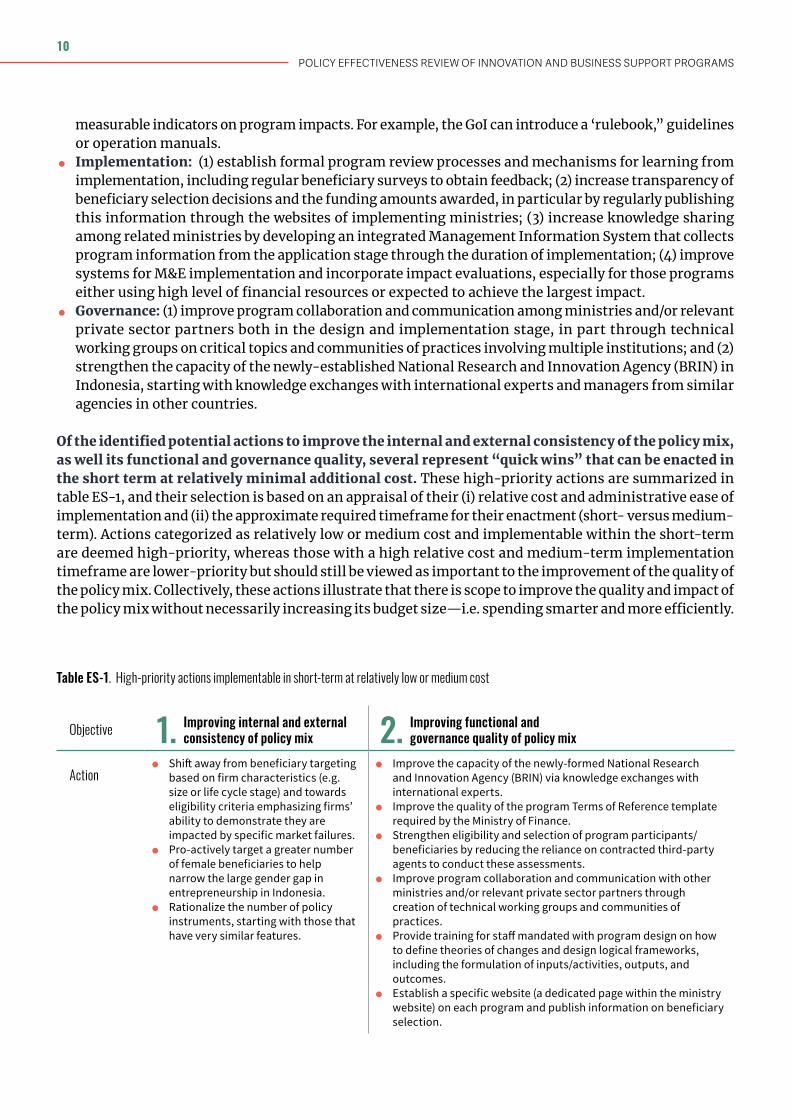
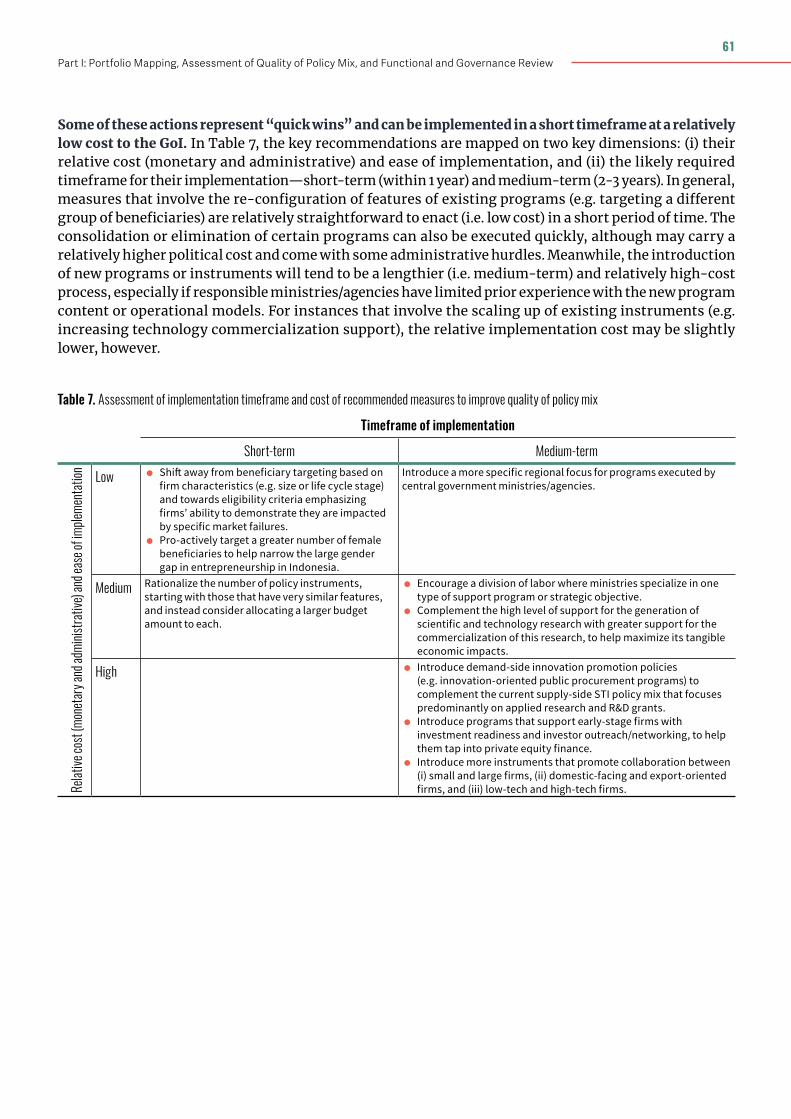
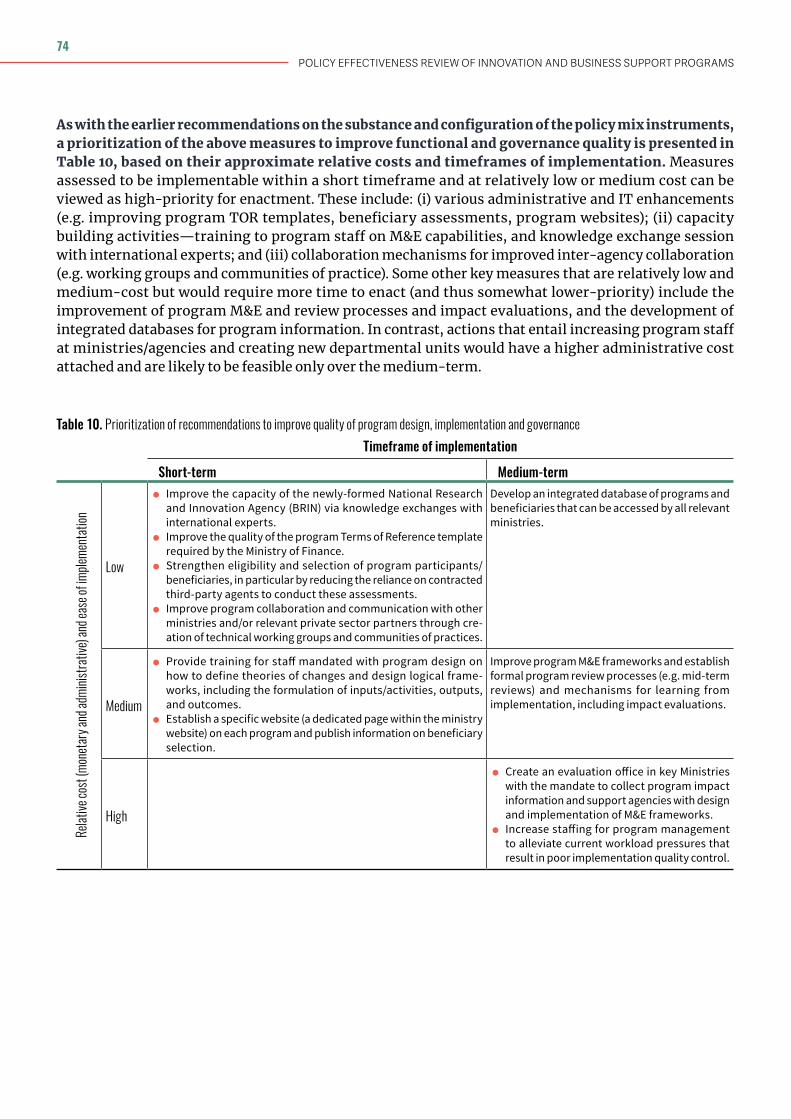
Of the identified potential actions to improve the internal and external consistency of the policy mix, as well its functional and governance quality, several represent “quick wins” that can be enacted in the short term at relatively minimal additional cost. These high-priority actions are summarized in table ES-1, and their selection is based on an appraisal of their (i) relative cost and administrative ease of implementation and (ii) the approximate required timeframe for their enactment (short- versus medium-term). Actions categorized as relatively low or medium cost and implementable within the short-term are deemed high-priority, whereas those with a high relative cost and medium-term implementation timeframe are lower-priority but should still be viewed as important to the improvement of the quality of the policy mix. Collectively, these actions illustrate that there is scope to improve the quality and impact of the policy mix without necessarily increasing its budget size—i.e. spending smarter and more efficiently.
Table ES-1. High-priority actions implementable in short-term at relatively low or medium cost
Objective 1. Improving internal and external consistency of policy mix 2. Improving functional and
governance quality of policy mix
Action • Shift away from beneficiary targeting
based on firm characteristics (e.g. size or life cycle stage) and towards eligibility criteria emphasizing firms’ ability to demonstrate they are impacted by specific market failures.
• Pro-actively target a greater number of female beneficiaries to help narrow the large gender gap in entrepreneurship in Indonesia.
• Rationalize the number of policy instruments, starting with those that have very similar features.
• Improve the capacity of the newly-formed National Research and Innovation Agency (BRIN) via knowledge exchanges with international experts.
• Improve the quality of the program Terms of Reference template required by the Ministry of Finance.
• Strengthen eligibility and selection of program participants/beneficiaries by reducing the reliance on contracted third-party agents to conduct these assessments.
• Improve program collaboration and communication with other ministries and/or relevant private sector partners through creation of technical working groups and communities of practices.
• Provide training for staff mandated with program design on how to define theories of changes and design logical frameworks, including the formulation of inputs/activities, outputs, and outcomes.
• Establish a specific website (a dedicated page within the ministry website) on each program and publish information on beneficiary selection.
POLICY EFFECTIVENESS REVIEW OF INNOVATION AND BUSINESS SUPPORT PROGRAMS
10
Introduction
The Policy Effectiveness Review on Innovation and Business Support Programs (iPER) sets out to assess the effectiveness of the Government of Indonesia’s (GoI) spending on business support programs and in promoting desired innovation and productivity outcomes. The ultimate objective is to help the GoI improve the quality of its policies in the areas of firm productivity and science, technology, and innovation (STI), and strengthen its capacity to design, implement and monitor these support programs. The iPER represents one of the first comprehensive assessments of the GoI’s spending on innovation and business support, and will lay an important foundation for subsequent dialogue on STI and business support policies between the GoI, the World Bank, and other development partners active in this space.
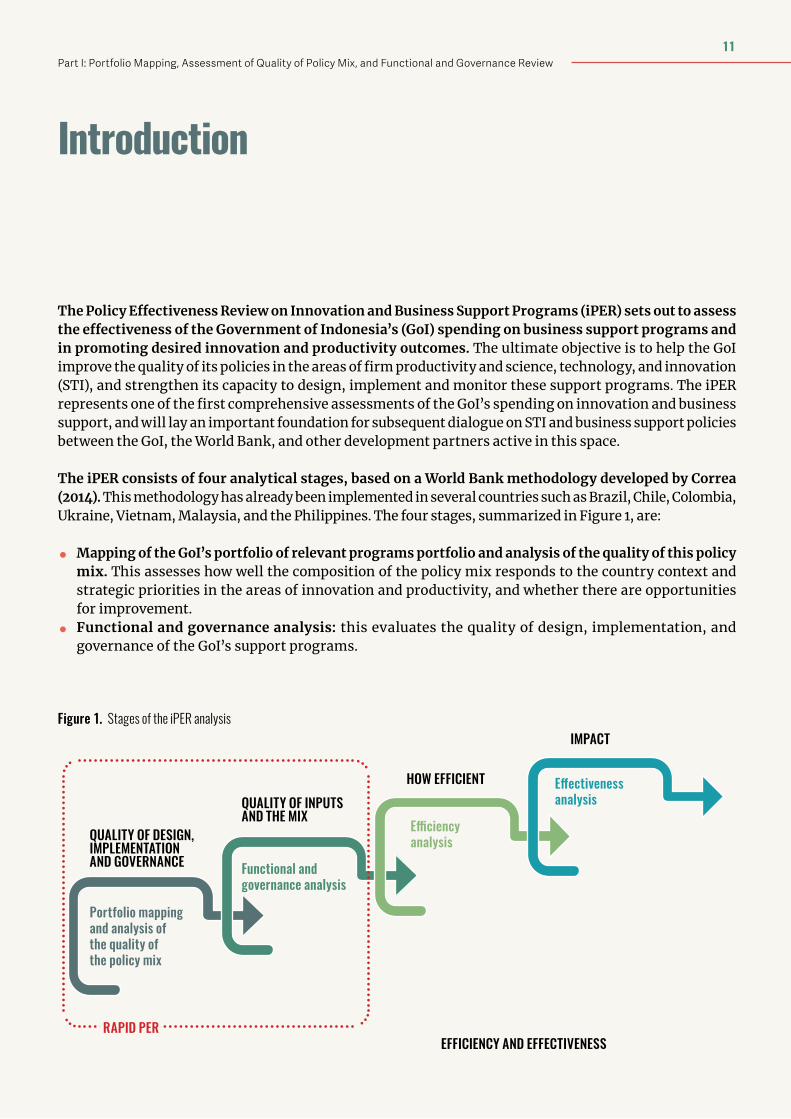
The iPER consists of four analytical stages, based on a World Bank methodology developed by Correa (2014). This methodology has already been implemented in several countries such as Brazil, Chile, Colombia, Ukraine, Vietnam, Malaysia, and the Philippines. The four stages, summarized in Figure 1, are:
• Mapping of the GoI’s portfolio of relevant programs portfolio and analysis of the quality of this policy mix. This assesses how well the composition of the policy mix responds to the country context and strategic priorities in the areas of innovation and productivity, and whether there are opportunities for improvement.
• Functional and governance analysis: this evaluates the quality of design, implementation, and governance of the GoI’s support programs.
Figure 1. Stages of the iPER analysis
Portfolio mapping and analysis of the quality of the policy mix
QUALITY OF DESIGN, IMPLEMENTATION AND GOVERNANCE Functional and
governance analysis
QUALITY OF INPUTS AND THE MIX
HOW EFFICIENT
Efficiency analysis
IMPACT
Effectiveness analysis
RAPID PEREFFICIENCY AND EFFECTIVENESS
11Part I: Portfolio Mapping, Assessment of Quality of Policy Mix, and Functional and Governance Review
• Efficiency analysis: this measures the cost efficiency of the GoI’s policy mix in achieving intended outputs and outcomes.
• Effectiveness analysis: this aims to measure the impact of the policy mix on the private sector’s innovation and productivity performance.
This report represents Part 1 of the iPER and covers the first two stages of the iPER analysis—(i) the portfolio mapping and analysis of the quality of the policy mix, and (ii) the functional and governance analysis. Collectively, these first two stages constitute a “Rapid iPER.” The efficiency and effectiveness analyses will be carried out in the future as Part 2 of the iPER. Once both parts are completed, they should help inform the smarter targeting of GoI resources towards firms with higher innovation, productivity and growth potential.
The analysis is a collaboration between the World Bank and Bappenas. The Bank and Bappenas worked closely together for the portfolio mapping and functional analysis. The roles of Bappenas included convening line ministries for discussions and data gathering, supporting meetings and analysis, and co-leading the dissemination of this report. The Bank has focused on compiling the initial list of portfolio instruments, training the Bappenas team on the iPER methodology, and leading interviews and analysis. It is envisioned that this collaborative working model will continue for Part 2 of the iPER.
The remainder of the report is structured as follows:
• Section 2 summarizes the Government of Indonesia’s (GoI) high-level objectives with regards to innovation and private sector productivity. These are strategic goals against which the GoI’s portfolio of innovation and business support programs will be assessed in this report.
• Section 3 is an analysis of the current performance of the private sector in Indonesia and provides the economic context for the challenges to greater productivity growth, which includes dimensions of innovation and firm-level competitiveness. This can be viewed as the demand side (for policy support) of the analysis, as it characterizes the size and scope of the need for stronger productivity growth among Indonesian firms and sectors.
• Section 4 is the first part of the analysis of the strength of the policy mix. It consists of: (i) the portfolio mapping of Indonesia’s innovation and business support programs, including summary statistics and disaggregation of the programs/instruments and related budget allocation based on the intended socio-economic outcomes, specific program objectives, mechanisms of intervention, and beneficiaries; and (ii) the analysis of the quality and consistency of the mix of policies I the GoI’s strategic priorities (Section 2) and the private sector performance gaps identified in the demand analysis (Section 3). It concludes with a synthesis of the recommended adjustments to the policy mix, based on the identified gaps between demand for policy and the existing provision of support.
• Section 5 is the functional and governance analysis, assessing the quality of design, implementation, and governance of the programs/instruments in the portfolio.
POLICY EFFECTIVENESS REVIEW OF INNOVATION AND BUSINESS SUPPORT PROGRAMS
12
Strategic Vision and Priorities
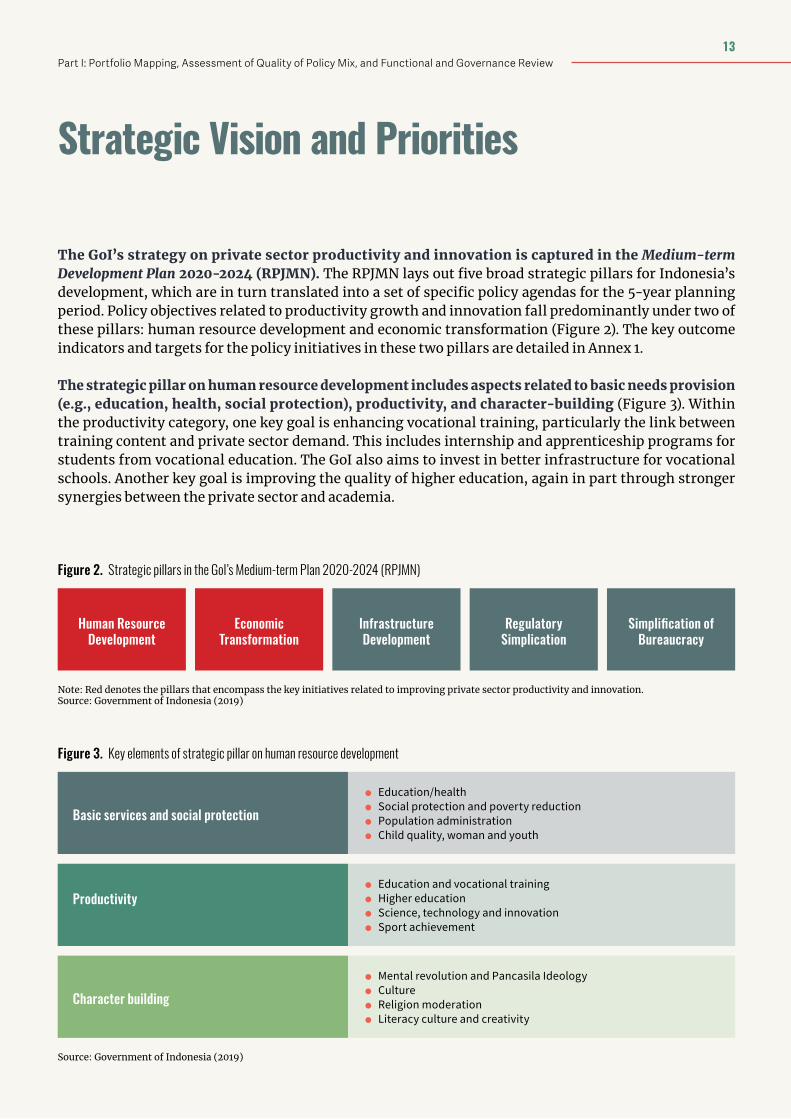
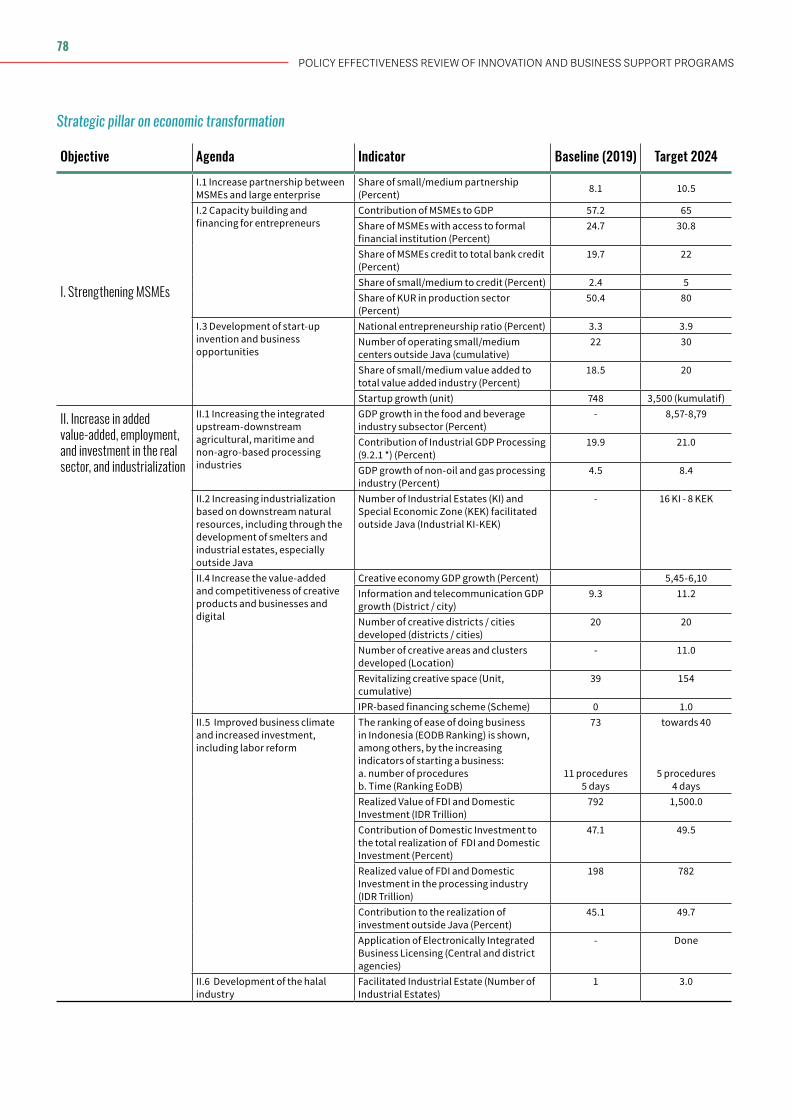
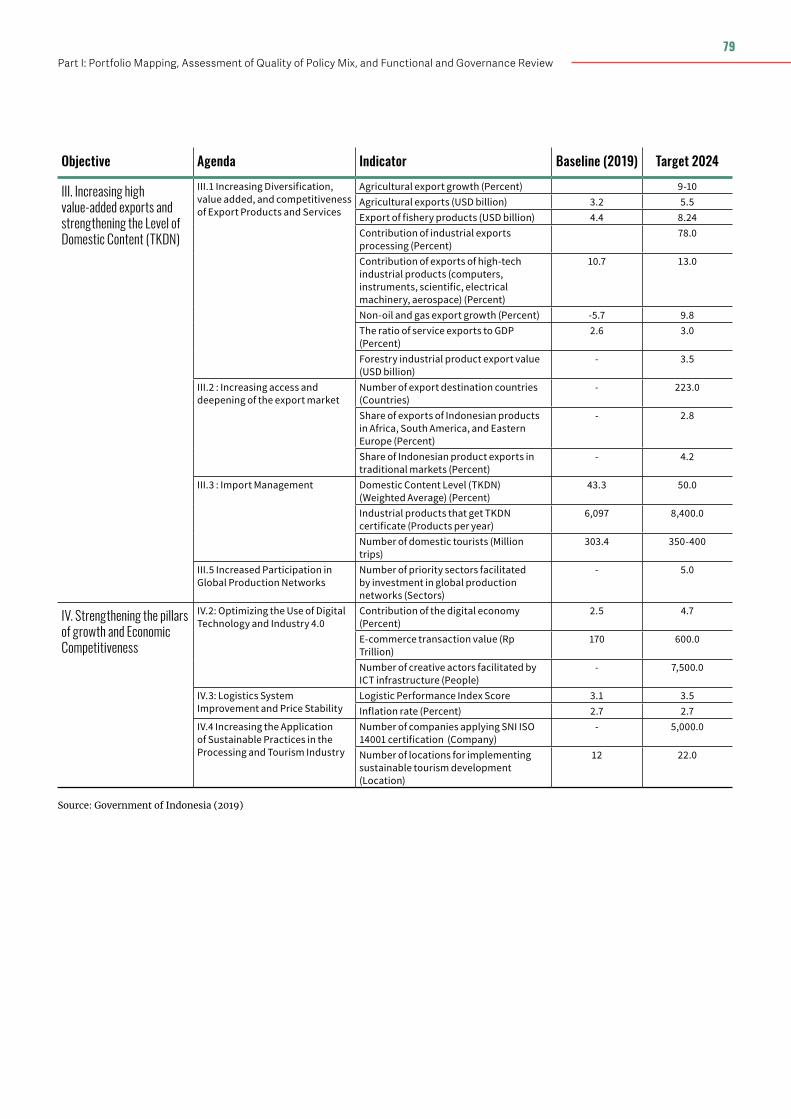
The GoI’s strategy on private sector productivity and innovation is captured in the Medium-term Development Plan 2020-2024 (RPJMN). The RPJMN lays out five broad strategic pillars for Indonesia’s development, which are in turn translated into a set of specific policy agendas for the 5-year planning period. Policy objectives related to productivity growth and innovation fall predominantly under two of these pillars: human resource development and economic transformation (Figure 2). The key outcome indicators and targets for the policy initiatives in these two pillars are detailed in Annex 1.
The strategic pillar on human resource development includes aspects related to basic needs provision (e.g., education, health, social protection), productivity, and character-building (Figure 3). Within the productivity category, one key goal is enhancing vocational training, particularly the link between training content and private sector demand. This includes internship and apprenticeship programs for students from vocational education. The GoI also aims to invest in better infrastructure for vocational schools. Another key goal is improving the quality of higher education, again in part through stronger synergies between the private sector and academia.
Figure 2. Strategic pillars in the GoI’s Medium-term Plan 2020-2024 (RPJMN)
Note: Red denotes the pillars that encompass the key initiatives related to improving private sector productivity and innovation.Source: Government of Indonesia (2019)
Infrastructure Development
Human Resource Development
Regulatory Simplication
Simplification of Bureaucracy
Economic Transformation
Figure 3. Key elements of strategic pillar on human resource development
Source: Government of Indonesia (2019)
Basic services and social protection
Productivity
Character building
• Education and vocational training • Higher education • Science, technology and innovation • Sport achievement
• Mental revolution and Pancasila Ideology • Culture • Religion moderation • Literacy culture and creativity
• Education/health • Social protection and poverty reduction • Population administration • Child quality, woman and youth
13Part I: Portfolio Mapping, Assessment of Quality of Policy Mix, and Functional and Governance Review
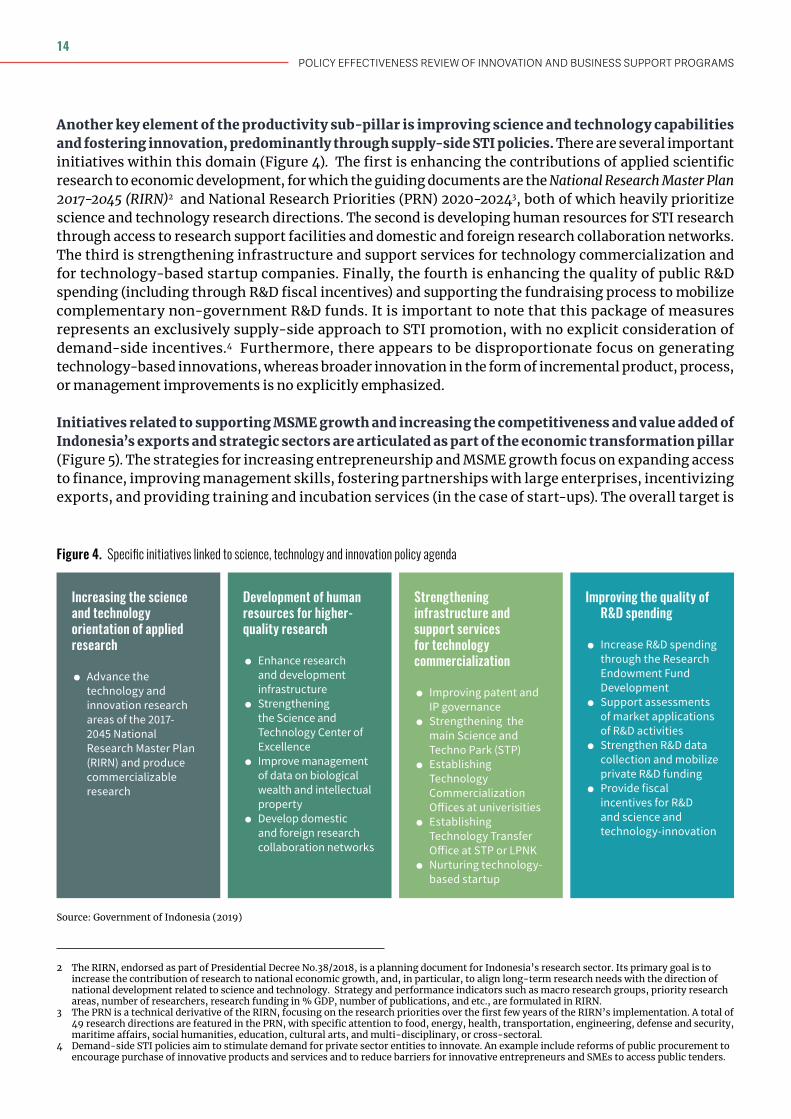
Another key element of the productivity sub-pillar is improving science and technology capabilities and fostering innovation, predominantly through supply-side STI policies. There are several important initiatives within this domain (Figure 4). The first is enhancing the contributions of applied scientific research to economic development, for which the guiding documents are the National Research Master Plan 2017-2045 (RIRN)2 and National Research Priorities (PRN) 2020-20243, both of which heavily prioritize science and technology research directions. The second is developing human resources for STI research through access to research support facilities and domestic and foreign research collaboration networks. The third is strengthening infrastructure and support services for technology commercialization and for technology-based startup companies. Finally, the fourth is enhancing the quality of public R&D spending (including through R&D fiscal incentives) and supporting the fundraising process to mobilize complementary non-government R&D funds. It is important to note that this package of measures represents an exclusively supply-side approach to STI promotion, with no explicit consideration of demand-side incentives.4 Furthermore, there appears to be disproportionate focus on generating technology-based innovations, whereas broader innovation in the form of incremental product, process, or management improvements is no explicitly emphasized.
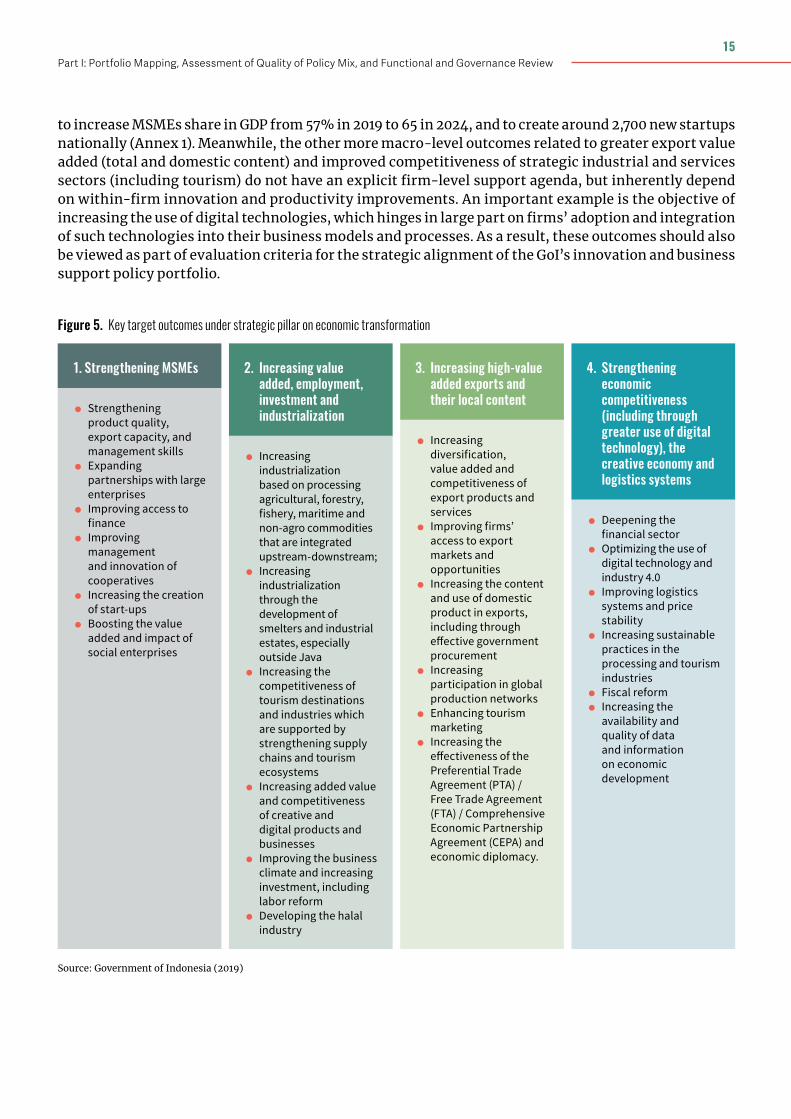
Initiatives related to supporting MSME growth and increasing the competitiveness and value added of Indonesia’s exports and strategic sectors are articulated as part of the economic transformation pillar (Figure 5). The strategies for increasing entrepreneurship and MSME growth focus on expanding access to finance, improving management skills, fostering partnerships with large enterprises, incentivizing exports, and providing training and incubation services (in the case of start-ups). The overall target is
2 The RIRN, endorsed as part of Presidential Decree No.38/2018, is a planning document for Indonesia’s research sector. Its primary goal is to increase the contribution of research to national economic growth, and, in particular, to align long-term research needs with the direction of national development related to science and technology. Strategy and performance indicators such as macro research groups, priority research areas, number of researchers, research funding in % GDP, number of publications, and etc., are formulated in RIRN.
3 The PRN is a technical derivative of the RIRN, focusing on the research priorities over the first few years of the RIRN’s implementation. A total of 49 research directions are featured in the PRN, with specific attention to food, energy, health, transportation, engineering, defense and security, maritime affairs, social humanities, education, cultural arts, and multi-disciplinary, or cross-sectoral.
4 Demand-side STI policies aim to stimulate demand for private sector entities to innovate. An example include reforms of public procurement to encourage purchase of innovative products and services and to reduce barriers for innovative entrepreneurs and SMEs to access public tenders.
Figure 4. Specific initiatives linked to science, technology and innovation policy agenda
Source: Government of Indonesia (2019)
Increasing the science and technology orientation of applied research
• Advance the technology and innovation research areas of the 2017-2045 National Research Master Plan (RIRN) and produce commercializable research
Development of human resources for higher-quality research
• Enhance research and development infrastructure
• Strengthening the Science and Technology Center of Excellence
• Improve management of data on biological wealth and intellectual property
• Develop domestic and foreign research collaboration networks
Strengthening infrastructure and support services for technology commercialization
• Improving patent and IP governance
• Strengthening the main Science and Techno Park (STP)
• Establishing Technology Commercialization Offices at univerisities
• Establishing Technology Transfer Office at STP or LPNK
• Nurturing technology-based startup
Improving the quality of R&D spending
• Increase R&D spending through the Research Endowment Fund Development
• Support assessments of market applications of R&D activities
• Strengthen R&D data collection and mobilize private R&D funding
• Provide fiscal incentives for R&D and science and technology-innovation
POLICY EFFECTIVENESS REVIEW OF INNOVATION AND BUSINESS SUPPORT PROGRAMS
14
Figure 5. Key target outcomes under strategic pillar on economic transformation
Source: Government of Indonesia (2019)
1. Strengthening MSMEs
• Strengthening product quality, export capacity, and management skills
• Expanding partnerships with large enterprises
• Improving access to finance
• Improving management and innovation of cooperatives
• Increasing the creation of start-ups
• Boosting the value added and impact of social enterprises
2. Increasing value added, employment, investment and industrialization
• Increasing industrialization based on processing agricultural, forestry, fishery, maritime and non-agro commodities that are integrated upstream-downstream;
• Increasing industrialization through the development of smelters and industrial estates, especially outside Java
• Increasing the competitiveness of tourism destinations and industries which are supported by strengthening supply chains and tourism ecosystems
• Increasing added value and competitiveness of creative and digital products and businesses
• Improving the business climate and increasing investment, including labor reform
• Developing the halal industry
3. Increasing high-value added exports and their local content
• Increasing diversification, value added and competitiveness of export products and services
• Improving firms’ access to export markets and opportunities
• Increasing the content and use of domestic product in exports, including through effective government procurement
• Increasing participation in global production networks
• Enhancing tourism marketing
• Increasing the effectiveness of the Preferential Trade Agreement (PTA) / Free Trade Agreement (FTA) / Comprehensive Economic Partnership Agreement (CEPA) and economic diplomacy.
to increase MSMEs share in GDP from 57% in 2019 to 65 in 2024, and to create around 2,700 new startups nationally (Annex 1). Meanwhile, the other more macro-level outcomes related to greater export value added (total and domestic content) and improved competitiveness of strategic industrial and services sectors (including tourism) do not have an explicit firm-level support agenda, but inherently depend on within-firm innovation and productivity improvements. An important example is the objective of increasing the use of digital technologies, which hinges in large part on firms’ adoption and integration of such technologies into their business models and processes. As a result, these outcomes should also be viewed as part of evaluation criteria for the strategic alignment of the GoI’s innovation and business support policy portfolio.
4. Strengthening economic competitiveness (including through greater use of digital technology), the creative economy and logistics systems
• Deepening the financial sector
• Optimizing the use of digital technology and industry 4.0
• Improving logistics systems and price stability
• Increasing sustainable practices in the processing and tourism industries
• Fiscal reform • Increasing the availability and quality of data and information on economic development
15Part I: Portfolio Mapping, Assessment of Quality of Policy Mix, and Functional and Governance Review
Private Sector Performance And Productivity Challenges
This chapter assesses the current performance of the private sector in Indonesia, with a focus on productivity and innovation outcomes and their underlying drivers. The overarching objective is to identify the priorities for innovation and business support based on the private sector’s challenges and needs. For this reason, the full range of macro-level issues potentially impacting Indonesia’s private sector growth and productive are not all discussed here, although they are elaborated in greater detail in the recent Indonesia Country Private Sector Diagnostic (World Bank, 2020), with the five most notable issues being: weaknesses or gaps in materials inputs to production, competition, infrastructure, human capital, and finance. Rather, the focus is on the subset of productivity constraints or determinants that are potentially addressable by the scope of programs/instruments in the policy mix considered in this iPER.
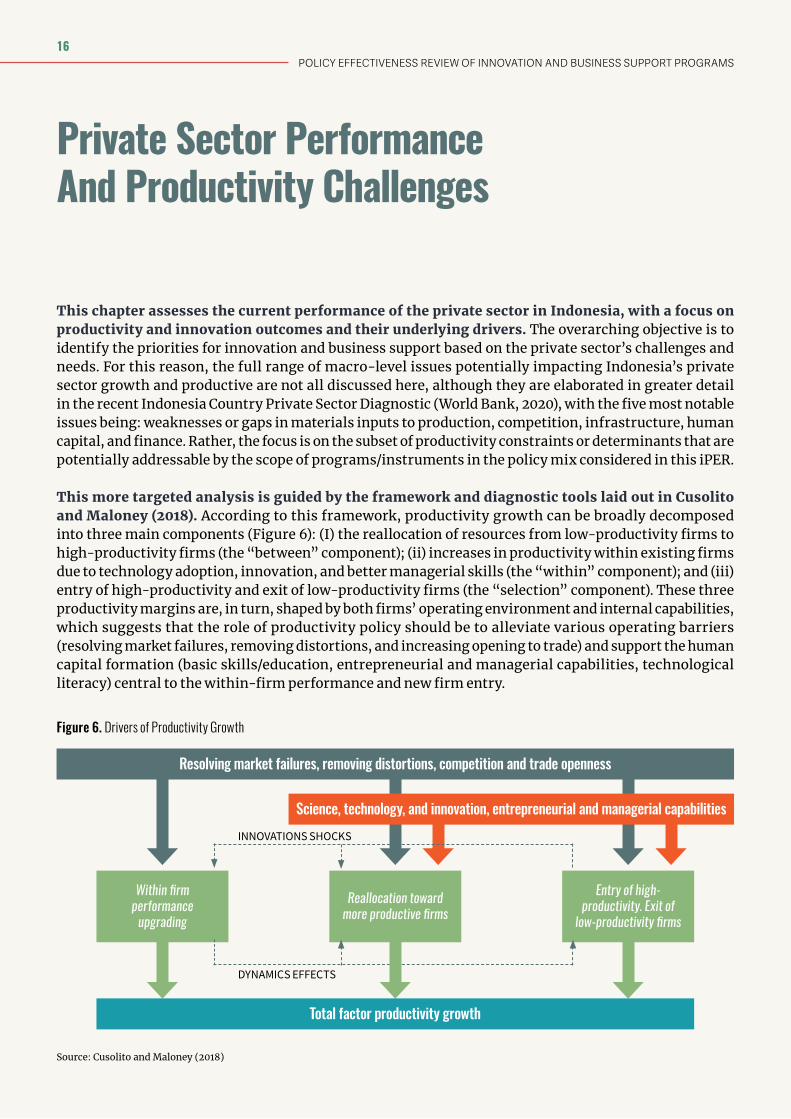
This more targeted analysis is guided by the framework and diagnostic tools laid out in Cusolito and Maloney (2018). According to this framework, productivity growth can be broadly decomposed into three main components (Figure 6): (I) the reallocation of resources from low-productivity firms to high-productivity firms (the “between” component); (ii) increases in productivity within existing firms due to technology adoption, innovation, and better managerial skills (the “within” component); and (iii) entry of high-productivity and exit of low-productivity firms (the “selection” component). These three productivity margins are, in turn, shaped by both firms’ operating environment and internal capabilities, which suggests that the role of productivity policy should be to alleviate various operating barriers (resolving market failures, removing distortions, and increasing opening to trade) and support the human capital formation (basic skills/education, entrepreneurial and managerial capabilities, technological literacy) central to the within-firm performance and new firm entry.
Figure 6. Drivers of Productivity Growth
Source: Cusolito and Maloney (2018)
INNOVATIONS SHOCKS
DYNAMICS EFFECTS
Resolving market failures, removing distortions, competition and trade openness
Within firm performance
upgrading
Total factor productivity growth
Reallocation toward more productive firms
Entry of high-productivity. Exit of
low-productivity firms
Science, technology, and innovation, entrepreneurial and managerial capabilities
POLICY EFFECTIVENESS REVIEW OF INNOVATION AND BUSINESS SUPPORT PROGRAMS
16
Accordingly, the analysis in this section is structured in three parts:
• A stocktaking of recent productivity, innovation and entrepreneurship outcomes in Indonesia, including the dynamics of each of the three productivity margins in the Cusolito and Maloney (2018) framework;
• An analysis of the some of the key input determinants of these outcomes, covering both the operating environment and firm-level factors;
• A brief perspective on the impacts of the recent COVID-19 crisis on firm performance and its implications for future GoI policy support to firms.
17Part I: Portfolio Mapping, Assessment of Quality of Policy Mix, and Functional and Governance Review
3.1. PRODUCTIVITY, INNOVATION, AND ENTREPRENEURSHIP OUTCOMES
3.1.1. Productivity
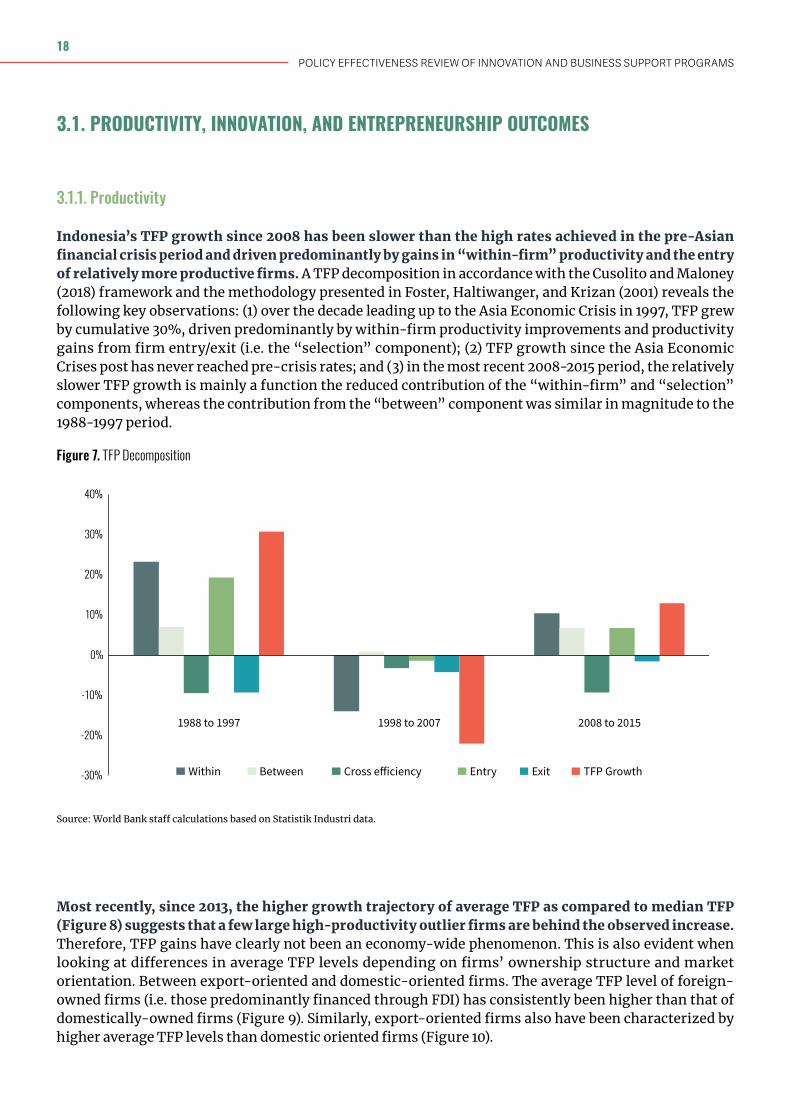
Indonesia’s TFP growth since 2008 has been slower than the high rates achieved in the pre-Asian financial crisis period and driven predominantly by gains in “within-firm” productivity and the entry of relatively more productive firms. A TFP decomposition in accordance with the Cusolito and Maloney (2018) framework and the methodology presented in Foster, Haltiwanger, and Krizan (2001) reveals the following key observations: (1) over the decade leading up to the Asia Economic Crisis in 1997, TFP grew by cumulative 30%, driven predominantly by within-firm productivity improvements and productivity gains from firm entry/exit (i.e. the “selection” component); (2) TFP growth since the Asia Economic Crises post has never reached pre-crisis rates; and (3) in the most recent 2008-2015 period, the relatively slower TFP growth is mainly a function the reduced contribution of the “within-firm” and “selection” components, whereas the contribution from the “between” component was similar in magnitude to the 1988-1997 period.
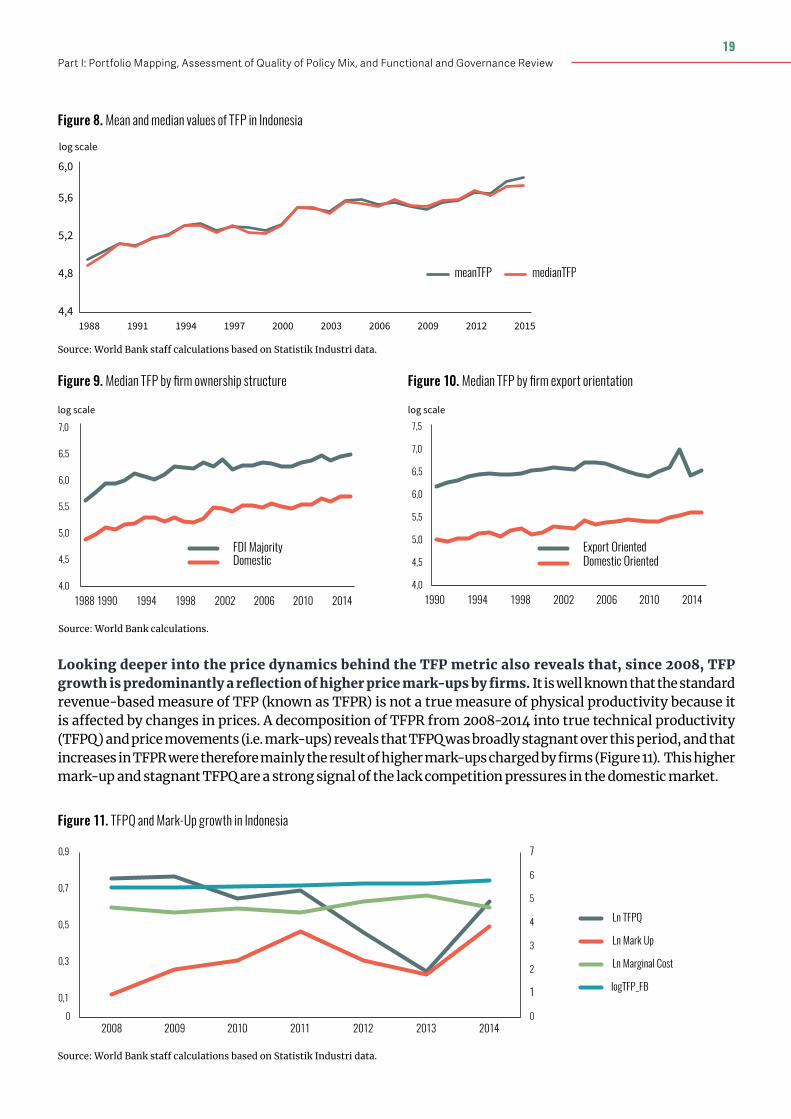
Most recently, since 2013, the higher growth trajectory of average TFP as compared to median TFP (Figure 8) suggests that a few large high-productivity outlier firms are behind the observed increase. Therefore, TFP gains have clearly not been an economy-wide phenomenon. This is also evident when looking at differences in average TFP levels depending on firms’ ownership structure and market orientation. Between export-oriented and domestic-oriented firms. The average TFP level of foreign-owned firms (i.e. those predominantly financed through FDI) has consistently been higher than that of domestically-owned firms (Figure 9). Similarly, export-oriented firms also have been characterized by higher average TFP levels than domestic oriented firms (Figure 10).
Figure 7. TFP Decomposition
Source: World Bank staff calculations based on Statistik Industri data.
-30%
-20%
-10%
0%
10%
20%
30%
40%
1988 to 1997 1998 to 2007 2008 to 2015
Within Between Cross e�iciency Entry Exit TFP Growth
POLICY EFFECTIVENESS REVIEW OF INNOVATION AND BUSINESS SUPPORT PROGRAMS
18
Looking deeper into the price dynamics behind the TFP metric also reveals that, since 2008, TFP growth is predominantly a reflection of higher price mark-ups by firms. It is well known that the standard revenue-based measure of TFP (known as TFPR) is not a true measure of physical productivity because it is affected by changes in prices. A decomposition of TFPR from 2008-2014 into true technical productivity (TFPQ) and price movements (i.e. mark-ups) reveals that TFPQ was broadly stagnant over this period, and that increases in TFPR were therefore mainly the result of higher mark-ups charged by firms (Figure 11). This higher mark-up and stagnant TFPQ are a strong signal of the lack competition pressures in the domestic market.
Figure 8. Mean and median values of TFP in Indonesia
Figure 9. Median TFP by firm ownership structure Figure 10. Median TFP by firm export orientation
Figure 11. TFPQ and Mark-Up growth in Indonesia
Source: World Bank staff calculations based on Statistik Industri data.
Source: World Bank calculations.
Source: World Bank staff calculations based on Statistik Industri data.
4,4
4,8
5,2
5,6
6,0
1988 1991 1994 1997 2000 2003 2006 2009 2012 2015
meanTFP medianTFP
log scale
1990 1994 1998 2002 2006 2010 20144,0
4,5
5,0
5,5
6,0
6,5
7,0
7,5
Export OrientedDomestic Oriented
log scale
4,0
4,5
5,0
5,5
6,0
6,5
7,0
1988 1990 1994 1998 2002 2006 2010 2014
FDI MajorityDomestic
log scale
0
1
2
3
4
5
6
7
0
0,1
0,3
0,5
0,7
0,9
2008 2009 2010 2011 2012 2013 2014
Ln TFPQ
Ln Mark Up
Ln Marginal Cost
logTFP_FB
19Part I: Portfolio Mapping, Assessment of Quality of Policy Mix, and Functional and Governance Review
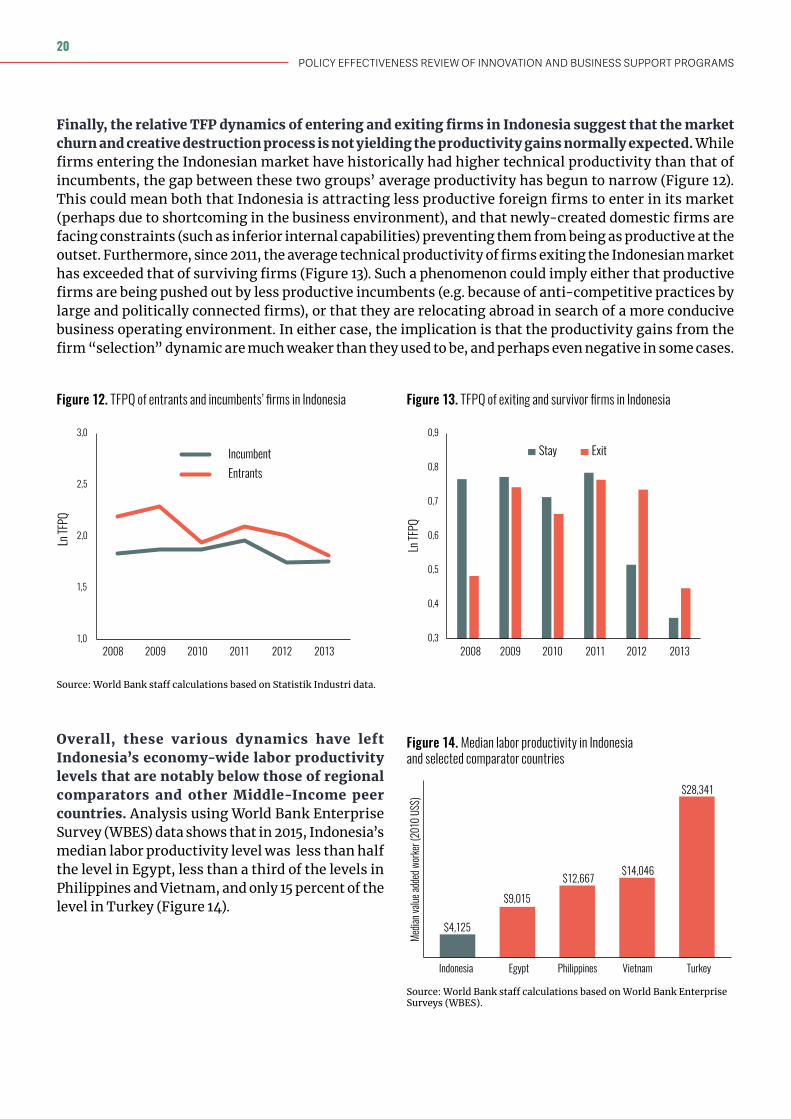
Finally, the relative TFP dynamics of entering and exiting firms in Indonesia suggest that the market churn and creative destruction process is not yielding the productivity gains normally expected. While firms entering the Indonesian market have historically had higher technical productivity than that of incumbents, the gap between these two groups’ average productivity has begun to narrow (Figure 12). This could mean both that Indonesia is attracting less productive foreign firms to enter in its market (perhaps due to shortcoming in the business environment), and that newly-created domestic firms are facing constraints (such as inferior internal capabilities) preventing them from being as productive at the outset. Furthermore, since 2011, the average technical productivity of firms exiting the Indonesian market has exceeded that of surviving firms (Figure 13). Such a phenomenon could imply either that productive firms are being pushed out by less productive incumbents (e.g. because of anti-competitive practices by large and politically connected firms), or that they are relocating abroad in search of a more conducive business operating environment. In either case, the implication is that the productivity gains from the firm “selection” dynamic are much weaker than they used to be, and perhaps even negative in some cases.
Figure 12. TFPQ of entrants and incumbents’ firms in Indonesia
Figure 14. Median labor productivity in Indonesia and selected comparator countries
Figure 13. TFPQ of exiting and survivor firms in Indonesia
Source: World Bank staff calculations based on Statistik Industri data.
Overall, these various dynamics have left Indonesia’s economy-wide labor productivity levels that are notably below those of regional comparators and other Middle-Income peer countries. Analysis using World Bank Enterprise Survey (WBES) data shows that in 2015, Indonesia’s median labor productivity level was less than half the level in Egypt, less than a third of the levels in Philippines and Vietnam, and only 15 percent of the level in Turkey (Figure 14).
Source: World Bank staff calculations based on World Bank Enterprise Surveys (WBES).
Ln TF
PQ
1,0
1,5
2,0
2,5
3,0
2008 2009 2010 2011 2012 2013
IncumbentEntrants
0,3
0,4
0,5
0,6
0,7
0,8
0,9
2008 2009 2010 2011 2012 2013
Ln TF
PQ
Stay Exit
Media
n valu
e add
ed w
orke
r (20
10 U
S$)
TurkeyVietnamPhilippinesEgyptIndonesia
$4,125
$9,015
$12,667$14,046
$28,341
POLICY EFFECTIVENESS REVIEW OF INNOVATION AND BUSINESS SUPPORT PROGRAMS
20
3.1.2. Innovation
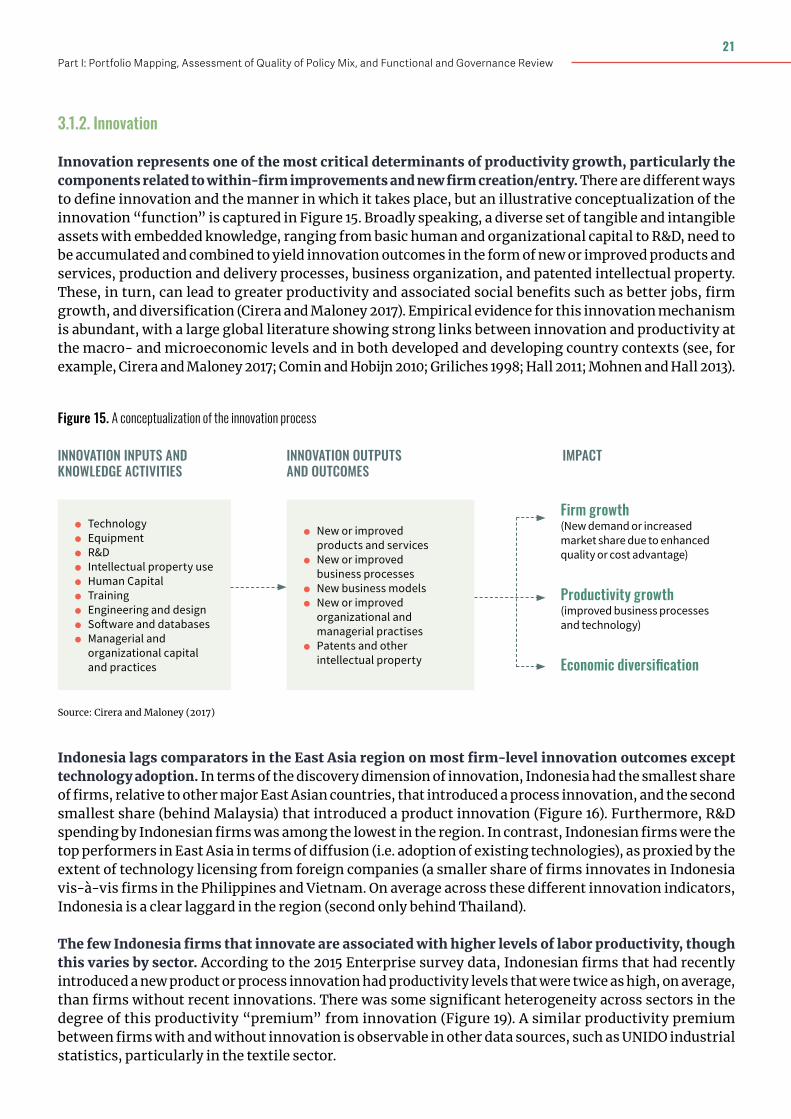
Innovation represents one of the most critical determinants of productivity growth, particularly the components related to within-firm improvements and new firm creation/entry. There are different ways to define innovation and the manner in which it takes place, but an illustrative conceptualization of the innovation “function” is captured in Figure 15. Broadly speaking, a diverse set of tangible and intangible assets with embedded knowledge, ranging from basic human and organizational capital to R&D, need to be accumulated and combined to yield innovation outcomes in the form of new or improved products and services, production and delivery processes, business organization, and patented intellectual property. These, in turn, can lead to greater productivity and associated social benefits such as better jobs, firm growth, and diversification (Cirera and Maloney 2017). Empirical evidence for this innovation mechanism is abundant, with a large global literature showing strong links between innovation and productivity at the macro- and microeconomic levels and in both developed and developing country contexts (see, for example, Cirera and Maloney 2017; Comin and Hobijn 2010; Griliches 1998; Hall 2011; Mohnen and Hall 2013).
Figure 15. A conceptualization of the innovation process
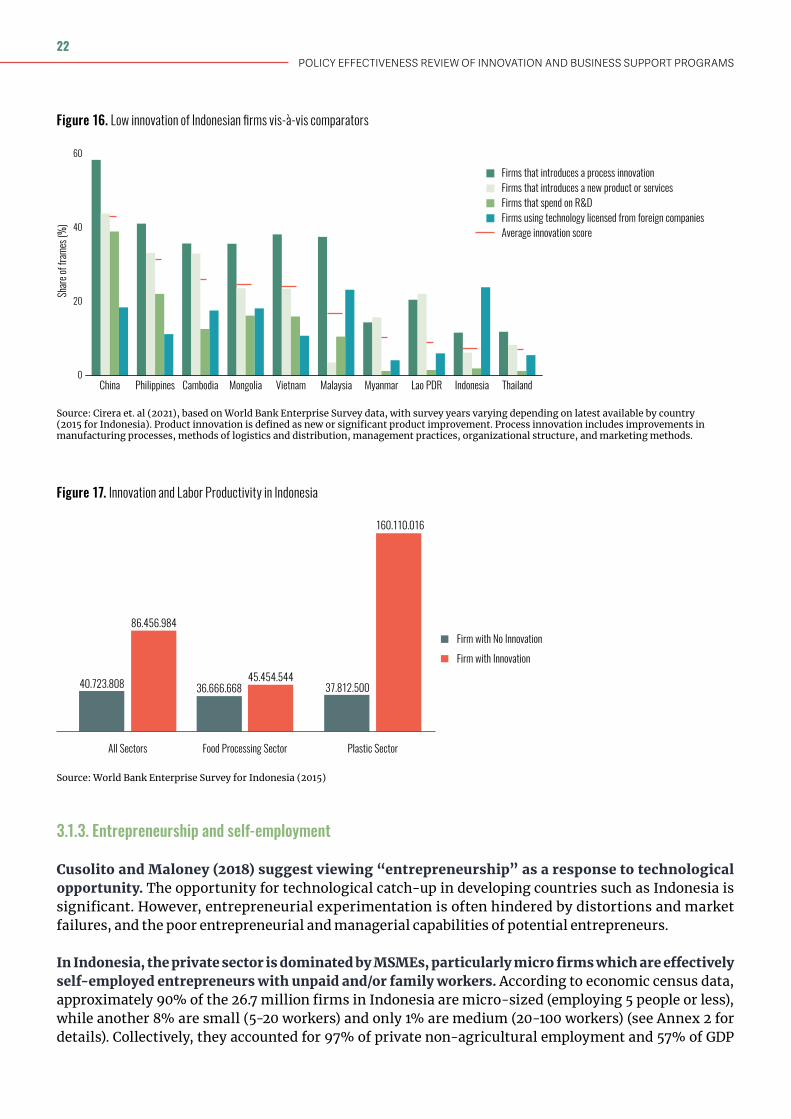
Indonesia lags comparators in the East Asia region on most firm-level innovation outcomes except technology adoption. In terms of the discovery dimension of innovation, Indonesia had the smallest share of firms, relative to other major East Asian countries, that introduced a process innovation, and the second smallest share (behind Malaysia) that introduced a product innovation (Figure 16). Furthermore, R&D spending by Indonesian firms was among the lowest in the region. In contrast, Indonesian firms were the top performers in East Asia in terms of diffusion (i.e. adoption of existing technologies), as proxied by the extent of technology licensing from foreign companies (a smaller share of firms innovates in Indonesia vis-à-vis firms in the Philippines and Vietnam. On average across these different innovation indicators, Indonesia is a clear laggard in the region (second only behind Thailand).
The few Indonesia firms that innovate are associated with higher levels of labor productivity, though this varies by sector. According to the 2015 Enterprise survey data, Indonesian firms that had recently introduced a new product or process innovation had productivity levels that were twice as high, on average, than firms without recent innovations. There was some significant heterogeneity across sectors in the degree of this productivity “premium” from innovation (Figure 19). A similar productivity premium between firms with and without innovation is observable in other data sources, such as UNIDO industrial statistics, particularly in the textile sector.
Source: Cirera and Maloney (2017)
INNOVATION INPUTS AND KNOWLEDGE ACTIVITIES
• New or improved products and services
• New or improved business processes
• New business models • New or improved organizational and managerial practises
• Patents and other intellectual property
Firm growth(New demand or increased market share due to enhanced quality or cost advantage)
Productivity growth(improved business processes and technology)
Economic diversification
• Technology • Equipment • R&D • Intellectual property use • Human Capital • Training • Engineering and design • Software and databases • Managerial and organizational capital and practices
INNOVATION OUTPUTS AND OUTCOMES
IMPACT
21Part I: Portfolio Mapping, Assessment of Quality of Policy Mix, and Functional and Governance Review
3.1.3. Entrepreneurship and self-employment
Cusolito and Maloney (2018) suggest viewing “entrepreneurship” as a response to technological opportunity. The opportunity for technological catch-up in developing countries such as Indonesia is significant. However, entrepreneurial experimentation is often hindered by distortions and market failures, and the poor entrepreneurial and managerial capabilities of potential entrepreneurs.
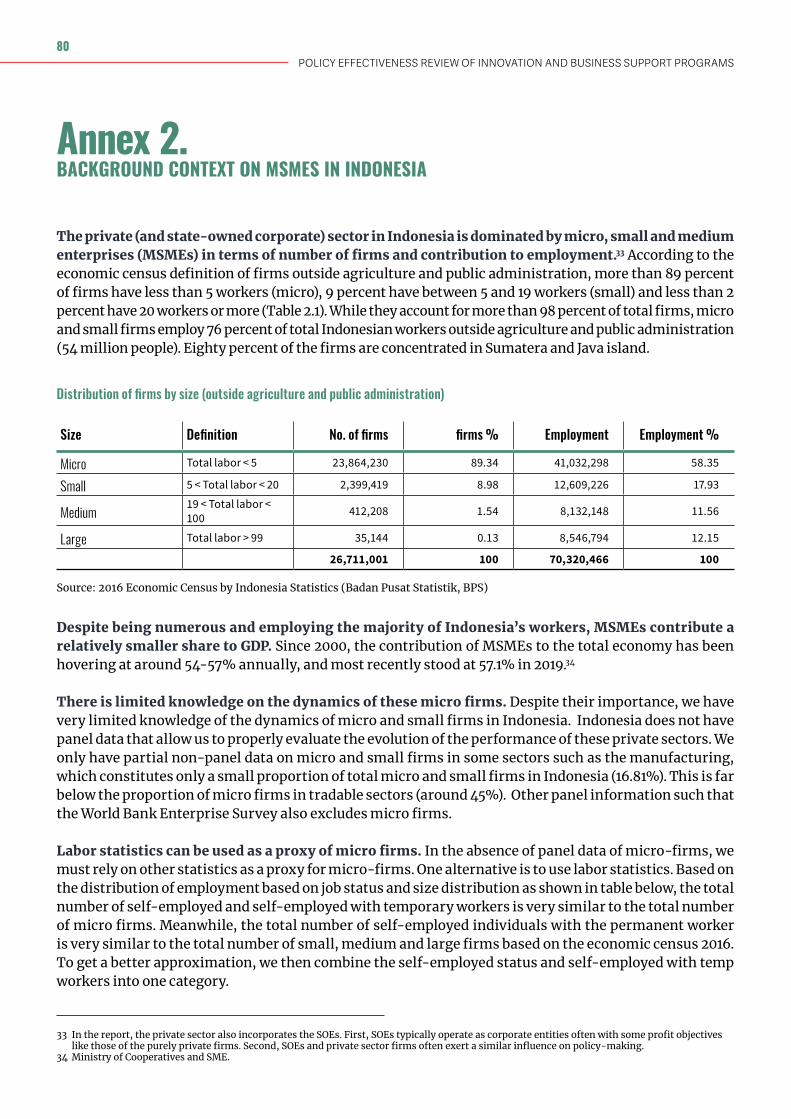
In Indonesia, the private sector is dominated by MSMEs, particularly micro firms which are effectively self-employed entrepreneurs with unpaid and/or family workers. According to economic census data, approximately 90% of the 26.7 million firms in Indonesia are micro-sized (employing 5 people or less), while another 8% are small (5-20 workers) and only 1% are medium (20-100 workers) (see Annex 2 for details). Collectively, they accounted for 97% of private non-agricultural employment and 57% of GDP
Figure 16. Low innovation of Indonesian firms vis-à-vis comparators
Figure 17. Innovation and Labor Productivity in Indonesia
Source: Cirera et. al (2021), based on World Bank Enterprise Survey data, with survey years varying depending on latest available by country (2015 for Indonesia). Product innovation is defined as new or significant product improvement. Process innovation includes improvements in manufacturing processes, methods of logistics and distribution, management practices, organizational structure, and marketing methods.
Source: World Bank Enterprise Survey for Indonesia (2015)
China
Firms that introduces a process innovation
Shar
e of f
rame
s (%
)
Firms that spend on R&D
Average innovation score
Firms that introduces a new product or services
Firms using technology licensed from foreign companies
Philippines Cambodia Mongolia Vietnam Malaysia Myanmar Lao PDR Indonesia Thailand
60
40
20
0
37.812.50036.666.66840.723.808
160.110.016
45.454.544
86.456.984
All Sectors Food Processing Sector Plastic Sector
Firm with No Innovation
Firm with Innovation
POLICY EFFECTIVENESS REVIEW OF INNOVATION AND BUSINESS SUPPORT PROGRAMS
22
in 2019. A triangulation of the economic Census data with labor force statistics reveals that the micro segment of this MSME population is effectively defined by self-employed individuals, only one-third of which employ additional workers in their “firm” (most of whom are unpaid family members). Their income is typically low—about half of the median employees’ wage in 2018—and they work predominantly in non-tradable services sectors, in relatively unproductive activities using unsophisticated technologies (e.g. two- and three-wheeler taxi services, street vendors, independent trash collectors).
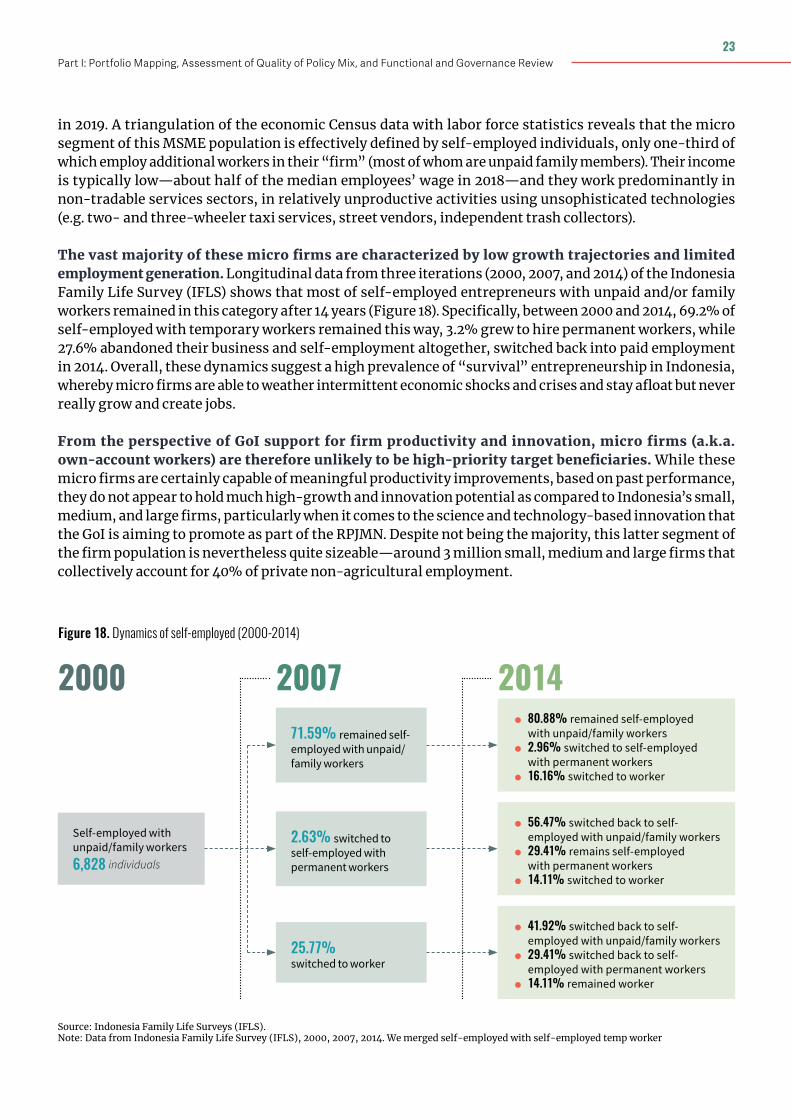
The vast majority of these micro firms are characterized by low growth trajectories and limited employment generation. Longitudinal data from three iterations (2000, 2007, and 2014) of the Indonesia Family Life Survey (IFLS) shows that most of self-employed entrepreneurs with unpaid and/or family workers remained in this category after 14 years (Figure 18). Specifically, between 2000 and 2014, 69.2% of self-employed with temporary workers remained this way, 3.2% grew to hire permanent workers, while 27.6% abandoned their business and self-employment altogether, switched back into paid employment in 2014. Overall, these dynamics suggest a high prevalence of “survival” entrepreneurship in Indonesia, whereby micro firms are able to weather intermittent economic shocks and crises and stay afloat but never really grow and create jobs.
From the perspective of GoI support for firm productivity and innovation, micro firms (a.k.a. own-account workers) are therefore unlikely to be high-priority target beneficiaries. While these micro firms are certainly capable of meaningful productivity improvements, based on past performance, they do not appear to hold much high-growth and innovation potential as compared to Indonesia’s small, medium, and large firms, particularly when it comes to the science and technology-based innovation that the GoI is aiming to promote as part of the RPJMN. Despite not being the majority, this latter segment of the firm population is nevertheless quite sizeable—around 3 million small, medium and large firms that collectively account for 40% of private non-agricultural employment.
Figure 18. Dynamics of self-employed (2000-2014)
Source: Indonesia Family Life Surveys (IFLS).Note: Data from Indonesia Family Life Survey (IFLS), 2000, 2007, 2014. We merged self-employed with self-employed temp worker
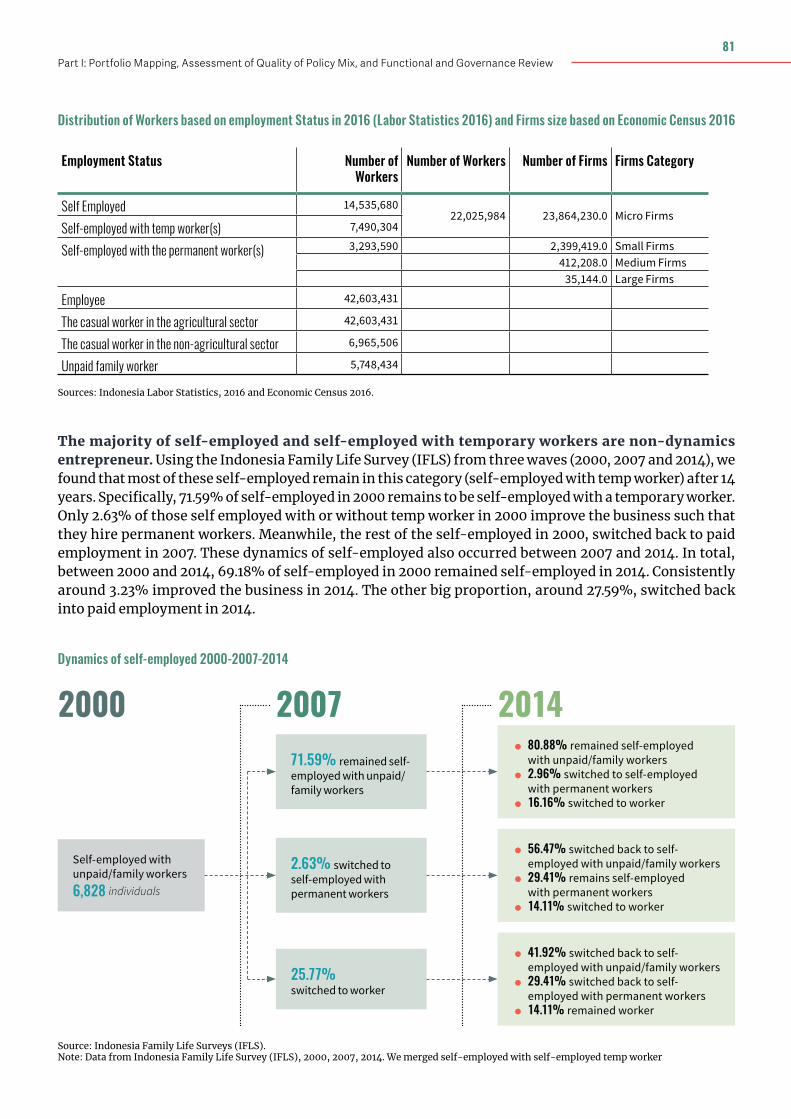
2000
Self-employed with unpaid/family workers 6,828 individuals
200771.59% remained self-employed with unpaid/family workers
2014 • 80.88% remained self-employed with unpaid/family workers
• 2.96% switched to self-employed with permanent workers
• 16.16% switched to worker
2.63% switched to self-employed with permanent workers
25.77%switched to worker
• 56.47% switched back to self-employed with unpaid/family workers
• 29.41% remains self-employed with permanent workers
• 14.11% switched to worker
• 41.92% switched back to self-employed with unpaid/family workers
• 29.41% switched back to self-employed with permanent workers
• 14.11% remained worker
23Part I: Portfolio Mapping, Assessment of Quality of Policy Mix, and Functional and Governance Review
3.2. KEY INPUT DETERMINANTS OF PRODUCTIVITY
3.2.1. Operating environment5
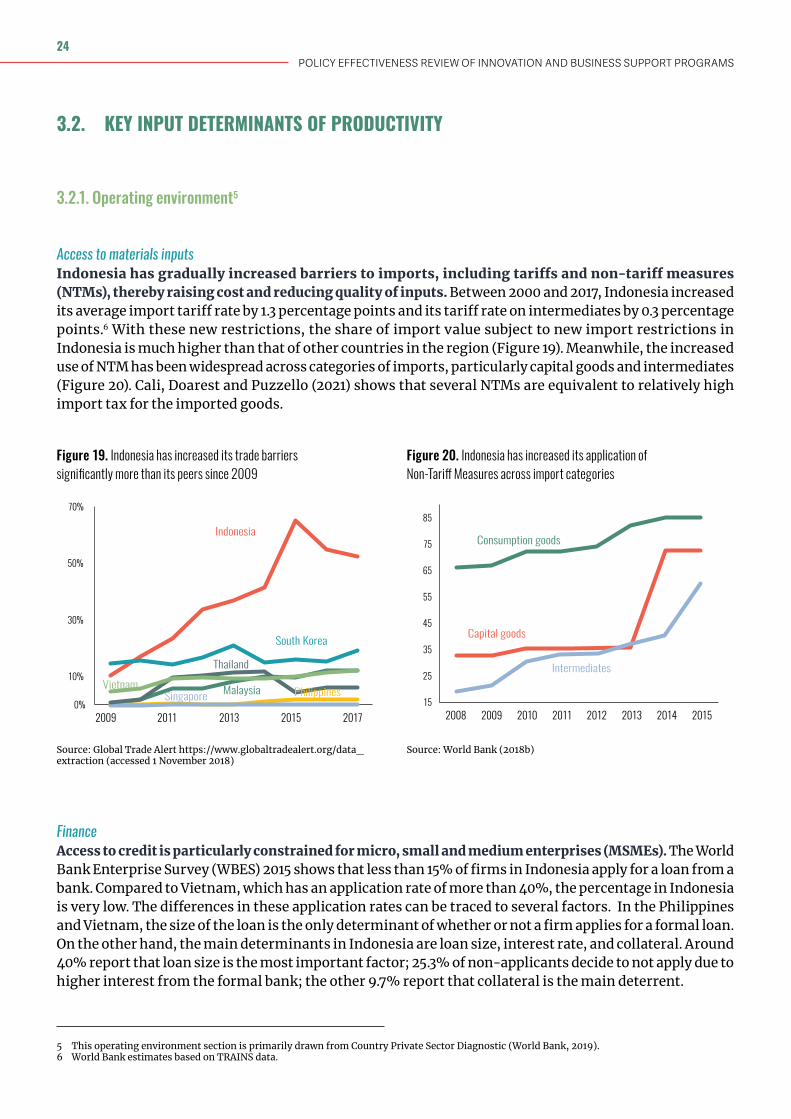
Access to materials inputsIndonesia has gradually increased barriers to imports, including tariffs and non-tariff measures (NTMs), thereby raising cost and reducing quality of inputs. Between 2000 and 2017, Indonesia increased its average import tariff rate by 1.3 percentage points and its tariff rate on intermediates by 0.3 percentage points.6 With these new restrictions, the share of import value subject to new import restrictions in Indonesia is much higher than that of other countries in the region (Figure 19). Meanwhile, the increased use of NTM has been widespread across categories of imports, particularly capital goods and intermediates (Figure 20). Cali, Doarest and Puzzello (2021) shows that several NTMs are equivalent to relatively high import tax for the imported goods.
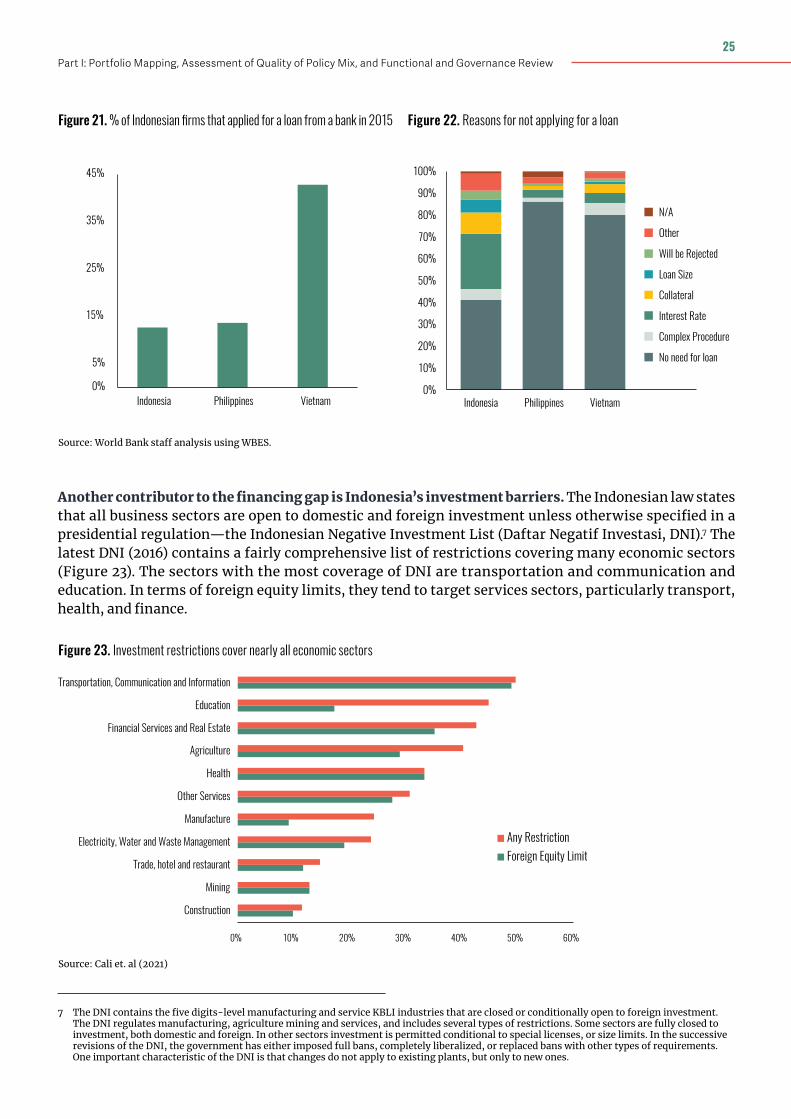
FinanceAccess to credit is particularly constrained for micro, small and medium enterprises (MSMEs). The World Bank Enterprise Survey (WBES) 2015 shows that less than 15% of firms in Indonesia apply for a loan from a bank. Compared to Vietnam, which has an application rate of more than 40%, the percentage in Indonesia is very low. The differences in these application rates can be traced to several factors. In the Philippines and Vietnam, the size of the loan is the only determinant of whether or not a firm applies for a formal loan. On the other hand, the main determinants in Indonesia are loan size, interest rate, and collateral. Around 40% report that loan size is the most important factor; 25.3% of non-applicants decide to not apply due to higher interest from the formal bank; the other 9.7% report that collateral is the main deterrent.
5 This operating environment section is primarily drawn from Country Private Sector Diagnostic (World Bank, 2019).6 World Bank estimates based on TRAINS data.
Figure 19. Indonesia has increased its trade barriers significantly more than its peers since 2009
Figure 20. Indonesia has increased its application of Non-Tariff Measures across import categories
Source: Global Trade Alert https://www.globaltradealert.org/data_extraction (accessed 1 November 2018)
Source: World Bank (2018b)
0%
10%
30%
50%
70%
2009 2011 2013 2015 2017
Indonesia
Malaysia PhilippinesSingapore
Thailand
Vietnam
South Korea
Consumption goods
Intermediates
Capital goods
15
35
55
75
85
2008 2010 2012 2014 20152009
25
45
65
20132011
POLICY EFFECTIVENESS REVIEW OF INNOVATION AND BUSINESS SUPPORT PROGRAMS
24
Figure 21. % of Indonesian firms that applied for a loan from a bank in 2015
Source: World Bank staff analysis using WBES.
Figure 22. Reasons for not applying for a loan
Another contributor to the financing gap is Indonesia’s investment barriers. The Indonesian law states that all business sectors are open to domestic and foreign investment unless otherwise specified in a presidential regulation—the Indonesian Negative Investment List (Daftar Negatif Investasi, DNI).7 The latest DNI (2016) contains a fairly comprehensive list of restrictions covering many economic sectors (Figure 23). The sectors with the most coverage of DNI are transportation and communication and education. In terms of foreign equity limits, they tend to target services sectors, particularly transport, health, and finance.
7 The DNI contains the five digits-level manufacturing and service KBLI industries that are closed or conditionally open to foreign investment. The DNI regulates manufacturing, agriculture mining and services, and includes several types of restrictions. Some sectors are fully closed to investment, both domestic and foreign. In other sectors investment is permitted conditional to special licenses, or size limits. In the successive revisions of the DNI, the government has either imposed full bans, completely liberalized, or replaced bans with other types of requirements. One important characteristic of the DNI is that changes do not apply to existing plants, but only to new ones.
Figure 23. Investment restrictions cover nearly all economic sectors
Source: Cali et. al (2021)
0% 10% 20% 30% 40% 50% 60%
Construction
Mining
Trade, hotel and restaurant
Electricity, Water and Waste Management
Manufacture
Other Services
Health
Agriculture
Financial Services and Real Estate
Education
Transportation, Communication and Information
Any RestrictionForeign Equity Limit
0%
5%
15%
25%
35%
45%
Indonesia Philippines Vietnam0%
10%
20%
30%
40%
50%
60%
70%
80%
90%
100%
Indonesia Philippines Vietnam
Complex Procedure
Interest Rate
Collateral
Loan Size
Will be Rejected
Other
N/A
No need for loan
25Part I: Portfolio Mapping, Assessment of Quality of Policy Mix, and Functional and Governance Review
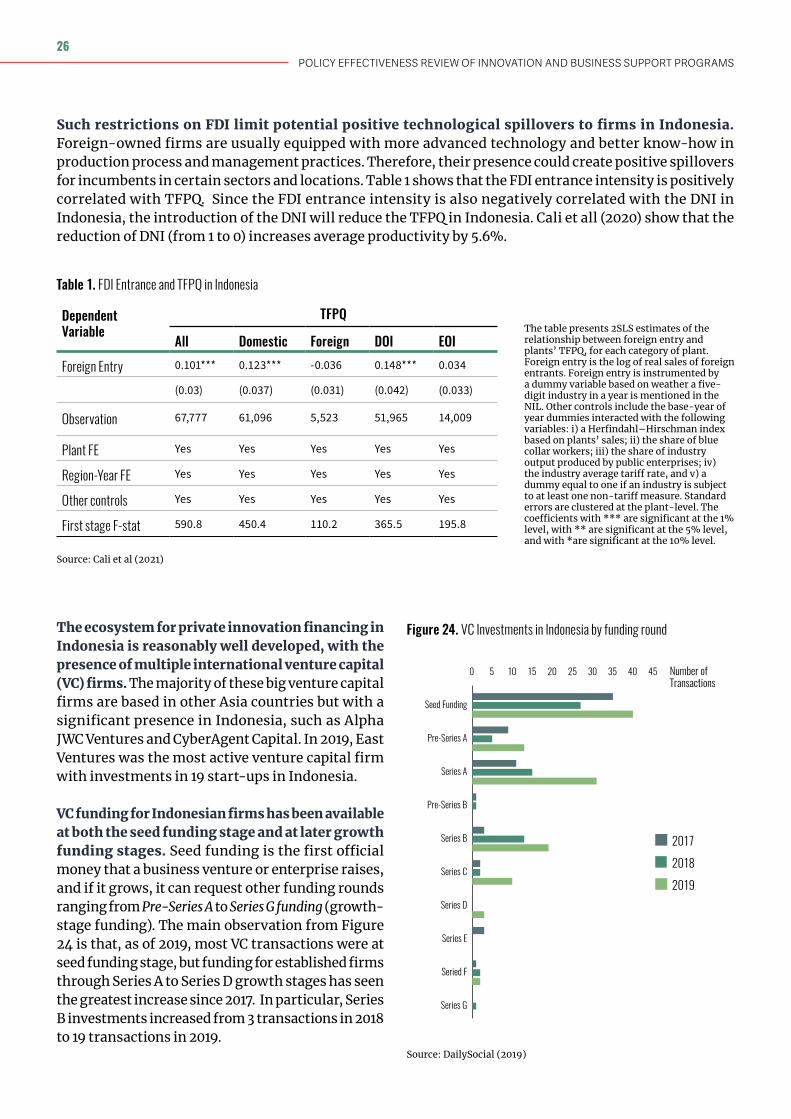
Such restrictions on FDI limit potential positive technological spillovers to firms in Indonesia. Foreign-owned firms are usually equipped with more advanced technology and better know-how in production process and management practices. Therefore, their presence could create positive spillovers for incumbents in certain sectors and locations. Table 1 shows that the FDI entrance intensity is positively correlated with TFPQ. Since the FDI entrance intensity is also negatively correlated with the DNI in Indonesia, the introduction of the DNI will reduce the TFPQ in Indonesia. Cali et all (2020) show that the reduction of DNI (from 1 to 0) increases average productivity by 5.6%.
Figure 24. VC Investments in Indonesia by funding round
The table presents 2SLS estimates of the relationship between foreign entry and plants’ TFPQ, for each category of plant. Foreign entry is the log of real sales of foreign entrants. Foreign entry is instrumented by a dummy variable based on weather a five-digit industry in a year is mentioned in the NIL. Other controls include the base-year of year dummies interacted with the following variables: i) a Herfindahl–Hirschman index based on plants’ sales; ii) the share of blue collar workers; iii) the share of industry output produced by public enterprises; iv) the industry average tariff rate, and v) a dummy equal to one if an industry is subject to at least one non-tariff measure. Standard errors are clustered at the plant-level. The coefficients with *** are significant at the 1% level, with ** are significant at the 5% level, and with *are significant at the 10% level.
The ecosystem for private innovation financing in Indonesia is reasonably well developed, with the presence of multiple international venture capital (VC) firms. The majority of these big venture capital firms are based in other Asia countries but with a significant presence in Indonesia, such as Alpha JWC Ventures and CyberAgent Capital. In 2019, East Ventures was the most active venture capital firm with investments in 19 start-ups in Indonesia.
VC funding for Indonesian firms has been available at both the seed funding stage and at later growth funding stages. Seed funding is the first official money that a business venture or enterprise raises, and if it grows, it can request other funding rounds ranging from Pre-Series A to Series G funding (growth-stage funding). The main observation from Figure 24 is that, as of 2019, most VC transactions were at seed funding stage, but funding for established firms through Series A to Series D growth stages has seen the greatest increase since 2017. In particular, Series B investments increased from 3 transactions in 2018 to 19 transactions in 2019.
Source: DailySocial (2019)
0 5 10 15 20 25 30 35 40 45
Seed Funding
Pre-Series A
Series A
Pre-Series B
Series B
Series C
Series D
Series E
Seried F
Series G
Number ofTransactions
2017
2018
2019
POLICY EFFECTIVENESS REVIEW OF INNOVATION AND BUSINESS SUPPORT PROGRAMS
26
Market competitionIndonesian markets are perceived as lacking effective competition. Indonesia scores below the average of the East Asia and Pacific region in terms of perceptions of the intensity of local competition and the prevalence of market dominance, according to the Global Competitiveness Indicators. The degree of market power of large firms in Indonesia, proxied by the level of markups, is higher than in other countries in the region such as China, Malaysia, and South Korea; and has increased between 1980 and 2016, showing signs that competition could be thwarted by dominance or collusion.8 The anti-competitive practices are often in intermediate sectors,9 thus further dragging down competitiveness by raising the cost of inputs to production.
This lack of competition creates rents for a few incumbent firms, which often adopt a rent-seeking approach vis-à-vis the government to ensure restrictions to competition stay in place. This close relationship between the state and business is buttressed by the presence of key domestic businessmen as government advisors and by strong business associations (led by the Indonesian Chamber of Commerce and Industry [Kadin] and the Indonesian Employers Association [APINDO]). The relationship dates back at least to the Suharto regime, during which political connections were among the key assets of Indonesian firms (Fisman 2001). While the fall of Suharto may have changed some business-to-government relationships, these connections persist. This has prevented any meaningful increase in competition in markets dominated by politically connected firms (Konchanova et al. 2018). These connections may not only influence policies, but also the allocation of import licenses (Mobarak and Purbasari 2006) and credit (Jiangtao et al. 2015) as well as the concessions to extract natural resources.10 Recent literature shows that fostering business-to-government connections typically crowds out productivity-enhancing investments and innovation (Akcigit et al. 2018) and leads to inefficient and unfair public policies (Rijkers et al. 2017).
Despite this context, limited authority and capacity stifle the Competition Commission’s ability to discourage anti-competitive practices. Indonesia enacted the Indonesian Competition Law in 1999, which also established a Business Competition Commission (KPPU) mandated to enforce competition policy. However, both the competition framework and KPPU still suffer from limitations that make Indonesia’s competition regime one of the least effective of the 49 countries surveyed by the OECD.11
8 De Loecker and Eeckhout (2018).9 Ivaldi, Jenny and Khimich (2016).10 At times such skewed allocation of rents could back-fire, such as the Churchill Mining case whereby the original concessionaire of the East Kutai
Coal Project (Churchill Mining) took Indonesia to international arbitration claiming large economic losses ($1.3 billion) as a result of the local government revoking the concession in favor of a domestic company, PT Nusantara Group. After four years of dispute, the tribunal eventually dismissed Churchill Mining’s claims.
11 For example, the KPPU is the only competition agency which cannot perform unannounced inspections to gather evidence at the premises of firms investigated for antitrust infringement. Similarly, the KPPU cannot act against firms located abroad, even if their behavior directly affects competition and/or consumers in domestic markets. As a result, the number of cartels detected by the KPPU has been very limited compared with even smaller economies. In addition, the KPPU has limited deterrence powers: the maximum penalty that can be levied is less than $2 million, significantly lower than many other jurisdictions. Finally, while the majority of KPPU’s advisory opinions have focused on anti-competition practices based on government regulations, the impact of such opinions on policymaking remains elusive in absence of formal feedback mechanisms from the government.
3.2.2. Human capital and knowledge
Human capital is another key constraint to private sector productivity in Indonesia, evidenced by significant gaps in education, technical and managerial business skills, and investments in R&D, which collectively weigh down labor productivity and economic growth.
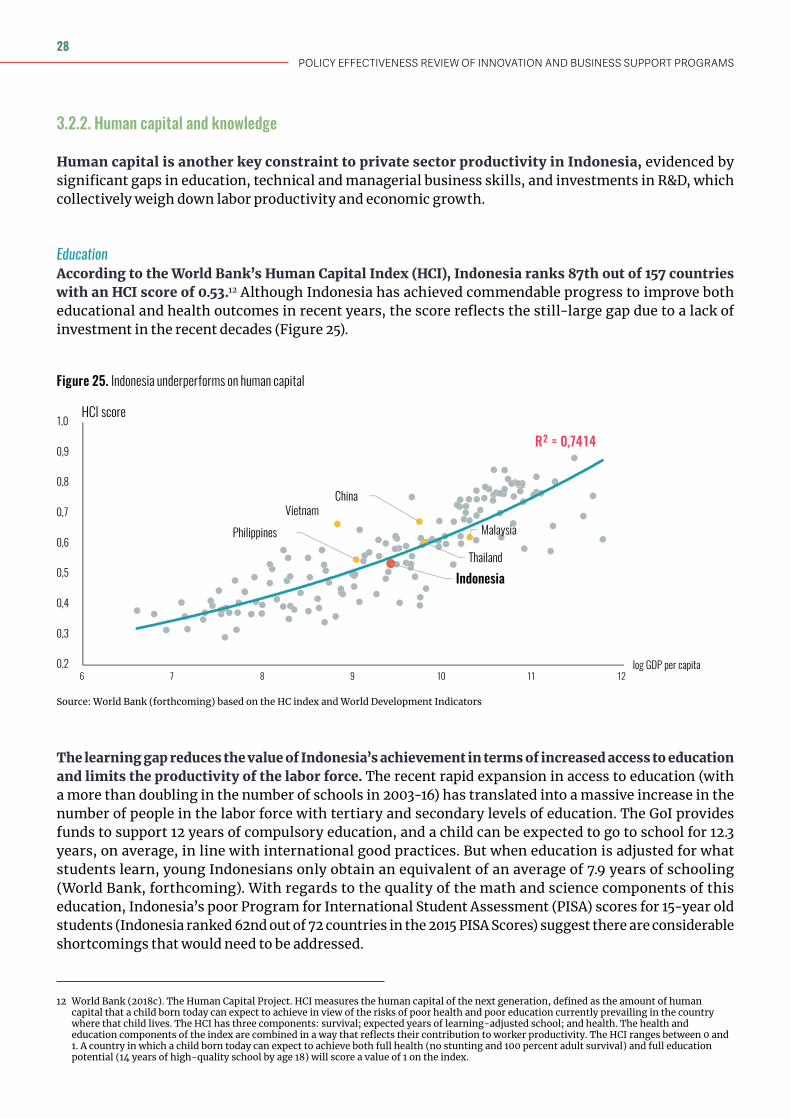
EducationAccording to the World Bank’s Human Capital Index (HCI), Indonesia ranks 87th out of 157 countries with an HCI score of 0.53.12 Although Indonesia has achieved commendable progress to improve both educational and health outcomes in recent years, the score reflects the still-large gap due to a lack of investment in the recent decades (Figure 25).
The learning gap reduces the value of Indonesia’s achievement in terms of increased access to education and limits the productivity of the labor force. The recent rapid expansion in access to education (with a more than doubling in the number of schools in 2003-16) has translated into a massive increase in the number of people in the labor force with tertiary and secondary levels of education. The GoI provides funds to support 12 years of compulsory education, and a child can be expected to go to school for 12.3 years, on average, in line with international good practices. But when education is adjusted for what students learn, young Indonesians only obtain an equivalent of an average of 7.9 years of schooling (World Bank, forthcoming). With regards to the quality of the math and science components of this education, Indonesia’s poor Program for International Student Assessment (PISA) scores for 15-year old students (Indonesia ranked 62nd out of 72 countries in the 2015 PISA Scores) suggest there are considerable shortcomings that would need to be addressed.
12 World Bank (2018c). The Human Capital Project. HCI measures the human capital of the next generation, defined as the amount of human capital that a child born today can expect to achieve in view of the risks of poor health and poor education currently prevailing in the country where that child lives. The HCI has three components: survival; expected years of learning-adjusted school; and health. The health and education components of the index are combined in a way that reflects their contribution to worker productivity. The HCI ranges between 0 and 1. A country in which a child born today can expect to achieve both full health (no stunting and 100 percent adult survival) and full education potential (14 years of high-quality school by age 18) will score a value of 1 on the index.
Figure 25. Indonesia underperforms on human capital
Source: World Bank (forthcoming) based on the HC index and World Development Indicators
China
Indonesia
MalaysiaPhilippines
Thailand
Vietnam
R² = 0,7414
0,2
0,3
0,4
0,5
0,6
0,7
0,8
0,9
1,0
6 7 8 9 10 11 12
HCI score
log GDP per capita
POLICY EFFECTIVENESS REVIEW OF INNOVATION AND BUSINESS SUPPORT PROGRAMS
28
In terms of tertiary education, particularly in scientific fields, Indonesia also has significant room for improvement. While Indonesia’s gross tertiary enrollment rate has risen 20 percentage points over the past two decades, it still stands at only 36.3% (as of 2017) and is relatively low relative to the rest of ASEAN (Figure 26). Actual tertiary attainment is even lower—the percentage of Indonesians over the age of 25 that had attained at least a bachelor’s degree in 2016 was just under 9 percent, the lowest among ASEAN. The percentage of graduates in science and engineering also compares unfavorably by regional standards—19.4% in Indonesia compared to an average of 31% among key ASEAN peers. This has translated into a relatively low share of Indonesian professionals in science and technology fields having advanced (i.e. S3 or doctoral) degrees: 17% of researchers, 16% lecturers, and 6% of engineers.13
Technical and managerial business skillsThese skill gaps are particularly salient in light of increased automation and sophistication of production technology, which has raised the importance of having workers with high technical skill levels. The quality of skills of the labor force, particularly that of high-skilled professionals and managers, is a key concern. The share of firms in Indonesia that reported inadequate skills as a top constraint when hiring managers and professionals is the highest in the region (Figure 27). On the other hand, firms hiring unskilled production workers complain less than their regional comparators about lack of adequacy skills. These difficulties in finding employees with foreign language abilities, and technical, leadership, and management skills are correlated with weaker firm performance and lower productivity among Indonesian firms (Gomez Mera and Hollweg 2018).
Source: Gomez-Mera and Hollweg (2018) based on WBES data
0
10
20
30
40
50
60
70
80
90
Indonesia Malaysia Thailand Singapore Vietnam Philippines
Gross tertiary enrollment rate (%)
Graduates in science and engineering (% of total)
0
10
20
30
40
50
60
70
80
Managers
IndonesiaMalaysia
ThailandPhilippines
Unskilled production workers
29Part I: Portfolio Mapping, Assessment of Quality of Policy Mix, and Functional and Governance Review
Although this lack of skills can be partially solved internally, firms in Indonesia rarely provide training to employees. Of all samples in WBES, only 13% of Indonesian firms offered formal training programs to their full-time permanent employees in 2015. This is less than half of the average in East Asia (31.7%) and almost three times below the average of middle-income countries. Of these limited number of trainings, most are targeted to skilled employees, particularly those involved in the production. On average 55% of skilled production and 44% of skilled non-production labor reportedly received training. By contrast, on average 20% of unskilled labor received training.
The skills gap is further compounded by the tight government restrictions on hiring foreign workers, which limit firms’ ability to tap into the global talent pool where local skills are in short supply. Current regulations impose stringent requirements on hiring foreign workers (including professionals), such as the need for approval by the Ministry of Manpower of a detailed foreign employment plan, performance requirements on workers, and company-specific caps on foreign employees in relation to domestic employees. Compared to other neighboring countries, Indonesia has the highest work permit regulatory restrictiveness. This helps explain why there are only 73 foreign workers per 100,000 workers in Indonesia, a much lower share than other countries in the region.14
Investments in STI research and business R&DRelative to its regional peers, Indonesia’s gross expenditure on R&D (GERD) is very low and predominantly funded by the public sector. Indonesia’s GERD is less than 0.1 percent of GDP, compared to 2.2 percent in Singapore and 1.3 percent in Malaysia.15 Furthermore, around three-quarters of this R&D activity is executed by the public sector (Figure 28): within the central government, R&D is spread across all line ministries, with each line ministry having its own research arm, and on top of that, there are six independent publicly-funded research institutes (Chen et al., 2013; LIPI and Kemenristekdikti, 2017). In contrast, in Thailand, Malaysia and Singapore, the public sector share of R&D spending is only 10-20% (Figure 29) and in OECD countries, it averages around 30 percent.
14 The recent Presidential Regulation No. 28/2018 to relax some of these restrictions is a step in the right direction, however, implementation is still inadequate as many restrictions are still in place.
15 Source: UNESCO Institute for Statistics. Data for Indonesia from 2013; for Singapore and Malaysia for 2014.
Figure 28. R&D budget allocation based on agents Figure 29. Distribution of R&D agents: Cross country comparison
Sources: Ministry of Research and Higher Education (2017)
*2013 **2015 ***2016
Philip
innes
*
Viet
nam*
Indon
esia*
**
Thail
and
Malay
sia
Singa
pore
**
China
USA
Japa
n
Sout
h Kor
ea
Public Sector Higher Education Private Sector Non Profit Organization
24,92 0,89 0,812,81
1,33
IDR
trillio
n
Central Government
HigherEducation
ManufacturingSector
PrivateResearch
LocalGovernment
POLICY EFFECTIVENESS REVIEW OF INNOVATION AND BUSINESS SUPPORT PROGRAMS
30
The contribution of Indonesia’s higher education institutions (i.e. universities) to R&D activity is surprisingly limited. The IDR810 billion spent by higher education institutions on R&D is a paltry 2.6% of total R&D expenditures. In part, this is consistent with the relatively low number of researchers in Indonesia by regional standards: in 2018, there were only 2.4 full-time equivalent researchers per million people in Indonesia, as compared to 28.6 in Malaysia, 16.1 in Thailand, and 81.5 Singapore (the top performer in ASEAN on this metric).16
The story on the private sector side is similar, with few Indonesian firms undertaking R&D activities. The private sector spent a total of around IDR 4.2 Trillion for research and development activities in 2016. Only 4.2% of medium and large manufacturing plants had an R&D unit within the firm, and allocated IDR334.46M for R&D in 2016, equivalent to 3.5% of total other expenses (excluding materials, fuel, labor, capital) (Figure 30). This underinvestment in R&D is quite striking in light of the measurable productivity gains experienced by Indonesian firms who do invest in R&D (Figure 31).
R&D outputs and outcomes associated with these low rates of public and private R&D also compare unfavorably to regional peers. Relative to the size of its economy, Indonesia lags ASEAN on several R&D output metrics, including the number of local patents and international (PCT) patents filed, utility models, and scientific and technical publications (Figure 32). The rate of international collaborations by Indonesia’s researchers and scientist has also declined in recent years, suggesting lost opportunities to access international knowledge and expertise and apply them to local problems. From 1996-2009, around 70% of publications in Indonesia involved foreign co-authorship, but by 2014 this share had fallen to 44%. 17
16 Global Innovation Index (2020).17 SCImago. (2007). SJR — SCImago Journal & Country Rank.
Figure 32. Indonesia’s performance on key metrics of knowledge creation
Figure 30. R&D Expenditure of manufacturing firms in Indonesia Figure 31. Productivity returns on R&D for Indonesian firms
Source: World Bank staff calculations based on Statistik Industri data.
Source: Global Innovation Index (2020)
0
100
200
300
400
0,0
0,5
1,5
2,5
3,5
4,5
Share of R&D toall other cost
Share firmswith R&D unit
Average R&DExpenditure (RHS)
Mill
ion
IDR
perc
ent
0
0,04
0,08
0,12
0
0,4
0,8
1,2
1,6
Ln Labor Ln RealOutput
Ln RealValue Added
Ln TFP(RHS)
Mean difference between firmswith R&D and firms without R&D
0 10 30 50
Indonesia
Singapore
Vietnam
Thailand
Philippines
Malaysia
Numberper billion$PPP GDP
Local patent applications
PCT patent applicationsUtility model applications
Scientific and technicalpublications
31Part I: Portfolio Mapping, Assessment of Quality of Policy Mix, and Functional and Governance Review
3.3. COVID-19 IMPACTS ON PRIVATE SECTOR
3.3.1. Impact on firms
The COVID-19 crisis hit firms in all sectors except the information and communication sector. Around 86 percent of firms saw a reduction in sales in June 2020 compared to the same period in 2019. Most of them reported a sales drop of more than 20 percent. For most sectors, average sales fell by 50% or more. With an 87.5 percent sales drop, firms in the rental business experienced the worst impact of the COVID-19 crisis. One exception is the information and communication sector, which appears to have been able to take advantage of increased demand for digital products and services and experiences a 60 percent average increase in sales. While there was improvement in October 2020, still 75% percent of firms saw a reduction in sales in October 2020 compared to the same period in 2019 (Figure 33).
The COVID-19 crisis is further disrupting value chains in Indonesia. A business pulse survey by the World Bank in June 2020 revealed that around 76% of firms reported problems in accessing material inputs for production (World Bank 2020). In addition to existing international tariff and non-tariff barriers, lockdowns in many regions and limited domestic/international cargo flights are among several reasons for this limited access to necessary material input. Another reason is the increased risk aversion of firms—in the face of low demand, many decided not to order additional material input and instead run down existing inventories.
Figure 33. Share of firms that in the last month have experienced one of these instances or undertaken one of these actions in June and October 2020
Source: World Bank (2021)
Figure 34. Impact of COVID-19 on firms
Source: World Bank (2020)
86
7582
7464
43
27 22 2418
2217 16 12 9
3
YoY sale drop Large saledrop (>20%)
Reducedlabor costs
Di�iculty repayingloans/credit
Di�iculty inpaying wages
Di�icultypaying utilities
Di�icultypaying rent
Filed forbankruptcy
Jun-20Oct-20
63%
Working hours
81%
Demand
77%
Cash flowavailability
60%
Supply of financialservices
73%
Supply of input
Increase
Decrease
Same
POLICY EFFECTIVENESS REVIEW OF INNOVATION AND BUSINESS SUPPORT PROGRAMS
32
Firms’ existing difficulties in accessing finance have been amplified during the COVID19 crisis. In June 2020, 77% of firms reported that they were experiencing reduced cash flow. Despite this cash flow situation and the provision of various subsidized loans to MSME as part of the government’s COVID-19 response, few firms seemed to rely on bank financing to mitigate the COVID-19 impact. Only 10% of firms used market mechanisms to finance this reduced cash flow, while the majority chose either to do nothing or to reduce expenses. The underlying reason for this low utilization of financial support remains unknown. In October 2020, 58% of firms still reported problems in accessing finance. One of the main reasons for this problem is repayment risk due to market uncertainty (Figure 36).
A longer-than-expected duration of the COVID-19 crisis may induce a permanent change in firms’ business processes. As of February 2021, Indonesia still experiences a high number of daily new positive COVID-19 cases and the vaccination rate is still low mainly due to vaccine availability and logistical issues. This persistence of the pandemic is likely to encourage firms to seek greater digitalization and automation of their business processes. For example, firms may try to use less workers and incorporate more machines and robotics into their production process. While this may negatively affect demand for workers, this switch could increase productivity.
3.3.2. Responses by firms
The COVID-19 crisis increases the need for support instruments to help firms (especially MSMEs) upgrade their technological capabilities. Limited mobility and lockdowns in many regions have reduced sales for many firms relying on traditional point of sales models (e.g. brick and mortar stores). Indeed 42% of firms (in the June 2020 survey) have adapted to this crisis by starting/increasing their usage of the internet, social media, and other digital methods. This adjustment has been implemented by firms of all sizes, but not evenly—9 in 10 large firms surveyed in June 2020 implemented some digital transformation, in contrast to only 3 in 10 micro firms (Figure 37). In October 2020, more firms adjusted through digital transformation—24% more firms than in June 2020. Furthermore, more MSMEs started to catch up and adopt this digital transformation (Figure 38). Nevertheless, the share of digitally transformed MSME is still relatively lower than that of large firms.
Figure 35. Cash flow availability and coping mechanisms for firms during COVID19 crisis
Figure 36. Obstacle in accessing finance
Source: World Bank (2021)
No change/increasedcash flow
availability
23%
Marketfinancing
Loans fromfriends & family
Delay paymentsSell assets
Reduceexpenses
Do nothing
Reducedcash flowavailability
77%
Share of firms that in the last month experienced:
16%
19%
5%5%
24%30%
HighInterestrate
Nocollateral
Too manyoutstandingloans
Repayment risk dueto market uncertainty
Other
Share of firms based on main obstacle in accessing finance
42% 58%
4%
12%
9%
26%
7%
NoProblem Some
problems in accessing finance
33Part I: Portfolio Mapping, Assessment of Quality of Policy Mix, and Functional and Governance Review
Figure 37. Share of firms that adjusted their business process due to COVID-19, based on the type of adjustments and size
Figure 38. Share of firms using digital technologies in June and October 2020
Source: World Bank (2021)
Source: World Bank (2021)
3.3.3. Policy support
The Government’s economic support programs for firms have yet to reach many of the most affected firms, especially badly hit MSMEs. To support the private sector during the crisis, the Government of Indonesia implemented several programs, such as: reducing tax payments and reducing electricity expenses for small firms.; facilitating loan restructuring, especially to MSMEs; providing interest rate subsidies and facilities for new working capital loans, especially for MSMEs and labor-intensive industries,18 and—more recently (as of August 2020)—an income support scheme for employees earning below IDR5 million per month. While in June 2020, only 7 percent of firms surveyed reported receiving government support, this share significantly increased to 49% in October 2020.
18 For more details see: World Bank. 2020. Indonesia Economic Prospects, July 2020: The Long Road to Recovery. World Bank, Washington, DC, pp. 41-42. http://hdl.handle.net/10986/34123
42,3
4,2 5,5
31,9
0,04,4
58,3
10,9 7,4
91,1
17,7
3,6
Digital New Capital New Product
All firms Micro
Small Medium Large
25%
21%
16% 15%
24% 24%
0
5
10
15
20
25
30
0
20
40
60
80
100
June October June October June October June October June October June October
Micro Small and medium Large High Value AddedServices
Low Value AddedServices
Manufacturing
Digital adoption (share of firms LHS) Digital adoption between June and Oct 2020 (increased share of firms, RHS)
percentperc
ent
POLICY EFFECTIVENESS REVIEW OF INNOVATION AND BUSINESS SUPPORT PROGRAMS
34
To further help the private sector during this crisis, the Government needs to improve the effectiveness of its support through better communication and easier access to support programs. Lack of clear information on programs and their eligibility criteria are the two main reasons for the low take-up rate of the existing programs. More than half of the firms not receiving support indicated that they were not aware of the existence of these programs. Others (21 percent) do not know the reasons for not getting support (Figure 4). This low take-up rate is consistent with the reported low utilization of the market financing scheme to alleviate liquidity constraints. This suggests the need for increasing and facilitating access to credit applications and other market-based instruments. Similarly, there is a need to improve the roll-out and expand the eligibility of the reduced or waived electricity expenses for small firms, as many of them still struggle to pay utilities.
The Government can also explore new or adjusted policies to help firms cope with this crisis. A plausible channel to reduce the ongoing costs of firms are wage subsidies, which have been used effectively in other countries to preserve valuable employer–worker relationships. However, these may need to be carefully targeted and time-bound, as widespread wage subsidies may be too onerous for the fiscal budget. Moreover, it may be challenging to implement in Indonesia’s context of high business and worker informality. The government could also reduce input costs by eliminating non-essential checks and restrictions on imported inputs (e.g., pre-shipment inspections, third-party verification of SNI compliance, port-of-entry restrictions, state import monopolies), fast-tracking other checks, and waiving import duties.
35Part I: Portfolio Mapping, Assessment of Quality of Policy Mix, and Functional and Governance Review
Table 2. Summary of key business operating environment constraints to productivity
Areas Description of key challenges and needs
Input materials Increases in barriers to goods and services imports over the past decade, including tariffs and non-tariff measures (NTMs), have raised material input costs for firms, forced the use of lower-quality alternatives, and negatively affected productivity and innovation (e.g. in cases where firms cannot source tech-intensive machinery and equipment from abroad).
Finance • Access to credit for MSMEs is limited, characterized by high interest rates and collateral requirements. • FDI supply is constrained by significant foreign investment restrictions in many sectors; this also reduces opportunities for positive technological spillovers to firms in Indonesia
Competition • Indonesia has a lot of regulation that restricts competition and enables market dominance by large and politically connected firms. The Competition Authority has limited power over the regulations imposed by other ministries.
• This lack of competition: (a) constraints the reallocation of economic resources to more productive firms (the “between firm” productivity component); (b) disincentives incumbent firms to invest in productivity-enhancing innovation (the within-firm component); and dampens entry and exit dynamics (the selection component)—stifling the entry of more productive firms and discouraging the exit of less productive ones.
Table 3. Summary of key human capital and knowledge constraints to productivity
Areas Description of key challenges and needs
Basic education In skills quality-adjusted terms, young Indonesians still receive less years of schooling than youth in similar-income country peers, which limits their subsequent productivity in the labor force.
Technical and managerial skills
• Share of firms in Indonesia that report inadequate skills as a top constraint when hiring managers and professionals is the highest in the EAP region. These skill gaps are particularly salient in light of increased automation and sophistication of production technology, which has raised the importance of having technically-skilled workers. The scarcity of such skills also limits firm capabilities to pursue innovative product design and development.
• Availability of formal training programs to address these skills gap is considerably low. • Restrictions on the hiring of foreign workers further compound skills shortages and prevent labor from efficiently flowing to productive opportunities.
STI research and business R&D
Overall R&D spending is low compared to rest of East Asia, and the majority is concentrated in the public sector (ministries and research institutes), with very few Indonesian firms engaging in R&D activities.
3.4. SUMMARY OF KEY PRIVATE SECTOR INNOVATION AND BUSINESS SUPPORT NEEDS
Based on the analysis above, the key constraints to private sector productivity growth are summarized in Table 2 and Table 3. These represent the demand side of innovation and business support in Indonesia and will be assessed against the supply side (i.e. the provision of government support programs) in subsequent sections to identify relevant gaps in the policy mix that will need to be addressed. It should be emphasized that some of these constraints (in Table 2), such as those related to import restrictions and competition regulations, would require significant changes in government policy and other interventions that are beyond the scope of this iPER.
POLICY EFFECTIVENESS REVIEW OF INNOVATION AND BUSINESS SUPPORT PROGRAMS
36
Assessment of the Quality of the Policy Mix
This section presents the findings from the analysis of the quality of the policy mix for innovation and business support policies in Indonesia. This represents the first element of the broader assessment of the government’s support programs, which also includes the functional and governance review (Section 5) of the key supporting systems and procedures to design and implement these programs.
4.1. APPROACH
This chapter represents the second part of the systemic assessment of innovation and business support policies in Indonesia. The objective of this section is to analyze the consistency between the innovation and business support policy mix used by the government with the challenges and demands of Indonesia’s private sector.
The framework for analyzing the quality of the policy mix compares the policy priorities for innovation and business support with the actual deployed policy instruments. The analytical framework is presented in Figure 39 and consists of three elements:
• The assessment of policy support needs and priorities for Indonesia’s private sector: this was already conducted in sections 2 and 3 of this report, and consisted of the summary of the GoI’s policy priorities for innovation and private sector development and the assessment of the private sector’s needs and challenges in these areas.
• Composition and internal consistency of the policy mix (i.e. the policy mapping): this sub-section provides descriptive statistics of the relevant policy instruments employed by the GoI, including disaggregation of the instruments and their budget allocation based on the intended outcomes, direct program objectives, mechanisms of intervention, etc. The internal consistency of this policy mix is then analyzed, which considers issues such as: (a) the scale and proportionality of budget allocations to targeted outcomes, (b) the degree of overlap across directorates and division of labor across responsible units responsible for the policy mix, and (c) the concentration of instruments with similar characteristics.
• External coherence assessment: this sub-section evaluates the overall coherence between the policy mix (the supply side, element #2 above) and the strategic GoI priorities and needs of the private sector (the demand side, element #1 above). In this sense, it is effectively an analysis of the gap between supply and demand for innovation and business support in Indonesia.
37Part I: Portfolio Mapping, Assessment of Quality of Policy Mix, and Functional and Governance Review
Policy mapping
Country needs assessments
Figure 39. Policy Analytical framework for the assessment of the mix
Source: World Bank (2018a)
Descriptive analytics (needs assessment and portfolio profiling)
Unmet needs for policy support
Strategic policy aspirations
Policy priorities for innovation
1
Prescriptive analytics(Quality of the policy mix)
• Is the policy portfolio responding according to the country’s priorities to firm innovation and SME development policy?
• Is the allocation of financial and human resources consistent with the stated priorities?
• Which are the evident gaps that seem unattended by the current support programs?
• Are the set of policies coherent with the state SME innovation as set by the country’s leaders?
• How can the policy mix be improved, and aligned better with the current policy direction?
• Are there obvious redundancies in the policy mix? Are the policies mutually reinforcing one another?
Current composition of the Policy mix
2
Externalcoherence
Internalconsistency
3
POLICY EFFECTIVENESS REVIEW OF INNOVATION AND BUSINESS SUPPORT PROGRAMS
38
4.2. POLICY MAPPING
4.2.1. Data and scope
For this analysis, the unit of observation used is a policy instrument. Instruments are different from programs and are more disaggregated. Typically, a government program consists of one or more instruments. An instrument represents one intervention mechanism, direct or indirect, that aims to promote change and improvement of the performance of the private sector. Examples of instruments are tax exemptions for R&D, doctoral scholarships at foreign universities, or innovation grants. Each instrument has a dedicated budget which can come from multiple institutions. Each instrument is assigned to an institution, although sometimes it can be managed or implemented in collaboration with more than one agency.
The mapping of the mix of policy instruments is based on data collected through desk review and consultations with staff responsible for program management and implementation. Most of the information is extracted from programs’ terms of reference documents and budget information, which have been shared by the relevant planning divisions in each ministry/agency. This information covers 146 instruments spread over 13 government institutions (see Annex 2 for full list of instruments). All instruments are part of programs implemented in 2018. The instruments are distributed among implementing institutions, where they are managed mostly by frontline technical public agencies, namely the Agency of Implementation Technology (BPPT), Ministry of Cooperative and Micro, Small, and Medium Enterprises (MSMEs), Ministry of Maritime and Fishery, Ministry of Industry, Ministry of Agriculture, and Ministry of Information.19, 20
Another key source of information is analysis from the Ministry of Finance on tax incentives available to the private sector in Indonesia. These tax incentives range from value added tax and import tax exemptions to income tax reductions. While these tax incentives are quantified and profiled at a high level in the policy mapping section below, they are not included in the scope of policy portfolio analyzed as part of this iPER, as there is there is insufficient available information to properly analyze them in detail. Therefore, the scope of the policy mix is limited to financial support through credit subsidies and direct expenditures (e.g. grants, vouchers, technical assistance, etc.).
19 The data collection was implemented prior to COVID-19. Therefore, the budget information here excludes all budget allocated as COVID-19 response. We will present any necessary information from the World Bank Survey of effect of COVID-19 on firms.
20 Unlike in many other countries, ministry and agency in Indonesia play the same role. They both issue policies and implement relevant activities related to their scope of work.
Figure 40. Principles for determining scope of instrument included in the policy mix
INCLUDED
EXCLUDED
• Direct and indirect support for innovation (e.g., grants, applied industry R&D)
• Direct and indirect business support (e.g., interest subsidy, Technopreneurship training)
• Regulation without budget envelope • Direct support for basic R&D • Tax Incentive (due to limited information) • Expenditure from district government
39Part I: Portfolio Mapping, Assessment of Quality of Policy Mix, and Functional and Governance Review
4.2.2. Descriptive profile and concentration of the policy mix
The GoI’s portfolio of business and innovation support programs consists of three categories of expenditure: (i) indirect credit subsidies to firms (via private financial institutions), (ii) tax incentives to firms that invest in innovation (e.g. corporate tax income exemption for technological enterprises), and (iii) direct financial support in the form of grants, technical assistance and other services. The total budget allocation across these the expenditure categories in 2018 was IDR 136 trillion (US$9.4 billion), equivalent to 0.9% of 2018 nominal GDP. Tax incentive programs represented a disproportionate amount in the total budget, accounting for 88% of the total value in 2018 (Figure 41). This skewed distribution toward tax incentives is a common characteristic of business and innovation policy portfolios in other Southeast Asian Countries. 21 The second largest budget allocation was for credit subsidies (10% of the total budget), follow by direct financial support (2% of total) (Figure 41). As mentioned above, given that tax incentives will not be included in the scope of the policy mix, the relevant budget envelope for programs that will be analyzed is IDR 16 trillion (consisting of credit subsidies and direct financial support instruments).
Tax incentivesThe estimated amount of GoI tax incentives for the private sector in 2018 was IDR 120 trillion—an IDR 18 trillion increase from 2017. This increase was driven by a significant take up by the private sector of several fiscal incentives, such as the tax holiday for pioneer industries.22 This program has been implemented since 2010 and grants a reduction in corporate income tax for firms that invest (at least IDR 100 billion) in selected pioneer industries. The percentage reduction in tax and duration of the tax holiday depend on a firm’s total new investment. Firms that invest more than IDR 30 trillion receive a 100 percent reduction in corporate income tax for 20 years. The realization of these tax holiday benefits increased significantly from zero in 2016 and 2017 to IDR 1.1 Trillion in 2018.23
21 In Vietnam, 93.9% of the government’s budget for business innovation in 2017 was allocated through tax incentive programs (World Bank, 2020). While tax incentives have been used with relative success in several countries to promote investments in R&D (Cirera et al, forthcoming), and typically account for a significant amount of resources, the magnitude of the financial allocation employed for these purposes seems lopsided.
22 Pioneer industry is defined as industry with many linkages to other industries, with high value added and externalities, and which introduces new technologies that have strategic value for the national economy. (MoF regulation No. 150/PMK.010/2018)
23 No further information on its implementation prior to 2016.
Figure 41. Allocated GoI budget for business and innovation support in Indonesia in 2018 (in Billion IDR)
Source: World Bank estimates.
120.180
13.660
2.418
Tax Incentive
Credit Subsidy
Direct Support
Scope of iPER policy mix
POLICY EFFECTIVENESS REVIEW OF INNOVATION AND BUSINESS SUPPORT PROGRAMS
40
The majority of these tax incentives targeted MSMEs and firms in the manufacturing sector. More than 50% of tax incentives (IDR 62 trillion) were given to develop MSMEs. The improvement of the investment climate was the second-most targeted outcome in the tax incentive program in Indonesia, supported by IDR 27 trillion in incentives. was the second-most targeted outcome in Indonesia’s tax incentive program, supported by IDR 27 trillion in incentives. This outcome was achieved through a tax incentive scheme (e.g., income tax reduction) for selected new FDI and domestic investment in Indonesia.24 The GoI also spent IDR 19 trillion in tax incentives aimed to improve the competitiveness and productivity of large firms. One example of a tax incentive aiming to boost productivity is a tariff reduction for importing raw materials for the selected sector in Indonesia.25 In terms of sectoral distribution, the GoI allocated 20% of tax incentives to firms in manufacturing sector. Another major beneficiary was the financial sector, which received 16% of tax incentives.
24 In order to be eligible for this scheme, the new FDI must satisfy at least of one the following eligibility criteria: (1)export oriented; (2) labor intensive FDI; (3) high local content.
25 One example of this is tariff reduction for import of seeds for the development of agriculture, fisheries sectors in Indonesia (MoF regulation No.105 Year 2007)
Figure 42. GoI tax incentives for private sector (in Billion IDR)
Source: World Bank estimates
Figure 44. Allocation of fiscal incentives by sectorFigure 43. Allocated budget for fiscal incentives by intended outcome (billion IDR)
Source: World Bank estimates.
Manufacturing
20%
Finance16%
Trade
13%
Transportation
12%Agricultureand fisheries
12%
Otherservicessector
26%
Mining1%
19.257
27.303
62.668
To support private sector (Non MSME)
To improve Investment Climate
To develop MSME
102.458
110.469
120.800
2016
2017
2018
41Part I: Portfolio Mapping, Assessment of Quality of Policy Mix, and Functional and Governance Review
Credit subsidiesCredit subsidy support in the policy mix is provided exclusively through the Ministry of Finance’s microcredit support program (KUR). The KUR is a national program aimed at improving MSMEs access to affordable bank lending (see Box 1) through the provision of interest rate and credit guarantee subsidies to private financial institutions that lend to MSMEs. Total loans disbursed by financial institutions participating in the KUR scheme reached IDR 120 Trillion in 2018, and the GoI’s subsidies provided for this loan portfolio amounted to IDR 13 Trillion. Only the GoI expenditure on these subsidies is included in the budget envelope of the policy mix (it is a direct government transfer to financial institutions that is not repaid), since funding for the loan disbursements to firms comes from the financial institutions themselves.
Box 1. KUR program in a nutshell
Kredit Usaha Rakyat (KUR) is one of the flagship programs aiming to increase productivity and financial inclusion to MSME in Indonesia. The KUR program provides two forms of subsidies to financial institutions on their loans to MSMEs. The first is an interest rate subsidy to help lower MSMEs cost of borrowing. All loans provided through the KUR therefore carry a significantly lower interest rate (e.g., 7% pa) than the market interest rate for the same loan type (e.g.17% pa). The second GoI subsidy covers expenses that banks incur (i.e. guarantee fees) to obtain a credit guarantee from the Credit Guarantee Company (CGC) for KUR program loans. This is a risk sharing arrangement that incentivizes banks to lend to MSMEs by partially guaranteeing potential losses on these loans. Prior to 2015, the GoI paid the subsidy for the KUR credit guarantees directly to the CGC, but in the latest structure of the KUR, the GoI pays the banks directly (as part of a combined payment for the interest and credit guarantee subsidies). This new structure provides flexibility for banks to directly deal with the CGC.
In the KUR program, all loan applications must be submitted through any pre-approved financial institutions such as banks. If the loan application is approved, the bank informs the GoI through the KUR MIS system. Using the information, the GoI transfers funds to the bank that covers both interest rate subsidy and guarantee fee. Since it is a subsidy program, the bank and the borrower do not have to repay the subsidy to GoI.
Since its launch in 2007, the KUR has reached tens of millions of borrowers in Indonesia, over 90% of which have been micro-enterprises with few than five employees. The majority of KUR borrowers – over 80% - have been first-time borrowers, who have not previously accessed a formal loan from a commercial bank or financial institution.
Going forward, key challenges for the KUR program are: (a) moving from affordability to access and ensuring that credit-worthy firms without collateral have access; and (b) demonstrating that borrowers can graduate from KUR to non-subsidized commercial loans over time.
Figure 45. KUR program structure
Source: World Bank staff analysis based on regulation on KUR
GoI
MoF
MoCSMECGC
BANKBorrower
LOAN
CAPITAL PMN GUARANTEE FEE
CLAIM
DEVIDEND RECOVERY
INTEREST SUBSIDY
CAPITAL
INTEREST
LOAN REPAYMENT
SEIZURE & RECOVERY
POLICY EFFECTIVENESS REVIEW OF INNOVATION AND BUSINESS SUPPORT PROGRAMS
42
Because of the relatively large allocation of the policy mix budget to the KUR program (around 90 percent of the total budget), it distorts the summary statistics and assessment of the relative weight/importance of instruments in the policy mix. To examine and correct for these distortions, the analysis below is therefore conducted with the KUR both included and excluded from the policy portfolio.
Direct financial support
This direct financial support to the private sector in the policy mix is distributed through multiple intervention mechanisms, including grants, vouchers, technical assistance, and other services. The details are discussed in section 4.3.4.
4.3. INTERNAL CONSISTENCY ANALYSIS
4.3.1. Implementing institutions
Multiple ministries have been mandated with business support policies, making responsibility over the policy mix disaggregated and fragmented. The 146 instruments analyzed in this report are implemented by 13 different ministries and agencies. In particular, the distribution of instruments among agencies is skewed toward two institutions: namely the Agency for Implementation Technology (BPPT), which is responsible for 38 instruments, and the Ministry of Cooperatives and MSMEs, with 23 instruments (Figure 46). This introduces challenges to a coordinated deployment of the policy mix.
Figure 46. Distribution of instrument by agency
Source: World Bank staff mapping
38
23
1511 11 11 10
7 7 5 52 1
Agen
cy fo
rIm
pleme
ntat
ion of
Tech
nolog
y
Minis
try of
MSM
E and
Coop
erat
ives
Minis
try of
Fish
eries
Agen
cy fo
r Cre
ative
Econ
omy
Minis
try of
Agr
icultu
re
Minis
try of
Indu
stry
Minis
try of
Trad
e
Minis
try of
Infor
matio
n
Minis
try of
Man
Pow
er
Agen
cy fo
r Scie
nce
Minis
try of
Res
earc
h
Agen
cy fo
r Inv
estm
ent
Minis
try of
Fina
nce
43Part I: Portfolio Mapping, Assessment of Quality of Policy Mix, and Functional and Governance Review
As previously mentioned, the majority of policy mix budget is allocated to the Ministry of Finance (MoF) for the KUR program.26 Total program funds executed by MoF amount to around IDR 16 trillion. Excluding KUR, the largest share of the budget is allocated to Ministry of Industry (IDR 795 million) and the Agency for Implementation Technology (IDR 613 million), which collectively manage nearly 60% of program funds.
26 Before 2014, the formal budget holder of the KUR program is the Ministry of Finance. In 2014, the GoI decided to change the budget holder of the KUR program to the Ministry of SME and Cooperatives. From the disbursement point of view, The Ministry of Finance directly transfers the fund to cover interest rate subsidy for approved loans under the KUR program to banks based on information on KUR MIS. Based on this disbursement point of view, this report grouped KUR as programs under MoF.
Figure 47. Budget allocation per ministries/agencies in 2018 (in million IDR)
Figure 48. Budget distribution (excluding KUR) in 2018
Source: World Bank estimates.
Source: World Bank estimates.
33%
25%
10%
7%
7%
4%
3%3%
3% 3% 2% Ministry of Industry
Agency for Implementation of Technology
Ministry of Man Power
Ministry of Cooperative and MSME
Ministry of Trade
Ministry of Agriculture
Agency for Science
Ministry of Information
Agency for Creative Economy
Ministry of Fisheries
Ministry of Research & Technology
Agency for Investment
- 4.000.000 8.000.000 12.000.000 16.000.000
Ministry of FinanceMinistry of Industry
Agency for Implementation of TechnologyMinistry of Man Power
Ministry of Cooperative and MSMEMinistry of Trade
Ministry of AgricultureAgency for Science
Ministry of InformationAgency for Creative Economy
Ministry of FisheriesMinistry of Research & Technology
Agency for Investment
POLICY EFFECTIVENESS REVIEW OF INNOVATION AND BUSINESS SUPPORT PROGRAMS
44
Although the policy mix budget envelope of 16 Trillion IDR is a relatively small share of the total budget of GoI line ministries (around 2% in 2018), spending on business support and innovation programs is a significant budget outlay for certain ministries. For the 13 ministries/agencies with programs in the policy mix, the program budget outlay is slightly greater—11% of their total budgets. Figure 49 further shows the size of each Ministry’s spending on business support and innovation programs relative to the Ministry’s total budget in 2018. At the high end, this budget share is around 50% for the Agency of Implementation of Technology. At the other extreme, less than 5% of the budgets of the Ministry of Agriculture, Agency for Investment and Ministry of Fisheries was allocated for programs in the business and innovation policy mix. Notably, the KUR program represented around 20% of the Ministry of Finance’s operational budget, although this figure is misleading since many subsidy programs in Indonesia are disbursed by the Ministry of Finance (in its role as State Treasurer) even though they are not directly part of its operational budget.
4.3.2. Socio-economic outcomes
Increases in productivity, jobs and knowledge creation are the primary targeted socio-economic outcomes within the policy mix but are not backed by commensurate budget allocations. Instead, most funding is distributed to programs targeting societal issues and inclusion (including financial inclusion). The 34 percent of instruments aiming to improve productivity growth receive only 9 percent of total support funds. Similarly, instruments aimed at improving jobs and knowledge creation (each accounting for around 20 percent of total instruments) are each allocated only 2 percent of total funding. In contrast, diversification (including MSME development) and societal development programs, which represent 18% and 4% of total instruments, received 44% and 42% of the total budget, respectively. This allocation includes the KUR program for MSME development and financial inclusion. Overall, this discrepancy demonstrates that the budgeting process does not fully align with the strategic objectives laid out in the planning documents of the support programs.
Figure 49. Share of budget of business support and innovation to total budget per ministry (2018)
Notes:1. MoF disburses KUR as State Treasurer. 2. Figure for Ministry of Finance is the combination of the specific ministerial budget for the Ministry of Finance and the budget KUR interest
subsidies. This figure excludes other forms of subsidies.Source: World Bank estimates.
0% 10% 20% 30% 40% 50% 60%
Ministry of Research & TechnologyMinistry of AgricultureAgency for Investment
Ministry of FisheriesMinistry of Information
Ministry of TradeAgency for Science
Ministry of Man PowerAgency for Creative Economy
Ministry of Cooperative and MSMEMinistry of FinanceMinistry of Industry
Agency for Implementation of Technology
45Part I: Portfolio Mapping, Assessment of Quality of Policy Mix, and Functional and Governance Review
As previously mentioned, there is a very high concentration of funding (more than 90 percent of total) in one program—KUR. The GoI’s emphasis on this program reflects the prioritization the GoI has been placing on increasing financial inclusion (particularly of MSMEs)—to 75% of the population by 2020.
By excluding KUR from the analysis, a more representative picture emerges of the relative budget allocations to policy instruments. 59% of the budget is allocated to instruments supporting productivity growth outcomes, while around 12% each is allocated to knowledge creation, diversification and jobs. This distribution more accurately reflects the large strategic importance the GoI’s has placed on improving productivity growth in the private sector.
Figure 50. Number of instruments and budget allocation based on outcomes
Source: World Bank estimates.
Figure 51. Budget allocation based on outcomes
Source: World Bank estimates.
1,0 0,8 0,6 0,4 0,2 0,0 0,2 0,4 0,6
Productivity Growth
Diversification
Knowledge creation
Jobs
Societal and inclusion
Enviromental
Allocated Budget (weighted)Allocated number of Instrument
0%
20%
40%
60%
80%
With KUR Without KUR
Productivity Growth
Diversification
Knowledge creation
Jobs
Societal and inclusion
Enviromental
POLICY EFFECTIVENESS REVIEW OF INNOVATION AND BUSINESS SUPPORT PROGRAMS
46
4.3.3. Instrument objectives
Due to the KUR program, access to finance is unsurprisingly the predominant output targeted in the policy mix. As mentioned in demand analysis chapter, reducing the financial gap in Indonesia is a key priority for the GoI, and accordingly, improved access to finance is a key element of the MSME support strategy in the RPJMN.
The second most targeted output is technology adoption (i.e. non-R&D innovation), with 6% of the total allocated budget in 2018, and 41% if the KUR program is excluded. In Indonesia, the Ministry of Industry, the Agency for Implementation and Dissemination of Technology (BPPT) and the Ministry of Agriculture are the three key actors promoting technological adoption. They are responsible for 70% of the instruments targeting this output.
Research excellence and skills formation are the other key targeted outputs, receiving 22% and 12% of the budget (excluding KUR). The objective of promoting skills was carried out through training to both formal and informal firms, especially MSMEs. This is consistent with GoI’s strategic goal to improve the performance of MSMEs in Indonesia. Meanwhile, research excellence is targeted through support toward public research organizations (PROs), research and development divisions in various ministries and government offices, and researchers at universities. This support focuses specifically on applied research. For example, innovation activities conducted by the R&D division of the Ministry of Agriculture aim to develop new seeds and support their examination and certification process. Similarly, the Ministry of Industry has collaborated with local universities to develop new medical products and promote their commercialization.
A smaller but still significant share the policy mix budget (5%) also targets business R&D and R&D-based innovation. The programs cover both support to R&D activity by private sectors and innovation activity that improve the quality of products through dedicated research and technology development. These programs tend to be at technology readiness level (TRL) 5-6 and include support for prototyping and product development, testing, market research, and securing patents. Most of the business R&D-focused instruments (around 77%) are concentrated in two public institutions, namely the Agency for Implementation and Dissemination of Technology (BPPT) and the Ministry of Industry. The prevalence of business R&D support in the policy mix would have been higher if the various tax incentives provided to firms by the GoI for R&D were included in the analysis.
Figure 52. Distribution of instrument’s objective by budget allocation
Source: World Bank estimates.
0% 10% 20% 30% 40% 50% 60% 70% 80% 90%
Access to finance
Non R&D Innovation,Technology adoption/diffusion
Research excellence
Skills formation
Entrepreneurship
Business R&D and R&D-based innovation
Management practices
Export promotion
Investment Promotion and attraction
Societal - smart cities, inclusion and climate change
Market access (domestic)
Technology transfer and science-industry collaboration
Improving business regulatory environment/business climate
Without KUR
With KUR
47Part I: Portfolio Mapping, Assessment of Quality of Policy Mix, and Functional and Governance Review
4.3.4. Mechanisms of intervention
Due to the KUR program, the two dominant mechanisms of intervention in the policy mix are loan interest subsidies and credit guarantees (accounting for 84% of total mechanisms used). When the KUR program is excluded, however, business advisory services are the main support mechanism used in the policy mix—roughly 15% of the instruments (Figure 46). Meanwhile, training and collaborative networks each represent 12% of the mechanisms used (excluding KUR).
Figure 53. Mechanism of program intervention by instrument budget
Source: World Bank estimates.
Figure 54. Mechanisms of program intervention by relative budget allocation (excluding KUR)
Source: World Bank estimates.
0% 10% 20% 30% 40% 50%
Loans and credit (including interest rate subsidy)Credit and loan guarantees
Business advisoryResearch infrastructure
Grants and matching grantsEducation and training
Early stage infrastructureCollaborative networks
Quality infrastructurePublic goodsScholarships
Public procurementRegulatory instruments
Science/technology parksCrowdsourcing
0% 5% 10% 15% 20% 25% 30% 35% 40%
Business advisory
Research infrastructure
Grants and matching grants
Education for entrepreneurship and SMEs
Early stage infrastructure
Collaborative networks and cluster policy
Quality infrastructure a
Public goods
Scholarships
Public procurement
Regulatory instruments
Science/technology parks, industrial parks, EPZs
POLICY EFFECTIVENESS REVIEW OF INNOVATION AND BUSINESS SUPPORT PROGRAMS
48
R&D
Design and/orprototypes ofproducts/services;
13% Diffusion
Purchase(lease, etc.)of Machinery
Advisoryfortechnologyadoption
02%Equity Working
capital
06%
11%
Other
05%
01%01%61%
4.3.5. Geographic coverage
All programs in the policy mix are executed by the central government. Ideally, for completeness, programs run by provincial and district-level district governments would also have been considered. However, since there are 514 districts in Indonesia, complete data collection at the subnational level would not have been possible within the timeframe of this iPER.
Most programs (95%) have nationwide coverage while at the same time emphasizing a specific issue or theme (Figure 56). The KUR is an example of such a national program. There are also programs which are executed only in certain areas of the country but are classified as having national coverage due to their strategic national importance. One example is the pilot program by the Ministry of Industry for technology innovation in the salt industry, which is implemented in a specific location, but characterized as a national program because it supports the national agenda to develop the salt industry in Indonesia.
Figure 55. Breakdown of activities funded through grants in the policy mix
Source: World Bank estimates.
Grant schemes are the favoured financial support instrument, while others such as vouchers and equity finance are relatively unexplored. Around 8% of the budget is allocated for grants to firms. However, despite high demand for equity finance among early-stage businesses, this mechanism of support is not employed in the policy mix, possibly because there is already a fairly active private funding market for startups (e.g. venture capital firms).
Significant grant funding is also allocated for various phases of the R&D-based business innovation cycle. Of the program funds earmarked for grants, more than 60% of are allocated for business R&D activities. Another 12.5% is allocated for prototype design of products and services, and 11% to the market diffusion of business’ innovations. Collectively, this support spans the full range of the product innovation cycle (albeit unevenly)—from the initial research/concept stage, to prototyping and testing, to market penetration—helping increase the likelihood of market-ready business innovations. This is consistent this is consistent with the international experience, and the use of grants in R&D in general, especially for early stages of innovation.
49Part I: Portfolio Mapping, Assessment of Quality of Policy Mix, and Functional and Governance Review
Despite persistent income disparities between Indonesia’s regions, the policy mix has a rather weak focus on provincial and regional development. Only a small portion of the instruments have a regional focus. Regional inequality is a central issue in Indonesia’s development, since for many decades, most of the country’s economic growth has been concentrated in Java island. Therefore, innovation and business support programs with a specific regional focus need to be encouraged as a means of helping to reduce development disparities between regions.
4.3.6. Beneficiaries
Formal firms are the primary target beneficiaries of innovation and business support (Figure 57). Around 90% of instruments target formal firms, especially MSMEs.27 In particular, formal MSMEs are the main target of the KUR program—although it is not explicitly specified that applicants must be formal, banks usually request proof of a business license as one of the required documents for loan application. Further analysis by excluding KUR also shows similar pattern. Formal firms remain the main target of program for business support and innovation in Indonesia with 41.6% allocated budget.
27 A formal firm is loosely defined as having a business license from local government.
Figure 56. Distribution of instruments by geographic coverage
Source: World Bank estimates.
Figure 57. Program beneficiaries
Source: World Bank estimates.
National95%
Regional 0%Province 0%
City 5%Other5%
0% 20% 40% 60% 80% 100%
Formal firmsResearchers
Other government agenciesResearch institutes
Business support institutionsIndividuals
CooperativesConsortia and associations
Informal firmsUniversities
Women entrepreneursFinancial institutions
SOEs
Without KURWith KUR
POLICY EFFECTIVENESS REVIEW OF INNOVATION AND BUSINESS SUPPORT PROGRAMS
50
Only a few programs are dedicated to women’s entrepreneurship, demonstrating a lack of attention to gender barriers in entrepreneurship development. The proportion of women managing a business in Indonesia, especially an informal business, has been growing over time. As most women are running a small and informal businesses, they face structural disadvantages such as lack of finance, skills, and information, limiting them from accessing support. However, most instruments in the policy mix do not target the participation of women—only around 2 percent of instruments mention women as target beneficiaries, and a few require that a certain number of beneficiary applications be from women.
Figure 58. Composition of beneficiaries by target firm size
Source: World Bank estimates.
Figure 59. Composition of beneficiaries by sector
Source: World Bank estimates.
With respect to firm size, MSMEs are the main target of support programs. The focus on MSMEs is understandable since, in Indonesia, they tend exhibit lower productivity than large firms and thus have much to gain from improved access to knowledge and technology. However, this neglects the innovation potential of large firms, as well the benefits of potentially pairing MSMEs with large firms as part of program support mechanisms, to facilitate sharing and knowledge transfer. It also potentially misses out on opportunities to accelerate the export readiness of medium-to-large firms who tend to be further along in the export cycle.
A relatively larger share of the policy mix budget is allocated to manufacturing firms. The KUR program is sector-agnostic, and because of its outsized budget allocation, it results in a fairly balanced distribution of support across sectors. However, the non-KUR part of the policy portfolio has a noticeable tilt towards the manufacturing sector—the relative weight of support to manufacturing firms increases from the 30% of the total budget to 50% when the KUR program is excluded. Meanwhile, knowledge-intensive services sectors received 19% of the portfolio budget (ex. KUR), agriculture and non-knowledge intensive sector received 11% and 6%, respectively.
0% 10% 20% 30% 40% 50%
Micro
Small
Medium
Large
With KUR Without KUR
0% 10% 20% 30% 40% 50% 60% 70%
Agriculture
Manufacturing
Services: knowledge-intensive
Services: non-knowledge intensive
Without KUR
With KUR
percent of portfolio budget
51Part I: Portfolio Mapping, Assessment of Quality of Policy Mix, and Functional and Governance Review
The policy mix supports firms of various ages, but much less funding is directed toward those at the initial idea/concept stage. About 31% of instruments target young and start-up firms, 36% support scale-up businesses, 30% mature businesses, while only 2.4% cover firms at the idea/concept stage. The support to young and start-up firms is through the development of science and technology parks and other innovation spaces, business incubation programs and assistance with investment readiness. Beneficiaries are generally selected through a competition format where proposals are evaluated on criteria such as their potential to promote innovation.28
Programs also consider firms’ innovation propensity and growth intentions, wherein there is a clear bias given to “potential innovator” firms. Exclusive of the KUR program, almost half of the instruments target potential innovator firms while only 2 percent support technology-intensive firms. “Potential innovator” firms, for example, typically requires basic (technology) support compared to technology-intensive firms, which need more on advanced technology services. From this perspective, the relative emphasis of the policy mix on supporting “potential innovators” appears consistent with the significant use of instruments aimed at facilitating technology adoption (see section 4.2.2).
28 The selected business will be included in the coaching program which sometimes calls private sector agents as coaches. The presence of a business coach here likely aims to improve business management and provide investment readiness through providing early financial support like from venture capital (VC) company.
Figure 60. Composition of beneficiaries by firms’ life cycle stage Figure 61. Composition of beneficiaries by innovation propensity (excluding KUR)
Source: World Bank estimates. Non-innovator: firms that do not regularly innovate (i.e. have not introduced a product or process innovation over past 3 years) and are receiving mainly non-innovation related support (e.g. to formalize).
Potential innovator: firms that do not regularly innovate but are receiving support to incentivize their innovation.
High-growth potential: young firms that demonstrate potential to grow.R&D intensive: firms that have previously been engaged in R&D
activities. Technology intensive: firms that use advanced technologies in their line
of business or operate in tech-intensive sectors.
Source: World Bank estimates.
Idea / concept stage
Young and startups
Scale-upMature
Non Innovator12%
Potential Innovator76%
High growthpotential
4%
R&D intensive6%
Technology intensive2%
POLICY EFFECTIVENESS REVIEW OF INNOVATION AND BUSINESS SUPPORT PROGRAMS
52
4.4. FRAGMENTATION ANALYSIS
Duplicity in the scope of instruments arises as a typical issue in the policy portfolio when its growth has been organic. This can lead to potential redundancy of programs and opens opportunities for instrument rationing. Conducting a review of the portfolio to identify opportunities for eliminating redundancy can therefore inform a potential reallocation of resources, either by elimination or merging of programs, as well as to sharpen the focus of existing programs.
Most ministries involved in the policy portfolio aim to achieve a very similar set of outcomes. Several outcomes such as of increasing productivity growth, diversification, and job growth are pursued by the largest number of ministries. The productivity outcome, in particular, is targeted by 92% of the ministries involved in the implementation of the policy mix, while diversification by 85% of ministries (Figure 62), and job growth by 60%. In contrast, less than one third of ministries support environmental issues in their innovation and business support policy instruments. The significant focus on productivity, diversification, and job creation is consistent with the main mandate of sectoral ministries to improve the performance of the sector under their purview. Furthermore, each implementing ministry typically acts as an independent implementing agency in the sense they design support programs and manage funds and human resources. The fact that there is no joint funding and staff for programs makes it difficult to promote coordination across government institutions.
Figure 62. Proportion of implementing ministries targeting specific socio-economic outcomes
Source: World bank estimates.
To further test for redundancies between instruments, a cluster analysis was conducted on the policy mix by grouping instruments according to certain criteria. The framework for the analysis is summarized in Figure 63. The four key variables used as the basis for assessing the extent of scope overlap between instruments are: (i) the instruments’ socio-economic outcomes, (ii) their specific objectives, (iii) their mechanisms of intervention, and (iv) their beneficiaries. In terms of the approach:
• The analysis creates measures of (dis)similarity between pairs of objects, using these variables. It then assigns instruments into groups (by similarity of scope). This segmentation is then used to look closer at each group of instruments to identify potential cases of overlapping scope.
• As a result, the findings recommend additional examination of these cases depending on the degree of overlap (degree of correlation).
• Where information permits, a qualitative assessment of identified similarities is conducted to validate the findings of the cluster analysis and factor in any nuanced issues before making a final determination on whether an instrument is a good candidate for rationalization.
92%Productivity Growth
85%Diversification
38%Knowledge creation
69%Jobs
46%Societal and inclusion
31%Enviromental
53Part I: Portfolio Mapping, Assessment of Quality of Policy Mix, and Functional and Governance Review
Figure 64 shows the dendrogram for the instruments based on their similarities in socio-economic outcomes, specific objectives, mechanisms of intervention and beneficiaries. The longer the horizontal lines that join the instruments, the more differences there are between them (and conversely, the shorter the lines, the greater the similarities). In the extreme case of similarity, the instruments are connected by a vertical line.
The dendrogram for the full un-clustered sample of instrument is only partially informative. Therefore, the various instruments were clustered into six groups based on similarities in characteristics. Instruments that belong to the same group are closer to each other (in terms of their objectives and mechanisms) than those that are outside this group. The dendrograms for each group can be seen in Figure 65. As in Figure 64, the instruments are represented on the y axis, and the length of the lines connecting them (x-axis) represents the degree of difference between their characteristics. Presented in this clustered manner, it is clearer that there are many more instruments connected by a vertical line, which indicates total similarity in their characteristics.
Figure 63. Methodology for cluster analysis
Source: World Bank.
Key Variables
FINAL RATIONALIZATION DETERMINATION
Maximum Overlap
2
UNCERTAIN
WEAK
3
STRONG
Qualitative case evaluation
Medium Overlap
Minimum Overlap
Examination of scope overlap within group
Objectives
Target beneficiary
Supporting mechanism
SCOPE
Key Variables1
Individual instruments
Groups
Instruments population
POLICY EFFECTIVENESS REVIEW OF INNOVATION AND BUSINESS SUPPORT PROGRAMS
54
Figure 64. Dendrogram of ungrouped instruments
Source: World Bank calculations.
11n=3
95n=3
58n=4
112n=7
98n=2
78n=2
135n=2
106n=2
144n=4
66n=4
63n=4
9n=2
142n=4
140n=5
76n=4
73n=3
86n=3
123n=3
119n=5
88n=5
131n=3
126n=2
124n=1
108n=2
122n=3
89n=9
130n=2
6n=2
129n=1
53n=3
115n=3
44n=7
48n=7
132n=2
90n=4
134n=4
104n=4
47n=14
-15-10-50Jaccard similarity measure
Dendrogram - Cluster all instruments
55Part I: Portfolio Mapping, Assessment of Quality of Policy Mix, and Functional and Governance Review
Several key observations emerge from an examination of patterns within these clusters. First, some agencies are represented in multiple groups, suggesting a lack of agency specialization in instruments of a certain characteristic profile. This corroborates findings in the above analysis that revealed a fragmented and sprawling scope of programs and instruments among ministries. Second, some agencies seem to concentrate on very similar instruments (such as instruments from the Agency of Implementation of Technology, in groups 5 and 6), implying a significant degree of intra-agency duplication. There are also large similarities among instruments housed in different ministries or agencies (e.g. instruments in group 3), and hence cross-ministry redundancies.
Figure 65. Dendrogram of instruments in 6 groups
MOTCE_1MOTCE_8
MOTCE_11MOFI_3
MOFI_14MOFI_6AoIT_7
AoIT_19MOA_1MOA_3MOFI_2MOI_5MOI_9MOI_6MOI_7
MOI_10MOI_8
AoIT_28MOFI_9
MOCSME_8MOCSME_12
BKPM_2MOT_1MOI_1MOI_2
MOA_10MOFI_4
MOMP_6MOT_10MOA_2MOA_6MOA_9
MOA_11MOA_4MOA_5MOA_7MOA_8
-3-2-101Jaccard similarity measure
Dendrograma - Cluster G1
MOTCE_2
MOTCE_9
BKPM_1
MOT_3
MOT_4
MOT_8
MOT_2
MOT_7
MOT_5
MOT_9
MOT_6
0.2.4.6.81Jaccard similarity measure
Dendrograma - Cluster G2
MOTCE_5MOCSME_16
MOCSME_2MOCSME_10
MOTCE_7AFS_1
MOCSME_7MOCSME_9
MOCSME_18MOCSME_20
MOFI_8MOMP_5MOMP_1
AFS_4MOIC_1MOIC_3MOIC_2MOIC_4
MOCSME_1MOCSME_5
MOCSME_15MOCSME_13MOCSME_22
MOTCE_10MOSRT_4MOSRT_2
MOCSME_6MOMP_4MOMP_2
MOI_3MOI_4
MOIC_5MOIC_6MOIC_7
MOCSME_3MOCSME_11MOCSME_19MOCSME_21
MOMP_3MOCSME_4
MOCSME_17MOCSME_14MOCSME_23
-2-101Jaccard similarity measure
Dendrograma - Cluster G3
MOTCE_3
MOSRT_1
MOTCE_4
MOTCE_6
MOMP_7
AoIT_16
AoIT_18
AFS_3
AFS_2
AFS_5
MOI_11
AoIT_1
AoIT_20
AoIT_12
AoIT_33
AoIT_21
AoIT_24
AoIT_34
-1-.50.51Jaccard similarity measure
Dendrograma - Cluster G4
AoIT_2
AoIT_26
AoIT_31
AoIT_35
AoIT_15
AoIT_17
AoIT_38
AoIT_14
MOSRT_3
AoIT_9
AoIT_13
AoIT_30
MOFI_1
MOFI_5
MOFI_12
MOFI_10
MOSRT_5
MOFI_7
MOFI_11
MOFI_13
MOFI_15
-3-2-101Jaccard similarity measure
Dendrograma - Cluster G5
AoIT_3
AoIT_4
AoIT_5
AoIT_6
AoIT_8
AoIT_10
AoIT_11
AoIT_22
AoIT_23
AoIT_25
AoIT_29
AoIT_32
AoIT_36
AoIT_37
02Jaccard similarity measure
Dendrograma - Cluster G6
Source: World Bank calculations.
POLICY EFFECTIVENESS REVIEW OF INNOVATION AND BUSINESS SUPPORT PROGRAMS
56
Further qualitative analysis is needed to verify whether some of the highly correlated instruments are indeed duplicative to the degree that their consolidation would yield tangible efficiency gains. As a starting point, based on the cluster analysis, Table 4 provides examples of instruments that exhibit characteristics of redundancy, and are thus potential candidates for consolidation.
Table 4. Examples of instruments exhibiting potential for consolidation
Implementing Ministry/Agency
Instrument NameCase for consolidation Similarity
IndexStrong Uncertain Weak
Ministry of Trade
Development of export of services and creative economy product x High
Development of export of manufactured goods in ASEAN x Facilitating of development of export product x Promotion of export x
Ministry of Industry
Revitalization of machineries of manufacturing firms in forest and plantation product x Medium
Prototype of product of manufacturing firms in forest and plantation product x
Agency for Creative Economy
Facilitating access from financial system for creative economy players x High
Policy on access to financial sector for creative economy players x Facilitating access to non-financial institution for creative economy players x
Ministry of Fisheries
Access to bank and non-bank for firms in fisheries sectors x
4.5. EXTERNAL COHERENCE
This evaluation looks at the coherence between Indonesia’s strategic priorities for innovation and private sector development and the supply of policies and programs analyzed in section 4.2. The goal is to identify policy gaps—i.e. areas in demand (i.e. pressing private sector productivity and innovation challenges) that are not covered adequately by the existing programs. There are two layers of this gap analysis: (i) gaps in policies relative to the private sector’s productivity challenges identified in section 3; and (ii) gaps relative to the specific innovation and business productivity support priorities identified in the GoI’s Medium Term Development 2020-2024 (Section 2).
With respect to the correspondence of the policy mix to the private sector’s key productivity challenges, there are some gaps, although they are a function of the inherently narrower scope of the policy mix. The policy portfolio considered in this iPER includes only expenditure-based public interventions, either through subsidies and guarantees, tax incentives, or direct transfers to private firms. It does not include legal and regulatory measures. This is important, as there are various operating environment constraints to firms’ productivity identified in section 3 that call for legal and regulatory solutions rather than specific public investments or financial support. These include: (i) reforms to Indonesia’s competition framework to foster greater competition and increase incentives for incumbent and/or market-dominant firms to invest in productivity improvements; (ii) reduction of import tariff and non-tariff barriers to improve domestic firm’s access to foreign production inputs; and (ii) reduction of foreign investment restrictions to facilitate greater FDI into Indonesia and technology and knowledge spillovers to domestic firms. As a result, it would not be fair to interpret the absence of such measures as in incoherence in the policy mix, as they are already excluded ex-ante from the scope of analyzed interventions. Nevertheless, the GoI should note their importance as complementary measures in the overall government policy strategy vis-à-vis private sector productivity and innovation.
57Part I: Portfolio Mapping, Assessment of Quality of Policy Mix, and Functional and Governance Review
Meanwhile, concerning the GoI’s stated strategic priorities for private sector innovation and productivity, the analysis reveals some important areas of incoherence and inconsistency. For this gap analysis, the relevant GoI’s strategic priorities in the Medium Term Plan 2020-2024 can be distilled into the following: (i) science/technology research and commercialization; (ii) entrepreneurship and MSME growth; (iii) firm-level innovation and technological capacity; and (iv) export growth and increase in value-added. The evaluation of the coherence of the policy with these various priorities is summarized in Table 8.
Some key conclusions from this external coherence analysis are as follows:
• The strategic priority of promoting innovation is broadly supported by the policy mix, albeit with a considerable slant towards technology adoption over R&D. A variety of innovation-related objectives are represented in the policy mix—business R&D, firm-level technology adoption (non-R&D innovation), and applied science and technology research—although technology-adoption is by far the most prevalent. This perhaps reflects, either explicitly or implicitly, the recognition that, due to Indonesia’s low starting point on innovation outcome measures, firms have more to gain in terms of productivity from focusing on incremental innovation (adoption of existing technologies) rather than pushing prematurely for new-to-world innovations. That said, Indonesian firms already demonstrate a high degree of technology adoption relative to East Asian peers (see section 3.1.2), suggesting that support for discovery/invention dimensions of business innovation should not be completely de-prioritized. From the beneficiary perspective, there is an underrepresentation of technology-intensive firms, which, combined with the modest budget allocation to STI research, appears inconsistent with the clear bias in the RPJMN objectives towards promoting science and technology-based innovation. In practice, however, this is not necessarily be a bad outcome since it is more accommodative of the broader spectrum of potential innovation (e.g. non-technology-based product, process or organizational innovations) than can translate into productivity increases.
• The objectives of entrepreneurship and MSME growth receive considerable resource allocations, but not consistently across the demographic spectrum of firms, including by size, formality status, life cycle stage, and gender of owners. Most of the support is oriented towards MSMEs, startups, and male-owned firms, representing a bias towards firm creation and early-stage development at the expense of also nurturing the growth of established firms. Such a bias risks fueling a glut of early-stage small firms that do not have sufficient resources and access to support to grow, and exacerbating Indonesia’s existing problem of a high incidence of low-growth survival entrepreneurship. This underscores the potential need for a more flexible approach to firm targeting in the policy, one that emphasizes firms’ needs over their demographic characteristics.
• The share of the policy mix devoted to increasing the value-added and diversity of exports is limited and not optimally targeted. In light of Indonesia having a low number of firms that export or can compete in international markets, the small share of export assistance in the policy mix is not consistent with the stated export objectives in the RPJMN. In particular, there is a lack of support instruments that (i) help link firms with foreign partners or FDI opportunities to facilitate knowledge transfer and international market access and (ii) support firms to obtain international quality certification for their products and thus become more export-ready.
POLICY EFFECTIVENESS REVIEW OF INNOVATION AND BUSINESS SUPPORT PROGRAMS
58
Table 5. Policy mix coherence with GoI’s stated innovation and productivity objectives in Medium Term Plan 2020-2024
Strategic focus areas
Coherence with a current policy mix Relevant gaps to be addressed
Science and technology research and commercialization
Slightly coherent: Support for applied research represents nearly one quarter of the total policy support budget, and provided directly public research organizations (PROs), research and development divisions in various ministries and government offices, and researchers at universities. Indirect support also comes in the form of budget allocations to the improvement of research infrastructure, including science and technology parks.
While the generation of scientific and technology research is well funded, support for the commercialization of this research (including for academia-industry collaboration) is virtually non-existent in the policy mix, receiving less than 1% of the budget. This is inconsistent with the stated objective of translating applied research into tangible economic impacts. It also reflects the exclusively supply-side approach to research-driven STI, and the opportunities for complementary demand-side policies.
Firm-level innovation and technological capacity
Moderately coherent: Nearly one quarter of the policy mix budget (excluding KUR program) is allocated to supporting firms with technology adoption. Within the programs providing grant funding, around 13% is devoted to innovation promotion via advisory services for marketing, advisory and training for technology adoption, and monitoring activities.
A further 5% of the program portfolio supports business R&D activities and R&D-based innovation, including early-stage product development in the form of prototype design and pilot implementation, as well as later-stage market diffusion.
Overall, the relatively greater resource allocation to supporting technology adoption vs. R&D-based innovation reflects the implicit premise that, at Indonesia’s current level of development (particularly in MSME sector), incremental innovation through technology adoption is the higher medium-term priority and offers a relatively greater marginal return on investment than trying to foster home-grown new-to-world innovation.
Minimal support (2% of total budget) is provided to technology-intensive firms. While this is presumably partly a reflection of the relatively small population of such firms, the low budget allocation appears inconsistent with the GoI’s stated strategic bias of specifically fostering science and technology-based innovation.
Entrepreneurship and MSME growth
Moderately coherent: Due to large allocation of KUR, around 45% of the program portfolio explicitly aims to stimulate MSME growth through improved access of the finance. The majority of this KUR program support is provided through loan interest rate subsidies and credit guarantees.
Meanwhile, support for firms’ human resources represents another key part of the portfolio—skills formation is the target objective for 12% of the policy mix (excluding KUR), executed predominantly through workforce training programs. Another 4% of the program portfolio goes beyond technical skills and also targets the improvement of firms’ management (via business advisory services)
Support across the firm age spectrum is fairly evenly balanced, with young startups, firms in scale-up stage, and mature firms each receiving around one-third of the program portfolio budget; support for firms in the idea/concept stage is negligible however (2.5% of total budget).
There is also only one instrument aimed at promoting collaboration between MSMEs and large enterprises, suggesting missed opportunities to facilitate potential knowledge spillovers and technology transfer through linkages.
Furthermore, only 2 percent of programs explicitly target women entrepreneurs as beneficiaries, demonstrating a lack of attention to gender barriers in entrepreneurship development.
Export value growth
Slightly coherent: Only 3% of programs target export support and promotion as an objective. The support includes product development and standardization while facilitation is done through the distribution of market information.
There are very few instruments that help link target beneficiaries with market opportunities—e.g. by promoting collaboration with exporting firms and multinational corporations. Such demand-pull instruments can help smaller firms plug into global GVCs and unlock export opportunities for their goods and services.
Support for firms to obtain international quality certification for their products (and thus make them more export-ready) is also notably absent in the policy mix.
Note: rating scale is, in ascending order: not coherent, slightly coherent, moderately coherent, strongly coherent
59Part I: Portfolio Mapping, Assessment of Quality of Policy Mix, and Functional and Governance Review
4.6. RECOMMENDATIONS
Based on the analysis of both the internal consistency and external coherence of the policy mix, some key recommendations emerge for improving the quality of the GoI’s portfolio of innovation and business support. These are summarized in Table 6 below.
29 Maloney and Nayyar (2018) find limited evidence of the benefits of sectoral targeting (i.e. vertical policy) of business support programs. Rather, the evidence points in the direction of focusing on addressing demonstrable market failures.
Table 6. Summary of recommendations to improve quality of policy mix
Area Proposed changes and actions Responsible stakeholder(s)
Reconfiguring the beneficiary targeting of the policy mix
Shift away from beneficiary targeting based on firm characteristics (e.g. size or life cycle stage) and towards eligibility criteria emphasizing firms’ ability to demonstrate they are impacted by specific market failures. This will promote a “self-selection” dynamic where firms with most to gain from help in alleviating binding constraints are prioritized (irrespective of their demographic traits), thus enhancing the marginal impact of program interventions on firm productivity and growth.
Coordinating Ministry of Economic Affairs, Bappenas
As a potential exception to the market failures-based approach, and in light of their significant underrepresentation in the policy mix, consider pro-actively targeting a greater number of female beneficiaries to help narrow the large gender gap in entrepreneurship in Indonesia.
Coordinating Ministry of Economic Affairs
Introduce a more specific regional focus for programs executed by central government ministries/agencies. The current configuration where most instruments are national in coverage may inadvertently be crowding out support and resources to regions with below-average productivity, where targeted support would tend to deliver greater marginal impacts. Geographic targeting could thus help reduce productivity and income disparities between and regions. Sector-specific targeting of instruments could also be considered, although some recent studies suggest limited benefits of such a vertical approach.
Coordinating Ministry of Economic Affairs, Bappenas
Recalibrating program features and intervention mechanisms
Complement the high level of support for the generation of scientific and technology research with greater support for the commercialization of this research, to help maximize its tangible economic impacts. This could include promoting collaboration between academic researchers and industry, and financing and/or technical assistance for researchers to obtain patents or conduct market demand studies for their technology or invention.
BRIN, Coordinating Ministry of Economic Affairs, Ministry of Education, Science and Technology
In light of the active private market in Indonesia for startup financing (e.g. VCs), consider introducing programs that support early-stage firms with investment readiness and investor outreach/networking, to help them tap into private equity finance. This would help complement the support already offered in the policy mix (via the KUR program) for subsidized debt financing.
Coordinating Ministry of Economic Affairs, Ministry of Tourism and Creative Economy, Ministry of Finance
Introduce demand-side innovation promotion policies (e.g. innovation-oriented public procurement programs) to complement the current supply-side STI policy mix that focuses predominantly on applied research and R&D grants.
Bappenas, Coordinating Ministry of Economic Affairs, BRIN
Introduce more instruments that promote collaboration between (i) small and large firms, (ii) domestic-facing and export-oriented firms, and (iii) low-tech and high-tech firms, to facilitate knowledge transfer and help firms boost productivity and expand market access. This support could be in the form of vouchers and grants to firms to finance their collaboration, or network and cluster policies.
Coordinating Ministry of Economic Affairs, Ministry of SME
Reducing policy fragmentation and redundancies for improved spending efficiency
Rationalize the number of policy instruments, starting with those that have very similar features, and instead allocate a larger budget amount to each. Although there are 146 instruments in the portfolio reviewed, more than 90 percent of the funding is allocated to the only instrument run by the Ministry of Finance (the KUR program). Consolidation of the smaller instruments could help improve the efficiency of program implementation and monitoring.
Bappenas, Ministry of Finance
Encourage a division of labor where ministries specialize in one type of support program or strategic objective. This would reduce the inefficiencies that currently result from most ministries executing programs/instruments that target the same set of objectives and mechanisms and would help achieve synergies. It could also help simplify the tracking and attribution of outcomes to program interventions, as there would be fewer initiatives simultaneously trying to influence the same outcomes.
Bappenas, Coordinating Ministry of Economic Affairs
POLICY EFFECTIVENESS REVIEW OF INNOVATION AND BUSINESS SUPPORT PROGRAMS
60
Table 7. Assessment of implementation timeframe and cost of recommended measures to improve quality of policy mix
Timeframe of implementation
Short-term Medium-term
Relat
ive co
st (m
onet
ary a
nd ad
minis
trativ
e) an
d eas
e of im
pleme
ntat
ion Low • Shift away from beneficiary targeting based on firm characteristics (e.g. size or life cycle stage) and towards eligibility criteria emphasizing firms’ ability to demonstrate they are impacted by specific market failures.
• Pro-actively target a greater number of female beneficiaries to help narrow the large gender gap in entrepreneurship in Indonesia.
Introduce a more specific regional focus for programs executed by central government ministries/agencies.
Medium Rationalize the number of policy instruments, starting with those that have very similar features, and instead consider allocating a larger budget amount to each.
• Encourage a division of labor where ministries specialize in one type of support program or strategic objective.
• Complement the high level of support for the generation of scientific and technology research with greater support for the commercialization of this research, to help maximize its tangible economic impacts.
High • Introduce demand-side innovation promotion policies (e.g. innovation-oriented public procurement programs) to complement the current supply-side STI policy mix that focuses predominantly on applied research and R&D grants.
• Introduce programs that support early-stage firms with investment readiness and investor outreach/networking, to help them tap into private equity finance.
• Introduce more instruments that promote collaboration between (i) small and large firms, (ii) domestic-facing and export-oriented firms, and (iii) low-tech and high-tech firms.
Some of these actions represent “quick wins” and can be implemented in a short timeframe at a relatively low cost to the GoI. In Table 7, the key recommendations are mapped on two key dimensions: (i) their relative cost (monetary and administrative) and ease of implementation, and (ii) the likely required timeframe for their implementation—short-term (within 1 year) and medium-term (2-3 years). In general, measures that involve the re-configuration of features of existing programs (e.g. targeting a different group of beneficiaries) are relatively straightforward to enact (i.e. low cost) in a short period of time. The consolidation or elimination of certain programs can also be executed quickly, although may carry a relatively higher political cost and come with some administrative hurdles. Meanwhile, the introduction of new programs or instruments will tend to be a lengthier (i.e. medium-term) and relatively high-cost process, especially if responsible ministries/agencies have limited prior experience with the new program content or operational models. For instances that involve the scaling up of existing instruments (e.g. increasing technology commercialization support), the relative implementation cost may be slightly lower, however.
61Part I: Portfolio Mapping, Assessment of Quality of Policy Mix, and Functional and Governance Review
Functional and Governance Analysis
5.1. INTRODUCTION
This functional and governance review is the second part of the PER, where selected GoI innovation and business support programs are assessed in their use of good practices in design, implementation, and coordination. This review provides the analytical for recommendations to strengthen the design, delivery, and effectiveness of business support and innovation program under implementation, as well as informing the design of new programs under consideration.
Based on good models for public management, the best programs should have the following characteristics:
• Market failure is identified and clearly justifies program design and intervention; • Program origin is not ad-hoc but part of a broader strategy/framework for public intervention. • The program defines objectives that are measurable; • The program has an explicit and realistic logical framework; • The selection of beneficiaries is appropriate; • The program counts with sufficient human, financial and organizational resources and features good
managerial practices; • The choice of intervention instruments is evidence-based and compared with reasonable and similar-
cost alternatives; • There are clear M&E frameworks with measurable and attributable indicators, and options for embedding
impact evaluation mechanisms are considered; • The program has the formal system to adopt lessons and learning to make the program more efficient.
These indicators were translated into a set of qualitative interviews and used to score the design, implementation, and governance of selected instruments in the policy mix. Specifically, semi-structured interviews were used to evaluate the quality of design, implementation, and inter-institutional integration (i.e. coordination among instruments and institutions) of instruments, as well as how their score on these criteria compares to international best practices. The design dimension has 14 criteria, implementation has 13, and governance has 4 (Table 8). The performance in each criterion for the agency responsible for each instrument is scored by the iPER team on a scale of 1-5 (1=lowest, 5=highest), based on interviews with the implementing team and reviewed documentation for each program.
After the instruments were ranked on each criteria, their score was compared to the average in each dimension of the best performer in the Latin America region (where the most iPERs have been conducted, to date) and two countries in Southeast Asia (Vietnam and Philippines). This comparison provides an international and regional benchmark for the performance of ministries in Indonesia and highlights the areas where the greatest improvements would be needed to close relative performance gaps.
POLICY EFFECTIVENESS REVIEW OF INNOVATION AND BUSINESS SUPPORT PROGRAMS
62
5.2. ANALYTICAL SAMPLE
Due to the significant time required to interview a program manager for any given instrument, in the interest of efficiency, it was decided to randomly select several instruments for analysis. During data collection, the assessor met with and surveyed the program managers of the 21 selected business support and innovation programs. The choice of instruments to include in the sample was based on parameters such as budget allocation, importance, and institutional diversity. These instruments came from 6 ministries/agencies: the Ministry of Industry, the Ministry of Agriculture, the Ministry of Cooperative and MSMEs, the Ministry of Research and Technology (RISTEK), the Agency of Creative Economy (BEKRAF—now under the Ministry of Tourism), and the Agency of Implementation of Technology (BPPT). The analytical exercise only included programs implemented in the year 2018. It is worth noting that, because the analysis has been done on only a sample of programs, the findings cannot necessarily be used to extrapolate and draw general conclusions about different agencies.
The sample selection was implemented in two stages. In the first stage, the assessor randomly chose the implementing ministries for functional analysis. In the second stage, total samples were allocated to selected ministries based on the total number of instruments per ministry. Ministry of Industry was purposely oversampled due to its important mandate as the overseer of the manufacturing sector in Indonesia. After the decision on the sample number per ministry, the assessor chose the sample instruments based on budget allocation and importance.
Table 8. Key criteria/parameters in each dimension of instrument quality
Design Implementation Governance1. Program origin2. Program justification3. Relationship to portfolio4. Objectives5. Logical framework6. Activities7. Inputs8. Products9. Main beneficiaries10. Audiences11. Alternative instruments12. Expected results and impact13. Selection criteria14. Monitoring and evaluation systems
1. Learning during implementation2. Project calls and products3. Eligibility and selection during the program4. Application process5. Program database and information6. Program closure7. Budget and financial resources8. Organization and management quality9. Roles and autonomy10. Staff adequacy and training11. Incentives12. Process monitoring13. Execution of monitoring and evaluation
1. Relationship between instruments
2. Relationship between implementing institutions
3. Coordination with outside entities and policy frameworks
4. Coordination with the functionality of outside programs
Figure 66. Distribution of instruments sampled in functional analysis by institution
Source: World Bank analysis.
5 5
4
3 3
1
Ministry ofIndustry
Agency of Implementationof Technology
Ministry ofAgriculture
Agency forcreative economy
Ministry of MSMand Cooperatives
Ministry of Researchand Technology
63Part I: Portfolio Mapping, Assessment of Quality of Policy Mix, and Functional and Governance Review
5.3. KEY FINDINGS
In general, all sampled instruments had average quality of planning, implementation, and governance and they scored lower than the international benchmark. The average score of the functional quality of instruments in Indonesia was 3.24 (out of 5), broadly in the middle of scoring and suggesting an “average” quality level. Nevertheless, this was slightly below the score of the overall quality of instruments in the benchmark country (3.93). The instrument sample also scored lower relative to the benchmark in each of the quality dimensions, with the largest underperformance being in implementation, where Indonesia’s average score was 3.15 (compared to 4.14 for the benchmark). Annex 4 provides detailed information on functional score for all samples.
Relative to the two Southeast Asian comparator countries, instruments in Indonesia had higher functional quality. The average scores of the sampled instruments in Vietnam and the Philippines were 2.78 and 2.92, respectively. These were significantly lower than Indonesia’s average score of 3.24. This superior quality was across all three quality dimensions: design, implementation, and governance.
Relative program scores across the three quality dimensions suggest Indonesia’s policy mix exceled in design aspects. Across the three dimensions of functional analysis, Indonesia performed best in the design stage (with a score of 3.37) and worst in the implementation stage (3.15). On the other hand, the benchmark Latin American country, Vietnam, and the Philippines performed best in the implementation stage and worst in the design stage. This pattern suggests that, while there is still scope in Indonesia for further improvements in program design, most enhancement efforts should be focused on implementation and governance aspects.
Figure 67. Indonesia’s functional and governance quality scores relative to regional and international comparators
Note: Benchmark is the best performing country in Latin America where multiple iPER has been implemented.Source: World Bank assessments.
3,24 3,373,15 3,19
2,78 2,682,9 2,75
2,922,68
3,14 3,07
3,933,71
4,14 4,02
All Design Implementation Governance
Indonesia Vietnam Philippines Benchmark
POLICY EFFECTIVENESS REVIEW OF INNOVATION AND BUSINESS SUPPORT PROGRAMS
64
There was some heterogeneity in program quality among implementing ministries. Programs run by the Agency for the Creative Economy, the Agency for Implementation Technology, and the Ministry of Industry had the highest average scores for design, implementation, and governance. On the other hand, the Ministry of Agriculture and the Ministry of MSME had the lowest program quality scores.
5.3.1. Design
This section provides an analysis of program design aspects. It covers multiple metrics of program design ranging from empirical justification to the existence of a monitoring and evaluation system to measure the program success.
Figure 68. Average quality scores of instruments by ministry
Figure 69. Assessment scores for design quality criteria
Source: World Bank assessment.
Source: World Bank assessment.
Log frame, objective, output, and expected impactIn general, programs were well-constructed, with clearly stated objectives, outputs, and expected impacts. The average score for program design was 3.37 (out of 5). Most programs were equipped with basic logical frameworks that allow them to identify objectives and required inputs. In part, this reflects the strict TOR requirements (set by the Ministry of Finance) for each program—TORs must include the background context of the program, log frame, target beneficiaries, program outputs, timeline, and budget.
Despite the standardized program TOR requirements and availability of sample TOR templates, the assessor found that there were significant gaps between ministries in their capacity to produce quality TORs. As shown in
4,29 3,56 2,75 3,29 2,76 3,07
3,723,23
2,543,35
2,81 2,83
3,333,20
2,81
3,60
2,75 2,75
Agency ofCreativeEconomy
Agency ofImplementationTechnology
Ministry ofAgriculture
Ministry ofIndustry
Ministry ofMSME
Ministry ofResearch andTechnology
Design Implementation Governance
012345
Program Started
ProgramJustification
PortfolioRelationship
ProgramObjectives
LogicalFramework
Inputs
Activities
Products
Mainbeneficiaries
Audiences
AlternativeInstrument
ExpectedOutputs
and Impact
Selectioncriteria
Monitoring andEvaluation
Mean Median
65Part I: Portfolio Mapping, Assessment of Quality of Policy Mix, and Functional and Governance Review
Figure 70, the Agency for Creative Economy consistently performed better in program design than did other ministries. Instruments from this agency all included a proper log frame and detailed achievable objectives informed by lessons from prior program experience. The largest variation in design quality among ministries occurred in “Selection Criteria” and “Expected Outputs and Impact”. On both metrics, the Agency for Creative Economy performed the best while the Ministry of Agriculture and the Ministry of MSME performed the worst.
Program origin and justificationAll programs were directly linked to GoI priorities in their target sector. In designing a program, a program manager used the national medium and long-term strategy of GoI as guidance. For instance, the “Technopreneurship” program by the Ministry of MSME was directly linked to the GoI’s roadmap for creating 1 million new entrepreneurs in 5 years. Another example was the pilot program for improving the quality of salt produced by MSMEs, which was intended to support the national agenda to improve MSME productivity and promote downstream industries in Indonesia. With better salt quality, the byproducts of salt production could be used as inputs by manufacturing firms. The main design component was the lessons learned from implementation in previous years. These were due to weaknesses in M&E frameworks, which are discussed below in the section on implementation quality.
Many programs clearly identified the market failure they intended to address but did not quantify the magnitude of this failure, slightly lowering their average score on this criterion. The lack of information on the relative magnitude of the relevant market failure (e.g., expected welfare loss, number of affected firms) made it difficult to judge the relative contribution of the proposed instruments in addressing the market failure. For example, the “Technopreneurship” training from the Ministry of MSME did not have any specific quantitative evidence to support the program’s intervention rationale of the program, and justified its existence on the basis of anecdotal evidence about the emergence and importance of the digital economy in Indonesia.
Figure 70. Average score for design stage per ministry
Source: World Bank assessment.
0,0
0,2
0,4
0,6
0,8
1,0
1,2
0
1
2
3
4
5
ProgramStarted
ProgramJustification
PortfolioRelationship
ProgramObjectives
LogicalFramework
Inputs
Activities
Products
Mainbeneficiaries
Audiences
AlternativeInstrument
ExpectedOutputsand Impact
Selectioncriteria
MonitoringandEvaluation
Agency of Creative Economy
Agency of Implementation Technology
Ministry of Agriculture
Ministry of Industry
Ministry of MSME
Ministry of Research and Technology
Standard Deviation
POLICY EFFECTIVENESS REVIEW OF INNOVATION AND BUSINESS SUPPORT PROGRAMS
66
Monitoring and evaluation frameworkAlmost all programs had a monitoring and evaluation framework defined at the design (i.e. TOR) stage. However, these M&E frameworks mostly focused on output rather than outcome and impact indicators. For example, the M&E framework in the training program mainly tracked the number of participants rather than the outcomes (economic or social) of participation or user sentiment and feedback about the program. Due to these shortcoming, program implementors failed to gather the type of information needed to help them adjust or improve programs, and thus tended to implement very similar follow-up programs in subsequent years.
Alternative instrument and selection criterionIn the design dimension, the policy mix sample performed worst in the areas of identification of “alternative instruments” and “selection criterion”. The assessor found that there were no formal processes (e.g. cost-benefit analysis) for assessing policy priorities and evaluating possible alternative instruments. This is related to the lack of empirical evidence in most programs in Indonesia. Without any empirical evidence, the implementor had limited ability to compare the effectiveness of the proposed intervention against alternatives.
Similarly, many instrument implementors had limited selection criteria and low transparency, leading to mistargeting and limited coverage of the population. The responsibility for attracting high-quality participants—through project call and recruitment processes—was sometimes decentralized to district government teams, which were less qualified than the staff from implementing agencies. In many cases, these implementors did not verify the outsourced assessments, leading to the exclusion of high-quality candidates or multiple award winners (MAWs)—i.e. where some beneficiaries received support from multiple programs (thus limiting opportunities for others). In this sense, implementors were heavily dependent on the assessment result provided by the third party. Due to these shortcomings in the beneficiary selection, most programs had limited ability to achieve maximum impact.
Relationship to broader portfolioEach implementing unit was adequately aware of the existence of similar programs within the same ministry, but less so of similar programs in other ministries. In the design and planning process, each implementing unit (i.e. program owner) proposed lists of programs for the upcoming year to the planning (monitoring and evaluation) division. The Planning bureau within each ministry was responsible for assessing the feasibility of implementation of the proposed instruments and possible duplication with other proposed instruments. However, this duplication screening was not done across ministries. Despite efforts to synchronize programs, there were still several program duplications both within and across ministries (see section 4.4). One clear example of this was entrepreneurship and Technopreneurship training. The fact that there were two very similar programs within the same ministries already showed evidence of lack of familiarity of the similar program within the same ministry. Furthermore, multiple ministries also offered similar entrepreneurship program in Indonesia.
5.3.2. Implementation
This section assesses the implementation aspects of sampled programs. It covers a wide range in program implementation that includes among other things: project calls, learning from implementation, and time frame program application.
67Part I: Portfolio Mapping, Assessment of Quality of Policy Mix, and Functional and Governance Review
and strategies and looked rather redundant over their years of implementation. A program such as entrepreneurship training by the Ministry of MSME had been implemented since 2009 yet there were limited lessons incorporated over these years of implementation. However, a few programs introduced innovation and new features in the design and implementation of the program in the following years (e.g. using social media for advertising). For example, BEKUP (BEKRAF for pre-start-up) from the Agency of Creative Economy changed its recruitment and advertising strategy in 2019. Unlike the previous year’s implementation, in 2019, ACE reduced the number of training locations and advertised the activities through social media and collaborated with universities. The selection criteria were also announced publicly.
Project calls and selection during implementationThe use of public information channels to disseminate program documentation and project calls was limited. Program information (e.g. eligibility criteria for beneficiaries and the number of funds awarded) was not freely available on the public access website. Furthermore, implementors rarely used public dissemination channels such as ministry websites to advertise project calls and share information about program features. Instead, they preferred to use formal and informal networking channels. For example, recruitment processes often relied on connections with associations and other government institutions.30 Consequently, programs ended up covering only small segments of the potential beneficiary population, and candidates who were not well-connected tended to be ignored. Due to this selection choice, the take-up rate of the program and overall quality of participants was low, and good candidates were excluded due to limited information on the program’s calls. Collectively, these outcomes likely limited (and will limit) the ultimate impact of these programs.
30 Unlike BEKUP, which started to use social media as media for disseminating the program, the Ministry of MSME program that facilitates access to bank lending for firms still relied on district government for information distribution
Figure 71. Assessment scores for implementation quality criteria
Source: World Bank assessment.
Program ClosureIn the implementation stage, programs performed well in program closure. As a regulatory requirement, all programs must submit a completion report by the end of each fiscal year. Due to this rigid regulation from the GoI, all programs had adequate closure documentation (i.e. each program manager submitted a written report on the result of the program). What was missing from this report was feedback from beneficiaries, which is critical for both program evaluation and program improvements in subsequent implementation cycles.
Mechanisms for program adjustmentMechanisms for program learning and adjustments are weak. Lack of feedback from beneficiaries led to limited program improvement for subsequent program implementation. Indeed, the assessor found that many ministries were implementing the same programs for several years with limited change throughout their lifespan. Many programs exhibited very similar designs, mechanisms,
012345
Mean Median
Projects calls andProducts
Eligibility andselection during
the program
Time frameprogram
application
Programdatabase and
information
Program closure
Budget andfinancial resourcesProgram
management andorganization quality
Roles andAutonomy
Sta�, trainingand incentives
Incentives
Processmonitoring
Learning evidence during implementation
M&E
POLICY EFFECTIVENESS REVIEW OF INNOVATION AND BUSINESS SUPPORT PROGRAMS
68
Selection processes were poorly implemented. Due to the limited project call and information dissemination, the application rates were rather low. More specifically, selection processes did not employ a clear scoring basis and measurable indicators, and information on candidate backgrounds was not thoroughly analyzed. Results were also not announced publicly. Along with these shortcomings in the selection process, successful candidates and the amount of funding assigned to them were not regularly disclosed.
Program Database and Management Information SystemWhile program documentation is available, there was a limited Management Information System. Not all programs were saved in the integrated folder and well-documented in a specific catalog. For instance, the database of programs and participants was not well maintained, leading to difficulties in impact evaluation after a program is terminated. Availability of such information could help implementors avoid creating duplicative or overlapping programs. The information obtained from beneficiaries at the end of the program was also limited. Ideally, there should be some follow-up after a program ends, to reflect on lessons learned and measure the impact of the program. In the absence of such impact evaluations, the effectiveness and efficiency of programs remained unknown.
Furthermore, there is no integrated digital database to manage applications and beneficiaries that can be used for project management or that can be shared within and across institutions. The Agency for Creative Economy already initiated a large database of information on many players in creative economy. This database can be accessed by other program managers within Agency for Creative Economy. However, our conclusion was that this case was the exception, and not the norm. Building a database is necessary to support program integration across all instruments and agencies. Project managers should be able to readily find information on applicants, including whether they have received support from similar programs, or whether they have submitted proposals in the past. The database should not only provide a mechanism for cross examination of prospective beneficiaries but also deliver a way to refer good candidates to other complementary programs (i.e. targeting firms at a different stage in the business life cycle). In addition, we found that open data sources that could be useful for program design and implementation are not made available, even within government agencies.
Monitoring and Evaluation (M&E) including Process MonitoringMonitoring and evaluation (M&E) systems were implemented but were not designed to properly measure the impact of the program. The limited Management Information Management Systems led to low M&E quality. Furthermore, there was no dedicated evaluation units within ministries and M&E roles were scattered among several units.31 Ideally, this M&E activity would track implementation progress and would be used to provide progress updates to stakeholders and to prepare a final evaluation report. However, in practice, the M&E team focused primarily on accountability. Only a few programs had some empirical evidence showing the effectiveness of their intervention on expected outcomes. One of the notable examples was BEKRAF for pre-startups. The Ministry of MSME access to finance program relied on the KUR program’s MIS system for information on whether applicants had received KUR assistance.
Lack of empirical justification led to the inability to benchmark the financial aspects of the project. As discussed above, a clear empirical justification of programs and an understanding of their objectives were often missing. Due to this limitation, program budgets might not be optimally scaled and allocated, as it is difficult to measure whether programs meet certain standards for value-for-money (e.g. on a rational cost basis).
31 M&E was regularly conducted by internal units (i.e. program’s implementors). In some cases, it was also conducted by Secretariat General Division (Setjen) in ministries, by the Planning division, or by the Research and Development Division.
69Part I: Portfolio Mapping, Assessment of Quality of Policy Mix, and Functional and Governance Review
Budget, staff, incentive, and trainingBudget allocations for program staffing were generally insufficient, requiring sharing of human resources across programs. Assessor found that there is no specific budget allocated for staffing. Due to this absence, the program implementor could not recruit a professional manager for the programs. Therefore, in most cases, staff members were shared across multiple programs, resulting in work overload that can compromise the quality of implementation. In particular, greater focus is given to administrative issues rather than essential program activities.
Almost all program managers and the majority of program implementors were civil servants. Of 21 instruments, BEKAP was the only program with a non-civil servant program manager. The ability to recruit professional program managers might have an impact on the quality of programs. The compensation scheme for these teams followed the regulation of the Ministry of Finance. There was some performance-based component in salary calculations, but in practice, it was simply based on job-level (e.g., director or manager) and attendance rate. Staff performance in a program was only relevant for promotion to a higher job-level.
There was no training for staff to improve their program management capabilities. Any staff training that existed was the mandatory advancement training for civil servants. This training focuses on helping staff achieve grade and job promotions but is not related to their specific program duties nor their performance in the program.
Heterogeneity between ministriesAs was the case with program design quality, there was also notable heterogeneity in implementation quality among ministries. The Agency for Creative Economy had the highest implementation quality score, while the Ministry of Agriculture had the lowest. The largest range of scores was in the in-process monitoring and eligibility and selection criteria.
Figure 72. Average implementation quality score by Ministry
Source: World Bank assessment.
0
1
2
3
4
5
Learning evidenceduringimplementation
Projects callsand Products
Eligibility andselection duringthe program
Time frameprogramapplication
Programdatabase andinformation
Programclosure
Budget an financialresources
Programmanagementand organizationquality
Roles andAutonomy
Sta�, trainingand incentives
Incentives
Processmonitoring
M&E
Agency of Creative Economy
Agency of Implementation Technology
Ministry of Agriculture
Ministry of Industry
Ministry of MSME
Ministry of Research and Technology
Standard Deviation
0,0
0,2
0,4
0,6
0,8
1,0
1,2
POLICY EFFECTIVENESS REVIEW OF INNOVATION AND BUSINESS SUPPORT PROGRAMS
70
5.3.3. Governance
Formal coordination among key stakeholders was absent. The overall average score quality of governance was relatively low—around 3.15 (out of 5). Due to the considerable overlap among programs, inter-agency communication played a critical role in coordinating and synchronizing programs. The assessor observed that communication among stakeholders was rather informal and no clear division of roles was specified.
Figure 73. Assessment scores for governance quality criteria
Figure 74. Average score for governance stage per ministry
Source: World Bank assessment.
Source: World Bank assessment.
This result is consistent with the findings of the redundancy analysis in section 4.4. Duplication of activities occurred both within the same ministry and between different ministries. Lack of formal coordination, both between ministries and between General Directorates within the same ministry, resulted in multiple duplications, as shown in section 4.4.
In contrast to design and implementation quality scores, there was little variation in scores for the different aspects of governance quality. Within the four governance indicators, the highest variance occurred in the program relationship scores. The Agency of Implementation of Technology and the Ministry of Industry performed well in this component, with an average score of 4.0. On the other hand, Ministry of SME and Ministry of Agriculture has the lowest scores.
1
2
3
4
5
ProgramsRelationship
InstitutionsRelationship
Jurisdictions and programsfunctionality coordination
Jurisdictionsand outside
coordination
Mean Median
0
0,1
0,2
0,3
0,4
0,5
0,6
0,7
0,5
1,5
2,5
3,5
4,5
ProgramsRelationship
InstitutionsRelationship
Jurisdictions andprograms functionality
coordination
Jurisdictions andoutside coordination
Agency of Creative Economy
Agency of Implementation Technology
Ministry of Agriculture
Ministry of Industry
Ministry of MSME
Ministry of Research and Technology
Standard Deviation
71Part I: Portfolio Mapping, Assessment of Quality of Policy Mix, and Functional and Governance Review
5.4. RECOMMENDATIONS
The key suggested changes and improvements based on the above functional and governance analysis are presented in this section. They are organized by the three key dimensions of analyzed quality: design, implementation, and governance.
Table 9. Recommendations to improve functional and governance quality
Quality dimension Proposed action or measure
Responsible stakeholder(s)
Design Improve the quality of the program Terms of Reference template required by the Ministry of Finance by including the following components:
• Explicitly state the root causes of the problem or market failure that is intended to be addressed using the instrument(s);
• Evidence to determine the scope and magnitude of the identified problems.; • Justification of the selection of mechanisms of intervention relative to potential alternatives (including relative cost-benefit analysis);
• Lessons learned from prior experience with same or similar programs, and, where relevant, from international experience;
• The GoI can learn from international best practices on TOR, theory of change and log frame formulation.
Ministry of Finance, Bappenas
Enforce adherence to TOR guidelines for all programs, potentially through penalties for non-com-pliant TORs; Alternatively, The GoI can introduce a ‘rulebook,” guidelines or operation manuals;
Provide training for staff mandated with program design on how to define theories of changes and design logical frameworks, including the formulation of inputs/activities, outputs, and outcomes. Bappenas
Improve program M&E frameworks by including measurable indicators on program impacts, specific protocols laying out sources of monitoring and evaluation data, the definition of indicators, respon-sibility for collecting and collating the data, and frequency for tabulating the data. Provide specific training to facilitate the adoption of the proposed frameworks.
Bappenas and Coordinating Ministry of Economic Affairs
Implementation Prioritize program evaluation, especially for those programs either using high levels of financial resources or being expected to achieve the largest impact. This is key to improve effectiveness. Project sponsors also need to establish as mandatory the use of M&E frameworks with harmonized and measurable indicators. This may require the creation of an evaluation office in the key Ministries with the mandate to collect and systematize this information and support agencies with design and implementation of M&E frameworks.
Bappenas and Coordinating Ministry of Economic Affairs
Establish formal program review processes and mechanisms for learning from implementation (e.g. surveys of program beneficiaries), ideally at regular intervals during the implementation phase and not only when programs are closing. Results from these surveys could be used to inform decisions for course correcting activities, amending design features of the programs, and evaluating the performance of local contractors and implementing partners. Mid-term review exercises should be introduced systematically, with the participation of different stakeholders. These review processes should allow for flexibility to modify previous M&E frameworks and make other necessary adjust-ments. All the information should be codified to ensure institutional memory, and to ensure that newcomers understand the context of program adjustments.
Establish a specific website (a dedicated page within the ministry website) on each program. At a minimum, this webpage should contain information on the program, basic information on project calls, progress reports, and completion reports. This can also be used to disseminate information to the public on the program. Further advertising can be done on social media or other public to ensure equal awareness and opportunities for participation by potential beneficiaries.
Strengthen eligibility and selection of program participants/beneficiaries, in particular by reducing the reliance on contracted third-party agents to conduct these assessments; at the minimum, the work and recommendations of these third-party providers should be reviewed closely and not automatically adopted.
POLICY EFFECTIVENESS REVIEW OF INNOVATION AND BUSINESS SUPPORT PROGRAMS
72
Quality dimension Proposed action or measure
Responsible stakeholder(s)
Implementation Increase transparency of beneficiary selection decisions and the funding amounts awarded, in part by regularly publishing this information through the dedicated website.
Bappenas and Coordinating Ministry of Economic Affairs
Ensure that information on all programs and beneficiaries is properly recorded in an integrated database to facilitate comparative analysis of program performance and enable impact evaluations.
Develop an integrated database that can be accessed by all relevant ministries. This can be done through an integrated IT system that collects program information from the application stage through the duration of implementation. In the last two years, several OECD countries have begun to develop digital science and innovation policy (DSIP) initiatives32. These DSIP systems have been used by policy practitioners to design, implement, monitor, and evaluate STI policies. A digital platform can connect data collected by different agencies, providing greater context to policy problems and interventions, and offering possibilities for a more integrated interagency policy design at the research or innovation system level. Introducing a centralized digital monitoring and evaluation system can also make avail-able real-time policy output data to inform timely program adjustments.
Coordinating Ministry of Economic Affairs
Increase staffing for program management to alleviate current workload pressures that result in poor implementation quality control; improve the process of allocating staff to programs by better matching their skills to the needs of assignments (in contrast to the current focus on satisfying staffing ratios). The GoI should also consider hiring professional program managers, at least for some of the more major programs with large budgets.
Bappenas and Coordinating Ministry of Economic Affairs
Governance Improve program collaboration and communication with other ministries and/or relevant private sector partners, both in the design and implementation stages. This formal collaboration can be done by creating technical working groups and communities of practices involving multiple institutions around critical topics. Some relevant issues are promoting productivity, supporting early-stage digi-tal innovative firms’ formation and growth, and fostering university-industry linkages. In the design stage, this working group can help ensure limited duplication among programs and crowding out of similar initiatives by the private sector. This working group can also help design the best approaches to address identified market failures. Furthermore, this working group should focus on integrating program databases and implementing robust M&E systems.
Bappenas and Coordinating Ministry of Economic Affairs, National Research and Innovation Agency (BRIN)
Improve the capacity of the newly-formed National Research and Innovation Agency (BRIN). This new institution can learn from the operating models and best practices of similar institutions in other countries. As first step, knowledge exchange sessions can be organized with international experts and/or senior management of similar institution in other countries, particularly those at a similar income level as Indonesia and with national innovation ecosystems at a similar stage of development.
National Research and Innovation Agency (BRIN)
32 General overview can be seen at https://www.innovationpolicyplatform.org/www.innovationpolicyplatform.org/digital-science-and-innovation-policy-and-governance-dsip/index.html. Evaluation of DCIP initiative in Norway can be found using following link: http://www.oecd.org/officialdocuments/publicdisplaydocumentpdf/?cote=DSTI/STP(2019)13/FINAL&docLanguage=En
73Part I: Portfolio Mapping, Assessment of Quality of Policy Mix, and Functional and Governance Review
As with the earlier recommendations on the substance and configuration of the policy mix instruments, a prioritization of the above measures to improve functional and governance quality is presented in Table 10, based on their approximate relative costs and timeframes of implementation. Measures assessed to be implementable within a short timeframe and at relatively low or medium cost can be viewed as high-priority for enactment. These include: (i) various administrative and IT enhancements (e.g. improving program TOR templates, beneficiary assessments, program websites); (ii) capacity building activities—training to program staff on M&E capabilities, and knowledge exchange session with international experts; and (iii) collaboration mechanisms for improved inter-agency collaboration (e.g. working groups and communities of practice). Some other key measures that are relatively low and medium-cost but would require more time to enact (and thus somewhat lower-priority) include the improvement of program M&E and review processes and impact evaluations, and the development of integrated databases for program information. In contrast, actions that entail increasing program staff at ministries/agencies and creating new departmental units would have a higher administrative cost attached and are likely to be feasible only over the medium-term.
Table 10. Prioritization of recommendations to improve quality of program design, implementation and governanceTimeframe of implementation
Short-term Medium-term
Relat
ive co
st (m
onet
ary a
nd ad
minis
trativ
e) an
d eas
e of im
pleme
ntat
ion
Low
• Improve the capacity of the newly-formed National Research and Innovation Agency (BRIN) via knowledge exchanges with international experts.
• Improve the quality of the program Terms of Reference template required by the Ministry of Finance.
• Strengthen eligibility and selection of program participants/beneficiaries, in particular by reducing the reliance on contracted third-party agents to conduct these assessments.
• Improve program collaboration and communication with other ministries and/or relevant private sector partners through cre-ation of technical working groups and communities of practices.
Develop an integrated database of programs and beneficiaries that can be accessed by all relevant ministries.
Medium
• Provide training for staff mandated with program design on how to define theories of changes and design logical frame-works, including the formulation of inputs/activities, outputs, and outcomes.
• Establish a specific website (a dedicated page within the ministry website) on each program and publish information on beneficiary selection.
Improve program M&E frameworks and establish formal program review processes (e.g. mid-term reviews) and mechanisms for learning from implementation, including impact evaluations.
High
• Create an evaluation office in key Ministries with the mandate to collect program impact information and support agencies with design and implementation of M&E frameworks.
• Increase staffing for program management to alleviate current workload pressures that result in poor implementation quality control.
POLICY EFFECTIVENESS REVIEW OF INNOVATION AND BUSINESS SUPPORT PROGRAMS
74
References
Cali, M., Cicowiez, M., Doarest, A., Hidayat, T., Sharma, D. (2021). “The Economic Impact of Investment Provisions: Evidence from Indonesia” mimeo.
Cali, M., Doarest, A., Presidente, G. (2020). “The Impact of Foreign Entry and Competition in a Developing Country: Plant-level Evidence from Indonesia,” mimeo.
Cirera, X. and Maloney, W. (2017). The Innovation Paradox: Developing Country Capabilities and the Unrealized Promise of Technological Catch-up. Washington, DC: World Bank.
Cirera, X., Mason, A.D, de Nicola, F., Kuriakose, S., Mare, D., & Thu Tran, T. (2021). The Innovation Imperative for Developing East Asia. World Bank East Asia and Pacific Regional Report. Washington, DC: World Bank.
Comin, D. and Hobijn, B. (2010). An Exploration of Technology Diffusion. American Economic Review, 100 (5).
Cusolito, A.P, & Maloney, W. (2018). Productivity Revisited: Shifting Paradigms in Analysis and Policy. Overview booklet. World Bank, Washington, DC.
De Loecker, J., & Eeckhout, J. (2018). Global Market Power. Working Paper No. 24768, National Bureau of Economic Research.
De Loecker, J., Goldberg, P. K., Khandelwal, A. K., & Pavcnik, N. (2016). Prices, markups, and trade reform. Econometrica, 84(2), 445-510.
Deaton (1989). “Rice Prices and Income Distribution in Thailand: A Non-Parametric Analysis”. The Economic Journal 99 (395):1-37
Fisman, R. (2001). Estimating the Value of Political Connections. American Economic Review, 91(4).
Foster, C., Haltiwanger, J. & Krizan, C.J. (2001). Aggregate Productivity Growth: Lessons from Microeconomic Evidence. Studies in Income and Wealth (63). National Bureau of Economic Research.
Global Trade Alert https://www.globaltradealert.org/data_extraction (accessed 1 November 2018)
Global Innovation Index (2020). http://www.globalinnovationindex.org.
Gomez-Mera and Hollweg (2018). Firm Performance and Constraints in Indonesia. Unpublished Paper.
Government of Indonesia (2019). Medium-term Development Plan 2020-2024 (RPJMN).
Griliches, Z. (1998). R&D and Productivity: The Econometric Evidence. University of Chicago Press.
Hall. B (2011). Innovation and Productivity. Working Paper No. 17178, National Bureau of Economic Research.
75Part I: Portfolio Mapping, Assessment of Quality of Policy Mix, and Functional and Governance Review
Indonesia National Research Master Plan 2017-2045.
Indonesia Family Life Survey, various years.
Ivaldi, M., Jenny, F. and Khimich, A. (2016). Cartel Damages to the Economy: An Assessment for Developing Countries. In: Competition Law Enforcement in the BRICS and in Developing Countries. Legal and Economic Aspects. 1st ed. Springer, pp. 103-133.
Jiangtao, F., Daichi, S and T. Yasuyuki (2015). Can Firms with Political Connections Borrow More Than Those Without? Evidence from firm-level data for Indonesia. RIETI Discussion Paper Series 15-E-087.
Kochanova, A., Rijkers, B., and Hallward-Driemeier, M. (2018). Does Cronyism Curtail Competition? Evidence from Indonesia. Jakarta: World Bank.
Maloney, W. and Nayyar, G. (2018). Industrial Policy, Information, and Government Capacity. Published by Oxford University Press on behalf of the World Bank.
Mobarak, A. M., and Purbasari, D. P. (2006). Corrupt protection for sale to firms: evidence from Indonesia. Working Paper, University of Colorado at Boulder.
Mohnen, P. and Hall, B. (2013). Innovation and Productivity: An Update. Eurasian Business Review, 3(1).
Rijkers, B., Arouri, H., and Baghdadi, L. (2017). Are Politically Connected Firms More Likely to Evade Taxes? Evidence from Tunisia. The World Bank Economic Review, 30(Supplement_1), S166-S175.
SCImago. (2007). SJR — SCImago Journal & Country Rank. https://www.scimagojr.com/
DailySocial (2019). Start-up Report 2019: Scaling Through Technology Democratization. https://dailysocial.id/post/laporan-startup-report-2019
World Bank Enterprise Survey, various years. http://www.enterprisesurveys.org
World Bank (2018a). Quality of the Policy Mix, Internal Guidance Note.
World Bank (2018b). Country Private Sector Diagnostic, 2019.
World Bank (2018b). Indonesia Economic Quarterly: Strengthening Competitiveness. December 2018.
World Bank (2020), Vietnam: Science, Technology and Innovation Report: Policy Effectiveness Review (PER) – vol. III. June 2020.
World Bank (2021). COVID-19 Business Pulse Surveys, various months.
POLICY EFFECTIVENESS REVIEW OF INNOVATION AND BUSINESS SUPPORT PROGRAMS
76
Annex 1.TARGET OUTPUTS AND INDICATORS FOR PRODUCTIVITY AND INNOVATION-RELATED STRATEGIC PROGRAMS IN RPJMN 2020-2024
Strategic pillar on human capital development
Objective Indicator Baseline (2019) Target 2024
I. Development of human resources for higher-quality research
Percentage of educated workforce middle to upper (%) 43.7 49.8Proportion of workers working in the field medium and high skills (%) 40.6 43.1Percentage of vocational education graduates who are get a job within 1 year after graduation (%)
46.6 52.6
Number of vocational training graduates (million people) 0.78 2.8Percentage of PT graduates who work immediately within 1 year after graduation (%)
64.3 66.7
Percentage of Science and Technology Human Resources with Doctoral qualifications
14.08 20
The number of universities that enter the World Class University List:a. Top 200b. Top 300c. Top 500
-12
123
II. Increasing the science and technology orientation of applied research
Number of scientific publications and citations in journals International:a. Number of International Publications (Articles)b. Number of citations in international journals
14.60631,159
38,58659,770
Innovative products and research products of National Research Priority that are produced
- 40
Application of technology to support sustainable development:a. Application of technology for sustainability utilization of natural resourcesb. Application of technology for prevention and post-disaster mitigation
1235
2435
III. Strengthening infrastructure and support services for technology commercialization
Number of Prototypes from Higher Education 94 304The number of registered IP from the results of R&D College 762 1,812The number of innovative products from Technology-Based Startup Company (PPBT) tenants that were fostered
143 700
The number of innovative products utilized by industry / business entity 52 210Patent Applications that meet the requirements for KI formal administration (Domestic)
1,362 3,000
Patent granting (Domestic) 790 1,000Centers of Excellence in Science and Technology were established 81 138The number of strategic science and technology infrastructure developed 6 10The number of strategic STPs developed is up to fully operational:a. College Basedb. Non-College Based
451728
853
IV. Improving the quality of R&D spending
R&D expenditures (share of GDP) 0.25 0.42Number of R & D institutions that are accredited (active) 48 75
Source: Government of Indonesia (2019)
77Part I: Portfolio Mapping, Assessment of Quality of Policy Mix, and Functional and Governance Review
I.1 Increase partnership between MSMEs and large enterprise
Share of small/medium partnership (Percent) 8.1 10.5
I.2 Capacity building and financing for entrepreneurs
Contribution of MSMEs to GDP 57.2 65Share of MSMEs with access to formal financial institution (Percent)
24.7 30.8
Share of MSMEs credit to total bank credit (Percent)
19.7 22
Share of small/medium to credit (Percent) 2.4 5Share of KUR in production sector (Percent)
50.4 80
I.3 Development of start-up invention and business opportunities
National entrepreneurship ratio (Percent) 3.3 3.9Number of operating small/medium centers outside Java (cumulative)
22 30
Share of small/medium value added to total value added industry (Percent)
18.5 20
Startup growth (unit) 748 3,500 (kumulatif)
II. Increase in added value-added, employment, and investment in the real sector, and industrialization
II.1 Increasing the integrated upstream-downstream agricultural, maritime and non-agro-based processing industries
GDP growth in the food and beverage industry subsector (Percent)
- 8,57-8,79
Contribution of Industrial GDP Processing (9.2.1 *) (Percent)
19.9 21.0
GDP growth of non-oil and gas processing industry (Percent)
4.5 8.4
II.2 Increasing industrialization based on downstream natural resources, including through the development of smelters and industrial estates, especially outside Java
Number of Industrial Estates (KI) and Special Economic Zone (KEK) facilitated outside Java (Industrial KI-KEK)
- 16 KI - 8 KEK
II.4 Increase the value-added and competitiveness of creative products and businesses and digital
Creative economy GDP growth (Percent) 5,45-6,10Information and telecommunication GDP growth (District / city)
9.3 11.2
Number of creative districts / cities developed (districts / cities)
20 20
Number of creative areas and clusters developed (Location)
- 11.0
Revitalizing creative space (Unit, cumulative)
39 154
IPR-based financing scheme (Scheme) 0 1.0II.5 Improved business climate and increased investment, including labor reform
The ranking of ease of doing business in Indonesia (EODB Ranking) is shown, among others, by the increasing indicators of starting a business:a. number of proceduresb. Time (Ranking EoDB)
73
11 procedures5 days
towards 40
5 procedures4 days
Realized Value of FDI and Domestic Investment (IDR Trillion)
792 1,500.0
Contribution of Domestic Investment to the total realization of FDI and Domestic Investment (Percent)
47.1 49.5
Realized value of FDI and Domestic Investment in the processing industry (IDR Trillion)
198 782
Contribution to the realization of investment outside Java (Percent)
45.1 49.7
Application of Electronically Integrated Business Licensing (Central and district agencies)
- Done
II.6 Development of the halal industry
Facilitated Industrial Estate (Number of Industrial Estates)
1 3.0
POLICY EFFECTIVENESS REVIEW OF INNOVATION AND BUSINESS SUPPORT PROGRAMS
Industrial products that get TKDN certificate (Products per year)
6,097 8,400.0
Number of domestic tourists (Million trips)
303.4 350-400
III.5 Increased Participation in Global Production Networks
Number of priority sectors facilitated by investment in global production networks (Sectors)
- 5.0
IV. Strengthening the pillars of growth and Economic Competitiveness
IV.2: Optimizing the Use of Digital Technology and Industry 4.0
Contribution of the digital economy (Percent)
2.5 4.7
E-commerce transaction value (Rp Trillion)
170 600.0
Number of creative actors facilitated by ICT infrastructure (People)
- 7,500.0
IV.3: Logistics System Improvement and Price Stability
Logistic Performance Index Score 3.1 3.5Inflation rate (Percent) 2.7 2.7
IV.4 Increasing the Application of Sustainable Practices in the Processing and Tourism Industry
Number of companies applying SNI ISO 14001 certification (Company)
- 5,000.0
Number of locations for implementing sustainable tourism development (Location)
12 22.0
Source: Government of Indonesia (2019)
79Part I: Portfolio Mapping, Assessment of Quality of Policy Mix, and Functional and Governance Review
Annex 2.BACKGROUND CONTEXT ON MSMES IN INDONESIA
The private (and state-owned corporate) sector in Indonesia is dominated by micro, small and medium enterprises (MSMEs) in terms of number of firms and contribution to employment.33 According to the economic census definition of firms outside agriculture and public administration, more than 89 percent of firms have less than 5 workers (micro), 9 percent have between 5 and 19 workers (small) and less than 2 percent have 20 workers or more (Table 2.1). While they account for more than 98 percent of total firms, micro and small firms employ 76 percent of total Indonesian workers outside agriculture and public administration (54 million people). Eighty percent of the firms are concentrated in Sumatera and Java island.
Despite being numerous and employing the majority of Indonesia’s workers, MSMEs contribute a relatively smaller share to GDP. Since 2000, the contribution of MSMEs to the total economy has been hovering at around 54-57% annually, and most recently stood at 57.1% in 2019.34
There is limited knowledge on the dynamics of these micro firms. Despite their importance, we have very limited knowledge of the dynamics of micro and small firms in Indonesia. Indonesia does not have panel data that allow us to properly evaluate the evolution of the performance of these private sectors. We only have partial non-panel data on micro and small firms in some sectors such as the manufacturing, which constitutes only a small proportion of total micro and small firms in Indonesia (16.81%). This is far below the proportion of micro firms in tradable sectors (around 45%). Other panel information such that the World Bank Enterprise Survey also excludes micro firms.
Labor statistics can be used as a proxy of micro firms. In the absence of panel data of micro-firms, we must rely on other statistics as a proxy for micro-firms. One alternative is to use labor statistics. Based on the distribution of employment based on job status and size distribution as shown in table below, the total number of self-employed and self-employed with temporary workers is very similar to the total number of micro firms. Meanwhile, the total number of self-employed individuals with the permanent worker is very similar to the total number of small, medium and large firms based on the economic census 2016. To get a better approximation, we then combine the self-employed status and self-employed with temp workers into one category.
33 In the report, the private sector also incorporates the SOEs. First, SOEs typically operate as corporate entities often with some profit objectives like those of the purely private firms. Second, SOEs and private sector firms often exert a similar influence on policy-making.
34 Ministry of Cooperatives and SME.
Distribution of firms by size (outside agriculture and public administration)
Size Definition No. of firms firms % Employment Employment %
Micro Total labor < 5 23,864,230 89.34 41,032,298 58.35
Small 5 < Total labor < 20 2,399,419 8.98 12,609,226 17.93
Medium19 < Total labor < 100 412,208 1.54 8,132,148 11.56
Large Total labor > 99 35,144 0.13 8,546,794 12.15
26,711,001 100 70,320,466 100
Source: 2016 Economic Census by Indonesia Statistics (Badan Pusat Statistik, BPS)
POLICY EFFECTIVENESS REVIEW OF INNOVATION AND BUSINESS SUPPORT PROGRAMS
80
The majority of self-employed and self-employed with temporary workers are non-dynamics entrepreneur. Using the Indonesia Family Life Survey (IFLS) from three waves (2000, 2007 and 2014), we found that most of these self-employed remain in this category (self-employed with temp worker) after 14 years. Specifically, 71.59% of self-employed in 2000 remains to be self-employed with a temporary worker. Only 2.63% of those self employed with or without temp worker in 2000 improve the business such that they hire permanent workers. Meanwhile, the rest of the self-employed in 2000, switched back to paid employment in 2007. These dynamics of self-employed also occurred between 2007 and 2014. In total, between 2000 and 2014, 69.18% of self-employed in 2000 remained self-employed in 2014. Consistently around 3.23% improved the business in 2014. The other big proportion, around 27.59%, switched back into paid employment in 2014.
Source: Indonesia Family Life Surveys (IFLS).Note: Data from Indonesia Family Life Survey (IFLS), 2000, 2007, 2014. We merged self-employed with self-employed temp worker
Distribution of Workers based on employment Status in 2016 (Labor Statistics 2016) and Firms size based on Economic Census 2016
Self-employed with the permanent worker(s) 3,293,590 2,399,419.0 Small Firms412,208.0 Medium Firms
35,144.0 Large Firms
Employee 42,603,431
The casual worker in the agricultural sector 42,603,431
The casual worker in the non-agricultural sector 6,965,506
Unpaid family worker 5,748,434
Sources: Indonesia Labor Statistics, 2016 and Economic Census 2016.
2000
Self-employed with unpaid/family workers 6,828 individuals
200771.59% remained self-employed with unpaid/family workers
2014 • 80.88% remained self-employed with unpaid/family workers
• 2.96% switched to self-employed with permanent workers
• 16.16% switched to worker
2.63% switched to self-employed with permanent workers
25.77%switched to worker
• 56.47% switched back to self-employed with unpaid/family workers
• 29.41% remains self-employed with permanent workers
• 14.11% switched to worker
• 41.92% switched back to self-employed with unpaid/family workers
• 29.41% switched back to self-employed with permanent workers
• 14.11% remained worker
Dynamics of self-employed 2000-2007-2014
81Part I: Portfolio Mapping, Assessment of Quality of Policy Mix, and Functional and Governance Review
Some of this dynamic can be explained by the initial endowment of self-employed individuals. The figures below present the median initial income and mean years of schooling of self-employed individuals. The left figure presents the median initial income (2000) and final income (2014) based on the dynamics of self-employed. The improved sell-employed have the highest initial median income. The median income of the other two remaining status is roughly similar. In 2014, the self-employed with permanent workers experienced the highest growth of median income. The self-employed who chose to revert to paid employment status experience the second-highest income growth. Meanwhile, the undynamic self-employed has the lowest income growth from 2000 to 2014.
The improved self-employed individuals also have higher median years of schooling. The right chart below presents the mean years of schooling of self-employed based on their dynamism between 2000 and 2014. The improved self-employed have the highest years of schooling. On average, these self-employed spent three more years in education that that of the undynamic self-employed. They also spent two more years in school than that of the ones that switched back into paid employment. Furthermore, the undynamic self-employed have the least years of schooling.
In summary, only a fraction of these micro and small businesses can be considered as “firms”, while the rest can be referred to as own-account workers with low average productivity and incomes. Based on the 2016 Census and Labor Force Survey data, it was estimated that out of 26.7 million Census firms in Indonesia, 23 million are own-account workers either with no workers (the majority) or a handful of temporary, unpaid or family workers. They are concentrated mainly in non-tradable services sectors. Their income is typically low, about half of the median employees’ wage in 2018, indicating that they are involved in relatively unproductive activities using less sophisticated technologies (for example, two- and three-wheeler taxi services, street vendors, independent trash collectors). As a result, some of these self-employed businesses are more likely to transition into wage employment rather than to expand their businesses.35 In spite of the prevalence of the small-scale activities, at 24.1 percent of the economy, the informal sector in Indonesia is smaller than its peers, such as Malaysia (31.4 percent) and the Philippines (39.3 percent) (Medina and Schneider 2018).36
35 Indonesian Family Life Survey (IFLS) data suggest that around 11 percent of self-employed in 2007 had become wage employee by 2014, and 13.3 percent switched to casual and family workers. On the other hand, only 3.2 percent of self-employed in 2007 had hired permanent workers by 2014. Median monthly nominal profit of these expanding self-employed individuals increased from Rp 900,000 in 2007 to Rp 3,000,000 in 2014.
36 However, the national labor force survey (2015) estimates that the informal economy employs over 50 percent of the labor force, and over 70 percent of the labor force are in rural areas. These informal firms are largely micro and small enterprises, are less productive, and pay lower wages than firms in the formal sector (Rothenberg et al. 2016).
Characteristics of self-employed
Source: Indonesia Family Life Surveys (IFLS)
Self employed in 2000 and worker in 2014
Self employed in 2000 and Self employedwith permanent worker in 2014
Self employed in 2000 and 2014
Mean school years by status in 2000 and 2014Median income by status in 2000 and 2014
500,000 2,500,0001,500,000 65 9870 4321
27.59 %Self employed
in 2000 andworker in 2014
3.23 %
Self employed in 2000and Self employed
with permanenworker in 2014
69.18%Self employedin 2000 and 2014
% to Self Employed in 2000 (RHS)Median monthly income 2014Median monthly income 2000
POLICY EFFECTIVENESS REVIEW OF INNOVATION AND BUSINESS SUPPORT PROGRAMS
82
Annex 3.LIST OF INSTRUMENTS IN THE POLICY MIX
Instrument’s Name Imple-menting agency
Code Budget allocation
in 2018 (Million IDR)
Access to Capital from Non-Banking sector to Creative Economy Players MOTCE MOTCE_1 20,218Capacity Building for creative economy researchers MOTCE MOTCE_2 6,000Big Data creative economy MOTCE MOTCE_3 900Facilitating Business Agreements for access to international market MOTCE MOTCE_4 2,225Facilitating Professional Certification in the Creative Economy MOTCE MOTCE_5 1,000Facilitated Pre-Start Up MOTCE MOTCE_6 6,485Facilitation IPR Consultation for Creative Economy actors MOTCE MOTCE_7 1,500Creative Economy Players Facilitated by Physical Infrastructure MOTCE MOTCE_8 3,500Policy on access to capital for the creative economy in the Banking Sector MOTCE MOTCE_9 9,099Access to Capital from banking sector to creative economy players MOTCE MOTCE_10 1,725International roadshow/exhibition for Creative Economy Products MOTCE MOTCE_11 16,273Food Processing Industry Technology AoIT AoIT_1 4,700Bioenergy Technology Innovations AoIT AoIT_2 2,222Horticultural Nurseries Production Technology Innovation AoIT AoIT_3 41,000Energy Techno Park Area (Baron Techno Park) AoIT AoIT_4 1,588System and Technology Innovation for Monitoring the Strength of Multi-storey Buildings Against Earthquake Disaster
AoIT AoIT_5 7,787
Intelligent Computing Technology Innovation for Human Information Processing AoIT AoIT_6 1,340Mercury-free gold processing technology innovation and management of its impact on small-scale gold mining (ASGM)
AoIT AoIT_7 56,900
Competitive Machinery Products AoIT AoIT_8 5,533Innovative nickel mineral processing and refining technology AoIT AoIT_9 19,954Biocompatible materials for medical devices AoIT AoIT_10 7,818Industrial Salt Pilot Project Technology Innovation AoIT AoIT_11 1,450Peatland Area Resource Exploration Technology Innovation AoIT AoIT_12 5,534Innovation in bio-fertilizer and pesticide production technology AoIT AoIT_13 900Technological Innovations to Increase the Competitiveness of Leading Agro Industry AoIT AoIT_14 500Ruminant Animal Feed Production Technology Innovation in Integrated Systems AoIT AoIT_15 391Production Technology Innovation of Medicinal Raw Materials with Synthesis and Purification AoIT AoIT_16 8,585Technological innovation for the production of herbal medicinal raw materials AoIT AoIT_17 50,000Material Technology Innovation for Polymer Industry Competitiveness AoIT AoIT_18 11,258Application and Development of Ceramic Creative Technology Services AoIT AoIT_19 52,239Electronics and Telecommunications Technology Convergence Innovations for Electromedical Systems AoIT AoIT_20 1,500Smart Grid technology innovation AoIT AoIT_21 9,935Regional Innovation Technology Policy Services in Special Infrastructure Development for Regional Innovations and Global Development Issues
AoIT AoIT_22 633
Techno Park area AoIT AoIT_23 25,763Data Center Infrastructure for Cloud Computing and Certificate Authority AoIT AoIT_24 2,200Application and Development of Technology Strategies AoIT AoIT_25 8,221Products in the transportation sector that support the independence of the nation AoIT AoIT_26 8,000Pioneering Techno Park in Central Lampung AoIT AoIT_27 953Enzyme technology innovation as import substitution AoIT AoIT_28 12,486Biotechnological Innovations for the Development of Medicinal Raw Materials AoIT AoIT_29 4,090Competitive products in the field of defense and security AoIT AoIT_30 62,858Horticultural Nurseries Production Technology Innovation AoIT AoIT_31 66,564Technological Innovation of Male Monosex Giant Prawn Seed Production Through Neofemale Technology AoIT AoIT_32 20,000Innovation and Technology Services for Production / Utilization of Coal, Oil and Gas, and the Petrochemical Industry
AoIT AoIT_33 6,000
83Part I: Portfolio Mapping, Assessment of Quality of Policy Mix, and Functional and Governance Review
Instrument’s Name Imple-menting agency
Code Budget allocation
in 2018 (Million IDR)
Small scale geothermal power plant (PLTP) technology innovation AoIT AoIT_34 1,250Pioneering Techno Park Pelalawan AoIT AoIT_35 1,000Material technology innovation for the competitiveness of the rare earth metal industry AoIT AoIT_36 940Improvement of Development and Development of BPPT Facilities AoIT AoIT_37 2,597Electronic System Implementation Technology Innovation for e-Services (e-Government and e-Business) AoIT AoIT_38 99,207Facilitating the Acceleration of Implementation of the Ease of Direct Investment in Construction (KLIK) BKPM BKPM_1 2,325National Partnership Program BKPM BKPM_2 900Results of the Application of LIPI Science and Technology to Technology-Based SMEs / SMEs AFS AFS_1 15,846Lake Health Technology to support aquaculture and tourism businesses AFS AFS_2 45,238The number of start-up and established companies (IKM) based on technology and research AFS AFS_3 4,000C-STP Pilot Plant Productive Building AFS AFS_4 3,322Tenants / Technology-Based Startup Companies at C-STP AFS AFS_5 12,838Cassava Cultivation Application Facility MOA MOA_1 9,111Seed Independent Village Facilities MOA MOA_2 4,382Facilities for Strengthening the Protection of Food Crops from Pest Interference MOA MOA_3 1,525Technical Support Facility for Processing and Marketing of Food Crops MOA MOA_4 51,623Innovation of superior commodity seeds and nurseries (non-strategic) MOA MOA_5 2,915Marketing and Investment Facilities for Food Crops MOA MOA_6 2,483Inventions that are registered IPR protection, promotions, license agreement texts MOA MOA_7 3,600Technical Support Facilities Strengthening Protection of Food Crops from Pest Disruption MOA MOA_8 2,065Corn Source Seed Propagation Facility MOA MOA_9 7,813Post-Harvest Facility Facilities for Food Crops MOA MOA_10 3,000Food Crop Processing Facility Facilities MOA MOA_11 5,600 Assisting cooperatives in developing a new and renewable energy-based economy MOCSME MOCSME_1 18,900 Certification of cooperatives and MSMEs MOCSME MOCSME_2 4,568 Facilitating the Promotion and Marketing of MSME Products MOCSME MOCSME_3 731 Facilitating Entrepreneurs to have access to capital MOCSME MOCSME_4 1,000 Vocational training MOCSME MOCSME_5 25,000 Marketing facilities in disadvantaged areas, borders and post-disaster MOCSME MOCSME_6 5,433 Standardization and certification for export for MSME product MOCSME MOCSME_7 30,000 Assisting group to form Cooperatives MOCSME MOCSME_8 1,180 Assisting priority Micro Enterprises to access and manage KUR MOCSME MOCSME_9 1,760 Business and Technology Incubator MOCSME MOCSME_10 600 Eco-Tourism Business Development Support for Cooperatives and MSME MOCSME MOCSME_11 9,000 Facilitating Access to Insurance and Capital Markets MOCSME MOCSME_12 2,539 Revitalization of traditional market managed by cooperatives MOCSME MOCSME_13 2,400 Technopreneurship Training MOCSME MOCSME_14 1,958 Facilitating the Improvement of the Quality of Human Resources for Cooperatives and MSMEs MOCSME MOCSME_15 26,000 Facilitating the Implementation of Product Quality Standards for MSME MOCSME MOCSME_16 2,472 Promotion and Marketing Abroad MOCSME MOCSME_17 1,133 Facilitating Network and Distribution Cooperation for Cooperatives and MSMEs MOCSME MOCSME_18 5,442 Facilitate the application of e-commerce MOCSME MOCSME_19 18,000 Cooperatives and MSMEs facilitated by Brands and Packaging MOCSME MOCSME_20 2,100 Training for personnel from Savings and Loan Cooperatives on principle of Sharia Cooperative MOCSME MOCSME_21 600 Strengthening the Business System of MSEM MSME in the Manufacturing Industry MOCSME MOCSME_22 2,500 Micro Enterprises Receiving Land Certification Assistance MOCSME MOCSME_23 1,410 Produced Fishery Innovation Components MOFI MOFI_1 1,425 Hatchery unit certified with CPIB (Good Fish Hatchery Method) MOFI MOFI_2 2,000 The resulting Marine Innovation Component MOFI MOFI_3 4,997 Product Processing Technology Innovations and KP Biotechnology are proposed to be recommended MOFI MOFI_4 8,488 Salt Location Adaptive Technology Innovation MOFI MOFI_5 1,661 Facilitated capture fisheries credit MOFI MOFI_6 4,145 Certified fishing crew MOFI MOFI_7 3,000 Improve Financial Access of private sector from fisheries sector MOFI MOFI_8 2,965 Fishery Location Adaptive Technology Innovation MOFI MOFI_9 1,000 The area of cultivation that is protected by insurance MOFI MOFI_10 1,500
POLICY EFFECTIVENESS REVIEW OF INNOVATION AND BUSINESS SUPPORT PROGRAMS
84
Instrument’s Name Imple-menting agency
Code Budget allocation
in 2018 (Million IDR)
Proposed Fisheries Technology Innovations to be Recommended MOFI MOFI_11 1,782 Fishermen’s Center that has been built Fisheries Information System MOFI MOFI_12 14,000 Technology package for engineering facility and fish health produced MOFI MOFI_13 1,505 Fisheries business actors who are facilitated by business services and investments MOFI MOFI_14 18,350 A package of superior seeding technology and quality seeds produced MOFI MOFI_15 392 Revitalized Traditional Medicine Company MOI MOI_1 2,500 Forest and plantation products industrial companies that are revitalizing their machine tools MOI MOI_2 1,500 Rural Multipurpose vehicle ready for mass production (*) MOI MOI_3 747,059 Medicines, Cosmetics and Traditional Medicines Industry Companies that obtain technical guidance and CPOTB, CPOB and CPKB certification
MOI MOI_4 3,448
Support for Machinery and Equipment for Non-Food Industry Made from Seaweed for Making Capsule Shells MOI MOI_5 164 Garment, Fashion and Footwear Companies developed as National Brands (National Branding) MOI MOI_6 7,898 A business plan for the rubber asphalt additive industry that is prepared to increase domestic consumption of natural rubber
MOI MOI_7 9,000
ASSISTANCE OF MACHINES AND / OR EQUIPMENT TO GROW THE POPULATION OF NON-METAL GALIAN MATERIAL INDUSTRY including beverages, seafood, and flour
MOI MOI_8 1,000
Center for design, raw materials and product innovation for the textile and footwear industry MOI MOI_9 9,638 Facilitating the development of telematics product research and development centers (*) MOI MOI_10 5,000 Prototypes of Industrial Forest and Plantation Products MOI MOI_11 8,041 Community Networking and Training to Become a Digital Technopreneur MOIC MOIC_1 3,750 Facilitation services for the promotion of ICT products and services MOIC MOIC_2 1,000 Facilitating 8 Million MSMEs to Go Online MOIC MOIC_3 2,500 Facilitating the development and empowerment of ICT for farmers and fishermen MOIC MOIC_4 8,900 Facilitating the development and empowerment of ICT for farmers and fishermen MOIC MOIC_5 20,000 Facilitating 8 Million MSMEs to Go Online MOIC MOIC_6 14,800 Community Networking and Training to Become a Digital Technopreneurship MOIC MOIC_7 22,803 New Entrepreneurs Through Business Incubation Expansion of Job Opportunities MOMP MOMP_1 700 Productivity Institution Development MOMP MOMP_2 1,649 Increased Productivity MOMP MOMP_3 105,961 Promotion of Productivity MOMP MOMP_4 4,450 New Entrepreneurs Using Simple Technology MOMP MOMP_5 87,064 Fostered Business Unit MOMP MOMP_6 1,513 Center for Skills Development (PN) MOMP MOMP_7 53,568 Science and Technology Promotion Package MOSRT MOSRT_1 3,713 Prospective Technology-Based Startup Companies from Higher Education MOSRT MOSRT_2 583 Regional Innovation Cluster MOSRT MOSRT_3 20,542 R & D innovation products in the industry MOSRT MOSRT_4 6,356 Tenants who are fostered to become Technology-Based Startup Companies MOSRT MOSRT_5 8,547 Product Development for Export Services and Creative Economy MOT MOT_1 7,353 Facilitation of Export Product Development MOT MOT_2 3,500 Promotion of Potential Products for Export in the country and Trade Expo Indonesia MOT MOT_3 423 Export Market Information MOT MOT_4 21,443 Promotion of Foreign Trade MOT MOT_5 41,799 Increasing Service Market Access in International Markets MOT MOT_6 5,658 Facilitating Promotion and Training for SMEs MOT MOT_7 37,500 Decreasing Barriers to Market Access in Partner Countries MOT MOT_8 2,495 Logistics Service Providers in the Trade Sector who are provided with Guidance MOT MOT_9 40,000 Increasing Market Access for Processed Goods at the ASEAN Forum and ASEAN Partners MOT MOT_10 1,705
Note:
MOTCE: Agency for Creative EconomyAoIT: Agency for Implementation of TechnologyBKPM: Agency for InvestmentAFS: Agency for ScienceMOA: Ministry of Agriculture
MOCSME: Ministry of Cooperative and MSMEMOFI: Ministry of FisheriesMOI:MOIMOIC: Ministry of InformationMOMP: Ministry of ManpowerMOSRT: Ministry of Research & TechnologyMOT: Ministry of Trade
85Part I: Portfolio Mapping, Assessment of Quality of Policy Mix, and Functional and Governance Review
Annex 4.DETAILS OF CLUSTER ANALYSIS OF POLICY MIX
This annex presents and analyzes the matrices of similarities for each of the 6 clusters of policy instruments laid out in section 4.4. Each matrix provides information on the similarity index among instruments within the same group. Index values closer to zero indicate more significant differences, while index values closer to one indicate more significant similarities. The diagonal has a value of 1 because it is the instrument compared to itself.
Group 1There are 37 instruments in this group coming from 9 ministries. Around 30% of instruments are from the Ministry of Agriculture. There are also instruments from the Ministry of Industry (8), the Ministry of Fisheries (6), the Agency for Creative Economy (3), Agency of Implementation Technology (3), the Ministry of MSME (2), the Ministry of Man Power (1), and the Ministry of Trade (2). From all instruments within this group, there are 703 correlations. Due to the size of this matrix, it is not possible to show it in its entirety. The average correlation in this group is 0.25, suggesting a weak correlation among instruments within this group. Nevertheless, there are 47 interactions with a 50%-75% degree of similarity. Furthermore, there are nine interactions with a 75%-100% degree of similarity. In the extreme, we also have 16 interactions with a similarity index equal to 1.
The contributor to these perfect similarities is the interaction between instruments within the same ministry. Specifically, we have 12 perfectly similar interactions within the Ministry of Agriculture and 3 perfect similarities from instruments within the Agency for Creative Economy.
Group 2There are 11 instruments in group 2 coming from 3 ministries. The main contributors of instruments to this group are the Ministry of Trade with eight instruments, the Agency for Creative Economy with 2 instruments, and Agency of Investment with one instrument. With these 11 instruments, there are 66 correlations. The average correlation within this group is 0.78—a relatively high correlation. From these correlations, there are 44 very high correlations and one perfect correlation. The rest can be categorized as low and medium correlation.
Table 11. Perfect similarities in group 1 based on ministries
Ministry of Agriculture
Agency for Creative Economy
Ministry of Industry
Ministry of Agriculture 12 0 0
Agency for Creative Economy
0 3 0
Ministry of Industry 0 0 1
POLICY EFFECTIVENESS REVIEW OF INNOVATION AND BUSINESS SUPPORT PROGRAMS
86
Group 3Group 3 consists of 43 instruments. The majority (21) of these instruments is from the Ministry of MSME. Among these instruments, there are 946 interactions. The average correlation among instruments is 0.43, a fairly low level. Due to the large size of the correlation matrix, it is not presented here. Of all the interactions in this group, 253 have medium correlations (index ranges from 0.5 to 0.75). There are also 28 interactions with high degree correlations (0.75-1) and one interaction with perfect correlation.
Group 4Group 4 consists of 18 instruments from 6 ministries. Half of the instruments come from the Agency of Implementation of Technology. From these instruments, there are 717 interactions. The average correlation value is 0.44. The majority of interactions have moderate and high similarities. There are ten interactions with high similarities and one interaction with perfect correlation. Most of these medium and high correlations occur between instruments within the Agency of Implementation Technology.
Group 5Group 5 consists of 21 instruments and 231 interactions. These instruments come from three ministries: The Agency for Implementation Technology, the Ministry of Fisheries, and the Ministry of Research and Technology. The average correlation value is 0.58, signaling medium correlation in this group. Of these interactions, there are 11 perfect interactions and 28 interactions with high correlation. Perfect correlations occur between instruments within the Ministry of Fisheries and the Agency of Implementation of Technology. Furthermore, the interactions with high correlation occur both between instruments within the same ministry and between different ministries.
Group 6There are 14 instruments from 1 ministry in this group: the Agency for Implementation of Technology. All interactions have perfect correlation. It means that all these instruments have the same outcome, objective, mechanism of intervention, and beneficiaries.
87Part I: Portfolio Mapping, Assessment of Quality of Policy Mix, and Functional and Governance Review
Annex 5.SCORES OF FUNCTIONAL AND GOVERNANCE QUALITY FOR EACH SAMPLED INSTRUMENT
The analysis in Section 5 presented scores for policy mix quality, implementation and governance based on average values across the 21 instruments sampled. The figure below shows the specific score (average across design, implementation, and governance quality) for each individual instrument in the sample.
Quality scores of the 21 instruments sampled in the functional and governance analysis
0,0 1,0 2,0 3,0 4,0 5,0
Revitalization of traditional medicine industry
Machine assistance for seaweed-based capsule
Facilitating the commercilization phase of multipurpose motor vehicle
Facilitating the development of R&D center for ICT products
Facilitating the development and implementation of technology in industrial sector
Big data of private sector in creative economy sector
Access to non-banking capital for start-ups in creative economy sector
BEKRAF for pre-start up
Innovative seeding system of non-strategic commodities
Facilitating access to higher quality of Paddy seed
Facilitating post-harvest infrastructure of food crops
Facilitating green-bean farming
Assitance for microfirms to access and manage KUR program
Access to early stage capital for technopreneurs - technopreneurship
Strengtening the collaboration between universities and industry on innovation
Technological Innovation in salt industry - Pilot program
Technological innovation for the production of herbal-based raw material
Technology innovation for integrated ruminant animal feed production
Baron Technopark
Facilitating the processing and marketing of food crops
Entrepreneurship program
Average score across design, implementation, and governance
POLICY EFFECTIVENESS REVIEW OF INNOVATION AND BUSINESS SUPPORT PROGRAMS