+ All Categories
Home > Documents > performance analysis mpi - High Performance Computing ...

performance analysis mpi - High Performance Computing ...

Date post: 19-Mar-2022
Category:
Upload: others
View: 15 times
Download: 0 times
Share this document with a friend
21
16 Parallel Performance Analysis and Profiling — 16 16-1 Performance Analysis [16] Slide 1 Höchstleistungsrechenzentrum Stuttgart Parallel Performance Analysis and Profiling Rolf Rabenseifner University of Stuttgart High-Performance Computing-Center Stuttgart (HLRS) www.hlrs.de Parallel Performance Analysis and Profiling [16] Rolf Rabenseifner Performance Analysis [16] Slide 2 / 42 Höchstleistungsrechenzentrum Stuttgart Goals of Parallel Performance Analysis Find performance bottlenecks Measure parallelization overhead Try to understand speedup value Verification of parallel execution Goals of this lecture To give an impression of the tools Helpful features Ease of use
Transcript

16 — Parallel Performance Analysis and Profiling — 1616-1

Performance Analysis[16] Slide 1 Höchstleistungsrechenzentrum Stuttgart

Parallel Performance Analysisand

Profiling

Rolf Rabenseifner

University of StuttgartHigh-Performance Computing-Center Stuttgart (HLRS)

www.hlrs.de

Parallel P

erformance A

nalysis and Profiling [16]

Rolf RabenseifnerPerformance Analysis[16] Slide 2 / 42 Höchstleistungsrechenzentrum Stuttgart

Goals of Parallel Performance Analysis

• Find performance bottlenecks• Measure parallelization overhead• Try to understand speedup value• Verification of parallel execution

Goals of this lecture

• To give an impression of the tools

– Helpful features

– Ease of use

16 — Parallel Performance Analysis and Profiling — 1616-2

Rolf RabenseifnerPerformance Analysis[16] Slide 3 / 42 Höchstleistungsrechenzentrum Stuttgart

Outline

slide no.

• Principles of performance analysis 4

• Visualization examples with Vampir NG 13

• Paraver 22

• KOJAK / Expert 23

• Most simple counter profiling 36

• Summary 41

• Technical appendix 38

Acknowledgments

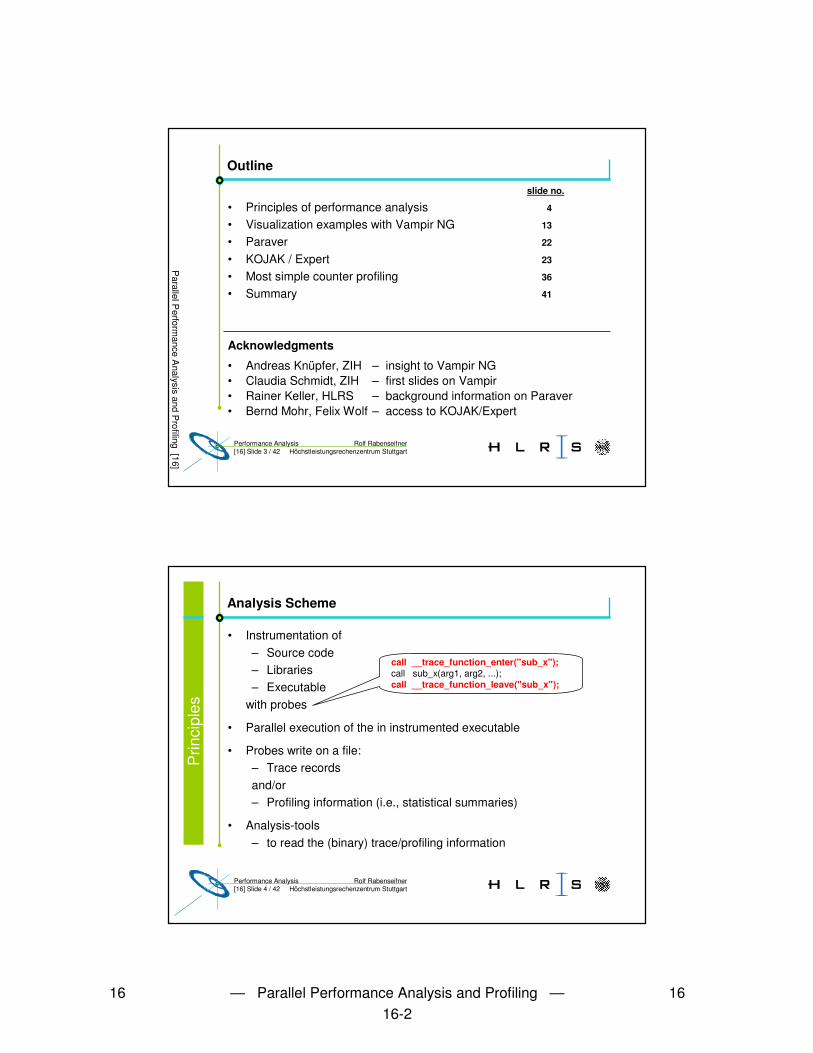
• Andreas Knüpfer, ZIH – insight to Vampir NG• Claudia Schmidt, ZIH – first slides on Vampir• Rainer Keller, HLRS – background information on Paraver• Bernd Mohr, Felix Wolf – access to KOJAK/Expert

Parallel P

erformance A

nalysis and Profiling [16]

Rolf RabenseifnerPerformance Analysis[16] Slide 4 / 42 Höchstleistungsrechenzentrum Stuttgart

Analysis Scheme

• Instrumentation of – Source code– Libraries– Executable

with probes

• Parallel execution of the in instrumented executable

• Probes write on a file:– Trace recordsand/or– Profiling information (i.e., statistical summaries)

• Analysis-tools – to read the (binary) trace/profiling information

call __trace_function_enter("sub_x");call sub_x(arg1, arg2, ...);call __trace_function_leave("sub_x");

Prin

cipl

es

16 — Parallel Performance Analysis and Profiling — 1616-3

Rolf RabenseifnerPerformance Analysis[16] Slide 5 / 42 Höchstleistungsrechenzentrum Stuttgart

Instrumentation

• Source code instrumentation– Manual– Automatically before compiling

• Automatic instrumentation by the compiler

• Using instrumented libraries

• Binary instrumentation of the executable

Source

Compiler

Linker

instrumentedlibraries

Instrumentedexecutable

Rolf RabenseifnerPerformance Analysis[16] Slide 6 / 42 Höchstleistungsrechenzentrum Stuttgart

Output

• Trace file– Records with

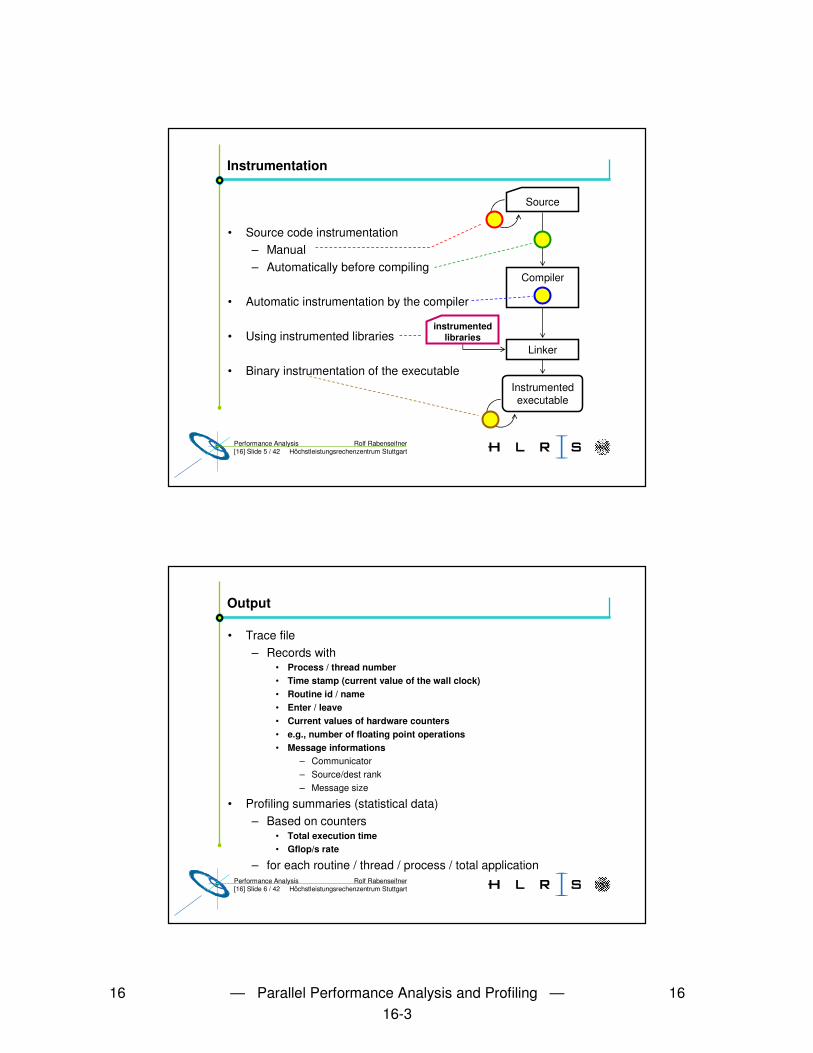
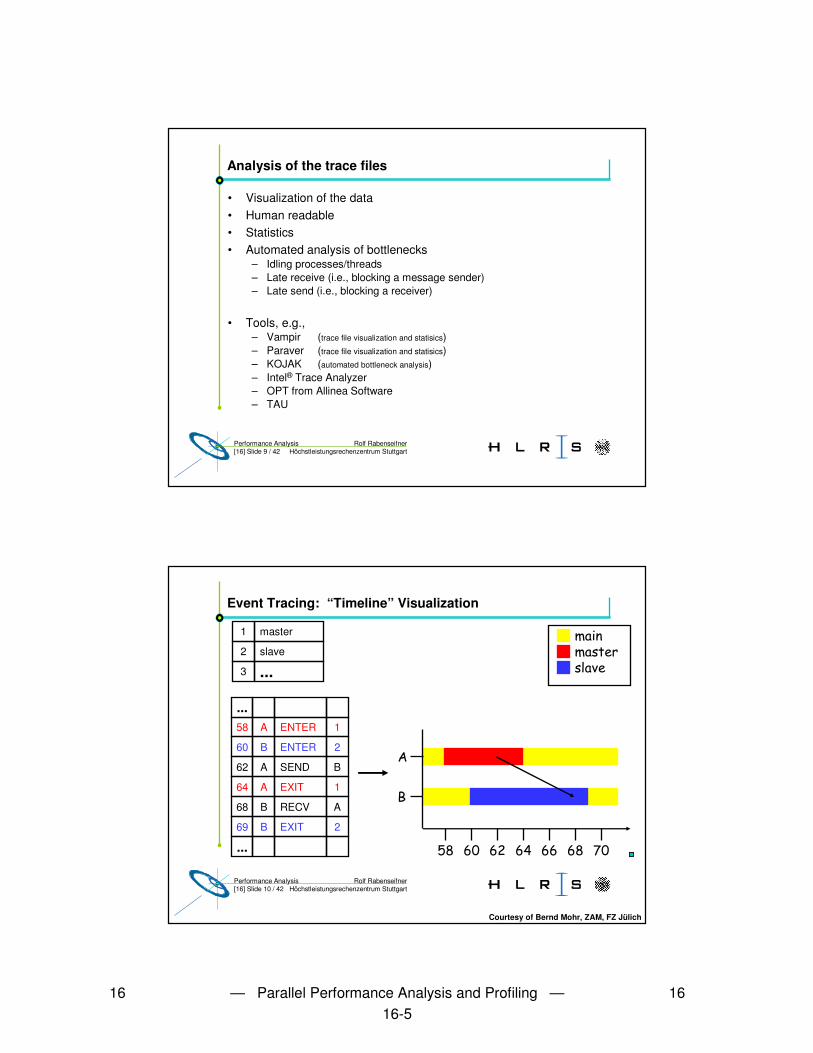
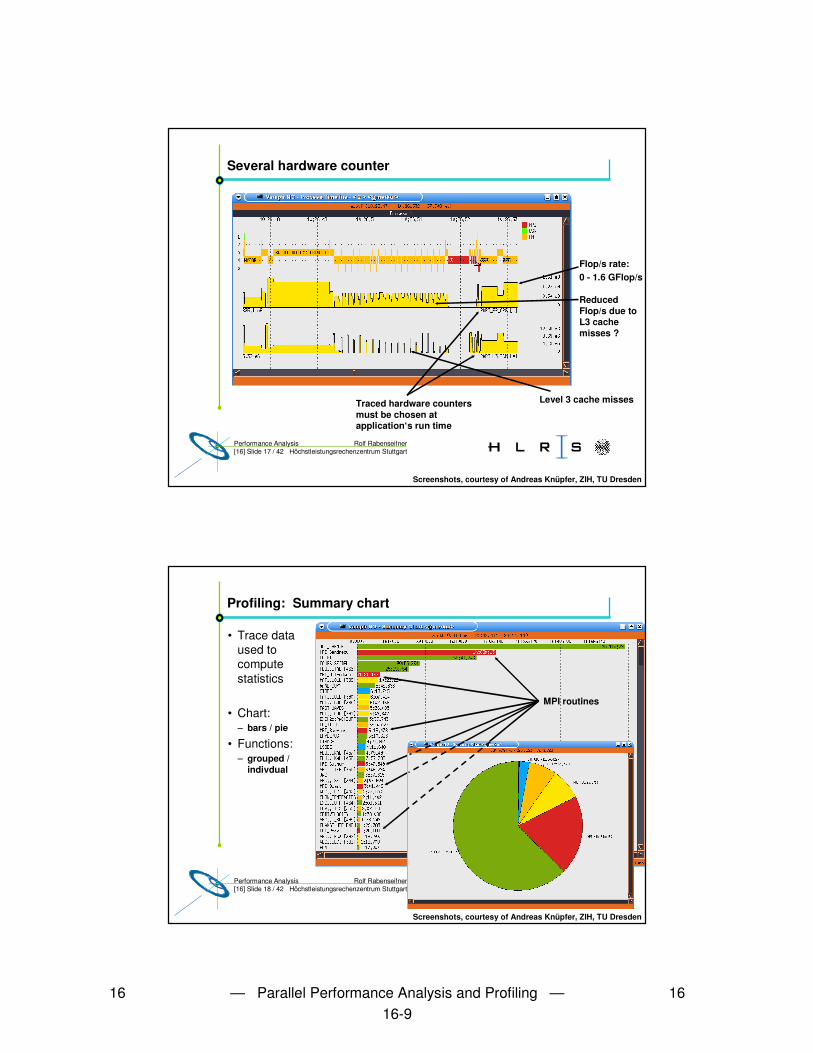
• Process / thread number• Time stamp (current value of the wall clock)• Routine id / name• Enter / leave• Current values of hardware counters • e.g., number of floating point operations• Message informations

– Communicator– Source/dest rank– Message size

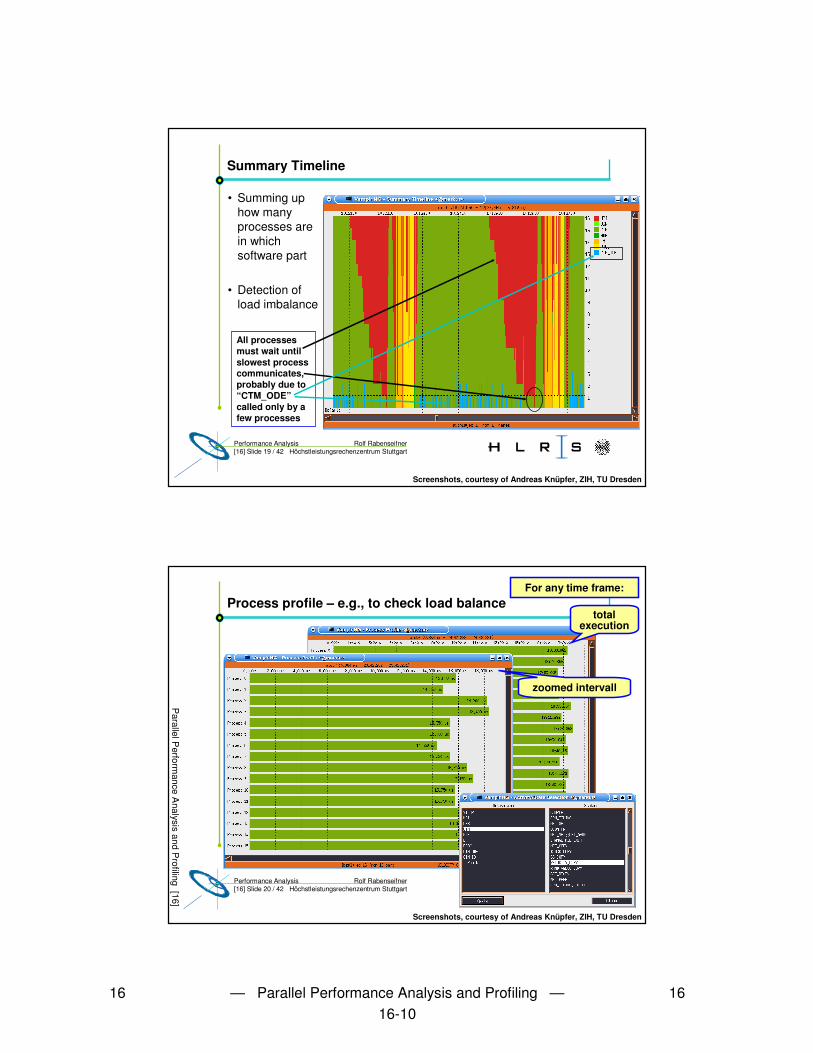
• Profiling summaries (statistical data)– Based on counters

• Total execution time • Gflop/s rate

– for each routine / thread / process / total application

16 — Parallel Performance Analysis and Profiling — 1616-4

Rolf RabenseifnerPerformance Analysis[16] Slide 7 / 42 Höchstleistungsrechenzentrum Stuttgart

Trace generation & Trace analysis

• E.g., with VAMPIRtraceand VAMPIR

• VAMPIRtrace must be linked with the user’sMPI application

• VAMPIRtrace writes atrace file

• VAMPIR is the graphicaltool to analyze the trace file

• VAMPIR may run – locally, or– via X window

parallel platform

user’s workstation

instrumentedapplication

VAMPIRtrace

PMPI library

Trace file

X11

user’s workstation

vampir

vampir

Server, e.g., front-end of

parallel platform

Rolf RabenseifnerPerformance Analysis[16] Slide 8 / 42 Höchstleistungsrechenzentrum Stuttgart

Event Tracing: Instrumentation, Monitoring, Trace

void master {

...

send(B, tag, buf);...

}

������

void slave {

...recv(A, tag, buf);

...

}

������

1 master

2 slave

3 ...

void slave {trace(ENTER, 2);...recv(A, tag, buf);trace(RECV, A);...trace(EXIT, 2);

}

void master {trace(ENTER, 1);...trace(SEND, B);send(B, tag, buf);...trace(EXIT, 1);

}

��� � ������������ ������

� � � �� � �

��� �������

58 A ENTER 1

60 B ENTER 2

62 A SEND B

64 A EXIT 1

68 B RECV A

...

69 B EXIT 2

...

��� ����

Courtesy of Bernd Mohr, ZAM, FZ Jülich

16 — Parallel Performance Analysis and Profiling — 1616-5

Rolf RabenseifnerPerformance Analysis[16] Slide 9 / 42 Höchstleistungsrechenzentrum Stuttgart

Analysis of the trace files

• Visualization of the data• Human readable• Statistics• Automated analysis of bottlenecks

– Idling processes/threads– Late receive (i.e., blocking a message sender)– Late send (i.e., blocking a receiver)

• Tools, e.g.,– Vampir (trace file visualization and statisics)– Paraver (trace file visualization and statisics)– KOJAK (automated bottleneck analysis)– Intel® Trace Analyzer– OPT from Allinea Software– TAU

Rolf RabenseifnerPerformance Analysis[16] Slide 10 / 42 Höchstleistungsrechenzentrum Stuttgart

Event Tracing: “Timeline” Visualization

Courtesy of Bernd Mohr, ZAM, FZ Jülich

1 master

2 slave

3 ...

58 A ENTER 1

60 B ENTER 2

62 A SEND B

64 A EXIT 1

68 B RECV A

...

69 B EXIT 2

...

� ��� ��������

�� ! " # � $!

16 — Parallel Performance Analysis and Profiling — 1616-6

Rolf RabenseifnerPerformance Analysis[16] Slide 11 / 42 Höchstleistungsrechenzentrum Stuttgart

Rolf RabenseifnerPerformance Analysis

Instrumentation & Trace Overhead

Parallel P

erformance A

nalysis and Profiling [16] Slide, courtesy of Andreas Knüpfer et al., ZIH, TU Dresden

15 ticksw/o

568526059dummy

937451300299id+timer

633219120119f.id

637278121120f.symbol

638115117117f.addr.

DynInstGCCPDTmanual

Rolf RabenseifnerPerformance Analysis[16] Slide 12 / 42 Höchstleistungsrechenzentrum Stuttgart

Tracefile formats

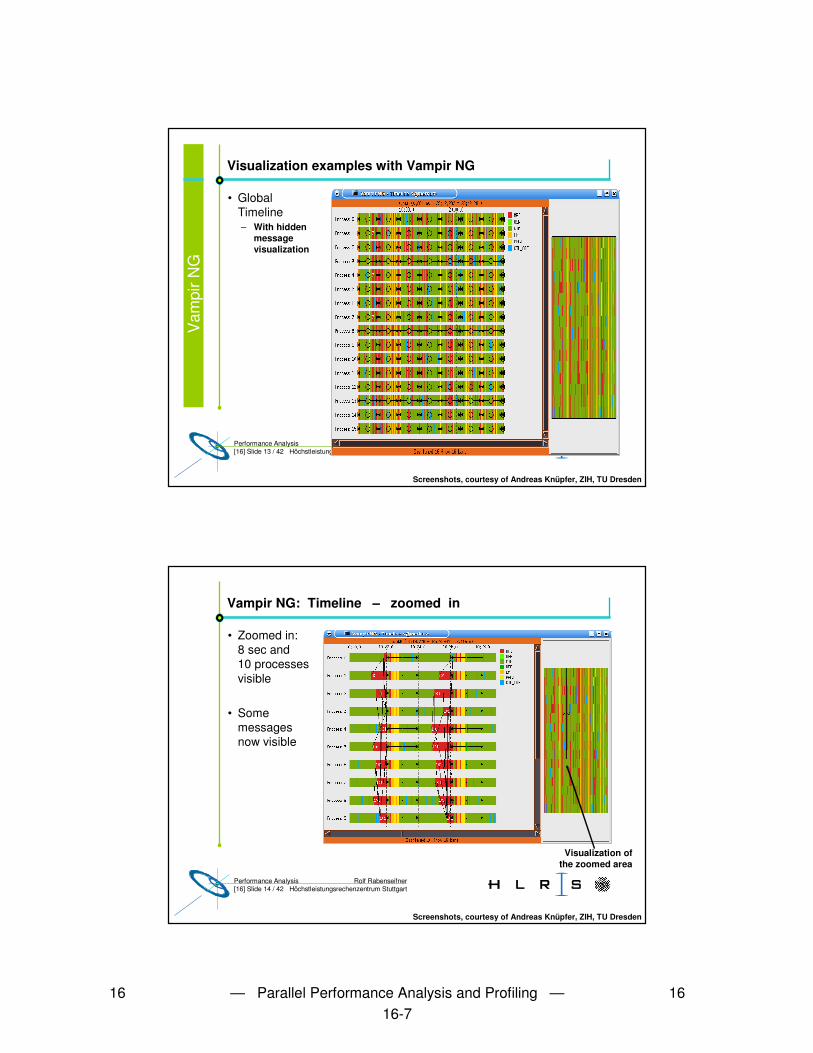
Instrumentation and Trace format Analysis tool• EPILOG (ZAM, FZ Jülich, .elg) � KOJAK• Open Trace Format, OTF (ZIH, TU Dresden) � Vampir• Paraver Tracefile (.prv + .pcf) � Paraver• STF (Pallas, now Intel) � Intel® Trace Analyzer• TAU Trace Format (Univ. of Oregon) � TAU

• Converter exists, e.g., EPILOG OTF
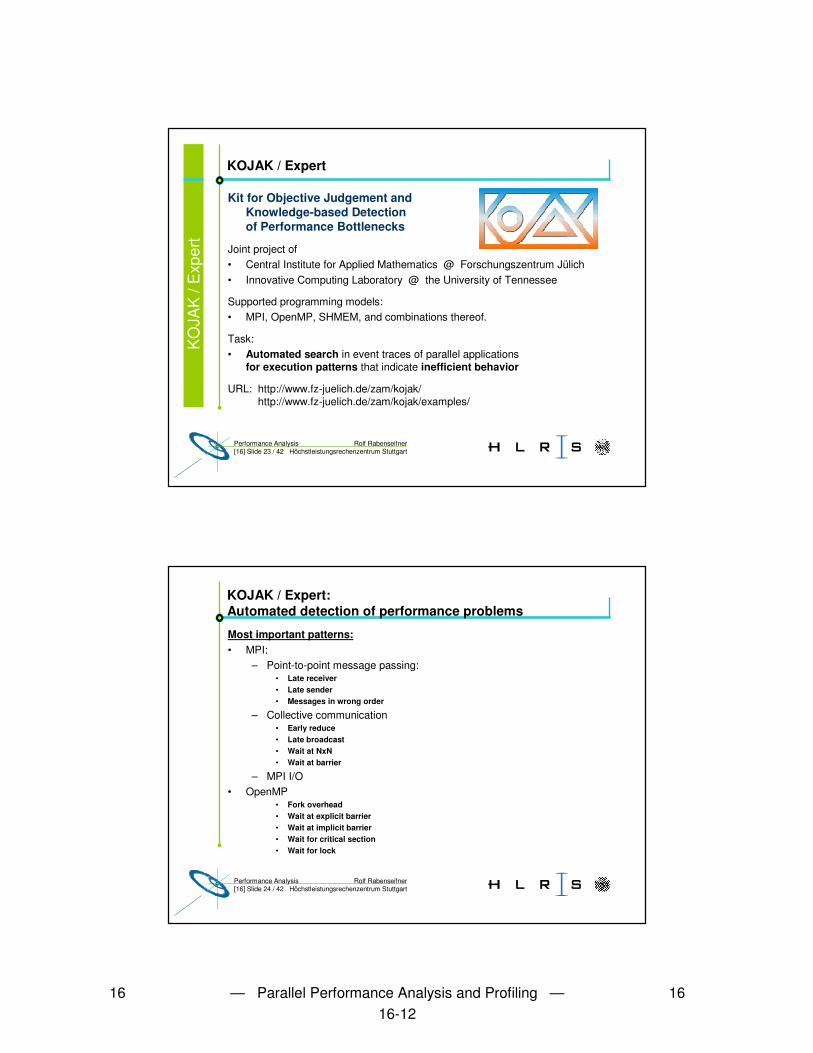
Paraver

• To access hardware counters, PAPI must be installed (in most cases)– Under Linux, PAPI requires a kernel patch �

Parallel P

erformance A

nalysis and Profiling [16]

16 — Parallel Performance Analysis and Profiling — 1616-7

Rolf RabenseifnerPerformance Analysis[16] Slide 13 / 42 Höchstleistungsrechenzentrum Stuttgart

Visualization examples with Vampir NG

• GlobalTimeline– With hidden

message visualization

Screenshots, courtesy of Andreas Knüpfer, ZIH, TU Dresden

Vam

pirN

G

Rolf RabenseifnerPerformance Analysis[16] Slide 14 / 42 Höchstleistungsrechenzentrum Stuttgart

Vampir NG: Timeline – zoomed in

• Zoomed in:8 sec and 10 processes visible

• Some messages now visible

Visualization of the zoomed area

Screenshots, courtesy of Andreas Knüpfer, ZIH, TU Dresden

16 — Parallel Performance Analysis and Profiling — 1616-8

Rolf RabenseifnerPerformance Analysis[16] Slide 15 / 42 Höchstleistungsrechenzentrum Stuttgart

Zoomed in again

• Routine names become visible

Screenshots, courtesy of Andreas Knüpfer, ZIH, TU Dresden

Rolf RabenseifnerPerformance Analysis[16] Slide 16 / 42 Höchstleistungsrechenzentrum Stuttgart

ProcessTimeline

• Timeline of several individual processes

• Call stack

• Hardware performance counter

Screenshots, courtesy of Andreas Knüpfer, ZIH, TU Dresden

16 — Parallel Performance Analysis and Profiling — 1616-9

Rolf RabenseifnerPerformance Analysis[16] Slide 17 / 42 Höchstleistungsrechenzentrum Stuttgart

Several hardware counter

Level 3 cache misses

Flop/s rate:0 - 1.6 GFlop/s

Reduced Flop/s due to L3 cache misses ?

Traced hardware counters must be chosen at application‘s run time

Screenshots, courtesy of Andreas Knüpfer, ZIH, TU Dresden

Rolf RabenseifnerPerformance Analysis[16] Slide 18 / 42 Höchstleistungsrechenzentrum Stuttgart

Profiling: Summary chart

• Trace data used to compute statistics

• Chart:– bars / pie

• Functions: – grouped /

indivdual

MPI routines

MPI

Screenshots, courtesy of Andreas Knüpfer, ZIH, TU Dresden

16 — Parallel Performance Analysis and Profiling — 1616-10

Rolf RabenseifnerPerformance Analysis[16] Slide 19 / 42 Höchstleistungsrechenzentrum Stuttgart

Summary Timeline

• Summing up how many processes are in which software part

• Detection of load imbalance

All processes must wait until slowest process communicates,probably due to“CTM_ODE”called only by a few processes

Screenshots, courtesy of Andreas Knüpfer, ZIH, TU Dresden

Rolf RabenseifnerPerformance Analysis[16] Slide 20 / 42 Höchstleistungsrechenzentrum Stuttgart

Process profile – e.g., to check load balance For any time frame:

total execution

zoomed intervall

Screenshots, courtesy of Andreas Knüpfer, ZIH, TU Dresden

Parallel P

erformance A

nalysis and Profiling [16]

16 — Parallel Performance Analysis and Profiling — 1616-11

Rolf RabenseifnerPerformance Analysis[16] Slide 21 / 42 Höchstleistungsrechenzentrum Stuttgart

Message Statistics

• sender-receiver matrix

• zoomable in two dimensions– suitable for

> 1000 peers

• show various properties:– count, length,

duration, speed

• color legend

• display as– min, max, avg, sum

Courtesy of Andreas Knüpfer, ZIH, TU Dresden

Rolf RabenseifnerPerformance Analysis[16] Slide 22 / 42 Höchstleistungsrechenzentrum Stuttgart

Paraver: Similar functionality

• Paraver is a versatile tool for Performance Measurement• However, it’s not very easy to learn – but straightforward…

(blue) Running(red) Waiting for a message(pink) Blocking send(pink) Immediate send

(gray) Immediate receive(orange) Collective communication(brown) Synchronization / Barrier

Courtesy of Rainer Keller, HLRS

Par

aver

16 — Parallel Performance Analysis and Profiling — 1616-12

Rolf RabenseifnerPerformance Analysis[16] Slide 23 / 42 Höchstleistungsrechenzentrum Stuttgart

KOJAK / Expert

Kit for Objective Judgement and Knowledge-based Detection of Performance Bottlenecks

Joint project of• Central Institute for Applied Mathematics @ Forschungszentrum Jülich• Innovative Computing Laboratory @ the University of Tennessee

Supported programming models:• MPI, OpenMP, SHMEM, and combinations thereof.

Task:• Automated search in event traces of parallel applications

for execution patterns that indicate inefficient behavior

URL: http://www.fz-juelich.de/zam/kojak/http://www.fz-juelich.de/zam/kojak/examples/

KO

JAK

/ E

xper

t

Rolf RabenseifnerPerformance Analysis[16] Slide 24 / 42 Höchstleistungsrechenzentrum Stuttgart

KOJAK / Expert: Automated detection of performance problems

Most important patterns:• MPI:

– Point-to-point message passing:• Late receiver• Late sender• Messages in wrong order

– Collective communication• Early reduce• Late broadcast• Wait at NxN• Wait at barrier

– MPI I/O• OpenMP

• Fork overhead• Wait at explicit barrier• Wait at implicit barrier• Wait for critical section• Wait for lock

16 — Parallel Performance Analysis and Profiling — 1616-13

Rolf RabenseifnerPerformance Analysis[16] Slide 25 / 42 Höchstleistungsrechenzentrum Stuttgart

KOJAK / Expert: Usage example 1 – “Late Sender”

1.Choose a propertywhere you loose time• e.g., “Late Sender”• with 5.8% of CPU time

2.Check for / choose locations in the call tree• 1.2% bound + 4.6 Recv• ���� right-double-click

3.Distribution across the processes• 0.7% loss in Pr. 0• 2.8% loss in Pr. 1

Screenshots, courtesy of KOJAK group, ZAM, FZ Jülich

Absolute view mode

Rolf RabenseifnerPerformance Analysis[16] Slide 26 / 42 Höchstleistungsrechenzentrum Stuttgart

Comparison with Vampir’s output

4.Detect the details:• Bad computational load balance in routine “velo”

in Process 7: under-loaded

Screenshots, courtesy of KOJAK group, ZAM, FZ Jülich

16 — Parallel Performance Analysis and Profiling — 1616-14

Rolf RabenseifnerPerformance Analysis[16] Slide 27 / 42 Höchstleistungsrechenzentrum Stuttgart

KOJAK / Expert: Example 2 – “Wait at NxN”

Screenshots, courtesy of KOJAK group, ZAM, FZ Jülich

90.2

9.8

For better viewing,use relative view mode, i.e.,

treating ___________ again as 100%2.4 Wait at NxN

8 processesare waiting in MPI_Allreduce

Relative view mode

Rolf RabenseifnerPerformance Analysis[16] Slide 28 / 42 Höchstleistungsrechenzentrum Stuttgart

Comparison with Vampir’s output

Screenshots, courtesy of KOJAK group, ZAM, FZ Jülich

Parallel P

erformance A

nalysis and Profiling [16]

16 — Parallel Performance Analysis and Profiling — 1616-15

Rolf RabenseifnerPerformance Analysis[16] Slide 29 / 42 Höchstleistungsrechenzentrum Stuttgart

KOJAK / Expert: Example 3 – “Idle threads”

• Idle time• Probably due

to serial parts in the OpenMP parallelization of “phyec”

• I.e., other threads are sleeping

Screenshots, courtesy of KOJAK group, ZAM, FZ Jülich

Absolute view mode

Rolf RabenseifnerPerformance Analysis[16] Slide 30 / 42 Höchstleistungsrechenzentrum Stuttgart

KOJAK / Expert: Example 4 – “Idle threads”

Screenshots, courtesy of KOJAK group, ZAM, FZ Jülich

MPI_Recv is called outside of OpenMP

parallel regions

Absolute view mode

16 — Parallel Performance Analysis and Profiling — 1616-16

Rolf RabenseifnerPerformance Analysis[16] Slide 31 / 42 Höchstleistungsrechenzentrum Stuttgart

KOJAK / Expert: Example 5 – “Wait at Barrier”

Screenshots, courtesy of KOJAK group, ZAM, FZ Jülich

Relative view mode

Indication of non-optimal load

balance

Rolf RabenseifnerPerformance Analysis[16] Slide 32 / 42 Höchstleistungsrechenzentrum Stuttgart

KOJAK / Expert: Example 5 – Solution

Screenshots, courtesy of KOJAK group, ZAM, FZ Jülich

Relative view mode

Better load balancing with

dynamic loop schedule

16 — Parallel Performance Analysis and Profiling — 1616-17

Rolf RabenseifnerPerformance Analysis[16] Slide 33 / 42 Höchstleistungsrechenzentrum Stuttgart

Example with Sweep3d – analyzed with KOJAK/Expert

• Expert: part of KOJAK project at FZ Jülich, – Contact: Dr. Bernd Mohr, Prof. Dr. Felix Wolf– www.fz-juelich.de/zam/kojak/

• Sweep3d– ASCI Benchmark (MPI-Version)

http://www.llnl.gov/asci_benchmarks/asci/limited/sweep3d/asci_sweep3d.html

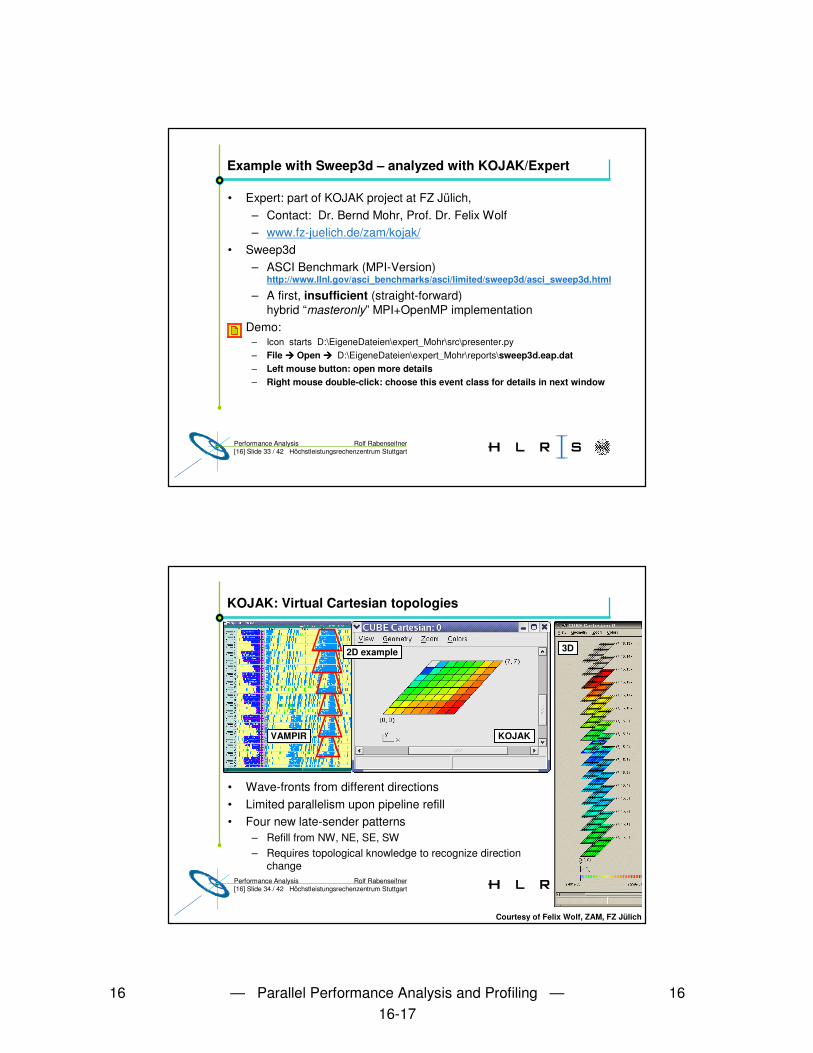
– A first, insufficient (straight-forward) hybrid “masteronly” MPI+OpenMP implementation

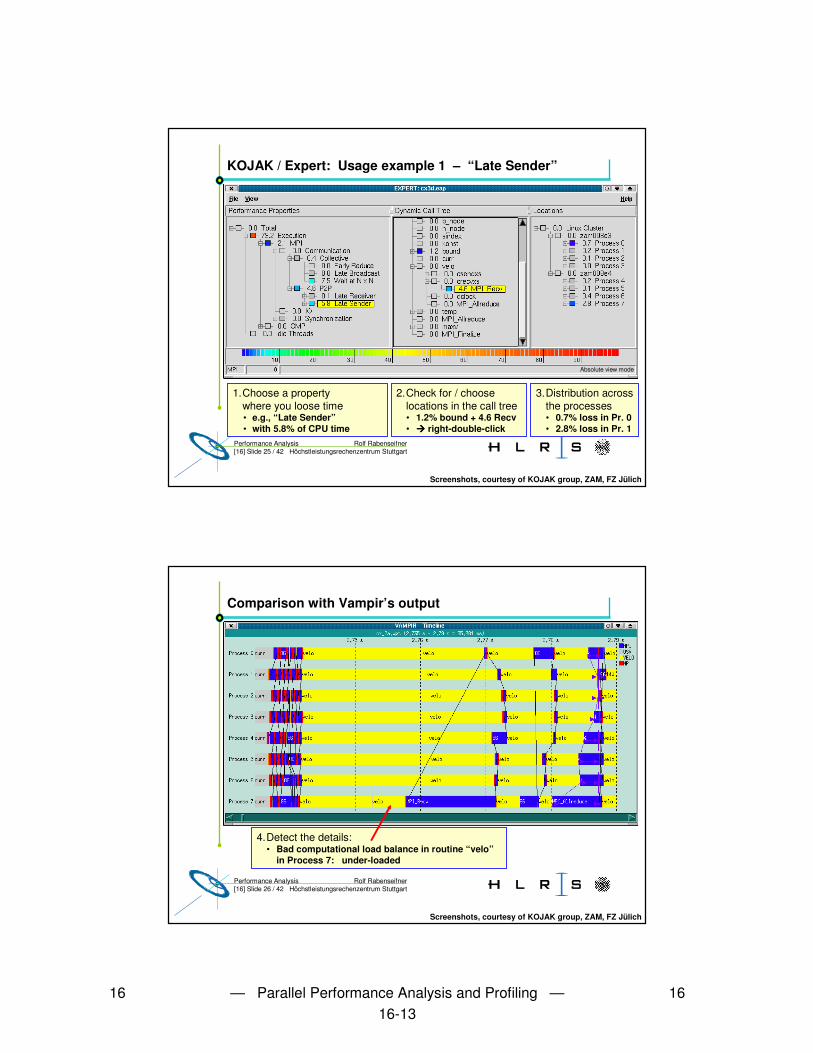
• Demo:– Icon starts D:\EigeneDateien\expert_Mohr\src\presenter.py– File ���� Open ���� D:\EigeneDateien\expert_Mohr\reports\sweep3d.eap.dat– Left mouse button: open more details– Right mouse double-click: choose this event class for details in next window

Rolf RabenseifnerPerformance Analysis[16] Slide 34 / 42 Höchstleistungsrechenzentrum Stuttgart

KOJAK: Virtual Cartesian topologies

• Wave-fronts from different directions• Limited parallelism upon pipeline refill • Four new late-sender patterns

– Refill from NW, NE, SE, SW– Requires topological knowledge to recognize direction

change

VAMPIR

Courtesy of Felix Wolf, ZAM, FZ Jülich

KOJAK

2D example 3D

16 — Parallel Performance Analysis and Profiling — 1616-18

Rolf RabenseifnerPerformance Analysis[16] Slide 35 / 42 Höchstleistungsrechenzentrum Stuttgart

KOJAK: Comparing multiple experiments

• Performance algebra• Abstract data model describing performance experiments• Closed arithmetic operations on entire experiments yielding entire

experiments – Difference– Mean – Merge

• Results are called derived experiments• Can be viewed like original experiments

CUBE(XML)

CUBE(XML)

CUBE(XML)�

Courtesy of Felix Wolf, ZAM, FZ Jülich

Rolf RabenseifnerPerformance Analysis[16] Slide 36 / 42 Höchstleistungsrechenzentrum Stuttgart

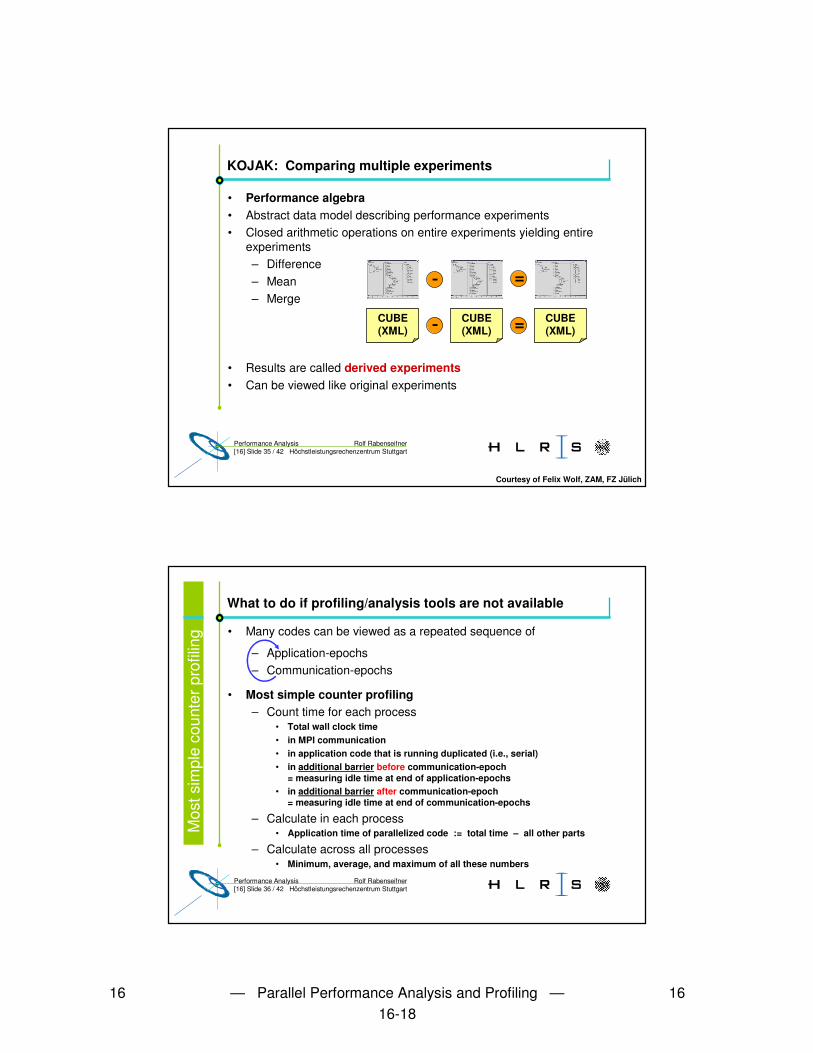
What to do if profiling/analysis tools are not available

• Many codes can be viewed as a repeated sequence of

– Application-epochs– Communication-epochs

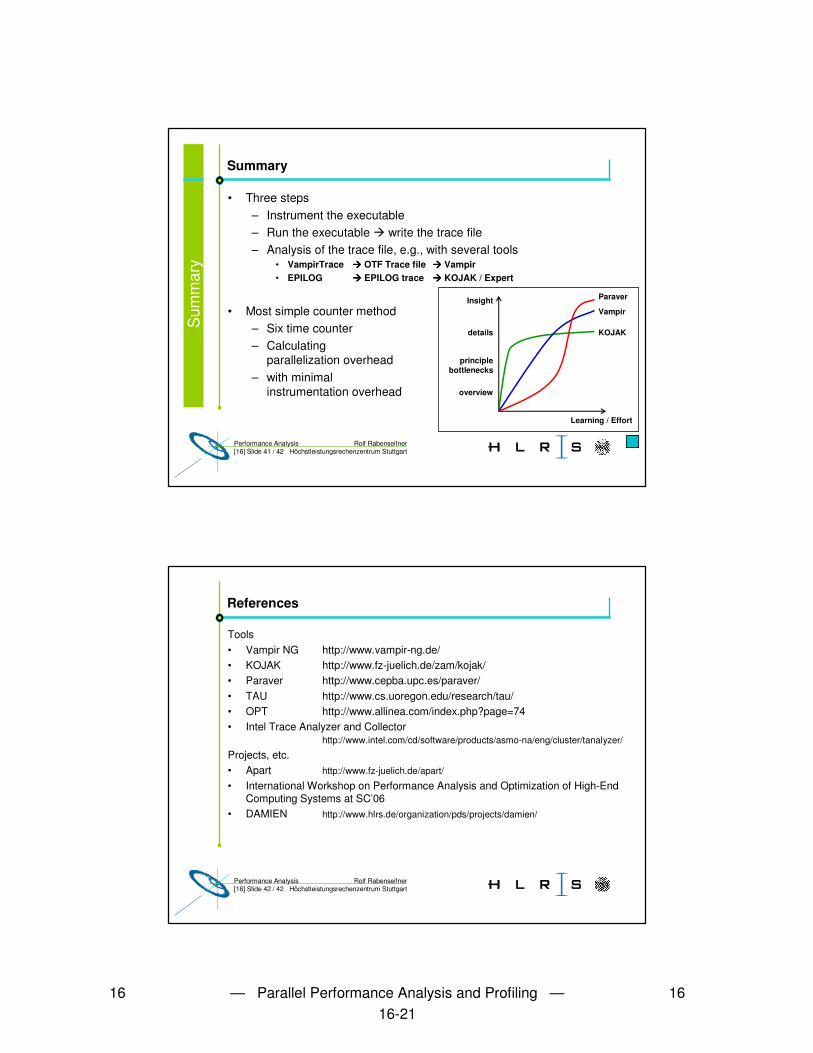
• Most simple counter profiling– Count time for each process

• Total wall clock time• in MPI communication• in application code that is running duplicated (i.e., serial)• in additional barrier before communication-epoch

= measuring idle time at end of application-epochs• in additional barrier after communication-epoch

= measuring idle time at end of communication-epochs

– Calculate in each process• Application time of parallelized code := total time – all other parts

– Calculate across all processes• Minimum, average, and maximum of all these numbers

Mos

t sim

ple

coun

ter p

rofil

ing

16 — Parallel Performance Analysis and Profiling — 1616-19

Rolf RabenseifnerPerformance Analysis[16] Slide 37 / 42 Höchstleistungsrechenzentrum Stuttgart

Most simple counter profiling

double t_all, t_appl, t_serial, t_comm, t_idle_num, t_idle_comm; /* global variables */

t_all=0; t_appl=0; t_serial=0; t_comm=0; t_idle_num=0; t_idle_comm=0;

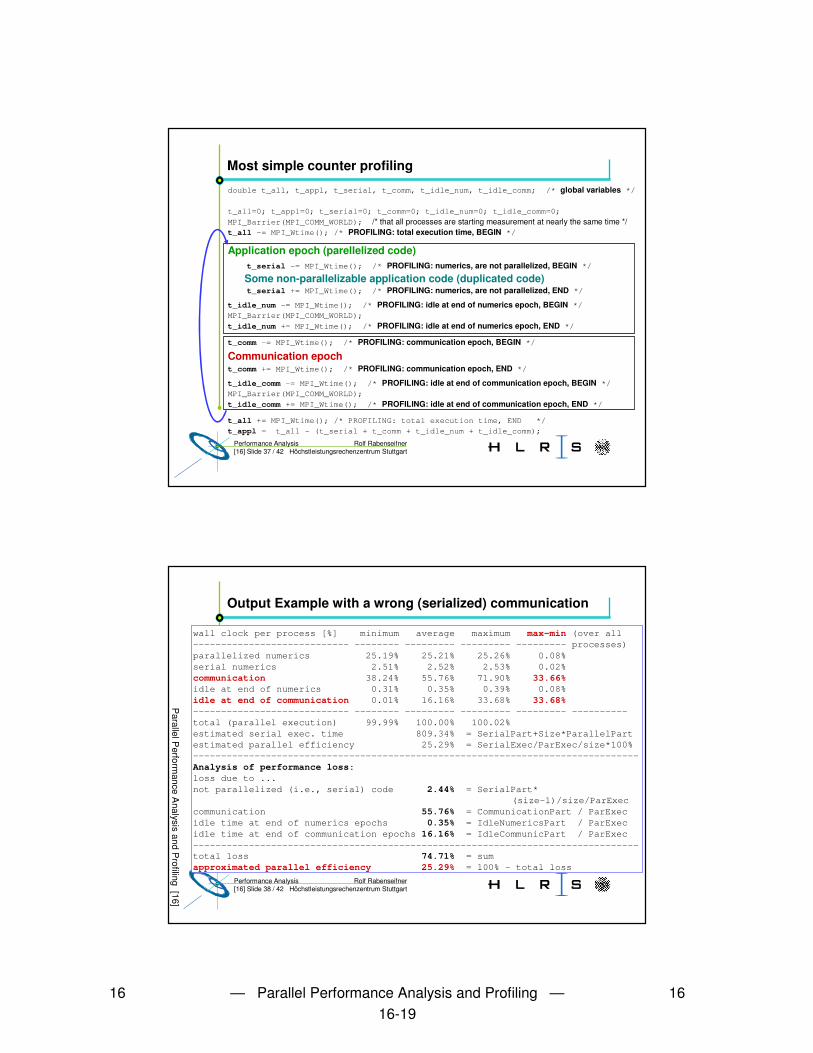
MPI_Barrier(MPI_COMM_WORLD); /* that all processes are starting measurement at nearly the same time */t_all -= MPI_Wtime(); /* PROFILING: total execution time, BEGIN */

Application epoch (parellelized code)t_serial -= MPI_Wtime(); /* PROFILING: numerics, are not parallelized, BEGIN */

Some non-parallelizable application code (duplicated code)t_serial += MPI_Wtime(); /* PROFILING: numerics, are not parallelized, END */

t_idle_num -= MPI_Wtime(); /* PROFILING: idle at end of numerics epoch, BEGIN */MPI_Barrier(MPI_COMM_WORLD);

t_idle_num += MPI_Wtime(); /* PROFILING: idle at end of numerics epoch, END */

t_comm -= MPI_Wtime(); /* PROFILING: communication epoch, BEGIN */

Communication epocht_comm += MPI_Wtime(); /* PROFILING: communication epoch, END */

t_idle_comm -= MPI_Wtime(); /* PROFILING: idle at end of communication epoch, BEGIN */MPI_Barrier(MPI_COMM_WORLD);

t_idle_comm += MPI_Wtime(); /* PROFILING: idle at end of communication epoch, END */

t_all += MPI_Wtime(); /* PROFILING: total execution time, END */

t_appl = t_all - (t_serial + t_comm + t_idle_num + t_idle_comm);

Rolf RabenseifnerPerformance Analysis[16] Slide 38 / 42 Höchstleistungsrechenzentrum Stuttgart

Output Example with a wrong (serialized) communication

wall clock per process [%] minimum average maximum max-min (over all---------------------------- -------- --------- --------- --------- processes)parallelized numerics 25.19% 25.21% 25.26% 0.08%serial numerics 2.51% 2.52% 2.53% 0.02%communication 38.24% 55.76% 71.90% 33.66%idle at end of numerics 0.31% 0.35% 0.39% 0.08%idle at end of communication 0.01% 16.16% 33.68% 33.68%---------------------------- -------- --------- --------- --------- ----------total (parallel execution) 99.99% 100.00% 100.02%estimated serial exec. time 809.34% = SerialPart+Size*ParallelPartestimated parallel efficiency 25.29% = SerialExec/ParExec/size*100%--------------------------------------------------------------------------------Analysis of performance loss:loss due to ...not parallelized (i.e., serial) code 2.44% = SerialPart*

(size-1)/size/ParExeccommunication 55.76% = CommunicationPart / ParExecidle time at end of numerics epochs 0.35% = IdleNumericsPart / ParExecidle time at end of communication epochs 16.16% = IdleCommunicPart / ParExec--------------------------------------------------------------------------------total loss 74.71% = sumapproximated parallel efficiency 25.29% = 100% - total loss

Parallel P

erformance A

nalysis and Profiling [16]

16 — Parallel Performance Analysis and Profiling — 1616-20

Rolf RabenseifnerPerformance Analysis[16] Slide 39 / 42 Höchstleistungsrechenzentrum Stuttgart

Visualization with OPT from Allinea

Different colors for each routine

Extreme jitter (1 ms) due to insufficient clock synchronization

Bad load balance of numerical code:Visible through additional MPI_Barrier Bad load balance of

communication:Visible with second MPI_Barrier

Screenshot, courtesy of Bettina Krammer, HLRS

Wrong direction ofmessage “arrows”:

• End of arrow in the middle of receive (instead of at end):Msg from rank 1 to 0

• Due to bad clock synchronization:Msg from rank 4 to 5

(Problems may besolved in next release)

Rolf RabenseifnerPerformance Analysis[16] Slide 40 / 42 Höchstleistungsrechenzentrum Stuttgart

Most simple counter profiling

• Example and output see:http://www.hlrs.de/organization/par/par_prog_ws/practical/MPI/course/C/optim/

• Files:– nonoptim.c – communication in a ring is serialized

– optim.c – communication is parallelized with non-blocking MPI routines

– Output examples:• optim_cacau_np32_1MB_LOOPx5_out.txt• nonoptim_cacau_np32_1MB_LOOPx5_out.txt

if (my_rank==0) {MPI_Send(snd1buf, ..., right, ...);MPI_Recv(rcv1buf, ..., left, ...);

}else{ MPI_Recv(rcv1buf, ..., left, ...);MPI_Send(snd1buf, ..., right, ...);

}

MPI_Irecv(rcv1buf, ..., left, ..., &rq);MPI_Send (snd1buf, ..., right, ...);MPI_Wait(rq, &status);

16 — Parallel Performance Analysis and Profiling — 1616-21

Rolf RabenseifnerPerformance Analysis[16] Slide 41 / 42 Höchstleistungsrechenzentrum Stuttgart

Summary

• Three steps– Instrument the executable– Run the executable � write the trace file– Analysis of the trace file, e.g., with several tools

• VampirTrace ���� OTF Trace file ���� Vampir• EPILOG ���� EPILOG trace ���� KOJAK / Expert

• Most simple counter method– Six time counter– Calculating

parallelization overhead – with minimal

instrumentation overhead

Learning / Effort

Insight

details

principlebottlenecks

overview

KOJAK

Vampir

Paraver

Sum

mar

y

Rolf RabenseifnerPerformance Analysis[16] Slide 42 / 42 Höchstleistungsrechenzentrum Stuttgart

References

Tools• Vampir NG http://www.vampir-ng.de/• KOJAK http://www.fz-juelich.de/zam/kojak/• Paraver http://www.cepba.upc.es/paraver/ • TAU http://www.cs.uoregon.edu/research/tau/• OPT http://www.allinea.com/index.php?page=74• Intel Trace Analyzer and Collector

http://www.intel.com/cd/software/products/asmo-na/eng/cluster/tanalyzer/

Projects, etc.• Apart http://www.fz-juelich.de/apart/

• International Workshop on Performance Analysis and Optimization of High-End Computing Systems at SC’06

• DAMIEN http://www.hlrs.de/organization/pds/projects/damien/


Recommended