129
On the neural encoding of object information A model simulation study of the fly lobula plate network Doctoral Dissertation by Patrick Hennig
On the neural encoding of object informationA model simulation study of the fly lobula plate network
Doctoral Dissertation by Patrick Hennig

On the neural encoding of object informationA model simulation study of the fly lobula plate network
Dissertation zur Erlangung des akademischen GradesDoktor der Naturwissenschaften - Dr. rer. nat. -
vorgelegt von Patrick Hennig
im Juni 2011an der Fakultät für Biologie der Universität Bielefeld
betreut von Prof. Dr. Martin Egelhaaf
3

4

Erklärung
Ich versichere, dass ich diese Arbeit selbständig und ohne unzulässige Hilfe verfasst habe, keine anderen als die angegebenen Quellen und Hilfsmittel benutzt und Zitate kenntlich gemacht habe.
Patrick Hennig
5

6
Contents
1. Summary ................................................................................................................................92. General introduction and discussion.....................................................................................11
2.1 Scientific Background ......................................................................................................... 11Visual system of the blowfly.................................................................................................. 13Connections within the lobula plate.......................................................................................15Model abstract level............................................................................................................... 17Model optimization ............................................................................................................... 17
2.2. Main projects....................................................................................................................... 19Computational principle underlying the FD1-cell’s object preference .................................19Binocular integration in the circuit presynaptic to the FD1-cell.............................................21Functional analysis on the FD1-circuit...................................................................................22
2.3. General Discussion & Conclusions.....................................................................................25Predictions.............................................................................................................................. 25Functional aspects.................................................................................................................. 26Operating range of the models............................................................................................... 26Abstraction level of the models.............................................................................................. 26Outlook................................................................................................................................... 28
2.4. References........................................................................................................................... 29
3. Distributed Dendritic Processing Facilitates Object Detection: A Computational Analysis on the Visual System of the Fly................................................................................................37
3.1. Abstract............................................................................................................................... 373.2. Introduction......................................................................................................................... 383.3. Methods............................................................................................................................... 393.4. Results................................................................................................................................. 503.5. Discussion........................................................................................................................... 573.6. Acknowledgments............................................................................................................... 623.7. References........................................................................................................................... 62
4. Binocular integration of visual information: a model study on naturalistic optic flow processing..................................................................................................................................67
4.1. Abstract............................................................................................................................... 674.2. Introduction......................................................................................................................... 674.3. Material and Methods.......................................................................................................... 694.5. Discussion........................................................................................................................... 894.6. Conclusions......................................................................................................................... 93
7
4.7. Acknowledgments............................................................................................................... 934.8. Literature............................................................................................................................. 94
5. Neuronal encoding of object and distance information: a model study on naturalistic optic flow processing.........................................................................................................................99
5.1. Abstract .............................................................................................................................. 995.2. Introduction ........................................................................................................................ 995.3. Methods and Material........................................................................................................ 1015.4. Results............................................................................................................................... 1105.5. Discussion......................................................................................................................... 1195.6. Conclusions....................................................................................................................... 1235.7. Acknowledgments............................................................................................................. 1235.8. Literature........................................................................................................................... 123
6. Acknowledgments...............................................................................................................129
8
1. Summary Moving through a structured surrounding requires gathering of spatial information. Collisions with obstacles have to be avoided and objects that may serve, for instance, as landmarks for orientation need to be detected. My work is a contribution to unravel the functional significance of the synaptic interactions within a small neural circuit in the visual system of the fly presumably involved in object-induced behaviors. One output neuron of the circuit, the so-named FD1-cell, responds stronger to moving objects than to the motion of extended background patterns.My study is divided into three parts. The first part analyzes the neuronal mechanisms responsible for the strong object responses of the FD1-cell. I developed a model in several variants implementing different wiring schemes and analyzed mechanisms by computer simulation. In all model variants the object-tuning of the FD1-cell relies on inhibition and non-linear synaptic transfer. The results suggest a presynaptic inhibition of the FD1-cell and led to electrophysiologically testable hypotheses on the wiring scheme. Further, the analysis of the mechanisms hints at functional features of the neural circuit beyond object detection. The spatially distributed inhibition of one model variant is, to some extent, reminiscent of a lateral inhibition network. This functional similarity between the analyzed distributed inhibition circuit and a lateral inhibition network suggests that sensory or perceptual phenomena that are conventionally explained by lateral inhibition may also be explained in an alternative way.The second part of my study targets the complex input organization of the FD1-cell in a more specific way. The FD1-cell is inhibited by the so-named vCH-cell. The vCH-cell receives input from several other identified motion sensitive wide-field neurons. The receptive fields of these wide-field neurons are located in the ipsilateral or contralateral visual field, respectively. It is still unresolved, how this connectivity contributes to the processing of naturalistic image sequences that are shaped by the peculiar dynamical characteristics of free-flight behavior. To disentangle the contributions of the different input components to the cell’s overall response, I used electrophysiologically determined responses of the vCH-cell and of its major input elements to parametrize a model of the vCH-circuit. I could pinpoint the impact of these input elements on the vCH-cell response by stimulating with behaviorally generated optic flow not only extended parts of the visual field of the fly, but also selected regions in the ipsi- and contralateral visual field. My computational model of the vCH-circuit proved to be suitable to account for the performance of its biological counterpart in the blowfly’s visual system.The third part of my study analyzes by model simulations the performance of the FD1-cell as an object detector. I developed a model of the FD1-cell based on the vCH circuitry established in the second part of this study. I optimized the model FD1 circuit with an automatic stochastic algorithm in order to mimic electrophysiological data obtained by stimulation of the biological FD1-cell with semi-naturalistic stimuli. As a consequence, the model shares those properties of its biological counterpart that led to the functional interpretation of being important in the context of
9

object-induced behavior. I assume the model to have predictive power, because it mimics also further properties of the neuron it was not explicitly optimized to. I challenged the model FD1 with targeted test flights: Under the systematically varied conditions of these test flights it became obvious that the responses of all circuit elements are much affected, though in different ways, by the texture of the environment. As a consequence neither the FD1-cell nor other circuit elements respond to an object unambiguously with an activity increase. Depending on the textural conditions and the distance of background structures in the environment clear object responses may be entirely missing. Even FD1-cells, although they show object sensitivity when tested with simple stimuli, are much affected by the distance of the fly to extended structures in the environment. These response characteristics suggest an encoding of information about three-dimensional environments by a population of cells. Because of its pronounced sensitivity to the spatial layout of the environment, the FD1-cell presumably plays a prominent role in such a cell ensemble.
10
2. General introduction and discussion
2.1 Scientific Background
One major aim of neuroscience is to identify the functional relevance of experimentally analyzed neuronal mechanisms, such as the characteristics of a neural circuit. The functional relevance of these mechanisms is in most cases not obvious and subject to speculation. A first step of unraveling the functional relevance of neurons and neural mechanisms is usually to find correlates with neuronal performance at the behavioral or perceptual level of the analyzed system. For example, if we observe an animal, which usually does not collide with objects in its environment, we tend to assume that it is some inherent neural mechanism that is dedicated to collision avoidance and/or object detection. If we now encounter a neuron by electrophysiological analysis in the brain of this animal which responds strongly to objects, we are likely to interpret the neuron as a kind of object detector. Nonetheless, just from the response properties of the neuron we cannot be sure that such an object detector is really required to fulfill the task of collision avoidance. Simulating neuronal mechanisms is a powerful method to test hypotheses not only about their functioning, but also about their functional relevance. Ideally the simulations combine testing these hypotheses with assumptions about how the analyzed neural circuits might be related to behavioral control. One crucial test is the analysis of model performance in a virtual environment after closing the action-perception loop. In such simulations we are able to test whether a model which is built upon the knowledge about the biological system is able to fulfill its assumed functions. Moreover, targeted modifications of model components enable us to determine the relevance of particular computational steps for the model’s overall performance. In this way, it might be possible to pinpoint the functional significance of particular features of the mechanisms. However, a model appropriate for such a kind of simulation experiments is required to share with its biological counterpart structural and response characteristics (on an adequate abstraction level) under a wide range of input conditions. Consequently, we expect a model to perform not only in closed-loop, but also under open-loop conditions. Thus, if we are able to build a model which shares all those characteristics in open-loop with the biological system to be analyzed, we make a probably necessary step into the direction of a closed-loop model. The open-loop analysis is in many cases a necessary first step towards a more comprehensive analysis of a model’s closed-loop performance, especially if neural data are used to parametrize the model components; neural data can usually only be obtained under open-loop conditions. In my thesis I address neuronal computations and functions of a specific neuronal network associated with object-induced behavior by the means of model simulations. For several reasons I chose the visual system of the fly as the biological system on which my model analysis is based.
11
(1) The fly is anatomically well studied and has been extensively investigated by electrophysiological experiments. Particularly well characterized is a region that integrates visual motion information from almost the entire visual field with individually identifiable neurons (see below). (2) Tethered flies flying in a flight simulator show object-related behavior, such as object fixation (Virsik and Reichardt, 1976; Reichardt and Poggio, 1976; Reichardt et al., 1983; Egelhaaf, 1985a; Kimmerle and Egelhaaf, 2000b; Kimmerle et al., 1997; Maimon et al., 2008; Reiser and Dickinson, 2010). Moreover, object-related landing behavior has also been analyzed on free-flying flies (Kimmerle et al., 1996).(3) The FD1-cell (“Figure Detection cell 1”) is a motion sensitive neuron of the fly’s visual system. It integrates optic flow in the fronto-ventral visual field and responds stronger to objects moving in its receptive field than to the motion of spatially extended patterns (Egelhaaf, 1985b). In the following, I will call this distinguishing property ‘preference for objects’, although this is not meant to imply that the FD1 does only respond to objects. (4) Based on this characteristic, FD1 is discussed to mediate object-induced behavior and even to represent an object detector (Egelhaaf, 1985b,c; Egelhaaf and Borst, 1993; Kimmerle and Egelhaaf, 2000a,b).
In former model studies FD1 was analyzed mainly with respect to its preference for objects of limited spatial extent (Egelhaaf, 1985c; Egelhaaf and Borst, 1993). None of these studies on FD1 aimed to reproduce the cell’s characteristic response features evoked by naturalistic stimulation or to consider the assumed complex input organization of the FD1. Rather, how this cell acquires its preference for objects was targeted by the use of experimenter-designed stimuli. Furthermore, new findings on the FD1-cell and the circuit into which it is embedded (Cuntz et al., 2003; Haag and Borst, 2002) could not be taken into account in the earlier modeling studies. Moreover, recent electrophysiological studies revealed that the FD1 responds strongly not only to objects but also to fast background motion (Kimmerle and Egelhaaf, 2000a). Accordingly, under naturalistic stimulation also strong responses of FD1 were generated during presentation of stimulus sequences without objects (Liang et al., in prep).A simulation study by Higgins and Pant (2004) showed that a network similar to that suggested for the FD1-circuit is in principle able to mediate target tracking. Though this model revealed a preference for objects similar to the biological FD1-cell, the functional relevance of the biological FD1 in the context of tracking of moving objects has never been addressed directly.
In my thesis I analyze by model simulations the neural circuit that tunes the fly’s FD1-cell to the preference for objects. The thesis consists of three parts. The first part addresses the neuronal computations responsible for the FD1-cell’s preference for objects. The second part focuses on the complex response characteristics of an element that inhibits the FD1-cell and thus plays an
12
important role in shaping its object preference. This presynaptic neuron is assumed to be a crucial element of the FD1-circuit (see below). Priority in the model simulations of this subproject is given to the binocular integration of visual information. The third part of the thesis combines the results and models of the previous parts into simulations with a detailed model of the FD1-cell. The model’s predictive power is used to address the presumed functions of the network.
Visual system of the blowfly
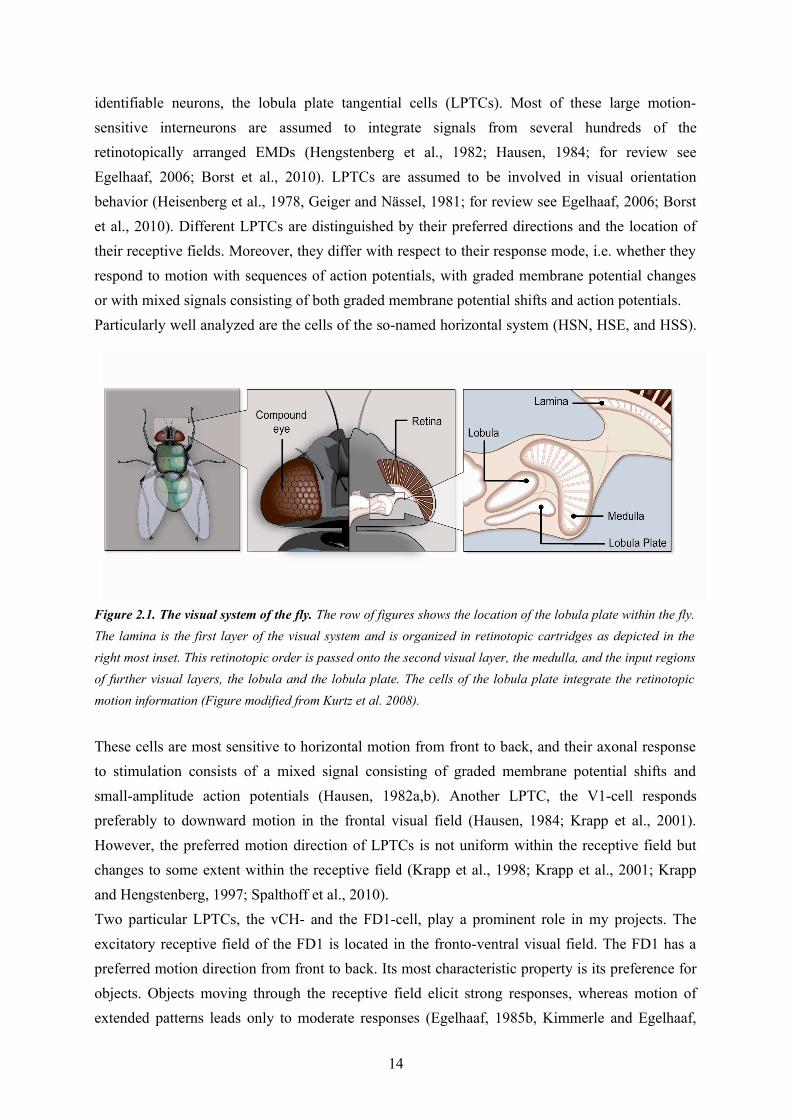
The visual system of the blowfly consists of the two compound eyes, the ocelli and the visual ganglia. For the purposes of the present study the input of the ocelli was considered to be negligible, despite the fact that some impact of the ocelli on particular neurons in the visual motion pathway has been established (Parsons et al., 2006). The visual motion pathway is mainly subserved by the large compound eyes which consist of about 5000 ommatidia arranged in a hexagonal array (Beersma et al., 1977; Hardie, 1985; Petrowitz et al., 2000). Each ommatidium possesses eight photoreceptors, six being sensitive to ultraviolet and green light and two being sensitive in other frequency bands (Hardie, 1985). The six green sensitive receptors (R1-R6) form the input to the motion vision pathway and, thus, to the neurons analyzed in this study (Yamaguchi et al., 2008). The different photoreceptors in each ommatidium of flies have different optical axes. The optic axes of the receptors are organized in a way that seven receptors in neighboring ommatidia have the same sampling direction. These receptors project their signals onto the same target cells in the lamina, the first main layer of the visual system: these large monopolar cells integrate the signals from these receptors (Laughlin, 1981,1994). This integration of signals from different receptors with the same optic axis, originating in different ommatidia is called neuronal superposition (Kirschfeld, 1972; Braitenberg, 1967).The lamina is the first layer of the visual system and is organized in retinotopic cartridges, i. e. neighboring cartridges process signals from neighboring gaze directions. This retinotopic order is passed onto the second visual layer, the medulla, and the input regions of further visual layers, the lobula and the lobula plate (Figure 2.1). Certain elements located in the medulla are assumed to compute local motion information and to propagate this information to the lobula plate (Strausfeld, 1984; Fischbach and Dittrich, 1989; Strausfeld and Lee, 1991; Bausenwein et al., 1992). The neuronal mechanisms of this local motion detection are still unknown. However, a model originally proposed by Hassenstein and Reichardt (1956), which correlates information in space and time, describes, in elaborated versions, the known functional properties of such motion detecting elements ‘in amazing detail’ (Borst et al., 2010; Borst and Egelhaaf, 1989; Egelhaaf, 2006). This so-named elementary motion detector (EMD) generates signals mainly as a function of motion direction, motion velocity, and pattern contrast (Hassenstein and Reichardt, 1956; Borst and Egelhaaf, 1989).Following the parallel and retinotopic processing in the lamina and medulla, the visual motion information converges in the lobula plate. The lobula plate contains about 60 individually
13
identifiable neurons, the lobula plate tangential cells (LPTCs). Most of these large motion-sensitive interneurons are assumed to integrate signals from several hundreds of the retinotopically arranged EMDs (Hengstenberg et al., 1982; Hausen, 1984; for review see Egelhaaf, 2006; Borst et al., 2010). LPTCs are assumed to be involved in visual orientation behavior (Heisenberg et al., 1978, Geiger and Nässel, 1981; for review see Egelhaaf, 2006; Borst et al., 2010). Different LPTCs are distinguished by their preferred directions and the location of their receptive fields. Moreover, they differ with respect to their response mode, i.e. whether they respond to motion with sequences of action potentials, with graded membrane potential changes or with mixed signals consisting of both graded membrane potential shifts and action potentials. Particularly well analyzed are the cells of the so-named horizontal system (HSN, HSE, and HSS).
These cells are most sensitive to horizontal motion from front to back, and their axonal response to stimulation consists of a mixed signal consisting of graded membrane potential shifts and small-amplitude action potentials (Hausen, 1982a,b). Another LPTC, the V1-cell responds preferably to downward motion in the frontal visual field (Hausen, 1984; Krapp et al., 2001). However, the preferred motion direction of LPTCs is not uniform within the receptive field but changes to some extent within the receptive field (Krapp et al., 1998; Krapp et al., 2001; Krapp and Hengstenberg, 1997; Spalthoff et al., 2010).Two particular LPTCs, the vCH- and the FD1-cell, play a prominent role in my projects. The excitatory receptive field of the FD1 is located in the fronto-ventral visual field. The FD1 has a preferred motion direction from front to back. Its most characteristic property is its preference for objects. Objects moving through the receptive field elicit strong responses, whereas motion of extended patterns leads only to moderate responses (Egelhaaf, 1985b, Kimmerle and Egelhaaf,
14
Figure 2.1. The visual system of the fly. The row of figures shows the location of the lobula plate within the fly. The lamina is the first layer of the visual system and is organized in retinotopic cartridges as depicted in the right most inset. This retinotopic order is passed onto the second visual layer, the medulla, and the input regions of further visual layers, the lobula and the lobula plate. The cells of the lobula plate integrate the retinotopic motion information (Figure modified from Kurtz et al. 2008).
2000a,b). The excitatory visual field of an FD1-cell is much larger than the optimum object size (Egelhaaf, 1985b,c).FD1 shares its object preference with other cells of the lobula plate, which differ in their preferred directions and locations of the visual fields (Egelhaaf, 1985b; Gauck and Borst, 1999). FD1 obtains its preference for objects by an inhibitory GABAergic input from the ventral centrifugal horizontal cell (vCH) (Warzecha et al. 1993). This conclusion is based on laser-ablation experiments in which the preference of FD1-cells for objects could be shown to disappear after eliminating the vCH-cell from the circuit. The complex receptive field of the vCH is distributed over the visual field of both eyes (Eckert and Dvorak, 1983; Hausen, 1976a; Hausen, 1984; Krapp et al., 2001; Spalthoff et al. 2010).
Connections within the lobula plate
The majority of the LPTCs are assumed to receive retinotopic input from the EMDs. However several studies revealed additional connections within the lobula plate (Figure 2.2). Most LPTCs receive, in addition to the direct retinotopic input, input from other LPTCs. This is different for the vCH-cell which does not receive direct EMD input, but only input from other mostly identified LPTCs from the ipsilateral and contralateral hemisphere. vCH responds to ipsilateral as well as contralateral optic flow with, at least on average, similar response amplitudes (Egelhaaf et al., 1993).On the ipsilateral side HSE and HSS are known to be electrically coupled with vCH via dendro-dendritic gap junctions (Hausen, 1976a,b; Hausen, 1982a,b; Egelhaaf et al., 1993; Farrow et al., 2003; Haag and Borst, 2005; Haag and Borst, 2002). Four contralateral cells are known to be presynaptic to vCH. The spiking H1- and the H2-cell have a preferred motion direction from back to front, and both excite the vCH (Hausen, 1976a; Eckert and Dvorak, 1983; Hausen, 1984) via chemical synapses (Haag and Borst, 2001; Egelhaaf et al., 1993; Gauck et al., 1997). Despite their similar functional properties H1 and H2 terminate on different dendrites of vCH (Horstmann et al., 2000; Haag and Borst, 2001). A spiking contralateral element, responding best to motion from front to back, inhibits the vCH-cell (Hausen, 1984) with pronounced IPSPs (Egelhaaf et al., 1993; Gauck et al., 1997). This element is not yet anatomically identified and is referred to as Hu-cell. Recordings at different vCH-cell sites indicate that the inhibition by the Hu-cell originates outside the lobula plate on a small dendritic aborization of vCH in the protocerebrum (Haag and Borst, 2001). V1 is the only known input element to vCH with a predominantly vertical preferred direction. The vCH-cell is excited by the V1-cell that receives its input in the contralateral visual field (Hausen, 1984; Haag and Borst, 2003; Haag and Borst, 2008). The vCH-cell inhibits the FD1-cell, most likely via dendritic output synapses (Egelhaaf, 1985b; Warzecha et al., 1993; Gauck et al., 1997). The dCH (dorsal centrifugal horizontal cell) has similar properties as the vCH, but its ipsilateral dendritic aborization resides in parts of the lobula plate which receive retinotopic input from the dorsal visual field. Consequently, it receives its
15
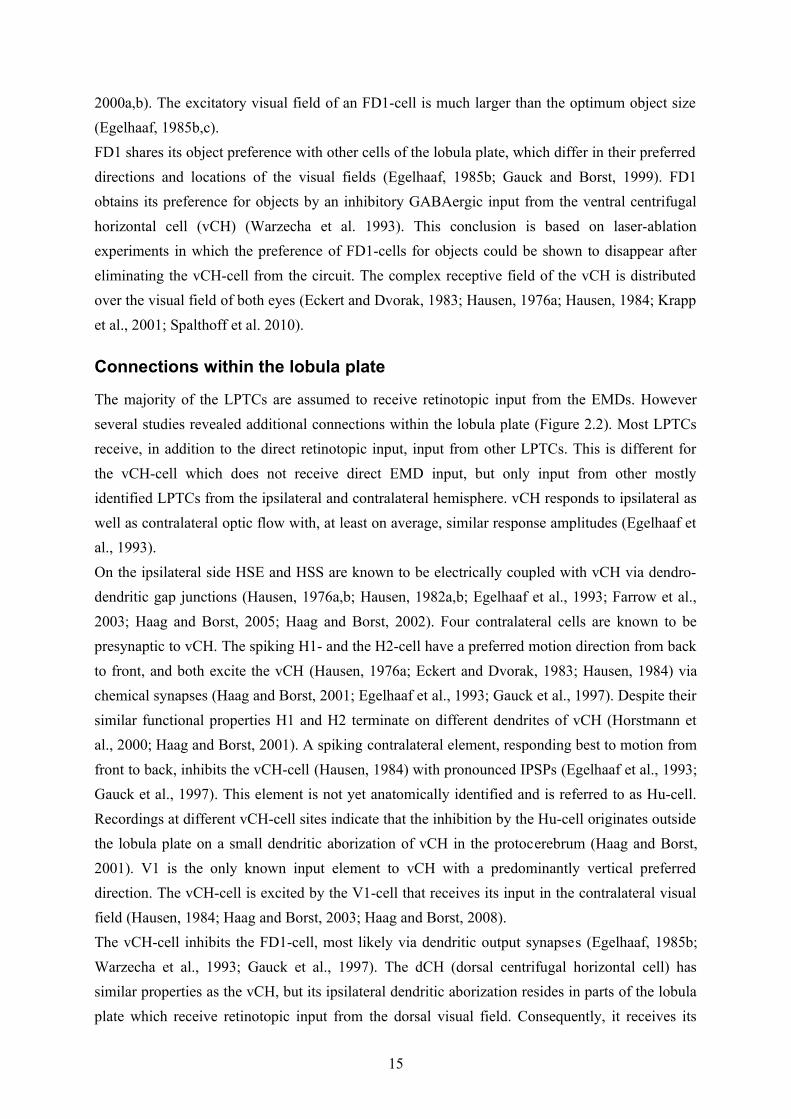
ipsilateral input via dendro-dendritic gap junctions from HSN and HSE, which are sensitive to motion from front to back in the dorsal and equatorial visual field (Hausen, 1982a,b; Farrow et al., 2003; Haag and Borst, 2002). HSN and HSE receive retinotopic motion input (Hausen, 1982a,b) and are excited by the contralateral H1 (Hausen, 1984; Horstmann et al., 2000). The HSE is furthermore electrically coupled to the contralateral H2 via axo-axonal gap junctions (Farrow et al., 2006).Further connections amongst the LPTCs make the lobula plate circuit of motion sensitive neurons
to a recurrent network. H1 and H2 are inhibited by the ipsilateral dCH and vCH (Haag and Borst, 2001). Moreover, it has been concluded that Hu is coupled via electrical synapses to the ipsilateral HSN and HSE (Haag and Borst, 2001). The network shaped by these intricate synaptic connections between LPTCs is predominantly sensitive to horizontal motion (Figure 2.2). Further connections within the lobula plate with cells sensitive to vertical motion are known, but are not considered in my thesis (Haag and Borst, 2003; Warzecha et al., 2000; Kurtz et al., 2001; Haag and Borst, 2007; Farrow et al., 2005; Kalb et al., 2006; for review see Borst et al., 2010).
16
Figure 2.2. Wiring sketch of the lobula plate tangential cells. Shown are those cells with a horizontal preferred motion direction. All elements despite the vCH and dCH receive retinotopic motion input (thick gray lines) from large portions of one eye. The cells of one hemisphere are connected via electrical and chemical synapses with each other. Further connections between the hemispheres lead to a recurrent network. The synaptic connections shown in the diagram are the results of evidence presented in large number of studies (see main text.).

Model abstract level
The models developed in my thesis are based on the assumption that the essential computational mechanisms responsible for the performance of the analyzed neural circuits are, to a large extent, the consequence of synaptic interactions rather than the biophysical details of the mechanisms of signal processing within single neurons. Nevertheless, some properties of individual neurons, such as a gain control resulting from basic electrical properties of neurons (Borst et al., 1995) and the consequences of dendro-dendritic interactions, which result from the specific geometry of the cells, will be shown to be relevant features of the model. Consequently, I choose a level of abstraction for my modeling project which takes the aforementioned aspects into account. The model paradigm is distinguished by some important characteristics: One basic approach was to represent the integration of synaptic input of a cell by a one compartmental passive membrane patch. This approach is computationally simple, but is also capable to describe the effect of activity-dependent gain control (Borst et al., 1995). The computational consequences of spatial interactions within extended dendrites that might be functionally relevant for dendro-dendritic synaptic interactions are implemented as a spatial low pass filter (Cuntz et al., 2003). Models at such a relatively abstract level have been successfully applied in previous simulation studies on neuronal circuits in the insect visual system (Meyer et al., 2011; Borst and Weber, 2011; Weber et al., 2010; Lindemann et al., 2005; Shoemaker et al., 2005, Wiederman et al., 2008; Brinkworth and C’Carroll, 2009; Brinkworth et al., 2008; Wiederman et al., 2010; Torben-Nielsen and Stiefel, 2010).Other model paradigms such as compartmental models with active processes such as provided by the simulation environment ‘NEURON’ (Carnevale and Hines, 2006) are certainly able to describe neurons and networks of neurons at a more detailed level, but seem not to be suitable for my purposes. Such detailed models (1) are presumably not necessary for my purposes, because the experimental key results that are the basis of my thesis can be explained by more abstract models, (2) would require information, which is currently not known, on a huge number of cell properties such as distributions of conductance and active sections in the dendrites and axons, and (3) would require high computational power for the simulations and, thus, would exacerbate considerably the adjustment of the model parameters to the characteristics of the corresponding biological neurons (Eichner et al., 2009).
Model optimization
Though the models developed in my thesis are parsimonious from a computational point of view in comparison with compartmental models, they have still up to 35 free parameters. These parameters had to be optimized to adjust the models to the biological data. Because the system is not analytically accessible for optimization and too complex to adjust it manually, I choose the optimization method ‘Differential Evolution’ for adjusting the model parameters. Differential Evolution is a convenient optimization procedure for continuous, non-linear and
17

multidimensional, but analytically inaccessible functions (Storn and Price, 1997; Price, 1999). The algorithm simulates an evolution of a population. Each individual in this population is represented by a value vector. In the case of my optimization these values are the parameters of the model. Each set of parameters is evaluated by an objective function which quantifies the similarity between model and biological cell responses. To accelerate the optimization and make it practicable I parallelized the computational implementation of the model and processed it on high performance computer clusters. The model of the peripheral visual system was not optimized in my thesis. I used the periphery model as parametrized by Lindemann and colleagues (2005).
18
2.2. Main projectsThe main projects of my thesis address from different perspectives the computations performed by the neural circuit that underlies the preference of the blowfly FD1-cell for objects. It is the common goal of all three projects to contribute to our thorough understanding of basic principles of neural computation by synaptic interactions within the neural circuit, on the one hand, as well as of the functional consequences of these computations under the normal operating conditions of the analyzed system.
Computational principle underlying the FD1-cell’s object preference
The aim of the first project (Chapter 3) was to unravel the fundamental computational principle underlying the FD1-cell’s the preference for objects. Constraints imposed by the general response characteristics of the biological FD1-cell had to be reproduced by the model. However, a detailed replication of neuronal circuitry was not intended. The FD1-cell is assumed to obtain its preference for objects through inhibition via another motion sensitive LPTC. Laser-ablation experiments identified the vCH-cell as the likely element for this inhibition (see above). Although the mechanisms underlying object sensitivity of the FD1-cell have not yet been unraveled in detail, simple models have been proposed that can explain a preference for objects similar to that of the FD1-cell (Egelhaaf, 1985c; Reichardt et al., 1983; Borst and Egelhaaf, 1993).After these models were proposed, the mechanisms underlying the preference for objects could be further constrained by additional anatomical and electrophysiological data. (1) There is now good evidence for spatially distributed interactions in the input circuit of FD1 or directly on its dendritic tree (Haag and Borst, 2002; Egelhaaf et al., 1993). (2) The responses of FD1-cells were found to depend on object and background velocity in a very peculiar way, in addition to the already known preference for objects (Kimmerle and Egelhaaf, 2000a). I will refer to the FD1-cell's dependence on the object and background velocities as “velocity dependence”. Furthermore neither electrophysiological experiments nor the model simulations could previously solve the problem of how the inhibition of the FD1 is accomplished in detail. The inhibition might act directly onto the FD1-cell but as well onto its retinotopically arranged presynaptic elements. I developed three different model variants of the FD1-circuit, each implementing a different organization of the inhibition (Figure 2-3). For all wiring schemes I assumed the same receptive field for the inhibitory neuron and the FD1-cell, because I wanted to find out, whether under this condition it is possible to obtain preference for objects. In model simulations I analyzed the different wiring schemes with respect to their ability to comply with the constraints given by the preference for objects and velocity dependence of the biological FD1-cell. To adjust the models to the specifications gathered from the electrophysiological data, I optimized the model parameters by means of an automatic and stochastic optimization algorithm (see above).
19
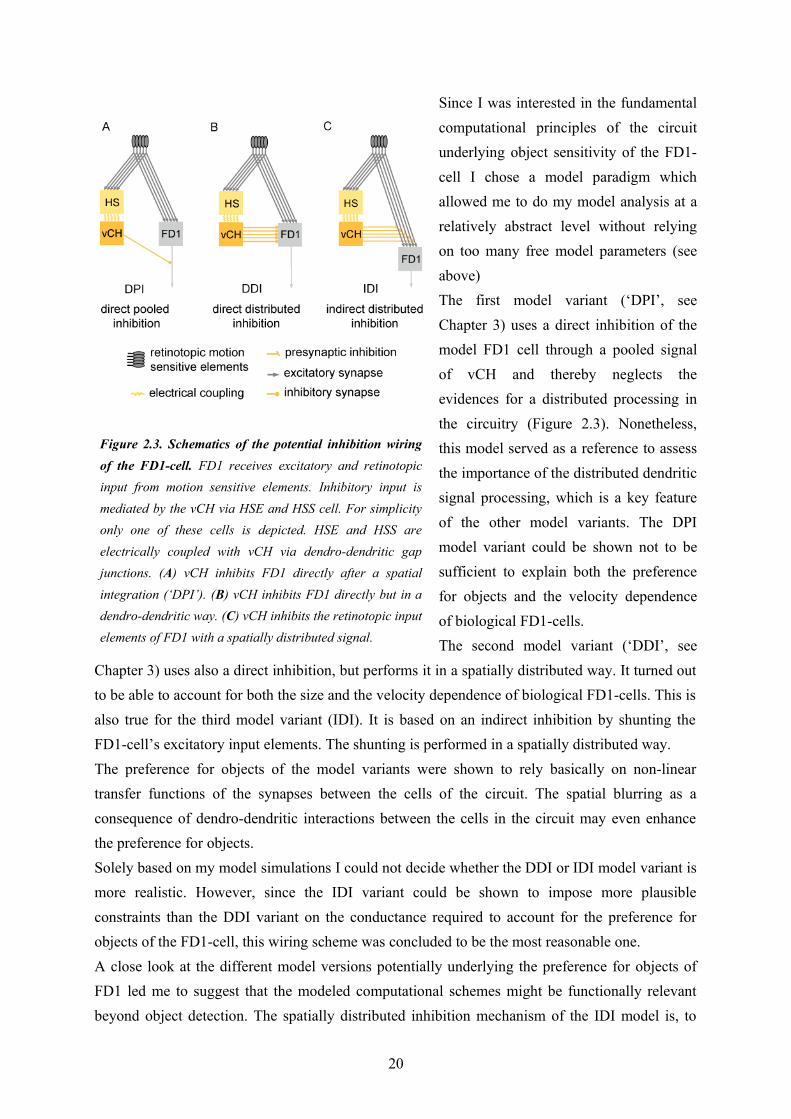
Since I was interested in the fundamental computational principles of the circuit underlying object sensitivity of the FD1-cell I chose a model paradigm which allowed me to do my model analysis at a relatively abstract level without relying on too many free model parameters (see above)The first model variant (‘DPI’, see Chapter 3) uses a direct inhibition of the model FD1 cell through a pooled signal of vCH and thereby neglects the evidences for a distributed processing in the circuitry (Figure 2.3). Nonetheless, this model served as a reference to assess the importance of the distributed dendritic signal processing, which is a key feature of the other model variants. The DPI model variant could be shown not to be sufficient to explain both the preference for objects and the velocity dependence of biological FD1-cells. The second model variant (‘DDI’, see
Chapter 3) uses also a direct inhibition, but performs it in a spatially distributed way. It turned out to be able to account for both the size and the velocity dependence of biological FD1-cells. This is also true for the third model variant (IDI). It is based on an indirect inhibition by shunting the FD1-cell’s excitatory input elements. The shunting is performed in a spatially distributed way. The preference for objects of the model variants were shown to rely basically on non-linear transfer functions of the synapses between the cells of the circuit. The spatial blurring as a consequence of dendro-dendritic interactions between the cells in the circuit may even enhance the preference for objects. Solely based on my model simulations I could not decide whether the DDI or IDI model variant is more realistic. However, since the IDI variant could be shown to impose more plausible constraints than the DDI variant on the conductance required to account for the preference for objects of the FD1-cell, this wiring scheme was concluded to be the most reasonable one. A close look at the different model versions potentially underlying the preference for objects of FD1 led me to suggest that the modeled computational schemes might be functionally relevant beyond object detection. The spatially distributed inhibition mechanism of the IDI model is, to
20
Figure 2.3. Schematics of the potential inhibition wiring of the FD1-cell. FD1 receives excitatory and retinotopic input from motion sensitive elements. Inhibitory input is mediated by the vCH via HSE and HSS cell. For simplicity only one of these cells is depicted. HSE and HSS are electrically coupled with vCH via dendro-dendritic gap junctions. (A) vCH inhibits FD1 directly after a spatial integration (‘DPI’). (B) vCH inhibits FD1 directly but in a dendro-dendritic way. (C) vCH inhibits the retinotopic input elements of FD1 with a spatially distributed signal.

some extent, similar to a lateral inhibition network. This functional similarity between the analyzed circuit and the lateral inhibition network suggests that sensory or perceptual phenomena that are conventionally explained by lateral inhibition may also be accounted for in an alternative way.
Binocular integration in the circuit presynaptic to the FD1-cell
In the first project I focused on the basic wiring scheme of the FD1-cell and its associated computational properties. The inhibitory element had a receptive field identical to the FD1-model cell. Furthermore the dendritic signal processing in the inhibitory element was rather simplistically assumed to be accomplished by spatial low-pass filtering of the retinotopic motion input. In contrast to this model, the vCH-cell, identified as the inhibitory element of FD1, has a more complex input organization and receptive field than implemented in the model analyzed in the first part of my thesis. With its complex response characteristic vCH is assumed to be a crucial element of the FD1-circuit. Despite the known input organization of the vCH-cell, it was not fully understood on the basis of previous studies how it merges the signals from input elements originating in both brain hemispheres and how these elements contribute to the complex vCH response characteristics.Therefore, the second part of my thesis targets the binocular integration performed by the vCH-cell. I developed a model of the vCH and its major input elements H1, HSE, HSS and Hu. The model vCH, H1, HSE and HSS were tuned by an optimization process to mimic the data from electrophysiological experiments. These data were obtained using semi-naturalistic stimulation based on flights of freely flying flies. The models reflect the cellular responses with a remarkable precision. I challenged the models with visual motion sequences generated by free-flying flies during flights that were not used for parameter optimization. The performance of the vCH model and its presynaptic elements in these controls suggest that the models have predictive power.All analyzed cells presynaptic to vCH integrate visual information from extended parts of the field of view. I used the stimulation of various combinations of regions of the visual field to assess the relevance of the interactions between the different input areas. Comparing superpositions of neural responses to partial stimulation and responses to a combined stimulation revealed differences in the cells of the circuit with respect to the relevance of different input areas. The H1 responses to stimulation of different parts of the visual field add almost linearly. HSE and HSS perform a sub-linear addition of responses to different stimulated regions. The model counterparts of these cells reflect these integration properties. The contributions of H1, HSS, and HSE to the overall response of the model vCH-cell suggest the integration properties of the H1- and HS-cells to be, at least partly, reflected in the vCH response. Nevertheless, differences between the superimposed responses of model vCH and neural vCH hint at computations not fully reproduced by the model. Despite such differences the model vCH
21
generates for stimulation with naturalistic optic flow time-dependent responses similar to those of its biological counterpart and seems to be suitable to serve as a model of the inhibitory element in a detailed model circuit of the FD1.
Functional analysis on the FD1-circuit
The third part of my thesis targets functional aspects of the FD1-cell. It uses the results of the first two parts and combines the models. The simplified inhibitory element and the artificial velocity input of the FD1-cell model developed in the first part are replaced by the model vCH and its input circuitry proposed in the second part. Thus, the resulting FD1 model takes major parts of the electrophysiologically established FD1-cell circuitry into account and comprises those features which led to its preference for objects of FD1 established in the first part of my thesis. The combined circuit model comprises the FD1 and its presynaptic elements vCH, HSE, HSS, Hu, and H1. The aim was to construct an FD1 model which accounts for those properties of its biological counterpart that led to the functional interpretation of being important in the context of object-induced behavior. Furthermore, I intended to design a model with predictive power adequate to reproduce the qualitative features of the responses of the biological FD1 under the conditions of naturalistic stimulation.In a first step different model variants were optimized in order to mimic the experimentally recorded electrical responses of a FD1-cell to naturalistic stimulation. The best of the tested model variants has a preference for objects similar to the biological FD1-cell and mimics its time course quite well, although with some deviations. Thus, this model displays the relevant properties leading to the functional interpretation of the FD1 as being involved in mediating object-induced behavior.To quantify the similarity between model and cell responses I analyzed the responses with respect to further characteristics of the FD1-cell found in electrophysiological data (Liang et al., in prep.). The responses of all circuit elements are affected, though in different ways, by the distance to walls in a virtual flight arena and the presence of objects in the environments. Each model cell of the circuit mimics the characteristics of its biological counterpart quite well. It turned out that the response of the FD1 cell and model is affected by the presence of objects and distances in a way indicating that the FD1 might encode distance independent of object-size. The congruence on these characteristics of neurons and cell models suggests predictive power of all models of the circuit.In a second step I addressed functional aspects of the circuit. I challenged the model by systematic variations of straight flight sequences to test hypotheses on the function of the FD1-cell. On these tests flights the model FD1 did not respond to an object with a clear activity increase. The object-inducted response changes are superposed by a strong texture dependence of the responses of all circuit elements including the FD1-cell. As a consequence, the model responses to stimuli without
22

object overlap to a large extent with the range of responses to stimuli without objects. This finding suggests that the FD1 is not able to unambiguously detect objects and encode the fly’s distance to structures in the environment.
23

24
2.3. General Discussion & Conclusions
Predictions
Elaborations of the inhibitory mechanism proposed before to explain the discrimination of an object from its background (Reichardt et al., 1983, Egelhaaf, 1985c) could be shown in my thesis to be capable to account not only for the preference of the FD1-cell for objects (Egelhaaf, 1985b), but also for its dependence on velocities of an object and its background (Kimmerle and Egelhaaf, 2000a). However, only those model variants with a spatially distributed inhibition were able to jointly explain the preference for objects and the velocity dependence. The assumption of a spatially distributed inhibition is in accordance with experimental data obtained in the fly: (1) The inhibitory vCH and the postsynaptic FD1 dendrites in the lobula plate are spatially close to each other (Egelhaaf et al., 1993; Warzecha et al., 1993; Gauck et al., 1997). (2) The distributed inhibition of FD1 requires a distributed activation of the arborizations of the inhibitory vCH when stimulated by spatially restricted stimuli. Such a distributed activation was observed for the vCH-cell (Gauck et al., 1997). The activation is assumed to be transferred electrically by dendro-dendritic gap junctions from HS-cells to the vCH-cell (Haag and Borst, 2002). (3) Swellings on the vCH arborization in the lobula plate, which are thought to be indicators of presynaptic sites, indicate that these arborizations are not only an input region but also an output region of the cell (Gauck et al., 1997).My conclusion that vCH inhibits FD1 indirectly via its retinotopic presynaptic elements leads to two electrophysiologically testable predictions: (1) Two objects moving with some distance through the excitatory receptive field should lead to a higher response than two objects with a smaller distance or a single object with twice the size of a single objects. A similar effect has already been observed in visual interneurons of the dragonfly (Geurten et al., 2007). (2) As a consequence of the presynaptic inhibition of FD1 the decreasing cellular response with an increasing object size is expected to lead to a decrease of the FD1-cell’s input resistance; in contrast, direct inhibition of FD1 should lead to an increased input resistance with increasing size of the stimulus pattern. The simulations with the elaborated FD1-circuit (Chapter 5) reveal high texture dependence not only of the FD1-cell, but of all circuit elements. Such dependence has previously been described in HS-cells (Egelhaaf et al., 1989; Rajesh et al., 2005; Shoemaker et al., 2005). It should also be verified in electrophysiological experiments on FD1 by stimulating real flies with the optic flow generated on the test flights that were simulated in my thesis. Such experiments would challenge the predictive power of the proposed model. The texture dependence of the responses of FD1 might even be tested in behavioral experiments. If the FD1 activity is texture dependent and FD1 is involved object-induced behaviors like landing
25
on objects, consequences of the texture dependence might be observable when analyzing the landing performance.
Functional aspects
FD1 has been discussed to mediate object-induced behavior or even to represent an object detector (Egelhaaf, 1985b,c; Egelhaaf and Borst, 1993; Kimmerle and Egelhaaf, 2000a,b). Later experiments suggested that FD1-cells might, in addition, encode the distance between fly and environmental structures (Liang et al., in prep.). The results on targeted test flights (Chapter 5) cause doubt on the ability of FD1-cells to unambiguously represent the presence of an object or distance information. This is because object and distance information are in many situations occluded by the pronounced pattern-dependent response components found in LPTCs, in general, and in FD1 in particular. Nevertheless, the FD1-cell might be involved in controlling object-related behavior, although not alone, but as an important member of an ensemble of neurons representing in different ways object and spatial information. The analyses on the computational properties of the FD1-cell preference for objects (Chapter 3) hint at a high functional versatility of the indirect distributed inhibition that is assumed for the FD1-circuit. Thus, the preference for objects of the FD1-cell might only be a side effect of its more widespread functional significance.
Operating range of the models
The model of the FD1-circuit is currently adjusted only to the luminance and contrast conditions of the electrophysiological experiments that led to the data applied to parametrize the model (Liang et al., in prep; Hennig et al., 2011; Lindemann et al., 2005). The non-linear contrast processing and adaptive processes in the peripheral visual system of flies (Laughlin and Hardie, 1978; Laughlin, 1989; French et al., 1993) were, so far, not included into my models. These peripheral processes need to be included, if the models are to be tested under stimulus conditions that encompass the entire naturally occurring brightness range. Models of peripheral visual information processing in flies were developed in previous studies simulating the responses to patterns with a natural range of luminance and contrast (Mah et al., 2008; van Hateren and Snippe, 2001). When incorporated into models of LPTCs or visual interneurons of other species the models of peripheral visual information processing allowed these model interneurons to perform under a wide range of luminance and contrast conditions (Shoemaker et al. 2005, Wiederman et al. 2008; Brinkworth and C’Carroll, 2009; Brinkworth et al. 2008; Wiederman et al. 2010; Meyer et al., 2011).
Abstraction level of the models
The level of abstractions employed for all elements of the models of the FD1 circuit as investigated in my thesis turned out to be suitable to explain the key properties of their biological
26
counterparts (see Chapter 3, (Hennig et al., 2008)). The time-dependent responses of the models of the elements H1, HSE, HSS, and vCH that are all presynaptic to FD1 are nearly within the range of response variability measured in the corresponding biological cells (see Chapter 4, (Hennig et al. 2011)). The models even account for responses to naturalistic stimuli they were not explicitly optimized to. This suggests predictive power of the models. Furthermore, the models reflect in the superposition analysis the gain control properties as are characteristic of the respective biological cells.The conformity between the responses of model cells and neurons also shows up in the intersaccadic response levels, i. e. in the responses between the fast saccadic turns of flies, where they fly largely on a straight path and have a constant gaze direction (van Hateren et al., 1999). Here, the model circuit elucidates the interactions between the cells that are responsible for the characteristic intersaccadic activity levels under different environmental conditions (see Chapter 5).Only the computations in the vCH are not fully grasped by its model. The response superposition of the model responses does not reflect the biological cell’s properties in some respect. It remains unresolved whether this discrepancy between model and cellular performance can be accounted for by employing a more detailed model with active processes to describe signal processing within the vCH. Alternatively, it might be sufficient to use a two-compartmental model as was used for modeling of VS- cells, another type of LPTC, in the lobula plate (Weber and Borst, 2011). This slightly more detailed approach would probably allow for attributing different properties to the different input regions of the vCH in the lobula and the protocerebrum (Haag and Borst, 2001; Horstmann et al., 2000).The LPTCs in the lobula plate are known to form through their synaptic interconnections a recurrent network (see above). My model circuit does not make use of this recurrence; it is entirely feed-forward. Nonetheless, the model performance grasps the key-properties of the corresponding biological neural circuit. This is possibly a consequence of the stimuli used, which are based on real-flight sequences and, for instance, do not contain backward translations, since such flight situations do not occur naturally in blowflies. The dominant movements of blowflies during free-flight are, apart from rapid saccadic rotations, forward translations with some side ward components (Schilstra and van Hateren, 1999; van Hateren and Schilstra, 1999). A combination of electrophysiological and model experiments using other naturalistic stimuli may help to elucidate the relevance of the recurrences in the network of the lobula plate. If the good performance of my feed forward model is due to the stimuli reconstructed from spontaneous flights in a flight arena, potential consequences of the recurrences may get visible under the stimulus conditions experienced by the fly in more specific flight situations. Such situations might for example be generated by distinct air puffs disturbing a flight of a freely flying fly.
27
Outlook
A similarity between responses of models and neurons does not mean that the model circuit encodes the same information used for controlling the behavior as its biological counterpart. The potential functional relevance of small but significant differences between neuron and model responses of the FD1 circuit could not be examined in my thesis. The probably best criterion to assess the adequacy of the analyzed FD1 model circuit could be based on the performance of a model fly, with the circuit in its visual input pathway. If the model fly’s performance under closed-loop cannot be distinguished from that of a real fly we have reached the best we can expect.The results of my thesis are a decisive step towards closing the action perception loop in a closed loop simulation of a comprehensive fly model. This step was necessary, because the sensory FD1 circuit could only be parametrized under open-loop conditions, as the corresponding electrophysiological data that served as reference, for methodological reasons, could only be acquired in open-loop. Before extending the model of the FD1 circuit to serve as a sensory module in a comprehensive fly model, the FD1 model needs to be adjusted to the broad range of natural light and contrast conditions (see above). Moreover, a further step would certainly be to extend the FD1 model by additional LPTCs, especially the ones preferably sensitive to vertical motion. Future experimental studies going beyond already existing ones and investigating how self-motion information and information about the environment is encoded by these LPTCs (Kern et al., 2005; van Hateren et. al., 2005; Karmeier et al., 2006; Liang et al., in prep.) may accompany this model extension.
28
2.4. ReferencesBausenwein, B., Dittrich, A., and Fischbach, K.-F. (1992). The optic lobe of Drosophila melanogaster II. Sorting of retinotopic pathways in the medulla. Cell Tissue Res. 267, 17-28.
Beersma, D., Stavenga, D., and Kuiper, J. (1977). Retinal lattice, visual field and binocularities in flies. J. Comp. Physiol. 119, 207-220.
Borst, A. and Egelhaaf, M. (1989). Principles of visual motion detection. Trends Neurosci. 12, 297-306.
Borst, A. and Egelhaaf, M. (1993). Processing of synaptic signals in fly visual interneurons selectively responsive to small moving objects. In: Brain theory - spatio-temporal aspects of brain function, eds Aertsen, A. and Seelen, W., Elsevier, 47-66.
Borst, A. and Weber, F. (2011). Neural action fields for optic flow based navigation: a simulation study of the fly lobula plate network. PLoS One 6, e16303.
Borst, A., Egelhaaf, M., and Haag, J. (1995). Mechanisms of dendritic integration underlying gain control in fly motion-sensitive interneurons. J. Comput. Neurosci. 2, 5-18.
Borst, A., Haag, J., and Reiff, D. F. (2010). Fly motion vision. Annu Rev Neurosci. 33, 49-70
Braitenberg, V. (1967). Patterns of projection in the visual system of the fly. Exp. Brain Res. 3, 271-298.
Brinkworth, R. S. A. and O'Carroll, D. C. (2009). Robust models for optic flow coding in natural scenes inspired by insect biology. PLoS Comput. Biol. 5(11), e1000555. doi:10.1371/journal.pcbi.1000555.
Brinkworth, R. S. A.; Mah, E.-L., Gray, J. P., and O'Carroll, D. C. (2008) Photoreceptor processing improves salience facilitating small target detection in cluttered scenes. J. Vis. 8, 1-17.
Carnevale N.T., and Hines M. L. (2006). The NEURON Book. Cambridge: Cambridge University Press.
Cuntz, H., Haag, J., and Borst, A. (2003) Neural image processing by dendritic networks. Proc. Natl. Acad. Sci. 100, 11082-11085.
Eckert H., Dvorak DR. (1983) The centrifugal horizontal cells in the lobula plate of the blowfly, Phaenicia sericata. J. Insect Physiol. 29, 547-560.
Egelhaaf, M. (1985b). On the neuronal basis of figure-ground discrimination by relative motion in the visual system of the fly. II. Figure-detection cells a new class of visual interneurones. Biol. Cybern. 52, 195-209.
29
Egelhaaf, M. (1985c). On the neuronal basis of figure-ground discrimination by relative motion in the visual system of the fly. III. Possible input circuitries and behavioural significance of the FD-cells. Biol. Cybern. 52, 267-280.
Egelhaaf M. (2006). The neural computation of visual motion information. In: Invertebrate vision, eds Warrant E., Nielsson D.E. (Cambridge, Cambridge University Press), 399-461.
Egelhaaf, M. and Borst, A. (1993). Motion computation and visual orientation in flies. Comp. Biochem. Physiol. 104(4), 659-673.
Egelhaaf, M.; Borst, A. and Reichardt, W. (1989). Computational structure of a biological motion-detection system as revealed by local detector analysis in the fly's nervous system. J. Opt. Soc. Am. A 6, 1070-1087.
Egelhaaf, M., Borst, A., Warzecha, A. K., Flecks, S., and Wildemann, A. (1993). Neural circuit tuning fly visual neurons to motion of small objects. II. Input organization of inhibitory circuit elements revealed by electrophysiological and optical recording techniques. J. Neurophysiol. 69, 340-351.
Egelhaaf, M., Hausen, K., Reichardt, W., and Wehrhahn, C. (1988). Visual course control in flies relies on neuronal computation of object and background motion. Trends Neurosci. 11, 351-358.
Eichner, H.; Klug, T., and Borst, A. (2009). Neural simulations on multi-core architectures. Front. Neuroinformatics 3, 21.
Farrow, K.; Borst, A. & Haag, J. (2005). Sharing receptive fields with your neighbors: tuning the vertical system cells to wide field motion. J. Neurosci. 25, 3985-3993.
Farrow, K.; Haag, J. and Borst, A.. (2003). A. Input organization of multifunctional motion-sensitive neurons in the blowfly. J Neurosci, , 23, 9805-9811.
Farrow, K.; Haag, J., and Borst, A.. (2006). Nonlinear, binocular interactions underlying flow field selectivity of a motion-sensitive neuron. Nat Neurosci. 9, 1312-1320.
Fischbach, K.-F. and Dittrich, A. (1989). The optic lobe of Drosophila melanogaster I. A Golgi analysis of wild-type structure. Cell Tissue Res. 258, 441-475.
French, A.S., Korenberg, M.J., Järvilehto M., Kouvalainen, E., Juusola, M., Weckström, M. (1993). The dynamic nonlinear behavior of fly photoreceptors evoked by a wide range of light intensities. Biophys J. 65(2), 832-839.
Gauck, V. and Borst, A. (1999) Spatial response properties of contralateral inhibited lobula plate tangential cells in the fly visual system. J Comp Neurol., 406, 51-71.
Gauck, V., Egelhaaf, M., and Borst, A. (1997). Synapse distribution on VCH, an inhibitory, motion-sensitive interneuron in the fly visual system. J. Comp. Neurol. 381, 489-499.
Geiger, G. and Nässel, D. (1981). Visual orientation behaviour of flies after selective laser beam ablation of interneurones. Nature 293, 398-399.
30
Geurten, B. R. H.; Nordström, K.; Sprayberry, J. D. H.; Bolzon, D. M. & O'Carroll, D. C. (2007). Neural mechanisms underlying target detection in a dragonfly centrifugal neuron. J. Exp Biol. 210, 3277-3284.
Haag, J. and Borst, A. (2001). Recurrent network interactions underlying flow-field selectivity of visual interneurons. J. Neurosci. 21, 5685-5692.
Haag, J. and Borst, A. (2002). Dendro-dendritic interactions between motion-sensitive large-field neurons in the fly. J. Neurosci. 22, 3227-3233.
Haag, J. and Borst, A. (2003). Orientation tuning of motion-sensitive neurons shaped by vertical-horizontal network interactions. J. Comp. Physiol. A 189, 363-370.
Haag, J. and Borst, A. (2005). Dye-coupling visualizes networks of large-field motion-sensitive neurons in the fly. J.Comp.Physiol. A 191, 445-454.
Haag, J. and Borst, A. (2007). Reciprocal inhibitory connections within a neural network for rotational optic-flow processing. Front. Neurosci. 1, 111-121.
Haag, J. and Borst, A. (2008). Electrical coupling of lobula plate tangential cells to a heterolateral motion-sensitive neuron in the fly. J. Neurosci. 28, 14435-14442.
Hardie, R. (1985). Functional organization of the fly retina. In: Progress in Sensory Physiology 5. eds. Autrum, H., Ottoson, D., Perl, E., Schmidt, R., Shimazu, H. & Willis, W., Springer, 1-79.
Hassenstein, B., and Reichardt, W. (1956). Systemtheoretische Analyse der Zeit-, Reihenfolgen- und Vorzeichenauswertung bei der Bewegungsperzeption des Rüsselkafers Chlorophanus. Z.Naturforsch. 11 b, 513-524.
Hausen, K. (1976a) Struktur, Funktion und Konnektivität bewegungsempfindlicher Interneurone im dritten optischen Neuropil der Schmeissfliege Calliphora erythrocephala. Doctoral Dissertation, 1976.
Hausen, K. (1976b). Functional charaterization and anatomical identification of motion sensitive neurons in the lobula plate of the blowfly Calliphora erythrocephala. Z. Naturforsch. 31c, 629-633.
Hausen K. (1981) Monocular and binocular computation of motion in the lobula plate of the fly. Verh. Dtsch. Zool. Ges. 74, 49-70.
31
Hausen, K. (1982a) Motion sensitive interneurons in the optomotor system of the fly. I. The Horizontal Cells: Structure and signals. Biol. Cybern. 45, 143-156.
Hausen, K. (1982b). Motion sensitive interneurons in the optomotor system of the fly. II. The Horizontal Cells: Receptive field organization and response characteristics. Biol.Cybern. 46, 67-79.
Hausen, K. (1984). “The lobula-complex of the fly: Structure, function and significance in visual behaviour” In: Photoreception and vision in invertebrates, ed Ali, M. A. (Plenum Press), 523-559.
Hausen, K. and Wehrhahn, C. (1983) Microsurgical lesion of horizontal cells changes optomotor yaw responses in the blowfly Calliphora erythrocephala. Proc.R.Soc.Lond.B. 219, 211-216.
Heisenberg, M., Wonneberger, R., and Wolf, R. (1978). Optomotor-blind - a Drosophila mutant of the lobula plate giant neurons. J.Comp.Physiol. 124, 287-296.
Hengstenberg, R., Hausen, K., and Hengstenberg, B. (1982). The number and structure of giant vertical cells (VS) in the Lobula plate of the blowfly, Calliphora erythrocephala. J.Comp.Physiol. 149, 163-177.
Hennig, P., Kern, R., and Egelhaaf, M. (2011). Binocular integration of visual information: a model study on naturalistic optic flow processing. Front. Neural Circuits. 5:4. doi: 10.3389/fncir.2011.00004
Hennig, P., Möller, R., and Egelhaaf, M. (2008). Distributed dendritic processing facilitates object detection: a computational analysis on the visual system of the fly. PLoS ONE 3(8), e3092. doi:10.1371/journal.pone.0003092.
Higgins, C. M. and Pant, V. (2004). An elaborated model of fly small-target tracking. Biol Cybern. 91, 417-428.
Horstmann, W., Egelhaaf, M., and Warzecha, A. K. (2000). Synaptic interactions increase optic flow specificity. Eur. J. Neurosci. 12, 2157-2165.
Kalb, J., Egelhaaf, M., and Kurtz R. (2006). Robust integration of motion information in the fly visual system revealed by single cell photoablation. J Neurosci. 26(30), 7898-906.
Kalb, J., Nielsen, T., Fricke, N., Egelhaaf, M., and Kurtz, R. (2004). In vivo two-photon laser-scanning micrscopy of Ca2+ dynamics in visual motion-sensitive neurons. Biochem. Biophys. Res. Communic. 316, 341-347.
32
Karmeier, K., van Hateren, J.H., Kern, R., and Egelhaaf, M. (2006). Encoding of naturalistic optic flow by a population of blowfly motion-sensitive neurons. J Neurophysiol. 96(3), 1602-1614.
Kern, R., van Hateren, H.J., Michaelis, C., Lindemann, J.P., and Egelhaaf, M. (2005) Function of a fly motion-sensitive neuron matches eye movements during free flight. PLoS-Biology 3(6), e171.
Kimmerle, B., Srinivasan, M., and Egelhaaf, M. (1996). Object detection by relative motion in freely flying flies Naturwiss. 83, 380-381.
Kimmerle, B., Warzecha, A., and Egelhaaf, M. (1997). Objekt detection in the fly during simulated translatory flight. J Comp Physiol A. 181, 247-255.
Kimmerle, B., Eickermann, J., and Egelhaaf, M. (2000). Object fixation by the blowfly during tethered flight in a simulated three-dimensional environment. J Exp Biol. 203, 1723-1732.
Kimmerle, B. and Egelhaaf, M. (2000a). Detection of object motion by a fly neuron during simulated flight. J. Comp. Physiol. A 186, 21-31.
Kimmerle, B. and Egelhaaf, M. (2000b) Performance of fly visual interneurons during object fixation. J. Neurosci. 20, 6256-6266.
Kirschfeld, K. (1972). The visual system of Musca. In: Studies on optics, structure and function Information processing in the visual system of arthropods, ed. Wehner, R., 61-74, Springer.
Krapp, H. G., Hengstenberg, B., and Hengstenberg, R. (1998) Dendritic structure and receptive-field organization of optic flow processing interneurons in the fly. J Neurophysiol. 79, 1902-1917.
Krapp, H. G. and Hengstenberg, R. (1997). A fast stimulus procedure to determine local receptive field properties of motion-sensitive visual interneurons. Vision Re. 37, 225-234.
Krapp, H. G., Hengstenberg, R., and Egelhaaf, M. (2001). Binocular contributions to optic flow processing in the fly visual system. J. Neurophysiol. 85, 724-734.
Kurtz, R., Kalb, J., and Spalthoff, C. (2008). Examination of fly motion vision by functional fluorescence techniques. Front Biosci., 13, 3009-3021.
Kurtz, R., Warzecha, A.-K., and Egelhaaf, M. (2001). Transfer of visual motion information via graded synapses operates linearly in the natural activity range. J. Neurosci. 21, 6957-6966.
Laughlin, S. B. (1989). The role of sensory adaptation in the retina. J Exp Biol. 146, 39-62.
Laughlin, S., and Hardie, R. (1978). Common Strategies for light adaptation in the peripheral visual systems of fly and dragonfly. J. Comp. Physiol. A 128, 319-340.
Liang, P., Heitwerth, J., Kern, R.., Kurtz, R., and Egelhaaf M. (in prep.) Visual object detection and distance encoding in three-dimensional environments by a neuronal circuit of the blowfly.
33
Lindemann, J. P., Kern, R., van Hateren, J. H., Ritter, H. and Egelhaaf, M. (2005). On the computations analyzing natural optic flow: Quantitative model analysis of the blowfly motion vision pathway. J. Neurosci. 25, 6435-6448.
Mah, E. L., Brinkworth, R. S., O'Carroll, D.C. (2008). Implementation of an elaborated neuromorphic model of a biological photoreceptor. Biol Cybern. 98(5), 357-69.
Maimon, G., Straw, A. D., and Dickinson, M. H. (2008), A simple vision-based algorithm for decision making in flying Drosophila. Curr Biol, 18, 464-470.
Meyer, G. H., Lindemann J. P., Egelhaaf, M. (2011). Pattern-Dependent Response Modulations in Motion-Sensitive Visual Interneurons – a Model Study. PLoS ONE. accepted for publication.
Parsons, M. M., Krapp, H. G., and Laughlin, S. B. (2006) A motion-sensitive neurone responds to signals from the two visual systems of the blowfly, the compound eyes and ocelli. J Exp Biol. 209, 4464 - 4474.
Petrowitz, R., Dahmen, H., Egelhaaf, M., and Krapp, H. G. (2000). Arrangement of optical axes and spatial resolution in the compound eye of the female blowfly Calliphora. J. Comp. Physiol. A 186, 737-746.
Price K. V. (1999). An introduction to differential evolution In: New Ideas in Optimization eds Corne, D., Dorigo, M., Glover, F., Dasgupta, D., Moscato, P. (Maidenhead(UK), McGraw-Hill Ltd.), 79–108.
Rajesh, S., Rainsford, T., and O'Carroll D. C. (2005). Modeling pattern noise in responses of fly motion detectors to naturalistic scenes. Proc. of SPIE. 5651, 160-173.
Reichardt, W. and Poggio, T. (1976). Visual control of orientation behaviour in the fly. Part I. A quantitative analysis. Quart. Rev. Biophys. 9, 311-375.
Reichardt, W., Poggio, T., and Hausen, K. (1983) Figure-ground discrimination by relative movement in the visual system of the fly. Part II: Towards the neural circuitry. Biol. Cybern. 46 (Suppl.), 1-30.
Reiser, M. B. and Dickinson, M. H. (2010) Drosophila fly straight by fixating objects in the face of expanding optic flow. J. Exp. Biol. 213, 1771-1781.
Shoemaker PA, O’Carroll DC, Straw AD (2005) Velocity constancy and models for wide-field visual motion detection in insects. Biol. Cybern. 93: 275-87.
Schilstra, C. and van Hateren J. H. (1999). Blowfly flight and optic flow. I. Thorax kinematics and flight dynamics. J. Exp. Biol. 202(11), 1481-1490.
Spalthoff, C., Egelhaaf, M., Tinnefeld, P. and Kurtz, R. (2010). Localized direction selective responses in the dendrites of visual interneurons of the fly. BMC Biol. 8, 36.
Storn, R. and Price, K. (1997). Differential evolution - a simple and efficient heuristic for global optimization over continuous spaces. J. of Global Optimization 11. 341–359.
34
Strausfeld, N., Singh, R., Bassemir, U., and Bacon, J. (1984). Organizational principles of outputs from dipteran brains. J. Insect Physiol. 30, 73-93.
Strausfeld, N. and Lee, J.-K. (1991). Neuronal basis for parallel visual processing in the fly. Vis. Neurosci. 7, 13-33.
Torben-Nielsen, B. and Stiefel, K. M. (2010). Wide-field motion integration in fly VS cells: insights from an inverse approach. PLoS Comput Biol. 6, e1000932.
Yamaguchi, S., Wolf, R., Desplan, C., and Heisenberg, M. (2008). Motion vision is independent of color in Drosophila. Proc Natl Acad Sci. 105, 4910-4915.
van Hateren, J. H. and Schilstra C. (1999). Blowfly flight and optic flow. II. Head movements during flight. J. Exp. Biol. 202, 1491–1500.
van Hateren, J. H. and Snippe, H. P. (2001) Information theoretical evaluation of parametric models of gain control in blowfly photoreceptor cells. Vision Res. 41, 1851-1865.
van Hateren, J. H., Kern, R., Schwerdtfeger, G. and Egelhaaf, M. (2005) Function and coding in the blowfly H1 neuron during naturalistic optic flow. J. Neurosci. 25, 4343-4352.
Virsik, R. and Reichardt, W. (1976) Detection and tracking of moving objects by the fly Musca domestica. Biol.Cybern. 23, 83-98.
Warzecha, A.-K., Egelhaaf, M., and Borst, A. (1993). Neural circuit tuning fly visual interneurons to motion of small objects. 1. Dissection of the circuit by pharmacological and photoinactivation techniques. J. Neurophysiol. 69, 329–339.
Warzecha, A. K., Kretzberg, J., and Egelhaaf, M. (2000). Reliability of a fly motion-sensitive neuron depends on stimulus parameters. J. Neurosci. 20, 8886-8896.
Weber, F., Machens, C. K., and Borst, A. (2010) Spatiotemporal response properties of optic-flow processing neurons. Neuron 67, 629-642.
Wiederman, S. D., Shoemaker, P. A. and O'Carroll, D. C. (2008). A model for the detection of moving targets in visual clutter inspired by insect physiology. PLoS ONE. 3, e2784.
Wiederman, S. D., Brinkworth, R. S., and O'Carroll, D. C. (2010). Performance of a Bio-Inspired Model for the Robust Detection of Moving Targets in High Dynamic Range Natural Scenes . J. of Computational and Theoretical Nanoscience 7, 911-920.
35

36
3. Distributed Dendritic Processing Facilitates Object Detection: A Computational Analysis on the Visual System of the Fly.
This Chapter was published as Hennig P, Möller R, Egelhaaf M (2008): Distributed Dendritic Processing Facilitates Object Detection: A Computational Analysis on the Visual System of the Fly. PLoS ONE 3(8): e3092. doi:10.1371/journal.pone.0003092
Corresponding author: Patrick HennigEditor: Olaf Sporns, Indiana University, United States of AmericaReceived: June 3, 2008; Accepted: July 3, 2008; Published: August 28, 2008
3.1. Abstract
Background
Detecting objects is an important task when moving through a natural environment. Flies, for example, may land on salient objects or may avoid collisions with them. The neuronal ensemble of Figure Detection cells (FD-cells) in the visual system of the fly is likely to be involved in controlling these behaviors, as these cells are more sensitive to objects than to extended background structures. Until now the computations in the presynaptic neuronal network of FD-cells and, in particular, the functional significance of the experimentally established distributed dendritic processing of excitatory and inhibitory inputs is not understood.
Methodology / Principal Findings
We use model simulations to analyze the neuronal computations responsible for the preference of FD-cells for small objects. We employed a new modeling approach which allowed us to account for the spatial spread of electrical signals in the dendrites while avoiding detailed compartmental modeling. The models are based on available physiological and anatomical data. Three models were tested each implementing an inhibitory neural circuit, but differing by the spatial arrangement of the inhibitory interaction. Parameter optimization with an evolutionary algorithm revealed that only distributed dendritic processing satisfies the constraints arising from electrophysiological experiments. In contrast to a direct dendro-dendritic inhibition of the FD-cell (Direct Distributed Inhibition model), an inhibition of its presynaptic retinotopic elements (Indirect Distributed Inhibition model) requires smaller changes in input resistance in the inhibited neurons during visual stimulation.
Conclusions / Significance
Distributed dendritic inhibition of retinotopic elements as implemented in our Indirect Distributed Inhibition model is the most plausible wiring scheme for the neuronal circuit of FD-cells. This
37
microcircuit is computationally similar to lateral inhibition between the retinotopic elements. Hence, distributed inhibition might be an alternative explanation of perceptual phenomena currently explained by lateral inhibition networks.
3.2. IntroductionMoving through an environment requires gathering information about the spatial properties of the surroundings. Collisions with obstacles have to be avoided and objects that may serve as landmarks for orientation need to be detected. Collision avoidance does not require detailed information about the object properties. Rather, it may be sufficient to know that there is an object no matter what it is. In a wide range of species visual interneurons have been found which preferentially respond to small objects in their receptive field (see for instance: Sterling and Wickelgren, 1969; Rizzolatti and Camarda, 1977; Mason, 1979; von Grünau and Frost, 1983; Mandl, 1985 (cat); Allman et al., 1985; Tanaka et al., 1986; Davidson and Bender, 1991 (monkey); Frost et al., 1981; Frost et al., 1983; Frost et al., 1988 (pigeon); Tsai, 1990 (toad); Rowell and O'Shea, 1976; Rowell et al., 1977 (locust); Collett and King, 1975 (hoverfly); Collett, 1971; Collett, 1972 (hawkmoth); Olberg, 1981; Olberg, 1986; O'Carroll, 1993 (dragonfly); Egelhaaf, 1985b; Gauck and Borst, 1999 (blowfly)). These cells differ in the size of their receptive fields and the preferred size of the objects. For instance, object sensitive cells in dragonflies or hoverflies respond most strongly to objects as small as 1-2 degrees. With increasing object size, the response vanishes almost completely (O'Carroll 1993; Barnett et al. 2007; Guerten et al. 2007). Other cells like the so-called FD-cells of blowflies respond best to objects with a width in the range of 6-12 degrees and still may respond, although at a considerably lower level, during wide-field motion (Egelhaaf 1985b,c; Kimmerle et al., 1997; Gauck and Borst, 1999; Kimmerle and Egelhaaf, 2000a).FD-cells are assumed to obtain their sensitivity for small objects through inhibition from another cell with a large receptive field. The assumption is based on laser-ablation experiments that revealed for at least one type of FD-cell, the FD1-cell, that its object preference disappears after eliminating an inhibitory wide-field neuron in its input circuitry (Warzecha et al., 1993). Although the receptive field of the inhibitory neuron is larger than that of the FD-cell, inhibition from outside the receptive field borders of the FD-cell is not necessary for tuning FD-cells to objects. This is because the width of the excitatory visual field of an FD-cell is much larger than the optimum object size (Egelhaaf, 1985b,c). Although the mechanisms underlying object sensitivity of the FD-cell have not yet been unraveled in detail, simple models have been proposed that can explain a preference for objects comparable to that of FD-cells. These models comprise an output neuron, the FD-cell that receives retinotopic input, as well as input from an inhibitory neuron. The synaptic transmission between retinotopic input elements and the FD-cell was assumed to be nonlinear (Egelhaaf 1985c; Reichardt et al., 1983; Borst and Egelhaaf, 1993).
38
After these models were put forward, the mechanisms underlying object sensitivity have been further constrained by new anatomical and electrophysiological data: (1) There is now good evidence for spatially distributed interactions in the input circuit or on the dendrite of the FD-cells (Borst and Egelhaaf, 1993), (2) the responses of FD-cells were found to depend on object and background velocity in a very peculiar way, in addition to the already known preference for objects (Kimmerle and Egelhaaf, 2000b). The above mentioned models were recently modified to allow a simulated fly to track a small moving target in a virtual environment (Higgins and Pant, 2004). Note that this modified model was tuned to target tracking rather than to account for the electrophysiologically determined responses of FD-cells. Moreover, it did not take into account the evidence for the spatially distributed interactions in the input circuit of the FD-cells.Using model simulations we analyze three different wiring schemes with respect to their ability to comply with the two above mentioned experimentally established constraints. For all wiring schemes we assume the same receptive field for the inhibitory neuron and the FD-cell. To adjust the models to the constraints imposed by the electrophysiological data, we optimized the model parameters by means of an optimization method.The aim of the study is to unravel fundamental computational principles underlying object sensitivity of FD-cells and putting forward electrophysiologically checkable predictions, but not to mimic the detailed neuronal circuitry. Therefore, we chose a new paradigm which relies on only few free model parameters and allows us to model dendritic signal spread within a dendro-dendritic wiring scheme at a relatively abstract level by spatial low pass convolution (compare with (Cuntz et al., 2003). This enables us to avoid the many assumptions that are required for detailed compartmental modeling of nerve cells (e.g. Koch and Segev, 1998).
3.3. Methods
Constraints
The analyzed models are constrained by the available experimental data on the wiring of the input circuitry of the FD-neuron and the responses of the FD-cell to different conditions of object and background motion. In the following we will focus on the FD1-cell, the member of the FD-cell ensemble which has been characterized most thoroughly. For the sake of simplicity we will use the term FD-cell in the modeling part of this study without explicit reference to a specific FD-cell.
Constraints imposed by the structure of the circuitry
The FD-cells are assumed to receive excitatory retinotopic input via their large dendritic trees from cells with small receptive fields encoding local motion information (Egelhaaf, 1985b). As assumed by Reichardt et al. (1983) and Egelhaaf (1985c) and experimentally verified by Warzecha et al. (1993), the FD1-cell is inhibited by a motion-sensitive cell with a large receptive
39
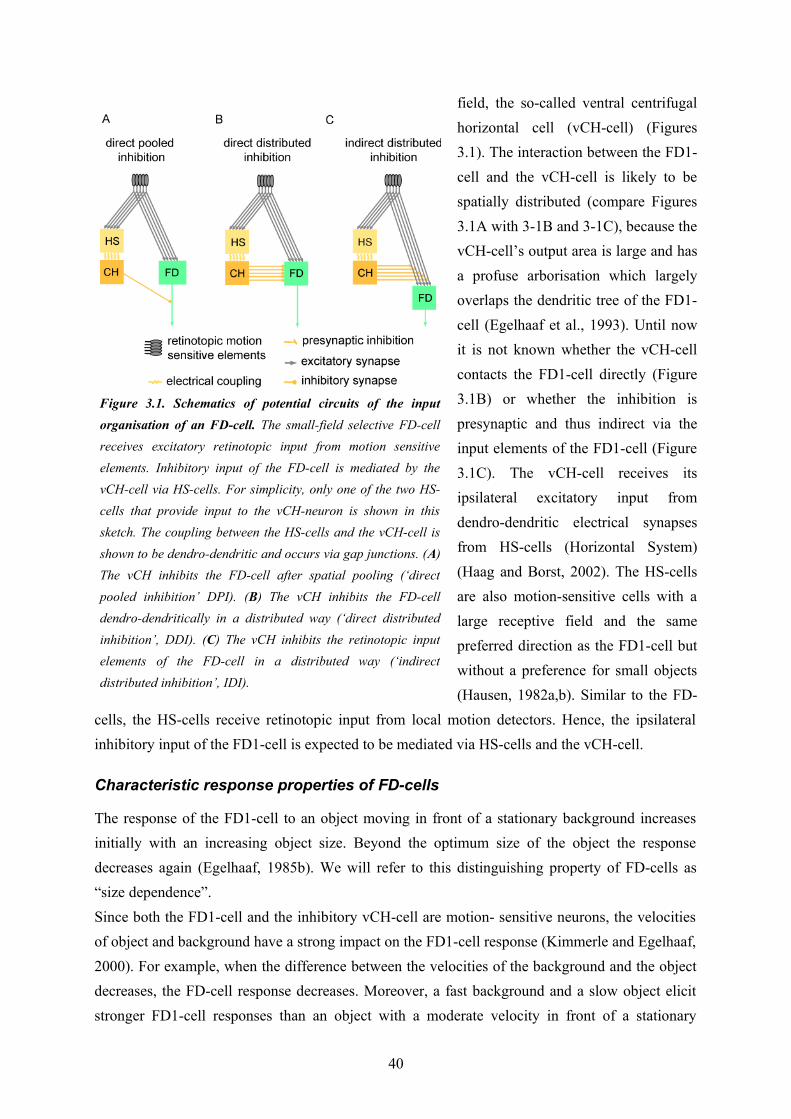
field, the so-called ventral centrifugal horizontal cell (vCH-cell) (Figures 3.1). The interaction between the FD1-cell and the vCH-cell is likely to be spatially distributed (compare Figures 3.1A with 3-1B and 3-1C), because the vCH-cell’s output area is large and has a profuse arborisation which largely overlaps the dendritic tree of the FD1-cell (Egelhaaf et al., 1993). Until now it is not known whether the vCH-cell contacts the FD1-cell directly (Figure 3.1B) or whether the inhibition is presynaptic and thus indirect via the input elements of the FD1-cell (Figure 3.1C). The vCH-cell receives its ipsilateral excitatory input from dendro-dendritic electrical synapses from HS-cells (Horizontal System) (Haag and Borst, 2002). The HS-cells are also motion-sensitive cells with a large receptive field and the same preferred direction as the FD1-cell but without a preference for small objects (Hausen, 1982a,b). Similar to the FD-
cells, the HS-cells receive retinotopic input from local motion detectors. Hence, the ipsilateral inhibitory input of the FD1-cell is expected to be mediated via HS-cells and the vCH-cell.
Characteristic response properties of FD-cells
The response of the FD1-cell to an object moving in front of a stationary background increases initially with an increasing object size. Beyond the optimum size of the object the response decreases again (Egelhaaf, 1985b). We will refer to this distinguishing property of FD-cells as “size dependence”.Since both the FD1-cell and the inhibitory vCH-cell are motion- sensitive neurons, the velocities of object and background have a strong impact on the FD1-cell response (Kimmerle and Egelhaaf, 2000). For example, when the difference between the velocities of the background and the object decreases, the FD-cell response decreases. Moreover, a fast background and a slow object elicit stronger FD1-cell responses than an object with a moderate velocity in front of a stationary
40
Figure 3.1. Schematics of potential circuits of the input organisation of an FD-cell. The small-field selective FD-cell receives excitatory retinotopic input from motion sensitive elements. Inhibitory input of the FD-cell is mediated by the vCH-cell via HS-cells. For simplicity, only one of the two HS-cells that provide input to the vCH-neuron is shown in this sketch. The coupling between the HS-cells and the vCH-cell is shown to be dendro-dendritic and occurs via gap junctions. (A) The vCH inhibits the FD-cell after spatial pooling (‘direct pooled inhibition’ DPI). (B) The vCH inhibits the FD-cell dendro-dendritically in a distributed way (‘direct distributed inhibition’, DDI). (C) The vCH inhibits the retinotopic input elements of the FD-cell in a distributed way (‘indirect distributed inhibition’, IDI).
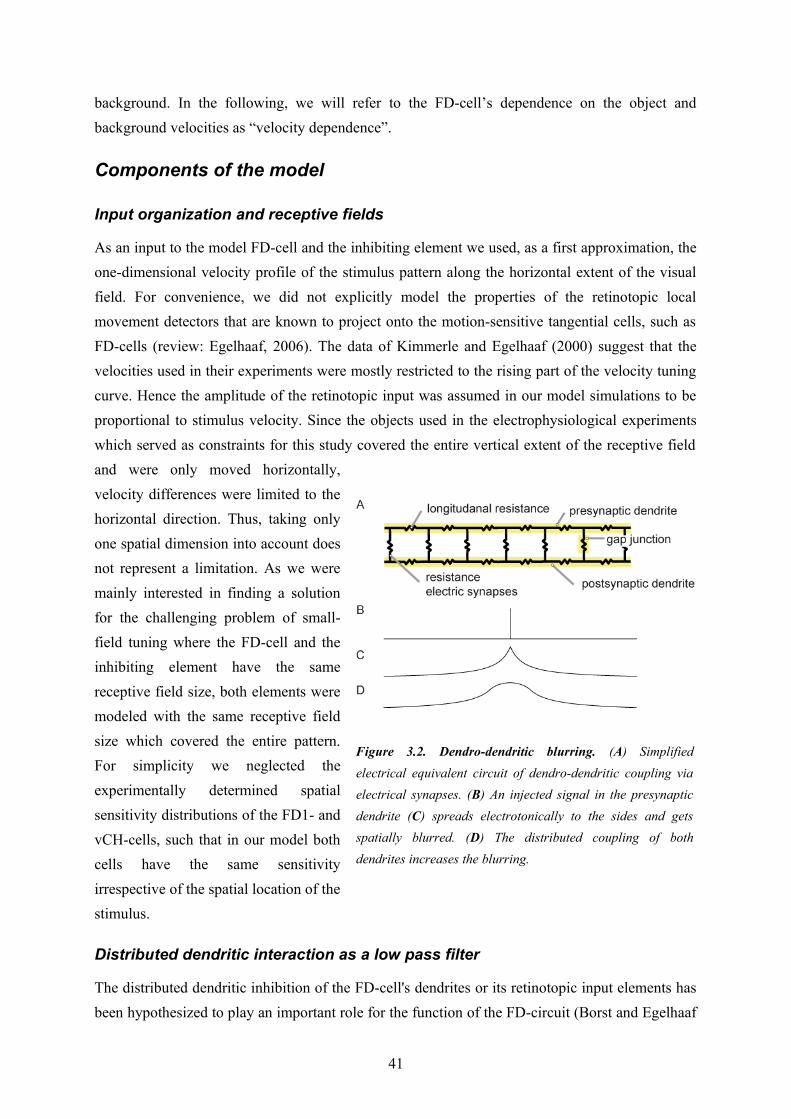
background. In the following, we will refer to the FD-cell’s dependence on the object and background velocities as “velocity dependence”.
Components of the model
Input organization and receptive fields
As an input to the model FD-cell and the inhibiting element we used, as a first approximation, the one-dimensional velocity profile of the stimulus pattern along the horizontal extent of the visual field. For convenience, we did not explicitly model the properties of the retinotopic local movement detectors that are known to project onto the motion-sensitive tangential cells, such as FD-cells (review: Egelhaaf, 2006). The data of Kimmerle and Egelhaaf (2000) suggest that the velocities used in their experiments were mostly restricted to the rising part of the velocity tuning curve. Hence the amplitude of the retinotopic input was assumed in our model simulations to be proportional to stimulus velocity. Since the objects used in the electrophysiological experiments which served as constraints for this study covered the entire vertical extent of the receptive field and were only moved horizontally, velocity differences were limited to the horizontal direction. Thus, taking only one spatial dimension into account does not represent a limitation. As we were mainly interested in finding a solution for the challenging problem of small-field tuning where the FD-cell and the inhibiting element have the same receptive field size, both elements were modeled with the same receptive field size which covered the entire pattern. For simplicity we neglected the experimentally determined spatial sensitivity distributions of the FD1- and vCH-cells, such that in our model both cells have the same sensitivity irrespective of the spatial location of the stimulus.
Distributed dendritic interaction as a low pass filter
The distributed dendritic inhibition of the FD-cell's dendrites or its retinotopic input elements has been hypothesized to play an important role for the function of the FD-circuit (Borst and Egelhaaf
41
Figure 3.2. Dendro-dendritic blurring. (A) Simplified electrical equivalent circuit of dendro-dendritic coupling via electrical synapses. (B) An injected signal in the presynaptic dendrite (C) spreads electrotonically to the sides and gets spatially blurred. (D) The distributed coupling of both dendrites increases the blurring.
1993). If the dendrite is not only the input region of a neuron but also its output region, the activation pattern at the output reflects the input activation pattern to some extent. To get an intuition of the consequences of a dendritic arborisation for the retinotopic input activation pattern, one may imagine the dendrites of a neuron as an electric wire with a limited longitudinal conductance. A spatially localized input activity spreads to both sides along the dendrite (Figure 3.2). The signal amplitudes decrease with the distance from the input side and thus become spatially blurred (Cuntz et a. 2003). This intuition may easily be generalized to two dimensions, if the fine dendritic branches show basically random orientations. The anatomy of vCH-cells appears to be not in contrast to this assumption (Haag and Borst, 2002; Hausen, 1976; Gauck et al., 1997). Thus, the overall dendritic output of the vCH-cell can be described as a kind of spatially low pass filtered version of its retinotopic input pattern. The spatial blurring of the retinotopic input pattern is further enhanced by the dendro-dendritic interaction between the HS-cells and the vCH-cell.Accordingly, we implemented the spatially distributed processing of the retinotopic input in the inhibitory part of the FD-cell circuit, consisting of HS-cells and the vCH-cell, as a single spatial low pass filter. In the model these two cells are lumped into a single inhibitory element. In a first approximation, a rectangular filter kernel was used to spatially convolve the input signal. This approximation saves computation time since the filter can be calculated as a running average:
I (i )= ∑n∈N (i )
V (n )cardinality ( N ( i )) (1)
with a neighborhood N ( i ):={n : i−σ /2≤n≤i+σ /2 ; 1≤n≤W }
V is the input signal and I the convolved output signal. i and n denote the position along the dendrite. W is the width of the receptive field and σ is the width of the filter kernel.
Spatial Integration
To unravel the significance of the spatially distributed processing in the neural circuit presynaptic to the FD-cell, the FD-cell is considered to be isopotential. The equivalent electrical circuit of a one-compartment passive membrane patch is used to calculate the membrane potential Um of the FD-cell that results from spatial dendritic pooling:
U m=g I E I+g E E E+g0 E0
g I+g E+g0 (2)
EI and EE denote the reversal potentials of ion channels with the associated inhibitory (g I) and excitatory (gE) conductances, respectively. E0 is the resting potential of the cell. The inhibitory and excitatory conductances will be calculated from the respective input using functions
42
specifying synaptic transmission between the presynaptic input and the corresponding postsynaptic cell (see below). The reversal potentials are fixed parameters. If the reversal potential of an ion channel is more positive than the resting potential E0 of the FD-cell, this channel is excitatory. A reversal potential more negative than the resting potential denotes an inhibitory channel.We set the leak conductance g0 to 1. The other conductances are thus given relative to the leak conductance. The electrical equivalent circuit delivers a membrane potential Um as a result.
Function of synaptic transmission
Synapses were often found to transform the presynaptic signal nonlinearly into postsynaptic responses (Koch, 1999). Accordingly, we selected a sigmoid function which allows us to describe a broad range of characteristics by using only three parameters.
syn( x )= S1+e(α ( x−offsetX ))−
S1+e(α (−offsetX )) (3)
The parameter α describes the slope, S accounts for the level of saturation and offsetX is used to specify which part of the function is taken as the operating range. The input argument x is always positive. For offsetX = 0 the function is approximately linear in the beginning. For offsetX > 0 it approximates a saturation nonlinearity and for offsetX < 0 initially a convex shape. The second part of the equation ensures that the function of synaptic transmission begins in the point of origin (syn(0)=0).
Direct Pooled Inhibition Model
The Direct Pooled Inhibition (DPI) model does not comply with the anatomical constraint of the inhibitory element conveying its signal in a distributed fashion to its postsynaptic targets. Nonetheless, this model will serve as a reference to understand the importance of a distributed processing. The FD-cell receives its excitatory and inhibitory input as a one-compartment passive membrane patch as described above. The FD-Cell is directly excited by the vector V(i) of retinotopically distributed velocity values (Figure 3.3B).The stimulus velocity V(i) from each spatial position i is transformed, via the synaptic transmission function synV, into a conductance gV(i) (Figure 3.3A). All local ion channel conductances with the reversal potential EV are pooled according to equation 2 and account for the activation of the FD-cell. The reversal potential EV is a free parameter of the model, but it is more positive than the resting potential E0. The FD-cell receives its inhibitory input from a neuron which has the same receptive field as the FD-cell itself (Figure 3.3B). After complete spatial pooling of the motion information, the inhibitory element directly controls the conductance gI of inhibitory FD-cell ion channels. As
43
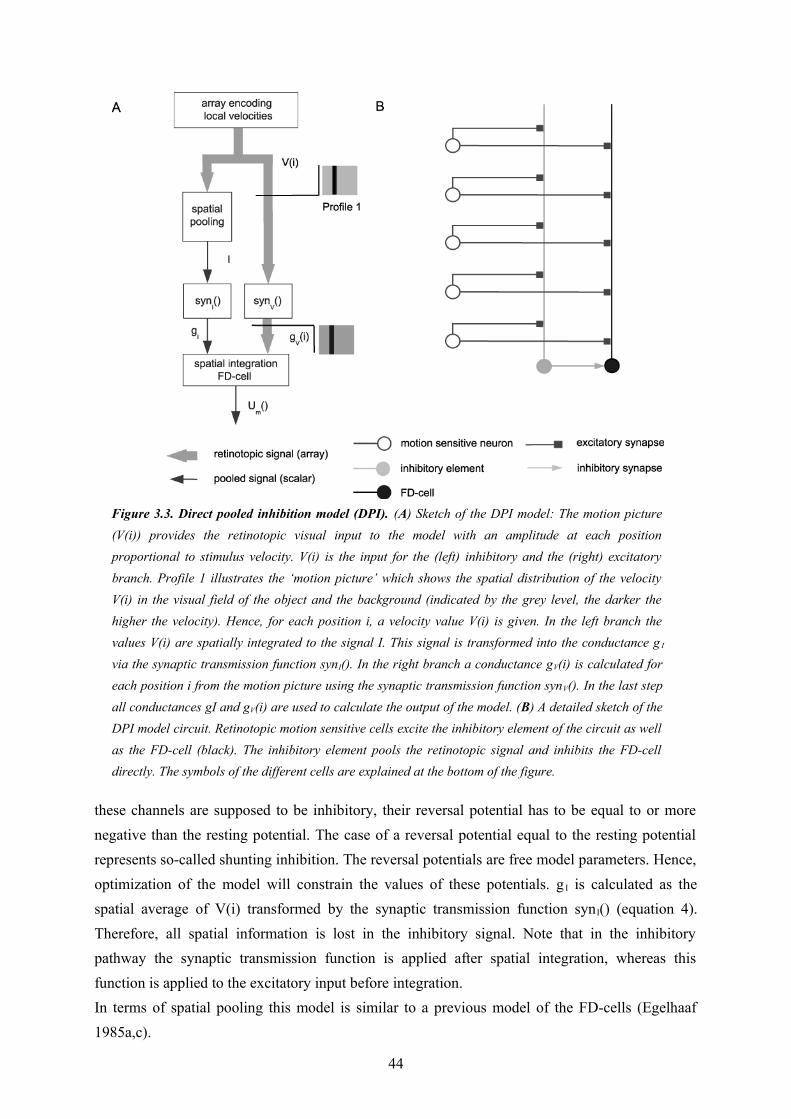
these channels are supposed to be inhibitory, their reversal potential has to be equal to or more negative than the resting potential. The case of a reversal potential equal to the resting potential represents so-called shunting inhibition. The reversal potentials are free model parameters. Hence, optimization of the model will constrain the values of these potentials. g I is calculated as the spatial average of V(i) transformed by the synaptic transmission function synI() (equation 4). Therefore, all spatial information is lost in the inhibitory signal. Note that in the inhibitory pathway the synaptic transmission function is applied after spatial integration, whereas this function is applied to the excitatory input before integration. In terms of spatial pooling this model is similar to a previous model of the FD-cells (Egelhaaf 1985a,c).
44
Figure 3.3. Direct pooled inhibition model (DPI). (A) Sketch of the DPI model: The motion picture (V(i)) provides the retinotopic visual input to the model with an amplitude at each position proportional to stimulus velocity. V(i) is the input for the (left) inhibitory and the (right) excitatory branch. Profile 1 illustrates the ‘motion picture’ which shows the spatial distribution of the velocity V(i) in the visual field of the object and the background (indicated by the grey level, the darker the higher the velocity). Hence, for each position i, a velocity value V(i) is given. In the left branch the values V(i) are spatially integrated to the signal I. This signal is transformed into the conductance g I
via the synaptic transmission function synI(). In the right branch a conductance gV(i) is calculated for each position i from the motion picture using the synaptic transmission function synV(). In the last step all conductances gI and gV(i) are used to calculate the output of the model. (B) A detailed sketch of the DPI model circuit. Retinotopic motion sensitive cells excite the inhibitory element of the circuit as well as the FD-cell (black). The inhibitory element pools the retinotopic signal and inhibits the FD-cell directly. The symbols of the different cells are explained at the bottom of the figure.
U m=g I E I+∑
ig V ( i) EV+g0 E0
∑i
g I+∑i
gV ( i )+g 0 (4)
with g I=syn I (V ( i )) and gV (i )=synV (V ( i ))
The DPI model has 8 free parameters: the reversal potentials EV, Ei and, for both functions of synaptic transmission, the three parameters characterizing saturation, slope and position of the transmission characteristic (see above). For optimization some parameters had to be constrained to ensure they are within a biologically realistic range. Thus, in the optimization process, the reversal potential Ee is kept smaller than 100mV whilst the reversal potential of the inhibitory ion channel Ei is held at the level of the resting potential (shunting inhibition) or at a more negative level (though not below -120mV). It is obvious that the synaptically inducted conductances are biologically limited. Since we do not know the upper limit, we choose a wide range: The maximum of the excitatory and the inhibitory conductance are limited each to 10,000-times the leak conductance.
Direct Distributed Inhibition Model
The Direct Distributed Inhibition (DDI) model uses the same activation of the FD-cell as the DPI model: the retinotopic velocity information V(i) is transformed into a sum of conductances gV of excitatory ion channels. However, DDI differs from DPI with respect to the inhibitory pathway (Figure 3.4A). DDI takes into account the evidence for a spatially distributed output of the inhibitory element. Furthermore, it assumes the inhibitory input of the FD-cell to be directly mediated via dendro-dendritic synapses between the inhibitory element and the FD-Cell (Figure 3.4B). Dendritic processing in the inhibitory element is modeled by a spatial low pass filter as described above. The output of the inhibitory element, represented by the vector I(i), is retinotopically distributed. By applying the synaptic transmission function synI, the output of the inhibitory element I(i) is transformed into an array of conductances g I(i) of the FD-cell (Figure 3.4A). In contrast to DPI, the retinotopic distribution of the inhibitory signal is preserved, though spatially blurred, until it reaches the FD-cell (compare Figures 3.3B and 3.4B).The FD-cell integrates the velocity information in terms of the conductances gV(i) and gI(i), respectively. gV(i) and gI(i) are the conductances of the synaptically controlled ion channels with the reversal potentials EV and EI, respectively:
U m=∑
ig I ( i )E I+∑
igV ( i )EV +g 0 E0
∑i
g I ( i)+∑i
gV ( i )+g 0 (5)
with g I ( i )=synI ( I ( i)) , gV (i )=synV (V ( i )) and I(i) as defined in eq. (1)
45
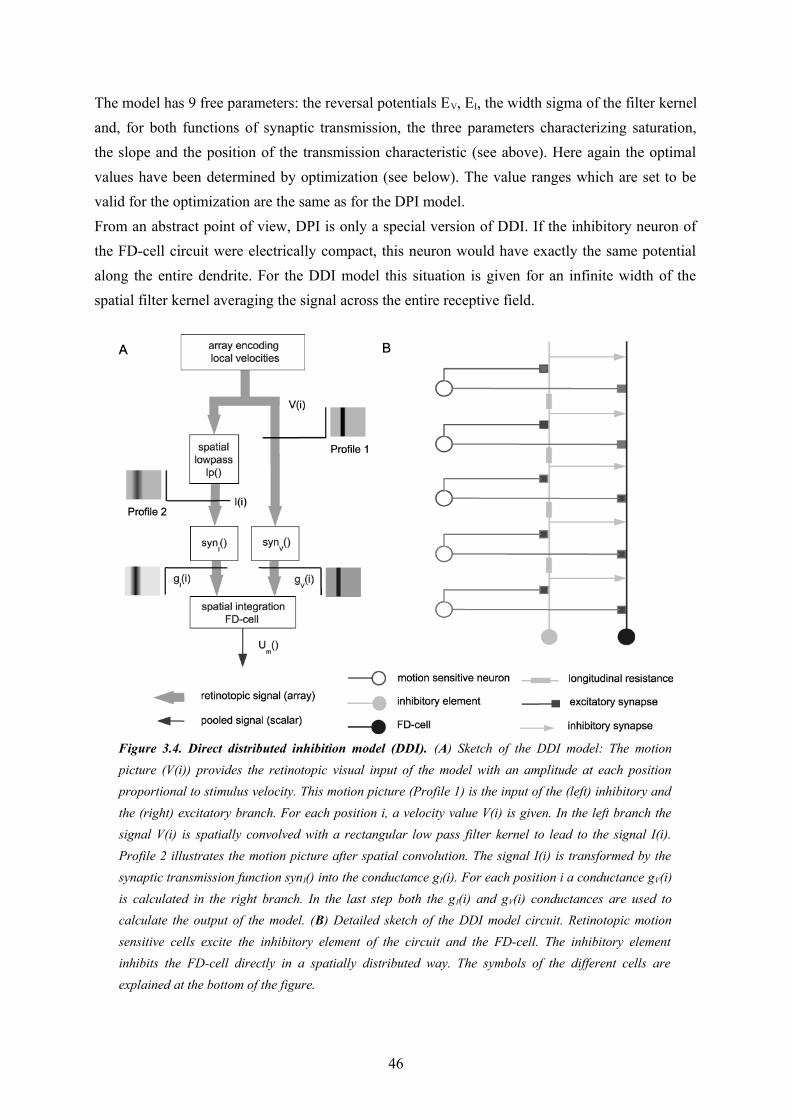
The model has 9 free parameters: the reversal potentials EV, EI, the width sigma of the filter kernel and, for both functions of synaptic transmission, the three parameters characterizing saturation, the slope and the position of the transmission characteristic (see above). Here again the optimal values have been determined by optimization (see below). The value ranges which are set to be valid for the optimization are the same as for the DPI model. From an abstract point of view, DPI is only a special version of DDI. If the inhibitory neuron of the FD-cell circuit were electrically compact, this neuron would have exactly the same potential along the entire dendrite. For the DDI model this situation is given for an infinite width of the spatial filter kernel averaging the signal across the entire receptive field.
46
Figure 3.4. Direct distributed inhibition model (DDI). (A) Sketch of the DDI model: The motion picture (V(i)) provides the retinotopic visual input of the model with an amplitude at each position proportional to stimulus velocity. This motion picture (Profile 1) is the input of the (left) inhibitory and the (right) excitatory branch. For each position i, a velocity value V(i) is given. In the left branch the signal V(i) is spatially convolved with a rectangular low pass filter kernel to lead to the signal I(i). Profile 2 illustrates the motion picture after spatial convolution. The signal I(i) is transformed by the synaptic transmission function synI() into the conductance gI(i). For each position i a conductance gV(i) is calculated in the right branch. In the last step both the g I(i) and gV(i) conductances are used to calculate the output of the model. (B) Detailed sketch of the DDI model circuit. Retinotopic motion sensitive cells excite the inhibitory element of the circuit and the FD-cell. The inhibitory element inhibits the FD-cell directly in a spatially distributed way. The symbols of the different cells are explained at the bottom of the figure.
Indirect Distributed Inhibition Model
The Indirect Distributed inhibition (IDI) model differs from the other models in one essential aspect: the inhibition of the FD-Cell is indirect, since it is mediated via its presynaptic retinotopic input elements. Here, not the FD-cell itself is inhibited, but its input elements. As a first approximation, the inhibition is implemented as a pure shunting inhibition, i.e. E i = E0.
presyn( in , shunt )= in1+shunt (6)
in is the input signal, shunt denotes the strength of the shunt.The inhibitory element contacts the output area of the local movement detectors and shunts them before they reach the FD-cell (Figure 3.5). The shunting is applied in a spatially distributed way. Again, in the inhibitory pathway we describe the effect of dendritic processing by spatial lowpass filtering of the array V(i) representing the retinotopic velocity values. Using the synaptic transmission function synI() as specified above, the low-pass-filtered signal I(i) is transformed entry-wise into the shunting signal (see equation 7). This signal shunts the retinotopic input of the FD-cell according to Equation 6. Employing the synaptic transmission function synV() the resulting signal is transformed into the array of local conductances gv(i) of the FD-Cell (Figure 3.5A). Similar to DDI, the FD-cell is implemented as a one-compartmental patch. The sum of gV(i) reflects the total conductance of the FD-cell corresponding to ion channels with the reversal potential EV. The FD-cell has no direct inhibitory input.
U m=∑
ig V ( i)EV+g0 E0
∑i
gV ( i )+g 0 (7)
with gV (i )=synV ( presyn(V ( i ) , syn I ( I ( i )))) and I(i) as defined in eq. (1)
The model has 8 free parameters: the reversal potential EV, the width sigma of the spatial filter kernel and, for both functions of synaptic transmission, the three parameters characterizing saturation, the slope and the position of the transmission characteristic. Again the optimal values have been determined by optimization (see below). The value ranges which are set to be valid for the optimization are the same as for the previous models.
Optimization
The model parameters were optimized to mimic the experimentally determined velocity and size dependencies of the FD-cell response. Since only spike rates were available from the extracellular recordings of FD-cell activity, these had to be transformed into membrane potentials. Based on a previous study, the membrane potential was assumed to be proportional to the spike rate
47
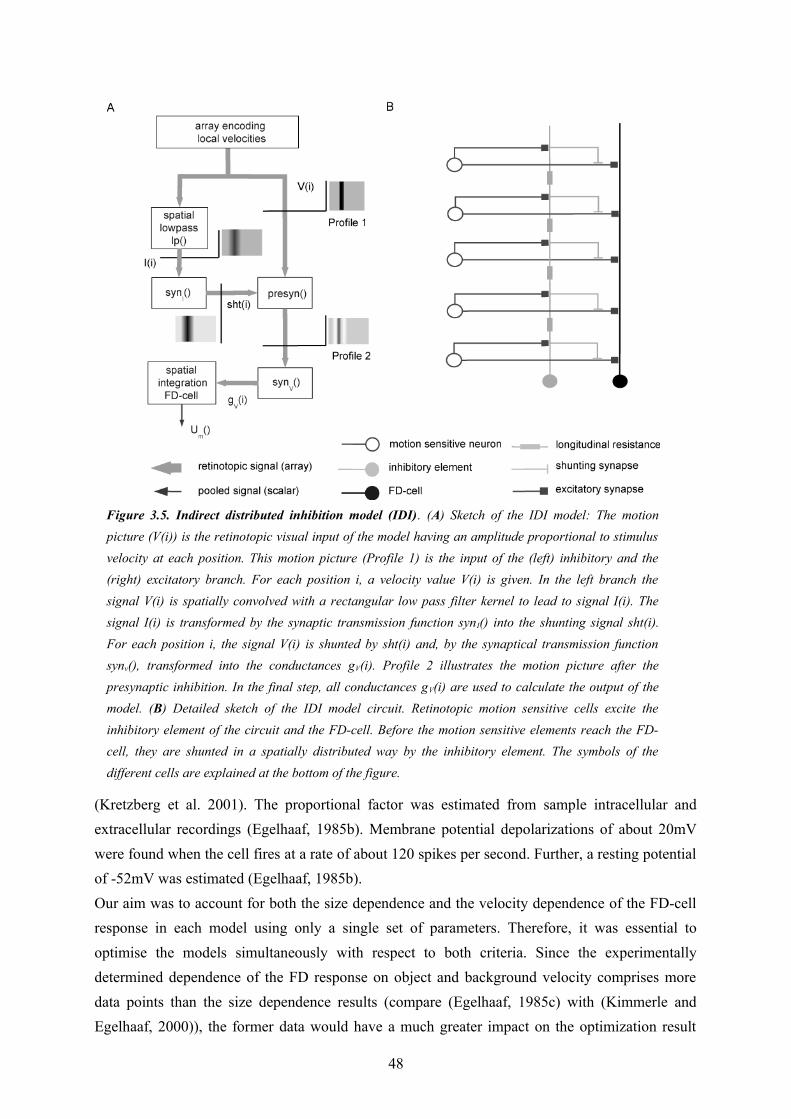
(Kretzberg et al. 2001). The proportional factor was estimated from sample intracellular and extracellular recordings (Egelhaaf, 1985b). Membrane potential depolarizations of about 20mV were found when the cell fires at a rate of about 120 spikes per second. Further, a resting potential of -52mV was estimated (Egelhaaf, 1985b).Our aim was to account for both the size dependence and the velocity dependence of the FD-cell response in each model using only a single set of parameters. Therefore, it was essential to optimise the models simultaneously with respect to both criteria. Since the experimentally determined dependence of the FD response on object and background velocity comprises more data points than the size dependence results (compare (Egelhaaf, 1985c) with (Kimmerle and Egelhaaf, 2000)), the former data would have a much greater impact on the optimization result
48
Figure 3.5. Indirect distributed inhibition model (IDI). (A) Sketch of the IDI model: The motion picture (V(i)) is the retinotopic visual input of the model having an amplitude proportional to stimulus velocity at each position. This motion picture (Profile 1) is the input of the (left) inhibitory and the (right) excitatory branch. For each position i, a velocity value V(i) is given. In the left branch the signal V(i) is spatially convolved with a rectangular low pass filter kernel to lead to signal I(i). The signal I(i) is transformed by the synaptic transmission function synI() into the shunting signal sht(i). For each position i, the signal V(i) is shunted by sht(i) and, by the synaptical transmission function synv(), transformed into the conductances gV(i). Profile 2 illustrates the motion picture after the presynaptic inhibition. In the final step, all conductances gV(i) are used to calculate the output of the model. (B) Detailed sketch of the IDI model circuit. Retinotopic motion sensitive cells excite the inhibitory element of the circuit and the FD-cell. Before the motion sensitive elements reach the FD-cell, they are shunted in a spatially distributed way by the inhibitory element. The symbols of the different cells are explained at the bottom of the figure.
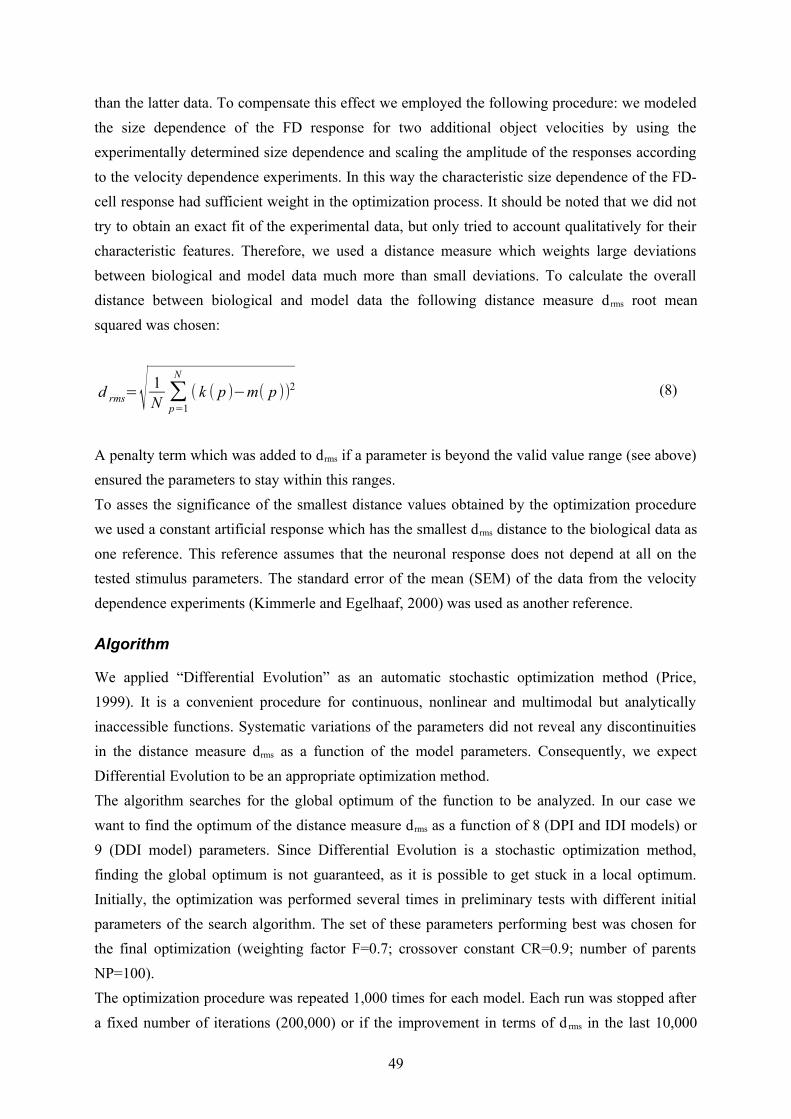
than the latter data. To compensate this effect we employed the following procedure: we modeled the size dependence of the FD response for two additional object velocities by using the experimentally determined size dependence and scaling the amplitude of the responses according to the velocity dependence experiments. In this way the characteristic size dependence of the FD-cell response had sufficient weight in the optimization process. It should be noted that we did not try to obtain an exact fit of the experimental data, but only tried to account qualitatively for their characteristic features. Therefore, we used a distance measure which weights large deviations between biological and model data much more than small deviations. To calculate the overall distance between biological and model data the following distance measure d rms root mean squared was chosen:
d rms=√ 1N ∑
p=1
N
( k ( p )−m( p ))2 (8)
A penalty term which was added to drms if a parameter is beyond the valid value range (see above) ensured the parameters to stay within this ranges.To asses the significance of the smallest distance values obtained by the optimization procedure we used a constant artificial response which has the smallest drms distance to the biological data as one reference. This reference assumes that the neuronal response does not depend at all on the tested stimulus parameters. The standard error of the mean (SEM) of the data from the velocity dependence experiments (Kimmerle and Egelhaaf, 2000) was used as another reference.
Algorithm
We applied “Differential Evolution” as an automatic stochastic optimization method (Price, 1999). It is a convenient procedure for continuous, nonlinear and multimodal but analytically inaccessible functions. Systematic variations of the parameters did not reveal any discontinuities in the distance measure drms as a function of the model parameters. Consequently, we expect Differential Evolution to be an appropriate optimization method.The algorithm searches for the global optimum of the function to be analyzed. In our case we want to find the optimum of the distance measure drms as a function of 8 (DPI and IDI models) or 9 (DDI model) parameters. Since Differential Evolution is a stochastic optimization method, finding the global optimum is not guaranteed, as it is possible to get stuck in a local optimum. Initially, the optimization was performed several times in preliminary tests with different initial parameters of the search algorithm. The set of these parameters performing best was chosen for the final optimization (weighting factor F=0.7; crossover constant CR=0.9; number of parents NP=100). The optimization procedure was repeated 1,000 times for each model. Each run was stopped after a fixed number of iterations (200,000) or if the improvement in terms of d rms in the last 10,000
49
steps of searching was negligible (<0.01mV). Each of the 1,000 runs delivers one set of model parameters as a solution which is a candidate for the global optimum. Since the optimization procedure may return only a local optimum as a solution, more than one optimum was found for each model. Each of the optima was found several times. Hence, the algorithm did not get stuck in a single local optimum and the different optima were found reliably. However, there is no guarantee that we found all local optima including the global optimum. Systematic variations of the model parameters around the best found solution ensured that the algorithm did not get stuck between optima as solutions actually turned out to be local optima.In the following we evaluate the different solutions for each of the three models. At first the solution with the best drms is most interesting. However, since also qualitative properties are important, good solutions in terms of the distance measure d rms may also be interesting, even if they are not the best.
3.4. Results
Direct Pooled Inhibition (DPI)
None of the solutions found for the DPI model mimics the size dependence of the FD responses: only for high object velocities the DPI responses decrease with an increasing object size. For small and medium object velocities, the model responses do not show any preference for small objects and the response is the same for all object sizes. On the other hand, all solutions for the DPI model mimic the velocity dependence quite well. The deviations are in the range of the SEM of the experimental data. Only at high background and object speeds do we find a big difference (fig. 6). The distance measure reflects the qualitative deviations: The best fit of the DPI model had a drms of 2.1mV. This is beyond the SEM (1.2mV) of the corresponding experimental data (Kimmerle and Egelhaaf, 2000), but far below the drms of 3.7mV for the constant response reference assuming that the response does not depend on the tested stimuli at all. It was surprising that no pronounced small-field tuning has been obtained with DPI, since this distinguishing characteristic of FD-cells was previously obtained with a similar model (Egelhaaf 1985c). When we optimized the DPI model solely with respect to the size dependence, we obtained also a clear preference for small objects. However, the model no longer mimics the dependence of the FD-cell on object and background velocity. These findings suggest that the DPI model, depending on the model parameters, can mimic either the characteristic size dependence or the object and background velocity dependence of the FD-cell, but not both characteristics simultaneously.Finding parameters leading to small drms is not sufficient for a model to be acceptable, it is also necessary that their optimized parameter values have biological plausibility. Three parameters of the best solution of the DPI model are at the border of the permitted range (see above). This is the case in one parameter vector for the parameter determining the slope of the synaptic transmission
50
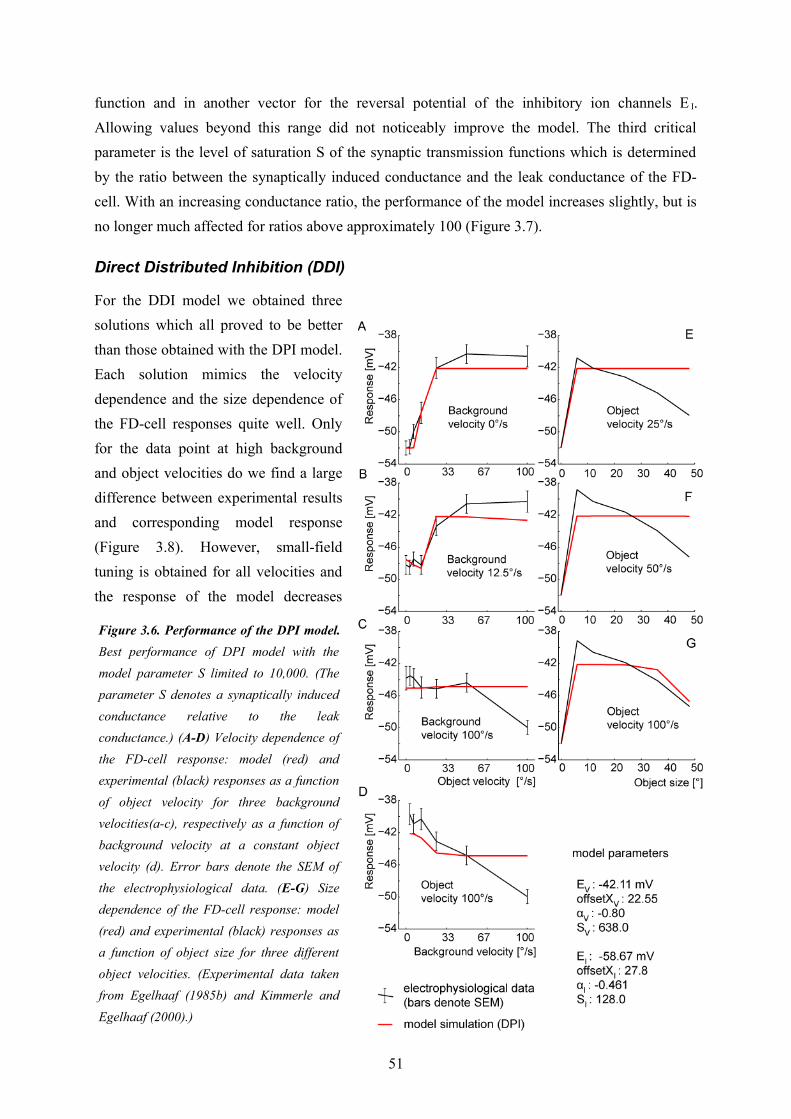
function and in another vector for the reversal potential of the inhibitory ion channels E I. Allowing values beyond this range did not noticeably improve the model. The third critical parameter is the level of saturation S of the synaptic transmission functions which is determined by the ratio between the synaptically induced conductance and the leak conductance of the FD-cell. With an increasing conductance ratio, the performance of the model increases slightly, but is no longer much affected for ratios above approximately 100 (Figure 3.7).
Direct Distributed Inhibition (DDI)
For the DDI model we obtained three solutions which all proved to be better than those obtained with the DPI model. Each solution mimics the velocity dependence and the size dependence of the FD-cell responses quite well. Only for the data point at high background and object velocities do we find a large difference between experimental results and corresponding model response (Figure 3.8). However, small-field tuning is obtained for all velocities and the response of the model decreases
51
Figure 3.6. Performance of the DPI model. Best performance of DPI model with the model parameter S limited to 10,000. (The parameter S denotes a synaptically induced conductance relative to the leak conductance.) (A-D) Velocity dependence of the FD-cell response: model (red) and experimental (black) responses as a function of object velocity for three background velocities(a-c), respectively as a function of background velocity at a constant object velocity (d). Error bars denote the SEM of the electrophysiological data. (E-G) Size dependence of the FD-cell response: model (red) and experimental (black) responses as a function of object size for three different object velocities. (Experimental data taken from Egelhaaf (1985b) and Kimmerle and Egelhaaf (2000).)

with increasing object size for all velocities (Figure 3.8).The obtained distance measure drms has values between 1.33 mV and 1.37 mV which are close to the experimentally determined velocity dependence SEM of 1.2mV (Kimmerle and Egelhaaf, 2000) (Figure 3.7). Hence, the deviations of the model from the experimental results are close to the range of variability of the experimental data.Some parameters of the different solutions cover only a small range. The reversal potential of the excitatory input of all solutions is between -38.8 and -39.6 mV. Hence, the excitatory reversal potential is about 14 mV more positive than the resting potential. The inhibitory reversal potential is more negative than the resting potential. In different solutions it covers the large range between -56.4 and almost -120.0 mV, the border of the permitted parameter range. To test
whether there is a significantly better solution beyond this border, we allowed the search to use parameters in wider confines. The solutions did not become significantly better. They improved by less than 0.01 mV in terms of drms. In any case, the experimental data are explained best if inhibition does not represent a pure shunting inhibition, but has a pronounced subtractive effect. The width of the spatial filter reflecting dendritic blurring of the retinotopic signal was found for all solutions in the range between 8 and 12 degrees. For all solutions the synaptic transmission functions have the shape of a sigmoid. We find almost the same shape of the synaptic transmission functions for the inhibitory and the excitatory synapses. The functions differ only in their saturation level and are just scaled by a factor.The performance of the DDI model continually improves with an increasing conductance saturation level S up to the permitted limit of a ratio of 10,000:1 between the synaptically induced conductances and the leak conductances (Figure 3.7). Decreasing parameter S below 100 the size dependence slowly vanishes. At an even smaller value of 10 the experimentally determined size and velocity dependencies are not mimicked anymore.
52
Figure 3.7. Consequences of increasing the inhibitory synaptic conductance. The distance measure drms for all models as a function of the model parameter S accounting for the maximum ratio between a synaptically induced conductance and the leak conductance. While DDI improves continually with an increasing synaptic conductance, IDI shows only clear improvements below a ratio of 10. For high ratios both DDI and IDI reach a distance measure near the SEM of the electrophysiological data (dotted line). DPI never gets close to the SEM of the experimental data (Kimmerle and Egelhaaf, 2000).
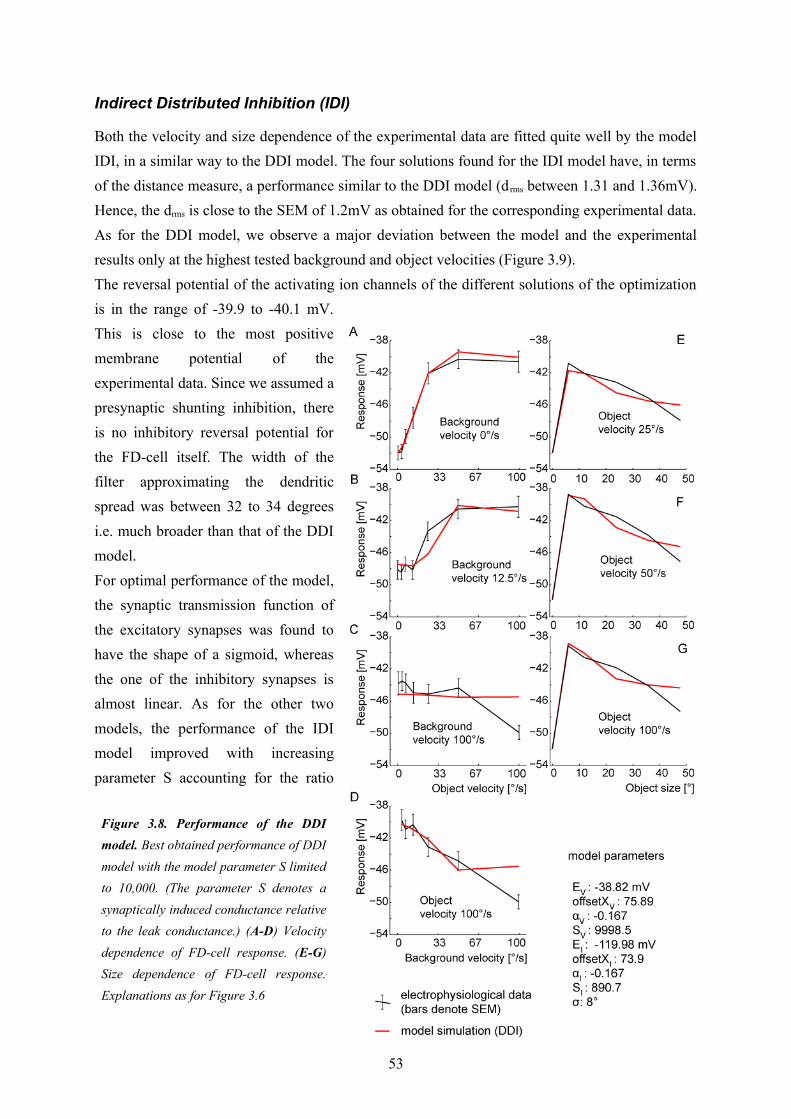
Indirect Distributed Inhibition (IDI)
Both the velocity and size dependence of the experimental data are fitted quite well by the model IDI, in a similar way to the DDI model. The four solutions found for the IDI model have, in terms of the distance measure, a performance similar to the DDI model (d rms between 1.31 and 1.36mV). Hence, the drms is close to the SEM of 1.2mV as obtained for the corresponding experimental data. As for the DDI model, we observe a major deviation between the model and the experimental results only at the highest tested background and object velocities (Figure 3.9). The reversal potential of the activating ion channels of the different solutions of the optimization is in the range of -39.9 to -40.1 mV. This is close to the most positive membrane potential of the experimental data. Since we assumed a presynaptic shunting inhibition, there is no inhibitory reversal potential for the FD-cell itself. The width of the filter approximating the dendritic spread was between 32 to 34 degrees i.e. much broader than that of the DDI model. For optimal performance of the model, the synaptic transmission function of the excitatory synapses was found to have the shape of a sigmoid, whereas the one of the inhibitory synapses is almost linear. As for the other two models, the performance of the IDI model improved with increasing parameter S accounting for the ratio
53
Figure 3.8. Performance of the DDI model. Best obtained performance of DDI model with the model parameter S limited to 10,000. (The parameter S denotes a synaptically induced conductance relative to the leak conductance.) (A-D) Velocity dependence of FD-cell response. (E-G) Size dependence of FD-cell response. Explanations as for Figure 3.6
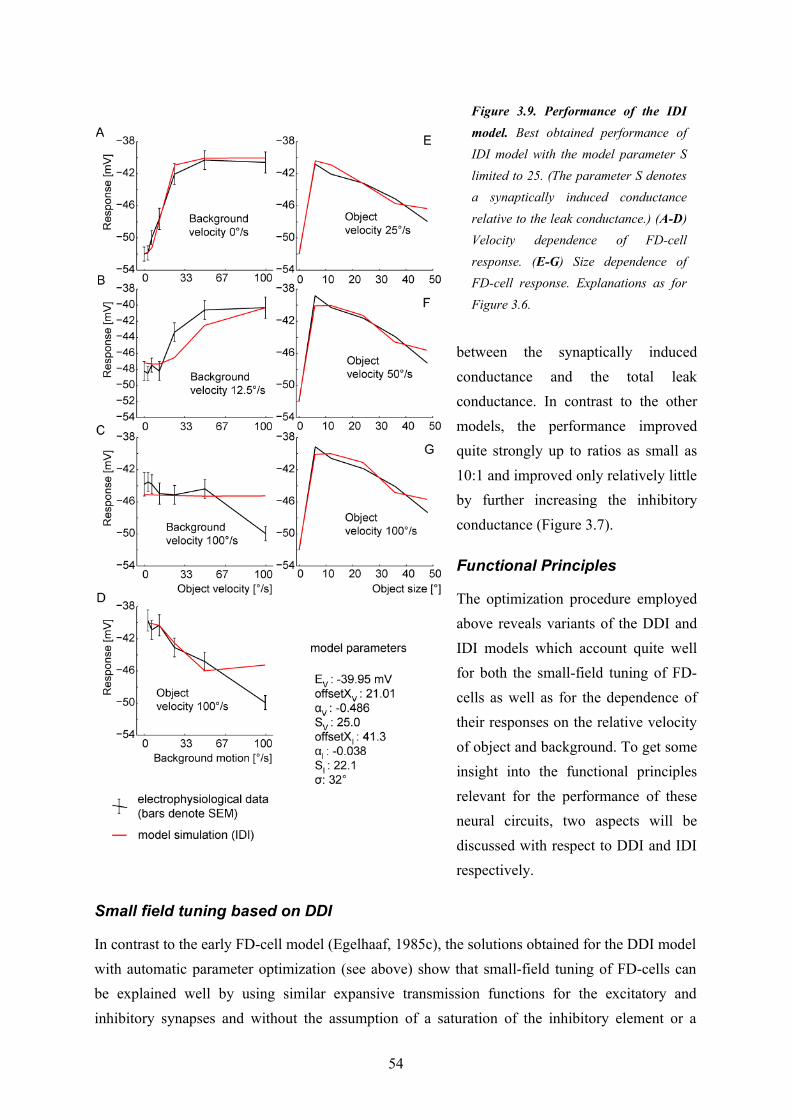
between the synaptically induced conductance and the total leak conductance. In contrast to the other models, the performance improved quite strongly up to ratios as small as 10:1 and improved only relatively little by further increasing the inhibitory conductance (Figure 3.7).
Functional Principles
The optimization procedure employed above reveals variants of the DDI and IDI models which account quite well for both the small-field tuning of FD-cells as well as for the dependence of their responses on the relative velocity of object and background. To get some insight into the functional principles relevant for the performance of these neural circuits, two aspects will be discussed with respect to DDI and IDI respectively.
Small field tuning based on DDI
In contrast to the early FD-cell model (Egelhaaf, 1985c), the solutions obtained for the DDI model with automatic parameter optimization (see above) show that small-field tuning of FD-cells can be explained well by using similar expansive transmission functions for the excitatory and inhibitory synapses and without the assumption of a saturation of the inhibitory element or a
54
Figure 3.9. Performance of the IDI model. Best obtained performance of IDI model with the model parameter S limited to 25. (The parameter S denotes a synaptically induced conductance relative to the leak conductance.) (A-D) Velocity dependence of FD-cell response. (E-G) Size dependence of FD-cell response. Explanations as for Figure 3.6.
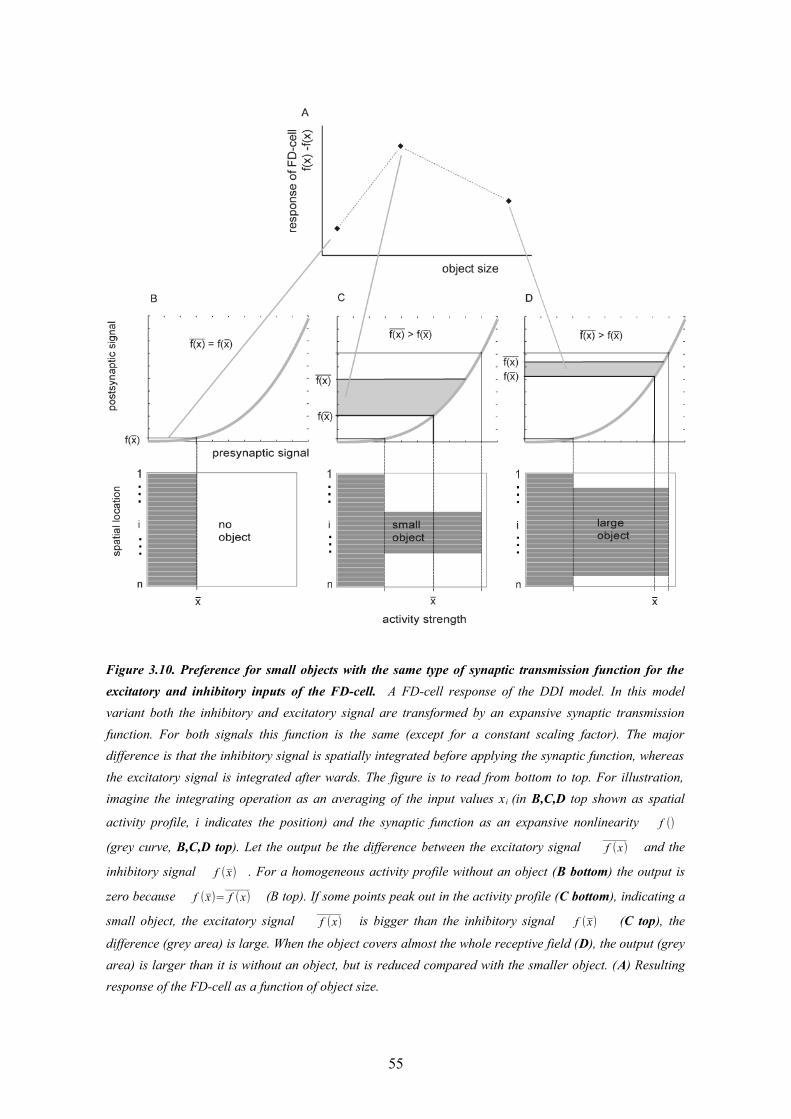
55
Figure 3.10. Preference for small objects with the same type of synaptic transmission function for the excitatory and inhibitory inputs of the FD-cell. A FD-cell response of the DDI model. In this model variant both the inhibitory and excitatory signal are transformed by an expansive synaptic transmission function. For both signals this function is the same (except for a constant scaling factor). The major difference is that the inhibitory signal is spatially integrated before applying the synaptic function, whereas the excitatory signal is integrated after wards. The figure is to read from bottom to top. For illustration, imagine the integrating operation as an averaging of the input values x i (in B,C,D top shown as spatial
activity profile, i indicates the position) and the synaptic function as an expansive nonlinearity f ()
(grey curve, B,C,D top). Let the output be the difference between the excitatory signal f (x) and the
inhibitory signal f (x) . For a homogeneous activity profile without an object (B bottom) the output is
zero because f (x)= f (x) (B top). If some points peak out in the activity profile (C bottom), indicating a
small object, the excitatory signal f (x) is bigger than the inhibitory signal f (x) (C top), the
difference (grey area) is large. When the object covers almost the whole receptive field (D), the output (grey area) is larger than it is without an object, but is reduced compared with the smaller object. (A) Resulting response of the FD-cell as a function of object size.
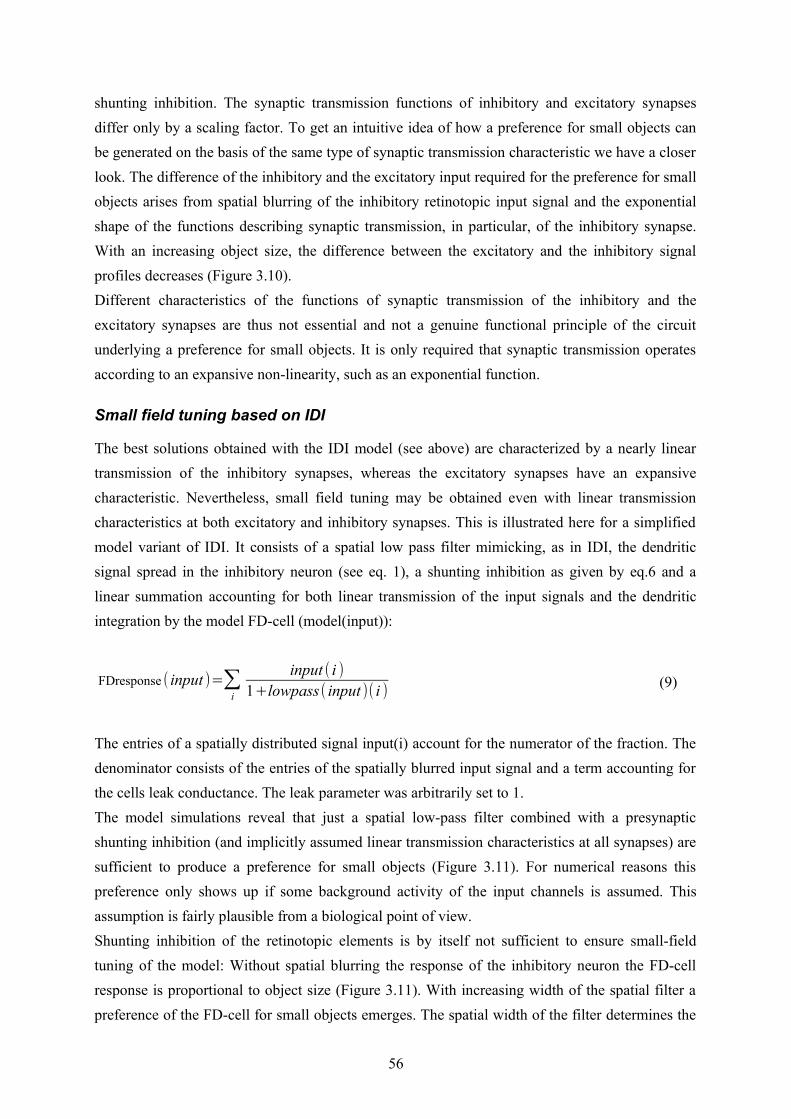
shunting inhibition. The synaptic transmission functions of inhibitory and excitatory synapses differ only by a scaling factor. To get an intuitive idea of how a preference for small objects can be generated on the basis of the same type of synaptic transmission characteristic we have a closer look. The difference of the inhibitory and the excitatory input required for the preference for small objects arises from spatial blurring of the inhibitory retinotopic input signal and the exponential shape of the functions describing synaptic transmission, in particular, of the inhibitory synapse. With an increasing object size, the difference between the excitatory and the inhibitory signal profiles decreases (Figure 3.10).Different characteristics of the functions of synaptic transmission of the inhibitory and the excitatory synapses are thus not essential and not a genuine functional principle of the circuit underlying a preference for small objects. It is only required that synaptic transmission operates according to an expansive non-linearity, such as an exponential function.
Small field tuning based on IDI
The best solutions obtained with the IDI model (see above) are characterized by a nearly linear transmission of the inhibitory synapses, whereas the excitatory synapses have an expansive characteristic. Nevertheless, small field tuning may be obtained even with linear transmission characteristics at both excitatory and inhibitory synapses. This is illustrated here for a simplified model variant of IDI. It consists of a spatial low pass filter mimicking, as in IDI, the dendritic signal spread in the inhibitory neuron (see eq. 1), a shunting inhibition as given by eq.6 and a linear summation accounting for both linear transmission of the input signals and the dendritic integration by the model FD-cell (model(input)):
FDresponse ( input )=∑i
input ( i )1+lowpass( input )( i ) (9)
The entries of a spatially distributed signal input(i) account for the numerator of the fraction. The denominator consists of the entries of the spatially blurred input signal and a term accounting for the cells leak conductance. The leak parameter was arbitrarily set to 1.The model simulations reveal that just a spatial low-pass filter combined with a presynaptic shunting inhibition (and implicitly assumed linear transmission characteristics at all synapses) are sufficient to produce a preference for small objects (Figure 3.11). For numerical reasons this preference only shows up if some background activity of the input channels is assumed. This assumption is fairly plausible from a biological point of view. Shunting inhibition of the retinotopic elements is by itself not sufficient to ensure small-field tuning of the model: Without spatial blurring the response of the inhibitory neuron the FD-cell response is proportional to object size (Figure 3.11). With increasing width of the spatial filter a preference of the FD-cell for small objects emerges. The spatial width of the filter determines the
56
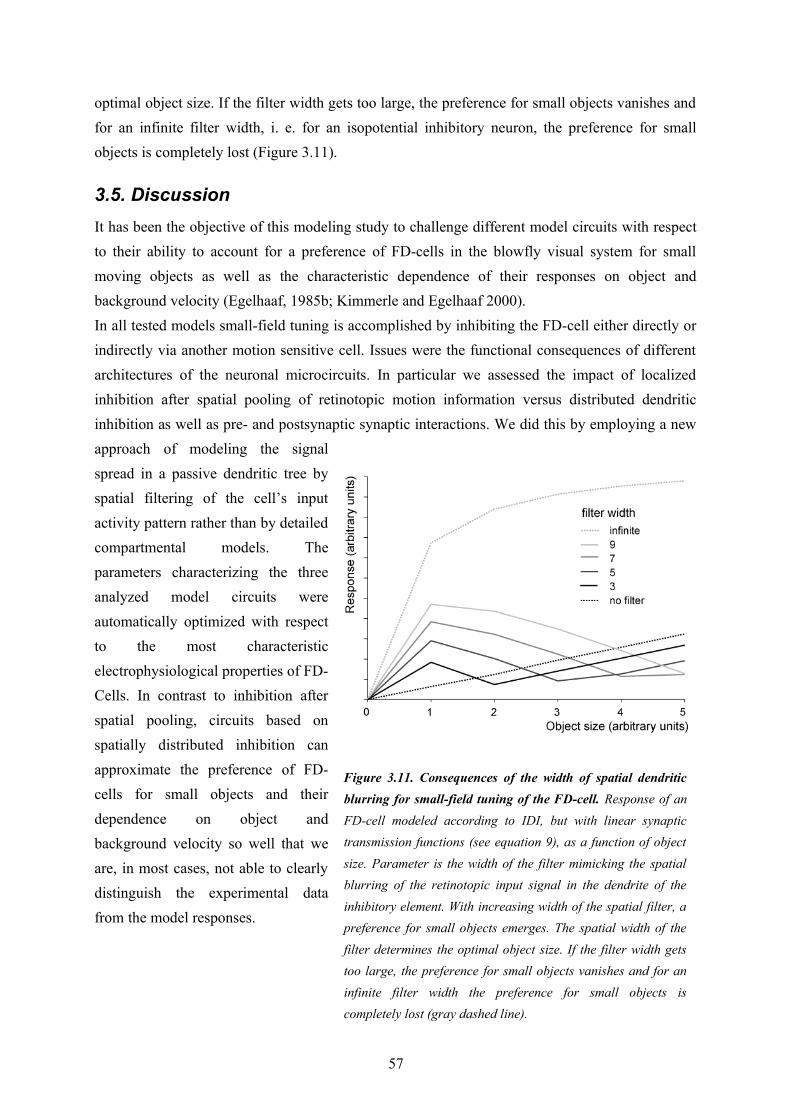
optimal object size. If the filter width gets too large, the preference for small objects vanishes and for an infinite filter width, i. e. for an isopotential inhibitory neuron, the preference for small objects is completely lost (Figure 3.11).
3.5. DiscussionIt has been the objective of this modeling study to challenge different model circuits with respect to their ability to account for a preference of FD-cells in the blowfly visual system for small moving objects as well as the characteristic dependence of their responses on object and background velocity (Egelhaaf, 1985b; Kimmerle and Egelhaaf 2000). In all tested models small-field tuning is accomplished by inhibiting the FD-cell either directly or indirectly via another motion sensitive cell. Issues were the functional consequences of different architectures of the neuronal microcircuits. In particular we assessed the impact of localized inhibition after spatial pooling of retinotopic motion information versus distributed dendritic inhibition as well as pre- and postsynaptic synaptic interactions. We did this by employing a new approach of modeling the signal spread in a passive dendritic tree by spatial filtering of the cell’s input activity pattern rather than by detailed compartmental models. The parameters characterizing the three analyzed model circuits were automatically optimized with respect to the most characteristic electrophysiological properties of FD-Cells. In contrast to inhibition after spatial pooling, circuits based on spatially distributed inhibition can approximate the preference of FD-cells for small objects and their dependence on object and background velocity so well that we are, in most cases, not able to clearly distinguish the experimental data from the model responses.
57
Figure 3.11. Consequences of the width of spatial dendritic blurring for small-field tuning of the FD-cell. Response of an FD-cell modeled according to IDI, but with linear synaptic transmission functions (see equation 9), as a function of object size. Parameter is the width of the filter mimicking the spatial blurring of the retinotopic input signal in the dendrite of the inhibitory element. With increasing width of the spatial filter, a preference for small objects emerges. The spatial width of the filter determines the optimal object size. If the filter width gets too large, the preference for small objects vanishes and for an infinite filter width the preference for small objects is completely lost (gray dashed line).
The distributed inhibition satisfies all constraints
In the Direct Pooled Inhibition (DPI) model, the inhibitory element spatially integrates the motion signals before inhibiting the FD-cell directly. With appropriate parameter constellations it satisfies either the characteristic size dependence or the velocity dependence, but not both with the same parameter setting. Hence, this model cannot account for the characteristic features of the FD-cells.With a spatially distributed interaction between the inhibitory element and the FD-cell or its input elements the performance improves significantly. In the model “Direct Distributed Inhibition” (DDI), the inhibitory element interacts with the FD-cell dendro-dendritically, whereas in the model “Indirect Distributed Inhibition” (IDI) it interacts presynaptically to the FD-cell with its retinotopic input elements. The two distributed models approximate quite well both the dependence of the FD responses on pattern size as well as its dependence on object and background velocity. At most data points are the model data within the standard error of the mean of the experimental data.This good performance of the distributed models relies on a spatial blurring of the retinotopically mediated velocity signal in the dendrite of the inhibitory neuron. Hence, we can conclude that a distributed interaction which preserves the spatially distributed retinotopic velocity signal in the inhibitory neuron, though in a blurred form, is an essential part of the circuitry of object detection in the visual system of the fly.This conclusion is in good accordance with the available experimental data: (1) elimination of the inhibitory vCH-cell eliminates the preference of the FD-cell for small objects (Warzecha, 1993). (2) The vCH-cell and the FD-cell come in close contact to each other only in their dendritic regions. The dendritic aborisations of the FD-cell are totally covered by the aborisations of the vCH-cell along their horizontal extent (Egelhaaf et al., 1993). (3) Varicose swellings on the dendrites of the vCH-cell indicate that the dendrites are an output region (Gauck et al., 1997). (4) A spatially distributed inhibition requires a distributed activation of the inhibiting neuron's aborisations when excited by spatially limited stimuli. This distributed activation was shown for the vCH-cell (Egelhaaf et al., 1993) and is likely to be mediated via dendro-dendritic synapses by the so-called HS-cells (Haag and Borst, 2002). (5) The joint input and output aborisations of the inhibitory vCH-cell (Egelhaaf et al., 1993; Kretzberg et al., 2001; Hengstenberg and Hengstenberg, 1980) form the structural basis of spatial blurring of the retinotopic input activity pattern (Cuntz et al. 2003).
Advantages of distributed processing
As a potential advantage of a circuit relying on spatially distributed inhibition the inhibitory signal has more computational degrees of freedom than a pooled signal. In the latter case, only the signal strength can be varied as a function of time, whereas in the former situation the spatial domain can also be used. Hence, in the case of a distributed interaction the inhibitory signal may depend in
58
different ways on object size as well as on the contrast and speed of the stimuli (Borst and Egelhaaf, 1993; Egelhaaf et al. 1993).There might be another advantage of distributed models (DDI and IDI) over a model where the signal in the inhibitory element is spatially pooled prior to its interaction with the FD-cell (DPI). Unlike the DPI model, when tuned to the size dependence of the FD-cell the responses of the DDI and IDI models do not confound two objects moving in the receptive field with a single object of twice the size in their responses. A second object has only a small effect on the response of the models with distributed inhibition, whereas the response of the DPI model decreases. This means that spatially distributed inhibition cannot be disturbed as easily as an inhibition after spatial pooling by a second object which turns up in the receptive field of the FD-cell. Although this prediction has not been tested in FD-cells so far, a similar effect was found in an object-sensitive cell of dragonflies (Geurten et al., 2007).
Indirect inhibition is less demanding
It is not known so far whether the spatially distributed inhibition operates directly on the dendrite of the FD-cell or indirectly via its retinotopic input elements. Both DDI and IDI are able to mimic similarly well all considered response properties of FD-cells. However, the synaptic conductance changes required for this performance differ for the two wiring schemes. IDI achieves the required performance with conductance changes which are by magnitudes smaller than the ones necessary for DDI. The performance of IDI does not improve further with increasing conductances. In contrast, DDI requires not only much higher conductance changes than IDI to satisfy the constraints, but gets continually better with growing conductance changes. Measurements of input resistance in the axon of blowfly motion sensitive neurons without and during visual motion stimulation reveal a ratio of less than 2:1 between the total synaptically induced conductance and the leak conductance (Single et al., 1997; Grewe et al. 2006). The FD-cell models proposed here hardly allow us to make realistic predictions of conductance ratios, because these models are intended to test the performance of different network architectures for a minimum set of assumptions and do not take the precise biophysical and geometrical properties of the involved neurons into account. Since in the electrophysiological experiment the postsynaptic sites are electrotonically distant from the recording site, the conductance changes determined in the axon may be considerably smaller than in the dendritic postsynaptic areas. This is because the conductance ratio in the axon depends on all conductance distributed over the dendritic tree, on the longitudinal conductances between the postsynaptic sites in the dendrite and the recording site in the axon as well as on the leak conductance of the axon (Hennig unpublished). Moreover, further geometrical properties may have to be taken into account: In the case of the DDI model, for example, the location of inhibitory synapses on the FD-cell’s dendrite may affect the required conductances. An inhibition on the path between the retinotopic input sites and the axonal output site, was shown to be much more efficient than an inhibition in the more distal parts of the
59
dendrites (Koch et al., 1983). Thus, a closer analysis of the consequences of the spatial structure of the inhibitory neuron and the FD-cell requires detailed compartmental models with realistic biophysical parameters.Nevertheless, independent of the biophysical details of the synaptic interaction between inhibitory neuron and FD-cell two advantages of a distributed indirect inhibition make this wiring scheme currently the most plausible one: Since IDI performs well for much smaller conductances than DDI, it is likely to be much less demanding with respect to energy expenditure. This is because, large synaptic currents require much more ions to be actively transported to the other side of the cell membrane. Furthermore IDI is less demanding with respect to the biophysical and geometrical properties of the FD-cell, because in DDI the very simple approximation of the model FD-cell operates sufficiently well only for very large synaptically controlled conductance. Only additional biophysical and geometric assumptions may – if at all - improve DDI in this respect.
Prediction to distinguish indirect and direct inhibition electrophysiologically
The two distributed models might be directly distinguished by experimental analysis. Due to an indirect inhibition the overall conductance of the FD-cell should decrease with increasing object size. The overall conductance depends, apart from the leak conductance, on the excitatory synaptic conductances. Therefore, a decreasing cellular response with increasing object size is predicted to lead to a decreasing overall conductance. In the case of direct inhibition of the FD-cell however, motion in the receptive field would also lead to an opening of inhibitory ion channels in the FD-cell dendrite. With increasing object size, the inhibitory currents are predicted to overcompensate the excitatory input currents. Thus, in the case of a direct inhibition, the overall conductance of an FD-cell should increase with increasing object size, in contrast to an indirect inhibition.
Open problems
Despite the good overall agreement of the models based on distributed inhibition and the experimental data, there are some differences for spatially extended objects and at high velocities. The difference obtained for large objects may be caused by the very simplistic receptive field structure of the model cells. In the models we assumed the same sensitivity across the entire receptive field, although the sensitivity of real cells building the circuit declines towards the receptive field edges (Egelhaaf, 1985b; Krapp et al. 2001). Therefore, more realistic receptive field structures may improve some details of the model performance. Moreover, the receptive fields of both the model FD-cells and of the inhibitory element had the same size, whereas the inhibitory vCH-cells in real flies have a considerably larger receptive field extending even into the contralateral visual field (Egelhaaf et al., 1993; Krapp et al. 2001). Two aspects may be responsible for the difference of the model performance and the experimental data at high velocities. (1) Velocity coding by biological motion detectors, as found in the fly
60
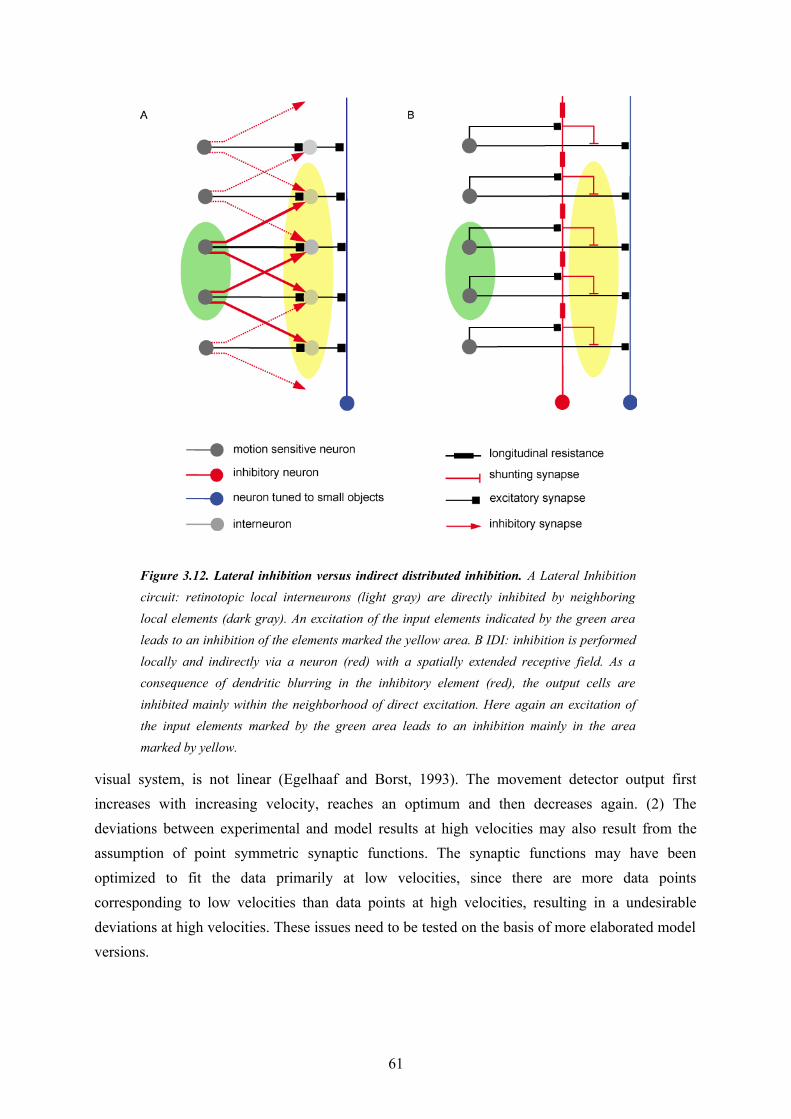
visual system, is not linear (Egelhaaf and Borst, 1993). The movement detector output first increases with increasing velocity, reaches an optimum and then decreases again. (2) The deviations between experimental and model results at high velocities may also result from the assumption of point symmetric synaptic functions. The synaptic functions may have been optimized to fit the data primarily at low velocities, since there are more data points corresponding to low velocities than data points at high velocities, resulting in a undesirable deviations at high velocities. These issues need to be tested on the basis of more elaborated model versions.
61
Figure 3.12. Lateral inhibition versus indirect distributed inhibition. A Lateral Inhibition circuit: retinotopic local interneurons (light gray) are directly inhibited by neighboring local elements (dark gray). An excitation of the input elements indicated by the green area leads to an inhibition of the elements marked the yellow area. B IDI: inhibition is performed locally and indirectly via a neuron (red) with a spatially extended receptive field. As a consequence of dendritic blurring in the inhibitory element (red), the output cells are inhibited mainly within the neighborhood of direct excitation. Here again an excitation of the input elements marked by the green area leads to an inhibition mainly in the area marked by yellow.
Similarity to lateral inhibition
Spatial blurring of the retinotopic input resulting from dendritic signal spread in the inhibitory neuron is restricted to the neighborhood of an activated input element. This is also true for the mechanism of lateral inhibition. A lateral inhibition circuit and the IDI model also show a structural similarity. In the case of lateral inhibition, a layer of interneurons is laterally inhibited by neighboring input elements (Figure 3.12). Assuming appropriate parameter settings, the sum over the interneuron’s activation shows a preference for small objects. In the IDI circuit, the layer of interneurons is replaced by a neuron with a dendritic output region that spatially blurs the retinotopic input signal. This signal then inhibits the input elements of the circuit’s output neuron in a spatially distributed fashion. Hence, the mechanism of IDI is, to some extent, reminiscent of a lateral inhibition network. This functional similarity between the indirect distributed inhibition circuit and the lateral inhibition network suggests that sensory or perceptual phenomena that are conventionally be explained by lateral inhibition may be also accounted for in an alternative way. A classical example is the perceptual enhancement of contrast borders (often referred to as Mach bands (Mach, 1865; Békésy, 1967). Whether a distributed dendritic interaction like the one presented with the IDI model is able to account in detail for this kind of phenomena needs to be tested.
3.6. AcknowledgmentsWe are grateful to Jan Grewe and Rafael Kurtz for critically reading drafts of the paper and making helpful suggestions and to Emily Baird for improving our English.
3.7. ReferencesAllman, J, Miezin, F., McGuinness, E. (1985). Direction- and velocity-specific responses from beyond the classical receptive field in the middle temporal visual area (MT). Perception 14 (2), 105-126.
Barnett, P.D., Nordström, K., O'Carroll, D.C. (2007). Retinotopic organization of small-field-target-detecting neurons in the insect visual system. Curr. Biol. 17 (7), 569-578.
Békésy G. (1967). Sensory Inhibition. New Jersey: Princeton University Press.
Borst, A., Egelhaaf, M. (1993). Processing of synaptic signals in fly visual interneurons selectively responsive to small moving objects In: Brain theory - spatio-temporal aspects of brain function. eds. Aertsen A, von Seelen W,. Amsterdam: Elsevier. 47-66.
Collett, T.S. and King, A.J. (1975). Vision during flight In: The compound eye and vision of insects ed. Horridge GA,. Oxford: Clarendon Press. 437-466.
Collett, T.S. (1971). Visual neurones for tracking moving targets. Nature 232 (5306), 127-130.
62
Collett, T.S. (1972). Visual Neurones in the Anterior Optic Tract of the Privet Hawk Moth. J. Comp. Physiol. A 78:396-433.
Cuntz, H., Haag, J., Borst, A. (2003). Neural image processing by dendritic networks. Proc. Natl. Acad. Sci. USA 100 (19), 11082-11085.
Davidson, R.M. and Bender, D.B. (1991). Selectivity for relative motion in the monkey superior colliculus. J. Neurophysiol. 65 (5), 1115-1133.
Egelhaaf, M. (1985a). On the neuronal basis of figure-ground discrimination by relative motion in the visual system of the fly. I. Behavioural constraints imposed on the neuronal network and the role of the optomotor system. Biol. Cybern. 52:123-140.
Egelhaaf, M. (1985b). On the neuronal basis of figure-ground discrimination by relative motion in the visual system of the fly. II. Figure-detection cells a new class of visual interneurones. Biol. Cybern. 52:195-209.
Egelhaaf, M. (1985c). On the neuronal basis of figure-ground discrimination by relative motion in the visual system of the fly. III. Possible input circuitries and behavioural significance of the FD-cells. Biol. Cybern. 52, 267-280.
Egelhaaf, M. (2006). The neural computation of visual motion In: Invertebrate vision. eds.Warrant, E., Nilsson, D.E., Cambridge (UK): Cambridge University Press. pp. 399-461.
Egelhaaf, M. and Borst, A. (1993) Movement detection in arthropods. In: Visual Motion and its Role in the Stabilization of Gaze. eds. Miles, F.A., Wallman, J., Elsevier, Amsterdam
Egelhaaf, M., Borst, A., Warzecha, A.-K., Flecks, S., Wildemann, A. (1993). Neural circuit tuning fly visual neurons to motion of small objects. II. Input organization of inhibitory circuit elements revealed by electrophysiological and optical recording techniques. J. Neurophysiol. 69 (2), 340-351.
Frost, B.J., Scilley, P.L., Wong, S.C. (1981). Moving background patterns reveal double-opponency of directionally specific pigeon tectal neurons. Exp. Brain Res. 43 (2), 173-185.
Frost, B.J., Cavanagh, P., Morgan, B. (1988). Deep tectal cells in pigeons respond to kinematograms. J. Comp. Physiol. A 162 (5), 639-647.
Frost, B.J., Nakayama, K. (1983). Single visual neurons code opposing motion independent of direction. Science 220 (4598), 744-745.
Gauck, V., Borst, A. (1999). Spatial response properties of contralateral inhibited lobula plate tangential cells in the fly visual system. J. Comp. Neurol. 406 (1), 51-71.
Gauck, V., Egelhaaf, M., Borst A. (1997). Synapse distribution on VCH, an inhibitory, motion-sensitive interneuron in the fly visual system. J. Comp. Neurol. 381 (4), 489-499.
63

Geurten, B.R.H., Nordström, K., Sprayberry, J.D.H., Bolzon D.M., O'Carroll D.C. (2007). Neural mechanisms underlying target detection in a dragonfly centrifugal neuron. J. Exp. Biol. 210 (Pt 18), 3277-3284.
Grewe, J., Matos, N., Egelhaaf, M., Warzecha, A.-K. (2006) Implications of functionally different synaptic inputs for neuronal gain and computational properties of fly visual interneurons. J. Neurophysiol. 96 (4), 1838-1847.
Haag, J., Borst, A. (2002). Dendro-dendritic interactions between motion-sensitive large-field neurons in the fly. J. Neurosci. 22 (8), 3227-3233.
Hausen, K. (1976a). Struktur, Funktion und Konnektivität bewegungsempfindlicher Interneurone im dritten optischen Neuropil der Schmeissfliege Calliphora erythrocephala. In: Doctoral Dissertation, University of Tuebingen.
Hausen, K. (1976b). Functional charaterization and anatomical identification of motion sensitive neurons in the lobula plate of the blowfly Calliphora erythrocephala. Z. Naturforsch. 31c, 629-633.
Hausen, K. (1982a). Motion sensitive interneurons in the optomotor system of the fly. I. The Horizontal Cells: Structure and signals Biol. Cybern. 45, 143-156.
Hausen, K. (1982b). Motion sensitive interneurons in the optomotor system of the fly. II. The Horizontal Cells: Receptive field organization and response characteristics. Biol Cybern 46, 67-79.
Hengstenberg, R., Hengstenberg, B. (1980). Intracellular staining of insect neurons with procion yellow In: Neuroanatomical Techniques. eds. Strausfeld, N.J., Miller, T.A. New York, Heidelberg, Berlin: Springer, 307-324.
Higgins, C.M., Pant, V. (2004). An elaborated model of fly small-target tracking. Biol. Cybern. 91, 417-428.
Kimmerle, B., Egelhaaf, M. (2000). Detection of object motion by a fly neuron during simulated flight. J. Comp. Physiol. A 186 (1), 21-31.
Kimmerle B., Warzecha A.-K., Egelhaaf M. (1997). Objekt detection in the fly during simulated translatory flight. J. Comp. Physiol. A 181, 247-255.
Koch, C (1999). Biophysics of Computation. New York, Oxford: Oxford University Press.
Koch, C., Poggio, T., Torre, V. (1983). Nonlinear interactions in a dendritic tree: localization, timing, and role in information processing. Proc. Natl Acad. Sci. U S A 80, 2799-2802.
Koch, C., Segev, I. (1998). Methoods in Neural Modelling. Cambridge, London: MIT Press.
Krapp, H.G., Hengstenberg, R., Egelhaaf, M. (2001). Binocular contributions to optic flow processing in the fly visual system. J. Neurophysiol. 85 (2), 724-734.
64
Kretzberg, J., Egelhaaf, M., Warzecha, A.-K. (2001). Membrane potential fluctuations determine the precision of spike timing and synchronous activity: a model study. J. Comput. Neurosci. 10 (1), 79-97.
Mach, E. (1865). Über die Wirkung der räumlichen Vertheilung des Lichtreizes auf der Netzhaut, I Sitzungsberichte der mathematisch-naturwissenschaftlichen Classe der kaiserlichen Akademie der Wissenschaften 54, 131-144.
Mandl, G. (1985). Responses of visual cells in cat superior colliculus to relative pattern movement. Vision Res. 25 (2), 267-281.
Mason, R. (1979). Responsiveness of cells in the cat's superior colliculus to textured visual stimuli. Exp. Brain Res. 37 (2), 231-240.
O'Carroll, D.C. (1993). Feature-detecting neurons in dragonflies. Nature 362, 541-543
Olberg, R.M. (1981). Object- and self-movement detectors in the ventral nerve cord of the dragonfly. J. Comp. Physiol. 141, 327-334.
Olberg, R.M. (1986). Identified target-selective visual interneurons descending from the dragonfly brain. J .Comp. Physiol. 159, 827-840.
Price, K.V. (1999). An introduction to differential evolution In: New Ideas in Optimization eds. Corne, D., Dorigo M., Glover, F., Dasgupta, D., Moscato, P., et al., Maidenhead (UK): McGraw-Hill Ltd. 79-108.
Reichardt, W., Poggio, T., Hausen, K. (1983). Figure-Ground Discrimination by Relative Movement in the Visual System of the fly. Part II: Towards the Neural Circuitry. Biol. Cybern. 46, 1-30.
Rizzolatti, G, Camarda, R. (1977). Influence of the presentation of remote visual stimuli on visual responses of cat area 17 and lateral suprasylvian area. Exp. Brain Res. 29 (1), 107-122.
Rowell, C.H.F., O'Shea, M. (1976). The neuronal basis of a sensory analyzer, the acridid movement detector system. III. Control of response amplitude by tonic lateral inhibition. J. Exp. Biol. 65, 617-625.
Rowell C.H.F., O'Shea M., Williams J.L.D. (1977) The neuronal basis of a sensory analyzer, the acridid movement detector system. IV. The preference for small field stimuli J. Exp. Biol. 68, 157-185.
Single, S., Haag J., Borst, A. (1997). Dendritic computation of direction selectivity and gain control in visual interneurons. J. Neurosci. 17 (16), 6023-6030.
Sterling, P. and Wickelgren, B.G. (1969). Visual receptive fields in the superior colliculus of the cat. J. Neurophysiol. 32 (1), 1-15.
65
Tanaka, K., Hikosaka, K., Saito, H., Yukie, M., Fukada, Y., et al. (1986) Analysis of local and wide-field movements in the superior temporal visual areas of the macaque monkey. J. Neurosci. 6 (1), 134-144.
Tsai, HJ (1990) Response of toad's tectal neurons to in-phase and anti-phase movements of object and textured background. J. Comp. Physiol. A 167, 857-863.
von Grünau, M., Frost, B. J. (1983). Double-opponent-process mechanism underlying RF-structure of directionally specific cells of cat lateral suprasylvian visual area. Exp. Brain Res. 49 (1), 84-92.
Warzecha, A.K., Egelhaaf, M., Borst, A. (1993). Neural circuit tuning fly visual interneurons to motion of small objects. I. Dissection of the circuit by pharmacological and photoinactivation techniques. J. Neurophysiol. 69, 329-339.
66
4. Binocular integration of visual information: a model study on naturalistic optic flow processing.
This Chapter was published as Hennig P., Kern R. and Egelhaaf M. (2011): Binocular integration of visual information: a model study on naturalistic optic flow processing. Front. Neural Circuits. 5:4. doi: 10.3389/fncir.2011.00004
Corresponding author: Patrick HennigEditor: Takao K. Hensch, Harvard University, USAReceived: 23 December 2010; Paper pending published: 13 January 2011;Accepted: 21 March 2011; Published online: 04 April 2011.
4.1. AbstractThe computation of visual information from both visual hemispheres is often of functional relevance when solving orientation and navigation tasks. The vCH-cell is a motion-sensitive wide-field neuron in the visual system of the blowfly Calliphora, a model system in the field of optic flow processing. The vCH-cell receives input from various other identified wide-field cells, the receptive fields of which are located in both the ipsilateral and the contralateral visual field. The relevance of this connectivity to the processing of naturalistic image sequences, with their peculiar dynamical characteristics, is still unresolved. To disentangle the contributions of the different input components to the cell’s overall response, we used electrophysiologically determined responses of the vCH-cell and its various input elements to tune a model of the vCH-circuit. Their impact on the vCH-cell response could be distinguished by stimulating not only extended parts of the visual field of the fly, but also selected regions in the ipsi- and contralateral visual field with behaviorally generated optic flow. We show that a computational model of the vCH-circuit is able to account for the neuronal activities of the counterparts in the blowfly’s visual system. Furthermore, we offer an insight into the dendritic integration of binocular visual input.
4.2. IntroductionNavigation and the control of locomotion in any environment require information about ego-motion. For many living beings, vision is an important sense with which to gather such information. Animals with a panoramic field of view, such as insects, many birds and several mammals with lateral eyes, can exploit visual cues to gather information about ego motion. Forward translation of the animal, for instance, elicits optic flow directed from front to back on both eyes (Gibson, 1950). In contrast, rotatory ego motion about the vertical axis of the eyes leads one eye to experience motion from front to back and the other from back to front. Hence, by taking into account global movement direction on both retinae, translatory and rotational self-motion can be distinguished. This strategy of combining visual motion information from a panoramic field of view is used by several animals with lateral eyes, such as rabbits, pigeons, and
67
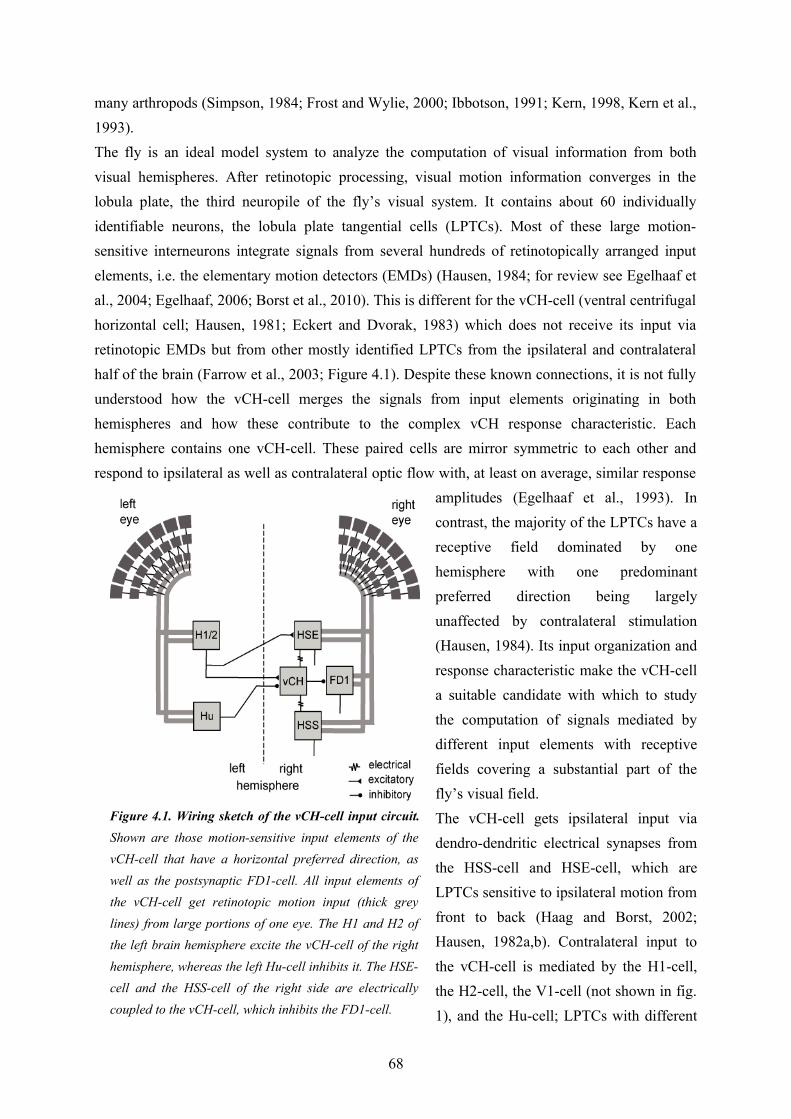
many arthropods (Simpson, 1984; Frost and Wylie, 2000; Ibbotson, 1991; Kern, 1998, Kern et al., 1993).The fly is an ideal model system to analyze the computation of visual information from both visual hemispheres. After retinotopic processing, visual motion information converges in the lobula plate, the third neuropile of the fly’s visual system. It contains about 60 individually identifiable neurons, the lobula plate tangential cells (LPTCs). Most of these large motion-sensitive interneurons integrate signals from several hundreds of retinotopically arranged input elements, i.e. the elementary motion detectors (EMDs) (Hausen, 1984; for review see Egelhaaf et al., 2004; Egelhaaf, 2006; Borst et al., 2010). This is different for the vCH-cell (ventral centrifugal horizontal cell; Hausen, 1981; Eckert and Dvorak, 1983) which does not receive its input via retinotopic EMDs but from other mostly identified LPTCs from the ipsilateral and contralateral half of the brain (Farrow et al., 2003; Figure 4.1). Despite these known connections, it is not fully understood how the vCH-cell merges the signals from input elements originating in both hemispheres and how these contribute to the complex vCH response characteristic. Each hemisphere contains one vCH-cell. These paired cells are mirror symmetric to each other and respond to ipsilateral as well as contralateral optic flow with, at least on average, similar response
amplitudes (Egelhaaf et al., 1993). In contrast, the majority of the LPTCs have a receptive field dominated by one hemisphere with one predominant preferred direction being largely unaffected by contralateral stimulation (Hausen, 1984). Its input organization and response characteristic make the vCH-cell a suitable candidate with which to study the computation of signals mediated by different input elements with receptive fields covering a substantial part of the fly’s visual field. The vCH-cell gets ipsilateral input via dendro-dendritic electrical synapses from the HSS-cell and HSE-cell, which are LPTCs sensitive to ipsilateral motion from front to back (Haag and Borst, 2002; Hausen, 1982a,b). Contralateral input to the vCH-cell is mediated by the H1-cell, the H2-cell, the V1-cell (not shown in fig. 1), and the Hu-cell; LPTCs with different
68
Figure 4.1. Wiring sketch of the vCH-cell input circuit. Shown are those motion-sensitive input elements of the vCH-cell that have a horizontal preferred direction, as well as the postsynaptic FD1-cell. All input elements of the vCH-cell get retinotopic motion input (thick grey lines) from large portions of one eye. The H1 and H2 of the left brain hemisphere excite the vCH-cell of the right hemisphere, whereas the left Hu-cell inhibits it. The HSE-cell and the HSS-cell of the right side are electrically coupled to the vCH-cell, which inhibits the FD1-cell.
preferred directions and receptive field locations. H1 and H2 get retinotopic input from EMDs and have largely overlapping receptive fields. They respond best to motion directed from back to front (Warzecha et al., 1998; Haag and Borst, 2003; Krapp et al., 2001). Both are heterolateral elements and project onto the vCH cell and further cells of the contralateral brain hemisphere. Despite their similar functional properties H1 and H2 terminate on different sites on vCH (Horstmann et al., 2000; Haag and Borst 2001). V1 is the only known input element to vCH with a predominantly vertical preferred direction. It provides excitatory input to the contralateral vCH-cell (Haag and Borst, 2003). A spiking contralateral element, responding best to motion from front to back, inhibits the vCH-cell with pronounced IPSPs (Egelhaaf et al., 1993; Gauck et al., 1997). This element is not yet anatomically identified and is referred to as Hu-cell. Recordings at different vCH-cell sites indicate that the inhibition by the Hu-cell originates outside the lobula plate (Haag and Borst, 2001). The vCH-cell in turn inhibits most likely via dendritic output synapses the FD1-cell, which is thought to contribute to solving object detection tasks (Egelhaaf, 1985; Warzecha et al., 1993; Gauck et al., 1997; Kimmerle et al., 1997). Major parts of the circuit are illustrated in figure 4.1.To unravel the spatial integration properties of the vCH-cell as well as the contribution of its input elements to its overall responses under natural stimulus conditions, we analyzed the vCH-cell and selected presynaptic elements electrophysiologically as well as via modeling. The model includes the visual pathway from the peripheral visual system to the LPTCs. The different LPTCs are modeled as one-compartment membrane patches. The cells and their model counterparts are stimulated by naturalistic optic flow, reconstructed from trajectories of free-flying flies. To disentangle the influence of different parts of the visual field and the interactions between the response components elicited by stimulation of these parts for each analyzed cell, the lateral and/or the binocular frontal parts of the visual field are masked in different combinations. The cellular responses to selected stimuli are used to adjust the model, which yields the contribution of each of the input elements to the vCH response with a realistic dynamic range.
4.3. Material and Methods
Stimulus generation and electrophysiology
The position and orientation of the head of blowflies flying in a cage of 40x40x40 cm³, with images of herbage on its side walls, were recorded using magnetic fields driving search coils attached to the flies (van Hateren and Schilstra, 1999; Schilstra and van Hateren, 1998). Because the fly’s compound eyes are fixed in its head, and the visual interior of the cage was known, the visual stimulus encountered by the fly during a flight could be reconstructed.Reconstructions of three flight sequences of 3.45s each, originating from three different flies (sequences A, B, and C), were played back on a panoramic stimulus device, FliMax (Lindemann et al., 2003), at a frame rate of 370Hz. Proper spatial and temporal prefiltering prevented
69
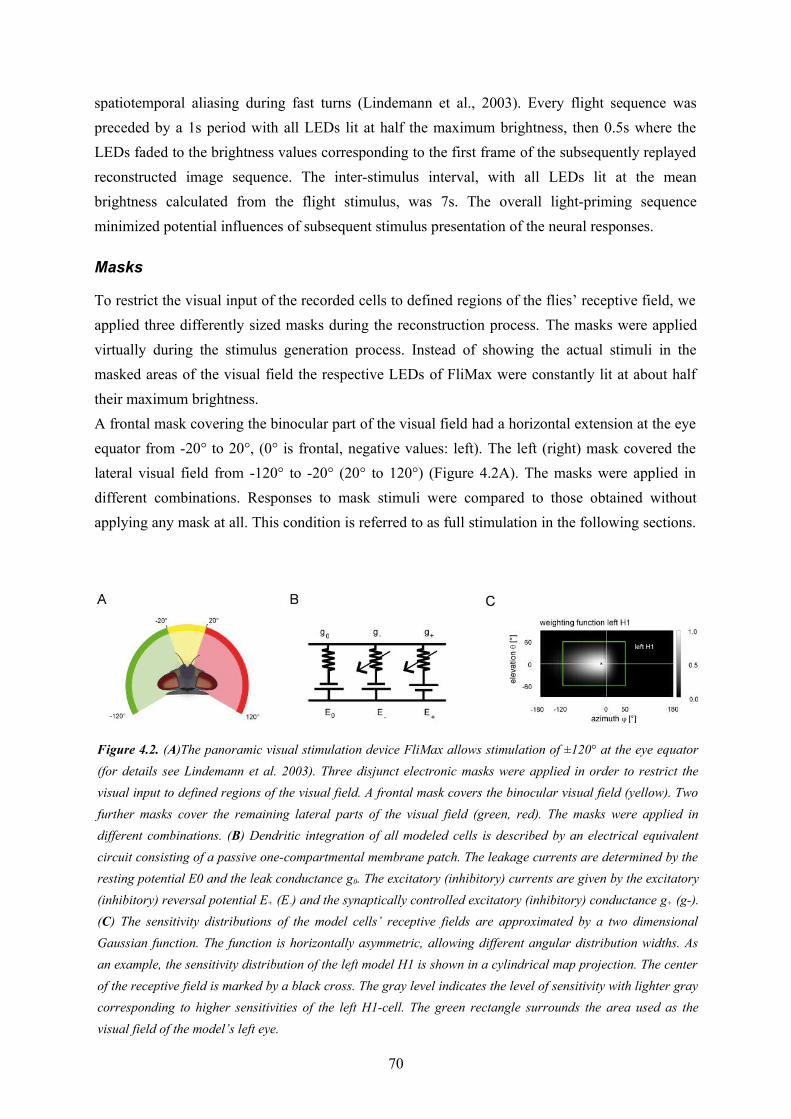
spatiotemporal aliasing during fast turns (Lindemann et al., 2003). Every flight sequence was preceded by a 1s period with all LEDs lit at half the maximum brightness, then 0.5s where the LEDs faded to the brightness values corresponding to the first frame of the subsequently replayed reconstructed image sequence. The inter-stimulus interval, with all LEDs lit at the mean brightness calculated from the flight stimulus, was 7s. The overall light-priming sequence minimized potential influences of subsequent stimulus presentation of the neural responses.
Masks
To restrict the visual input of the recorded cells to defined regions of the flies’ receptive field, we applied three differently sized masks during the reconstruction process. The masks were applied virtually during the stimulus generation process. Instead of showing the actual stimuli in the masked areas of the visual field the respective LEDs of FliMax were constantly lit at about half their maximum brightness. A frontal mask covering the binocular part of the visual field had a horizontal extension at the eye equator from -20° to 20°, (0° is frontal, negative values: left). The left (right) mask covered the lateral visual field from -120° to -20° (20° to 120°) (Figure 4.2A). The masks were applied in different combinations. Responses to mask stimuli were compared to those obtained without applying any mask at all. This condition is referred to as full stimulation in the following sections.
70
Figure 4.2. (A)The panoramic visual stimulation device FliMax allows stimulation of ±120° at the eye equator (for details see Lindemann et al. 2003). Three disjunct electronic masks were applied in order to restrict the visual input to defined regions of the visual field. A frontal mask covers the binocular visual field (yellow). Two further masks cover the remaining lateral parts of the visual field (green, red). The masks were applied in different combinations. (B) Dendritic integration of all modeled cells is described by an electrical equivalent circuit consisting of a passive one-compartmental membrane patch. The leakage currents are determined by the resting potential E0 and the leak conductance g0. The excitatory (inhibitory) currents are given by the excitatory (inhibitory) reversal potential E+ (E-) and the synaptically controlled excitatory (inhibitory) conductance g+ (g-). (C) The sensitivity distributions of the model cells’ receptive fields are approximated by a two dimensional Gaussian function. The function is horizontally asymmetric, allowing different angular distribution widths. As an example, the sensitivity distribution of the left model H1 is shown in a cylindrical map projection. The center of the receptive field is marked by a black cross. The gray level indicates the level of sensitivity with lighter gray corresponding to higher sensitivities of the left H1-cell. The green rectangle surrounds the area used as the visual field of the model’s left eye.
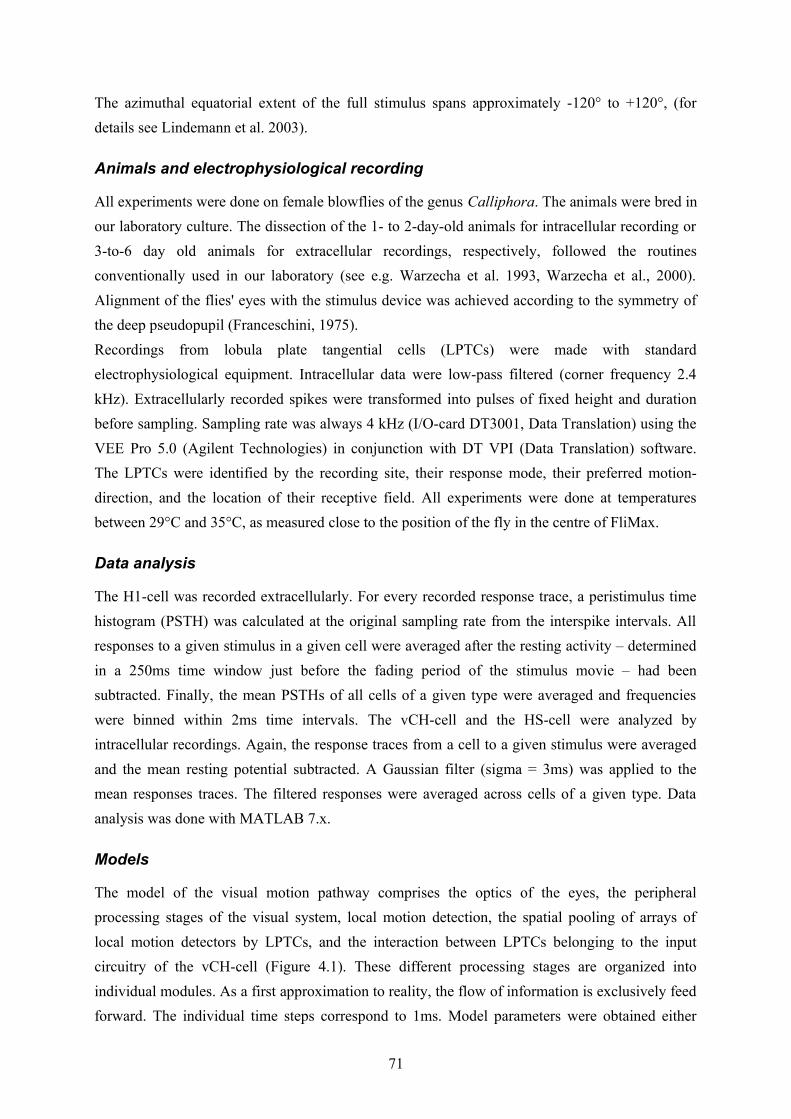
The azimuthal equatorial extent of the full stimulus spans approximately -120° to +120°, (for details see Lindemann et al. 2003).
Animals and electrophysiological recording
All experiments were done on female blowflies of the genus Calliphora. The animals were bred in our laboratory culture. The dissection of the 1- to 2-day-old animals for intracellular recording or 3-to-6 day old animals for extracellular recordings, respectively, followed the routines conventionally used in our laboratory (see e.g. Warzecha et al. 1993, Warzecha et al., 2000). Alignment of the flies' eyes with the stimulus device was achieved according to the symmetry of the deep pseudopupil (Franceschini, 1975).Recordings from lobula plate tangential cells (LPTCs) were made with standard electrophysiological equipment. Intracellular data were low-pass filtered (corner frequency 2.4 kHz). Extracellularly recorded spikes were transformed into pulses of fixed height and duration before sampling. Sampling rate was always 4 kHz (I/O-card DT3001, Data Translation) using the VEE Pro 5.0 (Agilent Technologies) in conjunction with DT VPI (Data Translation) software. The LPTCs were identified by the recording site, their response mode, their preferred motion-direction, and the location of their receptive field. All experiments were done at temperatures between 29°C and 35°C, as measured close to the position of the fly in the centre of FliMax.
Data analysis
The H1-cell was recorded extracellularly. For every recorded response trace, a peristimulus time histogram (PSTH) was calculated at the original sampling rate from the interspike intervals. All responses to a given stimulus in a given cell were averaged after the resting activity – determined in a 250ms time window just before the fading period of the stimulus movie – had been subtracted. Finally, the mean PSTHs of all cells of a given type were averaged and frequencies were binned within 2ms time intervals. The vCH-cell and the HS-cell were analyzed by intracellular recordings. Again, the response traces from a cell to a given stimulus were averaged and the mean resting potential subtracted. A Gaussian filter (sigma = 3ms) was applied to the mean responses traces. The filtered responses were averaged across cells of a given type. Data analysis was done with MATLAB 7.x.
Models
The model of the visual motion pathway comprises the optics of the eyes, the peripheral processing stages of the visual system, local motion detection, the spatial pooling of arrays of local motion detectors by LPTCs, and the interaction between LPTCs belonging to the input circuitry of the vCH-cell (Figure 4.1). These different processing stages are organized into individual modules. As a first approximation to reality, the flow of information is exclusively feed forward. The individual time steps correspond to 1ms. Model parameters were obtained either
71
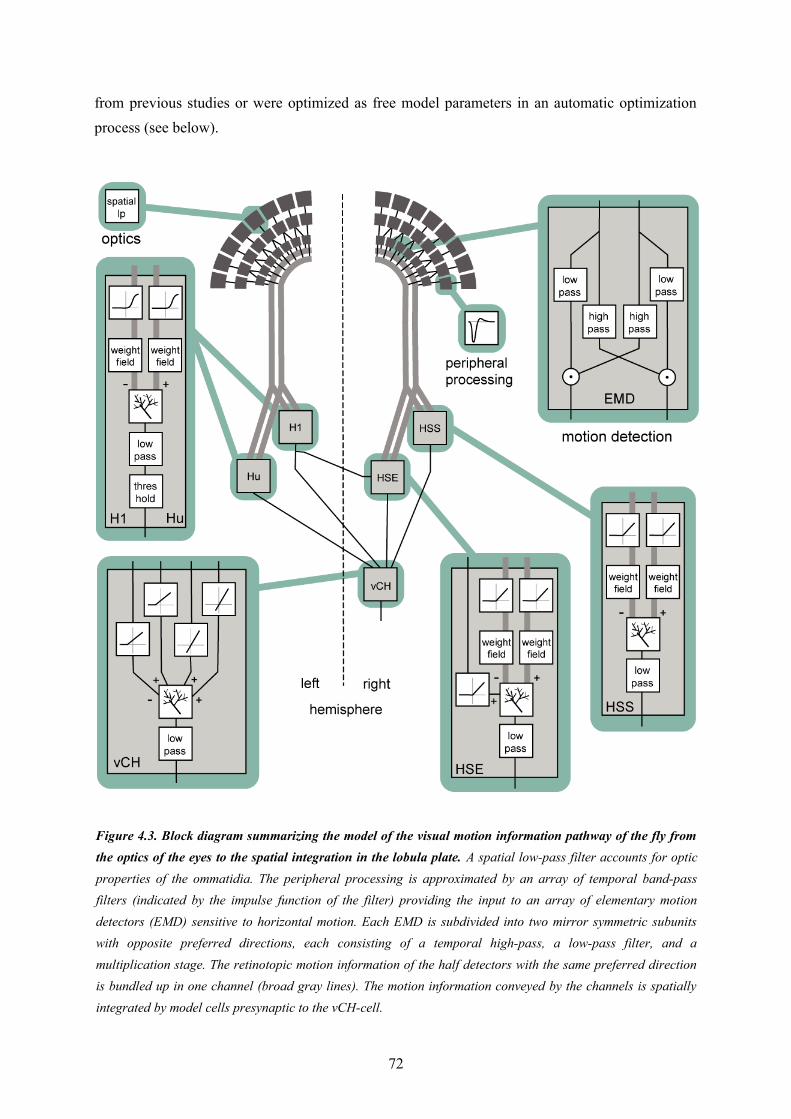
from previous studies or were optimized as free model parameters in an automatic optimization process (see below).
72
Figure 4.3. Block diagram summarizing the model of the visual motion information pathway of the fly from the optics of the eyes to the spatial integration in the lobula plate. A spatial low-pass filter accounts for optic properties of the ommatidia. The peripheral processing is approximated by an array of temporal band-pass filters (indicated by the impulse function of the filter) providing the input to an array of elementary motion detectors (EMD) sensitive to horizontal motion. Each EMD is subdivided into two mirror symmetric subunits with opposite preferred directions, each consisting of a temporal high-pass, a low-pass filter, and a multiplication stage. The retinotopic motion information of the half detectors with the same preferred direction is bundled up in one channel (broad gray lines). The motion information conveyed by the channels is spatially integrated by model cells presynaptic to the vCH-cell.
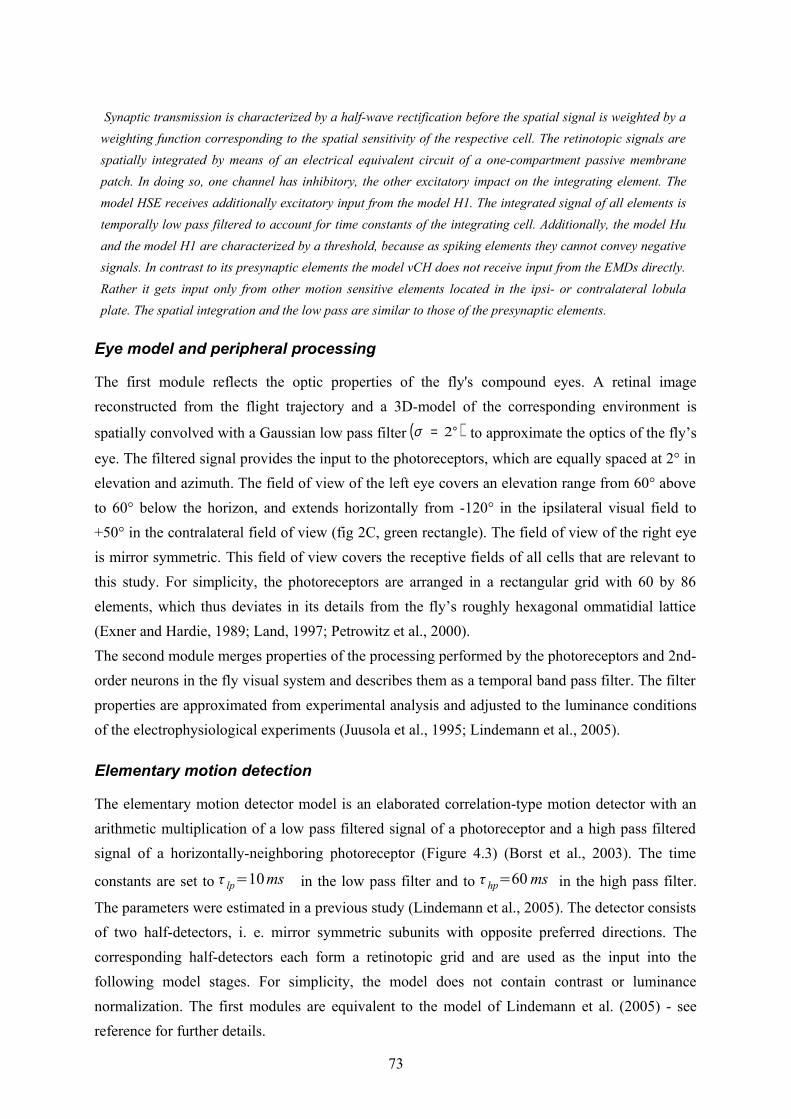
Eye model and peripheral processing
The first module reflects the optic properties of the fly's compound eyes. A retinal image reconstructed from the flight trajectory and a 3D-model of the corresponding environment is
spatially convolved with a Gaussian low pass filter ( )°= 2σ to approximate the optics of the fly’s
eye. The filtered signal provides the input to the photoreceptors, which are equally spaced at 2° in elevation and azimuth. The field of view of the left eye covers an elevation range from 60° above to 60° below the horizon, and extends horizontally from -120° in the ipsilateral visual field to +50° in the contralateral field of view (fig 2C, green rectangle). The field of view of the right eye is mirror symmetric. This field of view covers the receptive fields of all cells that are relevant to this study. For simplicity, the photoreceptors are arranged in a rectangular grid with 60 by 86 elements, which thus deviates in its details from the fly’s roughly hexagonal ommatidial lattice (Exner and Hardie, 1989; Land, 1997; Petrowitz et al., 2000).The second module merges properties of the processing performed by the photoreceptors and 2nd-order neurons in the fly visual system and describes them as a temporal band pass filter. The filter properties are approximated from experimental analysis and adjusted to the luminance conditions of the electrophysiological experiments (Juusola et al., 1995; Lindemann et al., 2005).
Elementary motion detection
The elementary motion detector model is an elaborated correlation-type motion detector with an arithmetic multiplication of a low pass filtered signal of a photoreceptor and a high pass filtered signal of a horizontally-neighboring photoreceptor (Figure 4.3) (Borst et al., 2003). The time
constants are set to τ lp=10ms in the low pass filter and to τ hp=60 ms in the high pass filter.
The parameters were estimated in a previous study (Lindemann et al., 2005). The detector consists of two half-detectors, i. e. mirror symmetric subunits with opposite preferred directions. The corresponding half-detectors each form a retinotopic grid and are used as the input into the following model stages. For simplicity, the model does not contain contrast or luminance normalization. The first modules are equivalent to the model of Lindemann et al. (2005) - see reference for further details.
73
Synaptic transmission is characterized by a half-wave rectification before the spatial signal is weighted by a weighting function corresponding to the spatial sensitivity of the respective cell. The retinotopic signals are spatially integrated by means of an electrical equivalent circuit of a one-compartment passive membrane patch. In doing so, one channel has inhibitory, the other excitatory impact on the integrating element. The model HSE receives additionally excitatory input from the model H1. The integrated signal of all elements is temporally low pass filtered to account for time constants of the integrating cell. Additionally, the model Hu and the model H1 are characterized by a threshold, because as spiking elements they cannot convey negative signals. In contrast to its presynaptic elements the model vCH does not receive input from the EMDs directly. Rather it gets input only from other motion sensitive elements located in the ipsi- or contralateral lobula plate. The spatial integration and the low pass are similar to those of the presynaptic elements.
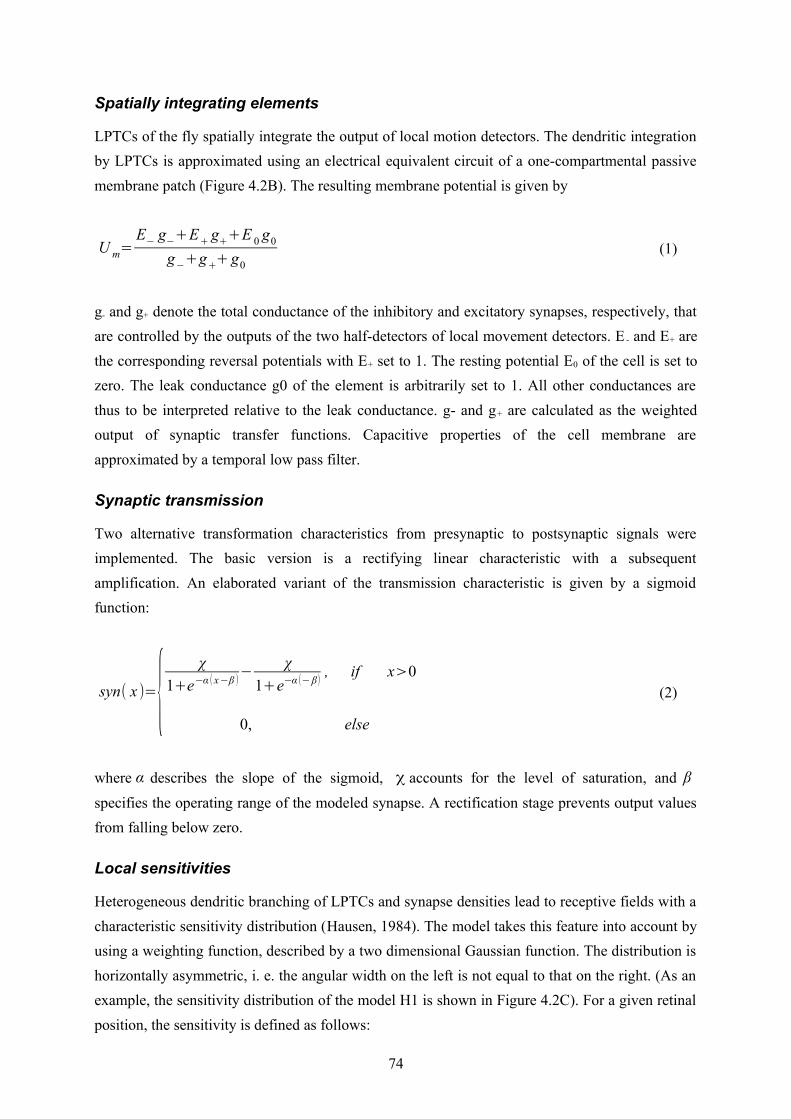
Spatially integrating elements
LPTCs of the fly spatially integrate the output of local motion detectors. The dendritic integration by LPTCs is approximated using an electrical equivalent circuit of a one-compartmental passive membrane patch (Figure 4.2B). The resulting membrane potential is given by
U m=E− g−+E+ g++E 0 g0
g−+g++ g0(1)
g- and g+ denote the total conductance of the inhibitory and excitatory synapses, respectively, that are controlled by the outputs of the two half-detectors of local movement detectors. E - and E+ are the corresponding reversal potentials with E+ set to 1. The resting potential E0 of the cell is set to zero. The leak conductance g0 of the element is arbitrarily set to 1. All other conductances are thus to be interpreted relative to the leak conductance. g- and g+ are calculated as the weighted output of synaptic transfer functions. Capacitive properties of the cell membrane are approximated by a temporal low pass filter.
Synaptic transmission
Two alternative transformation characteristics from presynaptic to postsynaptic signals were implemented. The basic version is a rectifying linear characteristic with a subsequent amplification. An elaborated variant of the transmission characteristic is given by a sigmoid function:
syn( x )={ χ1+e−α ( x−β )−
χ1+e−α (−β) , if x>0
0, else
(2)
where α describes the slope of the sigmoid, χ accounts for the level of saturation, and β specifies the operating range of the modeled synapse. A rectification stage prevents output values from falling below zero.
Local sensitivities
Heterogeneous dendritic branching of LPTCs and synapse densities lead to receptive fields with a characteristic sensitivity distribution (Hausen, 1984). The model takes this feature into account by using a weighting function, described by a two dimensional Gaussian function. The distribution is horizontally asymmetric, i. e. the angular width on the left is not equal to that on the right. (As an example, the sensitivity distribution of the model H1 is shown in Figure 4.2C). For a given retinal position, the sensitivity is defined as follows:
74
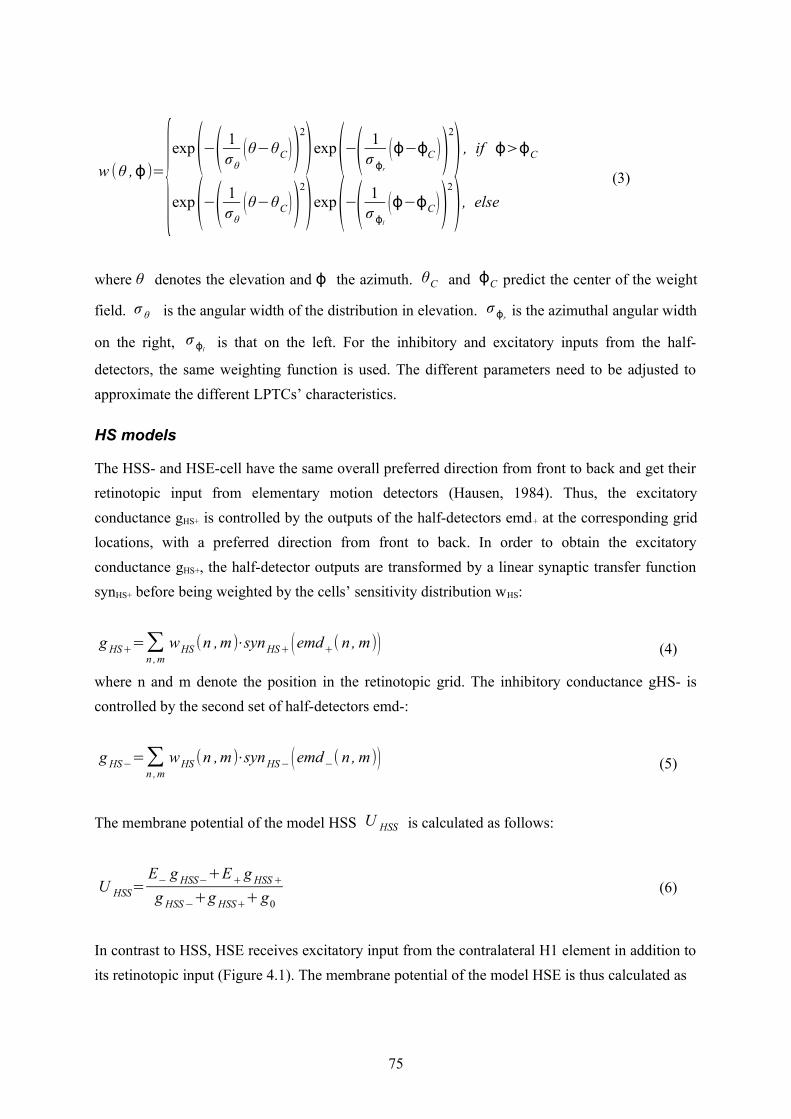
w (θ ,ϕ)={exp(−( 1σθ
(θ−θC))2)exp(−( 1
σ ϕr
(ϕ−ϕC ))2) , if ϕ>ϕC
exp(−( 1σθ
(θ−θC))2)exp(−( 1
σ ϕl
(ϕ−ϕC))2) , else
(3)
where θ denotes the elevation and ϕ the azimuth. θC and ϕC predict the center of the weight
field. σ θ is the angular width of the distribution in elevation. σϕris the azimuthal angular width
on the right, σ ϕl is that on the left. For the inhibitory and excitatory inputs from the half-
detectors, the same weighting function is used. The different parameters need to be adjusted to approximate the different LPTCs’ characteristics.
HS models
The HSS- and HSE-cell have the same overall preferred direction from front to back and get their retinotopic input from elementary motion detectors (Hausen, 1984). Thus, the excitatory conductance gHS+ is controlled by the outputs of the half-detectors emd+ at the corresponding grid locations, with a preferred direction from front to back. In order to obtain the excitatory conductance gHS+, the half-detector outputs are transformed by a linear synaptic transfer function synHS+ before being weighted by the cells’ sensitivity distribution wHS:
g HS+=∑n ,m
wHS (n ,m)⋅synHS+ (emd+( n , m)) (4)
where n and m denote the position in the retinotopic grid. The inhibitory conductance gHS- is controlled by the second set of half-detectors emd-:
g HS−=∑n ,m
wHS (n ,m)⋅synHS− (emd−( n , m)) (5)
The membrane potential of the model HSS U HSS is calculated as follows:
U HSS=E− g HSS−+E+ g HSS +
g HSS −+g HSS++g0(6)
In contrast to HSS, HSE receives excitatory input from the contralateral H1 element in addition to its retinotopic input (Figure 4.1). The membrane potential of the model HSE is thus calculated as
75
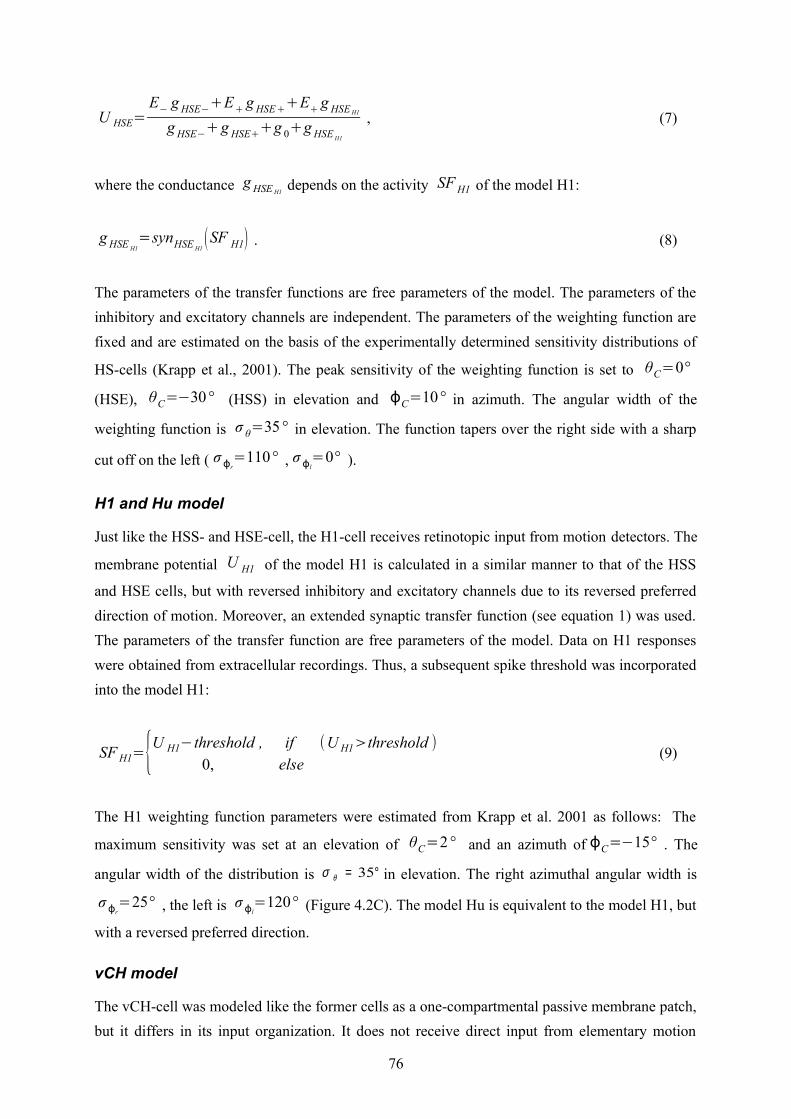
U HSE=E− g HSE−+E+ g HSE++E+ g HSE H1
g HSE−+g HSE++g 0+g HSE H1
, (7)
where the conductance g HSE H1depends on the activity SF H1 of the model H1:
g HSE H1=synHSE H1
(SF H1) . (8)
The parameters of the transfer functions are free parameters of the model. The parameters of the inhibitory and excitatory channels are independent. The parameters of the weighting function are fixed and are estimated on the basis of the experimentally determined sensitivity distributions of
HS-cells (Krapp et al., 2001). The peak sensitivity of the weighting function is set to θC=0°
(HSE), θC=−30 ° (HSS) in elevation and ϕC=10 ° in azimuth. The angular width of the
weighting function is σ θ=35 ° in elevation. The function tapers over the right side with a sharp
cut off on the left ( σ ϕr=110 ° , σ ϕl
=0° ).
H1 and Hu model
Just like the HSS- and HSE-cell, the H1-cell receives retinotopic input from motion detectors. The
membrane potential U H1 of the model H1 is calculated in a similar manner to that of the HSS
and HSE cells, but with reversed inhibitory and excitatory channels due to its reversed preferred direction of motion. Moreover, an extended synaptic transfer function (see equation 1) was used. The parameters of the transfer function are free parameters of the model. Data on H1 responses were obtained from extracellular recordings. Thus, a subsequent spike threshold was incorporated into the model H1:
SF H1={U H1−threshold , if (U H1>threshold )0, else
(9)
The H1 weighting function parameters were estimated from Krapp et al. 2001 as follows: The
maximum sensitivity was set at an elevation of θC=2 ° and an azimuth of ϕC=−15° . The
angular width of the distribution is °= 35θσ in elevation. The right azimuthal angular width is
σ ϕr=25° , the left is σ ϕl
=120° (Figure 4.2C). The model Hu is equivalent to the model H1, but
with a reversed preferred direction.
vCH model
The vCH-cell was modeled like the former cells as a one-compartmental passive membrane patch, but it differs in its input organization. It does not receive direct input from elementary motion
76
detectors. Rather, it receives input from the ipsilateral HSE and HSS, the contralateral H1 and the contralateral Hu (see fig. 3). Since the H2-cell, another contralateral input element, has a similar preferred direction to H1 and a largely overlapping receptive field, this cell was not explicitly taken into consideration for the present model. The membrane potential of vCH is given by:
xHuvCHHvCHHSvCH
xHuvCHHvCHHSvCHHSSHSEvCH gggg
IgEgEgUUU
+++++++
= −+
_1__
_1__)((10)
where UHSS and UHSE are the model HS membrane potential signals. The free model parameter gvCH_HS accounts for conductance of the dendro-dendritic gap junctions between HS-cells and vCH-cell. The conductances gvCH_H1 and gvCH_Hu are determined by linear synaptic transfer functions equivalent to equation (8) and depend on the activity signals SF H1 and SFHu of the model H1 and the model Hu, respectively. The amplification factors of the transfer functions, the reversal potential E-, the current Ix and the conductance gX are free parameters of the model.
Optimizing model parameters
The model parameters were optimized to mimic the cells’ responses to naturalistic stimulation. As a quantitative measure of the similarity between physiological p(t) and model data ms(t) the root
mean square difference d rms was chosen:
d rms=√ 1N ∑
i=1
N
( p (t i)− f ⋅m s( t i))2 . (11)
The models as described above do not contain all latencies of the nervous system. To correct for this fact, the optimal shifts between the visual input and the model output were determined by a cross-correlation of the model and neuronal signals. Setting the excitatory reversal potential arbitrarily to 1 (see above) implies that the model response is not necessarily scaled to the range of the physiological responses. The scaling factor f was determined analytically, by finding the factor that scales the model response to the corresponding neuronal response with the smallest
d rms . Since the model is not analytically accessible, an automatic method was applied for
parameter optimization. As it is convenient for continuous, nonlinear, multimodal and analytically non-accessible functions, the automatic stochastic optimization method “Differential Evolution” was chosen (Price, 1999). The search algorithm parameters of the search algorithm were adjusted to the current optimization task in preliminary tests (scaling factor F = 0.6; crossover constant CR= 0.9). For the final optimization the neural responses to the optic flow experienced during flight sequence A of length 3.45s were used. Since Differential Evolution is a stochastic optimization method, finding the global optimum is not guaranteed, as it is possible to get stuck in a local inflection. As a consequence, the procedure was repeated up to 50 times for each model. Only the best solutions
77
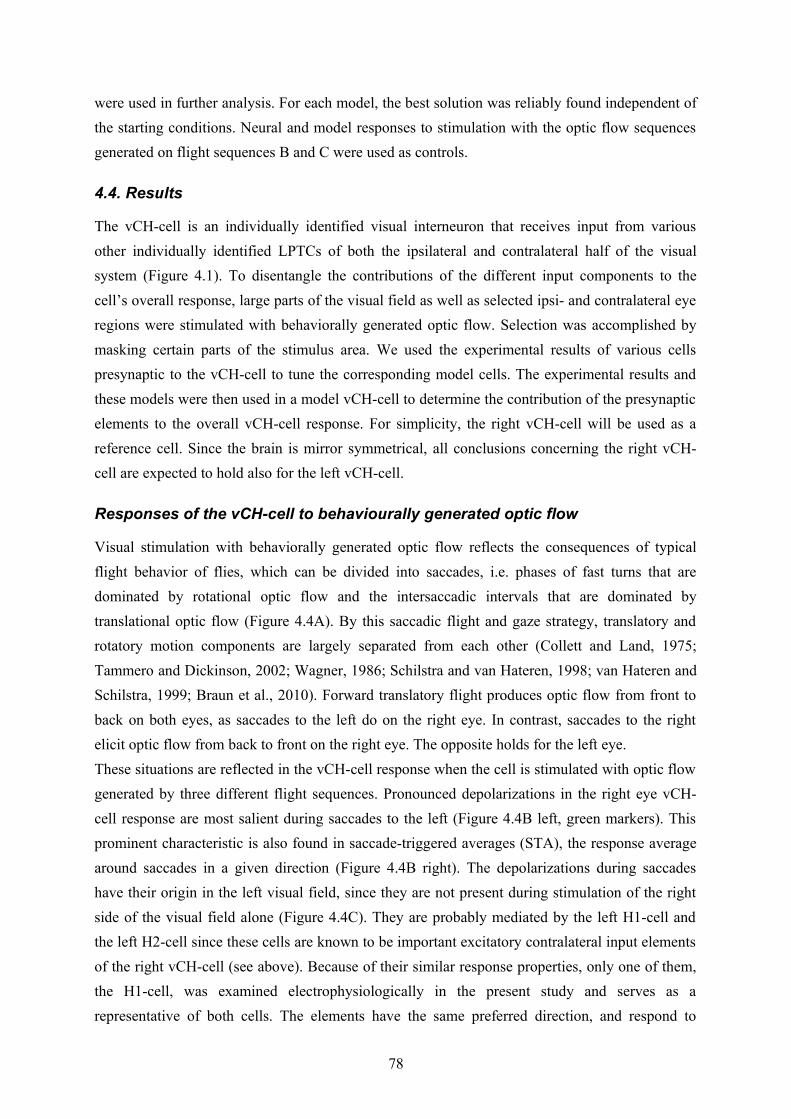
were used in further analysis. For each model, the best solution was reliably found independent of the starting conditions. Neural and model responses to stimulation with the optic flow sequences generated on flight sequences B and C were used as controls.
4.4. Results
The vCH-cell is an individually identified visual interneuron that receives input from various other individually identified LPTCs of both the ipsilateral and contralateral half of the visual system (Figure 4.1). To disentangle the contributions of the different input components to the cell’s overall response, large parts of the visual field as well as selected ipsi- and contralateral eye regions were stimulated with behaviorally generated optic flow. Selection was accomplished by masking certain parts of the stimulus area. We used the experimental results of various cells presynaptic to the vCH-cell to tune the corresponding model cells. The experimental results and these models were then used in a model vCH-cell to determine the contribution of the presynaptic elements to the overall vCH-cell response. For simplicity, the right vCH-cell will be used as a reference cell. Since the brain is mirror symmetrical, all conclusions concerning the right vCH-cell are expected to hold also for the left vCH-cell.
Responses of the vCH-cell to behaviourally generated optic flow
Visual stimulation with behaviorally generated optic flow reflects the consequences of typical flight behavior of flies, which can be divided into saccades, i.e. phases of fast turns that are dominated by rotational optic flow and the intersaccadic intervals that are dominated by translational optic flow (Figure 4.4A). By this saccadic flight and gaze strategy, translatory and rotatory motion components are largely separated from each other (Collett and Land, 1975; Tammero and Dickinson, 2002; Wagner, 1986; Schilstra and van Hateren, 1998; van Hateren and Schilstra, 1999; Braun et al., 2010). Forward translatory flight produces optic flow from front to back on both eyes, as saccades to the left do on the right eye. In contrast, saccades to the right elicit optic flow from back to front on the right eye. The opposite holds for the left eye. These situations are reflected in the vCH-cell response when the cell is stimulated with optic flow generated by three different flight sequences. Pronounced depolarizations in the right eye vCH-cell response are most salient during saccades to the left (Figure 4.4B left, green markers). This prominent characteristic is also found in saccade-triggered averages (STA), the response average around saccades in a given direction (Figure 4.4B right). The depolarizations during saccades have their origin in the left visual field, since they are not present during stimulation of the right side of the visual field alone (Figure 4.4C). They are probably mediated by the left H1-cell and the left H2-cell since these cells are known to be important excitatory contralateral input elements of the right vCH-cell (see above). Because of their similar response properties, only one of them, the H1-cell, was examined electrophysiologically in the present study and serves as a representative of both cells. The elements have the same preferred direction, and respond to
78
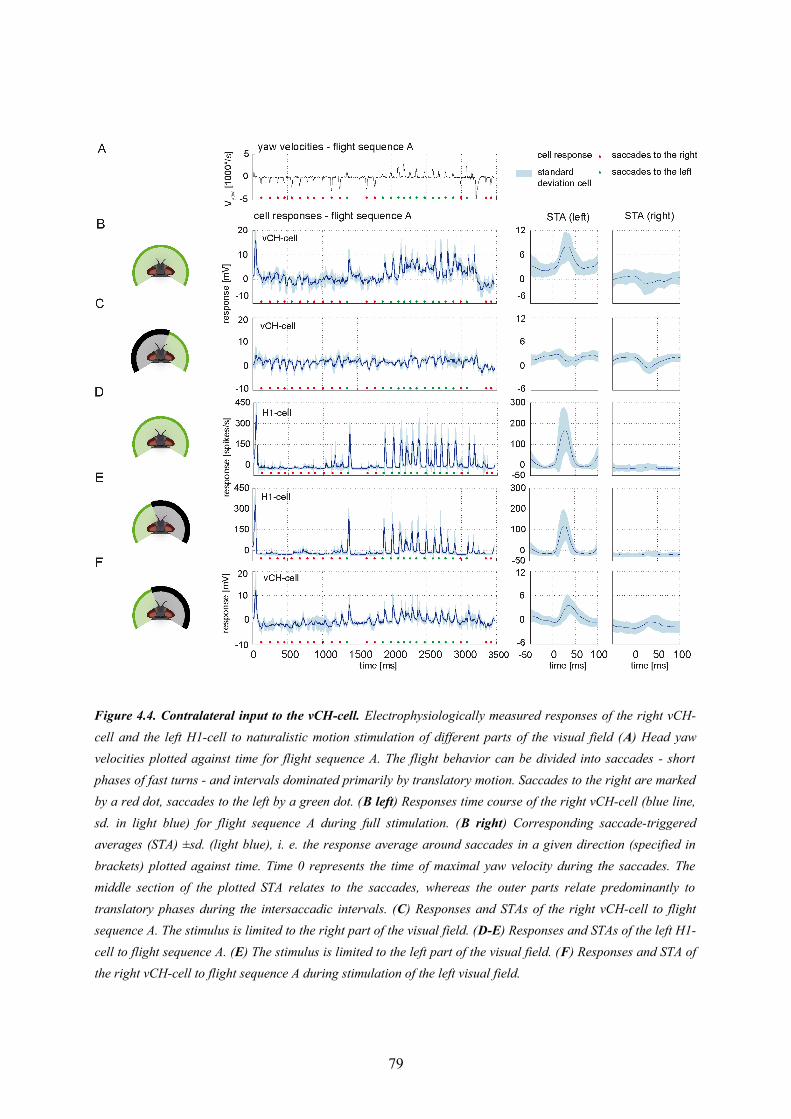
79
Figure 4.4. Contralateral input to the vCH-cell. Electrophysiologically measured responses of the right vCH-cell and the left H1-cell to naturalistic motion stimulation of different parts of the visual field (A) Head yaw velocities plotted against time for flight sequence A. The flight behavior can be divided into saccades - short phases of fast turns - and intervals dominated primarily by translatory motion. Saccades to the right are marked by a red dot, saccades to the left by a green dot. (B left) Responses time course of the right vCH-cell (blue line, sd. in light blue) for flight sequence A during full stimulation. (B right) Corresponding saccade-triggered averages (STA) ±sd. (light blue), i. e. the response average around saccades in a given direction (specified in brackets) plotted against time. Time 0 represents the time of maximal yaw velocity during the saccades. The middle section of the plotted STA relates to the saccades, whereas the outer parts relate predominantly to translatory phases during the intersaccadic intervals. (C) Responses and STAs of the right vCH-cell to flight sequence A. The stimulus is limited to the right part of the visual field. (D-E) Responses and STAs of the left H1-cell to flight sequence A. (E) The stimulus is limited to the left part of the visual field. (F) Responses and STA of the right vCH-cell to flight sequence A during stimulation of the left visual field.
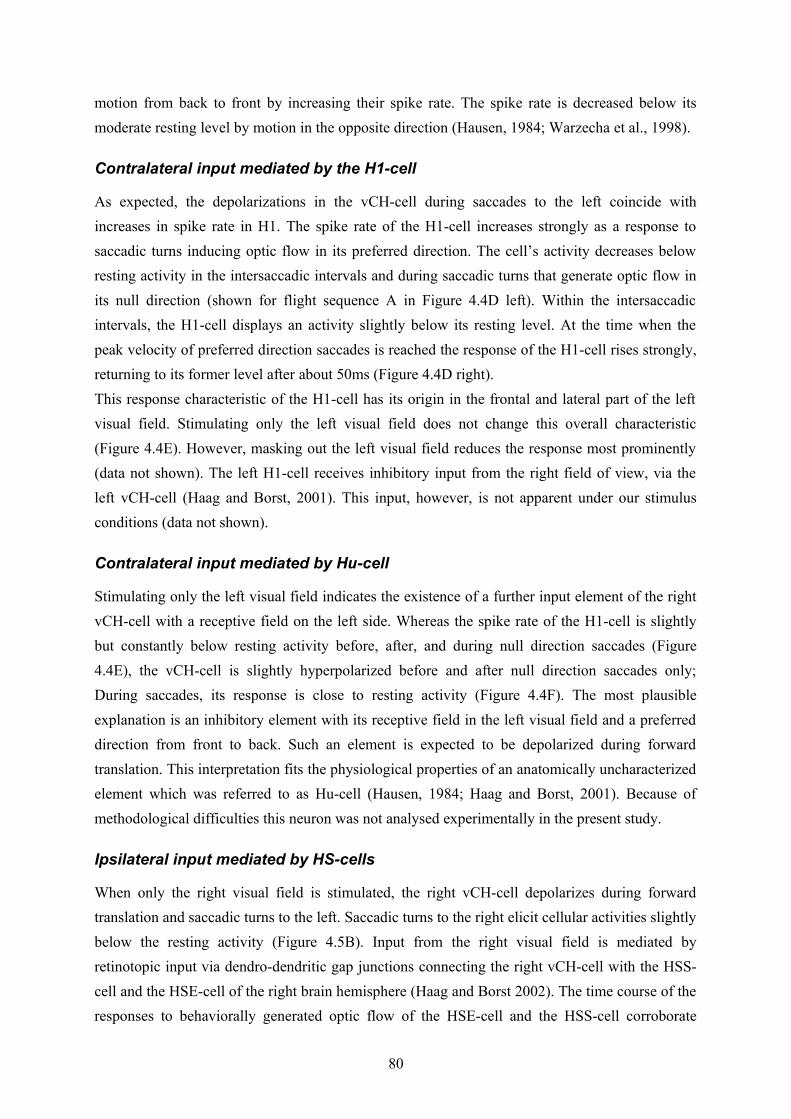
motion from back to front by increasing their spike rate. The spike rate is decreased below its moderate resting level by motion in the opposite direction (Hausen, 1984; Warzecha et al., 1998).
Contralateral input mediated by the H1-cell
As expected, the depolarizations in the vCH-cell during saccades to the left coincide with increases in spike rate in H1. The spike rate of the H1-cell increases strongly as a response to saccadic turns inducing optic flow in its preferred direction. The cell’s activity decreases below resting activity in the intersaccadic intervals and during saccadic turns that generate optic flow in its null direction (shown for flight sequence A in Figure 4.4D left). Within the intersaccadic intervals, the H1-cell displays an activity slightly below its resting level. At the time when the peak velocity of preferred direction saccades is reached the response of the H1-cell rises strongly, returning to its former level after about 50ms (Figure 4.4D right). This response characteristic of the H1-cell has its origin in the frontal and lateral part of the left visual field. Stimulating only the left visual field does not change this overall characteristic (Figure 4.4E). However, masking out the left visual field reduces the response most prominently (data not shown). The left H1-cell receives inhibitory input from the right field of view, via the left vCH-cell (Haag and Borst, 2001). This input, however, is not apparent under our stimulus conditions (data not shown).
Contralateral input mediated by Hu-cell
Stimulating only the left visual field indicates the existence of a further input element of the right vCH-cell with a receptive field on the left side. Whereas the spike rate of the H1-cell is slightly but constantly below resting activity before, after, and during null direction saccades (Figure 4.4E), the vCH-cell is slightly hyperpolarized before and after null direction saccades only; During saccades, its response is close to resting activity (Figure 4.4F). The most plausible explanation is an inhibitory element with its receptive field in the left visual field and a preferred direction from front to back. Such an element is expected to be depolarized during forward translation. This interpretation fits the physiological properties of an anatomically uncharacterized element which was referred to as Hu-cell (Hausen, 1984; Haag and Borst, 2001). Because of methodological difficulties this neuron was not analysed experimentally in the present study.
Ipsilateral input mediated by HS-cells
When only the right visual field is stimulated, the right vCH-cell depolarizes during forward translation and saccadic turns to the left. Saccadic turns to the right elicit cellular activities slightly below the resting activity (Figure 4.5B). Input from the right visual field is mediated by retinotopic input via dendro-dendritic gap junctions connecting the right vCH-cell with the HSS-cell and the HSE-cell of the right brain hemisphere (Haag and Borst 2002). The time course of the responses to behaviorally generated optic flow of the HSE-cell and the HSS-cell corroborate
80
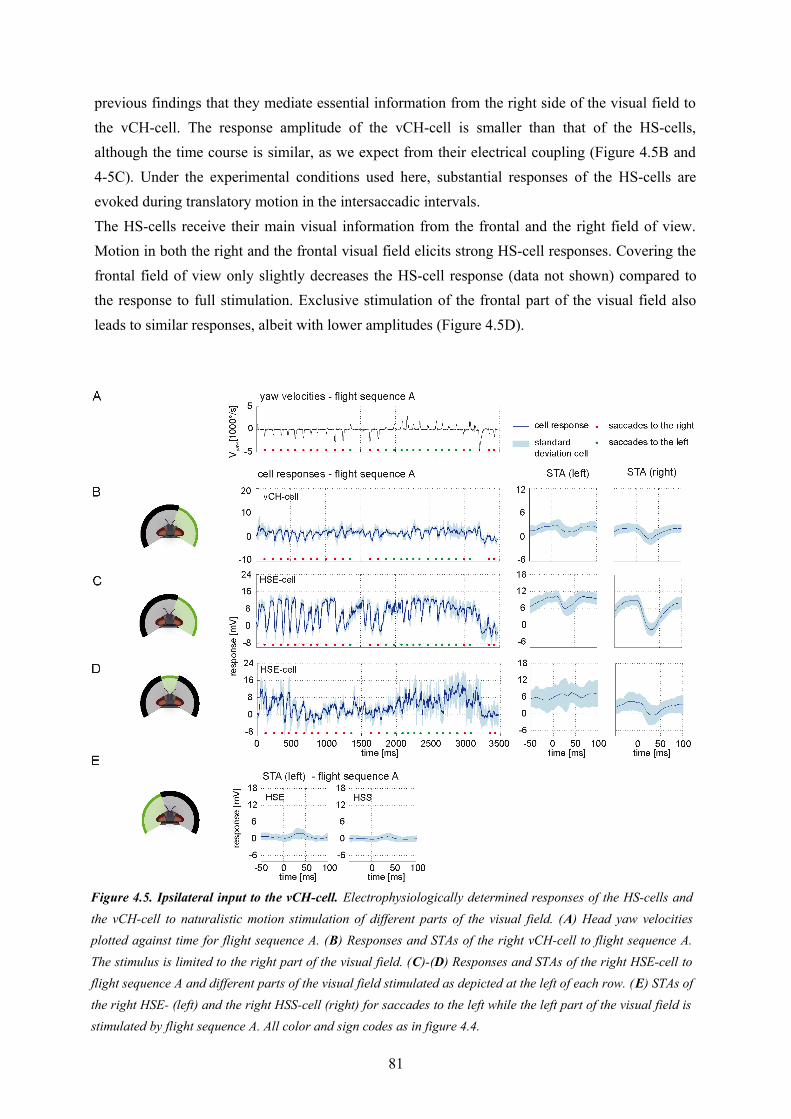
previous findings that they mediate essential information from the right side of the visual field to the vCH-cell. The response amplitude of the vCH-cell is smaller than that of the HS-cells, although the time course is similar, as we expect from their electrical coupling (Figure 4.5B and 4-5C). Under the experimental conditions used here, substantial responses of the HS-cells are evoked during translatory motion in the intersaccadic intervals. The HS-cells receive their main visual information from the frontal and the right field of view. Motion in both the right and the frontal visual field elicits strong HS-cell responses. Covering the frontal field of view only slightly decreases the HS-cell response (data not shown) compared to the response to full stimulation. Exclusive stimulation of the frontal part of the visual field also leads to similar responses, albeit with lower amplitudes (Figure 4.5D).
81
Figure 4.5. Ipsilateral input to the vCH-cell. Electrophysiologically determined responses of the HS-cells and the vCH-cell to naturalistic motion stimulation of different parts of the visual field. (A) Head yaw velocities plotted against time for flight sequence A. (B) Responses and STAs of the right vCH-cell to flight sequence A. The stimulus is limited to the right part of the visual field. (C)-(D) Responses and STAs of the right HSE-cell to flight sequence A and different parts of the visual field stimulated as depicted at the left of each row. (E) STAs of the right HSE- (left) and the right HSS-cell (right) for saccades to the left while the left part of the visual field is stimulated by flight sequence A. All color and sign codes as in figure 4.4.
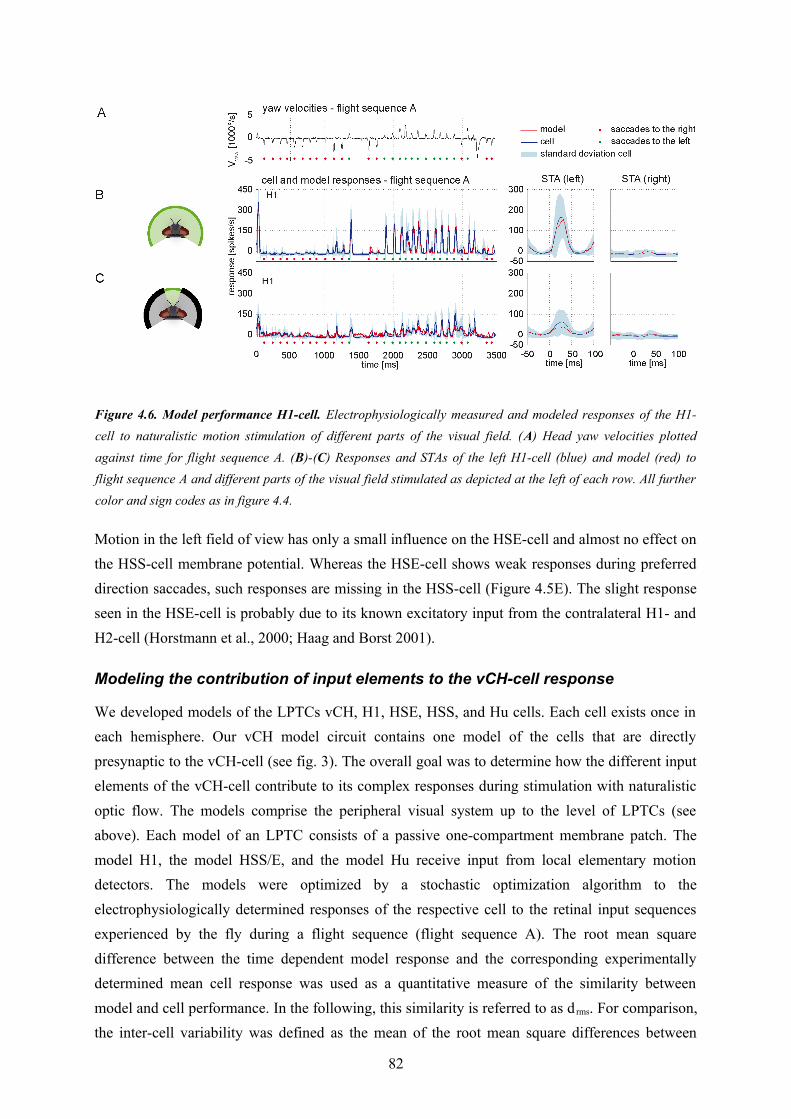
Motion in the left field of view has only a small influence on the HSE-cell and almost no effect on the HSS-cell membrane potential. Whereas the HSE-cell shows weak responses during preferred direction saccades, such responses are missing in the HSS-cell (Figure 4.5E). The slight response seen in the HSE-cell is probably due to its known excitatory input from the contralateral H1- and H2-cell (Horstmann et al., 2000; Haag and Borst 2001).
Modeling the contribution of input elements to the vCH-cell response
We developed models of the LPTCs vCH, H1, HSE, HSS, and Hu cells. Each cell exists once in each hemisphere. Our vCH model circuit contains one model of the cells that are directly presynaptic to the vCH-cell (see fig. 3). The overall goal was to determine how the different input elements of the vCH-cell contribute to its complex responses during stimulation with naturalistic optic flow. The models comprise the peripheral visual system up to the level of LPTCs (see above). Each model of an LPTC consists of a passive one-compartment membrane patch. The model H1, the model HSS/E, and the model Hu receive input from local elementary motion detectors. The models were optimized by a stochastic optimization algorithm to the electrophysiologically determined responses of the respective cell to the retinal input sequences experienced by the fly during a flight sequence (flight sequence A). The root mean square difference between the time dependent model response and the corresponding experimentally determined mean cell response was used as a quantitative measure of the similarity between model and cell performance. In the following, this similarity is referred to as d rms. For comparison, the inter-cell variability was defined as the mean of the root mean square differences between
82
Figure 4.6. Model performance H1-cell. Electrophysiologically measured and modeled responses of the H1-cell to naturalistic motion stimulation of different parts of the visual field. (A) Head yaw velocities plotted against time for flight sequence A. (B)-(C) Responses and STAs of the left H1-cell (blue) and model (red) to flight sequence A and different parts of the visual field stimulated as depicted at the left of each row. All further color and sign codes as in figure 4.4.
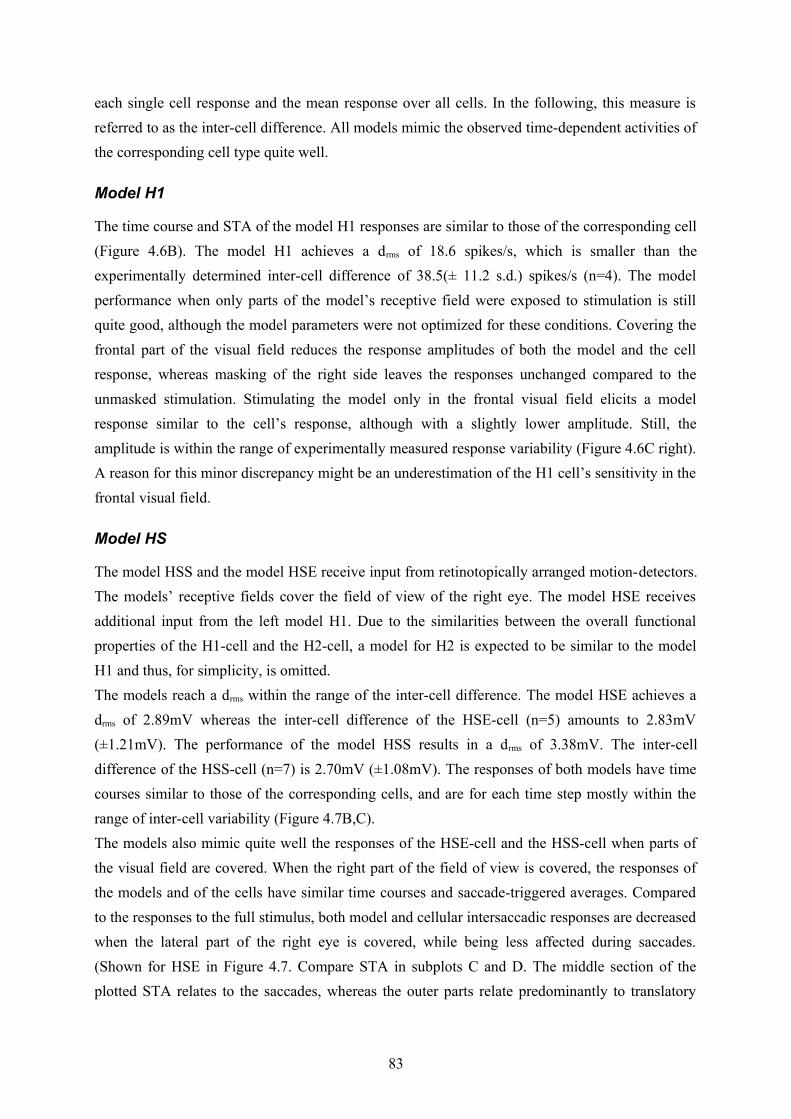
each single cell response and the mean response over all cells. In the following, this measure is referred to as the inter-cell difference. All models mimic the observed time-dependent activities of the corresponding cell type quite well.
Model H1
The time course and STA of the model H1 responses are similar to those of the corresponding cell (Figure 4.6B). The model H1 achieves a drms of 18.6 spikes/s, which is smaller than the experimentally determined inter-cell difference of 38.5(± 11.2 s.d.) spikes/s (n=4). The model performance when only parts of the model’s receptive field were exposed to stimulation is still quite good, although the model parameters were not optimized for these conditions. Covering the frontal part of the visual field reduces the response amplitudes of both the model and the cell response, whereas masking of the right side leaves the responses unchanged compared to the unmasked stimulation. Stimulating the model only in the frontal visual field elicits a model response similar to the cell’s response, although with a slightly lower amplitude. Still, the amplitude is within the range of experimentally measured response variability (Figure 4.6C right). A reason for this minor discrepancy might be an underestimation of the H1 cell’s sensitivity in the frontal visual field.
Model HS
The model HSS and the model HSE receive input from retinotopically arranged motion-detectors. The models’ receptive fields cover the field of view of the right eye. The model HSE receives additional input from the left model H1. Due to the similarities between the overall functional properties of the H1-cell and the H2-cell, a model for H2 is expected to be similar to the model H1 and thus, for simplicity, is omitted. The models reach a drms within the range of the inter-cell difference. The model HSE achieves a drms of 2.89mV whereas the inter-cell difference of the HSE-cell (n=5) amounts to 2.83mV (±1.21mV). The performance of the model HSS results in a drms of 3.38mV. The inter-cell difference of the HSS-cell (n=7) is 2.70mV (±1.08mV). The responses of both models have time courses similar to those of the corresponding cells, and are for each time step mostly within the range of inter-cell variability (Figure 4.7B,C). The models also mimic quite well the responses of the HSE-cell and the HSS-cell when parts of the visual field are covered. When the right part of the field of view is covered, the responses of the models and of the cells have similar time courses and saccade-triggered averages. Compared to the responses to the full stimulus, both model and cellular intersaccadic responses are decreased when the lateral part of the right eye is covered, while being less affected during saccades. (Shown for HSE in Figure 4.7. Compare STA in subplots C and D. The middle section of the plotted STA relates to the saccades, whereas the outer parts relate predominantly to translatory
83
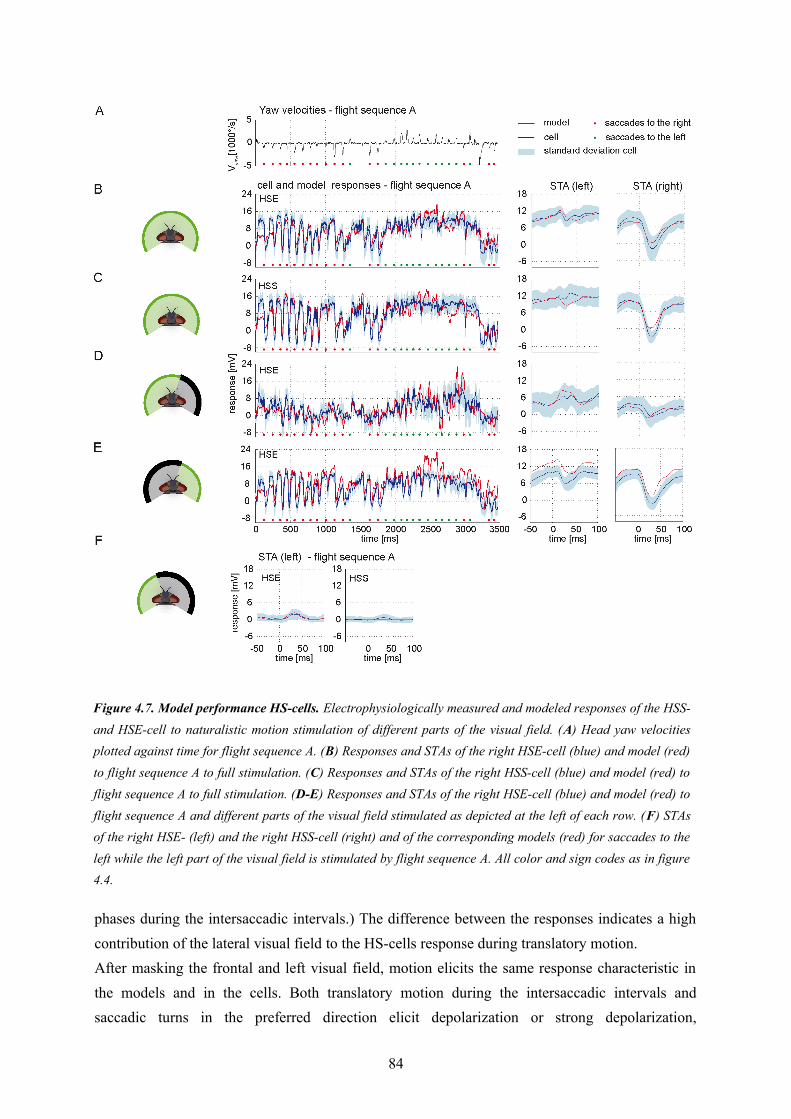
phases during the intersaccadic intervals.) The difference between the responses indicates a high contribution of the lateral visual field to the HS-cells response during translatory motion. After masking the frontal and left visual field, motion elicits the same response characteristic in the models and in the cells. Both translatory motion during the intersaccadic intervals and saccadic turns in the preferred direction elicit depolarization or strong depolarization,
84
Figure 4.7. Model performance HS-cells. Electrophysiologically measured and modeled responses of the HSS- and HSE-cell to naturalistic motion stimulation of different parts of the visual field. (A) Head yaw velocities plotted against time for flight sequence A. (B) Responses and STAs of the right HSE-cell (blue) and model (red) to flight sequence A to full stimulation. (C) Responses and STAs of the right HSS-cell (blue) and model (red) to flight sequence A to full stimulation. (D-E) Responses and STAs of the right HSE-cell (blue) and model (red) to flight sequence A and different parts of the visual field stimulated as depicted at the left of each row. (F) STAs of the right HSE- (left) and the right HSS-cell (right) and of the corresponding models (red) for saccades to the left while the left part of the visual field is stimulated by flight sequence A. All color and sign codes as in figure 4.4.
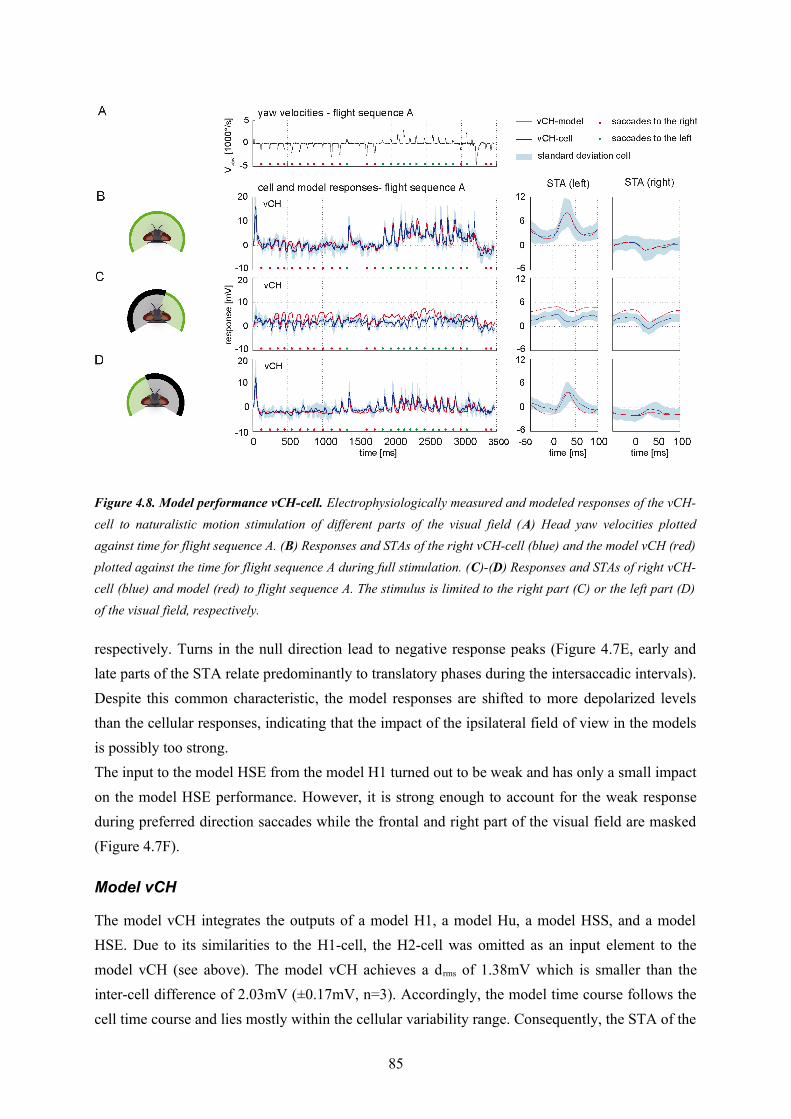
respectively. Turns in the null direction lead to negative response peaks (Figure 4.7E, early and late parts of the STA relate predominantly to translatory phases during the intersaccadic intervals). Despite this common characteristic, the model responses are shifted to more depolarized levels than the cellular responses, indicating that the impact of the ipsilateral field of view in the models is possibly too strong.The input to the model HSE from the model H1 turned out to be weak and has only a small impact on the model HSE performance. However, it is strong enough to account for the weak response during preferred direction saccades while the frontal and right part of the visual field are masked (Figure 4.7F).
Model vCH
The model vCH integrates the outputs of a model H1, a model Hu, a model HSS, and a model HSE. Due to its similarities to the H1-cell, the H2-cell was omitted as an input element to the model vCH (see above). The model vCH achieves a drms of 1.38mV which is smaller than the inter-cell difference of 2.03mV (±0.17mV, n=3). Accordingly, the model time course follows the cell time course and lies mostly within the cellular variability range. Consequently, the STA of the
85
Figure 4.8. Model performance vCH-cell. Electrophysiologically measured and modeled responses of the vCH-cell to naturalistic motion stimulation of different parts of the visual field (A) Head yaw velocities plotted against time for flight sequence A. (B) Responses and STAs of the right vCH-cell (blue) and the model vCH (red) plotted against the time for flight sequence A during full stimulation. (C)-(D) Responses and STAs of right vCH-cell (blue) and model (red) to flight sequence A. The stimulus is limited to the right part (C) or the left part (D) of the visual field, respectively.
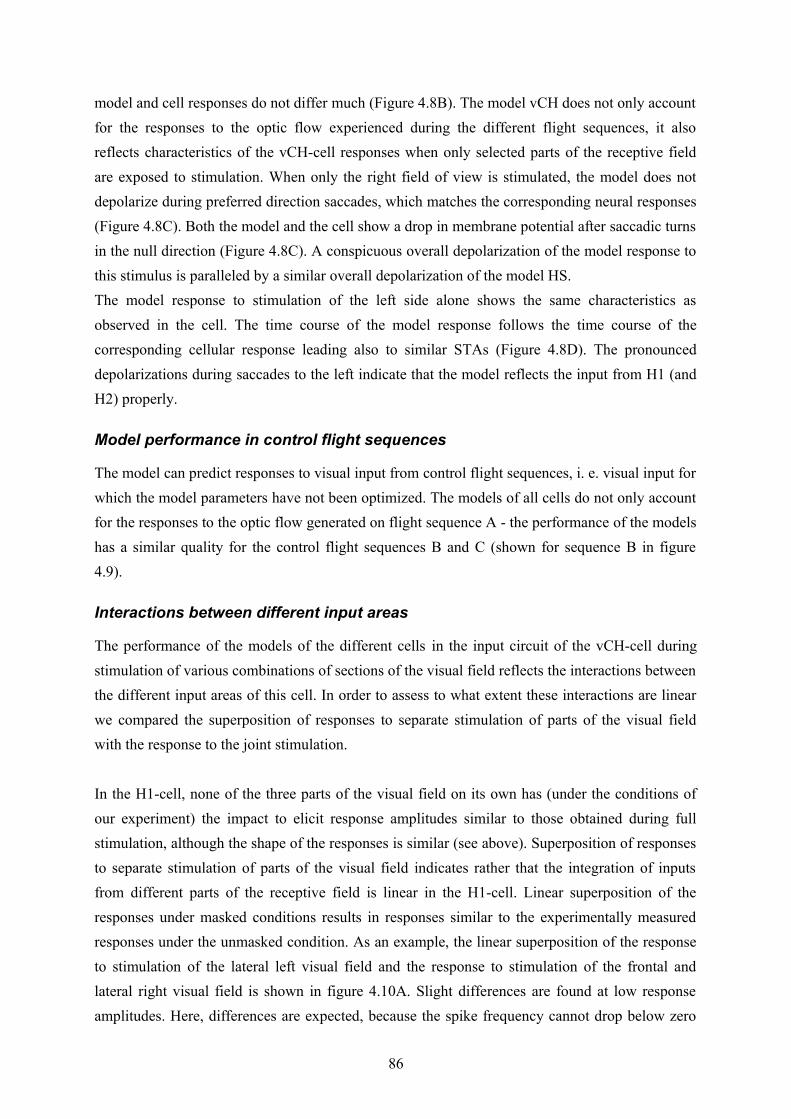
model and cell responses do not differ much (Figure 4.8B). The model vCH does not only account for the responses to the optic flow experienced during the different flight sequences, it also reflects characteristics of the vCH-cell responses when only selected parts of the receptive field are exposed to stimulation. When only the right field of view is stimulated, the model does not depolarize during preferred direction saccades, which matches the corresponding neural responses (Figure 4.8C). Both the model and the cell show a drop in membrane potential after saccadic turns in the null direction (Figure 4.8C). A conspicuous overall depolarization of the model response to this stimulus is paralleled by a similar overall depolarization of the model HS. The model response to stimulation of the left side alone shows the same characteristics as observed in the cell. The time course of the model response follows the time course of the corresponding cellular response leading also to similar STAs (Figure 4.8D). The pronounced depolarizations during saccades to the left indicate that the model reflects the input from H1 (and H2) properly.
Model performance in control flight sequences
The model can predict responses to visual input from control flight sequences, i. e. visual input for which the model parameters have not been optimized. The models of all cells do not only account for the responses to the optic flow generated on flight sequence A - the performance of the models has a similar quality for the control flight sequences B and C (shown for sequence B in figure 4.9).
Interactions between different input areas
The performance of the models of the different cells in the input circuit of the vCH-cell during stimulation of various combinations of sections of the visual field reflects the interactions between the different input areas of this cell. In order to assess to what extent these interactions are linear we compared the superposition of responses to separate stimulation of parts of the visual field with the response to the joint stimulation.
In the H1-cell, none of the three parts of the visual field on its own has (under the conditions of our experiment) the impact to elicit response amplitudes similar to those obtained during full stimulation, although the shape of the responses is similar (see above). Superposition of responses to separate stimulation of parts of the visual field indicates rather that the integration of inputs from different parts of the receptive field is linear in the H1-cell. Linear superposition of the responses under masked conditions results in responses similar to the experimentally measured responses under the unmasked condition. As an example, the linear superposition of the response to stimulation of the lateral left visual field and the response to stimulation of the frontal and lateral right visual field is shown in figure 4.10A. Slight differences are found at low response amplitudes. Here, differences are expected, because the spike frequency cannot drop below zero
86
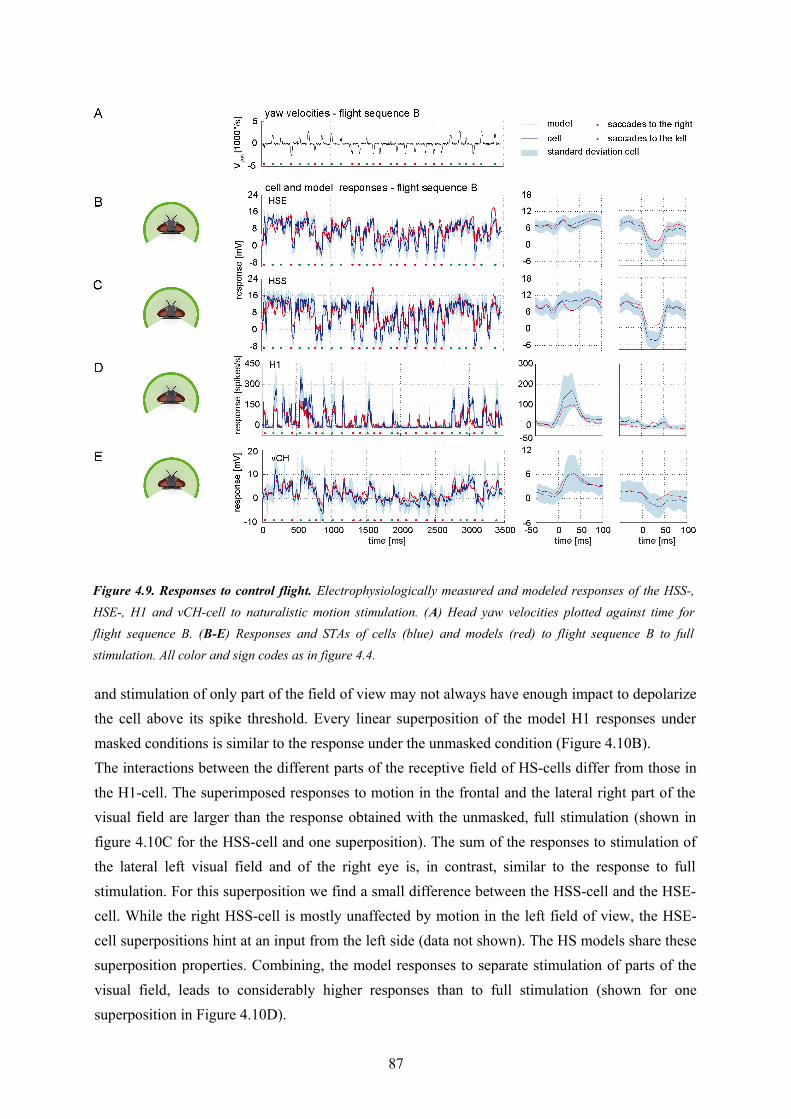
and stimulation of only part of the field of view may not always have enough impact to depolarize the cell above its spike threshold. Every linear superposition of the model H1 responses under masked conditions is similar to the response under the unmasked condition (Figure 4.10B).The interactions between the different parts of the receptive field of HS-cells differ from those in the H1-cell. The superimposed responses to motion in the frontal and the lateral right part of the visual field are larger than the response obtained with the unmasked, full stimulation (shown in figure 4.10C for the HSS-cell and one superposition). The sum of the responses to stimulation of the lateral left visual field and of the right eye is, in contrast, similar to the response to full stimulation. For this superposition we find a small difference between the HSS-cell and the HSE-cell. While the right HSS-cell is mostly unaffected by motion in the left field of view, the HSE-cell superpositions hint at an input from the left side (data not shown). The HS models share these superposition properties. Combining, the model responses to separate stimulation of parts of the visual field, leads to considerably higher responses than to full stimulation (shown for one superposition in Figure 4.10D).
87
Figure 4.9. Responses to control flight. Electrophysiologically measured and modeled responses of the HSS-, HSE-, H1 and vCH-cell to naturalistic motion stimulation. (A) Head yaw velocities plotted against time for flight sequence B. (B-E) Responses and STAs of cells (blue) and models (red) to flight sequence B to full stimulation. All color and sign codes as in figure 4.4.
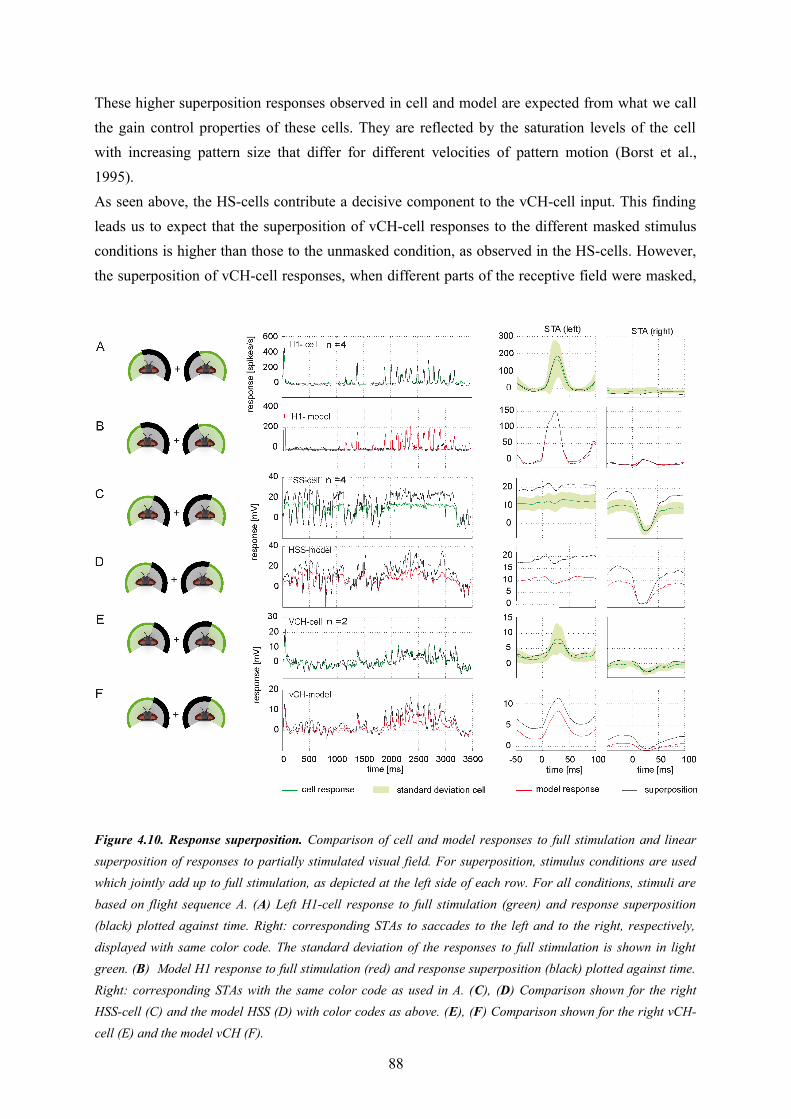
These higher superposition responses observed in cell and model are expected from what we call the gain control properties of these cells. They are reflected by the saturation levels of the cell with increasing pattern size that differ for different velocities of pattern motion (Borst et al., 1995). As seen above, the HS-cells contribute a decisive component to the vCH-cell input. This finding leads us to expect that the superposition of vCH-cell responses to the different masked stimulus conditions is higher than those to the unmasked condition, as observed in the HS-cells. However, the superposition of vCH-cell responses, when different parts of the receptive field were masked,
88
Figure 4.10. Response superposition. Comparison of cell and model responses to full stimulation and linear superposition of responses to partially stimulated visual field. For superposition, stimulus conditions are used which jointly add up to full stimulation, as depicted at the left side of each row. For all conditions, stimuli are based on flight sequence A. (A) Left H1-cell response to full stimulation (green) and response superposition (black) plotted against time. Right: corresponding STAs to saccades to the left and to the right, respectively, displayed with same color code. The standard deviation of the responses to full stimulation is shown in light green. (B) Model H1 response to full stimulation (red) and response superposition (black) plotted against time. Right: corresponding STAs with the same color code as used in A. (C), (D) Comparison shown for the right HSS-cell (C) and the model HSS (D) with color codes as above. (E), (F) Comparison shown for the right vCH-cell (E) and the model vCH (F).
fit in all cases the response to full stimulation (shown for one superposition conditions in figure 4.10E). This finding is consistent with former experiments with experimenter designed stimuli (Egelhaaf et al., 1993). One might think that the other input elements of vCH may compensate for this difference in the superposition results between HS and vCH. Hu seems to be a suitable candidate to account, at least partly, for the difference. However, the model vCH, which gets input from the model Hu, does not share the superposition properties of the vCH cell (Figure 4.10F). The vCH model behaves like the HS cell in the superposition experiments as shown above. Despite some differences, the model vCH performance confirms the conclusions drawn from the electrophysiological recordings from the H1-cell, the HS-cells, and the vCH-cell. For stimulation with naturalistic optic flow, the model vCH generates response time courses similar to those of the vCH-cell. Whereas the properties of the vCH-cells are reflected quite well by the model vCH during full stimulation, stimulation of only parts of the visual field and superposition of the corresponding responses hint at interactions not grasped by the current vCH-model.
4.5. DiscussionWe analyzed the computation of visual information from both brain hemispheres during naturalistic stimulation by investigating the contribution of different input elements and different parts of the visual field to the complex responses of the vCH-cell, an identified motion sensitive interneuron in the blowfly’s visual system. The analysis was done by model simulations of the vCH-cell and its various input elements. The modeling was based on extensive electrophysiological experiments. Behavioral data of freely flying flies were used to construct naturalistic image sequences, which we used for stimulation. These image sequences reflect the fly’s typical saccadic flight strategy which separates translatory and rotatory motion components. The naturalistic stimulation is dominated by forward translation and rotations around the vertical head-axis.
Contribution of input elements
Based on models of its most important input elements, a feed forward model of the vCH-cell was developed which is able to mimic the time course of the cell’s electrophysiologically determined time-dependent responses to the optic flow that is generated on the fly’s eyes during free-flight maneuvers. The saccadic flight strategy is particularly reflected in the characteristic responses of the analyzed cells and the corresponding models. The vCH-cell achieves the biggest depolarizations during saccadic turns that lead to image displacements in the cells’ preferred directions. In the model these depolarizations are mediated by the contralateral H1-model. Because of similar properties (Horstmann et al., 2000; Haag and Borst, 2003) of the H1-cell and the H2-cell we lumped both into one model cell. As a consequence, (1) the relative contribution of either cell to the overall vCH response and (2) the relevance of the different location of the output terminals of H1- and H2-cell on the vCH-cell
89
remain unresolved. Nevertheless, the model suggests that the pronounced responses of the left H1- and H2-cell to fast turns to the left can account for the corresponding saccadic depolarizations of the right vCH-cell.The size of the depolarizations during saccades is clearly larger than that during translatory flight. This finding suggests that information about preferred direction saccades might be functionally important for the vCH-cell. The fly would probably not invest energy into generating pronounced saccadic depolarizations without reason. Two HS-cells, major ipsilateral input elements of the vCH-cell, reach their highest response level during translatory flight sections. Their contribution to the overall response of the vCH-cell is weaker than that of the H1–cell. Nonetheless, the HS-cells’ impact on the vCH-cell is obvious during translatory flight sections. In accordance with the electric coupling between HS-cells and vCH-cell (Haag and Borst, 2002), the depolarization of the vCH-cell is attenuated when compared to the depolarizations of the HS-cells. The relative contributions of the HSE- and the HSS-cell to the overall vCH-cell response could not be identified in this study. The excitation of vCH is superimposed with an inhibition presumably originating from the Hu-cell, especially during translatory forward motion and during rightwards saccades. Beyond these essential input elements with horizontal preferred directions, the V1-cell with sensitivity to vertical motion is known to project onto the vCH-cell (Haag and Borst, 2003). This cell is assumed to be responsible for the vCH-cell’s sensitivity to downward motion in parts of its frontal receptive field (Krapp et al., 2001). Because the naturalistic flight sequences that were replayed here for visual stimulation are dominated by forward translations and rotations around the vertical eye axis, only a minor contribution of the V1-cell to the vCH-cell response is expected under these conditions. Consistent with this expectation, including V1-responses into our model simulations did not improve the model performance (data not shown).On the whole, the model cells mimic, within the range of experimentally established variability, the time course not only of the vCH responses, but also the responses of its input elements, the H1-cell and the HSE- and HSS-cell. The models of the different circuit elements perform almost as well even when only parts of the visual field are stimulated, although the model parameters were optimized with full stimulation. This result indicates that the model vCH responses reflect the proper contribution from its different input elements.
Spatial integration
All analyzed input elements of the vCH-cell integrate visual information from large parts of the visual field. However, stimulation of only parts of the visual field revealed different spatial integration properties of the analyzed cells. Whereas the responses of H1 to stimulation of different parts of the visual field add almost linearly, HS-cells show clear sub-linear addition of responses between different stimulated dendritic fields: linear superposition of responses to partial stimulation of selected regions of the receptive field are always larger than the response to
90
simultaneous stimulation of these regions. These interactions of the responses originating in different parts of the dendrite of HS limit the overall cell response amplitude, most likely as a consequence of the established gain control properties of these cells (Borst et al., 1995). The contributions of HS-cells and the H1-cell to the vCH-cell response, as reflected in the model, might suggest that the integration properties of the HS-cells are at least partly reflected in the vCH-cell responses. Surprisingly, the physiology revealed different properties: (1) the impact of stimulation of one part of the receptive field of vCH-cell is not affected by stimulation of an additional part, (2) linear superposition of responses to partial stimulation of selected regions of the receptive field is similar to the responses to simultaneous stimulation of these regions. This finding is consistent with observations made when stimulating only lateral parts of the visual field of both eyes with experimenter designed stimuli (Egelhaaf et al., 1993).This finding hints at computations possibly arising from the spatial structure of the respective cells, which are beyond the scope of the present model. Most importantly, HS-cells are synaptically connected to the vCH-cell via dendro-dendritic gap junctions that lead to a still retinotopic, though spatially blurred, information transmission (Haag and Borst, 2002; Cuntz et al., 2003). This feature is not taken into account in our current version of the vCH model. Moreover, the recording site in the HS-cells is far away from the connections to the vCH-cell. The analyzed axonal HS-cell signal reflects only a spatially pooled version of the activity distribution in the dendrite near the gap junctions to the vCH-cell. Active processes such as the voltage dependent calcium channels in the HS dendrite (Egelhaaf and Borst, 1995) or conductances in the major dendritic branches of the HS-cells far away from the input site are likely to be essential for the experimentally analyzed axonal HS-cell signal and important for the HS-cell’s spatial integration properties. On the other hand, these active and passive properties of the HS-cells have possibly only a small influence on the signals propagated to the vCH-cell. In addition, the input signals originating from the H1-cell, the HSS-cell and the HSE-cell might interact in the dendrite of the vCH-cell and thus also shape the vCH-response.
Model abstraction level
The model circuit possesses a high abstraction level and primarily addresses the contribution of different parts of the visual field and of the different input elements of the vCH-cell to the cells’ overall response. The abstractions concern properties of the network as well as of the individual cells and their response mode. The cells of the lobula plate are known to be interconnected as a recurrent network (Farrow et al., 2006; Haag and Borst, 2001). However, the present model is entirely feed forward. Nevertheless, differences between the time course of the experimentally determined responses and the model responses are to a large extent in the range of the inter-cell variability. This is possibly a consequence of the stimuli used, which are based on real flight sequences and, for instance do not contain backward translations since such flight situations do not occur naturally in blowflies. For
91
example, the known inhibition of the left H1-cell by the left vCH-cell (which is supposed to be mirror symmetric to the analyzed right vCH-cell) would presumably have the highest impact on the left H1-cell during backward motion. The dominant movements of blowflies during flight are forward translations with some side ward components interspersed by fast saccadic rotations (Schilstra and van Hateren, 1999; van Hateren and Schilstra, 1999; Braun et al., 2010). These movements either do not elicit a clear activity of the H1-cell, or the inhibiting ipsilateral vCH-cell has only a moderate activation level. Under these conditions the recurrences in the circuit are unlikely to have large impacts on the responses. Our model simulates neural activity as graded membrane potential changes or spike rates, but not individual spikes. Thus, information carried solely by the spike timing is not reflected by the model. Precise timing of spikes is known to be critical in some tasks. For example, auditory systems use the tiny time difference between a sound arriving at the two ears to localize its direction, and thus depend critically on the precise timing of action potentials (Jeffress, 1948; Joris and Yin, 2007). The fly’s visual system, on the other hand, has to deal with signals on a different time scale. Though the fly’s movements are fast, time differences at millisecond-level precision seem unlikely to be functionally relevant. Several studies on the spiking H1-cell suggest that the information rate and coding efficiency are mainly set by the firing rate, rather than by the firing precision (Warzecha et al., 2000; Spavieri et al., 2010; Warzecha and Egelhaaf, 2001, see however de Ruyter van Steveninck et al., 2001). In contrast to their contralateral input elements, i.e. H1, H2 and Hu that are modeled her, the ipsilateral input elements of vCH, i. e. HSE and HSS, but also vCH itself, mainly respond to visual stimulation with graded membrane potential changes (Hausen, 1984).At its retinal input site, the model elements that mimic the processing in the peripheral visual system are fitted to the luminance conditions of the physiological experiments. In its current version, the model thus does not contain features like adaptation to contrast or luminance changes. This is not expected to be a severe limitation in the context of identifying the contributions of the input elements to the vCH, since all input elements share the same early processing. Detailed models of the peripheral visual processing stages including light adaptation have already been investigated (van Hateren and Snippe, 2001; Juusola et al., 1995). When inserted into the input lines of the movement detectors that are presynaptic to the input elements of the vCH-cell, they seem to be appropriate to adjust models to a wide range of luminance conditions (Brinkworth and O’Carroll, 2009; Wiederman et al., 2010).
Functional aspects
Computational strategies operating with input from both hemispheres of an animal’s surroundings are used by several animals. The owl’s auditory system, for example, owes its excellent localization ability to the comparison of signals from both ears (Konishi, 2000). Decision-making may profit as well from combining the information from the two hemispheres. The inhibition of
92
dragonfly neurons sensitive to small objects by their contralateral counterparts is thought to be ”a neural substrate for directing attention to single targets in the presence of distracters” (Bolzon et al., 2009). The visual input of the vCH-cell from both eyes presumably has its need in the saccadic flight strategy of the fly. The vCH-circuit is thought to play an important role in behaviors where objects, such as obstacles or landing sites, are to be detected. The vCH-cell is an inhibitory element to the FD1-cell, a cell that responds preferentially to this sort of object (Egelhaaf, 1985; Kimmerle and Egelhaaf, 2000a,b). After combining information from both eyes, the vCH-cell inhibits the FD1-cell and helps to tune this cell to small objects (Warzecha et al., 1993). The inhibition probably takes place via a spatially distributed inhibition of the FD1-cell’s retinotopic input elements (Hennig et al., 2008). The HS-cells and the H1-cell contribute to the network in different ways. The HS-cells mediate the vCH cell’s ipsilateral motion sensitivity, especially during forward translation. The inhibition of the FD1-cell during saccades to the left might be the main functional significance of the pronounced saccadic responses of the vCH-cell mediated by its H1-input. Without the H1-cell (or the H2-cell) the FD1-cell would otherwise possibly wrongly signal the detection of an object during a saccade, since the FD1-cell responds not only strongly to small objects but also to fast wide-field motion (Egelhaaf, 1985, Kimmerle and Egelhaaf, 2000a, b; Hateren et al., 2005).
4.6. ConclusionsBy combining electrophysiological recordings and a computational model of a neuronal circuit we were able to identify the contribution of different input elements and different parts of the visual field to the complex responses of the vCH-cell, an inhibitory neuron in the blowfly visual motion pathway. The model has predictive power as it can account for the neural response to stimuli it was not adjusted to. This is valid for partly masked original stimuli but also for stimuli generated from control flights. The successful performance of the model circuit will allow us to make functional predictions, for example, for experiments where individual elements of the neural circuit are blocked pharmacologically or genetically. Such an experiment on the H1-cell could strengthen the hypothesis that the saccadic responses of vCH mediated by H1 prevents the object sensitive FD1-cell to wrongly signal a small object. Further examinations will include a detailed analysis of the contribution of the vCH-cell and its presynaptic elements to the FD1-cell responses and its role in object detection tasks.
4.7. AcknowledgmentsWe are grateful to Norbert Böddeker and Nicole Carey for critically reading drafts of the paper and making helpful suggestions, to Jens Lindemann and Ralf Möller for contributing software, and to Grit Schwerdtfeger for technical assistance. This study was supported by the Deutsche Forschungsgemeinschaft (DFG).
93
4.8. LiteratureBolzon, D. M., Nordström, K., and O'Carroll, D. C. (2009) Local and large-range inhibition in feature detection. J. Neurosci. 29, 14143-14150.
Borst, A., Egelhaaf, M., and Haag, J. (1995). Mechanisms of dendritic integration underlying gain control in fly motion-sensitive interneurons. J. Comput. Neurosci., 2, 5-18.
Borst, A., Haag, J. & Reiff, D. F. (2010). Fly motion vision. Annu Rev Neurosci, 33, 49-70
Borst, A., Reisenman, C., and Haag, J. (2003). Adaptation of response transients in fly motion vision. II: Model studies., Vision Res. 43, 1309-1322.
Braun, E., Geurten, B., and Egelhaaf, M. (2010). Identifying Prototypical Components in Behaviour Using Clustering Algorithms. PLoS ONE 5(2), e9361.doi:10.1371/journal.pone. 0009361.
Brinkworth, R. S. A. and O'Carroll, D. C. (2009). Robust models for optic flow coding in natural scenes inspired by insect biology. PLoS Comput. Biol. 5(11), e1000555. doi:10.1371/journal.pcbi.1000555.
Collett, T. and Land, M. (1975).Visual control of flight behaviour in the hoverfly Syritta pipiens L. J. Comp. Physiol. 99, 1-66.
Cuntz, H., Haag J. and Borst A. (2003) Neural image processing by dendritic networks. Proc Natl Acad Sci U S A, 100, 11082-11085.
Eckert H., Dvorak DR. (1983) The centrifugal horizontal cells in the lobula plate of the blowfly, Phaenicia sericata. J. Insect Physiol. 29, 547-560.
Egelhaaf, M. (1985). On the neuronal basis of figure-ground discrimination by relative motion in the visual system of the fly. II. Figure-detection cells a new class of visual interneurones. Biol. Cybern. 52, 195-209.
Egelhaaf, M. (2006). “The neural computation of visual motion information.” In: Invertebrate vision, eds Warrant E., Nielsson D.E. Cambridge: Cambridge University Press, 399-461.
Egelhaaf, M. and Borst, A. (1995). Calcium accumulation in visual interneurons of the fly: stimulus dependence and relationship to membrane potential. J. Neurophysiol. 73, 2540-2552.
Egelhaaf, M., Borst, A., Warzecha, A. K., Flecks, S., and Wildemann, A. (1993). Neural circuit tuning fly visual neurons to motion of small objects. II. Input organization of inhibitory circuit elements revealed by electrophysiological and optical recording techniques. J. Neurophysiol. 69, 340-351.
Egelhaaf M., Kern R., Kurtz R., and Warzecha A.-K. (2004). Fly: processing of visual motion information and its role in visual orientation. In: Encyclopedia of Neuroscience, eds Adelman G., Smith B.H., (Elsevier).
94
Exner, S. and Hardie, R. (1989). The physiology of the compound eyes of insects and crustaceans: a study. Springer-Verlag.
Farrow, K., Haag, J., and Borst, A. (2003) Input organization of multifunctional motion-sensitive neurons in the blowfly. J. Neurosci. 23, 9805-9811
Farrow, K., Haag, J., and Borst, A. (2006) Nonlinear, binocular interactions underlying flow field selectivity of a motion-sensitive neuron. Nat. Neurosci. 9, 1312-1320.
Franceschini, N. (1975). “Sampling of the visual environment by the compound eye of the fly: Fundamentals and applications” In: Photoreceptor optics eds Snyder, A. and Menzel, R. (Springer), 98-125.
Frost, B. J., and Wylie, D. R. (2000). A common frame of reference for the analysis of optic flow and vestibular information. Int. Rev. Neurobiol. 44, 121–140.
Gauck, V., Egelhaaf, M., and Borst, A. (1997). Synapse distribution on VCH, an inhibitory, motion-sensitive interneuron in the fly visual system. J. Comp. Neurol. 381, 489-499.
Gibson, J. (1950). The perception of the visual world. Houghton Mifflin.
Haag, J. and Borst, A. (2002) Dendro-dendritic interactions between motion-sensitive large-field neurons in the fly. J. Neurosci. 22, 3227-3233.
Haag, J. and Borst, A. (2003). Orientation tuning of motion-sensitive neurons shaped by vertical-horizontal network interactions. J. Comp. Physiol. A 189, 363-370.
Haag, J. and Borst, A. (2001). Recurrent network interactions underlying flow-field selectivity of visual interneurons. J. Neurosci. 21, 5685-5692.
Hausen, K. (1981) Monocular and binocular computation of motion in the lobula plate of the fly. Verh. Dtsch. Zool. Ges. 74, 49-70.
Hausen, K. (1982a) Motion sensitive interneurons in the optomotor system of the fly. I. The Horizontal Cells: Structure and signals. Biol. Cybern. 45, 143-156.
Hausen, K. (1982b). Motion sensitive interneurons in the optomotor system of the fly. II. The Horizontal Cells: Receptive field organization and response characteristics. Biol.Cybern. 46, 67-79.
Hausen, K. (1984). “The lobula-complex of the fly: Structure, function and significance in visual behaviour” In: Photoreception and vision in invertebrates, ed Ali, M. A. (Plenum Press), 523-559.
Hennig, P., Möller, R., and Egelhaaf, M. (2008). Distributed dendritic processing facilitates object detection: a computational analysis on the visual system of the fly. PLoS ONE 3(8), e3092. doi:10.1371/journal.pone.0003092.
Horstmann, W., Egelhaaf, M., and Warzecha, A. K. (2000). Synaptic interactions increase optic flow specificity. Eur. J. Neurosci. 12, 2157-2165.
95
Ibbotson (1991). Wide-field motion-sensitive neurons tuned to horizontal movement in the honeybee, Apis mellifera. J. Comp. Physiol. A 168, 91–102.
Jeffress, L. A. (1948). A place theory of sound localization. J. Comp. Physiol. Psychol. 41, 35-39.
Joris, P., and Yin, T. C. T. (2007) A matter of time: internal delays in binaural processing. Trends Neurosci. 30, 70-78.
Juusola, M., Weckström, M., Uusitalo, R. O., Korenberg, M. J., and French, A. S. (1995). Nonlinear models of the first synapse in the light-adapted fly retina. J. Neurophysiol. 74, 2538-2547.
Kern, R. (1998). Visual position stabilization in the hummingbird hawk moth, Macroglossum stellatarum L.: II. Electrophysiological analysis of neurons sensitive to widefieldimage motion. J. Comp. Physiol. 182, 239–249.
Kern, R., Nalbach HO., and Varju D. (1993). Interactions of local movement detectors enhance the detection of rotation. Optokinetic experiments with the rock crab, Pachygrapsus marmoratus. Vis. Neurosci. 10, 643-652.
Kimmerle, B. and Egelhaaf, M. (2000a). Detection of object motion by a fly neuron during simulated flight. J. Comp. Physiol. A 186, 21-31.
Kimmerle, B. and Egelhaaf, M. (2000b) Performance of fly visual interneurons during object fixation. J. Neurosci. 20, 6256-6266.
Kimmerle, B., Warzecha, A., and Egelhaaf, M. (1997). Objekt detection in the fly during simulated translatory flight. J. Comp. Physiol. A 181, 247-255.
Konishi, M. (2000). Study of sound localization by owls and its relevance to humans. Comp. Biochem. Physiol. A 126, 459-469.
Krapp, H. G., Hengstenberg, R., and Egelhaaf, M. (2001). Binocular contributions to optic flow processing in the fly visual system. J. Neurophysiol. 85, 724-734.
Land, MF. (1997). Visual acuity in insects. Annu. Rev. Entomol. 42, 147-177.
Lindemann, J. P., Kern, R., Michaelis, C., Meyer, P., van Hateren, J. H. and Egelhaaf, M. (2003). FliMax, a novel stimulus device for panoramic and highspeed presentation of behaviourally generated optic flow. Vision Res. 43, 779-791.
Lindemann, J. P., Kern, R., van Hateren, J. H., Ritter, H. and Egelhaaf, M. (2005). On the computations analyzing natural optic flow: Quantitative model analysis of the blowfly motion vision pathway. J. Neurosci. 25, 6435-6448.
Petrowitz, R., Dahmen, H., Egelhaaf, M., and Krapp, H. G. (2000). Arrangement of optical axes and spatial resolution in the compound eye of the female blowfly Calliphora. J. Comp. Physiol. A 186, 737-746.
96
Price, K. V. (1999). An introduction to differential evolution, In: New Ideas in Optimization eds Corne, D., Dorigo, M., Glover, F., Dasgupta, D., and Moscato, P. Maidenhead(UK): McGraw-Hill Ltd., 79–108.
de Ruyter van Steveninck, R., Borst, A. and Bialek, W. (2001). Real-time encoding of motion: Answerable questions and questionable answers from the fly's visual system. In: Motion vision, eds Zanker J., and Zeil J. (Springer), 279-306.
Schilstra, C. and van Hateren J. H. (1998). Stabilizing gaze in flying blowflies. Nature 395, 654.
Simpson, J. I. (1984). The accessory optic system. Annu. Rev. Neurosci. 7, 13–41.
Spavieri, D. L., Eichner, H., and Borst, A. (2010). Coding efficiency of fly motion processing is set by firing rate, not firing precision. PLoS Comput. Biol. 6(7), e1000860. doi:10.1371/journal.pcbi.1000860.
Tammero, L. F. and Dickinson, M. H. (2002). The influence of visual landscape on the free flight behavior of the fruit fly Drosophila melanogaster. J. Exp. Biol. 205, 327-343.
van Hateren, J. H. and Schilstra C. (1999). Blowfly flight and optic flow. II. Head movements during flight. J. Exp. Biol. 202, 1491–1500.
van Hateren, J. H. and Snippe, H. P. (2001) Information theoretical evaluation of parametric models of gain control in blowfly photoreceptor cells. Vision Res. 41, 1851-1865.
van Hateren, J. H., Kern, R., Schwerdtfeger, G. and Egelhaaf, M. (2005) Function and coding in the blowfly H1 neuron during naturalistic optic flow. J. Neurosci. 25, 4343-4352.
Wagner, H. (1986a) Flight performance and visual control of flight of the free-flying housefly (Musca domestica). I. Organization of the flight motor. Phil. Trans. R. Soc. Lond. B 312, 527-551.
Warzecha A.-K., Egelhaaf M., and Borst A. (1993). Neural circuit tuning fly visual interneurons to motion of small objects. 1. Dissection of the circuit by pharmacological and photoinactivation techniques. J. Neurophysiol. 69, 329–339.
Warzecha, A.-K., Kretzberg, J., and Egelhaaf, M. (2000). Reliability of a fly motion-sensitive neuron depends on stimulus parameters. J. Neurosci. 20, 8886-8896.
Warzecha, A.-K. and Egelhaaf, M. (2001). Neuronal encoding of visual motion in real-time. In: Motion vision, eds Zanker J. and Zeil J. Springer, 239-277.
Warzecha, A.-K., Kretzberg, J., and Egelhaaf, M. (1998).Temporal precision of the encoding of motion information by visual interneurons. Curr. Biol. 8, 359-368.
Wiederman, S. D., Brinkworth, R. S., and O'Carroll, D. C. (2010). Performance of a Bio-Inspired Model for the Robust Detection of Moving Targets in High Dynamic Range Natural Scenes. Journal of Computational and Theoretical Nanoscience 7, 911-920.
97

98
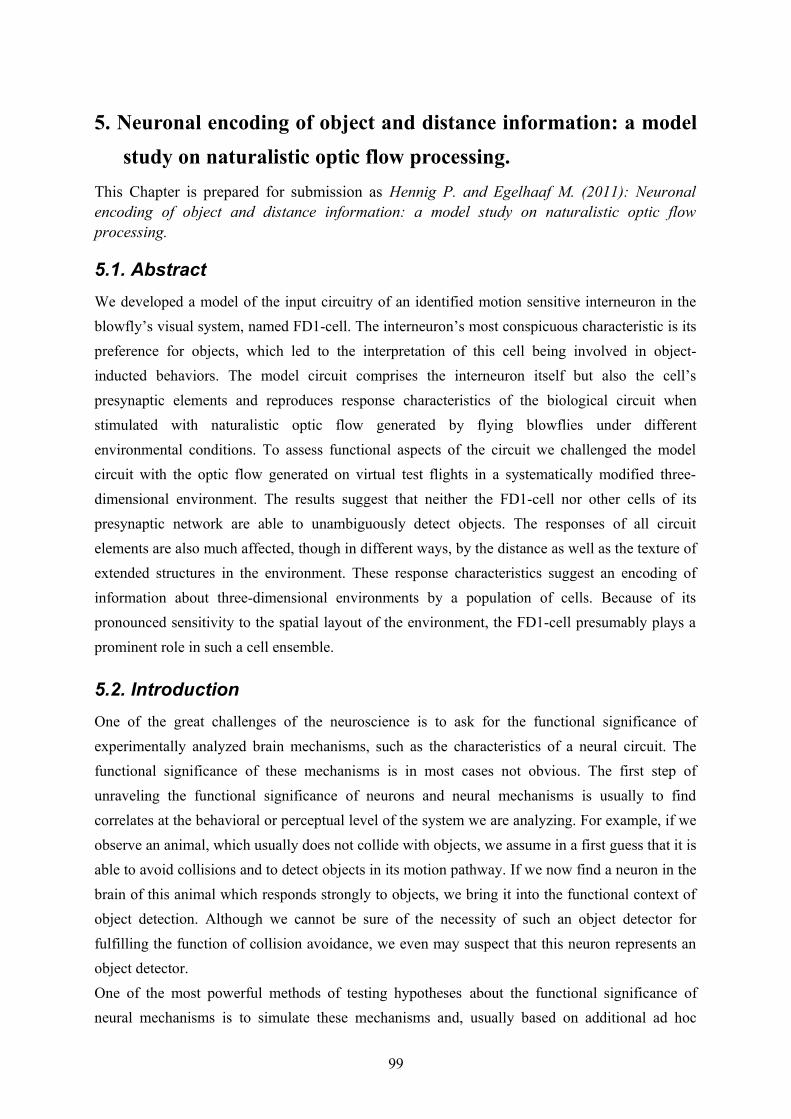
5. Neuronal encoding of object and distance information: a model study on naturalistic optic flow processing.
This Chapter is prepared for submission as Hennig P. and Egelhaaf M. (2011): Neuronal encoding of object and distance information: a model study on naturalistic optic flow processing.
5.1. Abstract We developed a model of the input circuitry of an identified motion sensitive interneuron in the blowfly’s visual system, named FD1-cell. The interneuron’s most conspicuous characteristic is its preference for objects, which led to the interpretation of this cell being involved in object-inducted behaviors. The model circuit comprises the interneuron itself but also the cell’s presynaptic elements and reproduces response characteristics of the biological circuit when stimulated with naturalistic optic flow generated by flying blowflies under different environmental conditions. To assess functional aspects of the circuit we challenged the model circuit with the optic flow generated on virtual test flights in a systematically modified three-dimensional environment. The results suggest that neither the FD1-cell nor other cells of its presynaptic network are able to unambiguously detect objects. The responses of all circuit elements are also much affected, though in different ways, by the distance as well as the texture of extended structures in the environment. These response characteristics suggest an encoding of information about three-dimensional environments by a population of cells. Because of its pronounced sensitivity to the spatial layout of the environment, the FD1-cell presumably plays a prominent role in such a cell ensemble.
5.2. Introduction One of the great challenges of the neuroscience is to ask for the functional significance of experimentally analyzed brain mechanisms, such as the characteristics of a neural circuit. The functional significance of these mechanisms is in most cases not obvious. The first step of unraveling the functional significance of neurons and neural mechanisms is usually to find correlates at the behavioral or perceptual level of the system we are analyzing. For example, if we observe an animal, which usually does not collide with objects, we assume in a first guess that it is able to avoid collisions and to detect objects in its motion pathway. If we now find a neuron in the brain of this animal which responds strongly to objects, we bring it into the functional context of object detection. Although we cannot be sure of the necessity of such an object detector for fulfilling the function of collision avoidance, we even may suspect that this neuron represents an object detector. One of the most powerful methods of testing hypotheses about the functional significance of neural mechanisms is to simulate these mechanisms and, usually based on additional ad hoc
99
assumptions about how the analyzed neural circuits might be related to behavioral control, their performance in a virtual environment after closing the action perception loop. In such simulations we are able to test whether a model system which is build upon the knowledge on the biological system is able to fulfill its assumed functions. Moreover, it is possible to modify model components and to determine the consequences for the model’s overall performance. In this way, we are able to pinpoint the functional significance of particular features of the mechanisms. In this study we approach by the means of model simulations the functions of a specific neuronal network in the visual system of the fly. The network we are analyzing is formed by the so-named FD1-cell and its presynaptic elements in the lobula plate, the posterior part of the third neuropile of the fly’s visual system. The lobula plate contains about 60 individually identifiable neurons, the lobula plate tangential cells (LPTCs). Most of these large motion-sensitive interneurons integrate signals from several hundreds of retinotopically arranged motion sensitive input elements, i.e. the elementary motion detectors (EMDs) (for review see Hausen, 1984; Borst et al., 2010; Egelhaaf,
2006). The FD1-cell integrates optic flow in the frontal visual field and responds stronger to objects moving in its receptive field than to extended motion in the entire visual field (Egelhaaf, 1985b). It could be shown that this preference for objects is achieved by an inhibitory GABAergic input from an other LPTC, the vCH-cell (Warzecha et al., 1993). The vCH-cell is an individually identified visual interneuron that receives input from various other identified LPTCs of both the ipsilateral and contralateral half of the visual system (Hennig et al., 2011; Spalthoff et al., 2010; Haag and Borst, 2001; Krapp et al., 2001). Major parts of the circuit are illustrated in figure 5.1.In several studies the FD1 was analyzed against the background of its characteristic property of an enhanced preference for objects and discussed to mediate object-induced behavior and even to represent an object detector (experimental analysis: Egelhaaf, 1985b; Kimmerle et al., 2000;
100
Figure 5.1. Wiring sketch of the FD1-cell input circuit. Motion-sensitive elements of the right FD1-circuit that have a horizontal preferred direction. The FD1-cell and most of its presynaptic elements presumably receive retinotopic motion input (thick grey lines) from large parts of one eye. The right vCH-cell inhibits the FD1-cell and receives itself excitatory and inhibitory input from motion sensitive LPTCs of both brain hemispheres. The left H1 and left H2 excite the right vCH-cell, whereas the left Hu-cell inhibits it. The right HSE-cell and the right HSS-cell are electrically coupled to the right vCH-cell. FD1, HSE and HSS are output neurons of the optic lobe, whereas H1, H2, Hu and vCH connect exclusively to other LPTCs.
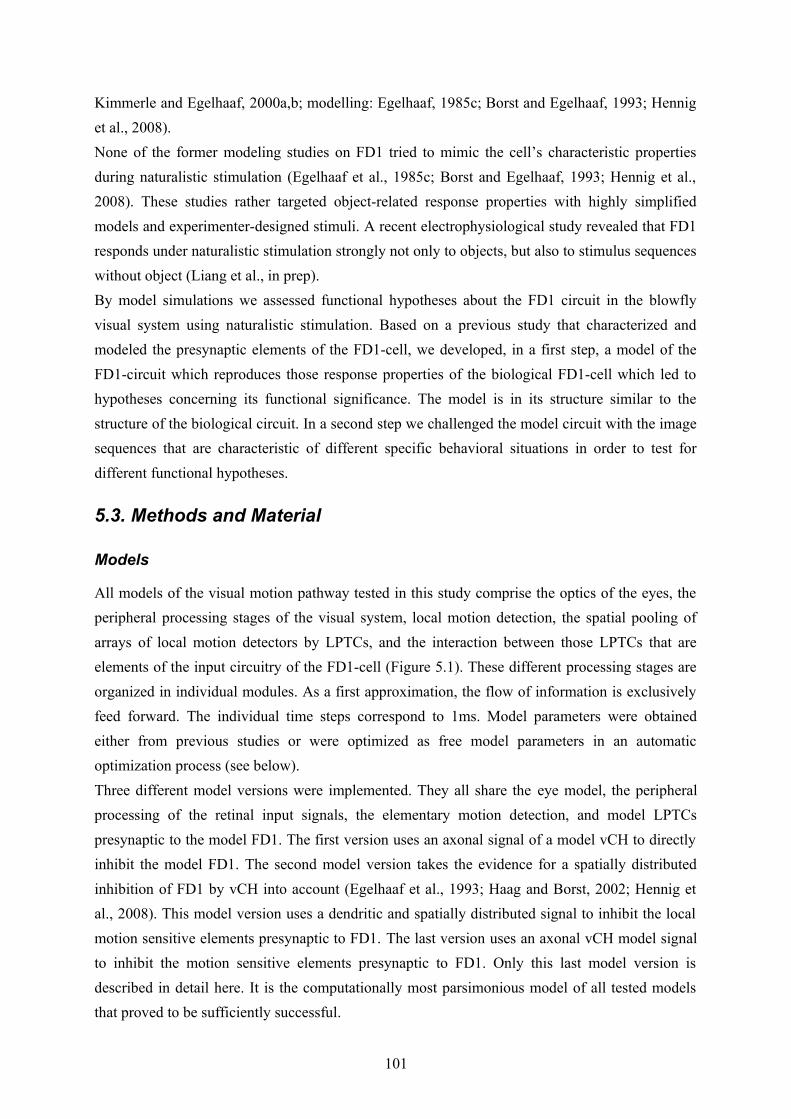
Kimmerle and Egelhaaf, 2000a,b; modelling: Egelhaaf, 1985c; Borst and Egelhaaf, 1993; Hennig et al., 2008).None of the former modeling studies on FD1 tried to mimic the cell’s characteristic properties during naturalistic stimulation (Egelhaaf et al., 1985c; Borst and Egelhaaf, 1993; Hennig et al., 2008). These studies rather targeted object-related response properties with highly simplified models and experimenter-designed stimuli. A recent electrophysiological study revealed that FD1 responds under naturalistic stimulation strongly not only to objects, but also to stimulus sequences without object (Liang et al., in prep).By model simulations we assessed functional hypotheses about the FD1 circuit in the blowfly visual system using naturalistic stimulation. Based on a previous study that characterized and modeled the presynaptic elements of the FD1-cell, we developed, in a first step, a model of the FD1-circuit which reproduces those response properties of the biological FD1-cell which led to hypotheses concerning its functional significance. The model is in its structure similar to the structure of the biological circuit. In a second step we challenged the model circuit with the image sequences that are characteristic of different specific behavioral situations in order to test for different functional hypotheses.
5.3. Methods and Material
Models
All models of the visual motion pathway tested in this study comprise the optics of the eyes, the peripheral processing stages of the visual system, local motion detection, the spatial pooling of arrays of local motion detectors by LPTCs, and the interaction between those LPTCs that are elements of the input circuitry of the FD1-cell (Figure 5.1). These different processing stages are organized in individual modules. As a first approximation, the flow of information is exclusively feed forward. The individual time steps correspond to 1ms. Model parameters were obtained either from previous studies or were optimized as free model parameters in an automatic optimization process (see below).Three different model versions were implemented. They all share the eye model, the peripheral processing of the retinal input signals, the elementary motion detection, and model LPTCs presynaptic to the model FD1. The first version uses an axonal signal of a model vCH to directly inhibit the model FD1. The second model version takes the evidence for a spatially distributed inhibition of FD1 by vCH into account (Egelhaaf et al., 1993; Haag and Borst, 2002; Hennig et al., 2008). This model version uses a dendritic and spatially distributed signal to inhibit the local motion sensitive elements presynaptic to FD1. The last version uses an axonal vCH model signal to inhibit the motion sensitive elements presynaptic to FD1. Only this last model version is described in detail here. It is the computationally most parsimonious model of all tested models that proved to be sufficiently successful.
101
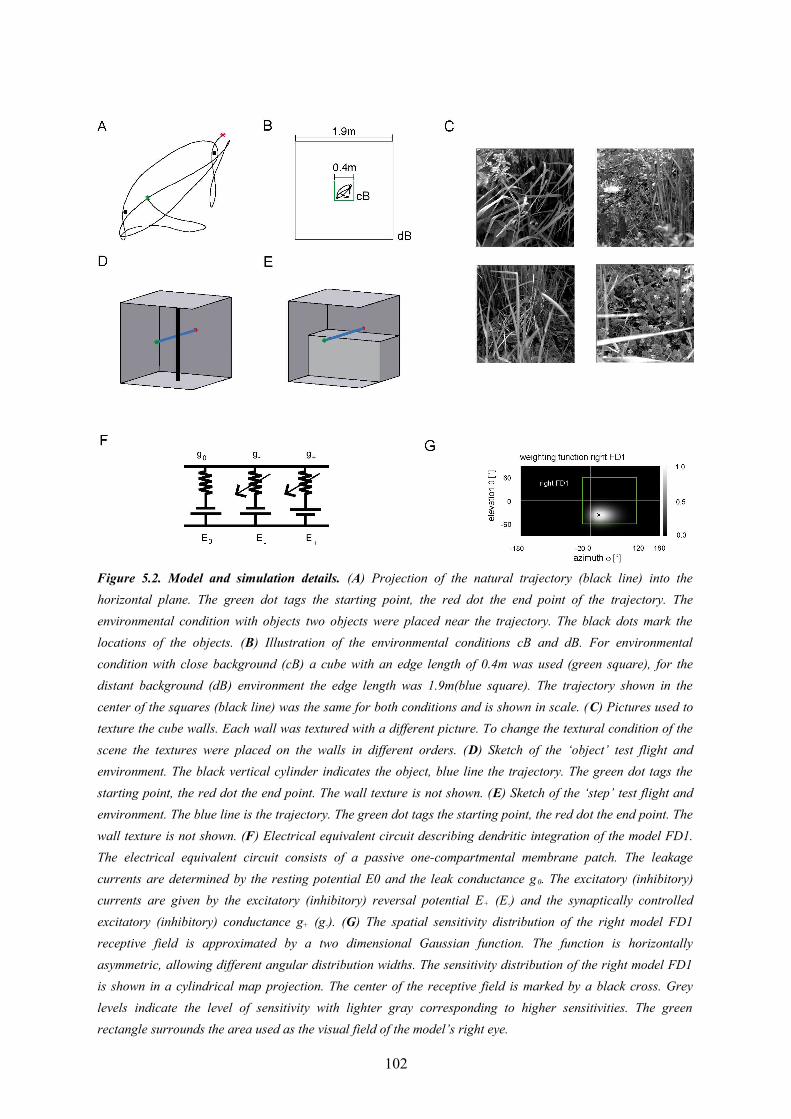
102
Figure 5.2. Model and simulation details. (A) Projection of the natural trajectory (black line) into the horizontal plane. The green dot tags the starting point, the red dot the end point of the trajectory. The environmental condition with objects two objects were placed near the trajectory. The black dots mark the locations of the objects. (B) Illustration of the environmental conditions cB and dB. For environmental condition with close background (cB) a cube with an edge length of 0.4m was used (green square), for the distant background (dB) environment the edge length was 1.9m(blue square). The trajectory shown in the center of the squares (black line) was the same for both conditions and is shown in scale. (C) Pictures used to texture the cube walls. Each wall was textured with a different picture. To change the textural condition of the scene the textures were placed on the walls in different orders. (D) Sketch of the ‘object’ test flight and environment. The black vertical cylinder indicates the object, blue line the trajectory. The green dot tags the starting point, the red dot the end point. The wall texture is not shown. (E) Sketch of the ‘step’ test flight and environment. The blue line is the trajectory. The green dot tags the starting point, the red dot the end point. The wall texture is not shown. (F) Electrical equivalent circuit describing dendritic integration of the model FD1. The electrical equivalent circuit consists of a passive one-compartmental membrane patch. The leakage currents are determined by the resting potential E0 and the leak conductance g 0. The excitatory (inhibitory) currents are given by the excitatory (inhibitory) reversal potential E+ (E-) and the synaptically controlled excitatory (inhibitory) conductance g+ (g-). (G) The spatial sensitivity distribution of the right model FD1 receptive field is approximated by a two dimensional Gaussian function. The function is horizontally asymmetric, allowing different angular distribution widths. The sensitivity distribution of the right model FD1 is shown in a cylindrical map projection. The center of the receptive field is marked by a black cross. Grey levels indicate the level of sensitivity with lighter gray corresponding to higher sensitivities. The green rectangle surrounds the area used as the visual field of the model’s right eye.
Eye model and peripheral processing
The eye module implements the optic properties of the fly's compound eyes. A retinal image reconstructed from a free-flight trajectory and a 3D-model of the corresponding environment is
spatially convolved with a Gaussian low-pass filter ( )°= 2σ to approximate the optics of the fly’s
eye. The filtered signal provides the input to the photoreceptors, which are equally spaced at 2° in elevation and azimuth. The field of view of the left eye covers an elevation range from 60° above to 60° below the horizon, and extends horizontally from -20° in the contralateral field of view to +120° in the ipsilateral visual field (fig 2G, green rectangle). The field of view of the right eye is mirror symmetric. For simplicity, the photoreceptors are arranged in a rectangular grid with 60 by 69 elements, which thus deviates in its details from the fly’s roughly hexagonal ommatidial lattice (Exner and Hardie, 1989; Land, 1997; Petrowitz et al., 2000).The peripheral processing module merges properties of the processing performed by the photoreceptors and 2nd-order neurons in the fly visual system and describes them as a temporal band-pass filter. The filter properties are approximated on the basis of experimental data and adjusted to the luminance conditions of the electrophysiological experiments on which the model simulations are based (Juusola et al., 1995; Lindemann et al., 2005).
Elementary motion detection
The elementary motion detector model is an elaborated correlation-type motion detector with an arithmetic multiplication of a low-pass filtered signal of a photoreceptor and a high- pass filtered signal of a horizontally-neighboring photoreceptor (Figure 5.3) (Borst et al., 2003). The time
constants are set to mslp 10=τ in the low-pass filter and to mshp 60=τ in the high-pass filter.
The parameters were estimated in a previous study (Lindemann et al., 2005). The detector consists of two half-detectors, i.e. mirror symmetric subunits with opposite preferred directions. The corresponding half-detectors each form a retinotopic grid and are used as the input into the following model stages. For simplicity, the model does not contain contrast or luminance normalization. This appears to be justified for our current purposes as we analyzed the simulated neural responses only for a given luminance level and did not vary pattern statistics. All modules up to the level of elementary motion detection are identical to the model of Lindemann et al. (2005).
Presynaptic elements
The vCH-cell inhibits the FD1-cell and gives the FD1-cell its preference for objects. The vCH-cell and its binocular integration of visual information were analyzed in a preceding model study (Hennig et al. 2011). This model vCH and its presynaptic elements were taken for the current FD1 study. For details on the model vCH circuit see Hennig et al. (2011).
103
Synaptic transmission
Three alternative transformation characteristics from presynaptic elementary movement detectors to the postsynaptic FD1-cell were implemented. The basic version is a rectifying linear characteristic with a subsequent amplification. The second version is characterized by a polynomial characteristic. The most elaborated variant of the transmission characteristic is given by a sigmoid function:
syn( x )={ χ1+e−α ( x−β )−
χ1+e−α (−β) , if x>0
0, else
(1)
where α describes the slope of the sigmoid, χ accounts for the level of saturation, and β specifies the operating range of the modeled synapse. A rectification stage prevents output values from falling below zero.We do not present details of linear or polynomial transformation characteristics. Model versions using these characteristics did not succeed.
Local sensitivities
Heterogeneous dendritic branching of LPTCs and synapse densities lead to receptive fields with a characteristic sensitivity distribution (Hausen, 1984). The model takes this feature into account by using a weighting function, described by a two dimensional Gaussian function. The distribution is horizontally asymmetric, i. e. the angular width on the left is not equal to that on the right. (The sensitivity distribution of the model FD1 is shown in figure 5.2G). For a given retinal position, the sensitivity is defined as follows:
w (θ ,ϕ)={exp(−( 1σθ
(θ−θC))2)exp(−( 1
σ ϕr
(ϕ−ϕC ))2) , if ϕ>ϕC
exp(−( 1σθ
(θ−θC))2)exp(−( 1
σ ϕl
(ϕ−ϕC))2), else
(2)
where θ denotes the elevation and ϕ the azimuth. θC and ϕC predict the center of the weight
field. σ θ is the angular width of the distribution in elevation. σϕr is the azimuthal angular width
on the right, σ ϕl is that on the left. For the inhibitory and excitatory inputs from the half-
detectors, the same weighting function is used. The different parameters need to be adjusted to approximate the different LPTCs’ characteristics.
104
Shunting inhibition
The inhibition of the local input elements of the FD1-cell is presumably presynaptical and done by the vCH-cell (Warzecha et al. 1993; Hennig et al. 2008). The model performs a shunting of the array of EMD half-detectors by means of a division (Koch 1999):
shunt (emd ,vCH )= emdshiftch fd
+synvCH (vCH +shiftch) (3)
where emd is the input signal to be shunted. vCH is the axonal vCH signal shifted by shift ch .
synvCH () is a transfer function identical to the one used for the synapse between FD1 and its
input elements (see above). shift ch fd is an additional shift to prevent division by small values near
zero. All parameters including those of synvCH () were optimized.
Spatial integration
The FD1-cell has a preferred direction of motion from front to back. Like other LPTCs of the fly the FD1-cell spatially integrates presumably the output of local motion detectors (Egelhaaf, 1985b). The dendritic integration by the FD1-cell is approximated using an electrical equivalent circuit of a one-compartmental passive membrane patch (Figure 5.2F). The resulting membrane potential is given by
U FD1( t )=E i⋅g−( t )+Ee⋅g+( t )+E0⋅g0
g−( t )+g+( t )+g0 (4)
g- and g+ denote the total conductance of the inhibitory and excitatory synapses and g0 the leak conductance, respectively.The excitatory and inhibitory conductances are controlled by the shunted outputs of the two half-detectors of local movement detectors. Ei and Ee are the corresponding reversal potentials with Ee
set to 1. The resting potential E0 of the cell is set to zero. The leak conductance g0 of the element is arbitrarily set to 1. All other conductances are thus to be interpreted relative to the leak conductance. g- and g+ are calculated as the weighted output of synaptic transfer functions. Capacitive properties of the cell membrane are approximated by a temporal low-pass filter after the dendritic integration .
The excitatory conductance g+ is controlled by the shunted outputs of the half-detectors emd+ at
the corresponding grid locations, with a preferred direction from front to back. In order to obtain
the excitatory conductance g+, the half-detector outputs are transformed by a sigmoidal synaptic transfer function syn+ before being weighted by the cells’ sensitivity distribution wFD1:
105
g+( t )=∑n , m
wFD1 (n , m)⋅syn+ (shunt (emd+(n ,m , t ) ,U vCH ( t ) )) (5)
where n and m denote the position in the retinotopic grid. The inhibitory conductance g- is
controlled by the second set of half-detectors emd-:
g−( t )=∑n , m
wFD1 (n , m)⋅syn− (shunt (emd−(n , m , t ) ,U vCH ( t ) )) (6)
The parameters of the transfer functions and the weight function are free parameters of the model. The parameters of the inhibitory and excitatory channels are independent. Data of FD1 responses were obtained from extracellular recordings. Thus, a spike threshold was incorporated into the model FD1:
SF FD 1={U FD1−threshold , if (U FD 1>threshold )0, else
(7)
Animals and electrophysiological recording
The experimental data on which this modeling study is based were collected in parallel projects (Hennig et al., 2011; Liang et al., in prep.). Therefore, the experimental procedure is described only in brief. The cells were stimulated with the optic flow experienced on free-flight sequences in a flight arena and modified versions of these optic flow sequences where two virtual objects were placed in the flight arena close to the flight trajectory. The flight sequence had a duration of 3.45s. In the electrophysiological experiments they were played back on a panoramic stimulus device, FliMax, at a frame rate of 370Hz (Lindemann et al., 2003). All electrophysiological experiments were done on female blowflies of the genus Calliphora. The activity of FD1-cells was monitored extracellularly according to routines conventionally used in our laboratory (see e. g. Warzecha et al., 1993). Recording site was the input arborization of the FD1-cell in the right optic lobe. The recordings on vCH- and HSE-cells were done also with standard electrophysiological equipment, but intracellulary. The LPTCs were identified by the recording site, their response mode, their preferred motion-direction, and the location of their receptive field. For further details see Liang et al. (in prep.) and Hennig et al. (2011).
106
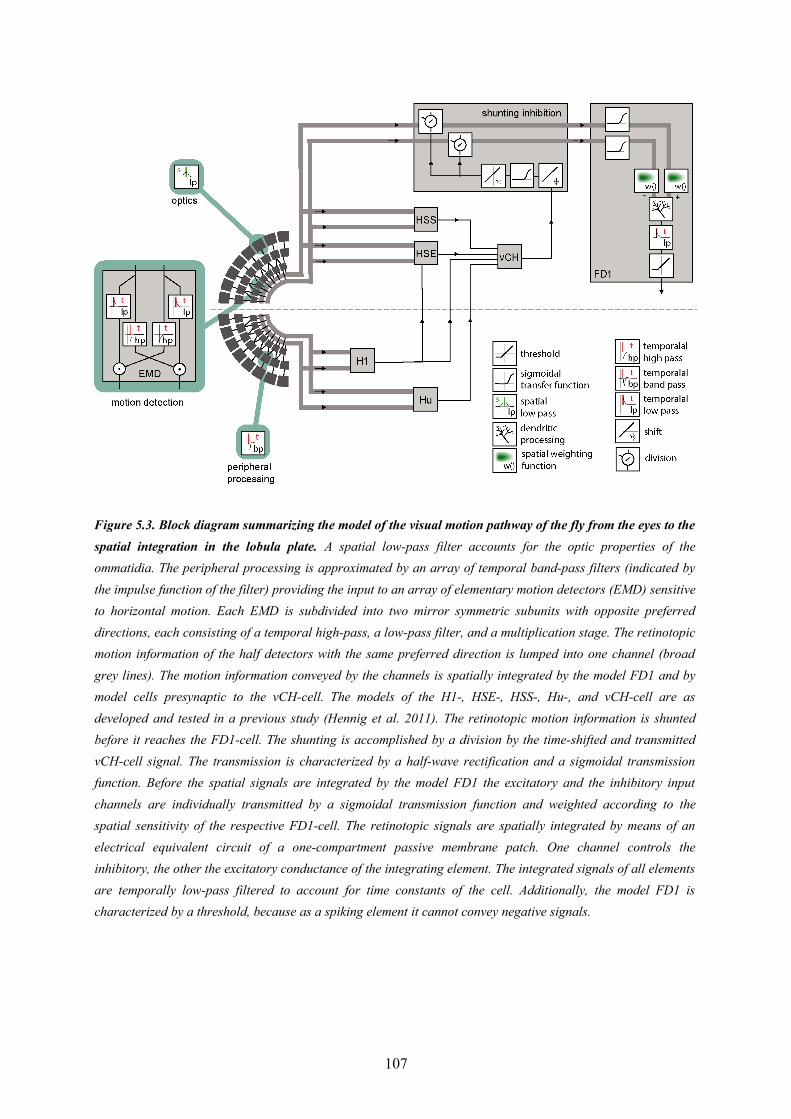
107
Figure 5.3. Block diagram summarizing the model of the visual motion pathway of the fly from the eyes to the spatial integration in the lobula plate. A spatial low-pass filter accounts for the optic properties of the ommatidia. The peripheral processing is approximated by an array of temporal band-pass filters (indicated by the impulse function of the filter) providing the input to an array of elementary motion detectors (EMD) sensitive to horizontal motion. Each EMD is subdivided into two mirror symmetric subunits with opposite preferred directions, each consisting of a temporal high-pass, a low-pass filter, and a multiplication stage. The retinotopic motion information of the half detectors with the same preferred direction is lumped into one channel (broad grey lines). The motion information conveyed by the channels is spatially integrated by the model FD1 and by model cells presynaptic to the vCH-cell. The models of the H1-, HSE-, HSS-, Hu-, and vCH-cell are as developed and tested in a previous study (Hennig et al. 2011). The retinotopic motion information is shunted before it reaches the FD1-cell. The shunting is accomplished by a division by the time-shifted and transmitted vCH-cell signal. The transmission is characterized by a half-wave rectification and a sigmoidal transmission function. Before the spatial signals are integrated by the model FD1 the excitatory and the inhibitory input channels are individually transmitted by a sigmoidal transmission function and weighted according to the spatial sensitivity of the respective FD1-cell. The retinotopic signals are spatially integrated by means of an electrical equivalent circuit of a one-compartment passive membrane patch. One channel controls the inhibitory, the other the excitatory conductance of the integrating element. The integrated signals of all elements are temporally low-pass filtered to account for time constants of the cell. Additionally, the model FD1 is characterized by a threshold, because as a spiking element it cannot convey negative signals.
Stimuli for the model simulations
Trajectory
Naturalistic stimulation was based on a flight trajectory of a freely flying fly (Figure 5.2A). The position and the orientation of the head of blowflies flying in a cube of 0.4 x 0.4 x 0.4 m³ was recorded using magnetic fields driving search coils attached to the flies (van Hateren and Schilstra, 1999; Schilstra and van Hateren, 1998a). The trajectory has a duration of 3.45seconds. The side walls of the flight arena were covered with images of herbage (Figure 5.2C). The visual stimulus encountered by the fly during the flight could be reconstructed, because the fly’s compound eyes are fixed in its head, and the visual interior of the cube was known.
Naturalistic stimulation
In combination with the natural trajectory four different virtual environments were used for naturalistic stimulation in the simulation experiments. Each environment consisted of a cube with side walls covered with the same images of herbage as used for recording the trajectory and for the electrophysiological experiments (van Hateren and Schilstra, 1999; Schilstra and van Hateren, 1999, Liang et al., in prep). The cube size was 0.4 x 0.4 x 0.4 m³ for the close background condition (cB) and 1.9 x 1.9 x 1.9 m³ for the distant background condition (dB) (Figure 5.2B). For the conditions with objects two vertical 5mm wide and blurred randomly dot patterned cylinders were placed in the cube near the trajectory (Figure 5.2A). The cylinders reached in the condition with closed background and objects (cBO) from the bottom to the ceiling of the cube. In the distant background condition with objects (dBO) the size and position of the cylinders relative to the trajectory were not changed.
Size dependence
The stimuli to analyze the size dependence of the model cell responses were based on vertical cylinders moving back and forth within the ipsilateral visual field from a frontal position of 0° to a lateral position of 45°. The cylinders had retinal sizes of 5°, 10°, 15°, and 20° and were covered by a blurred random dot pattern. As a surrounding the close background (cB) cube was used. The model fly was positioned in the middle of the cube. The stimulus was completed by 45° clockwise and counter clockwise rotations of the cube around the model fly. The responses of the model cell shown in Figure 5.4 were averaged over the time intervals of rotations which generated optic flow in the preferred direction of the model cells. A similar stimulus was used in electrophysiological experiments to predict response to a 10° wide cylinder and the moving background (unpublished data).
108
Test flight ‘object’
In the test flight with an object in the arena the model fly flew on an artificial straight trajectory in the middle of a cube parallel to the side walls and to the floor of the arena (Figure 5.2D). A vertical cylinder was placed in the virtual box at a distance of 20mm at the right of the flight trajectory. The cylinder had a height of 370mm, a width of 3mm and 4mm, respectively. The objects are textured with a section of a wall texture. As environments the virtual cube with the close (cB) and distant background (dB) were used. The flights were performed with two velocities (0.5m/s and 1.0m/s) and without object as well as with the 3mm and the 4mm cylinder. Four different texture conditions were obtained by exchanging the patterns on the different arena walls via four sequential rotations of the virtual flight arena each by 90°.
Test flight ‘step’
In the test flight with a step in the arena floor the model flew on a straight trajectory as in the test flight with object. Instead of a cylinder a step was placed in the small virtual flight arena (cB) . The step filled the rear bottom quarter of the arena (Figure 5.2E). Again four different texture conditions were obtained by four rotations of the virtual box by 90° each. The step was textured with the same image as that covering the wall the model fly was approaching. The flight was repeated at three flight heights above the step (10mm, 20mm, and 30mm) and three velocities (0.5m/s, 0.75m/s, and 1.0m/s).
Test flight ‘texture dependance’
To test for texture dependence of the model cells’ responses the model fly was placed in the middle of a cylindrical flight arena. The arena had a diameter of 120mm and rotated at a constant speed of 360°/s around its vertical axis. (The model fly could not see the top or bottom of the drum.) Four texture conditions were tested. For each condition one of the wall images of the former experiments were used. To prevent high local and artificial contrasts we extended each image horizontally by a mirrored version.
Optimization
For the optimization process a stimulus sequence was composed of the optic flow as perceived on the flight in the four environmental conditions (cB, cBO, dB, dBO) and of the size dependence stimuli. The optimization flight lasted 10s. It contained always the section between 1050 ms and 2650 ms after the onset of the flights. These sequences thus comprise those times in which an object moved within the receptive field of the right FD1-cell. The stimulus was completed by those parts of the size dependence stimuli (see above) which showed the motion of the 10° object and the rotating cube.As a quantitative measure of the similarity between physiological p(t) and model data ms(t) the
root mean square difference d rms was chosen:
109
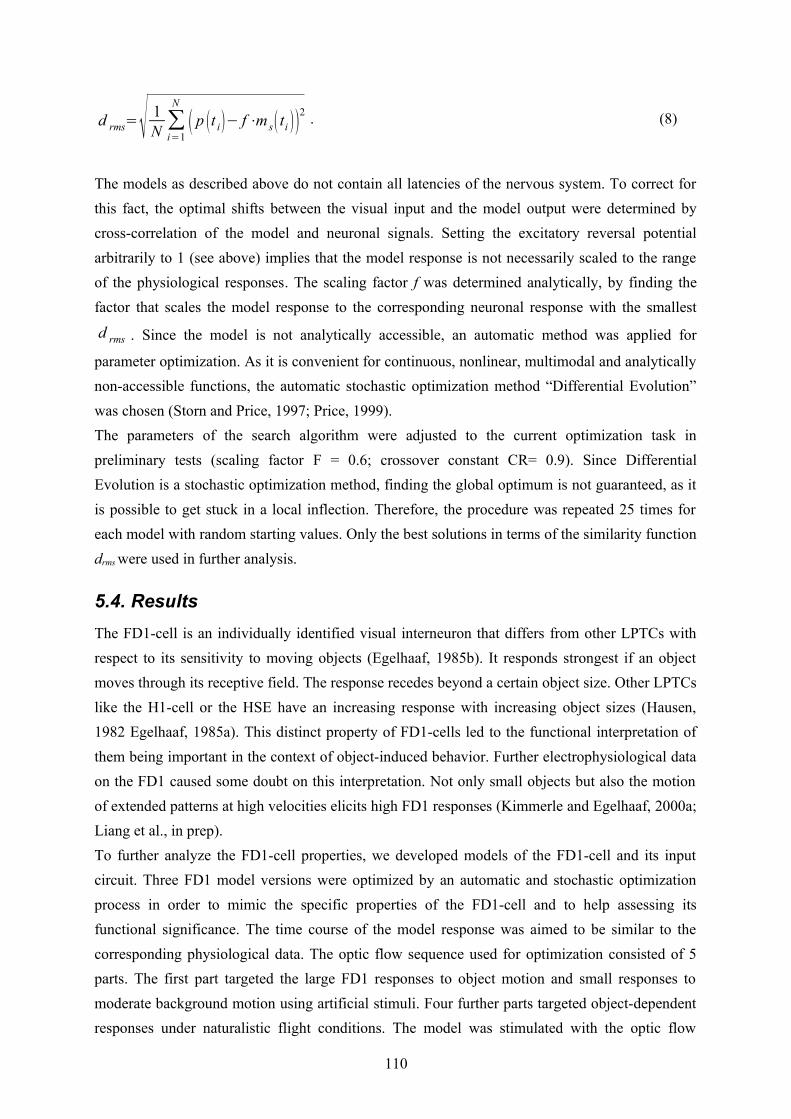
d rms=√ 1N ∑
i=1
N
( p (t i)− f ⋅m s( ti ))2 . (8)
The models as described above do not contain all latencies of the nervous system. To correct for this fact, the optimal shifts between the visual input and the model output were determined by cross-correlation of the model and neuronal signals. Setting the excitatory reversal potential arbitrarily to 1 (see above) implies that the model response is not necessarily scaled to the range of the physiological responses. The scaling factor f was determined analytically, by finding the factor that scales the model response to the corresponding neuronal response with the smallest
d rms . Since the model is not analytically accessible, an automatic method was applied for
parameter optimization. As it is convenient for continuous, nonlinear, multimodal and analytically non-accessible functions, the automatic stochastic optimization method “Differential Evolution” was chosen (Storn and Price, 1997; Price, 1999). The parameters of the search algorithm were adjusted to the current optimization task in preliminary tests (scaling factor F = 0.6; crossover constant CR= 0.9). Since Differential Evolution is a stochastic optimization method, finding the global optimum is not guaranteed, as it is possible to get stuck in a local inflection. Therefore, the procedure was repeated 25 times for each model with random starting values. Only the best solutions in terms of the similarity function drms were used in further analysis.
5.4. ResultsThe FD1-cell is an individually identified visual interneuron that differs from other LPTCs with respect to its sensitivity to moving objects (Egelhaaf, 1985b). It responds strongest if an object moves through its receptive field. The response recedes beyond a certain object size. Other LPTCs like the H1-cell or the HSE have an increasing response with increasing object sizes (Hausen, 1982 Egelhaaf, 1985a). This distinct property of FD1-cells led to the functional interpretation of them being important in the context of object-induced behavior. Further electrophysiological data on the FD1 caused some doubt on this interpretation. Not only small objects but also the motion of extended patterns at high velocities elicits high FD1 responses (Kimmerle and Egelhaaf, 2000a; Liang et al., in prep). To further analyze the FD1-cell properties, we developed models of the FD1-cell and its input circuit. Three FD1 model versions were optimized by an automatic and stochastic optimization process in order to mimic the specific properties of the FD1-cell and to help assessing its functional significance. The time course of the model response was aimed to be similar to the corresponding physiological data. The optic flow sequence used for optimization consisted of 5 parts. The first part targeted the large FD1 responses to object motion and small responses to moderate background motion using artificial stimuli. Four further parts targeted object-dependent responses under naturalistic flight conditions. The model was stimulated with the optic flow
110
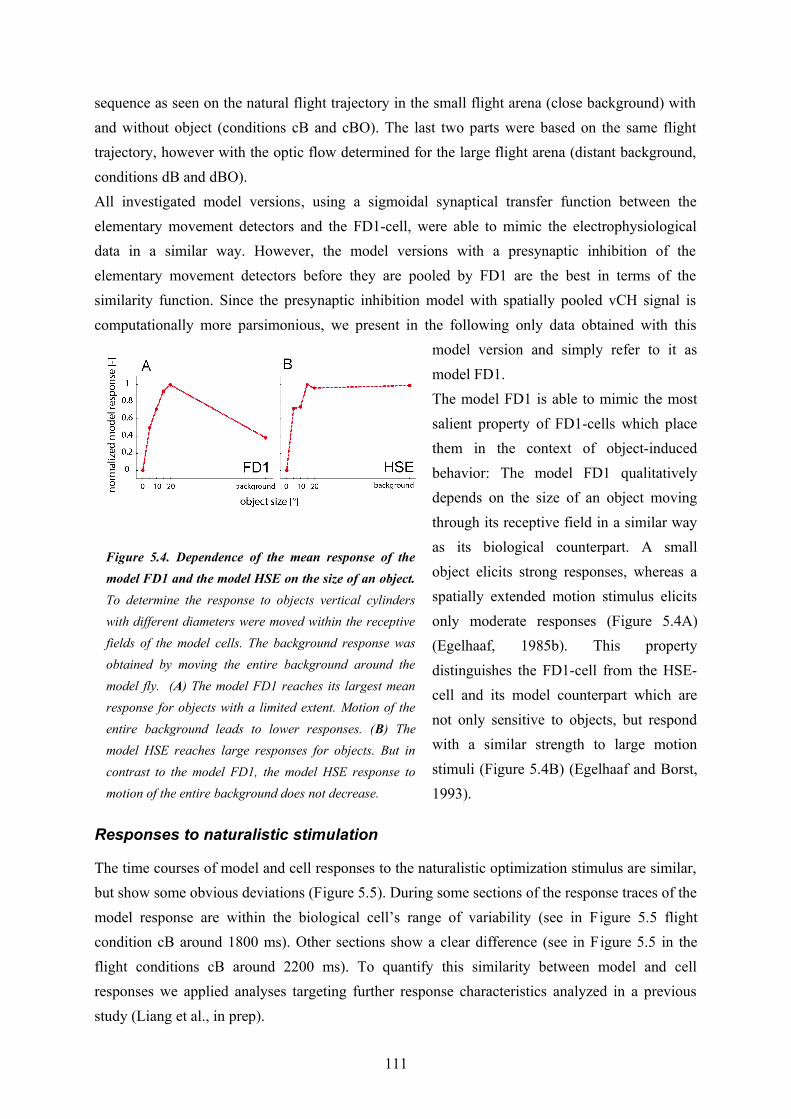
sequence as seen on the natural flight trajectory in the small flight arena (close background) with and without object (conditions cB and cBO). The last two parts were based on the same flight trajectory, however with the optic flow determined for the large flight arena (distant background, conditions dB and dBO). All investigated model versions, using a sigmoidal synaptical transfer function between the elementary movement detectors and the FD1-cell, were able to mimic the electrophysiological data in a similar way. However, the model versions with a presynaptic inhibition of the elementary movement detectors before they are pooled by FD1 are the best in terms of the similarity function. Since the presynaptic inhibition model with spatially pooled vCH signal is computationally more parsimonious, we present in the following only data obtained with this
model version and simply refer to it as model FD1.The model FD1 is able to mimic the most salient property of FD1-cells which place them in the context of object-induced behavior: The model FD1 qualitatively depends on the size of an object moving through its receptive field in a similar way as its biological counterpart. A small object elicits strong responses, whereas a spatially extended motion stimulus elicits only moderate responses (Figure 5.4A) (Egelhaaf, 1985b). This property distinguishes the FD1-cell from the HSE-cell and its model counterpart which are not only sensitive to objects, but respond with a similar strength to large motion stimuli (Figure 5.4B) (Egelhaaf and Borst, 1993).
Responses to naturalistic stimulation
The time courses of model and cell responses to the naturalistic optimization stimulus are similar, but show some obvious deviations (Figure 5.5). During some sections of the response traces of the model response are within the biological cell’s range of variability (see in Figure 5.5 flight condition cB around 1800 ms). Other sections show a clear difference (see in Figure 5.5 in the flight conditions cB around 2200 ms). To quantify this similarity between model and cell responses we applied analyses targeting further response characteristics analyzed in a previous study (Liang et al., in prep).
111
Figure 5.4. Dependence of the mean response of the model FD1 and the model HSE on the size of an object. To determine the response to objects vertical cylinders with different diameters were moved within the receptive fields of the model cells. The background response was obtained by moving the entire background around the model fly. (A) The model FD1 reaches its largest mean response for objects with a limited extent. Motion of the entire background leads to lower responses. (B) The model HSE reaches large responses for objects. But in contrast to the model FD1, the model HSE response to motion of the entire background does not decrease.
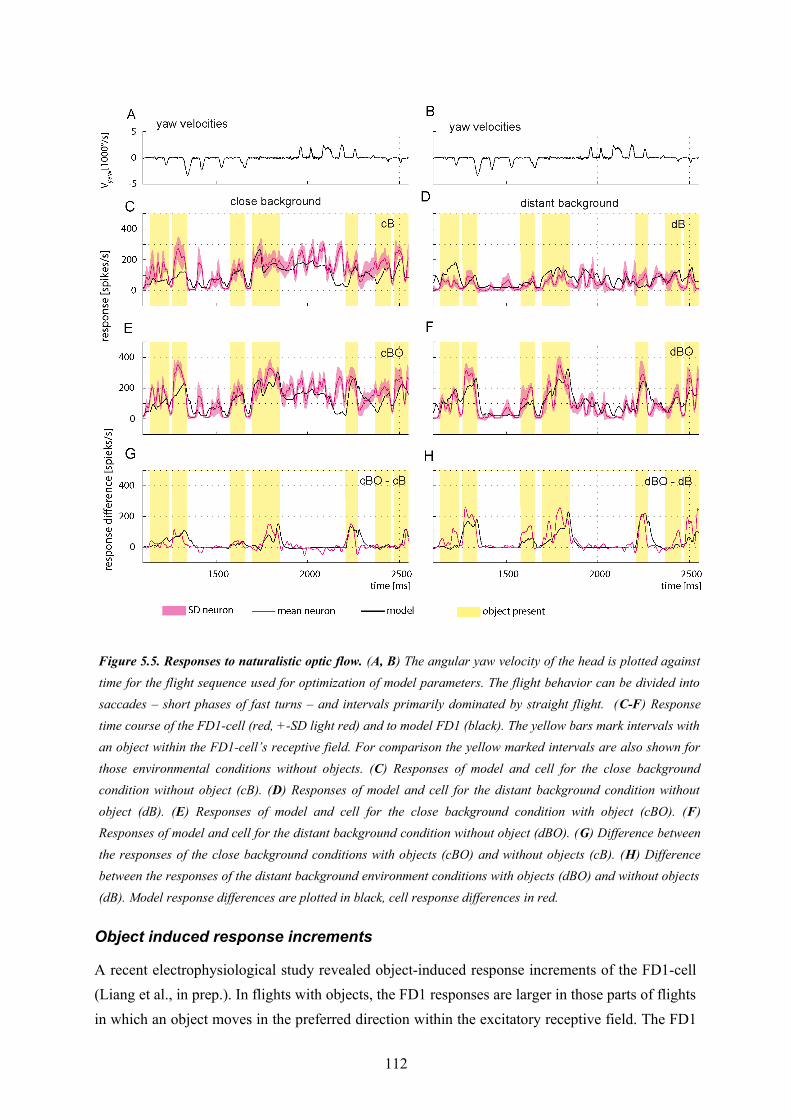
Object induced response increments
A recent electrophysiological study revealed object-induced response increments of the FD1-cell (Liang et al., in prep.). In flights with objects, the FD1 responses are larger in those parts of flights in which an object moves in the preferred direction within the excitatory receptive field. The FD1
112
Figure 5.5. Responses to naturalistic optic flow. (A, B) The angular yaw velocity of the head is plotted against time for the flight sequence used for optimization of model parameters. The flight behavior can be divided into saccades – short phases of fast turns – and intervals primarily dominated by straight flight. (C-F) Response time course of the FD1-cell (red, +-SD light red) and to model FD1 (black). The yellow bars mark intervals with an object within the FD1-cell’s receptive field. For comparison the yellow marked intervals are also shown for those environmental conditions without objects. (C) Responses of model and cell for the close background condition without object (cB). (D) Responses of model and cell for the distant background condition without object (dB). (E) Responses of model and cell for the close background condition with object (cBO). (F) Responses of model and cell for the distant background condition without object (dBO). (G) Difference between the responses of the close background conditions with objects (cBO) and without objects (cB). (H) Difference between the responses of the distant background environment conditions with objects (dBO) and without objects (dB). Model response differences are plotted in black, cell response differences in red.
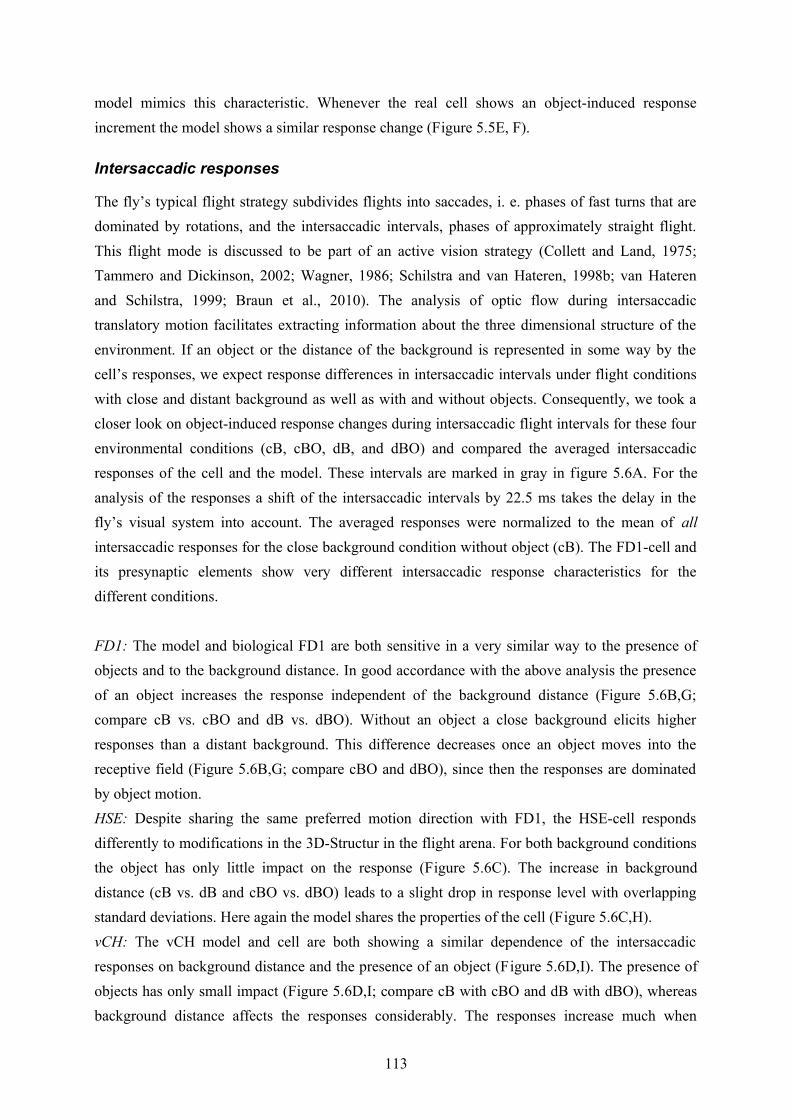
model mimics this characteristic. Whenever the real cell shows an object-induced response increment the model shows a similar response change (Figure 5.5E, F).
Intersaccadic responses
The fly’s typical flight strategy subdivides flights into saccades, i. e. phases of fast turns that are dominated by rotations, and the intersaccadic intervals, phases of approximately straight flight. This flight mode is discussed to be part of an active vision strategy (Collett and Land, 1975; Tammero and Dickinson, 2002; Wagner, 1986; Schilstra and van Hateren, 1998b; van Hateren and Schilstra, 1999; Braun et al., 2010). The analysis of optic flow during intersaccadic translatory motion facilitates extracting information about the three dimensional structure of the environment. If an object or the distance of the background is represented in some way by the cell’s responses, we expect response differences in intersaccadic intervals under flight conditions with close and distant background as well as with and without objects. Consequently, we took a closer look on object-induced response changes during intersaccadic flight intervals for these four environmental conditions (cB, cBO, dB, and dBO) and compared the averaged intersaccadic responses of the cell and the model. These intervals are marked in gray in figure 5.6A. For the analysis of the responses a shift of the intersaccadic intervals by 22.5 ms takes the delay in the fly’s visual system into account. The averaged responses were normalized to the mean of all intersaccadic responses for the close background condition without object (cB). The FD1-cell and its presynaptic elements show very different intersaccadic response characteristics for the different conditions.
FD1: The model and biological FD1 are both sensitive in a very similar way to the presence of objects and to the background distance. In good accordance with the above analysis the presence of an object increases the response independent of the background distance (Figure 5.6B,G; compare cB vs. cBO and dB vs. dBO). Without an object a close background elicits higher responses than a distant background. This difference decreases once an object moves into the receptive field (Figure 5.6B,G; compare cBO and dBO), since then the responses are dominated by object motion.HSE: Despite sharing the same preferred motion direction with FD1, the HSE-cell responds differently to modifications in the 3D-Structur in the flight arena. For both background conditions the object has only little impact on the response (Figure 5.6C). The increase in background distance (cB vs. dB and cBO vs. dBO) leads to a slight drop in response level with overlapping standard deviations. Here again the model shares the properties of the cell (Figure 5.6C,H). vCH: The vCH model and cell are both showing a similar dependence of the intersaccadic responses on background distance and the presence of an object (Figure 5.6D,I). The presence of objects has only small impact (Figure 5.6D,I; compare cB with cBO and dB with dBO), whereas background distance affects the responses considerably. The responses increase much when
113
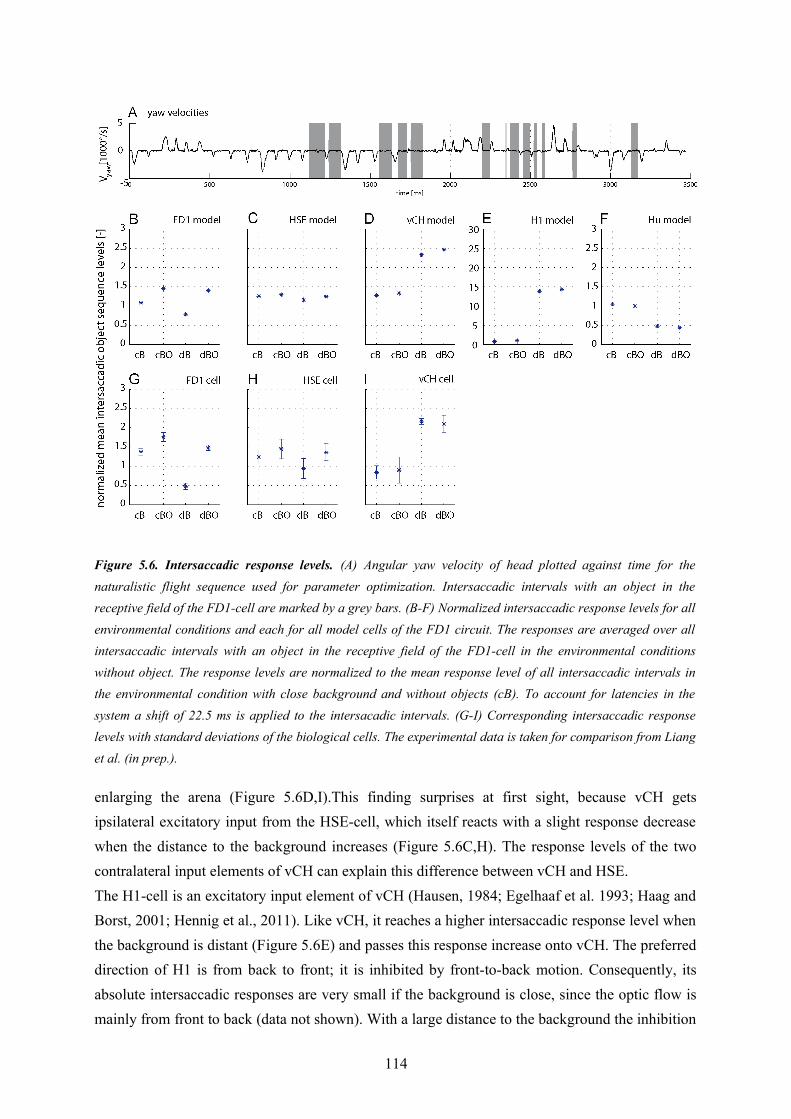
enlarging the arena (Figure 5.6D,I).This finding surprises at first sight, because vCH gets ipsilateral excitatory input from the HSE-cell, which itself reacts with a slight response decrease when the distance to the background increases (Figure 5.6C,H). The response levels of the two contralateral input elements of vCH can explain this difference between vCH and HSE. The H1-cell is an excitatory input element of vCH (Hausen, 1984; Egelhaaf et al. 1993; Haag and Borst, 2001; Hennig et al., 2011). Like vCH, it reaches a higher intersaccadic response level when the background is distant (Figure 5.6E) and passes this response increase onto vCH. The preferred direction of H1 is from back to front; it is inhibited by front-to-back motion. Consequently, its absolute intersaccadic responses are very small if the background is close, since the optic flow is mainly from front to back (data not shown). With a large distance to the background the inhibition
114
Figure 5.6. Intersaccadic response levels. (A) Angular yaw velocity of head plotted against time for the naturalistic flight sequence used for parameter optimization. Intersaccadic intervals with an object in the receptive field of the FD1-cell are marked by a grey bars. (B-F) Normalized intersaccadic response levels for all environmental conditions and each for all model cells of the FD1 circuit. The responses are averaged over all intersaccadic intervals with an object in the receptive field of the FD1-cell in the environmental conditions without object. The response levels are normalized to the mean response level of all intersaccadic intervals in the environmental condition with close background and without objects (cB). To account for latencies in the system a shift of 22.5 ms is applied to the intersacadic intervals. (G-I) Corresponding intersaccadic response levels with standard deviations of the biological cells. The experimental data is taken for comparison from Liang et al. (in prep.).
of H1 gets small as a consequence of the much reduced retinal velocities resulting from front-to-back translatory motion (Figure 5.6E). Under these conditions the residual rotations in the intersaccadic intervals overcome partly the inhibiting impact of the forward translation and lead to large H1 and thus vCH responses (van Hateren et al., 2005).As an inhibitory element of vCH (Hausen, 1984; Egelhaaf et al., 1993; Haag and Borst, 2001; Hennig et al., 2011) the Hu-cell contributes to the large vCH response levels if the background is distant. Hu has a preferred direction from front to back. This is reflected in the model Hu responses. In comparison with the close background conditions the smaller overall optic flow under the distant background conditions lead to lower intersaccadic response levels (Figure 5.6F). As a consequence, vCH gets less inhibited under the latter conditions contributing to its large response amplitude.
Model predictions for specific spatial configurations of the environment
The model FD1 reflects the characteristic properties of the biological FD1-cell that were tested experimentally under a wide variety of conditions: The model mimics the FD1-cell’s preference for objects and even the object-induced response increments during the intersaccadic intervals under naturalistic flight conditions. We now test the model with systematic variations of straight flights sequences to challenge hypotheses on the function of the FD1-cell. For simplicity, we will use straight translational flights without any rotational component. This reflects an approximation of the intersaccadic flight intervals, which are thought to be most important for gathering information on the 3D-structure of the environment (see above).
Test flight ‘object’
If the FD1-cell plays a dominant role for the fly to perform object-induced behavior or even to detect objects, FD1 is expected, based on the above results, to indicate the presence of an object by an increase in its response amplitude. To test this hypothesis systematically we let the model fly pass an object during straight flights at two velocities (0.5m/s and 1.0m/s). The fly crossed the virtual flight arena in the middle flying parallel to the side wall and to the floor (see above). A vertical cylindrical object was placed at a small distance to the flight trajectory. The object was textured with a section of the wall texture. The flights were repeated for all four virtual arena environmental conditions (cB, cBO, dB, and dBO) and each with different wall textures and velocities. We addressed the following questions. Is there a response difference with and without objects? Is it possible to infer unambiguously from the FD1 response the existence of an object? How are the responses of the FD1 in comparison to other cells of the circuit?The FD1 responses show strong time-dependent fluctuations that depend on the texture of the background. These pattern-dependent fluctuations occur regardless of the distance to the background and the flight speed (for example Figure 5.7A). The responses of HSE and vCH are
115
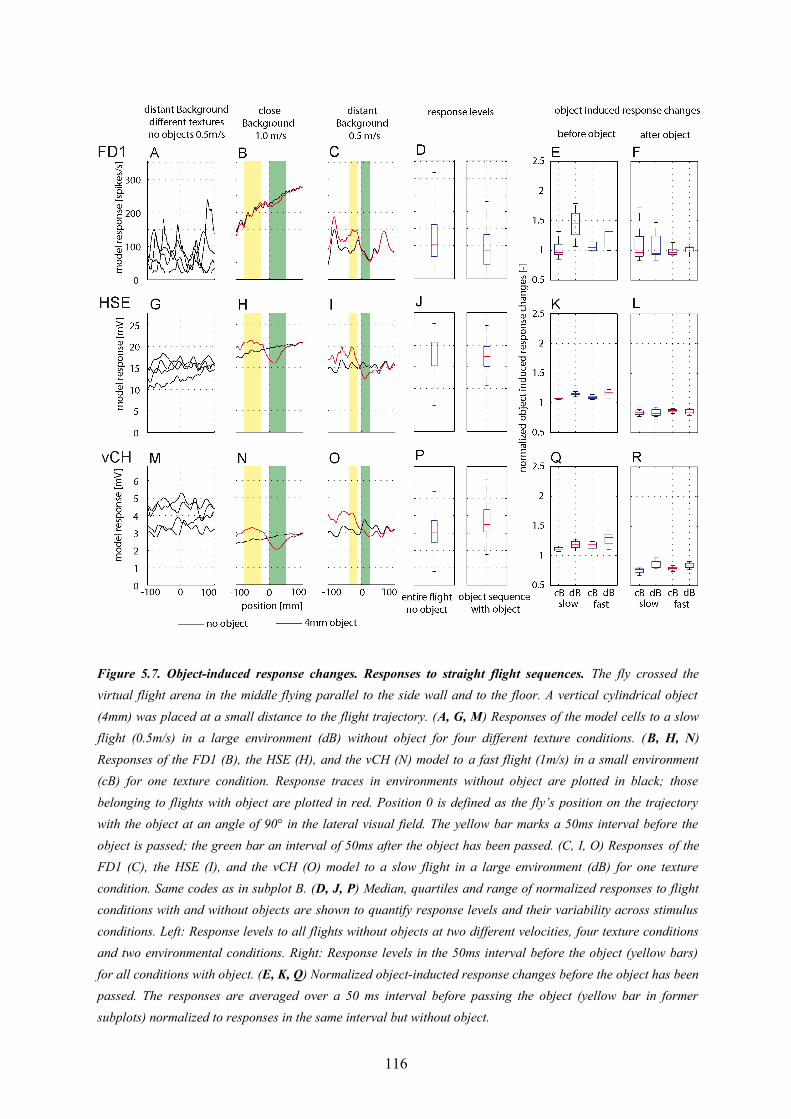
116
Figure 5.7. Object-induced response changes. Responses to straight flight sequences. The fly crossed the virtual flight arena in the middle flying parallel to the side wall and to the floor. A vertical cylindrical object (4mm) was placed at a small distance to the flight trajectory. (A, G, M) Responses of the model cells to a slow flight (0.5m/s) in a large environment (dB) without object for four different texture conditions. (B, H, N) Responses of the FD1 (B), the HSE (H), and the vCH (N) model to a fast flight (1m/s) in a small environment (cB) for one texture condition. Response traces in environments without object are plotted in black; those belonging to flights with object are plotted in red. Position 0 is defined as the fly’s position on the trajectory with the object at an angle of 90° in the lateral visual field. The yellow bar marks a 50ms interval before the object is passed; the green bar an interval of 50ms after the object has been passed. (C, I, O) Responses of the FD1 (C), the HSE (I), and the vCH (O) model to a slow flight in a large environment (dB) for one texture condition. Same codes as in subplot B. (D, J, P) Median, quartiles and range of normalized responses to flight conditions with and without objects are shown to quantify response levels and their variability across stimulus conditions. Left: Response levels to all flights without objects at two different velocities, four texture conditions and two environmental conditions. Right: Response levels in the 50ms interval before the object (yellow bars) for all conditions with object. (E, K, Q) Normalized object-inducted response changes before the object has been passed. The responses are averaged over a 50 ms interval before passing the object (yellow bar in former subplots) normalized to responses in the same interval but without object.
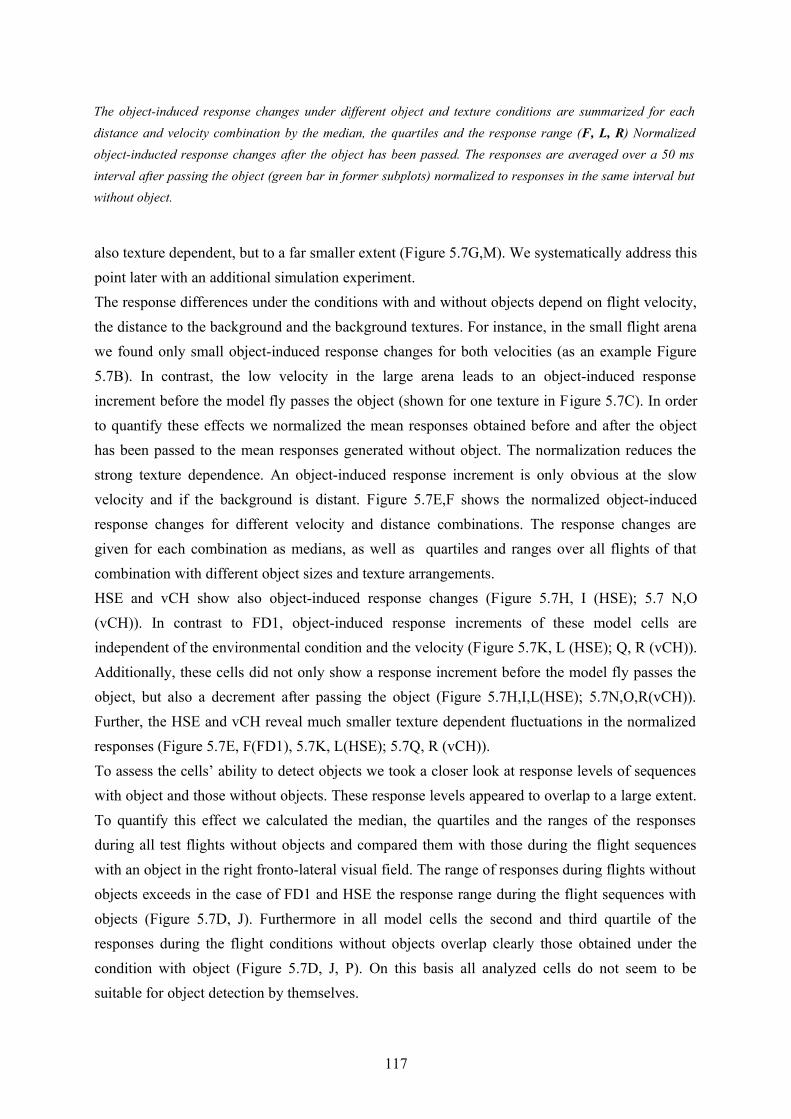
also texture dependent, but to a far smaller extent (Figure 5.7G,M). We systematically address this point later with an additional simulation experiment.The response differences under the conditions with and without objects depend on flight velocity, the distance to the background and the background textures. For instance, in the small flight arena we found only small object-induced response changes for both velocities (as an example Figure 5.7B). In contrast, the low velocity in the large arena leads to an object-induced response increment before the model fly passes the object (shown for one texture in Figure 5.7C). In order to quantify these effects we normalized the mean responses obtained before and after the object has been passed to the mean responses generated without object. The normalization reduces the strong texture dependence. An object-induced response increment is only obvious at the slow velocity and if the background is distant. Figure 5.7E,F shows the normalized object-induced response changes for different velocity and distance combinations. The response changes are given for each combination as medians, as well as quartiles and ranges over all flights of that combination with different object sizes and texture arrangements. HSE and vCH show also object-induced response changes (Figure 5.7H, I (HSE); 5.7 N,O (vCH)). In contrast to FD1, object-induced response increments of these model cells are independent of the environmental condition and the velocity (Figure 5.7K, L (HSE); Q, R (vCH)). Additionally, these cells did not only show a response increment before the model fly passes the object, but also a decrement after passing the object (Figure 5.7H,I,L(HSE); 5.7N,O,R(vCH)). Further, the HSE and vCH reveal much smaller texture dependent fluctuations in the normalized responses (Figure 5.7E, F(FD1), 5.7K, L(HSE); 5.7Q, R (vCH)). To assess the cells’ ability to detect objects we took a closer look at response levels of sequences with object and those without objects. These response levels appeared to overlap to a large extent. To quantify this effect we calculated the median, the quartiles and the ranges of the responses during all test flights without objects and compared them with those during the flight sequences with an object in the right fronto-lateral visual field. The range of responses during flights without objects exceeds in the case of FD1 and HSE the response range during the flight sequences with objects (Figure 5.7D, J). Furthermore in all model cells the second and third quartile of the responses during the flight conditions without objects overlap clearly those obtained under the condition with object (Figure 5.7D, J, P). On this basis all analyzed cells do not seem to be suitable for object detection by themselves.
117
The object-induced response changes under different object and texture conditions are summarized for each distance and velocity combination by the median, the quartiles and the response range (F, L, R) Normalized object-inducted response changes after the object has been passed. The responses are averaged over a 50 ms interval after passing the object (green bar in former subplots) normalized to responses in the same interval but without object.
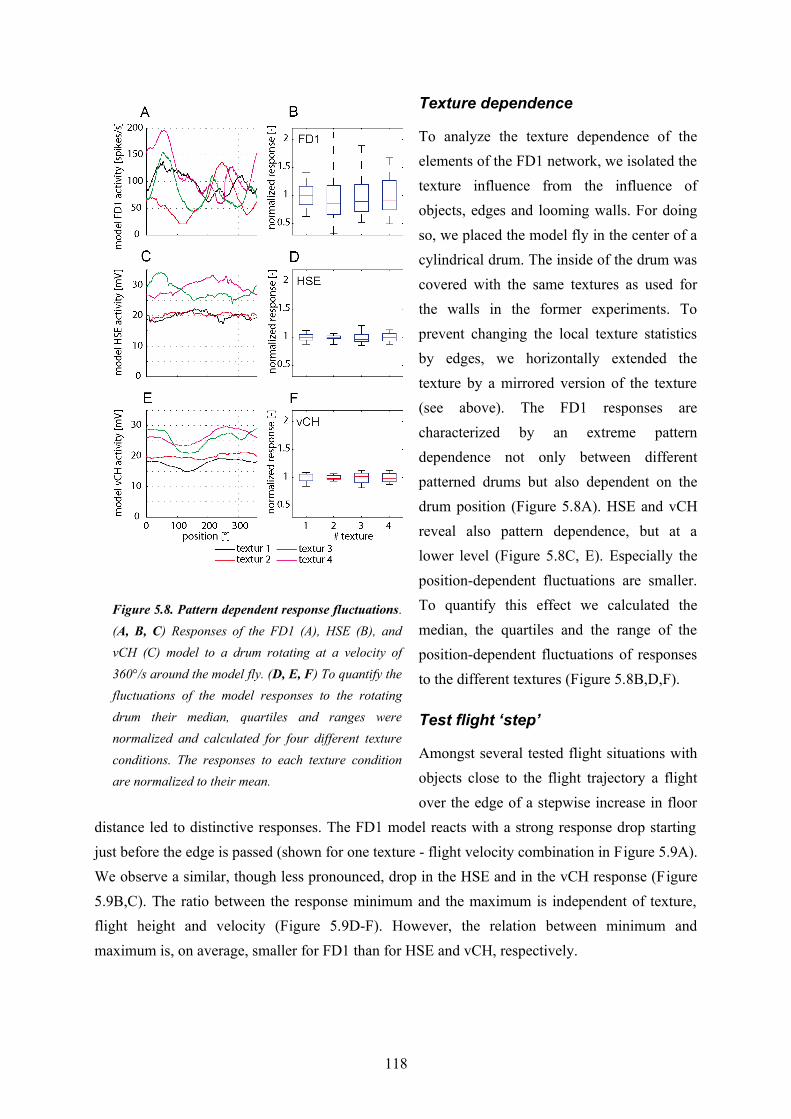
Texture dependence
To analyze the texture dependence of the elements of the FD1 network, we isolated the texture influence from the influence of objects, edges and looming walls. For doing so, we placed the model fly in the center of a cylindrical drum. The inside of the drum was covered with the same textures as used for the walls in the former experiments. To prevent changing the local texture statistics by edges, we horizontally extended the texture by a mirrored version of the texture (see above). The FD1 responses are characterized by an extreme pattern dependence not only between different patterned drums but also dependent on the drum position (Figure 5.8A). HSE and vCH reveal also pattern dependence, but at a lower level (Figure 5.8C, E). Especially the position-dependent fluctuations are smaller. To quantify this effect we calculated the median, the quartiles and the range of the position-dependent fluctuations of responses to the different textures (Figure 5.8B,D,F).
Test flight ‘step’
Amongst several tested flight situations with objects close to the flight trajectory a flight over the edge of a stepwise increase in floor
distance led to distinctive responses. The FD1 model reacts with a strong response drop starting just before the edge is passed (shown for one texture - flight velocity combination in Figure 5.9A). We observe a similar, though less pronounced, drop in the HSE and in the vCH response (Figure 5.9B,C). The ratio between the response minimum and the maximum is independent of texture, flight height and velocity (Figure 5.9D-F). However, the relation between minimum and maximum is, on average, smaller for FD1 than for HSE and vCH, respectively.
118
Figure 5.8. Pattern dependent response fluctuations. (A, B, C) Responses of the FD1 (A), HSE (B), and vCH (C) model to a drum rotating at a velocity of 360°/s around the model fly. (D, E, F) To quantify the fluctuations of the model responses to the rotating drum their median, quartiles and ranges were normalized and calculated for four different texture conditions. The responses to each texture condition are normalized to their mean.
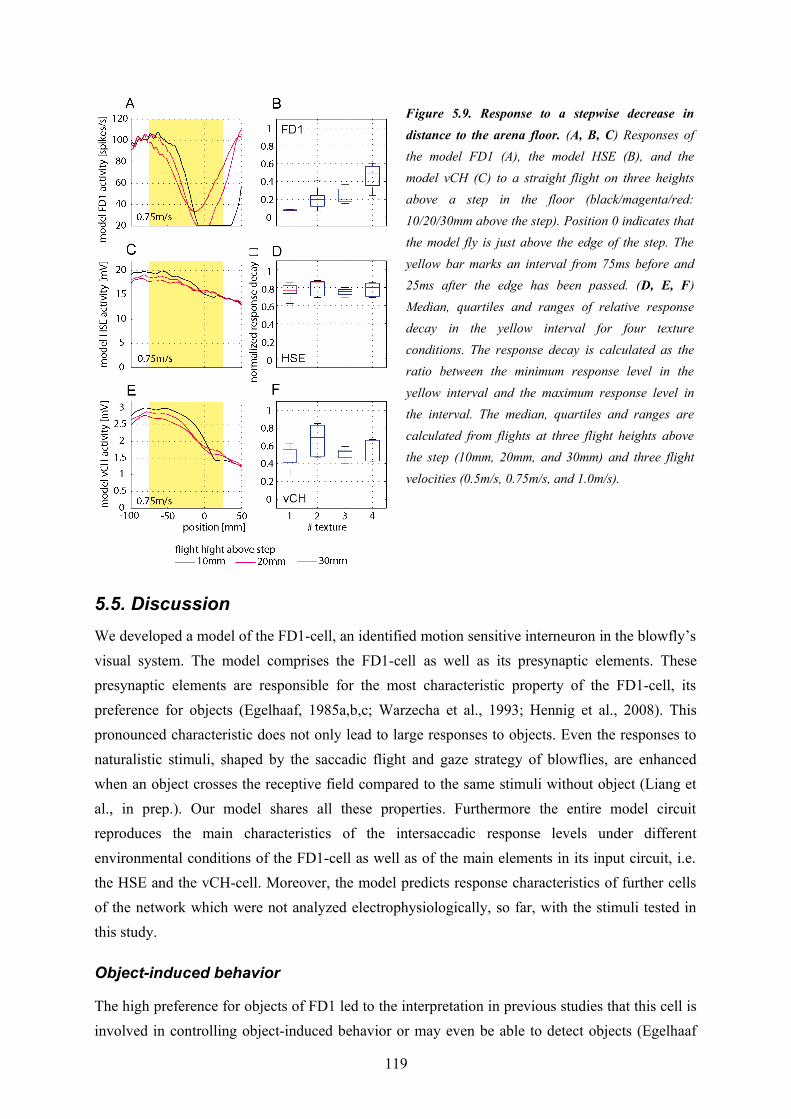
5.5. DiscussionWe developed a model of the FD1-cell, an identified motion sensitive interneuron in the blowfly’s visual system. The model comprises the FD1-cell as well as its presynaptic elements. These presynaptic elements are responsible for the most characteristic property of the FD1-cell, its preference for objects (Egelhaaf, 1985a,b,c; Warzecha et al., 1993; Hennig et al., 2008). This pronounced characteristic does not only lead to large responses to objects. Even the responses to naturalistic stimuli, shaped by the saccadic flight and gaze strategy of blowflies, are enhanced when an object crosses the receptive field compared to the same stimuli without object (Liang et al., in prep.). Our model shares all these properties. Furthermore the entire model circuit reproduces the main characteristics of the intersaccadic response levels under different environmental conditions of the FD1-cell as well as of the main elements in its input circuit, i.e. the HSE and the vCH-cell. Moreover, the model predicts response characteristics of further cells of the network which were not analyzed electrophysiologically, so far, with the stimuli tested in this study.
Object-induced behavior
The high preference for objects of FD1 led to the interpretation in previous studies that this cell is involved in controlling object-induced behavior or may even be able to detect objects (Egelhaaf
119
Figure 5.9. Response to a stepwise decrease in distance to the arena floor. (A, B, C) Responses of the model FD1 (A), the model HSE (B), and the model vCH (C) to a straight flight on three heights above a step in the floor (black/magenta/red: 10/20/30mm above the step). Position 0 indicates that the model fly is just above the edge of the step. The yellow bar marks an interval from 75ms before and 25ms after the edge has been passed. (D, E, F) Median, quartiles and ranges of relative response decay in the yellow interval for four texture conditions. The response decay is calculated as the ratio between the minimum response level in the yellow interval and the maximum response level in the interval. The median, quartiles and ranges are calculated from flights at three flight heights above the step (10mm, 20mm, and 30mm) and three flight velocities (0.5m/s, 0.75m/s, and 1.0m/s).
1985a,c ; Kimmerle and Egelhaaf, 2000a; Kimmerle et al., 2000; Kimmerle et al., 1997). Further studies revealed that the mechanism shaped by the inhibitory structure of the FD1-network is in fact capable of producing a preference for objects that are even smaller than the FD1’s receptive field (Hennig et al., 2008; Borst and Egelhaaf, 1993). A study of Higgins and Pant (2004) showed that an inhibitory network similar to the input circuit of the FD1-cell is also able to mediate target tracking. However, the behavioral role of FD1-cell has not yet been disclosed, although it is very unlikely that it is involved in tracking moving targets (see below).
Predictive power for naturalistic stimulation conditions
None of the former modeling studies on FD1 tried to mimic the cell’s characteristic properties during naturalistic stimulation. They rather targeted object related features with highly simplified models and artificial stimulation. In contrast, we now used more naturalistic stimulation based on fly’s natural flight behavior and, in particular, taking into account the typical dynamical properties of the saccadic flight and gaze strategy of blowflies. We assume our model to have predictive power for naturalistic stimulations conditions for two reasons. (1) Our model FD1 takes into account the inhibition of FD1 via the vCH-cell, as well as major parts of its experimentally established circuitry, including the complex receptive fields and synaptic interactions of the involved cells. (2) Our model FD1 shares the characteristic properties of its biological counter part for artificial as well as for naturalistic stimulation. This holds for properties the model was adjusted to, but also for properties it was not explicitly adjusted to, i.e. the intersaccadic response levels (Figure 5.6). Despite some deviations in the time course of the responses the model mimics the responses of the biological cell in a way that allows us to draw the same conclusion from model and cell responses: A system with these properties is probably involved in controlling object-induced behavior or is even suitable for object detection.
Object detection
Assuming a predictive power of the FD1 model we challenged the model with targeted test flights. Under the well-defined conditions of these tests the model FD1 did not respond to an object close to a straight trajectory with a clear activity increase. Only if the background has a relatively large distance to the model fly and the model fly is flying at a low velocity, we observed a clear object-induced response change. This finding causes doubt on the FD1-cell’s assumed function of being an unambiguous object detector. However, the increased activity under this specific condition is consistent with previous findings on FD1 responses to experimenter-defined stimulation (Kimmerle and Egelhaaf, 2000a). Response increments caused by an object were predominantly found for a stationary or slow moving background pattern. High background velocities led also to a large FD1 activity (Kimmerle and Egelhaaf, 2000a). In our model simulations the HSE and vCH showed also an object-induced response increment. This is astonishing because neither the model HSE- nor the model vCH-cell showed preferences for
120
objects in the simulations testing size dependence of the model responses (Figure 5.4). The object-induced response increment of the HSE is consistent with an analysis based on receiver-operating characteristics of the biological HSE in an object detection task under naturalistic stimulus conditions. The HSE’s sensitivity for objects is only slightly smaller than that of FD1 (Liang et al. in prep). Nevertheless, the FD1 by itself seems not be suitable to detect objects unambiguously.
Pattern dependent response fluctuations
Environmental textures strongly affect the responses of the model FD1-cell (Figure 5.8). Object-induced response changes may be much less conspicuous than texture-induced changes in the time course of the responses. This holds also true for other elements of the network. The texture-induced response changes of HSE and vCH are smaller than those of the FD1-cell, but they might still be stronger than the object-induced changes. The pronounced texture-dependent response fluctuations of FD1 may surprise at first sight. However, scrutinizing the complex receptive field properties of the cells in its input circuit helps to clarify this issue. The excitatory receptive field of FD1 is smaller than that of the inhibitory vCH, but also shifted in its sensitivity maximum (Egelhaaf, 1985b; Egelhaaf et al. 1993; Krapp et al., 2001). The shift between the sensitivity maximum of both cells leads to a phase shift of the response to salient pattern elements moving through the receptive fields. The larger receptive field of vCH leads to a blurring of the response. This aspect is even enlarged by the dendrodendritic interactions between the vCH and the HS-cells (Cuntz et al., 2004; Hennig et al. 2008). The combination of these aspects may explain the high sensitivity of the FD1-cell to the stimulus texture.
Distance coding
Despite the pattern dependence of the model responses, the three-dimensional structure of the environment, including objects, influences the FD1-cell as well as the other elements of the network, though in quite different ways. The intersaccadic response level revealed clear object-induced effects in different environments, but the response level also depends on the distance to the background (Figure 5.6B,G). In contrast to its presynaptic elements the FD1 response changes strongly depending on background distance and on the presence of objects. FD1 responds with large amplitudes if the background is close or a (near) object is present. This might hint at a distance encoding independent of object size. But again, the pronounced texture dependence of the FD1 response will presumably prevent an unambiguous performance in distance encoding.
Potential functional significance
The model FD1 responses elicited by a flight across a step in the floor of the virtual flight arena are also texture dependent. Nonetheless, for all tested texture and flight speeds the model FD1 response drops when the model fly passes the edge of the step. This characteristic response feature
121
might be functionally relevant in the context of landing behavior of blowflies and bees. Both species land preferentially at the edges of salient objects (Kimmerle et al., 1996; Lehrer et at., 1988; Lehrer and Srinivasan, 1993). Whether these response drops are causally related to landing behavior will be a subject of further studies which take into account not only FD1-cells, but the ensemble of large motion sensitive cells in the blowfly visual pathway and analyzes the performance of the system under closed loop conditions. The ensemble of cells involved in object-dependent behavior, such as landing on edges, will presumably include cells in addition to those of the FD1-circuit. In the blowfly lobula plate there reside several cells which are more sensitive to object than to background motion. The FD2, FD3, and FD4 (Egelhaaf 1985b) and further cells described by Gauck and Borst (1999) show also a preference for objects, though they differ in their preferred directions of motion and the location and size of their receptive fields. None of these cells is known to be highly selective to specific features. Other LPTCs are discussed to encode for rotational or translational motion information and were shown to provide some information about spatial parameters during the intersaccadic intervals (Karmeier et al. 2006). None of them seems to provide information about any of these parameters unambiguously and thus, on its own, is likely to provide unambiguous spatial information including object information that is suitable to mediate behaviors such as collision avoidance with obstacles or landing. For most situations in the life of a fly an ensemble of cells encoding information about the three dimensional structure of the surroundings might be more suitable.
Pursuit of small moving targets
In most cases when a collision with objects in a natural environment of a fly needs to be avoided the objects are stationary and may vary tremendously in size and shape. The same is true for objects that serve as landing sites for a fly. When accomplishing other tasks such as when hunting a prey or chasing a potential mate insects are required to detect and pursue extremely small moving objects. In the visual system of hoverflies and dragonflies the small target motion detector neurons (STMD) have been concluded to play a role in such tasks (Nordström and O’Carroll, 2006; Nordström et al., 2006; Barnett et al., 2007; Geurten et al., 2007). The STMD cells differ tremendously from the FD1-cell: they are highly selective to objects of a size smaller than the interommatidial angle, even if they move in front of a cluttered background (Geurten et al., 2007; Nordström et al. 2006). These properties presumably play a role in predatory or chasing behavior. Moreover, males of several fly species are able to pursue small targets, such as a female fly, in the context of mating behavior (Collett and Land, 1975; Wehrhahn 1979; Wehrhahn et al., 1982; Zeil, 1983; Trischler et al., 2010; Boeddeker et al., 2003). This behavior is discussed to be mediated by male-specific visual neurons sensitive to small targets (Gilbert and Strausfeld, 1991; Strausfeld,
122
1991; Wachenfeld, 1994; Trischler et al., 2007)), but not by the FD1-cell that has been characterized in females and is not sufficiently sensitive to extremely small objects.
Operating range of the model
The current model of the FD1-circuit is currently adjusted only to the luminance and contrast conditions of the electro-physiological data that led to the neural data used to adjust the model parameters (Liang et al., in prep; Hennig et al., 2011; Lindemann et al. 2005). Before extending the model to serve as a sensory module in comprehensive fly model and to perform in closed-loop under a broader range of environmental conditions it needs to be adapted to a broader range of light conditions. The nonlinear contrast processing and adaptive processes in the peripheral visual system of flies (Laughlin and Hardie, 1978; Laughlin, 1989; French et al., 1993), so far not included into our model, need to be taken into account. Models of the peripheral visual information processing were implemented in previous studies simulating the responses to patterns with a natural range of luminance and contrast (Mah et al., 2008; van Hateren and Snippe, 2001). When integrated into models of LPTCs or of cells which are sensitive to extremely small objects (STMDs) they enabled these models to perform under a wide range of luminance and contrast conditions (Shoemaker et al., 2005, Wiederman et al., 2008; Brinkworth and C’Carroll, 2009; Brinkworth et al., 2008; Wiederman et al., 2010; Meyer et al., 2011).
5.6. ConclusionsOur model FD1 circuit is in its structure similar to its biological counterpart and mimics its characteristic response properties, which led in previous studies to the conclusion that the FD1-cell represents an object detector. Systematic variations of the three-dimensional environment in virtual test flights of a model fly suggest that neither FD1 nor other cells of its presynaptic network are able to unambiguously detect objects. The responses of all elements of the model circuit are also much affected, though in different ways, by the distance as well as the texture of extended structures in the environment. These response characteristics suggest an encoding of information about three-dimensional environments by a population of cells. Because of its pronounced sensitivity to the spatial layout of the environment, the FD1-cell plays presumably a prominent role in such a cell ensemble.
5.7. AcknowledgmentsWe are grateful to Diana Rien for critically reading drafts of the paper and making helpful suggestions, to Jens Lindemann and Ralf Möller for contributing software, to Hans van Hateren, Jochen Heitwerth and Roland Kern for providing experimental data. This study was supported by the Deutsche Forschungsgemeinschaft (DFG).
123
5.8. LiteratureBarnett, P. D.; Nordström, K. and O'Carroll, D. C. (2007). Retinotopic organization of small-field-target-detecting neurons in the insect visual system. Curr. Biol.17, 569-578.
Boeddeker, N.; Kern, R. and Egelhaaf, M. (2003). Chasing a dummy target: Smooth pursuit and velocity control in male blowflies Proc. R. Soc. Lond. B 270, 393-399.
Borst, A. and Egelhaaf, M. (1993). Processing of synaptic signals in fly visual interneurons selectively responsive to small moving objects. In: eds. Brain theory - spatio-temporal aspects of brain function. Aertsen, A. and Seelen, W. , Elsevier, 47-66.
Borst, A., Reisenman, C., and Haag, J. (2003). Adaptation of response transients in fly motion vision. II: Model studies. Vision Res. 43, 1309-1322.
Borst, A., Haag, J., and Reiff, D. F. (2010). Fly motion vision. Annu. Rev. Neurosci. 33, 49-70
Braun E., Geurten B., and Egelhaaf M. (2010). Identifying Prototypical Components in Behaviour Using Clustering Algorithms. PLoS ONE 5(2), e9361.doi:10.1371/journal.pone. 0009361.
Brinkworth, R. S. A.; Mah, E.-L., Gray, J. P., and O'Carroll, D. C. (2008) Photoreceptor processing improves salience facilitating small target detection in cluttered scenes. J. Vis. 8, 1-17.
Brinkworth, R. S. A. and O'Carroll, D. C. (2009). Robust models for optic flow coding in natural scenes inspired by insect biology. PLoS Comput. Biol. 5(11), e1000555. doi:10.1371/journal.pcbi.1000555.
Collett, T. and Land, M. (1975).Visual control of flight behaviour in the hoverfly Syritta pipiens L. J. Comp. Physiol. 99, 1-66.
Cuntz, H., Haag, J., and Borst, A. (2003). Neural image processing by dendritic networks. Proc Natl Acad Sci . 100, 11082-11085.
Egelhaaf, M. (1985a). On the neuronal basis of figure-ground discrimination by relative motion in the visual system of the fly. I. Behavioural constraints imposed on the neuronal network and the role of the optomotor system. Biol. Cybern. 52, 123-140.
Egelhaaf, M. (1985b). On the neuronal basis of figure-ground discrimination by relative motion in the visual system of the fly. II. Figure-detection cells a new class of visual interneurones. Biol. Cybern. 52, 195-209.
Egelhaaf, M. (1985c). On the neuronal basis of figure-ground discrimination by relative motion in the visual system of the fly. III. Possible input circuitries and behavioural significance of the FD-cells. Biol Cybern. 52, 267-280.
Egelhaaf, M. and Borst, A. (1993). Motion computation and visual orientation in flies. Comp. Biochem. Physiol. 104(4), 659-673.
124
Egelhaaf M. (2006). The neural computation of visual motion information. In: Invertebrate vision, eds. Warrant E. and Nielsson D.E. Cambridge: Cambridge University Press, 399-461.
Egelhaaf, M., Borst, A., Warzecha, A. K., Flecks, S., and Wildemann, A. (1993). Neural circuit tuning fly visual neurons to motion of small objects. II. Input organization of inhibitory circuit elements revealed by electrophysiological and optical recording techniques. J. Neurophysiol. 69, 340-351.
Exner, S. and Hardie, R. (1989). The physiology of the compound eyes of insects and crustaceans: a study (Springer-Verlag).
French., A.S., Korenberg, M.J., Järvilehto, M., Kouvalainen, E., Juusola, M., and Weckström, M. (1993) The dynamic nonlinear behavior of fly photoreceptors evoked by a wide range of light intensities. Biophys. J. 65(2), 832-839.
Gauck, V. and Borst, A. (1999). Spatial response properties of contralateral inhibited lobula plate tangential cells in the fly visual system. J. Comp. Neurol. 406, 51-71.
Geurten, B. R. H., Nordström, K., Sprayberry, J. D. H., Bolzon, D. M., and O'Carroll, D. C. (2007). Neural mechanisms underlying target detection in a dragonfly centrifugal neuron. J. Exp. Biol. 210, 3277-3284.
Gilbert, C. and Strausfeld, N. J. (1991). The functional organization of male-specific visual neurons in flies. J. Comp. Physiol. A 169, 395-411.
Haag, J. and Borst, A. (2002). Dendro-dendritic interactions between motion-sensitive large-field neurons in the fly. J. Neurosci. 22, 3227-3233.
Haag, J. and Borst, A. (2001). Recurrent network interactions underlying flow-field selectivity of visual interneurons. J. Neurosci. 21, 5685-5692.
Hausen, K. (1982b). Motion sensitive interneurons in the optomotor system of the fly. II. The Horizontal Cells: Receptive field organization and response characteristics. Biol. Cybern. 46, 67-79.
Hausen K. (1984). “The lobula-complex of the fly: Structure, function and significance in visual behaviour” In: Photoreception and vision in invertebrates, ed Ali, M. A. (Plenum Press), 523-559.
Hennig, P., Möller, R., and Egelhaaf, M. (2008). Distributed dendritic processing facilitates object detection: a computational analysis on the visual system of the fly. PLoS ONE 3(8), e3092. doi:10.1371/journal.pone.0003092.
Hennig, P., Kern, R., and Egelhaaf, M., (2011). Binocular integration of visual information: a model study on naturalistic optic flow processing. Front. Neural Circuits. 5:4. doi: 10.3389/fncir.2011.00004
Higgins, C. M. and Pant, V. (2004). An elaborated model of fly small-target tracking. Biol Cybern. 91, 417-428.
125
Juusola, M., Weckström, M., Uusitalo, R. O., Korenberg, M. J., and French, A. S. (1995). Nonlinear models of the first synapse in the light-adapted fly retina . J. Neurophysiol. 74, 2538-2547.
Karmeier, K., van Hateren, J.H., Kern, R., Egelhaaf M. (2006). Encoding of naturalistic optic flow by a population of blowfly motion-sensitive neurons. J Neurophysiol. 96(3), 1602-1614
Kimmerle, B., Srinivasan, M. and Egelhaaf, M. (1996). Object detection by relative motion in freely flying flies Naturwiss. 83, 380-381.
Kimmerle, B., Eickermann, J., and Egelhaaf, M. (2000). Object fixation by the blowfly during tethered flight in a simulated three-dimensional environment. J. Exp. Biol. 203, 1723-1732.
Kimmerle, B. and Egelhaaf, M. (2000a). Detection of object motion by a fly neuron during simulated flight. J. Comp. Physiol. A 186, 21-31.
Kimmerle, B. and Egelhaaf, M. (2000b). Performance of fly visual interneurons during object fixation. J. Neurosci. 20, 6256-6266.
Kimmerle, B., Warzecha, A., and Egelhaaf, M. (1997). Objekt detection in the fly during simulated translatory flight. J. Comp. Physiol. A 181, 247-255.
Koch C. (1999). Biophysics of computation. New York, Oxford University Press.
Krapp, H. G., Hengstenberg, R., and Egelhaaf, M. (2001). Binocular contributions to optic flow processing in the fly visual system. J. Neurophysiol. 85, 724-734.
Land, MF. (1997). Visual acuity in insects. Annu. Rev. Entomol. 42, 147-177.
Laughlin, S. B. (1989). The role of sensory adaptation in the retina. J. Exp. Biol. 146, 39-62.
Laughlin, S., and Hardie, R. (1978). Common Strategies for light adaptation in the peripheral visual systems of fly and dragonfly. J. Comp. Physiol. A 128, 319-340.
Lehrer, M. and Srinivasan, M. (1993) Object detection by honeybees: Why do they land on edges? J. Comp. Physiol. 173, 23-32.
Lehrer, M., Srinivasan, M., Zhang, S., and Horridge, G. (1988) Motion cues provide the bee's visual world with a third dimension. Nature 332, 356-357.
Liang, P., Heitwerth, J., Kern R., Kurtz R., and Egelhaaf, M. (in prep.) Visual object detection and distance encoding in three-dimensional environments by a neuronal circuit of the blowfly.
Lindemann, J. P., Kern, R., Michaelis, C., Meyer, P., van Hateren, J. H. and Egelhaaf, M. (2003). FliMax, a novel stimulus device for panoramic and highspeed presentation of behaviourally generated optic flow. Vision Res. 43, 779-791.
126

Lindemann, J. P., Kern, R., van Hateren, J. H., Ritter, H. and Egelhaaf, M. (2005). On the computations analyzing natural optic flow: Quantitative model analysis of the blowfly motion vision pathway. J. Neurosci. 25, 6435-6448.
Mah E. L., Brinkworth R. S., and O'Carroll D. C. (2008). Implementation of an elaborated neuromorphic model of a biological photoreceptor. Biol. Cybern. 98(5), 357-69.
Meyer, G. H., Lindemann J. P., Egelhaaf, M. (2011). Pattern-Dependent Response Modulations in Motion-Sensitive Visual Interneurons – a Model Study. PLoS ONE. accepted for publication.
Nordström, K. and O'Carroll, D. C. (2006). Small object detection neurons in female hoverflies. Proc. Biol. Sci. 273, 1211-1216.
Nordström, K.; Barnett, P. D. and O'Carroll, D. (2006). C. Insect detection of small targets moving in visual clutter. PLoS Biol. 4, e54.
Petrowitz, R., Dahmen, H., Egelhaaf, M., and Krapp, H. G. (2000). Arrangement of optical axes and spatial resolution in the compound eye of the female blowfly Calliphora. J. Comp. Physiol. A 186, 737-746.
Price K. V. (1999). An introduction to differential evolution, In: New Ideas in Optimization eds. Corne, D., Dorigo, M., Glover, F., Dasgupta, D., and Moscato, P. Maidenhead(UK): McGraw-Hill Ltd., 79–108.
Shoemaker, P.A., O’Carroll, D.C., Straw, A.D. (2005). Velocity constancy and models for wide-field visual motion detection in insects. Biol. Cybern. 93, 275-87.
Schilstra, C. and van Hateren J. H. (1998a). Using miniature sensor coils for simultaneous measurement of orientation and position of small, fast-moving animals. J. Neurosci. Methods 83(2), 125-131.
Schilstra, C. and van Hateren, J. H. (1998b). Stabilizing gaze in flying blowflies. Nature 395, 654.
Schilstra, C. and van Hateren, J. H. (1999). Blowfly flight and optic flow. I. Thorax kinematics and flight dynamics. J. Exp. Biol. 202(11), 1481-1490.
Spalthoff, C., Egelhaaf, M., Tinnefeld, P. and Kurtz, R. (2010). Localized direction selective responses in the dendrites of visual interneurons of the fly. BMC Biol. 8, 36.
Storn, R. and Price, K. (1997). Differential evolution - a simple and efficient heuristic for global optimization over continuous spaces. Journal of Global Optimization 11. 341–359.
Strausfeld, N. (1991). Structural organization of male-specific visual neurons in calliphorid optic lobes J. Comp. Physiol. A 169, 379-393.
Trischler, C., Boeddeker, N., and Egelhaaf, M. (2007). Characterisation of a blowfly male-specific neuron using behaviourally generated visual stimuli. J. Comp. Physiol. A 193, 559-572.
127
Trischler C, Kern R and Egelhaaf M (2010). Chasing behaviour and optomotor following in free-flying male blowflies: flight performance and interactions of the underlying control systems. Front. Behav. Neurosci. 4:20. doi: 10.3389/fnbeh.2010.00020.
Tammero, L. F. and Dickinson, M. H. (2002). The influence of visual landscape on the free flight behavior of the fruit fly Drosophila melanogaster. J. Exp. Biol. 205, 327-343.
van Hateren, J. H. and Schilstra C. (1999). Blowfly flight and optic flow. II. Head movements during flight. J. Exp. Biol. 202, 1491–1500.
van Hateren, J. H. and Snippe, H. P. (2001) Information theoretical evaluation of parametric models of gain control in blowfly photoreceptor cells. Vision Res. 41, 1851-1865.
van Hateren, J. H., Kern, R., Schwerdtfeger, G., and Egelhaaf, M. (2005) Function and coding in the blowfly H1 neuron during naturalistic optic flow. J. Neurosci. 25, 4343-4352.
Wachenfeld A (1994). Elektrophysiologische Untersuchungen und funktionelle Charakterisierung männchenspezifischer visueller Interneurone in der Schmeißfliege Calliphora erythrocephala (Meig.). Doctoral dissertation, Universität Köln
Wagner, H. (1986). Flight performance and visual control of flight of the free-flying housefly (Musca domestica). I. Organization of the flight motor. Phil. Trans. R. Soc. Lond. B 312, 527-551.
Warzecha A.-K., Egelhaaf M., and Borst A. (1993). Neural circuit tuning fly visual interneurons to motion of small objects. 1. Dissection of the circuit by pharmacological and photoinactivation techniques. J. Neurophysiol. 69, 329–339.
Wehrhahn, C. (1979). Sex-specific differences in the chasing behaviour of houseflies (Musca) Bio. Cybern. 32, 239-241.
Wehrhahn, C.; Poggio, T. & Bülthoff, H. (1982). Tracking and chasing in houseflies (Musca) Biol.Cybern. 45, 123-130.
Wiederman, S. D., Shoemaker, P. A. and O'Carroll, D. C. (2008). A model for the detection of moving targets in visual clutter inspired by insect physiology. PLoS ONE. 3, e2784.
Wiederman, S. D., Brinkworth, R. S., and O'Carroll, D. C. (2010). Performance of a Bio-Inspired Model for the Robust Detection of Moving Targets in High Dynamic Range Natural Scenes . J of Comput. and Theoretical Nanoscience 7, 911-920.
Zeil, J. (1983). Sexual dimorphism in the visual system of flies: The free flight behaviour of male Bibionidae (Diptera). J. Comp. Physiol. A. 150, 395-412.
128

6. AcknowledgmentsI thank my advisor Martin Egelhaaf for the inspiring discussions, his helpful advises and for making it possible for me to work on this project.
I am grateful to Rafael Kurtz, Norbert Böddeker, Roland Kern, and Jan Grewe for many motivating scientific discussions and to Diana Rien, Ralf Gerdes, Emily Baird, and Nicole Carey for reading drafts of the publications or my thesis and making helpful suggestions.
Christian Spalthoff delivered the template for figure 2-1 and was always supportive in issues with graphics and Illustrator.
I thank Jens Lindemann and Ralf Möller for supporting software packages used in my models and Jens Lindemann and Matthias Schöpfer for configuration and maintenance of the computer clusters used for optimization.
I thank Laura Dittmar, Heike Sieb, Ulrich Beckers, Jochen Heitwerth, and Anne-Katrin Warzecha for being supportive in many ways.
My particular thanks are for my office mate Diana Rien for going with me 'through thick and thin' of our PhD projects. Thank you!
129


