Interstaatliche Hochschule für Technik Buchs NTB FHO Fachhochschule Ostschweiz Observatory: Multi-layer database of Swiss industrial energy demand, savings and investments Prof. Dr. Sabine Sulzer, Rishabh Saxena Prof. Dr. beat Wellig, Marina Saxena
Transcript
Interstaatliche Hochschulefür Technik Buchs
NTB
FHO Fachhochschule Ostschweiz
Observatory: Multi-layer database of Swiss industrial energy demand, savings and investments
Prof. Dr. Sabine Sulzer, Rishabh SaxenaProf. Dr. beat Wellig, Marina Saxena
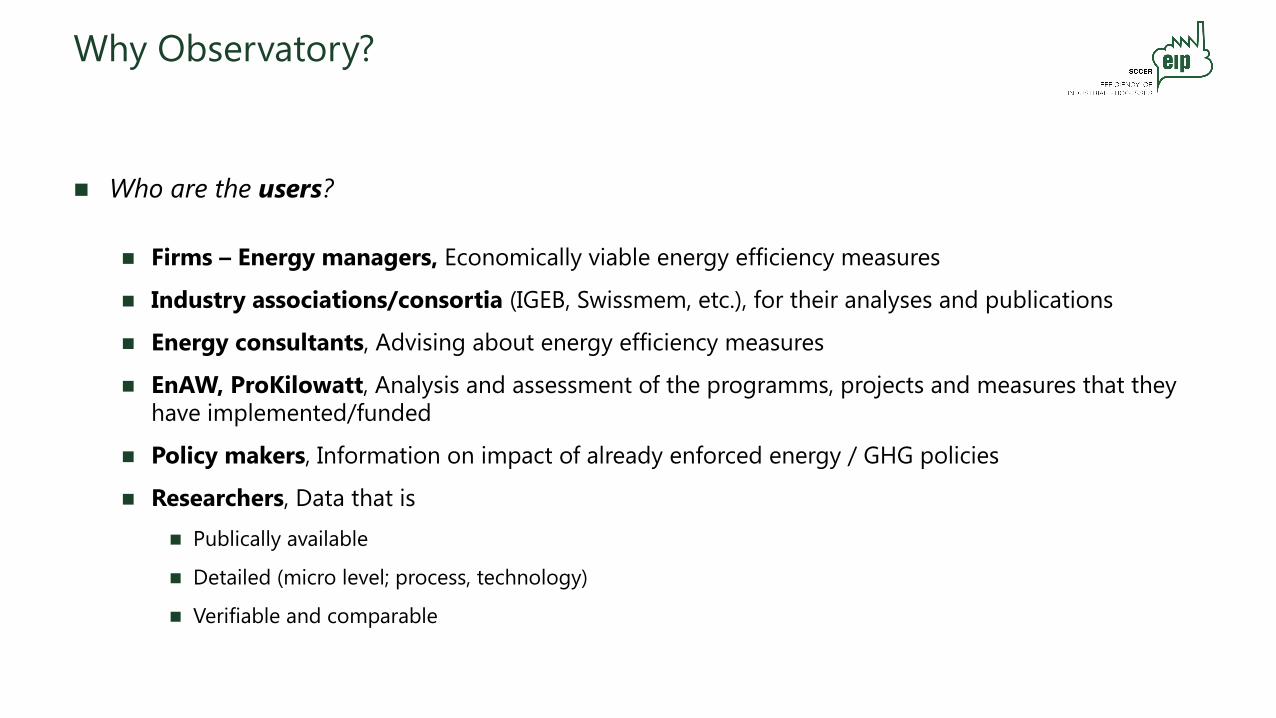
Why Observatory?
n Who are the users?
n Firms – Energy managers, Economically viable energy efficiency measures
n Industry associations/consortia (IGEB, Swissmem, etc.), for their analyses and publications
n Energy consultants, Advising about energy efficiency measures
n EnAW, ProKilowatt, Analysis and assessment of the programms, projects and measures that they have implemented/funded
n Policy makers, Information on impact of already enforced energy / GHG policies
n Researchers, Data that is
n Publically available
n Detailed (micro level; process, technology)
n Verifiable and comparable
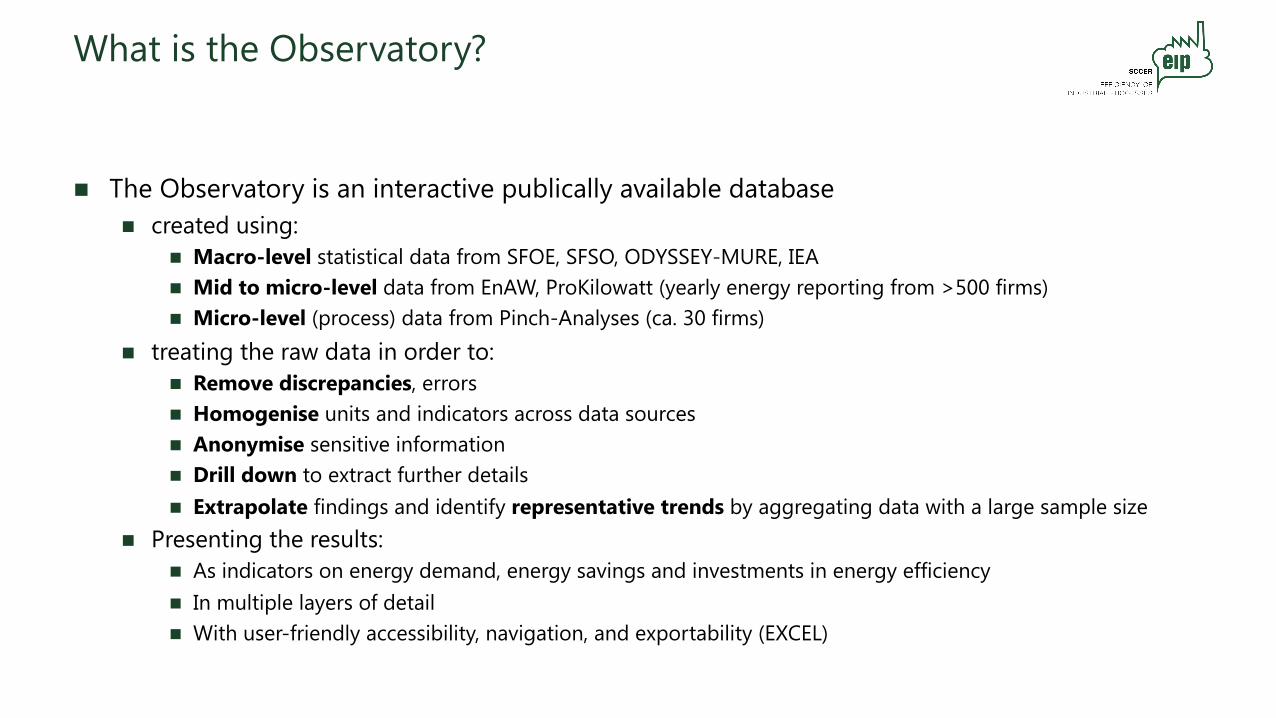
What is the Observatory?
n The Observatory is an interactive publically available database n created using:
n Macro-level statistical data from SFOE, SFSO, ODYSSEY-MURE, IEAn Mid to micro-level data from EnAW, ProKilowatt (yearly energy reporting from >500 firms)n Micro-level (process) data from Pinch-Analyses (ca. 30 firms)
n treating the raw data in order to:n Remove discrepancies, errorsn Homogenise units and indicators across data sourcesn Anonymise sensitive informationn Drill down to extract further detailsn Extrapolate findings and identify representative trends by aggregating data with a large sample size
n Presenting the results:n As indicators on energy demand, energy savings and investments in energy efficiencyn In multiple layers of detailn With user-friendly accessibility, navigation, and exportability (EXCEL)
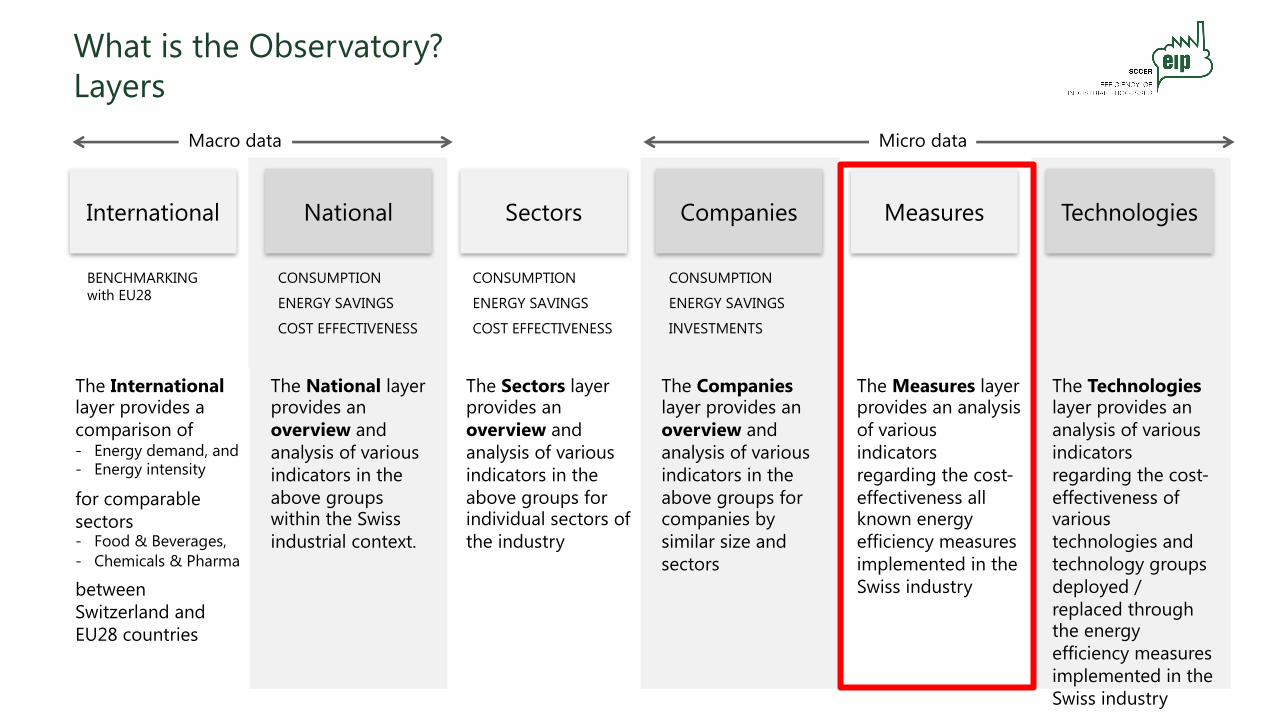
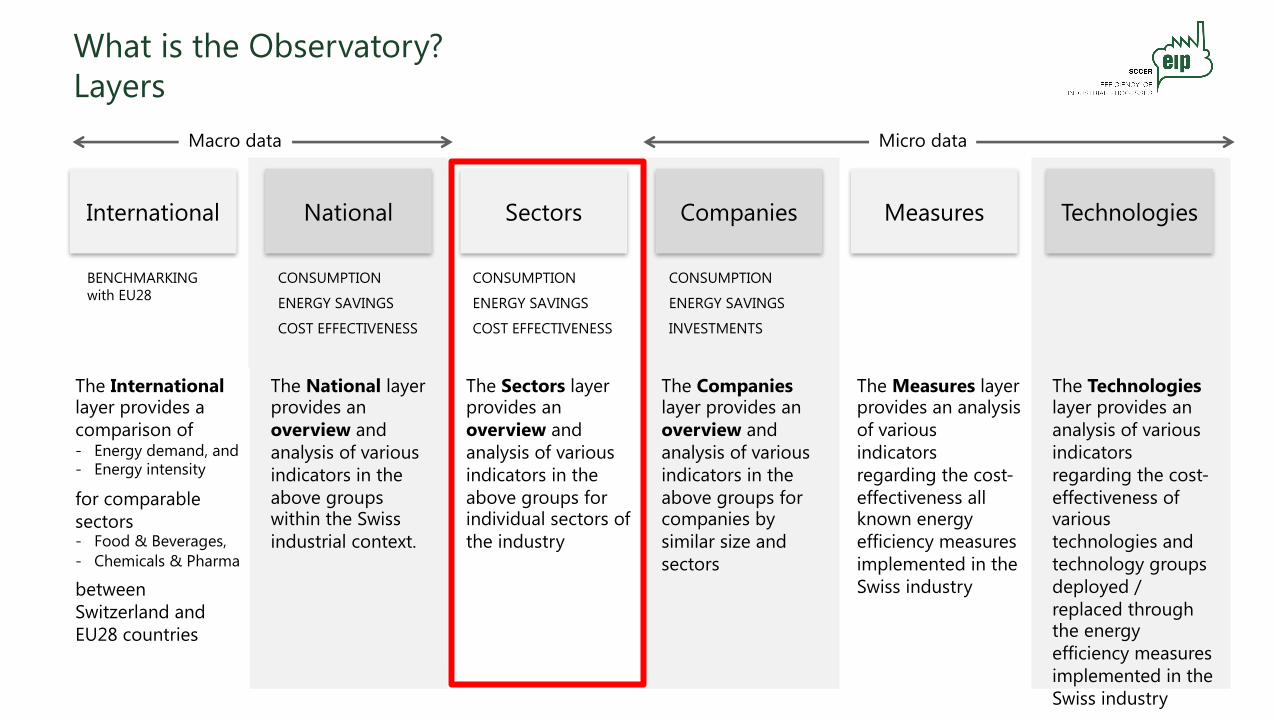
What is the Observatory?Layers
International MeasuresCompaniesSectorsNational Technologies
Macro data Micro data
The Internationallayer provides a comparison of- Energy demand, and- Energy intensity
for comparable sectors- Food & Beverages,- Chemicals & Pharma
between Switzerland and EU28 countries
The National layer provides an overview and analysis of various indicators in the above groups within the Swiss industrial context.
The Sectors layer provides an overview and analysis of various indicators in the above groups for individual sectors of the industry
The Companies layer provides an overview and analysis of various indicators in the above groups for companies by similar size and sectors
The Measures layer provides an analysis of various indicators regarding the cost-effectiveness all known energy efficiency measures implemented in the Swiss industry
The Technologies layer provides an analysis of various indicators regarding the cost-effectiveness of various technologies and technology groups deployed / replaced through the energy efficiency measures implemented in the Swiss industry
CONSUMPTION
ENERGY SAVINGS
COST EFFECTIVENESS
BENCHMARKING with EU28
CONSUMPTION
ENERGY SAVINGS
COST EFFECTIVENESS
CONSUMPTION
ENERGY SAVINGS
INVESTMENTS
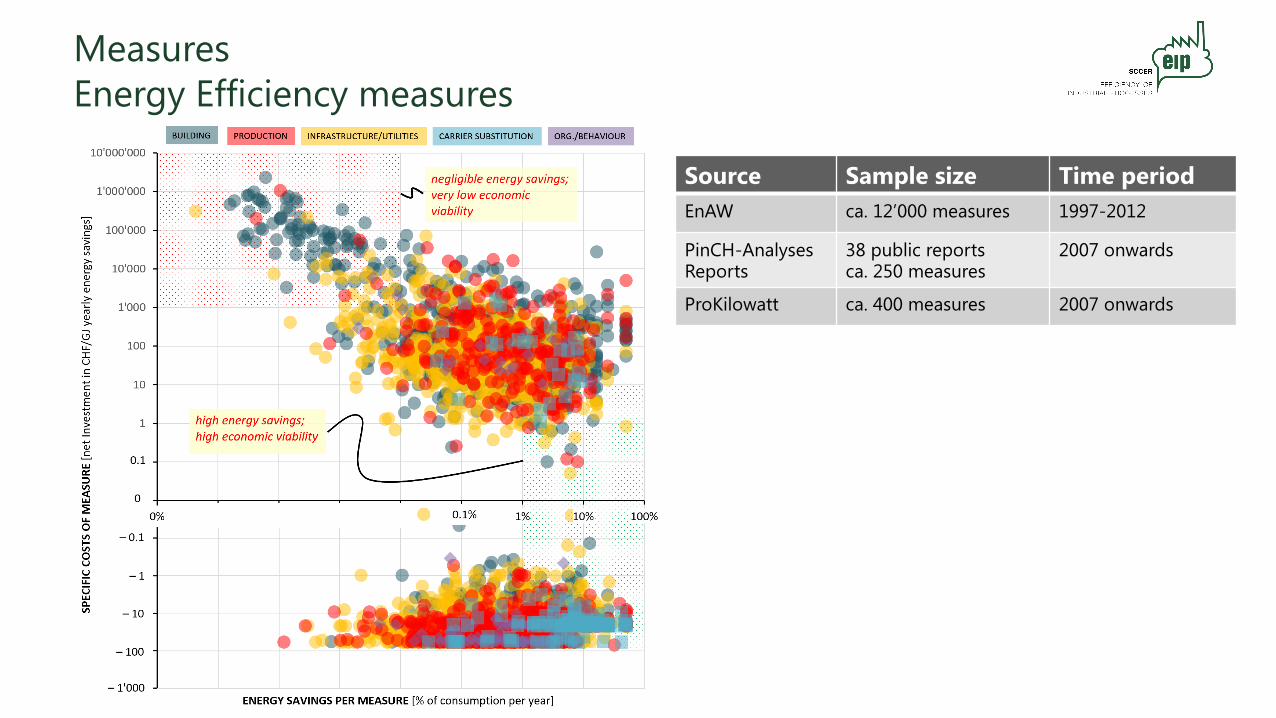
MeasuresEnergy Efficiency measures
Source Sample size Time periodEnAW ca. 12’000 measures 1997-2012
PinCH-AnalysesReports
38 public reportsca. 250 measures
2007 onwards
ProKilowatt ca. 400 measures 2007 onwards
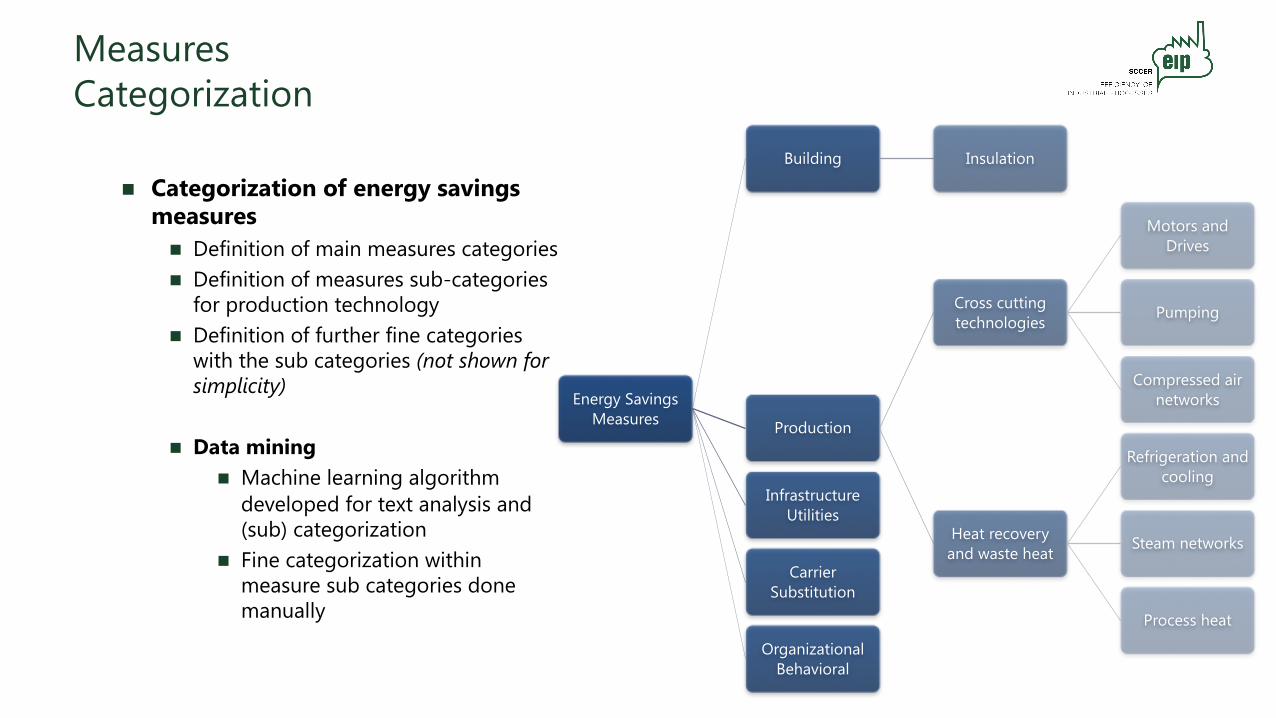
MeasuresCategorization
n Categorization of energy savings measures
n Definition of main measures categoriesn Definition of measures sub-categories
for production technologyn Definition of further fine categories
with the sub categories (not shown for simplicity)
n Data miningn Machine learning algorithm
developed for text analysis and (sub) categorization
n Fine categorization within measure sub categories done manually
Energy Savings Measures
Building Insulation
Production
Cross cutting technologies
Motors and Drives
Pumping
Compressed air networks
Heat recovery and waste heat
Refrigeration and cooling
Steam networks
Process heat
InfrastructureUtilities
Carrier Substitution
OrganizationalBehavioral
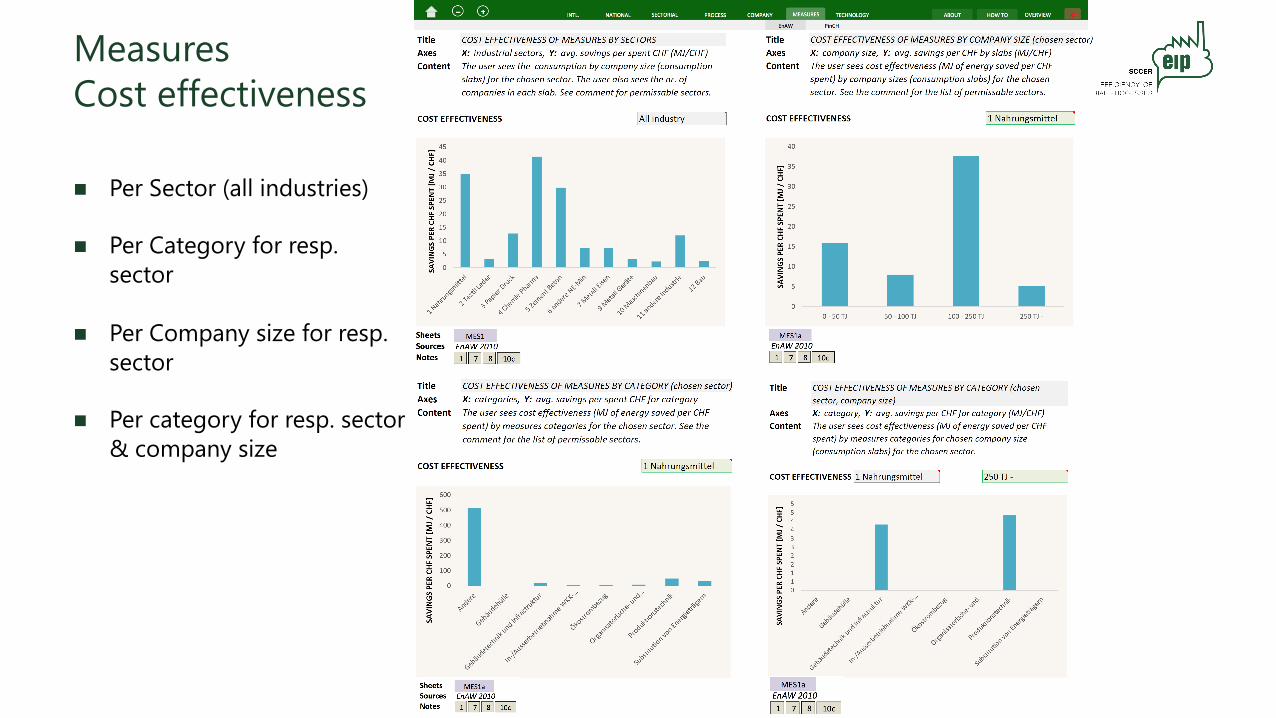
MeasuresCost effectiveness
n Per Sector (all industries)
n Per Category for resp. sector
n Per Company size for resp. sector
n Per category for resp. sector & company size
What is the Observatory?Layers
International MeasuresCompaniesSectorsNational Technologies
Macro data Micro data
The Internationallayer provides a comparison of- Energy demand, and- Energy intensity
for comparable sectors- Food & Beverages,- Chemicals & Pharma
between Switzerland and EU28 countries
The National layer provides an overview and analysis of various indicators in the above groups within the Swiss industrial context.
The Sectors layer provides an overview and analysis of various indicators in the above groups for individual sectors of the industry
The Companies layer provides an overview and analysis of various indicators in the above groups for companies by similar size and sectors
The Measures layer provides an analysis of various indicators regarding the cost-effectiveness all known energy efficiency measures implemented in the Swiss industry
The Technologies layer provides an analysis of various indicators regarding the cost-effectiveness of various technologies and technology groups deployed / replaced through the energy efficiency measures implemented in the Swiss industry
CONSUMPTION
ENERGY SAVINGS
COST EFFECTIVENESS
BENCHMARKING with EU28
CONSUMPTION
ENERGY SAVINGS
COST EFFECTIVENESS
CONSUMPTION
ENERGY SAVINGS
INVESTMENTS
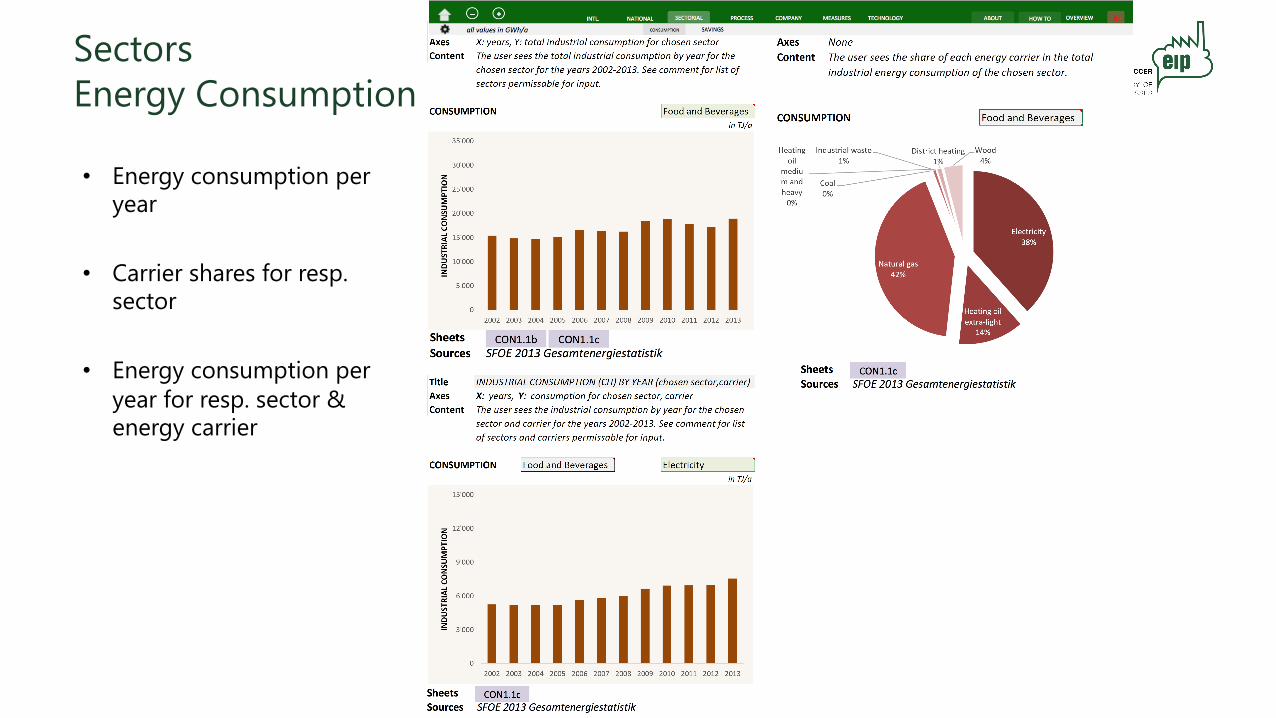
SectorsEnergy Consumption
• Energy consumption per year
• Carrier shares for resp. sector
• Energy consumption per year for resp. sector & energy carrier
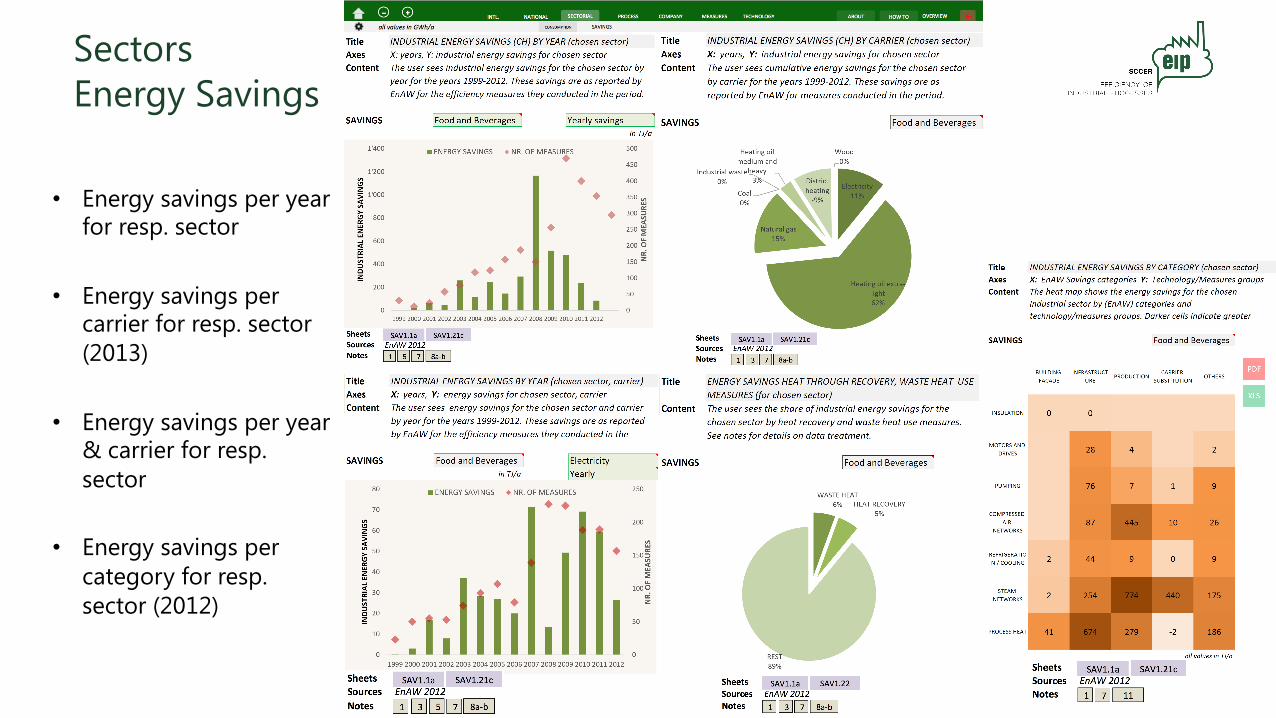
SectorsEnergy Savings
• Energy savings per year for resp. sector
• Energy savings per carrier for resp. sector (2013)
• Energy savings per year & carrier for resp. sector
• Energy savings per category for resp. sector (2012)
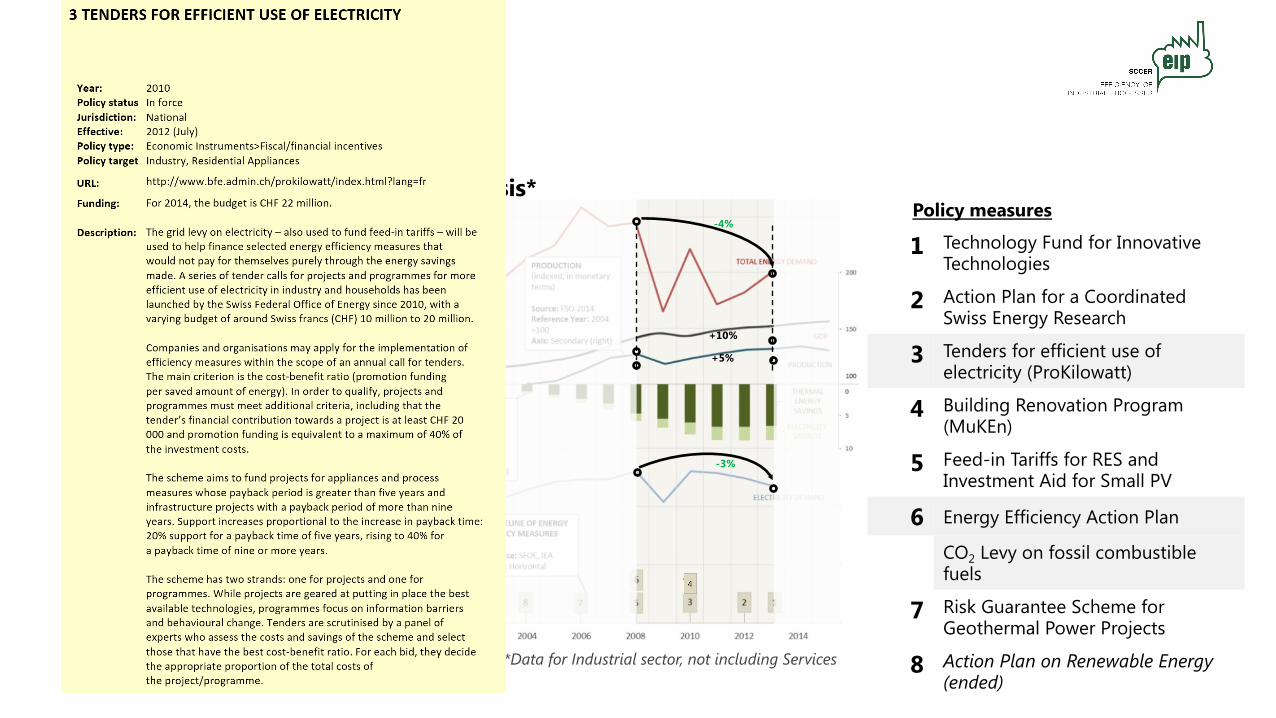
1 Technology Fund for Innovative Technologies
2 Action Plan for a Coordinated Swiss Energy Research
3 Tenders for efficient use of electricity (ProKilowatt)
4 Building Renovation Program (MuKEn)
5 Feed-in Tariffs for RES and Investment Aid for Small PV
6 Energy Efficiency Action Plan
CO2 Levy on fossil combustible fuels
7 Risk Guarantee Scheme for Geothermal Power Projects
8 Action Plan on Renewable Energy (ended)
Policy measures-4%
-3%
+5%
+10%
n Qualitative policy impact analysis*
*Data for Industrial sector, not including Services
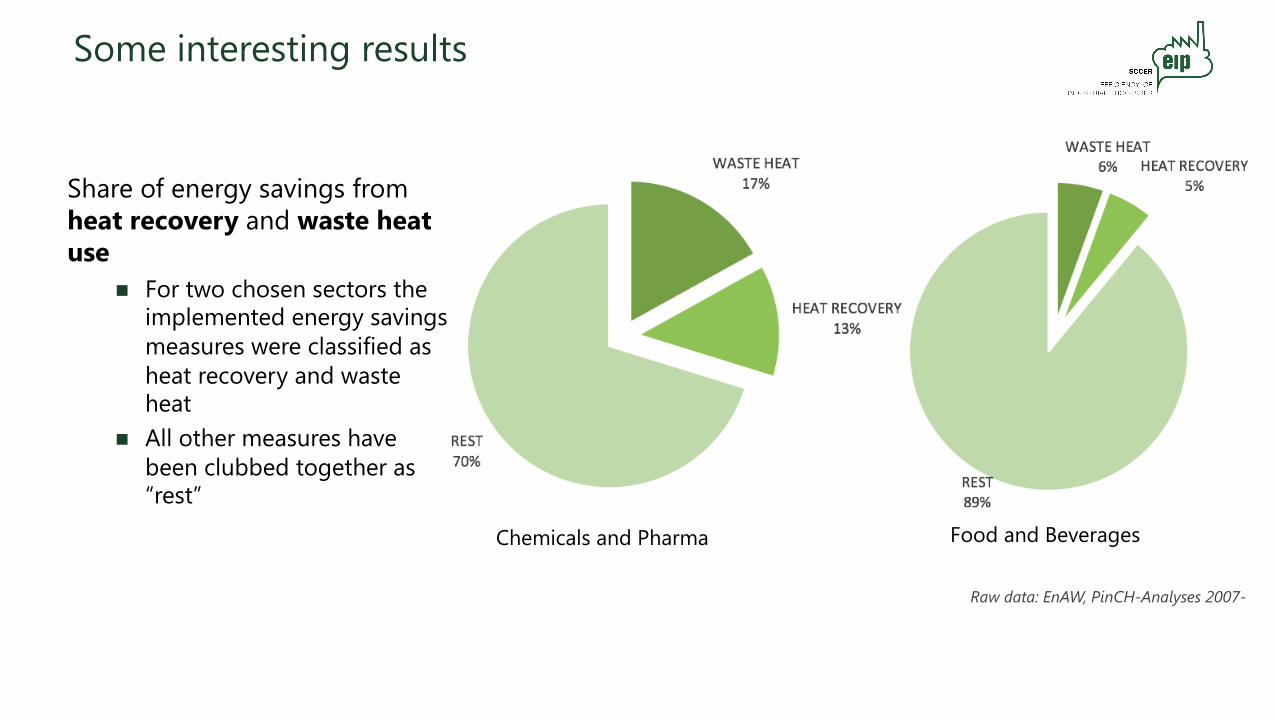
Some interesting results
Some interesting results
Raw data: EnAW, PinCH-Analyses 2007-
Chemicals and Pharma Food and Beverages
Share of energy savings from heat recovery and waste heat use
n For two chosen sectors the implemented energy savings measures were classified as heat recovery and waste heat
n All other measures have been clubbed together as “rest”
Outlook
n Online availabilityn The database (Beta version) is available as of today upon request
n The final version will be released by November 2016
n The final version will be made available to download on several websites
n Maintenancen Frequency of new data being made available is dependent on the data source and data sharing
agreements
n New data will be processed using algorithms already developed and added to the database as and when made available
n A fundamental data structure and a list of indicators to be considered has been established –> in future versions it will only be tweaked
n Error checking and navigation improvements will proceed independent of data acquisition and processing