252
TECHNISCHE UNIVERSITÄT MÜNCHENLehrstuhl für Betriebswirtschaftslehre - Finanzmanagement und Kapitalmärkte
Market Liquidity
An empirical analysis of the impact of the�nancial crisis, ownership structures and insider
trading
Christoph G. Rösch
Vollständiger Abdruck der von der Fakultät für Wirtschaftswissenschaften der Technischen
Universität München zur Erlangung des akademischen Grades eines
Doktors der Wirtschaftswissenschaften
(Dr. rer. pol.)
genehmigten Dissertation.
Vorsitzender: Univ.-Prof. Dr. Martin Grunow
Prüfer der Dissertation: 1. Univ.-Prof. Dr. Christoph Kaserer
2. Univ.-Prof. Dr. Isabell M. Welpe
Die Dissertation wurde am 20.03.2012 bei der Technischen Universität eingereicht und
durch die Fakultät für Wirtschaftswissenschaften am 02.05.2012 angenommen.

Acknowledgements
I am extremely grateful to Deutsche Börse AG and Bundesanstalt für Finanzdi-
enstleistungsaufsicht (BaFin) for granting me access for my research to the Xetra
liquidity measure (XLM) and the directors' dealings data, respectively.
Abstract1
This dissertation provides a solid and in-depth discussion of market liquidity in
the �nancial markets; in particular, it focuses upon the empirical impact of the
�nancial crisis, ownership structures and insider trading on market liquidity.
The empirical analysis uses a volume-weighted spread liquidity measure called
XLM (Xetra liquidity measure) which is a relatively new liquidity measure that
can be extracted from the limit order book of the Xetra trading platform and
measures the order-size-dependent liquidity costs of a roundtrip. Our sample
includes all companies listed in one of the four major German stock indices (DAX,
MDAX, SDAX and TecDAX) during the period from July 2002 until December
2009.
The �rst part of this dissertation examines the dynamics and drivers of market
liquidity during the �nancial crisis. We �nd that market liquidity is impaired when
stock markets decline, implying a positive relationship between market and liq-
uidity risk. This thesis furthermore sheds light on two puzzling features of market
liquidity in the stock market, namely, liquidity commonality and �ight-to-quality.
We observe that liquidity commonality varies over time, increases during market
downturns, peaks at major crisis events and becomes weaker as we look more
deeply into the limit order book. Consistent with recent theoretical models that
argue for a spiral e�ect between the �nancial sector's funding liquidity and an as-
set's market liquidity, we empirically show that funding liquidity tightness induces
an increase in liquidity commonality that then leads to market-wide liquidity dry-
1 The abstract is largely based on Rösch and Kaserer (2010), Rösch and Kaserer (2011) andRösch and Kaserer (2012).
i
Abstract
ups. Therefore we are able to prove that market liquidity can be a driving force
of �nancial contagion. In accord with previous research that proposes a �ight-to-
quality, we demonstrate that there is a positive relationship between credit risk
and liquidity risk, i.e., there is a spread between the liquidity costs of high- and
low-credit quality stocks, and that in times of increased market uncertainty, the
impact of credit risk on liquidity risk intensi�es. This �nding demonstrates that
in times of crisis, investors become increasingly risk-avers and display a preference
for less risky and more liquid instruments.
The second research topic addressed in this dissertation is an analysis of the
relationship between market liquidity and ownership concentration and the ef-
fect of di�erent types of blockholders on stock market liquidity in Germany. For
the overall sample, high ownership concentration is negatively related to market
liquidity. This result is due to an information asymmetry problem, as large share-
holders possess economies of scale in the collection of information or have access to
private, value-relevant information and may trade on this information to extract
the private bene�ts of control. We scrutinized the e�ect of speci�c types of share-
holders on market liquidity. We found that most blockholder types, particularly
insider blockholders, have a deleterious e�ect on market liquidity. However, we
also show that, in contrast, private blockholders and majority strategic blockhold-
ers alleviate the information asymmetry. This e�ect may be due to the fact that
these blockholder types do not have access to private information, cannot lever-
age economies of scale in the acquisition of information, or simply do not engage
in information-based trading, as they are typically long-term investors. Hence,
private, and to some extent strategic, blockholders are able to improve stock mar-
ket liquidity. We are therefore able to show that the often-promulgated tradeo�
between the liquidity bene�ts obtained through dispersed corporate ownership
and the bene�ts from e�cient management control achieved by some degree of
ownership concentration does not hold for all blockholder types.
The last part of this dissertation investigates the impact of reported insider
trading on market liquidity. This relationship is scrutinized for the German mar-
ket both in an event study framework and through a panel data analysis. Overall,
we note that insiders appear to trade on days that are very active, most likely to
hide their information-based trading in higher trading volumes. We discover that
ii
Abstract
the liquidity impact of an insider transaction is highly dependent on the type of
the transaction. Insider purchases impair market liquidity on and after the day
of the insider transaction, whereas insider sales improve market liquidity on and
after the day of the insider transaction. This liquidity impact is due to informa-
tional e�ects, as uninformed market participants price protect against the adverse
selection generated by informed investors. Uninformed market participants use
the share of insider ownership as a proxy for the level of information asymmetry
induced by insiders. This price protection is therefore re�ected in the market liq-
uidity on and after the day of insider purchases. As a consequence, insider sales
alleviate information asymmetry, as the share of insider holdings is decreased;
thus, market liquidity is improved on and after the day of insider sales.
iii
Contents
Abstract i
List of Figures viii
List of Tables x
List of Abbreviations xiv
List of Symbols xvi
1 Introduction 1
1.1 Motivation . . . . . . . . . . . . . . . . . . . . . . . . . . . . . . . 1
1.2 Research questions and contribution . . . . . . . . . . . . . . . . . 8
1.3 Structure of the analysis . . . . . . . . . . . . . . . . . . . . . . . 11
2 Background on market liquidity and market structure 13
2.1 Delimitation of market liquidity . . . . . . . . . . . . . . . . . . . 14
2.2 De�nition of market liquidity . . . . . . . . . . . . . . . . . . . . 16
2.3 Characteristics of market liquidity . . . . . . . . . . . . . . . . . . 22
2.4 Theoretical explanations for the existence of liquidity costs . . . . 25
2.5 Measures of market liquidity . . . . . . . . . . . . . . . . . . . . . 28
2.5.1 Indirect measures . . . . . . . . . . . . . . . . . . . . . . . 28
2.5.2 Direct measures . . . . . . . . . . . . . . . . . . . . . . . . 31
2.6 Introduction to the Xetra Liquidity Measure . . . . . . . . . . . . 37
iv
Contents
2.7 Description of the Xetra market structure . . . . . . . . . . . . . 41
3 Relevant literature on market liquidity and the development of re-
search hypotheses 45
3.1 Market liquidity and the �nancial crisis . . . . . . . . . . . . . . . 46
3.1.1 Liquidity in times of crisis . . . . . . . . . . . . . . . . . . 46
3.1.2 Liquidity commonality . . . . . . . . . . . . . . . . . . . . 49
3.1.3 Flight-to-quality and �ight-to-liquidity . . . . . . . . . . . 53
3.2 Market liquidity and di�erent ownership structures . . . . . . . . 55
3.3 Market liquidity and insider trading . . . . . . . . . . . . . . . . . 60
4 Sample data and descriptive information 67
4.1 Description of sample data sets . . . . . . . . . . . . . . . . . . . 67
4.1.1 Market liquidity and the �nancial crisis . . . . . . . . . . . 68
4.1.1.1 Market liquidity . . . . . . . . . . . . . . . . . . 69
4.1.1.2 Ratings . . . . . . . . . . . . . . . . . . . . . . . 71
4.1.1.3 Index, EONIA and EURIBOR data . . . . . . . . 73
4.1.2 Market liquidity and di�erent ownership structures . . . . 73
4.1.2.1 Market liquidity . . . . . . . . . . . . . . . . . . 74
4.1.2.2 Ownership . . . . . . . . . . . . . . . . . . . . . 76
4.1.3 Market liquidity and insider trading . . . . . . . . . . . . . 77
4.1.3.1 Market liquidity . . . . . . . . . . . . . . . . . . 77
4.1.3.2 Directors' dealings . . . . . . . . . . . . . . . . . 78
4.1.3.3 Insider ownership . . . . . . . . . . . . . . . . . . 79
4.1.4 General control variables . . . . . . . . . . . . . . . . . . . 80
4.2 Descriptive information . . . . . . . . . . . . . . . . . . . . . . . . 83
4.2.1 Market liquidity and the �nancial crisis . . . . . . . . . . . 83
4.2.2 Market liquidity and di�erent ownership structures . . . . 87
4.2.3 Market liquidity and insider trading . . . . . . . . . . . . . 90
5 Empirical analysis 94
5.1 Market liquidity and the �nancial crisis . . . . . . . . . . . . . . . 94
5.1.1 Market liquidity over time - the impact of the �nancial crisis 95
v
Contents
5.1.1.1 A description of the evolution of market liquidity
over time in light of the �nancial crisis . . . . . . 95
5.1.1.2 The impact of the �nancial crisis on our measure
of market liquidity . . . . . . . . . . . . . . . . . 99
5.1.1.3 The impact of market returns on our measure of
market liquidity . . . . . . . . . . . . . . . . . . . 101
5.1.2 Liquidity commonality . . . . . . . . . . . . . . . . . . . . 103
5.1.2.1 Liquidity commonality and the �nancial crisis . . 105
5.1.2.2 Liquidity commonality over time . . . . . . . . . 111
5.1.2.3 Liquidity commonality and the impact of di�erent
order sizes . . . . . . . . . . . . . . . . . . . . . . 115
5.1.2.4 Liquidity commonality and market declines . . . 117
5.1.2.5 Liquidity commonality and funding liquidity . . . 121
5.1.3 Flight-to-quality or �ight-to-liquidity in the stock market . 126
5.1.3.1 Descriptive statistics uncovering the �ight-to-quality128
5.1.3.2 The impact of rating information on market liquidity130
5.1.3.3 The �ight-to-quality - the impact of credit qual-
ity/default probability on market liquidity during
the �nancial crisis . . . . . . . . . . . . . . . . . 131
5.2 Market liquidity and ownership structures . . . . . . . . . . . . . 134
5.2.1 Market liquidity and ownership concentration . . . . . . . 134
5.2.2 Market liquidity and blockholder types . . . . . . . . . . . 137
5.2.3 Robustness tests . . . . . . . . . . . . . . . . . . . . . . . 144
5.2.3.1 Endogeneity . . . . . . . . . . . . . . . . . . . . . 144
5.2.3.2 Disclosure thresholds . . . . . . . . . . . . . . . . 145
5.2.3.3 Further robustness tests . . . . . . . . . . . . . . 146
5.3 Market liquidity and insider trading . . . . . . . . . . . . . . . . . 158
5.3.1 Event study . . . . . . . . . . . . . . . . . . . . . . . . . . 158
5.3.1.1 Theoretical framework for a market liquidity event
study . . . . . . . . . . . . . . . . . . . . . . . . 158
5.3.1.2 Univariate results from the event study . . . . . . 161
5.3.1.3 Panel data analysis for abnormal volume-weighted
spreads from the event study . . . . . . . . . . . 166
vi
Contents
5.3.2 Panel data analysis for the impact of insider trading on
market liquidity . . . . . . . . . . . . . . . . . . . . . . . . 172
5.3.2.1 Market liquidity on the day of the insider transaction172
5.3.2.2 Market liquidity and the di�erent types of insiders
on the day of the insider transaction . . . . . . . 179
5.3.2.3 Market liquidity and the days following the insider
transaction . . . . . . . . . . . . . . . . . . . . . 183
5.3.3 Robustness tests . . . . . . . . . . . . . . . . . . . . . . . 185
6 Summary and conclusion 192
6.1 Concluding remarks . . . . . . . . . . . . . . . . . . . . . . . . . . 192
6.1.1 Main results regarding market liquidity and the �nancial crisis194
6.1.2 Main results regarding market liquidity and ownership struc-
tures . . . . . . . . . . . . . . . . . . . . . . . . . . . . . . 195
6.1.3 Main results regarding market liquidity and insider trading 197
6.2 Outlook . . . . . . . . . . . . . . . . . . . . . . . . . . . . . . . . 198
Bibliography 201
A Appendix - Market liquidity and the �nancial crisis 221
B Appendix - Market liquidity and ownership structures 228
C Appendix - Market liquidity and insider trading 231
vii
List of Figures
2.1 Price impact . . . . . . . . . . . . . . . . . . . . . . . . . . . . . . 20
2.2 Delay costs . . . . . . . . . . . . . . . . . . . . . . . . . . . . . . 21
2.3 Liquidity characteristics . . . . . . . . . . . . . . . . . . . . . . . 23
2.4 The weighted spread as the area between the limit order bid- and
ask-curves . . . . . . . . . . . . . . . . . . . . . . . . . . . . . . . 39
2.5 Largest exchanges by value of share trading in the electronic order
book in 2010 . . . . . . . . . . . . . . . . . . . . . . . . . . . . . . 42
2.6 Xetra continuous trading and auction plan . . . . . . . . . . . . . 43
3.1 Funding and market liquidity spirals . . . . . . . . . . . . . . . . 52
4.1 Overview of German equity indices . . . . . . . . . . . . . . . . . 68
4.2 Rating distribution of sample observations by index . . . . . . . . 72
4.3 Liquidity costs and control variables . . . . . . . . . . . . . . . . . 82
5.1 Volume-weighted spread (XLM) by index . . . . . . . . . . . . . . 96
5.2 Volume-weighted spread (XLM) by volume class . . . . . . . . . . 97
5.3 Liquidity commonality over time . . . . . . . . . . . . . . . . . . 112
5.4 Liquidity commonality over time by di�erent volume classes . . . 114
5.5 Average liquidity commonality by di�erent volume classes . . . . . 116
5.6 Illustration of event and reference period in the event study . . . 160
5.7 Trading volumes on and around the insider transaction day . . . . 164
viii

List of Figures
A.1 Distribution of the liquidity commonality measure by index and
volume class . . . . . . . . . . . . . . . . . . . . . . . . . . . . . . 227
ix
List of Tables
4.1 Liquidity costs L(q) for the impact of the �nancial crisis . . . . . 70
4.2 Liquidity costs L(q) for the impact of ownership structures . . . . 75
4.3 Liquidity costs L(q) for insider trading impact . . . . . . . . . . . 78
4.4 Descriptive statistics of variables for the impact of the �nancial
crisis on market liquidity . . . . . . . . . . . . . . . . . . . . . . . 84
4.5 Variance in�ation factors (VIFs) for the impact of the �nancial
crisis on market liquidity . . . . . . . . . . . . . . . . . . . . . . . 86
4.6 Descriptive statistics of variables for ownership structures and mar-
ket liquidity . . . . . . . . . . . . . . . . . . . . . . . . . . . . . . 88
4.7 Variance in�ation factors (VIFs) for ownership structures and mar-
ket liquidity . . . . . . . . . . . . . . . . . . . . . . . . . . . . . . 89
4.8 Descriptive statistics of variables for insider trading and market
liquidity . . . . . . . . . . . . . . . . . . . . . . . . . . . . . . . . 91
4.9 Variance in�ation factors or insider trading and market liquidity . 93
5.1 The e�ect of the �nancial crisis on market liquidity . . . . . . . . 102
5.2 The impact of market returns on market liquidity: crisis vs. non-crisis104
5.3 Market-wide commonality in liquidity: overall sample . . . . . . . 108
5.4 Market-wide commonality in liquidity: non-�nancial crisis (Jan 1,
2003 - Sep 14, 2008) . . . . . . . . . . . . . . . . . . . . . . . . . 109
5.5 Market-wide commonality in liquidity: �nancial crisis (Sep 15, 2008
- Dec 31, 2009) . . . . . . . . . . . . . . . . . . . . . . . . . . . . 110
x
List of Tables
5.6 The e�ect of index returns on liquidity commonality . . . . . . . . 119
5.7 The e�ect of index and banking sector returns on liquidity com-
monality . . . . . . . . . . . . . . . . . . . . . . . . . . . . . . . . 123
5.8 The e�ect of funding liquidity (measured by the EURIBOR-EONIA-
spread) on liquidity commonality . . . . . . . . . . . . . . . . . . 125
5.9 Descriptive statistics on the e�ect of ratings on stock market liquidity127
5.10 E�ect of rating information on stock market liquidity . . . . . . . 130
5.11 E�ect of credit quality/default probability on stock market liquidity 132
5.12 Di�erent measures of ownership concentration . . . . . . . . . . . 135
5.13 Liquidity costs, ownership concentration and several blockholder
types . . . . . . . . . . . . . . . . . . . . . . . . . . . . . . . . . . 138
5.14 Liquidity costs and several blockholder types . . . . . . . . . . . . 140
5.15 The blockholder size e�ect for strategic blockholders . . . . . . . . 142
5.16 The e�ect of a change in the ownership structure towards a private
blockholder . . . . . . . . . . . . . . . . . . . . . . . . . . . . . . 143
5.17 Impact of disclosure thresholds . . . . . . . . . . . . . . . . . . . 149
5.18 Di�erent measures of ownership concentration - Large volume classes150
5.19 Liquidity costs, ownership concentration and several blockholder
types - Large volume classes . . . . . . . . . . . . . . . . . . . . . 151
5.20 Di�erent measures of ownership concentration - Small volume classes152
5.21 Liquidity costs, ownership concentration and several blockholder
types - Small volume classes . . . . . . . . . . . . . . . . . . . . . 153
5.22 Di�erent measures of ownership concentration - DAX and MDAX 154
5.23 Liquidity costs, ownership concentration and several blockholder
types - DAX and MDAX . . . . . . . . . . . . . . . . . . . . . . . 155
5.24 Di�erent measures of ownership concentration - SDAX and TecDAX156
5.25 Liquidity costs, ownership concentration and several blockholder
types - SDAX and TecDAX . . . . . . . . . . . . . . . . . . . . . 157
5.26 Event study - abnormal liquidity costs around insider transactions 162
5.27 Event study - abnormal liquidity costs around insider transactions 163
5.28 E�ect of the number of insider transactions on abnormal stock mar-
ket liquidity at insider trading days . . . . . . . . . . . . . . . . . 167
xi
List of Tables
5.29 The e�ect of the number of insider transactions on abnormal stock
market liquidity after insider trading days . . . . . . . . . . . . . 170
5.30 The e�ect of the number of insider transactions on cumulative ab-
normal stock market liquidity after insider trading days . . . . . . 171
5.31 The e�ect of the nominals traded by insiders on stock market liquidity173
5.32 The e�ect of the number of insider transactions on stock market
liquidity . . . . . . . . . . . . . . . . . . . . . . . . . . . . . . . . 176
5.33 Market liquidity and insider transactions as a share of insider own-
ership . . . . . . . . . . . . . . . . . . . . . . . . . . . . . . . . . 178
5.34 The e�ect of buy transactions from di�erent types of insiders on
stock market liquidity . . . . . . . . . . . . . . . . . . . . . . . . 180
5.35 The e�ect of sell transactions from di�erent types of insiders on
stock market liquidity . . . . . . . . . . . . . . . . . . . . . . . . 182
5.36 The e�ect of the nominals traded by insiders (lagged) on stock
market liquidity . . . . . . . . . . . . . . . . . . . . . . . . . . . . 184
5.37 The e�ect of the number of insider transactions on stock market
liquidity . . . . . . . . . . . . . . . . . . . . . . . . . . . . . . . . 186
5.38 The e�ect of the nominals traded by insiders on stock market liq-
uidity - small vs. large volume classes . . . . . . . . . . . . . . . . 187
5.39 The e�ect of the number of insider transactions on stock market
liquidity - small vs. large volume classes . . . . . . . . . . . . . . 188
5.40 The e�ect of the nominals traded by insiders on stock market liq-
uidity - SDAX and TecDAX vs. DAX and MDAX . . . . . . . . . 190
5.41 The e�ect of the number of insider transactions on stock market
liquidity - SDAX and TecDAX vs. DAX and MDAX . . . . . . . 191
A.1 Matching of di�erent rating categories . . . . . . . . . . . . . . . 222
A.2 Rating information by company . . . . . . . . . . . . . . . . . . . 223
A.3 The impact of market returns on market liquidity: Crisis vs. non-
crisis . . . . . . . . . . . . . . . . . . . . . . . . . . . . . . . . . . 226
B.1 Di�erent measures of ownership concentration . . . . . . . . . . . 229
B.2 Liquidity costs, ownership concentration and several blockholder
types . . . . . . . . . . . . . . . . . . . . . . . . . . . . . . . . . . 230
xii

List of Tables
C.1 The e�ect of the nominals traded by insiders on stock market liquidity232
xiii
List of Abbreviations
Abbreviation De�nition
AG Aktiengesellschaft - German name for a certain type of
a company with limited liabilities
a.m. Ante meridiem
BaFin Bundesanstalt für Finanzdienstleistungsaufsicht -
�nancial regulatory authority for Germany
bn Billion
bps Basis points
CDS Credit default swap
CET Central European time
CRT Cost of a round trip trade
EEC European Economic Community
EONIA Euro Over Night Index Average
et al. Et alia
ETF Exchange traded fund
EURIBOR Euro Interbank O�ered Rate
GWN Gaussian white noise process
HRE Hypo Real Estate - a German bank
IKB IKB Deutsche Industriebank - a German bank
InsO Insolvenzordnung - German insolvency statute
IPO Initial public o�ering
ISIN International Securities Identi�cation Number
xiv
List of Abbreviations
Abbreviation De�nition
LTCM Long Term Capital Management
mio. Million
NYSE New York Stock Exchange
NASDAQ National Association of Securities Dealers Automated
Quotations
OLS Ordinary least squares
p.m. post meridiem
S.A. Société Anonyme
SIC Standard industrial classi�cation
S&P Standard & Poor's
thsd. Thousand
U.K. United Kingdom
U.S. United States
VIF Variance in�ation factor
WpHG Wertpapierhandelsgesetz - German Securities Trading
Act
XLM Xetra liquidity measure
xv

List of Symbols
Symbol De�nition
a Ask-price
A Vector of regression variables
AAWS Average abnormal volume-weighted spread
α Regression coe�cient
b Bid-price
β Liquidity beta
C Total share of blockholdings
C1 Share of the largest blockholder
C13 Share of the three largest blockholders
C15 Share of the �ve largest blockholders
CAWS Cumulative abnormal volume-weighted spread
CN Number of blockholders
Cov Covariance
d Index d (DAX, MDAX, SDAX, TecDAX)
Dt Dummy variable that represents the sign of the
incoming order (+1 for a buy transaction and −1 for a
sell transaction)
D(q) Delay costs for an order with quantity q
e Event period
ε Stochastic disturbance term
ε Error term
xvi
List of Symbols
Symbol De�nition
γ Price impact measure that measures the return reversal
in response to the previous trading day's order-�ow
shock
h Individual blockholder
HHI Her�ndahl index
i Firm or stock of a �rm i
IQE Total number of insider transactions across all �rms i
and volume classes q
j Order j
k Order k
l Firm or stock of a �rm l
LiqCom Measure of liquidity commonality
L (q) Liquidity costs for an order with quantity q
λ Price impact measure that measures the price impact of
a unit of trade size
m Month
MV Market capitalization
µ (q)n Volume and �rm dependent constant
µ̂ (q) Sample mean of a volume-weighted spread of order
quantity q
n Number of shares of an order or traded in a transaction
ph Percentage share held by the individual blockholder h
P Price
Pmid Mid-price between the bid- and the ask-price
PI (q) Price impact costs for an order with quantity q
φ Regression coe�cient
ψ Fixed liquidity cost coe�cient
q Order quantity in currency units
r Return of an asset
R2 R2 statistic
s Time
Seff. E�ective spread
xvii

List of Symbols
Symbol De�nition
Squo. Quoted bid-ask-spread
Srel. Relative bid-ask-spread
S(q) Search costs for an order with quantity q
SAWS (q) Standardized abnormal volume-weighted spread of order
quantity q
σr Standard deviation of log-returns
σ̂ (q) Sample standard deviation of a volume-weighted spread
of order quantity q
t Time
T (q) Direct trading costs for an order with quantity q
Tn Turnover rate
τ Time period
θ Regression coe�cient
V Traded volume
V O Daily transaction volume (in number of shares)
WS(q) Volume-weighted spread of order quantity q
WS(q)M,i Equal weighted average of the volume-weighted spreads
of all stocks in the market excluding �rm i
x Transaction
X Vector of regression coe�cients
# Number
xviii

Chapter 1Introduction
1.1 Motivation2
Over the course of the last two decades, the �nancial markets worldwide were
struck by several severe liquidity crises. Several of the most prominent examples
of such events were the Asian �nancial crisis in 1997, the collapse of the Long Term
Capital Management (LTCM) hedge fund in 1998, and the most recent �nancial
crisis that was triggered by the downturn in the U.S. sub-prime mortgage market.3
Particularly in the aftermath of the recent �nancial crisis the importance of market
liquidity as a key factor for �nancial stability in the capital markets has been
recognized, and even stressed, and has received a remarkable amount of attention
from researchers, regulators and �nancial institutions. In 1999, recapping a speech
of Myron Scholes4 on the �rst anniversary of the collapse of LTCM, the Economist
(1999) highlighted the relevance of market liquidity:
2 This section is partly based on Rösch and Kaserer (2010), Rösch and Kaserer (2011) andRösch and Kaserer (2012).
3 See Elul (2008).4 Nobel prize laureate and co-founder of LTCM.
1

Chapter 1. Introduction
�The possibility that liquidity might disappear from a market, and
so not be available when it is needed, is a big source of risk to an
investor.�
In addition, only recently, in a review of the current �nancial crisis, Brunnermeier
(2009) rea�rmed the importance of market liquidity in the �nancial markets by
stating that
�a relatively small shock can cause liquidity to dry up suddenly and
carry the potential for a full-blown �nancial crisis�.
As a response to the recent �nancial crisis, regulators also recognized the im-
portant role of market liquidity and revealed several shortcomings in the current
liquidity risk management practice, which led to the revision and development of
several guidelines for liquidity risk management and supervision5, e.g., the �Prin-
ciples for Sound Liquidity Risk Management and Supervision� developed by Basel
Committee on Banking Supervision (2008a) demand that banks
�establish a robust liquidity risk management framework that en-
sures it maintains su�cient liquidity, including a cushion of unencum-
bered, high quality liquid assets, to withstand a range of stress events�
and adjust
�assumptions about the market liquidity of such positions [...] ac-
cording to market conditions or bank-speci�c circumstances�.
5 See, e.g., Basel Committee on Banking Supervision (2008a), Basel Committee on BankingSupervision (2008b) and Basel Committee on Banking Supervision (2010) for guidelines forliquidity risk management and supervision.
2
Chapter 1. Introduction
However, despite the crucial role that market liquidity can play in the �nancial
markets during times of �nancial turmoil6, little is known about the dynamics
and drivers of market liquidity, especially in these market conditions. Therefore,
we seek to address this gap in the literature by focusing on three research topics
centered around market liquidity that should deepen the understanding of market
liquidity in the �nancial markets. In particular, our work contributes to the
existing market liquidity literature by analyzing the properties and roles of market
liquidity during the �nancial crisis, the relationship between market liquidity and
ownership structures and the liquidity impact of insider trading activities.
First of all, we investigate and seek to understand the role of market liquidity
during periods of �nancial distress. This thesis particularly endeavors to address
two puzzling features of market liquidity in the stock market; namely, liquidity
commonality and �ight-to-quality (�ight-to-liquidity). We extend the existing lit-
erature on liquidity commonality, such as Chordia et al. (2000), Hasbrouck and
Seppi (2001), Huberman and Halka (2001), and Brockman and Chung (2002), by
not solely focusing upon giving additional proof of the mere existence of liquidity
commonality but also examining the dynamics and cause of liquidity commonal-
ity in an environment of increased market uncertainty. In our work, we further
empirically analyze recent theories that propose dynamic and spiral interactions
between the �nancial sector's funding liquidity7 and the market liquidity that
can lead to banking crises and market contagion, as described in Brunnermeier
and Pedersen (2009). This analysis should help to prove that market liquidity, by
amplifying �nancial market pro-cyclicality, can be a driving force for the transmis-
6 For a more theoretical discussion on the role of liquidity as a promoter in economic crisis, see,e.g., Bookstaber (2000), and for an analysis and discussion of the more general relationshipbetween business cycles and market liquidity, see, e.g., Næs et al. (2011).
7 Funding liquidity describes the ease with which an investor, a company or a �nancialinstitution can obtain funding.
3
Chapter 1. Introduction
sion of shocks and �nancial contagion. To make our analysis of market liquidity
during crises complete, we explore another phenomenon in market liquidity called
�ight-to-quality, which is also known as the �ight-to-liquidity. This notion essen-
tially states that market liquidity is positively correlated with credit risk and that
investors tend to shift their portfolio towards less risky and more liquid assets in
stressed market scenarios, as discussed in, e.g., Beber et al. (2009). The �ight-to-
quality theory, to the best of our knowledge, was never tested before for the stock
market; therefore, we want to close this gap with this dissertation.8
Second, we examine the relationship between market liquidity and ownership
concentration and the e�ect of di�erent types of blockholders on stock market
liquidity. There is a vast amount of literature that has investigated the e�ect of
blockholders on corporate decision-making, corporate performance and �rm valua-
tion, e.g., Demsetz and Lehn (1985), Holderness and Sheehan (1988), Morck et al.
(1988), Stulz (1988) and Kole (1995).9 Theoretically, blockholders can produce
two distinct e�ects. On the one hand, they can be bene�cial to all of the company's
shareholders, as they mitigate the classic agency problem between management
and shareholders by controlling and monitoring the management, as described, for
example, in Shleifer and Vishny (1986). This e�ect is known as the shared bene�ts
of control. There is empirical evidence that supports the existence of shared ben-
e�ts, see, e.g., Mikkelson and Ruback (1985) and Barclay and Holderness (1991).
On the other hand, blockholders can generate an economic gain by exerting in�u-
ence on a company, often at the expense of small shareholders, an e�ect known
as the private bene�ts of control. There is also empirical evidence supporting the
existence of private bene�ts of control, see, e.g., Barclay and Holderness (1989)
8 Thus far, this stream of research has focused mainly on the bond and CDS markets and oninter-market portfolio re-balancing between stock and bond markets.
9 For a review of literature on blockholder ownership, please see Holderness (2003).
4
Chapter 1. Introduction
and Mikkelson and Regassa (1991). In addition, empirical evidence suggests that
typically both factors are at work and are not mutually exclusive. However, there
have only been a few investigations of the e�ect of ownership concentration and
structures on market liquidity. This topic, therefore, will be one focus of our the-
sis. It appears obvious that a certain degree of ownership dispersion is necessary
for liquid stock markets, as otherwise there would not be investors that are willing
to trade. Therefore, most of the existing literature claims that the monitoring of
blockholders comes at the cost of a decrease in market liquidity. They propagate a
tradeo� between the liquidity bene�ts from dispersed ownership and the bene�ts
from e�cient management control that are achieved by a certain degree of owner-
ship concentration, see for example Bolton and von Thadden (1998), Holmström
and Tirole (1993) and Bhide (1993). These theoretical arguments have also been
backed by certain empirical evidence demonstrating that ownership concentration
impairs market liquidity, see, e.g., He�in and Shaw (2000) and further references
in section 3.2. However, in this dissertation, we want to analyze whether this
tradeo� holds for all types of blockholders or whether there are certain types of
blockholders or blockholder characteristics that actually improve market liquidity.
This information should shed further light on the impact of di�erent ownership
structures and corporate governance mechanisms on stock market liquidity.
Third, it has been acknowledged that information asymmetries have an adverse
e�ect on the e�cient functioning of markets.10 This dissertation aims to further
analyze a fundamental issue of information asymmetry in the �nancial market:
the information asymmetry between insiders11 and uninformed investors. We ex-
10 See, e.g., Akerlof (1970).11 Although the term insider has sometimes been extended to all investors with an informa-
tional advantage, in our study, consistent with Bundesanstalt für Finanzdienstleistungsauf-sicht (BaFin) (2012), we restrict it to members of the management or supervisory boardand other persons with executive duties, who have access to (value-relevant) insider infor-
5
Chapter 1. Introduction
amine whether reported insider transactions are associated with informational ef-
fects that are manifested in market liquidity, as posited by market microstructure
theory.12 Our study uses directors' dealings13 provided by the German Bunde-
sanstalt für Finanzdienstleistungsaufsicht (BaFin) to investigate the impact of
informed trading on the stock market liquidity of the stocks listed on the major
German indices. Insider trading is a topic that has received enormous attention
in law, economics and �nance both in practice and in academia.14 Recently, the
Galleon case, which is deemed to be one of the largest cases of illegal insider
trading in the U.S., has caused quite a stir in media and business. Considerable
resources have been devoted to establishing and enforcing legal restrictions for
insider trading15, e.g., in Germany, insider trading restrictions came into e�ect
in 1994 through the Securities Trading Act (Wertpapierhandelsgesetz � WpHG),
which implemented the European Community Insider Trading Directive (Council
Directive 89/592/EEC of November 13, 1989). Numerous research papers have
focused on discussing the advantages and disadvantages of insider trading regula-
tions from di�erent perspectives. First and foremost, Bainbridge (2000) provides
a comprehensive summary of the major arguments for and against insider trad-
ing restrictions. Those researchers in favor of insider trading restrictions at least
partially justify these restrictions with the hypothesis that insider trading cre-
mation, along with their spouses, registered civil partners, dependent children and otherrelatives living with them in the same household.
12 See, e.g., O'Hara (1997).13 The linguistic usage of the terms `directors' dealings' and `insider trading' is somewhat am-
biguous. In the colloquial language used most of the time, the term `insider trading' refersto both illegal and legal transactions conducted by corporate insiders in their company'sown shares, whereas the term `directors' dealings' refers to legal reported transactions bycorporate insiders. In this study, we strictly use the terms `insider trading' and `directors'dealings' synonymously, referring to legal, publicly reported insider transactions.
14 A good overview of the discussion on the merits of insider trading can be found in Leland(1992).
15 See, e.g., Bhattacharya and Daouk (2002) for a summary of the existence and the enforce-ment of insider trading laws thoughout the world.
6
Chapter 1. Introduction
ates an adverse selection problem that impairs stock market liquidity.16 This
prominent argument is backed by theoretical models in the literature on market
liquidity, which showed that, due to the adverse selection problem from informed
traders, uninformed market participants will increase the spreads, which leads to
poorer market liquidity, to compensate for the expected losses to these privately
informed traders.17 This can be linked to the impact of insider trading on market
liquidity, as evidence and widespread belief suggest that insiders have access to
price-sensitive information and are therefore well informed about the fundamen-
tal value of the security.18 Hence, an observed insider trade can essentially have
two fundamental motivations: insiders can either trade on value-relevant private
information, or they, like any other market participant, can trade for liquidity
reasons. Therefore, one would expect that uninformed market participants price
protect against the perceived information risk induced by insider transactions to
compensate for the expected losses. However, there have only been a few empir-
ical research investigations into the e�ect of insider trading activity on market
liquidity, and the empirical results in the existing literature are ambiguous, as
discussed in section 3.3. Most of this ambiguity might be explained by the fact
that much of the previous research fails to distinguish between insider purchases
and sales. However, in this dissertation, we are able to separately analyze the
e�ect of insider purchases and sales on market liquidity. We further seek to link
our results on insider trading to our research on the relationship between insider
16 See, e.g., Georgakopoulos (1993).17 See, e.g., Copeland and Galai (1983), Glosten and Milgrom (1985) and Easley and O'Hara
(1987) for theoretical work on the adverse selection component and section 2.4 for a discus-sion of all three basic theoretical determinants or sources of friction that in�uence marketliquidity costs.
18 Existing research that con�rms that insiders are able to earn abnormal returns when tradingin their own company's securities and therefore fail to provide support for the strong-form market e�ciency hypothesis, suggests that they trade on non-public value-relevantinformation, see, e.g., Ja�e (1974), Finnerty (1976), Demsetz (1986) and Seyhun (1986).
7
Chapter 1. Introduction
ownership and market liquidity (see above), as uninformed market participants
appear to use the share of insider ownership as a proxy for the level of information
asymmetry induced by insiders.
In summary, market liquidity attracted increasing attention from both aca-
demics and market paricipants in recent years. Despite the considerable attention
devoted to liquidity, little is known about the role and impact of market liquid-
ity in times of crisis, and there are only a few, surprisingly diverse perspectives
regarding the impact of ownership structures and insider trading on market liq-
uidity. The motivation for our analysis of market liquidity is to shed light on these
questions.
1.2 Research questions and contribution19
This section summarizes the main research questions of this dissertation. This
thesis seeks to deepen the understanding of the properties, role and impact of
market liquidity in the �nancial markets. Our main focus is on the dynamics
and the drivers of market liquidity during the �nancial crisis, the relationship
between market liquidity and ownership concentration, the e�ect of di�erent types
of blockholders on liquidity and the liquidity impact of the trading activity of
insiders. In particular, we will cover the following research questions during the
course of this dissertation:
1. What is the role of market liquidity during periods of �nancial distress?
a) Is market liquidity time-varying? Is market liquidity a�ected by market
downturns?
19 This section is partly based on Rösch and Kaserer (2010), Rösch and Kaserer (2011) andRösch and Kaserer (2012).
8
Chapter 1. Introduction
b) Is the individual market liquidity of an asset a�ected by system-wide
interactions, i.e., does liquidity commonality exist? Is liquidity com-
monality time-varying and a�ected by the �nancial crisis? What are
the drivers of liquidity commonality?
c) Can the theoretical concept of funding and market liquidity spirals pro-
posed by Brunnermeier and Pedersen (2009) be empirically validated?
d) Do external rating agencies help to alleviate the information asymmetry
in the market, and is this e�ect manifested in market liquidity? Is there
a link between credit risk and market liquidity? Does the liquidity
phenomenon of �ight-to-quality or �ight-to-liquidity exist in the stock
market?
2. Is there a relationship between ownership concentration or di�erent types
of blockholders and stock market liquidity?
a) How is ownership concentration linked to market liquidity?
b) Do di�erent types of blockholders, i.e., insiders, strategic investors,
�nancial investors and private investors, a�ect stock market liquid-
ity di�erently? How are the access to and the use of value-relevant
information a�ecting market liquidity? Therefore, how are di�erent
ownership structures and corporate governance mechanisms impacting
market liquidity?
3. Do insider transactions have an impact on market liquidity?
a) Are reported insider transactions associated with informational e�ects
that are manifested in market liquidity, as posited by market mi-
crostructure theory?
9
Chapter 1. Introduction
b) Do insider sales and insider purchases a�ect market liquidity di�er-
ently?
On the basis of the general research questions presented above, we formulate
testable hypotheses in Chapter 3 and empirically analyze these hypotheses using
a highly representative data set of daily liquidity data for the sample period of
July 2002 until December 2009 for the German market. In contrast to the existing
literature on market liquidity, which largely focuses on the bid-ask spread or other,
less precise market liquidity proxies, to assess liquidity costs, we use a volume-
weighted spread liquidity measure20 called XLM (Xetra liquidity measure), which
is provided by Deutsche Börse. XLM is a relatively new liquidity measure that
can be extracted from the limit order book of the Xetra trading platform and
that measures the order-size-dependent liquidity costs of a roundtrip. The use of
this order-size-dependent, volume-weighted spread measure gives us new insights
into market liquidity and enables us to demonstrate that our presented liquidity
e�ects hold for the whole depth of the limit order book.21
To the best of our knowledge, there has been no research in the �eld of market
liquidity using such a sophisticated liquidity measure and taking such a holistic
view of dynamics, drivers and phenomena. We add to the existing literature by
clarifying the impact of insider trading, ownership structures and corporate gov-
ernance mechanisms on stock market liquidity. These �ndings contribute to a
better understanding of the impact, role and behavior of stock market liquidity
in crisis scenarios and thereby provide additional insight into the characteristics
20 For an overview on the liquidity literature and the di�erent liquidity measures, see, e.g.,Amihud et al. (2005) and section 2.5.
21 This is especially interesting as our last two main research questions focus on the adversesection component of liquidity costs (see section 2.4) and Glosten and Harris (1988) �ndthat the importance of the adverse selection component rises with trade size.
10
Chapter 1. Introduction
of market liquidity risk. These insights should be especially helpful for institu-
tional investors, exchange o�cials, �nancial regulators, supervisory bodies and
risk management practitioners in the context of a sophisticated risk management
approach.
1.3 Structure of the analysis
In this section, we will provide a brief overview of the structure of this dissertation.
This chapter includes the motivation, the research questions and the contribu-
tion of this thesis as well as a description of its structure. The remainder of this
dissertation is organized as follows.
Chapter 2 introduces the foundational knowledge and basic principles underly-
ing market liquidity. We clearly delimit the di�erent meanings of liquidity that
can be found in the existing literature and provide a detailed de�nition of market
liquidity in the context of this dissertation. This de�nition is followed by a descrip-
tion of key characteristics and associated theoretical concepts regarding liquidity,
as well as a presentation of existing liquidity measures. We then provide a de-
tailed introduction to the liquidity measure known as the Xetra liquidity measure
(XLM), which will be the basis of our empirical analysis as well as a description
of the associated electronic trading platform operated by Deutsche Börse called
Xetra.
In Chapter 3, we provide an overview of the existing literature about market
liquidity that relates to the three main research questions that we presented in
section 1.2. Furthermore, we will derive testable research hypotheses based upon
our main research questions.
Chapter 4 introduces our datasets in great detail, including a description of all of
11

Chapter 1. Introduction
our di�erent variables. We further give an overview of the descriptive statistics of
our data sets and present the average daily liquidity costs for di�erent order sizes
for our sample stocks, which gives �rst insights on the magnitude and variance of
liquidity costs and liquidity risk in the German market.
Chapter 5 is dedicated to the empirical analysis of our three main research
questions and, more explicitly, the test of our more detailed research hypotheses.
We discuss and interpret our empirical results and provide several robustness tests
that support our �ndings.
In Chapter 6, we will sum up our work with a conclusion and provide an outlook
for avenues for further research in adjacent areas of market liquidity.
12

Chapter 2Background on market liquidity and
market structure
This chapter provides foundational knowledge regarding market liquidity and es-
tablishes the basic principles used in our later discussions. As Goodhart (2008)
put it,
�the word liquidity has so many facets that it is often counter-
productive to use it without further and closer de�nition.�
Therefore, we �rst clearly delimit the di�erent meanings of liquidity by providing
an overview of what is implied by the term �liquidity� in the literature. After hav-
ing di�erentiated market liquidity from other liquidity terms, we o�er a detailed
de�nition of market liquidity. We then present characteristics of market liquidity
and discuss the theoretical explanation for the existence of liquidity costs. Further-
more, we summarize several di�erent concepts of market liquidity measurement
and discuss the de�nitions, properties and characteristics of each concept. To
conclude the discourse upon the foundations of market liquidity, we introduce our
liquidity measure, known as the Xetra liquidity measure (XLM), in great detail,
13
Chapter 2. Background on market liquidity and market structure
and thoroughly explain the construction of this liquidity measure. Finally, we
introduce the market model of the Xetra, which is the electronic trading platform
that we focus upon in our research.
2.1 Delimitation of market liquidity
Before we de�ne market liquidity, we need to �rst of all clearly delimit it from
other liquidity de�nitions, as the term liquidity is commonly used in at least three
di�erent contexts, which we will now brie�y discuss:
� First, liquidity can refer to a macroeconomic perspective on liquidity that fo-
cuses on the monetary liquidity of whole economies and is also often known
as global liquidity. Recently, monetary liquidity and its impact on other
macroeconomic factors, e.g., in�ation, long-term real interest rates, risk pre-
miums and cross-border �ows, has attracted a lot of attention, especially in
media and politics. However, there is no unique and widely accepted de�-
nition for this macroeconomic liquidity, although most of the o�ered de�ni-
tions center around the di�erent categories of the money supply of individual
countries and monetary aggregates across major economies.22
� Second, in corporate �nance, liquidity often refers to the funding liquidity of
companies, especially �nancial institutions. There are several de�nitions for
funding liquidity. The International Monetary Fund (2008) describes fund-
ing liquidity as �the ability of a solvent institution to make agreed-upon
payments in a timely fashion�. The Basel Committee on Banking Supervi-
sion (2008a) de�nes funding liquidity as �the ability to fund increases in as-
22 See, e.g., Baks and Kramer (1999), Clark and Polak (2004) and Rü�er and Stracca (2006).
14
Chapter 2. Background on market liquidity and market structure
sets and meet obligations as they come due, without incurring unacceptable
losses�. Summarizing this, we can therefore essentially conclude that liquid-
ity of this type has two dimensions: timing and funding capacity, i.e., the
ease of obtaining �nancing23 of cash�ows to settle obligations. According
to the German insolvency statute (Insolvenzordnung (InsO)), illiquidity24
is, in addition to over-indebtedness25 (the going concern value of the assets
falls below the value of the obligations), one reason for the insolvency of a
company.
� Third, liquidity can refer to the trade characteristics of an asset, and is
frequently termed asset or market liquidity if used in this context. In brief,
market liquidity or asset liquidity describes the marketability or ease of
trading an asset (see, e.g., Longsta� (1995)). A more applied de�nition
speci�es market liquidity as the cost of trading an asset relative to its fair
value (see, e.g., Dowd (2001) and Amihud and Mendelson (2006)).
Despite the clear distinctions between these three forms of liquidity, these three
concepts are also closely intertwined, albeit in a rather complex way. This disser-
tation primarily focuses on market liquidity. However, in section 5.1.2.5, we will
also discuss the nexus between funding and market liquidity. We will elaborate
upon the de�nition of market liquidity in the next subsection.
23 See Brunnermeier and Pedersen (2009).24 � 17 InsO.25 � 19 InsO.
15

Chapter 2. Background on market liquidity and market structure
2.2 De�nition of market liquidity
From the brief description above, we can already see that market liquidity is
a complex and often elusive concept. According to Crockett (2008), �liquidity
is easier to recognize than to de�ne�. Despite this statement, we try to give a
de�nition of market liquidity in the following paragraphs, which should serve as
a foundation for the remainder of our work.
As we already stated above, in general, market liquidity or asset liquidity de-
scribes the marketability or ease of trading an asset (see, e.g., Longsta� (1995)).
To make this concept of marketability or ease of trading more accesible, we will
provide more concrete de�nitions.
Early de�nitions of asset or market liquidity are centered upon an asset's ability
to be (quickly) converted into cash or another asset without a loss of value. An
asset is therefore said to be liquid if it can be easily bought or sold. A consequence
of these de�nitions of asset liquidity is that cash is one of the most liquid assets. Of
the more standardized assets that are continuously traded on regulated �nancial
markets, investments in instruments such as, e.g., stocks, bonds or futures are
considered to be more liquid than investments in, e.g., real estate or rare art. This
rather simple de�nition provides an initial practical impression of what market
liquidity means and permits broad di�erentiation between the liquidity of di�erent
asset categories: however, it fails to distinguish either between the liquidity of
di�erent assets of the same asset category (e.g., the liquidity of di�erent DAX
stocks traded on Xetra) or between the liquidity of di�erent markets for the same
asset.
We will now further develop the de�nition of market liquidity. According to
one of the �rst de�nitions of a liquid market by Black (1971),
16
Chapter 2. Background on market liquidity and market structure
�a liquid market is a continuous market, in the sense that almost any
amount of stock can be bought or sold immediately; and an e�cient
market, in the sense that small amounts of stock can always be bought
or sold very near the current market price, and in the sense that large
amounts can be bought or sold over long periods of time at prices that,
on average, are very near the current market price�.
This leads us to the conclusion that two main factors of market liquidity can be
determined: the immediacy of trading and its associated costs (e.g., in the form
of price concessions). Thus, we can de�ne market liquidity as the ability of an
asset to be bought or sold quickly at any time and in any quantity in the market
without a signi�cant loss in value (compared with its fair value).
For a liquid market, it is therefore essential that there is an abundance of market
participants in the market that are ready and willing to buy or sell. Therefore,
liquidity is often associated with a high level of trading activity. Depending on the
architecture of the market studied the following di�erent market participants that
contribute to the liquidity in the market may all potentially exist: specialists, �oor
brokers, market makers, dealers, designated sponsors and traders placing limit
orders.26 In the case of an order-driven market, like the Xetra-market that is the
focus of this dissertation, limit orders placed by traders provide liquidity, whereas
market orders placed by traders consume liquidity.27 Therefore, to tailor the
de�nition of market liquidity to an order-driven market, we follow the de�nition
of Holli�eld et al. (2001), who state that
�a liquid limit order market has a large volume of limit orders in
26 See, e.g., Holli�eld et al. (2001).27 In addition to traders, there are also so-called designated sponsors active in the Xetra-
market to enhance liquidity. They quote binding ask and bid limits for those securitiesthat are sponsored by them, which largely consist of less-liquid shares.
17
Chapter 2. Background on market liquidity and market structure
the book, a small bid/ask spread, a relatively large quantity of shares
o�ered close to the bid and ask quotes, and a limit order book which
rebounds quickly after a market order is submitted.�
Thus, this de�nition of market liquidity emphasizes once again the rapid matching
of demand and supply of an asset at low costs of transaction. However, to make
the market liquidity de�nition more practical and less elusive, and to make the re-
sulting assessment of market liquidity more comparable, all components of market
liquidity, including, in particular, the immediacy of trading, can be translated into
the costs that they generate. Therefore, market liquidity, as already stated above,
can also be de�ned as the cost of trading an asset in the capital markets relative to
its fair value28 (see, e.g., Dowd (2001) and Amihud and Mendelson (2006)). This
market liquidity cost de�nition is the foundation for this dissertation. In accor-
dance with Aitken and Comerton-Forde (2003), Amihud and Mendelson (2006)
and Stange and Kaserer (2011), we can e�ectively distinguish between the four
order-size-dependent explicit and implicit liquidity cost components of price im-
pact costs PI(q), search costs S(q), delay costs D(q) and direct trading costs
T (q). These components, in total, represent the market liquidity costs L(q) and
therefore de�ne the market liquidity of an asset:
L (q) = PI (q) + S (q) +D (q) + T (q) (2.1)
The four liquidity cost components are described in the following paragraphs:
� Price-impact (or market-impact) measures how much the transaction
itself will impact the current price of the asset underlying the transaction
28 In most de�nitions and concepts, the fair value of an asset is set to the mid-price of the bid-ask-spread. This makes the application of the concept rather simple, but leads by de�nitionto a continuous �uctuation of the fair value of an asset, which is a bit counter-intuitive.
18
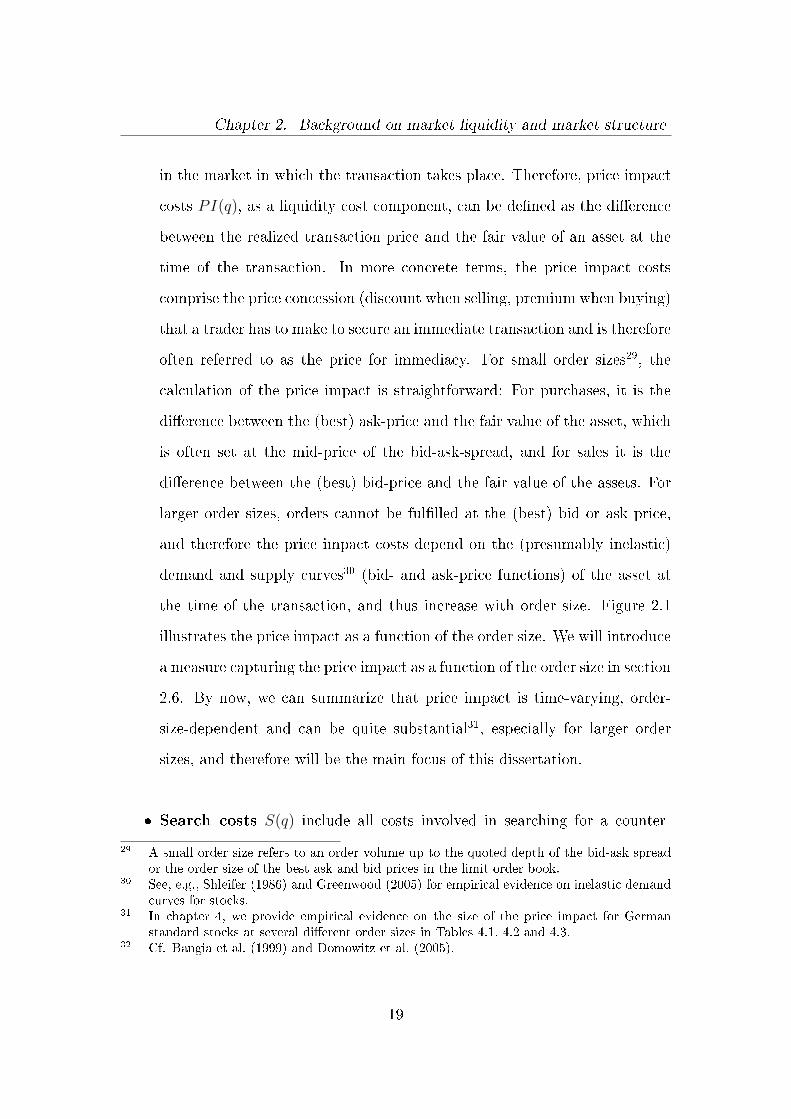
Chapter 2. Background on market liquidity and market structure
in the market in which the transaction takes place. Therefore, price impact
costs PI(q), as a liquidity cost component, can be de�ned as the di�erence
between the realized transaction price and the fair value of an asset at the
time of the transaction. In more concrete terms, the price impact costs
comprise the price concession (discount when selling, premium when buying)
that a trader has to make to secure an immediate transaction and is therefore
often referred to as the price for immediacy. For small order sizes29, the
calculation of the price impact is straightforward: For purchases, it is the
di�erence between the (best) ask-price and the fair value of the asset, which
is often set at the mid-price of the bid-ask-spread, and for sales it is the
di�erence between the (best) bid-price and the fair value of the assets. For
larger order sizes, orders cannot be ful�lled at the (best) bid or ask price,
and therefore the price impact costs depend on the (presumably inelastic)
demand and supply curves30 (bid- and ask-price functions) of the asset at
the time of the transaction, and thus increase with order size. Figure 2.1
illustrates the price impact as a function of the order size. We will introduce
a measure capturing the price impact as a function of the order size in section
2.6. By now, we can summarize that price impact is time-varying, order-
size-dependent and can be quite substantial31, especially for larger order
sizes, and therefore will be the main focus of this dissertation.
� Search costs S(q) include all costs involved in searching for a counter-
29 A small order size refers to an order volume up to the quoted depth of the bid-ask spreador the order size of the best ask and bid prices in the limit order book.
30 See, e.g., Shleifer (1986) and Greenwood (2005) for empirical evidence on inelastic demandcurves for stocks.
31 In chapter 4, we provide empirical evidence on the size of the price impact for Germanstandard stocks at several di�erent order sizes in Tables 4.1, 4.2 and 4.3.
32 Cf. Bangia et al. (1999) and Domowitz et al. (2005).
19
Chapter 2. Background on market liquidity and market structure
Figure 2.1: Price impact32
part for transactions. Search costs can be a signi�cant part of liquidity
costs, especially for rather unique assets like rare art or real estate, but for
many other assets, like stocks and bonds, that are continuously traded on
exchanges, the search costs are negligible. However, stocks can be associ-
ated with signi�cant search costs in case of block trades of large quantities
of shares. In such trades, investors typically search for a counterpart with
whom they can privately negotiate the transaction instead of dumping the
whole order on the market, which would lead to a signi�cant price impact.
� Delay costs D(q) basically describe the risk of an adverse change in asset
prices or price impact costs during transaction delays. We can distinguish
between two di�erent types of delays, forced and unforced delays. An un-
forced delay describes the situation that occurs if a trader deliberately delays
(parts of) the transaction in the hopes of receiving better prices or reducing
price impact costs. Particularly for large orders, there are trading strate-
20
Chapter 2. Background on market liquidity and market structure
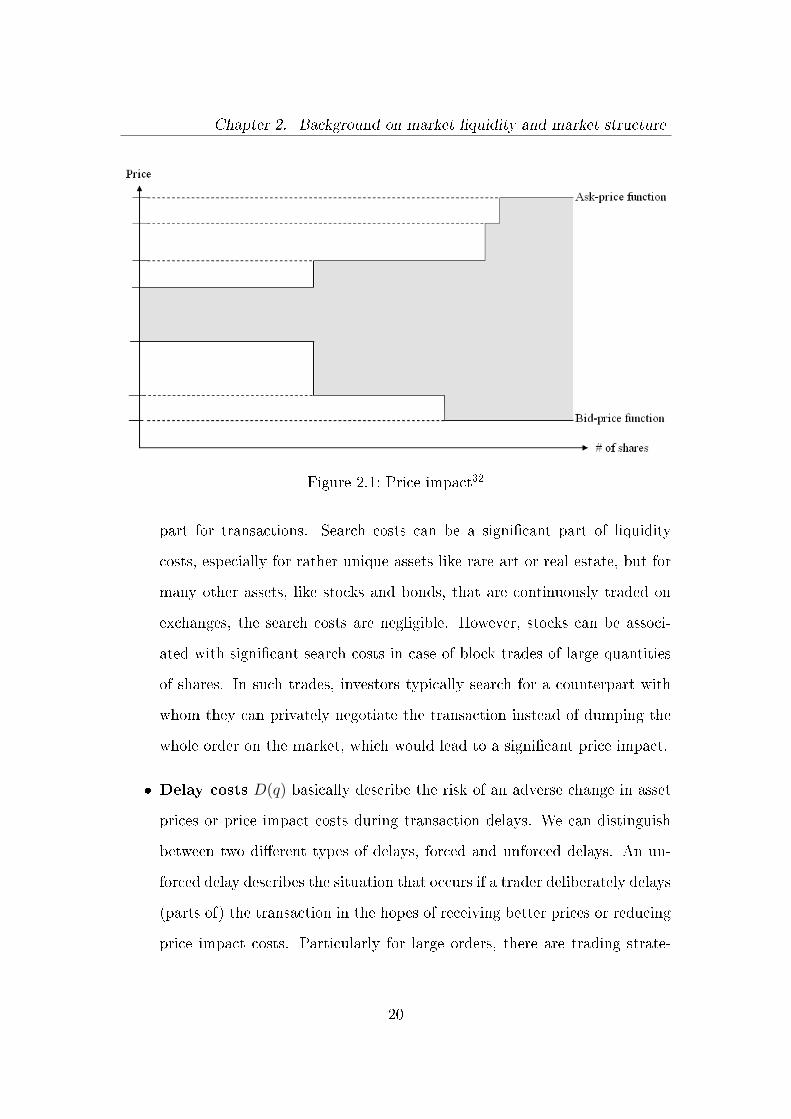
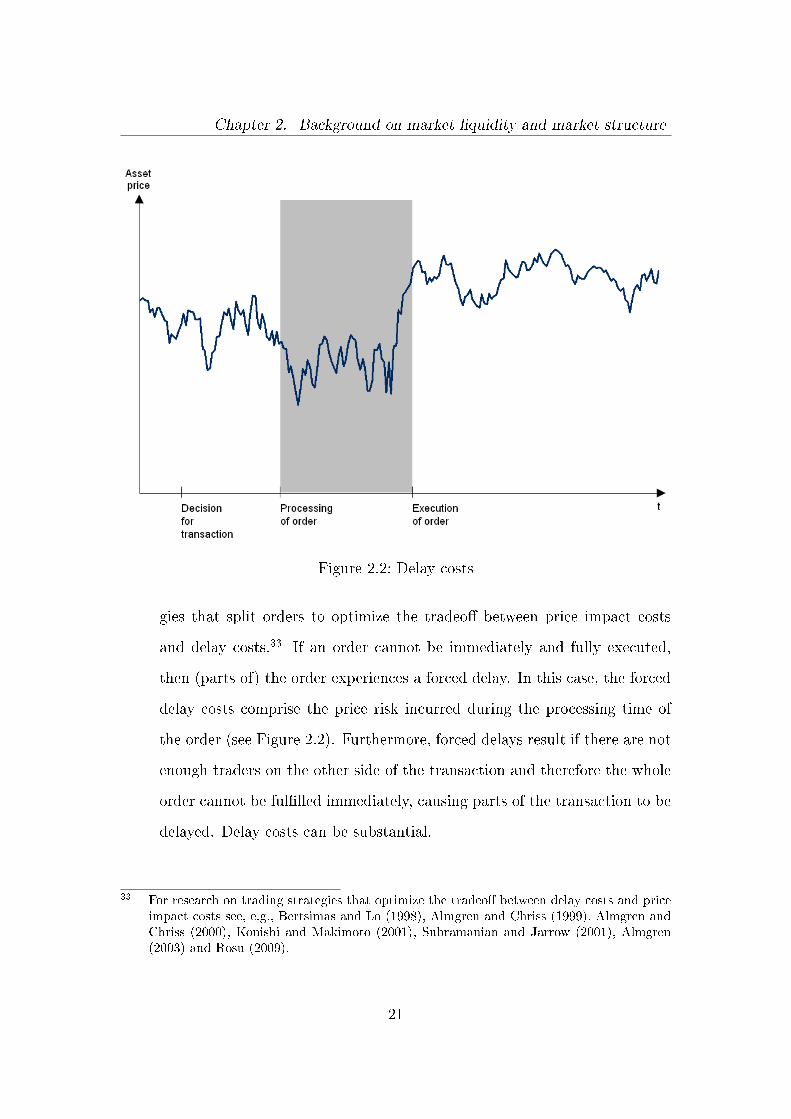
Figure 2.2: Delay costs
gies that split orders to optimize the tradeo� between price impact costs
and delay costs.33 If an order cannot be immediately and fully executed,
then (parts of) the order experiences a forced delay. In this case, the forced
delay costs comprise the price risk incurred during the processing time of
the order (see Figure 2.2). Furthermore, forced delays result if there are not
enough traders on the other side of the transaction and therefore the whole
order cannot be ful�lled immediately, causing parts of the transaction to be
delayed. Delay costs can be substantial.
33 For research on trading strategies that optimize the tradeo� between delay costs and priceimpact costs see, e.g., Bertsimas and Lo (1998), Almgren and Chriss (1999), Almgren andChriss (2000), Konishi and Makimoto (2001), Subramanian and Jarrow (2001), Almgren(2003) and Rosu (2009).
21
Chapter 2. Background on market liquidity and market structure
� Direct trading costs T (q) summarize all the explicit liquidity costs that
are related to the transaction including exchange fees, brokerage commis-
sions and government taxes. Only exchange fees can be controlled by the
exchange itself (and are often used as a selling proposition in the competi-
tion among di�erent exchanges), whereas the others are exogenous. Direct
trading costs are rather simple to quantify, as they are deterministic and
are typically relatively small compared to the other liquidity cost compo-
nents listed above (especially for most standardized assets, such as stocks).
Due to their deterministic nature, direct trading costs are often neglected
in academic research.
By relating all the liquidity cost components to the fair value of the asset, liquidity
costs and hence market liquidity are represented as a fraction of the asset's fair
value, which makes a comparison of market liquidity across di�erent assets and
markets very straightforward.
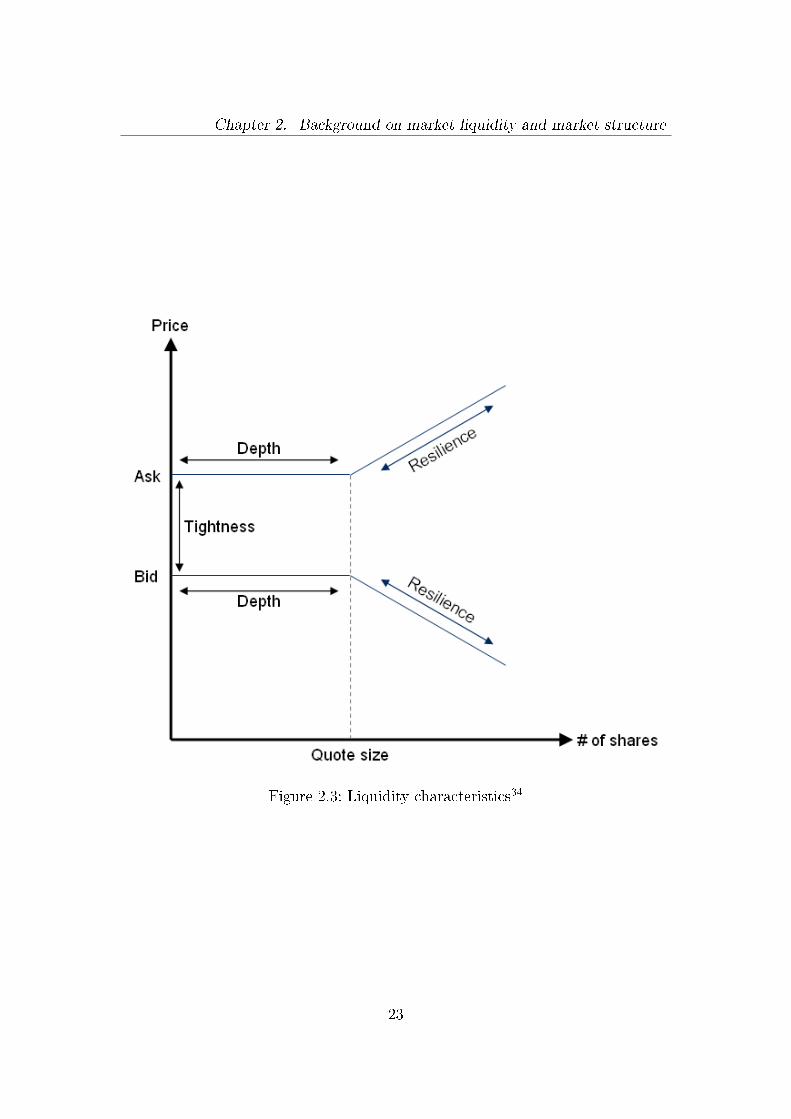
2.3 Characteristics of market liquidity
In the previous section, we gave a de�nition of market liquidity and stressed the
importance of the price impact as a liquidity component. Several researchers in
the �eld of market liquidity followed the work of Kyle (1985) by describing three
main characteristics of market liquidity. More precisely, these are characteristics
of the price impact, which we de�ned above. As these characteristics play a central
role in the existing research and help us to better understand the concept of price
impact, we will brie�y describe these three characteristics, which are illustrated
in summary in Figure 2.3.
34 Cf. Bervas (2006).
22
Chapter 2. Background on market liquidity and market structure
Figure 2.3: Liquidity characteristics34
23

Chapter 2. Background on market liquidity and market structure
The three basic characteristics of market liquidity or price impact are:
� Tightness, or breadth, which describes the ability to trade assets close to
the fair value of the asset. In a more concrete manner, one can say that
tightness is measured as the spread between the best bid and the best ask
price.
� Depth, which is the ability to buy and sell large order sizes without an
excessive adverse impact on the price of the asset. More precisely, depth
measures the volume that can be transacted (either sold or bought) at the
best quoted price. The concepts of tightness and depth can be combined
by stating that a tight and deep market is a market in which even large
orders (both purchases and sales) can be ful�lled immediately at close to
the current market price.
� Resilience refers to the speed at which prices recover from the impact of
a transaction or a random shock, like temporary order imbalances. It is
therefore closely linked to the order �ow that is required to counterbalance
these price e�ects.
All of these three characteristics play a crucial role in the evaluation of the liquidity
of a �nancial market.
24
Chapter 2. Background on market liquidity and market structure
2.4 Theoretical explanations for the existence of
liquidity costs35
After having focused on the de�nition and characteristics of market liquidity
(costs), we now seek to derive a better understanding for the driving forces under-
lying the existence of market liquidity costs. The existing market microstructure
literature on market liquidity distinguishes three basic theoretical determinants
or sources of friction that in�uence market liquidity costs (see, e.g., Stoll (1989),
Stoll (2000) or Amihud et al. (2005)). A solid understanding of these factors
is essential for any further empirical research that focuses on e�ects on market
liquidity, as these form the theoretical underpinnings of that concept. The three
sources of friction are:
� Order handling costs or order processing costs (see, e.g., Demsetz
(1968), Tinic (1972) and Roll (1984)) relatively straightforwardly re�ect the
compensation required for the intermediation processes of transacting an
order.
� Inventory costs comprise the compensation for the price risk and oppor-
tunity costs of holding a position (see, e.g., Stoll (1978b), Amihud and
Mendelson (1980) and Ho and Stoll (1981)). This theory is based on a mar-
ket structure with some sort of market maker36. Market makers stand ready
to buy and sell from investors to provide immediacy of trading. As a result,
a market maker may have to buy an asset from an investor with the antici-
pation of being able to unwind the position by selling it to another investor
in the future. In the interim, by holding the position in his inventory, he is
35 This section is partly based on Rösch and Kaserer (2011).36 Designated sponsors in the case of the Xetra.
25
Chapter 2. Background on market liquidity and market structure
exposed to the risk of adverse price changes. He therefore must be compen-
sated for taking this risk. This compensation is implemented through the
use of a spread; thus, the magnitude of this risk in�uences the size of the
spread.
� Adverse selection costs refer to theories demonstrating that asymmetric
information is a driver for liquidity costs and therefore explain the spread
as compensation for losses incurred by trading with (privately) informed
investors. This notion can be derived from theories of Copeland and Galai
(1983), who demonstrated that due to the adverse selection problem from
informed traders, uninformed market participants will increase the spreads,
which leads to poorer market liquidity, to compensate for the expected losses
to these privately informed traders. Thus, market makers will gain from
trading with uninformed liquidity traders while they lose money to the pri-
vately informed traders (see, e.g., Bagehot (1974)). The private information
in question can stem from either con�dential data regarding the fundamen-
tals of the asset, e.g., a potential buyer has private information that a com-
pany is about to take o�, justifying a higher asset price, or data regarding
the order �ow, e.g., a trader has private information that another large in-
stitutional investor is going to dump a large position of a security in the
market, which will depress the price of this asset in the market, at least
in the short term. This phenomenon was later referred to as the �adverse
selection component� by Glosten and Milgrom (1985). Further fundamen-
tal theoretical works on the adverse selection component include the sudies
of Kyle (1985) and Glosten and Harris (1988). Furthermore, Stoll (1989)
and George et al. (1991) provide empirical evidence for the existence of the
26

Chapter 2. Background on market liquidity and market structure
adverse selection component in the �nancial markets.
An understanding of the sources of liquidity costs is essential for regulators, ex-
change o�cials, market makers, traders, etc. to develop mechanisms, e.g., better
disclosure to reduce the extent of private information, to improve market liquidity.
27
Chapter 2. Background on market liquidity and market structure
2.5 Measures of market liquidity
Given its de�nition and characteristics, a holistic measurement of liquidity seems
to be nearly impossible. As a consequence, a vast number of di�erent measures
have been used as a proxy for market liquidity, indicating that there is no estab-
lished consensus regarding the most appropriate measure. One major empirical
constraint for the construction and use of a market liquidity measure is data avail-
ability. Financial data recorded on a high-frequency level, which enables liquidity
measurement based on the actual sequence of orders, quotes and trades, only re-
cently became available for developed �nancial markets such as those of the U.S..
For less developed markets or longer periods of time, one is therefore restricted to
the use of low-frequency data to measure market liquidity. This section surveys
and discusses the most prominent existing market liquidity measures and sets the
foundation for the introduction of the market liquidity measure that we will use
for our empirical research, which will be discussed in the next section. In this
presentation of the liquidity measures, we broadly categorize them as liquidity
measures that only roughly act as proxies for market liquidity, i.e., they give a
general sense of the liquidity of an asset and enable a liquidity ranking of as-
sets but do not have a clear linkage to liquidity costs (indirect measures); and
those liquidity measures for which liquidity costs can be directly inferred from the
respective liquidity measure (direct measures).
2.5.1 Indirect measures
We begin our discussion by considering the indirect liquidity measures of traded
volume, turnover rate and proportion of zero-trading days.
� Traded volume
28
Chapter 2. Background on market liquidity and market structure
Traded volume V represents a rather simple and rough liquidity measure,
although it does have very limited data requirements.37 It measures the
amount transacted either between investors of a single asset or by an entire
market for a certain period of time (usually a day, a week, a month or a
year). It is therefore a measure that acts as a proxy for the activity and the
existence of participants in the market. It is calculated by aggregating the
product of the price of a transaction Px with the quantity transacted nx for
all transactions for a speci�ed period of time:
V =∑x
Px · nx (2.2)
� Turnover rate
The traded volume by itself is hard to compare across securities and mar-
kets, as it does not account for the number of shares outstanding or the
shareholder bases. Thus, Datar et al. (1998) propose an adaption that uses
the turnover rate as a proxy for liquidity. The turnover rate Tn is con-
structed by relating the traded volume V (as calculated in equation (2.2))
to the outstanding volume of the asset MV , which is the product of the
number of shares outstanding and the average price of the traded shares.
Tn =V
MV(2.3)
� Proportion of zero-trading days
Lesmond et al. (1999) propose a liquidity measure that is based on the inci-
37 However, Stoll (1978a) shows that traded volume is the most important determinant ofthe bid-ask spread and therefore, if data availability precludes the use of other liquiditymeasure, this metric is often used as a liquidity proxy. For instance, Brennan et al. (1998)use trading volume as a measure of liquidity in a multi-factor asset pricing model.
29
Chapter 2. Background on market liquidity and market structure
dence of trading days with a zero return. They argue that there is a direct
link between liquidity costs and the number of days with zero returns. In
their view, an asset with higher liquidity costs exhibits less frequent price
movement and, in turn, more days with zero returns, as liquidity costs con-
stitute a threshold to transact, and given the adverse selection model intro-
duced by Glosten and Milgrom (1985) and Kyle (1985), market participants
will only trade if this threshold is outweighed by the value of an informa-
tional signal.38 Lesmond et al. (1999) further demonstrate that this measure
is highly correlated with more conventional direct liquidity measures, like
the bid-ask-spread, which makes it a good liquidity proxy. The calculation
of the proportion of zero-trading days is simply the number of days with
zero returns as a fraction of the total number of trading days in a month
(see equation (2.4)). The construction of this liquidity measure already im-
plies that it is a rather low frequency measure. Indeed, perhaps the most
important advantage of this liquidity measure is that it requires very little
data, i.e., it only requires time-series data of returns, and therefore it can be
a useful liquidity proxy in contexts for which volume data or more sophis-
ticated high-frequency price data are unavailable, as is the case for many
emerging markets.
Zero =# of days with zero returns
# of trading days in a month(2.4)
Certain studies use a slightly di�erent de�nition of the proportion of zero-
trading days that counts only zero-return days with a positive trading vol-
ume:
38 See, e.g., Goyenko et al. (2009) and Bekaert et al. (2007).
30
Chapter 2. Background on market liquidity and market structure
Zero =# of positive volume days with zero return
# of trading days in a month(2.5)
After having presented some indirect liquidity measures, we will now focus on
direct liquidity measures, which can be converted rather straightforwardly into
estimates of particular liquidity costs.
2.5.2 Direct measures
In the following section, we will discuss the direct liquidity measures of quoted bid-
ask-spread, relative bid-ask-spread, e�ective spread, lambda λ, gamma γ, ILLIQ,
liquidity ratio and volume-weighted spread.
� Quoted and relative bid-ask-spread
The quoted and the relative bid-ask spread are among the most widely used
measures of market liquidity, see, e.g., Amihud and Mendelson (1986). The
quoted bid-ask spread Squo. is the di�erence between the quoted bid (b) and
ask (a) price and is therefore a direct measure for the cost of an immediate
transaction (see equation 2.6).39
Squo. = a− b (2.6)
It measures the price for immediacy that a small investor40 has to pay, i.e.,
to purchase a stock he has to pay the ask-price, whereas he only receives
the bid-price when selling the same stock, and therefore a small investor
has to pay the spread as a liquidity cost for a roundtrip. To make the bid-
39 Cf. Amihud and Mendelson (1986).40 A small investor, in this context, is an investor that trades order sizes that are smaller than
the quote size.
31
Chapter 2. Background on market liquidity and market structure
ask spread more comparable across di�erent assets (especially with di�erent
prices), the quoted bid-ask-spread is often expressed as a fraction of the
mid-price Pmid between the bid- and the ask-price.
Pmid =a+ b
2(2.7)
The resulting measure is called the relative bid-ask spread Srel.:
Srel. =Squo.Pmid
(2.8)
� E�ective spread
The quoted spread presented above, however, fails to fully capture the im-
pact of large orders on market prices and the e�ect that transactions can
occur within the quoted bid- and ask-prices. The e�ective spread addresses
this de�ciency with actual transaction prices instead of quoted bid- and
ask-prices. It is de�ned as twice the absolute di�erence between the actual
transaction price Px and the mid-price Pmid at the time of the order entry,
and it therefore captures the cost of a roundtrip.
Seff. = 2 · |Px − Pmid| (2.9)
The e�ective spread is aggregated over a time period (e.g., a month or a
year) by calculating the volume-weighted average of all transactions in that
time period. Much of the time, only the transaction prices are known,
whereas the mid-price is unknown due to limitations in data availability. As
a consequence, Roll (1984) developed an implicit estimator of the e�ective
32
Chapter 2. Background on market liquidity and market structure
percentage spread ˆSeff. based on the serial covariance of the changes in
transaction prices that exist due to the bid-ask bounce.41 The estimator of
the e�ective percentage spread ˆSeff.is calculated as follows:
ˆSeff. = 2 ·√−Cov(rt, rt−1) (2.10)
In this case, Cov(rt, rt−1) is the serial covariance of the returns of the asset.
The advantage of the model of Roll (1984) is that it provides a simple method
to estimate liquidity costs that solely uses transaction price data.
� Relation between price change and order �ow - Lambda λ
In their work, Brennan and Subrahmanyam (1996) distinguish between liq-
uidity costs that are constant for any trading size (which they call �xed
costs) and those that vary with the trading size (which they call variable
costs). Using the following regression framework that is based on Glosten
and Harris (1988)42
∆Pt = λ · nt + ψ [Dt −Dt−1] + εt (2.11)
where ∆Pt = Pt − Pt−1 is the price change, nt is trade-size or order �ow,
and Dt represents the sign of the incoming order (+1 for a buy transaction
and −1 for a sell transaction), they estimate the variable costs coe�cient
λ and the �xed cost coe�cient ψ. This λ, which is also often called Kyle
41 For extensions of this model see, e.g., Stoll (1989), George et al. (1991) and Huang andStoll (1997).
42 They further use a regression model that is based on Hasbrouck (1991) and Foster andViswanathan (1993). However, as this model produces qualitatively similar results, werestrict our discussion to the model based on Glosten and Harris (1988).
33
Chapter 2. Background on market liquidity and market structure
(1985)'s λ43, essentially measures the price impact of a unit of trade size;
thus, 1λproxies the depth of the market, as it represents the number of shares
required to move the price of the security by one currency unit. A larger
absolute value of λ implies a larger price impact and therefore a lower market
liquidity. The variable ψ measures the transaction-size-independent �xed
liquidity costs. To make this measure more comparable across securities, ψ
is often divided by the monthly average of the security price. A larger value
of ψ represents a larger �xed liquidity cost.
� Volume shock related return reversal - Gamma γ
Pastor and Stambaugh (2003) suggest a measure of liquidity with concep-
tual underpinnings that are motivated by an observation of Campbell et al.
(1993), who conducted a regression analysis that focused on the impact of
the signed lagged trading volume on a stocks daily excess return. In this
analysis, they discovered that the negative coe�cient for the lagged transac-
tion volume, capturing the price reversal in response to a certain transaction
volume, is more pronounced for less liquid stocks. In their study, Pastor and
Stambaugh (2003) use this �nding of Campbell et al. (1993) and perform
the following monthly regressions to estimate their price impact measure
called gamma γ.
ret+1 = θ + φ · rt + γ · sign (ret ) · Vt + εt (2.12)
In this equation, rt is the individual stock's return on day t, ret is the excess
return of an individual stock above the market return and Vt is the indi-
vidual stock's traded volume on day t. The price impact measure gamma
43 Kyle (1985) argues that λ increases with the extent of information asymmetry.
34
Chapter 2. Background on market liquidity and market structure
γ measures the return reversal in response to the previous trading day's
order-�ow shock. A larger absolute value of γ implies a larger price impact
and therefore a lower market liquidity.
� Price response to turnover - ILLIQ and Amivest
We have already demonstrated that traded volume alone can be used as
a liquidity measure. In recent years, several other liquidity measures have
been developed that use the traded volume as a main component. Perhaps
the most prominent of these liquidity measures was developed by Amihud
(2002) and is called ILLIQ. It is calculated as the daily ratio of the absolute
stock return r to its traded volume V and represents the price response that
is associated with one currency unit of trading volume. It can be interpreted
as a rough measure of the price impact. For longer periods of time, such as
months or years, the ratio is averaged over that period.
ILLIQ =|r|V
(2.13)
Amihud (2002) already states that there are probably better and more pre-
cise liquidity measures, such as the (quoted or e�ective) bid-ask-spread or
other, more sophisticated price impact measures. However, these other mea-
sures all su�er from the same problem of requiring a large amount of high-
frequency microstructure data that are not available in many equity ex-
changes or over longer time periods, as high-frequency data only recently
became available in developed �nancial markets. This is the main reason for
the popularity of the use of the ILLIQ measure in long-term studies that an-
alyze the impact of market liquidity on asset pricing, such as, e.g., Acharya
and Pedersen (2005).
35
Chapter 2. Background on market liquidity and market structure
One related measure to the ILLIQ is called the Amivest liquidity measure
or liquidity ratio44, which is essentially the reciprocal value of the ILLIQ
measure:
Amivest =V
|r|(2.14)
It compares the traded volume with the absolute price change. Any time
interval, like days or months, can be chosen for this measure. However,
unlike the ILLIQ measure, the Amivest measure is typically not aggregated
by averaging the daily measures; instead, the Amivest measure is calculated
using the appropriate overall values (e.g., monthly or yearly) for the traded
volume and the absolute percentage change for the chosen time interval.
In e�ect, the Amivest measure or liquidity ratio measures how much vol-
ume needs to be traded to induce a price change of one percent. A higher
Amivest measure implies a higher market liquidity, as it indicates that a
higher trading volume has less in�uence on price.
� Volume-weighted spread
Volume-weighted spread measures, derive, at any point in time, the ex-
ante liquidity costs associated with a transaction of a particular order size
by aggregating the state of the limit order book at that particular point
of time and for this particular order size. It generalizes the concept of
the quoted bid-ask-spread to the rest of the limit order book. Irvine et al.
(2000) introduced a volume-weighted spread measure called cost of roundtrip
trade (CRT); in addition, Barclay et al. (1999), Coppejans et al. (2002) and
Giot and Grammig (2005) used similar liquidity measures. We limit the
44 This measure has been used by e.g., Amihud et al. (1997) and Berkman and Eleswarapu(1998) to analyze less developed �nancial markets.
36
Chapter 2. Background on market liquidity and market structure
discussion of volume-weighted spread measures in this section, as we will
introduce our liquidity measure, which is a volume-weighted spread measure,
in great detail in the next section.
Due to the abundance of available liquidity measures, this section could only ad-
dress the most prominent liquidity measures. For an overview of further liquidity
measures, consult, e.g., Sarr and Lybek (2002), Amihud et al. (2005), Goyenko
et al. (2009) and Gabrielsen et al. (2011).
2.6 Introduction to the Xetra Liquidity Measure45
To measure the liquidity costs, and speci�cally the roundtrip price impact46, we
use an order-size-dependent volume-weighted spreadWS(q) derived from the limit
order book. WS(q) represents the cost of immediate order execution of a roundtrip
order of a speci�c Euro volume size q relative to its fair value, which is set at the
mid-point of the bid-ask-spread, the mid-price Pmid. It is an ex-ante market
liquidity measure of the liquidity available in the market at a particular moment
in time. The volume-weighted spread is a liquidity measure that combines three
aspects of market liquidity in one measure: tightness, depth and immediacy of
execution.
Mathematically, WS(q) can be calculated as the average volume-weighted price
of all limit orders that are required for transacting a speci�c Euro volume roundtrip
45 This section is largely based on Rösch and Kaserer (2010), Rösch and Kaserer (2011) andRösch and Kaserer (2012).
46 See section 2.2 for a discussion of the liquidity cost components and price impact. Asthe Xetra-market for the stocks is a very active market with continuous trading, we canneglect the search and delay costs as a liquidity component. Furthermore, transactioncosts are deterministic and rather small (especially for institutional investors) and are alsonegligible. Thus, an adequate price impact measure captures all relevant aspects of liquiditycosts, and we will therefore use this price impact measure as a liquidity measure in linewith our de�nition in equation (2.1).
37
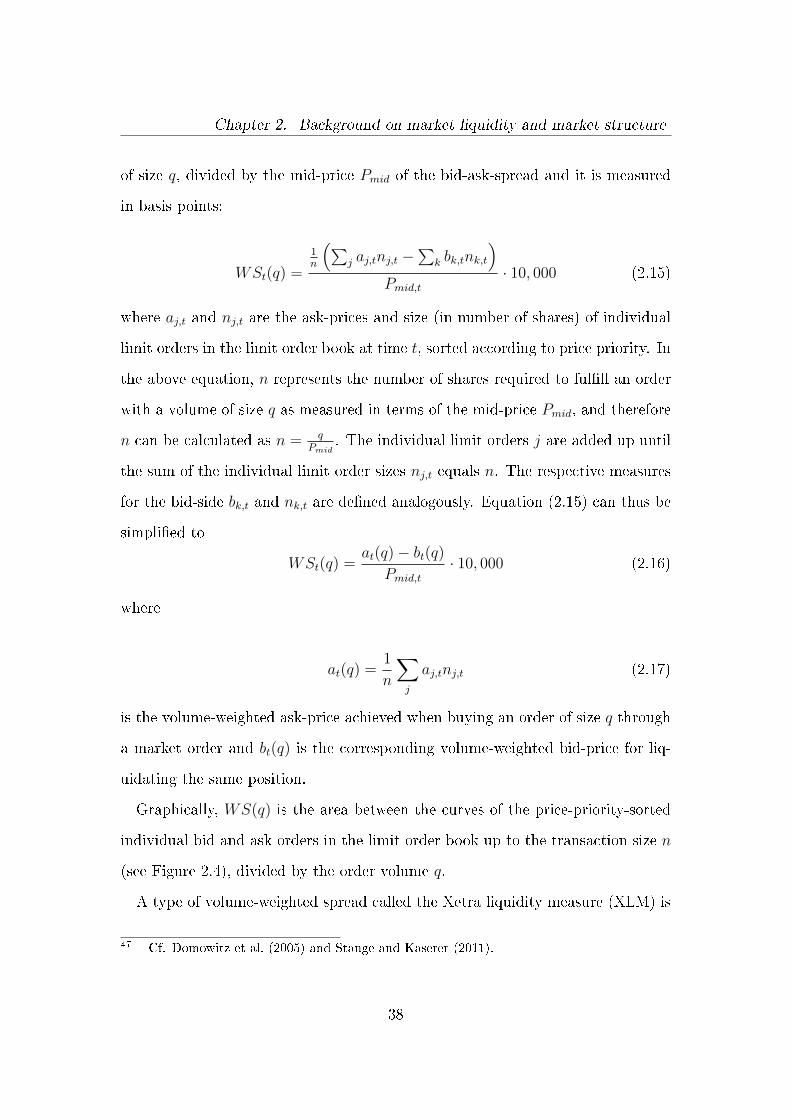
Chapter 2. Background on market liquidity and market structure
of size q, divided by the mid-price Pmid of the bid-ask-spread and it is measured
in basis points:
WSt(q) =
1n
(∑j aj,tnj,t −
∑k bk,tnk,t
)Pmid,t
· 10, 000 (2.15)
where aj,t and nj,t are the ask-prices and size (in number of shares) of individual
limit orders in the limit order book at time t, sorted according to price priority. In
the above equation, n represents the number of shares required to ful�ll an order
with a volume of size q as measured in terms of the mid-price Pmid, and therefore
n can be calculated as n = qPmid
. The individual limit orders j are added up until
the sum of the individual limit order sizes nj,t equals n. The respective measures
for the bid-side bk,t and nk,t are de�ned analogously. Equation (2.15) can thus be
simpli�ed to
WSt(q) =at(q)− bt(q)
Pmid,t· 10, 000 (2.16)
where
at(q) =1
n
∑j
aj,tnj,t (2.17)
is the volume-weighted ask-price achieved when buying an order of size q through
a market order and bt(q) is the corresponding volume-weighted bid-price for liq-
uidating the same position.
Graphically, WS(q) is the area between the curves of the price-priority-sorted
individual bid and ask orders in the limit order book up to the transaction size n
(see Figure 2.4), divided by the order volume q.
A type of volume-weighted spread called the Xetra liquidity measure (XLM) is
47 Cf. Domowitz et al. (2005) and Stange and Kaserer (2011).
38
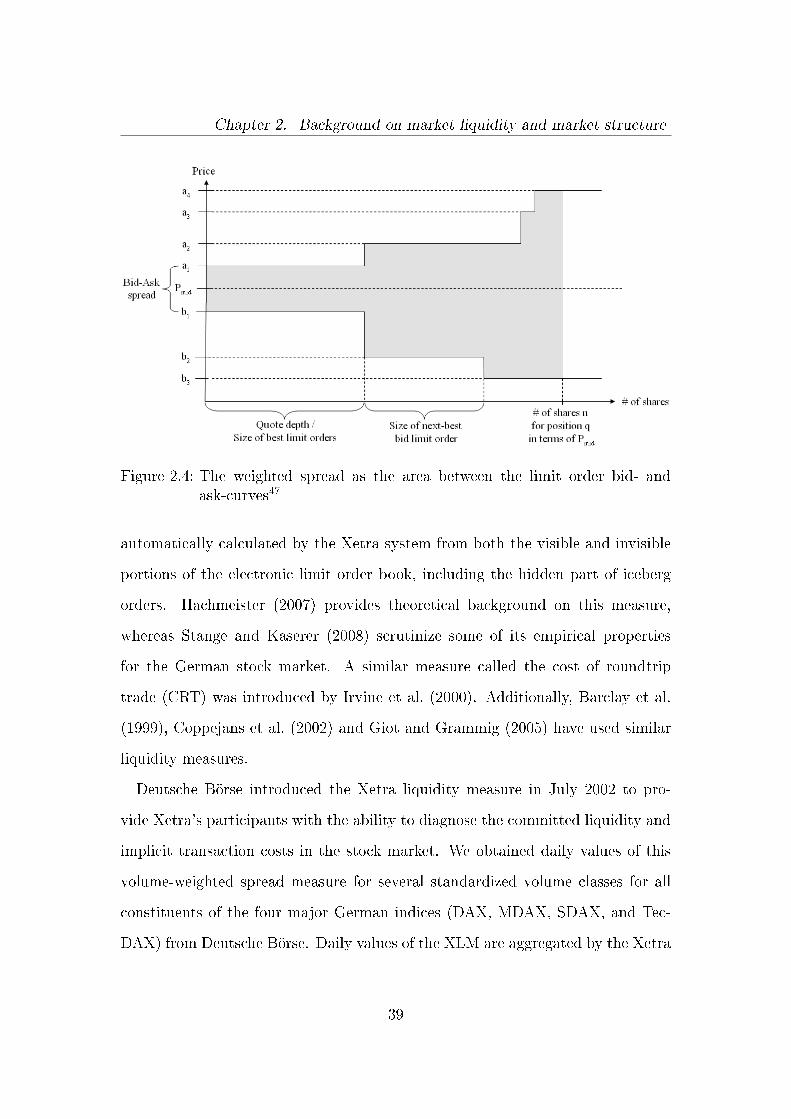
Chapter 2. Background on market liquidity and market structure
Figure 2.4: The weighted spread as the area between the limit order bid- andask-curves47
automatically calculated by the Xetra system from both the visible and invisible
portions of the electronic limit order book, including the hidden part of iceberg
orders. Hachmeister (2007) provides theoretical background on this measure,
whereas Stange and Kaserer (2008) scrutinize some of its empirical properties
for the German stock market. A similar measure called the cost of roundtrip
trade (CRT) was introduced by Irvine et al. (2000). Additionally, Barclay et al.
(1999), Coppejans et al. (2002) and Giot and Grammig (2005) have used similar
liquidity measures.
Deutsche Börse introduced the Xetra liquidity measure in July 2002 to pro-
vide Xetra's participants with the ability to diagnose the committed liquidity and
implicit transaction costs in the stock market. We obtained daily values of this
volume-weighted spread measure for several standardized volume classes for all
constituents of the four major German indices (DAX, MDAX, SDAX, and Tec-
DAX) from Deutsche Börse. Daily values of the XLM are aggregated by the Xetra
39
Chapter 2. Background on market liquidity and market structure
trading system by calculating the equal-weighted average of all individual volume-
weighted spread data points calculated at every minute during the trading hours
for each standardized volume class q. Daily WS(q) were provided for each stock
for 10 out of the following 14 standardized volume classes q of Euro 10, 25, 50, 75,
100, 150, 250, 500, 750, 1000, 2000, 3000, 4000 and 5000 thousand, if su�cient
volume was available in the limit order book to calculate the respective volume
class for the stock. For DAX stocks, the 10 standardized volume classes comprise
all volume classes up to Euro 5000 thsd. with the exception of the following four
volume classes: Euro 10, 75, 150 and 750 thsd. By contrast, for the stocks in the
other three indices, the XLM was available for all volume classes up to Euro 1
million.
For the purpose of most of our research, we use the XLM data to calculate
the liquidity costs L(q) from a transaction perspective, i.e., either a sell or a buy
order and not a roundtrip, as a per-transaction �gure is much more intuitive than
a per-roundtrip �gure.48 For simplicity, we assume that on average, there is a
symmetrical limit order book49, i.e., the liquidity costs for buying and selling are
equal. Therefore, we can derive the volume-dependent price impact PI(q) of a
hypothetical single (buy or sell) transaction with order size q as
L(q) = PI(q) =WS(q)
2(2.18)
After having introduced the Xetra liquidity measure, which will be the liquidity
measure that we will use in our empirical research, we will now elaborate on the
Xetra market, which is the focus of this dissertation.
48 This approach is consistent with Stange and Kaserer (2008).49 This assumption is fair, as Hedvall et al. (1997) found that, in general, the order book is
quite symmetrical, and Hachmeister (2007) showed that for the XLM, the liquidity costsdo not signi�cantly di�er on the buy and the sell side for trading sizes up to Euro 1 million.
40
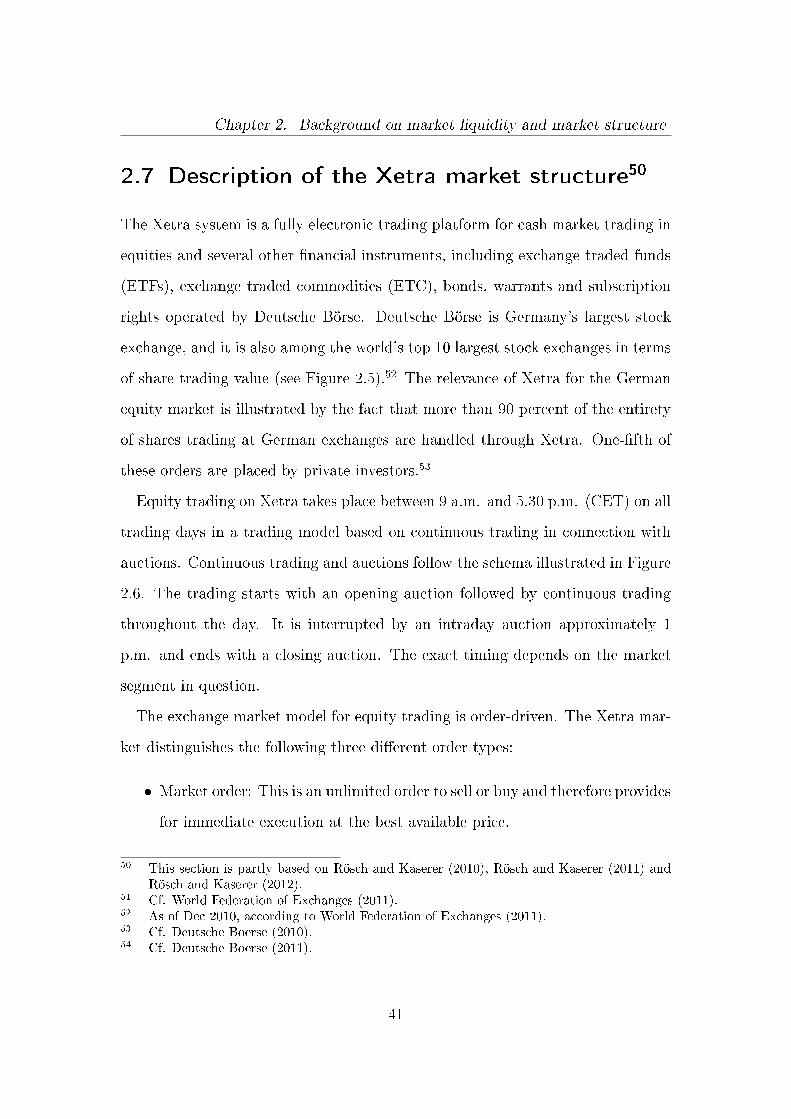
Chapter 2. Background on market liquidity and market structure
2.7 Description of the Xetra market structure50
The Xetra system is a fully electronic trading platform for cash market trading in
equities and several other �nancial instruments, including exchange traded funds
(ETFs), exchange traded commodities (ETC), bonds, warrants and subscription
rights operated by Deutsche Börse. Deutsche Börse is Germany's largest stock
exchange, and it is also among the world's top 10 largest stock exchanges in terms
of share trading value (see Figure 2.5).52 The relevance of Xetra for the German
equity market is illustrated by the fact that more than 90 percent of the entirety
of shares trading at German exchanges are handled through Xetra. One-�fth of
these orders are placed by private investors.53
Equity trading on Xetra takes place between 9 a.m. and 5.30 p.m. (CET) on all
trading days in a trading model based on continuous trading in connection with
auctions. Continuous trading and auctions follow the schema illustrated in Figure
2.6. The trading starts with an opening auction followed by continuous trading
throughout the day. It is interrupted by an intraday auction approximately 1
p.m. and ends with a closing auction. The exact timing depends on the market
segment in question.
The exchange market model for equity trading is order-driven. The Xetra mar-
ket distinguishes the following three di�erent order types:
� Market order: This is an unlimited order to sell or buy and therefore provides
for immediate execution at the best available price.
50 This section is partly based on Rösch and Kaserer (2010), Rösch and Kaserer (2011) andRösch and Kaserer (2012).
51 Cf. World Federation of Exchanges (2011).52 As of Dec 2010, according to World Federation of Exchanges (2011).53 Cf. Deutsche Boerse (2010).54 Cf. Deutsche Boerse (2011).
41
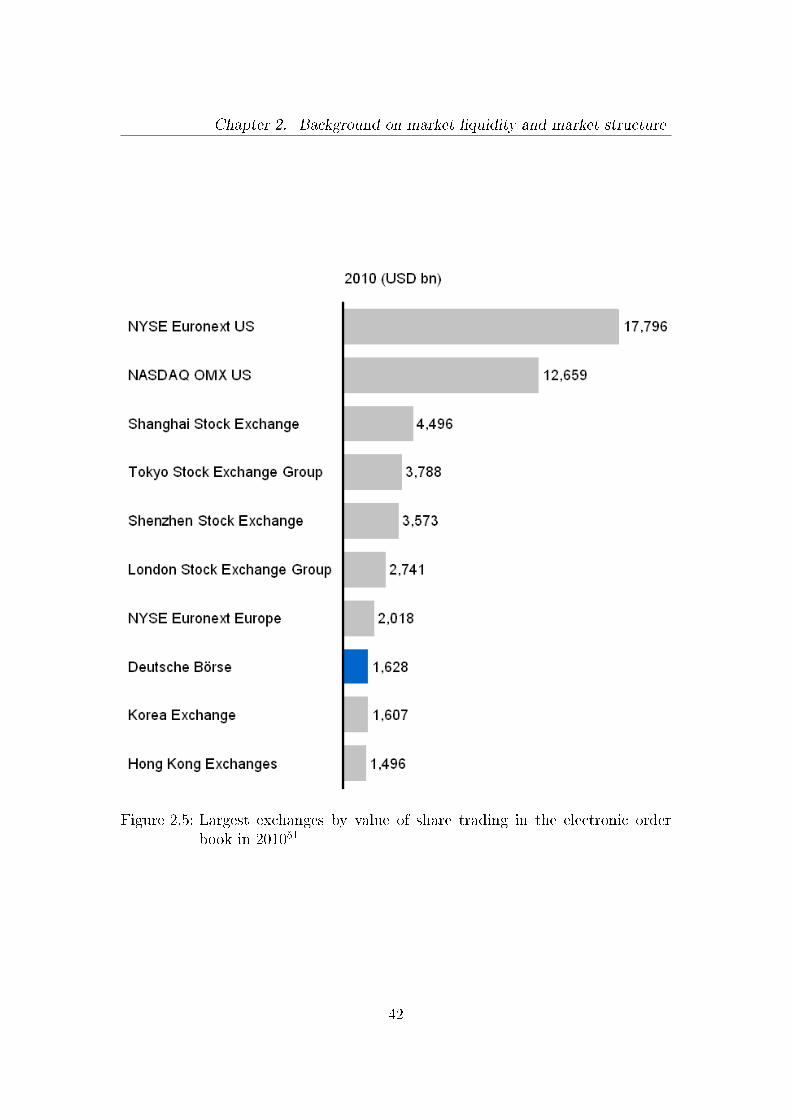
Chapter 2. Background on market liquidity and market structure
Figure 2.5: Largest exchanges by value of share trading in the electronic orderbook in 201051
42
Chapter 2. Background on market liquidity and market structure
Figure 2.6: Xetra continuous trading and auction plan54
� Limit order: This is a bid or ask order, which can only be executed at a price
at or better than the speci�ed limit price. The limit order enables traders
to achieve better prices than the current prevailing market price. However,
the execution at that limit price will not happen immediately and is not
guaranteed at all.
� Market-to-limit order: This is an unlimited order to sell or buy which will
be executed at the best available limit in the order book. If the order can
only be partially ful�lled at that price, then the remaining part of the order
will be entered into the limit order book with a limit price and timestamp
determined by the price and time of the �rst executed part of this order.
The choice of the optimal order type for a transaction is highly dependent on the
trader's subjective preference between the delay costs and the cost of immedi-
acy. Orders can be further speci�ed by adding execution conditions (which de�ne
whether an order has to be executed in full or can be executed in part), validity
43
Chapter 2. Background on market liquidity and market structure
constraints (which determine how long the respective order is valid) and trading
restrictions (which specify the possibilities of assigning orders to auctions).55
An electronic order book aggregates all limit and market orders from all Xetra
participants. Orders in the order book will be matched based on price and time
priority. The limit order book is anonymous but transparent to all Xetra partic-
ipants. However, market participants have the capability to submit large orders
into the electronic limit order book without revealing the entire size of theses or-
ders to other participants. These sort of orders are known as iceberg orders. For
an iceberg order, only a speci�ed tranche, or peak, which is the visible volume
for other market participants of an iceberg order, is entered in the order book,
with the initial timestamp of the iceberg order. As soon as the visible part of the
iceberg order has been completely ful�lled, if there is hidden volume remaining, a
new tranche is introduced into the limit order book with a current timestamp.56
Market makers, also known as designated sponsors, may provide additional
liquidity, particularly for less liquid stocks. They support trading on Xetra by
committing themselves to the quoting of binding bid and ask prices for securities,
up to a prespeci�ed minimum quotation volume.57 For more detailed information
on the Xetra market model for equity trading see Deutsche Boerse (2011).
55 See Deutsche Boerse (2011) for a full description of these order features.56 Cf. Deutsche Boerse (2011).57 Cf. Deutsche Boerse (2009).
44
Chapter 3Relevant literature on market liquidity
and the development of research
hypotheses
This chapter gives an overview of the existing literature on market liquidity. Af-
ter having laid out the foundations of market liquidity, we will now concentrate
on the existing literature that relates to our three major research questions (see
section 1.2). We begin by addressing literature focusing on market liquidity and
the �nancial crisis. This is followed by an overview of the relevant research that
concentrates on the in�uence of ownership structures, ownership concentration,
and blockholder types on market liquidity. The last subsection of this chapter ex-
amines one speci�c type of stock-owner, the insider, and summarizes the literature
�ndings regarding the in�uence of insider trading behavior on market liquidity.
Furthermore, in each subsection, we will elaborate on our research questions
and derive testable research hypotheses that will be the basis for our empirical
analysis in Chapter 5.
45
Chapter 3. Relevant literature and research hypotheses
3.1 Market liquidity and the �nancial crisis58
In this section, we give an overview of the literature that addresses market liquidity
in times of crisis, focusing upon considerations of two main liquidity phenomena
in the context of the recent �nancial crisis: liquidity commonality and the �ight-
to-quality. Furthermore, we present our research hypotheses derived from the
discussion of previous works.
3.1.1 Liquidity in times of crisis
In discussions of the current �nancial crisis, the important role of market liquidity
was often highlighted.59 However, the evolution and drivers of market liquidity in
times of crisis have not been widely studied. Certain existing research studying
market liquidity has touched on properties of liquidity during times of crisis and, in
particular, analyzed the relationship (in both directions) between market liquidity
and market returns.60
Amihud et al. (1990) were among the �rst to show that market liquidity can be
a driving force for market declines. They propose that the stock market crash of
1987 can be at least partially explained by a comprehensive revision of investors'
expectations regarding stock market liquidity. They argue that, as market liquid-
ity is priced into the stock market (see, e.g., Amihud and Mendelson (1986)), a
drop in investors' expectations regarding the liquidity of the market will lead to
a decline in stock prices.
58 This section is largely based on Rösch and Kaserer (2012).59 See, e.g., Brunnermeier (2009) for a presentation of the sequence of events of the current
�nancial crisis and the role of liquidity.60 The main focus of this existing research mostly has not been the analysis of market liquidity
during times of crisis. Instead, most of the summarized results can be considered to be abyproduct of research with another primary focus.
46
Chapter 3. Relevant literature and research hypotheses
Whereas Amihud et al. (1990) show a causal relationship between market liq-
uidity and returns, in more recent research, the theory that market declines are
a source for illiquidity is more widely acknowledged. Chordia et al. (2001) detect
that market liquidity is a�ected by market returns in a sample of NYSE stocks
from 1988 to 1992. They discover that bid-ask spreads respond asymmetrically to
market returns, as they signi�cantly increase in down markets and only marginally
decrease in up markets. Liu (2006), with several di�erent liquidity measures,
demonstrates that market liquidity in the U.S. stock market is impaired follow-
ing large economic and �nancial events such as the 1972�1974 recession, the 1987
crash, the Asian �nancial crisis in 1997, the 1998 Russian default, the collapse
of the Long Term Capital Management hedge fund in 1998, the early 2000 burst
of the high-tech bubble and the terrorist attacks on September 11, 2001. Hegde
and Paliwal (2005) �nd that for U.S. companies, both those directly exposed to
the Asian crisis61 and those that were not, liquidity dried-up during this crisis
period, resulting in an increase in spreads and a decrease of market depth. Ana-
lyzing 23 emerging markets over the period from 1993 to 2000, Lesmond (2005)
descriptively demonstrates that bid-ask spreads as well as several other liquidity
measures62 sharply increase during the periods of the Asian and Russian crises.
Yeyati et al. (2008), also focusing on emerging markets63, use a sample of 52 stocks
from seven di�erent countries over the period from April 1994 to June 2004 to
61 They de�ne exposed �rms as those U.S. companies that are fundamentally related to theAsian market, i.e., have either operations or signi�cant sales or service o�ces in the crisisregion or have more than 5% of their total sales in this region.
62 Among the other measures used are the LOT measure, which is an indirect liquidity measurebased on the number of zero returns (Lesmond et al. (1999)), Roll's estimator for an impliede�ective bid-ask spread (Roll (1984)) and Amihud's ILLIQ measure, which is the daily ratioof absolute stock return to its dollar volume (Amihud (2002)). See section 2.5 for a detaileddescription of these measures.
63 Yeyati et al. (2008) research the following seven emerging markets: Argentina, Brazil,Indonesia, South Korea, Mexico, Russia, and Thailand.
47
Chapter 3. Relevant literature and research hypotheses
demonstrate that crisis periods64 are associated with higher liquidity costs and
an initial increase in trading activity, which reverses at a later stage of the cri-
sis. Hameed et al. (2010) also �nd that there is a negative relationship between
market returns and changes in the proportional bid-ask spreads. They provide
strong evidence that market declines cause market illiquidity, as on average, the
spread increases by 2.8 (6.2) basis points in their sample of NYSE ordinary stocks
from January 1988 to December 2003 after a (large)65 market decline. Addition-
aly, Næs et al. (2011), by taking a more general view on the relation of business
cycles and market liquidity, show that stock market liquidity tends to dry up
during economic downturns, using an U.S. sample that considers NYSE common
shares from 1947 to 2008 and a Norwegian sample from the Oslo Stock Exchange
encompassing the period from 1980 to 2008.
All of these �ndings lead to our �rst hypothesis:
Hypothesis 1: Market liquidity varies over time and is especially im-
paired during times of crisis or periods of market decline. Furthermore,
there is a negative relationship between market returns and liquidity
costs, i.e., market downturns lead to soaring liquidity costs.
Certain existing research attributes this negative reaction of market liquidity in
periods of market downturn to two liquidity phenomena and their underlying
causes. We therefore examine these two phenomena in the next two subsections.
64 They de�ne a crisis as a period that begins when the stock market index starts decliningfor at least �ve consecutive weeks and reaches a total loss in market value of more than25% and ends after the index keeps rising for at least four consecutive weeks.
65 They de�ne a large market decline as a decrease in the weekly market return to below morethan 1.5 standard deviations less than its mean.
48
Chapter 3. Relevant literature and research hypotheses
3.1.2 Liquidity commonality
The phenomenon of liquidity commonality refers to the synchronicity of an indi-
vidual asset's liquidity variation with aggregate market-wide liquidity movements
and therefore describes the elusive concept of a common liquidity component that
in�uences the secondary market asset liquidity of an individual company.66 This
phenomenon was initially discovered empirically by Chordia et al. (2000), who
show that variations in �rm-level bid-ask spreads and depths are partially caused
by changes in aggregate market-wide spreads and depths. Further research fol-
lowing the initial discovery acknowledges the existence of liquidity commonality.
Hasbrouck and Seppi (2001), for instance, use a principal component analysis to
provide evidence for a single common liquidity factor in�uencing the liquidity of
the Dow 30 stocks and �nd a small systematic liquidity component. Huberman
and Halka (2001) also �nd that daily liquidity across NYSE stocks has a system-
atic and time-varying component. Brockman and Chung (2002) document the
existence of liquidity commonality in an order-driven market structure using data
from the Hong Kong Stock Exchange. Kamara et al. (2008) study the historic de-
velopment of liquidity commonality across U.S. stocks for the period from 1963 to
2005. They �nd a strong time variation in liquidity commonality and an asymmet-
ric development for small and large �rms over time, i.e., liquidity commonality has
declined for small �rms, while it signi�cantly increased for large �rms. Kempf and
Mayston (2008) focus on the liquidity commonality in an open limit order book
market and show that the liquidity commonality becomes stronger with larger
transaction sizes in the limit order book and that liquidity commonality exhibits
a strong time variation. Additionally, the empirical results of Brockman et al.
66 See Brockman et al. (2009a).
49
Chapter 3. Relevant literature and research hypotheses
(2009a) con�rm that an individual �rm's bid-ask spreads or depths are signi�-
cantly in�uenced by changes in the aggregate market's bid-ask spreads or depth,
respectively, in 47 stock exchanges throughout the world. Besides the previously
acknowledged exchange-level commonality component, they furthermore provide
evidence for a global liquidity commonality component. These �ndings lead to
our second research hypothesis:
Hypothesis 2: Liquidity commonality exists and it exhibits a time-
varying component.
Although the aforementioned research provides evidence for a strong liquidity
co-movement, and research in the area of asset pricing has shown that this sys-
tematic and undiversi�able risk factor is also relevant in asset pricing67, relatively
little research has focused on the fundamental drivers a�ecting liquidity common-
ality. In fact, liquidity commonality can theoretically have three basic sources:
co-variation in liquidity supply, co-movement in liquidity demand, or both. Sev-
eral theoretical studies trying to explain the causal relationship between market
returns and market liquidity that we described above (see 3.1.1), e.g., Bookstaber
(2000), Kyle and Xiong (2001), Vayanos (2004), Garleanu and Pedersen (2007)
and Brunnermeier and Pedersen (2009), argue that stock market declines either
a�ect the liquidity demand (e.g., panic selling, risk aversion) or the supply for
liquidity (e.g., margin or capital constraints, fund withdrawals by �nancial inter-
mediaries). As these market-wide liquidity demand and supply e�ects of market
declines have a market-wide impact on liquidity through simultaneously occurring
transactions, we hypothesize that such declines therefore induce co-movement in
67 See, e.g., Acharya and Pedersen (2005), Pastor and Stambaugh (2003), Sadka (2006), Ko-rajczyk and Sadka (2008) and Kuan-Hui and Lee (2011) for research that focuses on thepricing of liquidity risk via a systematic liquidity risk component, i.e., liquidity commonal-ity.
50
Chapter 3. Relevant literature and research hypotheses
liquidity:
Hypothesis 3: Liquidity commonality increases during time of crisis
and market downturns.
Indeed, several empirical works provide evidence for such liquidity supply and
demand factors in�uencing liquidity commonality. For instance, support for liq-
uidity supply-side factors such as capital constraints (especially of common mar-
ket makers and other �nancial intermediaries) is given by Coughenour and Saad
(2004), Hameed et al. (2010) and Comerton-Forde et al. (2010), whereas Karolyi
et al. (2011) don't �nd signi�cantly consistent support for this source of liquidity
commonality. Empirical support for demand-side determinants is, to an extent,
provided in the works of e.g., Huberman and Halka (2001), Kamara et al. (2008),
Karolyi et al. (2011) and Koch et al. (2011), who test demand drivers like common
variation in trading activity, concentration of institutional ownership and investor
sentiment.
As the theoretical work of Brunnermeier and Pedersen (2009), which focuses
on supply-side explanations, has received tremendous academic recognition, we
concentrate upon extending and applying this research to our empirical study.
Brunnermeier and Pedersen (2009) propose a theoretical model that explains the
spiral and dynamic interactions between funding liquidity and market liquidity.68
See Figure 3.1 for an illustration of this nexus between funding and market liq-
uidity. In their research, they argue that market declines reduce the value of
�nancial intermediaries' assets and thus increase the probability of margin calls
68 Bookstaber (2000), Kyle and Xiong (2001), Xiong (2001), Bernardo and Welch (2004),Cifuentes et al. (2005) and Garleanu and Pedersen (2007) follow a similar line of argumen-tation.
69 Taken from Brunnermeier and Pedersen (2009).
51
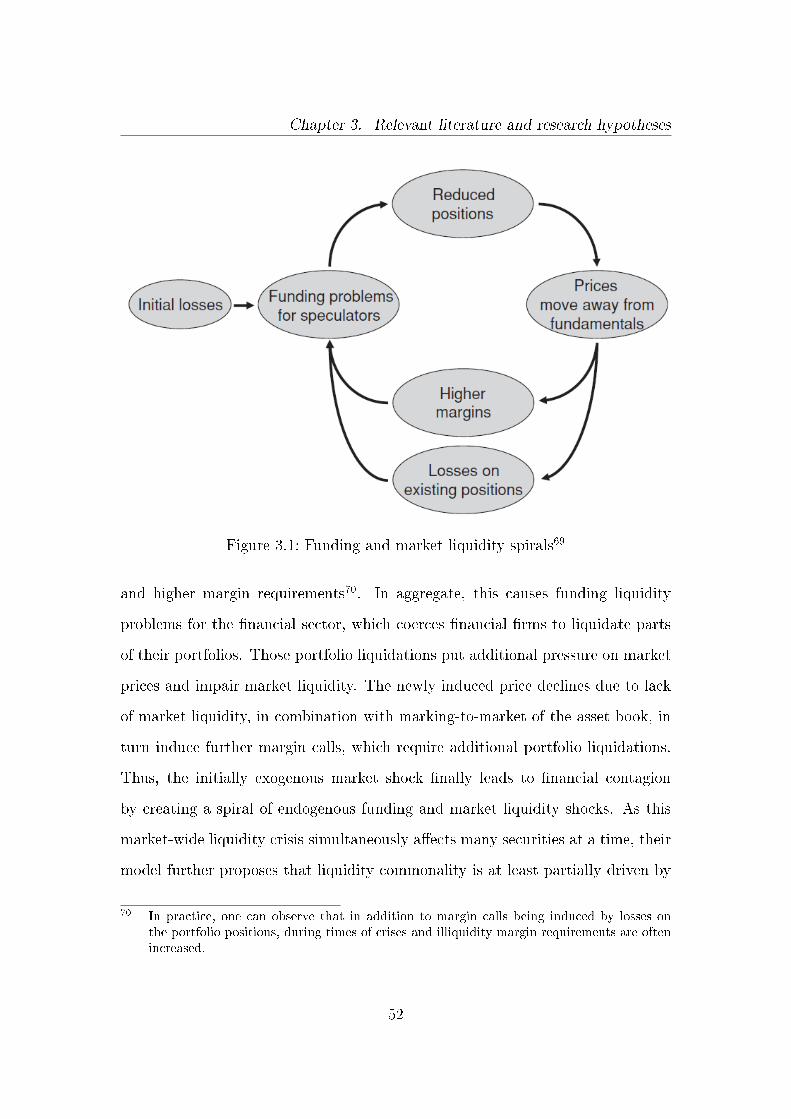
Chapter 3. Relevant literature and research hypotheses
Figure 3.1: Funding and market liquidity spirals69
and higher margin requirements70. In aggregate, this causes funding liquidity
problems for the �nancial sector, which coerces �nancial �rms to liquidate parts
of their portfolios. Those portfolio liquidations put additional pressure on market
prices and impair market liquidity. The newly induced price declines due to lack
of market liquidity, in combination with marking-to-market of the asset book, in
turn induce further margin calls, which require additional portfolio liquidations.
Thus, the initially exogenous market shock �nally leads to �nancial contagion
by creating a spiral of endogenous funding and market liquidity shocks. As this
market-wide liquidity crisis simultaneously a�ects many securities at a time, their
model further proposes that liquidity commonality is at least partially driven by
70 In practice, one can observe that in addition to margin calls being induced by losses onthe portfolio positions, during times of crises and illiquidity margin requirements are oftenincreased.
52
Chapter 3. Relevant literature and research hypotheses
the funding and market liquidity spiral.
In our research, we seek to empirically test this theory and therefore formulate
our fourth hypothesis as follows:
Hypothesis 4: Funding liquidity dry-ups leads to an increase in liq-
uidity commonality.
3.1.3 Flight-to-quality and �ight-to-liquidity
Two other liquidity phenomena that prevail in times of crisis and increased mar-
ket uncertainty are the two interlinked phenomena of �ight-to-quality and �ight-
to-liquidity, which are often used synonymously. These phenomena stem from
observations of empirical investment behavior that demonstrate that in times
of increased uncertainty in the �nancial markets, investors move their capital to-
wards less risky (�ight-to-quality) and more liquid assets (�ight-to-liquidity). One
oft-stated explanation of why these two phenomena are intertwined is that risky
assets also tend to be less liquid, as noted in, e.g., Ericsson and Renault (2006).
This is also our �rst hypothesis related to the �ight-to-quality phenomenon:
Hypothesis 5: An individual stock's asset liquidity is negatively re-
lated to its company's default probability, e.g., company rating.
Previous theoretical and empirical research on the impact of credit quality, i.e.,
the likelihood of default of an asset, on market liquidity typically indicates that
there is an inverse relationship between liquidity costs and credit quality, although
such studies almost exclusively focus on the bond or CDS markets. Ericsson and
Renault (2006) develop a model to demonstrate the impact of market liquidity risk
on corporate bond yield spreads. One main qualitative result from their model
53
Chapter 3. Relevant literature and research hypotheses
is that levels of liquidity spreads are positively correlated with credit risk/default
probability. Chen et al. (2007a) analyze liquidity costs, using three di�erent mea-
sures of liquidity71, for over 4000 non-callable corporate bonds from 1995 to 2003
and �nd that liquidity costs decrease with greater creditworthiness, as measured
by bond rating. This liquidity trend holds for various bond maturities. Looking
at a CDS sample of 32 Fortune 500 companies from January 2004 to August 2006,
Dunbar (2008) �nds that the average bid�ask spread increases with a deteriora-
tion in credit ratings. However, Beber et al. (2009) �nd a negative relationship
between credit quality and market liquidity across the Euro-area government bond
market.
The dynamics of this aforementioned relationship in the context of crisis sit-
uations leads us directly to the �ight-to-quality and �ight-to-liquidity. Vayanos
(2004) demonstrates theoretically that investors prefer more liquid instruments in
times of market uncertainty (i.e., increased market volatility), which is re�ected in
increasing liquidity premiums. He explains this phenomenon for an increased pref-
erence for liquidity as an increase in the investor's risk aversion. Longsta� (2004)
�nds a �ight-to-liquidity premium in U.S. Treasury bond prices, by comparing
prices of Treasury bonds with identical bonds of Refcorp72, which essentially only
di�er in their liquidity. He shows that there is a movement towards the more liq-
uid Treasury bonds when the concerns about the future economic situation among
market participants rise (as approximated by a drop in the consumer con�dence
index), leading to an increase in the �ight-to-liquidity premium. Beber et al.
(2009) also demonstrate that in times of �nancial crisis, investors chase for liquid-
71 Bid-ask spreads, zero returns and the Lesmond et al. (1999) model's liquidity estimate.72 Refcorp is the Resolution Funding Corporation, which is a government agency founded
by the Financial Institutions Reform, Recovery, and Enforcement Act of 1989 (FIRREA).Refcorp bonds are fully guaranteed by the U.S. Treasury and therefore necessarily haveexactly the same credit risk as T-bonds; however, there is less liquidity for Refcorp bonds.
54

Chapter 3. Relevant literature and research hypotheses
ity in the bond market. These �ndings are also consistent with Næs et al. (2011),
who use data for Norway to show that in times of increased market uncertainty,
some investors exit the stock market, which is perceived to be riskier than other
asset classes, whereas others re-balance their equity portfolios towards larger and
more liquid stocks.
We expect that the �ight-to-quality and �ight-to-liquidity also prevail in the
stock market and therefore try to test these �ight phenomena in the stock market,
deriving the following research hypothesis:
Hypothesis 6: Liquidity spreads between high- and low-credit-quality
assets widen as a reaction to increased market uncertainty, i.e., assets
with a high credit quality become more liquid compared with low-
credit-quality assets during times of �nancial market distress.
As we hypothesize that high-credit-quality stocks are per se more liquid than
low-credit-quality assets (see hypothesis 5), this hypothesis implies both a �ight-
to-liquidity and �ight-to-quality in the stock market.
In the next section, we will survey the existing research on the impact of own-
ership structures on market liquidity.
3.2 Market liquidity and di�erent ownership
structures73
Blockholders, both internal and external, possess economies of scale in the collec-
tion of information or might have access to private, value-relevant information.
Thus, there is a strong belief, backed by theoretical models, that market makers
73 This section is largely based on Rösch and Kaserer (2010).
55
Chapter 3. Relevant literature and research hypotheses
and other market participants face an adverse selection problem from these in-
formed traders. As a result, market makers and uninformed participants therefore
increase the spreads, which leads to poorer market liquidity, as noted in Copeland
and Galai (1983), Glosten and Milgrom (1985) and our discussion in section 2.4.
Hence, there should be a negative empirical relationship between ownership con-
centration and market liquidity, and we thus derive our research hypothesis:
Hypothesis 7: Ownership concentration is generally associated with
higher liquidity costs.
In fact, there is empirical evidence that supports this hypothesis. Demsetz (1968)
was one of the �rst who showed empirically that ownership dispersion (measured
by the number of shareholders) is positively related to liquidity. Becht (1999)
demonstrates that voting power concentration through blocks has a negative ef-
fect on liquidity, as measured by annual turnover divided by market capitalization,
in the Belgian and German stock markets. He�in and Shaw (2000) �nd strong
evidence in a sample of U.S. stocks that the magnitude of the internal or external
blockholder ownership share has a negative impact on the stock liquidity. Sarin
et al. (2000) as well as Dennis and Weston (2001) document that both institutions
and insiders are better informed than other investors, and therefore, greater insider
and institutional ownership is associated with poorer stock liquidity. Brockman
et al. (2009b) notice that inside and outside block ownership impairs stock mar-
ket liquidity (spreads and market depth) by reducing trading activity in an U.S.
sample. Ginglinger and Hamon (2007a) �nd that large insider blockholders ex-
hibit signi�cantly lower liquidity in a French sample. Comerton-Forde and Rydge
(2006) provide evidence that there is a negative relationship between stock own-
ership concentration and liquidity in an Australian sample. The fact that the
56
Chapter 3. Relevant literature and research hypotheses
di�erence between ultimate ownership and control leads to more severe informa-
tion asymmetry and poorer stock liquidity was found by Attig et al. (2006) in a
Canadian sample. Kothare (1997) �nd, in the context of rights and public o�er-
ings, that higher ownership concentration leads to an increase in liquidity costs.
Rights o�erings increase bid-ask spreads, whereas public underwritten o�erings
decrease the spreads. They attribute the di�erence to a change in the resulting
ownership structure, as rights o�erings increase the company's ownership concen-
tration but public underwritten o�ers lead to a more di�use ownership.
All these �ndings support our seventh hypothesis that because of information
asymmetry, ownership concentration impairs stock market liquidity. Furthermore,
these cited examples not only provide evidence for the negative impact of block-
holders in general but also present some �ndings for the same e�ect for speci�c
types of blockholders, mainly insider blockholders. Therefore, we also expect to
provide empirical evidence that market liquidity is impaired by ownership con-
centration in our sample due to informational e�ects. In addition, we hypothesize
that the shareholdings of speci�c blockholder types, namely, insiders and �nancial
investors, should decrease market liquidity. These blockholders increase the level
of information asymmetry because they are better informed, as they either pos-
sess economies of scale in the collection of information or have access to private,
value-relevant information and might trade on this information.74
However, there is also a hypothesis that shareholder concentration can be pos-
itively related to market liquidity, if blockholders do not have access to private
information, cannot leverage economies of scale in the acquisition of information,
74 Existing research that con�rms that insiders are able to earn abnormal returns when tradingin their own company's securities and therefore fail to provide support for the strong-formmarket e�ciency hypothesis, suggests that these insiders trade using non-public value-relevant information, as noted by, e.g., Ja�e (1974), Finnerty (1976), Demsetz (1986) andSeyhun (1986).
57
Chapter 3. Relevant literature and research hypotheses
or simply face restrictions upon engaging in information-based trading. These
conditions reduce the overall share and probability of information-based trading;
consequently, liquidity costs are lower and market liquidity is improved. Thus
far, there is little empirical evidence for this hypothesis, which might prove to
be conditional on the type of blockholder, as access to private information is not
uniformly distributed across all blockholder types. To date, the e�ects of di�erent
blockholder types have not been properly scrutinized.
Hypothesis 8: Certain blockholder types do not have access to value-
relevant information and/or face restrictions upon engaging in information-
based trading. The presence of such blockholder types improves mar-
ket liquidity.
Only Ginglinger and Hamon (2007a) and Fehle (2004) provide some evidence for
this hypothesis. Ginglinger and Hamon (2007a) �nd in France that shareholders
with double voting right shares (a French means of control enhancement rewarding
long-term shareholders, often used by families that want to keep control while in-
creasing free �oat) lead to increased liquidity for outside investors of small, family
�rms. They argue that double voting rights prevent informed shareholders from
trading on private information, as such trading would lead them to lose their dou-
ble voting rights. Consequently, information asymmetry is decreased and there-
fore market liquidity is improved. Fehle (2004) analyzes the e�ect of institutional
blockholders on stock market liquidity. He �nds that for his overall sample, there
is a negative relationship between the share of institutional owners and bid-ask
spreads, but a positive relationship between the number of institutional owners
and bid-ask spreads (both e�ective and posted spreads). In the subsequent analy-
sis of the e�ect of di�erent institutional blockholder types, Fehle (2004) �nds that
58
Chapter 3. Relevant literature and research hypotheses
the positive e�ect of institutional ownership share on stock market liquidity only
holds for mutual funds; whereas for commercial banks and investment managers,
the relationship reverses, and for other types, such as insurance companies and
pension funds, the relationship is insigni�cant. Fehle (2004) explains that there-
fore some types of institutions (like commercial banks and investment managers)
increase the adverse selection costs (in line with our �rst hypothesis), while oth-
ers (like mutual funds) face restrictions in information based trading (in line with
our second hypothesis) or speci�cally seek out stocks with relatively low liquidity
costs.
For our research that scrutinizes the di�erent types of blockholders, we hypoth-
esize that the presence of private blockholders will improve market liquidity. We
believe that private investors either do not have access to private information,
are not able to leverage economies of scale in information acquisition, or are not
willing to trade on any private information. In particular, the unwillingness to
trade on private information seems obvious, as private investors mostly have an
investment interest in long-term strategic opportunities and therefore follow a
buy-and-hold investment strategy, seek a lower security turnover rate and take a
long-term perspective regarding their investment.75
For the remaining blockholder type, strategic investors, the hypothesis is not
so straightforward. As in the case of private blockholders, we would expect that
strategic investors are not willing to trade on private information and therefore
reduce liquidity costs, as strategic investors also usually take a long-term perspec-
tive on their investment if they acquire control of another company. However,
75 In the context of family �rms, several studies, such as, e.g., Casson (1999), Chami (2001)and Bertrand and Schoar (2006), posit that private investors are long-term investors. Theyargue that those investors even often see their investments as an asset that they want topass on to their descendants rather than as wealth that they want to consume during theirlifetimes (see also Becker (1976) and Becker (1981)).
59
Chapter 3. Relevant literature and research hypotheses
this intuition might only hold for �real� strategic investors who possess a majority
stake (≥ 50%) in the acquired company. Such strategic investors are therefore
in control of this company and are usually closely interconnected. For those in-
vestors classi�ed as strategic investors with an ownership stake of less than 50%,
we expect that they impair stock market liquidity, as their minor stake is usually
not driven by a strategic motivation but rather a �nancial motivation. There-
fore, they are more comparable to �nancial investors and thus we expect a similar
deleterious impact on market liquidity for these kinds of strategic blockholders.
In the next section, we will focus on one speci�c type of shareholder, namely,
the insider, and give an overview on the existing research regarding the impact of
insider trading behavior on market liquidity.
3.3 Market liquidity and insider trading76
Insider trading is a topic that has received a tremendous amount of attention in
law, economics and �nance in both practice and academia. Considerable resources
have been devoted to establishing and enforcing legal restrictions for insider trad-
ing, and those researchers in favor of insider trading restrictions at least partially
justify these restrictions with the hypothesis that insider trading creates an ad-
verse selection problem that impairs stock market liquidity.77
Early empirical research on market liquidity has focused on investigating the
determinants of the cross-sectional variation in liquidity across stocks, as seen in,
e.g., Benston (1974), Stoll (1978a), Glosten and Harris (1988), Stoll (1989) and
George et al. (1991). These researchers conclude that informational e�ects explain
76 This section is largely based on Rösch and Kaserer (2011).77 See, e.g., Georgakopoulos (1993).
60
Chapter 3. Relevant literature and research hypotheses
some of the variation in the market liquidity. However, further empirical research
is required to better understand the impact of adverse selection on stock market
liquidity. In particular, the subject of this work - the impact of insider trading
on market liquidity - is an interesting �eld of research, as insider trading seems
to be a prime example of information-based activity in the �nancial market and,
as already mentioned, the few available empirical research results in this �eld are
mixed. To appropriately comprehend the existing research, we summarize it by
categorizing these research results in accord with their observed impact of insider
trading on market liquidity.
We begin with those studies that indicate that insider trading has no impact on
stock market liquidity: Cornell and Sirri (1992) and Chakravarty and McConnell
(1997) dedicate their research to two prominent cases of illegal insider trading ac-
tivity. Cornell and Sirri (1992) identify illegal insider transaction centered around
the acquisition of Campbell Taggart by Anheuser-Busch in 1982, by using ex post
court records. They report that their spread estimates78 did not rise during the
period of illegal insider trading and therefore market liquidity did not fall.
Chakravarty and McConnell (1997) analyze the illegal insider trading activity
of Ivan Boesky surrounding the acquisition of Carnation Company by Nestlé S.A.
in 1984. Chakravarty and McConnell (1997) demonstrate that both the bid-ask
spreads and depths appear to be una�ected by his trades; however, for certain
data depths appear to be improved. Interestingly, both studies that found no
impact of insider trading on market liquidity did focus on illegal insider trading.
We now continue with those empirical research studies demonstrating that mar-
ket liquidity is improved by insider trading: The initial public o�ering (IPO)
78 They use the serial covariance measure presented by Roll (1984), which we explained insection 2.5, to estimate spreads, as the bid-ask spread was not directly observable in theirdata.
61
Chapter 3. Relevant literature and research hypotheses
lockup expiration constitutes an attractive event in corporate �nance for test-
ing the informational e�ect of insider trading activity on market liquidity, as on
the lockup expiration day, insiders are legally allowed to sell their shares for the
�rst time since the IPO. Therefore, lockup expirations presumably marks a pre-
announced event during which informed insider traders enter the equity markets
via large sale transactions. Both Cao et al. (2004) and Krishnamurti and Thong
(2008) concentrate on this event type for their studies. Cao et al. (2004) analyze
intraday trades around 1,497 IPO lockup expiration dates. In their overall sam-
ple, insider sales have little e�ect on e�ective spreads. However, for those lockup
expirations where insiders disclose their share sales (23% of the whole sample),
spreads actually decline.
Krishnamurti and Thong (2008) focus on the IPO lockup expiration of 399
technology stocks listed on the NASDAQ market for the period covering 1998 to
2000. They found that the market liquidity actually improves immediately after
the lockup expiration period. Similarly to Cao et al. (2004), they discover that
for the set of �rms where insiders actually report their sales during a 10-day post
lockup expiration period, bid-ask spreads actually decline more as compared with
other �rms. They attribute their �nding largely to a decline in the adverse selec-
tion component of the spread. It is noteworthy that both studies demonstrating
a positive relationship between insider trading and market liquidity solely focus
on insider sales in the context of lockup expirations.
We conclude our literature overview with the empirical research that discovered
that insider trading impairs market liquidity. Bettis et al. (2000) analyze corporate
policies and procedures, e.g., blackout periods79, put in place to regulate insider
79 According to Bettis et al. (2000), most corporate policies de�ne blackout periods in relationto earnings announcements, in which cases the single most common rule for a blackoutperiod only permits insider trading for the period 3 to 12 trading days after the quarterly
62
Chapter 3. Relevant literature and research hypotheses
trading in the company's own shares. Bettis et al. (2000) conclude that blackout
periods successfully suppress both insider purchases and insider sales, and they
found that the bid-ask spread is narrower by approximately two basis points during
the blackout period, which implies, in turn, that market liquidity is impaired in
periods where insider trading is permitted.
Over a period from May 1996 to April 2000, Cheng et al. (2006) examine the
e�ect of 12,435 insider transactions on the market liquidity of 701 companies listed
on the Hong Kong Stock Exchange. For their sample, they concluded that spread
widens and depth falls on insider trading days compared with non-insider trading
days.
Chung and Charoenwong (1998) analyze 1,101 NYSE and AMEX stocks and
11,522 insider transactions in 1988. Although they did not �nd any evidence
for a spread change on insider trading days in a time-series regression analysis,
they found increased spreads for those companies with a greater extent of insider
trading in a cross-section analysis. They argue that market participants may not
be able to detect insider trading when it occurs; however, in their cross-section
analysis they suggest that the uninformed market participants price protect them-
selves against a cross-sectionally greater extent of insider trading. We conclude
that this cross-sectional measure of insider activity can be seen as a proxy for
insider ownership. Thus, their �ndings are in line with several studies analyzing
the impact of insider ownership on stock market liquidity, which showed that a
concentration of insider holdings impairs market liquidity.
As the existing research on insider trading is very limited, we will further brie�y
examine an adjacent stream of literature that focuses on the in�uence of stock re-
purchases, which are, by de�nition, large-scale managerial trades, on stock market
earnings announcement and disallows trading at all other times.
63
Chapter 3. Relevant literature and research hypotheses
liquidity: Barclay and Smith (1988) investigate 244 open-market repurchases by
198 NYSE-listed �rms between 1970 and 1978 and �nd that stock repurchases
have a negative impact on market liquidity. Brockman and Chung (2001) study
the timing of open market share repurchases and the resultant impact on �rm
liquidity for �rms listed on the Hong Kong Stock Exchange, a market that re-
quires public disclosure of share repurchases. In their sample, market liquidity is
impaired by stock repurchases. Ginglinger and Hamon (2007b) use data from Eu-
ronext Paris to examine the timing of actual stock repurchases and their impact
on market liquidity for the period from 2000 to 2002. They also discover that
market liquidity deteriorates during repurchase periods.
Summarizing the literature that indicates a deleterious e�ect of insider trading,
we can conclude that much of this research focuses on either insider purchases
(Barclay and Smith (1988), Brockman and Chung (2001) and Ginglinger and
Hamon (2007b)) or on a proxy of insider ownership instead of insider trading
(Chung and Charoenwong (1998) and Bettis et al. (2000)).
Although the presented previous studies report mixed empirical results and
provide no clear indication of how market liquidity is a�ected by insider trading,
we establish a research hypothesis that tries to integrate and explain most of the
previously discussed results. The adverse selection theory posits that market liq-
uidity falls, i.e., liquidity costs increase, as the intensity of information asymmetry
rises. However, the question then remains of what factors in�uence the market's
assessment of information asymmetry created by insiders. We are con�dent that
market participants proxy the extent of information asymmetry induced by in-
siders by the share of insider-ownership.80 Given this, we can derive our research
hypothesis that predicts a twofold impact of insider transactions on stock market
80 See, e.g., Chiang and Venkatesh (1988).
64
Chapter 3. Relevant literature and research hypotheses
liquidity:
Hypothesis 9: Market liquidity is impaired on and after days of
insider purchases.
We expect market participants to price protect by increasing liquidity costs on
and after the days of insider purchases. This occurs because insider purchases
increase the share of insider ownership and consequently increase the information
asymmetry, as insider ownership constitutes a measure of information asymmetry
induced by insiders.
This hypothesis is also supported by the �ndings of Barclay and Smith (1988),
Chung and Charoenwong (1998), Bettis et al. (2000), Brockman and Chung (2001)
and Ginglinger and Hamon (2007b) presented above that focus on insider pur-
chases or proxy insider ownership in their works.
Hypothesis 10: Market liquidity is improved on and after days of
insider sales.
As a corollary to hypothesis 9, insider sales, by decreasing the share of insider
holdings, therefore alleviating information asymmetry and improving market liq-
uidity on and after the days of insider sales. Our hypothesis is also consistent
with the �nding of Lakonishok and Lee (2001), who argue that purchases are the
only source of informativeness of insider activities, whereas insider sales appear
to have no predictive ability.81 Therefore, insider sales are driven by liquidity or
diversi�cation reasons and thus are bringing additional liquidity into the market.
In addition, the empirical �ndings of Cao et al. (2004) and Krishnamurti and
Thong (2008), who analyzed large-scale insider sales during lockup expirations,
seem to support this hypothesis.
81 Further studies positing the informativeness of purchases compared with sales are Madha-van and Smidt (1991) and Chan and Lakonishok (1993).
65
Chapter 3. Relevant literature and research hypotheses
Both hypotheses on the e�ect of insider trading are consistent with empirical
literature focusing on the relationship of insider ownership and market liquidity,
which showed that insider ownership impairs market liquidity, as seen in, e.g.,
He�in and Shaw (2000) and our results in section 5.2. Purchases leading to a
higher share of insider ownership should worsen market liquidity, while sales de-
creasing the insider ownership should improve market liquidity.
In this chapter we provided an overview of the existing literature in our �eld of
research and derived testable hypotheses. This will be followed by an introduction
of our empirical data in the next chapter.
66
Chapter 4Sample data and descriptive information
This chapter describes in detail the data sets that we will use in the empirical
analysis in Chapter 5 to answer our research questions and test our research
hypotheses that were derived in Chapter 3. We divide the presentation of the
di�erent types of data according to our three main research questions in section
4.1. In particular, the presentation of the average daily liquidity costs L(q) for our
sample stocks is quite useful for obtaining a sense of the magnitude and variance
of liquidity costs and liquidity risk in the German market. This is followed by
an overview of the descriptive statistics of our data sets in section 4.2, which will
provide useful �rst insights into our data sets in the sample period.
4.1 Description of sample data sets82
In our research, we focus on the 160 companies listed in one of the four major Ger-
man stock indices (DAX, MDAX, SDAX, TecDAX), which are all traded on Xetra.
The DAX is a blue-chip stock market index consisting of the 30 major publicly
82 This section is largely based on Rösch and Kaserer (2010), Rösch and Kaserer (2011) andRösch and Kaserer (2012).
67
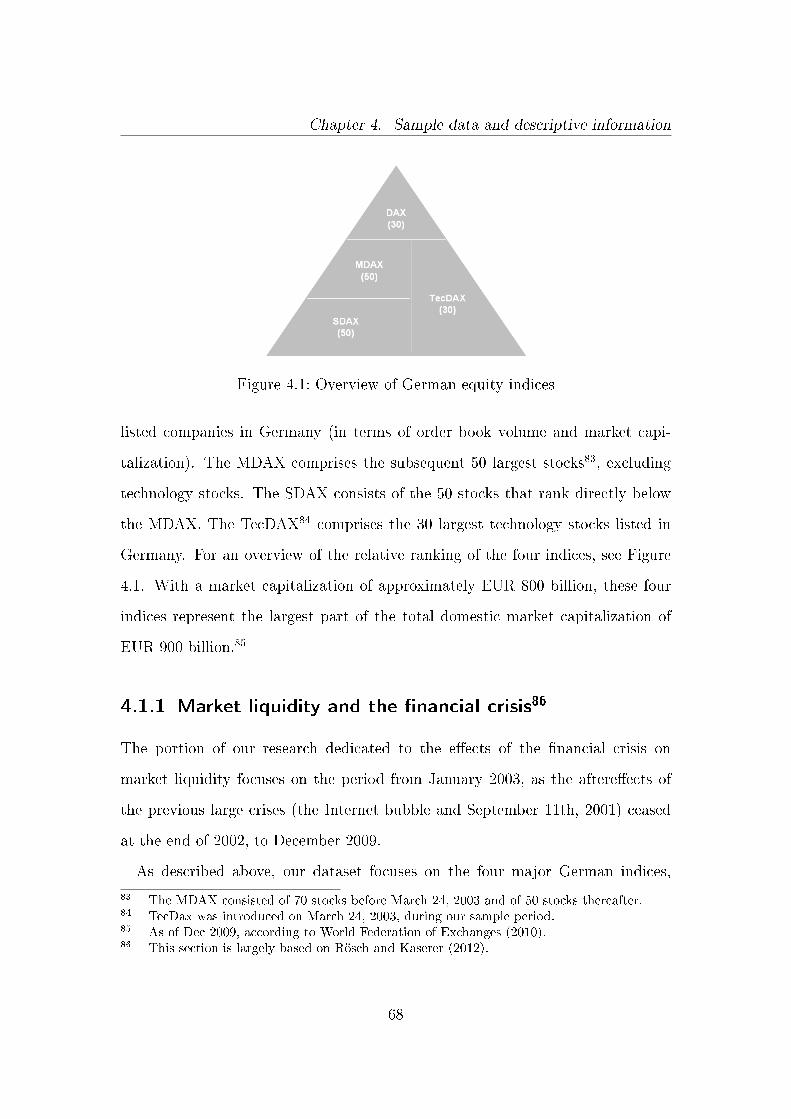
Chapter 4. Sample data and descriptive information
Figure 4.1: Overview of German equity indices
listed companies in Germany (in terms of order book volume and market capi-
talization). The MDAX comprises the subsequent 50 largest stocks83, excluding
technology stocks. The SDAX consists of the 50 stocks that rank directly below
the MDAX. The TecDAX84 comprises the 30 largest technology stocks listed in
Germany. For an overview of the relative ranking of the four indices, see Figure
4.1. With a market capitalization of approximately EUR 800 billion, these four
indices represent the largest part of the total domestic market capitalization of
EUR 900 billion.85
4.1.1 Market liquidity and the �nancial crisis86
The portion of our research dedicated to the e�ects of the �nancial crisis on
market liquidity focuses on the period from January 2003, as the aftere�ects of
the previous large crises (the Internet bubble and September 11th, 2001) ceased
at the end of 2002, to December 2009.
As described above, our dataset focuses on the four major German indices,
83 The MDAX consisted of 70 stocks before March 24, 2003 and of 50 stocks thereafter.84 TecDax was introduced on March 24, 2003, during our sample period.85 As of Dec 2009, according to World Federation of Exchanges (2010).86 This section is largely based on Rösch and Kaserer (2012).
68
Chapter 4. Sample data and descriptive information
and because the composition of the four indices changes over time according to
speci�c rules set by Deutsche Börse, we dynamically adjusted the sample over our
sample period from January 2003 to December 2009. We included a company in
our sample for the time it has been a constituent of any of the four indices. In
line with this procedure, there are 272 companies listed in one of the four indices
during our sample period. In the following sections, we will introduce our data
for market liquidity, ratings, as well as the control variables, in detail.
4.1.1.1 Market liquidity
In total, our sample contains over 2.3 million observations for the 1,760 trading
days in our sample period87. Table 4.1 shows an overview of the average daily
liquidity costs L(q) for our sample stocks in the four major German stock market
indices. Average liquidity costs were 121 bps across all volume classes and indices
and range from 6 bps for an order volume of Euro 25,000 in DAX stocks to 500 bps
for an order volume of Euro 1 million in SDAX stocks. Table 4.1 also shows that
there is a clear ranking of liquidity costs among the stock indices, i.e., stocks in
the DAX have the lowest liquidity costs, followed by those in the MDAX, TecDAX
and SDAX, and that liquidity costs are order-size-dependent, i.e., the larger the
order sizes q, the larger the liquidity costs L(q).
87 Because for certain stocks, our dataset contains liquidity data for volume classes outside thestandardized set of volume classes of the respective index, we excluded these observations(0.02% of the total observations in our sample). We assumed that these observations weredue to tests of an extended volume class coverage in the automatic calculation routineof the Xetra system, as the observations were only available for connected periods of lessthan a trading week. We removed these observations to ensure that our dataset remainsrepresentative.
69
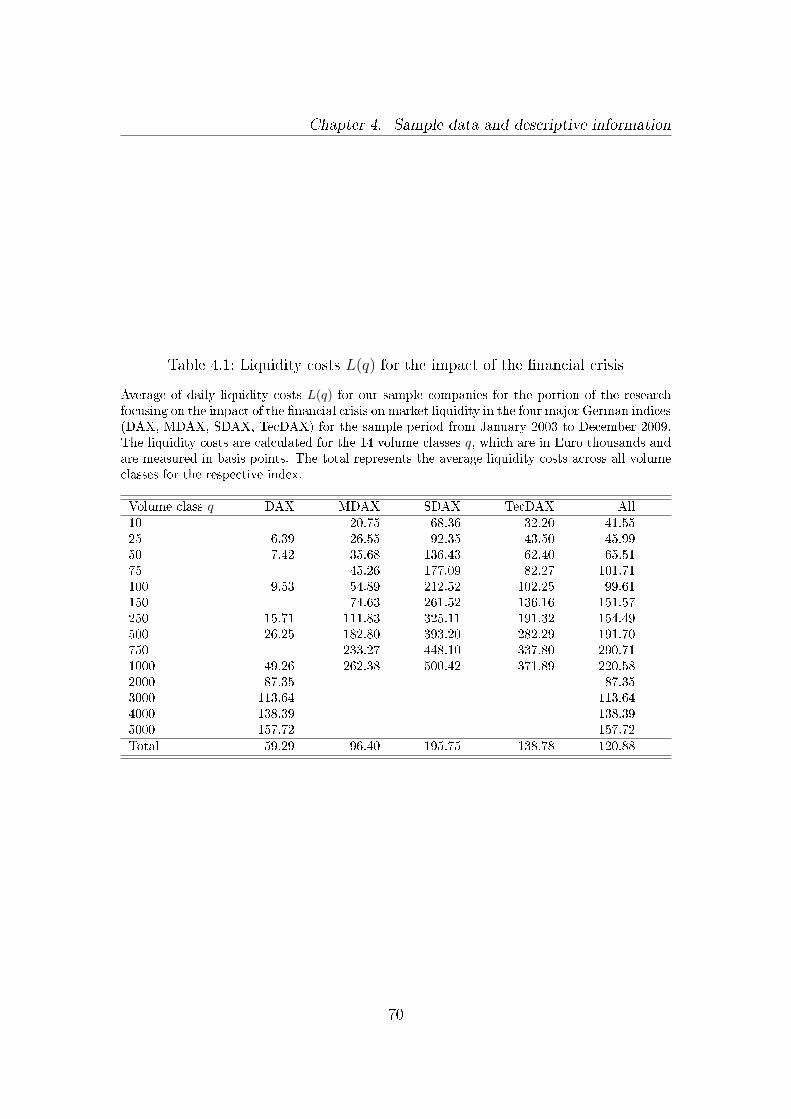
Chapter 4. Sample data and descriptive information
Table 4.1: Liquidity costs L(q) for the impact of the �nancial crisis
Average of daily liquidity costs L(q) for our sample companies for the portion of the researchfocusing on the impact of the �nancial crisis on market liquidity in the four major German indices(DAX, MDAX, SDAX, TecDAX) for the sample period from January 2003 to December 2009.The liquidity costs are calculated for the 14 volume classes q, which are in Euro thousands andare measured in basis points. The total represents the average liquidity costs across all volumeclasses for the respective index.
Volume class q DAX MDAX SDAX TecDAX All10 20.75 68.36 32.20 41.5525 6.39 26.55 92.35 43.50 45.9950 7.42 35.68 136.43 62.40 65.5175 45.26 177.09 82.27 101.71100 9.53 54.89 212.52 102.25 99.61150 74.63 261.52 136.16 151.57250 15.71 111.83 325.11 191.32 154.49500 26.25 182.80 393.20 282.29 191.70750 233.27 448.10 337.80 290.711000 49.26 262.38 500.42 371.89 220.582000 87.35 87.353000 113.64 113.644000 138.39 138.395000 157.72 157.72Total 59.29 96.40 195.75 138.78 120.88
70
Chapter 4. Sample data and descriptive information
4.1.1.2 Ratings
Information on company ratings are obtained from Thomson Financial Datas-
tream. If no rating information was available in Thomson Financial Datastream,
we obtained the information from the company's annual or quarterly reports, its
website or from the company's investor relations department. We collected the
individual company's full history of the long-term issuer ratings from Standard &
Poor's (S&P)88 during the sample period.
Overall, 67 companies89 possess a rating (at least for some time) during our
sample period. For all other companies, we obtained an explicit statement from
the respective company that they are not publicly rated.
Figure 4.2 provides an overview of the distribution of our daily liquidity obser-
vations by rating category and index. Almost 78% of the observations that are
associated with a credit rating are associated with investment grade ratings. How-
ever, the distribution is heterogeneous across indices: Almost 93% of the obser-
vations in the DAX and only 34% of the rated SDAX observations are associated
with investment grade ratings. There appears to be a clear rating ranking among
the indices, i.e., companies in larger indices have better ratings than companies
in smaller indices.
88 Five companies, namely Aareal Bank, GEA Group, IKB Deutsche Industriebank, P�eidererand ProSiebenSat.1 Media were not rated by S&P but by Fitch; Degussa and Rhoen-Klinikum were only rated by Moody's; and VHB Holding was exclusively rated by EulerHermes Rating. For these companies we translated the respective ratings into the S&Prating categories. A table matching the di�erent rating categories can be found in theAppendix (see Table A.1).
89 See Table A.2 in the Appendix for an overview of the rated companies.
71
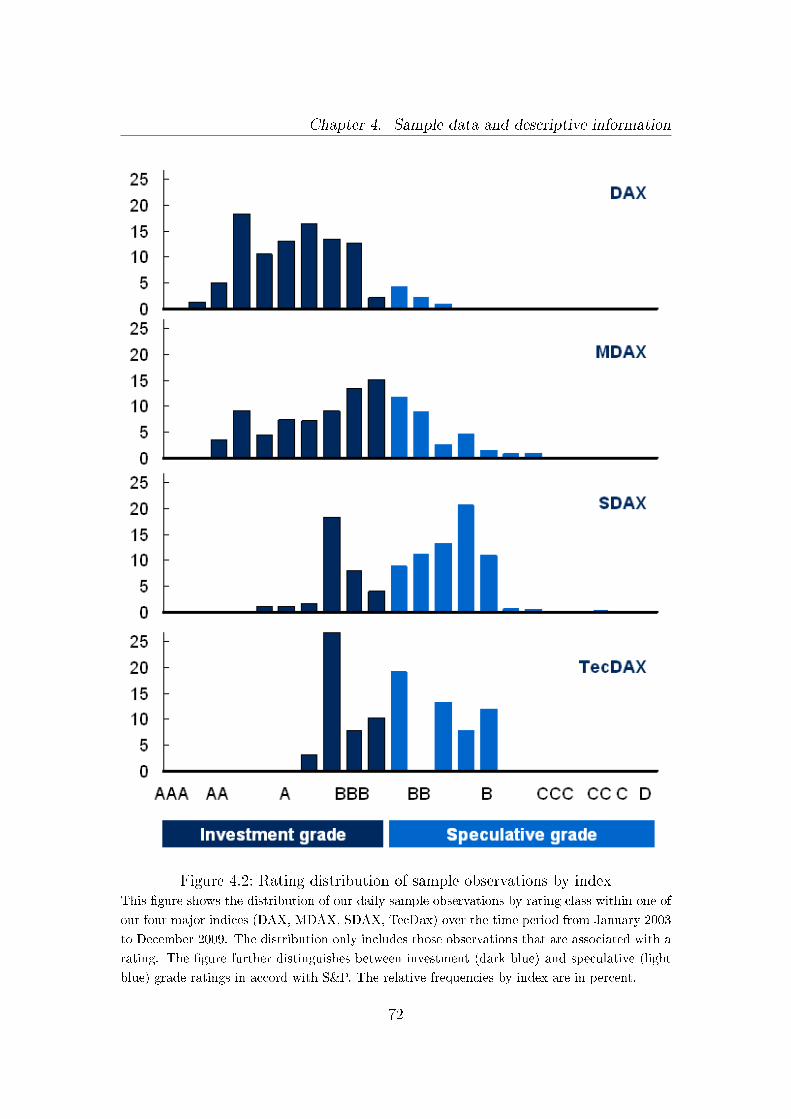
Chapter 4. Sample data and descriptive information
Figure 4.2: Rating distribution of sample observations by indexThis �gure shows the distribution of our daily sample observations by rating class within one of
our four major indices (DAX, MDAX, SDAX, TecDax) over the time period from January 2003
to December 2009. The distribution only includes those observations that are associated with a
rating. The �gure further distinguishes between investment (dark blue) and speculative (light
blue) grade ratings in accord with S&P. The relative frequencies by index are in percent.
72
Chapter 4. Sample data and descriptive information
4.1.1.3 Index, EONIA and EURIBOR data
For the analysis of liquidity commonality, we further require return data from
several indices (DAX, MDAX, SDAX, TecDAX, DAX All Banks) and interest rate
data of the EONIA and the EURIBOR. The DAX, MDAX, SDAX and TecDAX
are the four major German stock indices, and their index constituents are all
traded on Xetra. The DAX All Banks index consists of all major German banks
and is therefore a good proxy for the development of the market valuation of
the German banking sector. The EONIA (Euro Over Night Index Average) is
an interest rate for unsecured, overnight interbank loans. It is computed by the
European Central Bank as a weighted average of all such interbank transactions.
The same panel of banks is used for the EURIBOR (Euro Interbank O�ered
Rate). The EURIBOR is the average rate at which the panel banks o�er to lend
unsecured funds to other panel banks in the interbank market for maturities of
one, two and three weeks and all monthly maturities of one to twelve months. For
our analyses, we use the 3-month EURIBOR.
The daily index returns of the DAX, MDAX, SDAX, and TecDAX, the monthly
index returns of the DAX All Banks and the 3-month EURIBOR are all obtained
from Thomson Financial Datastream. The EONIA was provided by the European
Central Bank.
4.1.2 Market liquidity and di�erent ownership structures90
This portion of our research focuses on the same 7 years, from January 2003
to December 2009, as the research portion above on the impact of the �nancial
crisis. Due to the same dynamic adjustment of the index composition, we end
90 This section is largely based on Rösch and Kaserer (2010).
73
Chapter 4. Sample data and descriptive information
up with the same 272 companies as above. However, as it is standard for studies
on ownership structures, we exclude all 40 �nancial �rms from our sample. We
further remove 20 companies with foreign ISINs, as they have di�erent corporate
governance structures, which would distort our analyses. This process leaves us
with a total of 212 companies in our sample period. In the following sections we
introduce our data for market liquidity as well as for the ownership concentration
and structures.
4.1.2.1 Market liquidity
In total, our sample contains over 1.5 million observations in our sample period91.
For our research we, calculated the yearly average of the liquidity costs L(q) for
every single company and every available volume class q. Table 4.2 shows an
overview of the average daily liquidity costs L(q) for our sample stocks in the four
major German stock market indices. The average liquidity costs were 178 bps
across all volume classes and indices and range from 6 bps for an order volume
of Euro 25,000 in DAX stocks to nearly 700 bps for an order volume of Euro
1 million in SDAX stocks. Table 4.2 again shows that there is a clear ranking
of liquidity costs among the stock indices, i.e., the stocks in the DAX have the
lowest liquidity costs followed by those in the MDAX, TecDAX and SDAX, and
that liquidity costs are order-size-dependent, i.e., the larger the order sizes q, the
larger the liquidity costs L(q).
91 Because, for certain stocks, our dataset contains liquidity data for volume classes outsidethe standardized set of volume classes of the respective index, we excluded these 325 obser-vations (0.02% of the total observations in our sample). We assumed that these observationswere due to tests of an extended volume class coverage in the automatic calculation routineof the Xetra system, as the observations were only available for connected periods of lessthan a trading week. We removed these observations to ensure that our dataset remainsrepresentative.
74
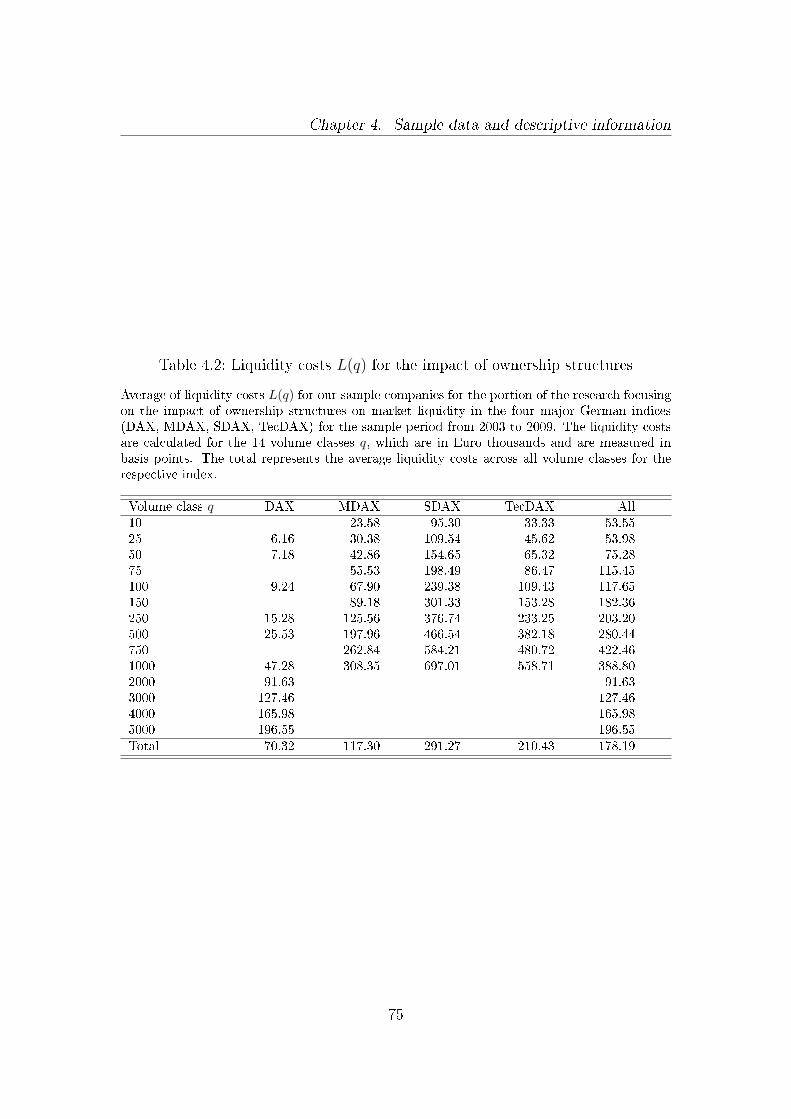
Chapter 4. Sample data and descriptive information
Table 4.2: Liquidity costs L(q) for the impact of ownership structures
Average of liquidity costs L(q) for our sample companies for the portion of the research focusingon the impact of ownership structures on market liquidity in the four major German indices(DAX, MDAX, SDAX, TecDAX) for the sample period from 2003 to 2009. The liquidity costsare calculated for the 14 volume classes q, which are in Euro thousands and are measured inbasis points. The total represents the average liquidity costs across all volume classes for therespective index.
Volume class q DAX MDAX SDAX TecDAX All10 23.58 95.30 33.33 53.5525 6.16 30.38 109.54 45.62 53.9850 7.18 42.86 154.65 65.32 75.2875 55.53 198.49 86.47 115.45100 9.24 67.90 239.38 109.43 117.65150 89.18 301.33 153.28 182.36250 15.28 125.56 376.74 233.25 203.20500 25.53 197.96 466.54 382.18 280.44750 262.84 584.21 480.72 422.461000 47.28 308.35 697.01 558.71 388.802000 91.63 91.633000 127.46 127.464000 165.98 165.985000 196.55 196.55Total 70.32 117.30 291.27 210.43 178.19
75
Chapter 4. Sample data and descriptive information
4.1.2.2 Ownership
Information on stock ownership structures is obtained from Hoppenstedt �Ak-
tienführer�. The �Hoppenstedt Aktienführer� is a German annual database that
provides certain information on listed German �rms (e.g., detailed information on
ownership structures, board compositions, and balance sheet data). The owner-
ship structures are those available at the end of each year.
For every company and every year in our sample, we collected the individual
blockholders92 and their respective stockholdings.93 Furthermore, we collected
information on the individual management board and supervisory board members
and their respective stockholdings from Hoppenstedt.
From this information, we calculated the following measures that serve as prox-
ies for the ownership concentration: the total share of blockholdings C94, the
number of blockholders CN , the Her�ndahl index HHI95 and the share of the
largest C1 and the three and �ve largest blockholders, C1C3 and C1C5, respec-
tively. Having detailed information on every blockholder, we are able to further
break down these proxies into four mutually exclusive and collectively exhaustive
categories: insiders, strategic, �nancial and private investors. For these categories,
we calculated the respective percentage of blockholdings. We de�ne as insiders all
current and former management board and supervisory board members, employ-
ees as well as own shares. The insider category, therefore, includes all shares that
are directly or indirectly controlled by the management and supervisory board.
92 We follow prior research to de�ne blockholders as shareholders who hold �ve percent ormore of a company's total shares.
93 We collected a maximum of the 12 largest individual blockholders for our sample companies.94 Measured as a fraction [0;1].95 Following prior research we use the sum of the squares of the individual blockholder share-
holdings: HHI =∑h p
2h where ph represents the percentage share of the individual block-
holders. The Her�ndahl index is a parameter specifying the characteristics of the sizedistribution of the blockholder shareholdings, see, e.g., Cubbin and Leech (1983).
76
Chapter 4. Sample data and descriptive information
As private investors, we classify those blockholdings that are held by individuals
as part of their personal assets.
4.1.3 Market liquidity and insider trading96
As the disclosure requirement of directors' dealings came into e�ect on July 1st,
2002, we focus on the period from July 2002 to December 2009 in our research on
the impact of insider trading activity on market liquidity.
Once again, we dynamically adjust the sample over our sample period from July
2002 to December 2009 to include a company in our sample for the time it has
been a constituent of any of the four major indices. In line with this procedure,
there are 285 companies listed in one of the four indices during our sample period.
In the following sections, we will introduce our data for market liquidity, directors'
dealings and insider ownership.
4.1.3.1 Market liquidity
In total, our sample contains over 2.4 million observations for the 1,888 trading
days in our sample period97. Table 4.3 shows an overview of the average daily
liquidity costs L(q) for our sample stocks in the four major German stock market
indices. The average liquidity costs were 124 bps across all volume classes and
indices and range from 7 bps for an order volume of Euro 25,000 in DAX stocks
to 500 bps for an order volume of Euro 1 million in SDAX stocks. Table 4.3 also
96 This section is largely based on Rösch and Kaserer (2011).97 Because, for certain stocks, our dataset contains liquidity data for volume classes outside
the standardized set of volume classes of the respective index, we excluded these 500 obser-vations (0.02% of the total observations in our sample). We assumed that these observationswere due to tests of an extended volume class coverage in the automatic calculation routineof the Xetra system, as the observations were only available for connected periods of lessthan a trading week. We removed these observations to ensure that our dataset remainsrepresentative.
77
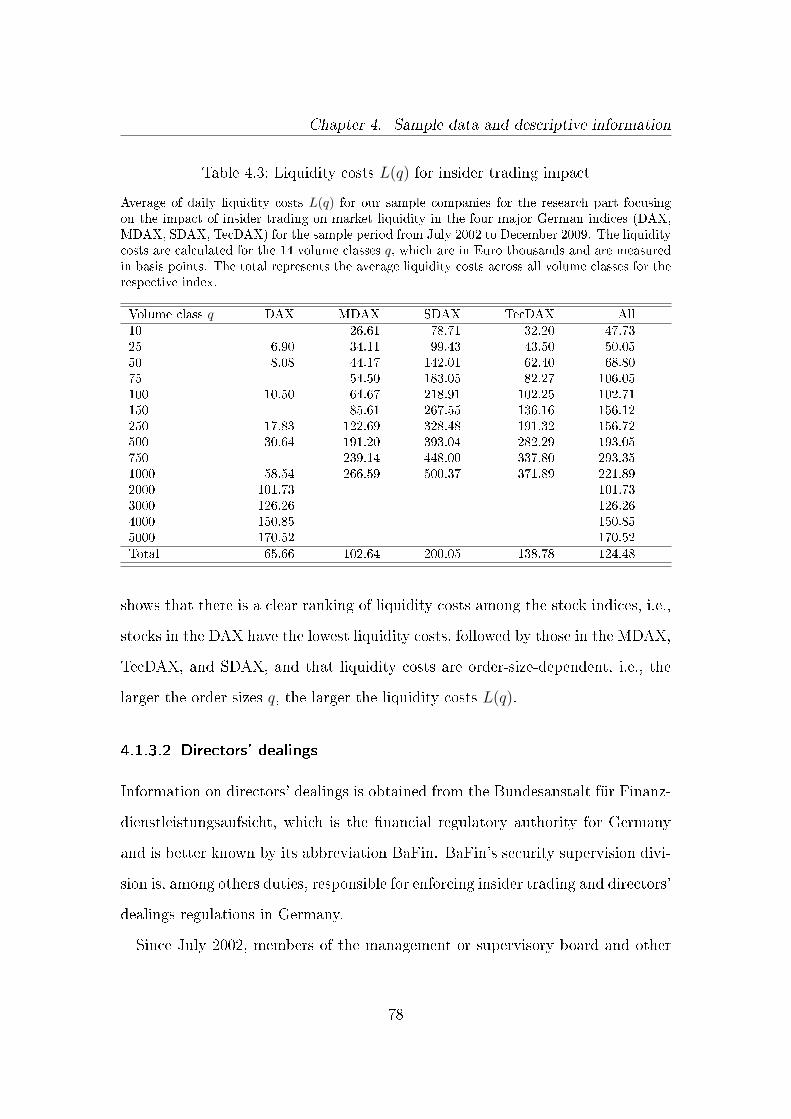
Chapter 4. Sample data and descriptive information
Table 4.3: Liquidity costs L(q) for insider trading impact
Average of daily liquidity costs L(q) for our sample companies for the research part focusingon the impact of insider trading on market liquidity in the four major German indices (DAX,MDAX, SDAX, TecDAX) for the sample period from July 2002 to December 2009. The liquiditycosts are calculated for the 14 volume classes q, which are in Euro thousands and are measuredin basis points. The total represents the average liquidity costs across all volume classes for therespective index.
Volume class q DAX MDAX SDAX TecDAX All10 26.61 78.71 32.20 47.7325 6.90 34.11 99.43 43.50 50.0550 8.08 44.17 142.01 62.40 68.8075 54.50 183.05 82.27 106.05100 10.50 64.67 218.91 102.25 102.71150 85.61 267.55 136.16 156.12250 17.83 122.69 328.48 191.32 156.72500 30.64 191.20 393.04 282.29 193.05750 239.14 448.00 337.80 293.351000 58.54 266.59 500.37 371.89 221.892000 101.73 101.733000 126.26 126.264000 150.85 150.855000 170.52 170.52Total 65.66 102.64 200.05 138.78 124.48
shows that there is a clear ranking of liquidity costs among the stock indices, i.e.,
stocks in the DAX have the lowest liquidity costs, followed by those in the MDAX,
TecDAX, and SDAX, and that liquidity costs are order-size-dependent, i.e., the
larger the order sizes q, the larger the liquidity costs L(q).
4.1.3.2 Directors' dealings
Information on directors' dealings is obtained from the Bundesanstalt für Finanz-
dienstleistungsaufsicht, which is the �nancial regulatory authority for Germany
and is better known by its abbreviation BaFin. BaFin's security supervision divi-
sion is, among others duties, responsible for enforcing insider trading and directors'
dealings regulations in Germany.
Since July 2002, members of the management or supervisory board and other
78
Chapter 4. Sample data and descriptive information
persons with executive duties, who have access to (value-relevant) insider infor-
mation are required to notify both the company and BaFin of any dealings in
their �rm's own shares , in accordance with section 15a of the Securities Trading
Act (Wertpapierhandelsgesetz � WpHG). The same requirement �also applies to
spouses, registered civil partners, dependent children and other relatives living
with them in the same household for at least one year. In certain circumstances,
legal persons, such as establishments acting in a �duciary capacity (e.g., founda-
tions) and partnerships, may also be subject to the noti�cation requirement.�98
For every company in our sample, we collect every single transaction made by
an insider during our sample period. The information on the transaction that was
provided by BaFin includes the date, price, size (as the number of shares traded)
and type (either a purchase or sale) of the transaction. Combining these data with
our detailed information on the insider who initiated the transaction, we are able
to further break down the insiders into three mutually exclusive and collectively
exhaustive insider categories: the management board, the supervisory board and
the other employees. Therefore, we are able to calculate the number of insiders
trading on a trading day and the respective total transaction size, and we are able
to distinguish this information for both buy and sell transactions and our three
insider categories.
4.1.3.3 Insider ownership
Information on insider ownership is also obtained from Hoppenstedt �Aktien-
führer�. The insider ownership data are those that are available at the end of
each year.
98 Bundesanstalt für Finanzdienstleistungsaufsicht (BaFin) (2012)
79
Chapter 4. Sample data and descriptive information
For every company and every year in our sample99 we collect the 12 largest
individual shareholders. We further collect information on the individual man-
agement board and supervisory board members and are therefore able to identify
their respective stock-holdings from Hoppenstedt. We then calculate the total
share owned by insiders100 at the end of the year. With this information, we are
able to relate the nominals transacted by insiders on a day to the total nominals
owned by insiders at the end of the year.
4.1.4 General control variables101
Prior research suggests that liquidity costs are at least partially explained by
the variations in share price, return volatility, trading activity and �rm size.102
Therefore, we use the daily Xetra closing price P , the standard deviation of daily
log-returns σr, the daily transaction volume V O as a proxy for trading activity
and the daily market valueMV as a proxy for �rm size as control variables in our
model speci�cations. In an order-driven market, the rationale for these control
variables is mainly based on considerations about order processing, inventory and
information asymmetry.103
99 As the insider ownership information is only available at the end of each year, we restrictour sample to the period from January 1st, 2003 to December 31st, 2009 to use only full yearperiods for the analysis that uses data on insider ownership. Analogously to the portion ofour research focusing on the ownership structures, we further excluded all 40 �nancial �rmsand all 20 companies with foreign ISINs from our sample, as it is standard for studies thatanalyze ownership structures, as they might have di�erent corporate governance structuresthat might distort our analysis.
100 We de�ne as insiders all current and former management board and supervisory boardmembers, employees as well as own shares. The insider category, therefore, includes allshares that are directly or indirectly controlled by the management and supervisory board.
101 This section is largely based on Rösch and Kaserer (2010), Rösch and Kaserer (2011) andRösch and Kaserer (2012).
102 See, e.g., Benston (1974), Stoll (1978a), Copeland and Galai (1983), Barclay and Smith(1988), Hanley et al. (1993), Corwin (1999), Stoll (2000), He�in and Shaw (2000), Acharyaand Pedersen (2005) and Stange and Kaserer (2008).
103 See, e.g., Stoll (2000) and Corwin (1999).
80
Chapter 4. Sample data and descriptive information
The price level P controls for the e�ect of discreteness104 and is also a further risk
proxy, as lower-priced stocks tend to be riskier105. Hence, liquidity costs should
theoretically be a decreasing function of the price level.106 On the one hand, return
volatility measures the inventory risk of limit order traders, e.g., the risk of non-
execution due to adverse price changes of stocks in the inventory, and on the other
hand, it serves as a proxy for the general market condition and risk107. Therefore,
liquidity costs should theoretically increase with a rise in the return volatility.108
Transaction volume V O proxies inventory risk, as the probability of ful�llment
of limit orders tend to increase with high transaction volume. Consequently,
there should be an inverse relationship between transaction volume and liquidity
costs. Similarly to trading volume, market value MV proxies inventory risk for
the same reasons. However, the market value of a company is also a proxy for
information asymmetry, as there is usually better analyst and media coverage for
larger companies, and therefore, the adverse selection costs resulting from the risk
of trading with individuals who possess private information decreases. All in all,
smaller stocks tend to be less liquid.109
Daily stock returns, daily stock prices, daily trading volume, and daily mar-
ket capitalization are obtained from Thomson Financial Datastream. We had to
adjust the daily price data because Datastream carries forward price data if no
transaction took place. We therefore removed all price data from days when no
transaction volume was recorded. The data for market valueMV and transaction
volume V O were used as provided by Datastream. For the portion of our research
104 Cf. Harris (1994).105 See, e.g., Bachrach and Galai (1979).106 See, e.g., Stoll (2000).107 Stoll (1978b) and Ho and Stoll (1981) theoretically show that return volatility, rather than
systematic risk, is a relevant driver for liquidity costs.108 See, e.g., Copeland and Galai (1983).109 See, e.g., Pastor and Stambaugh (2003).
81
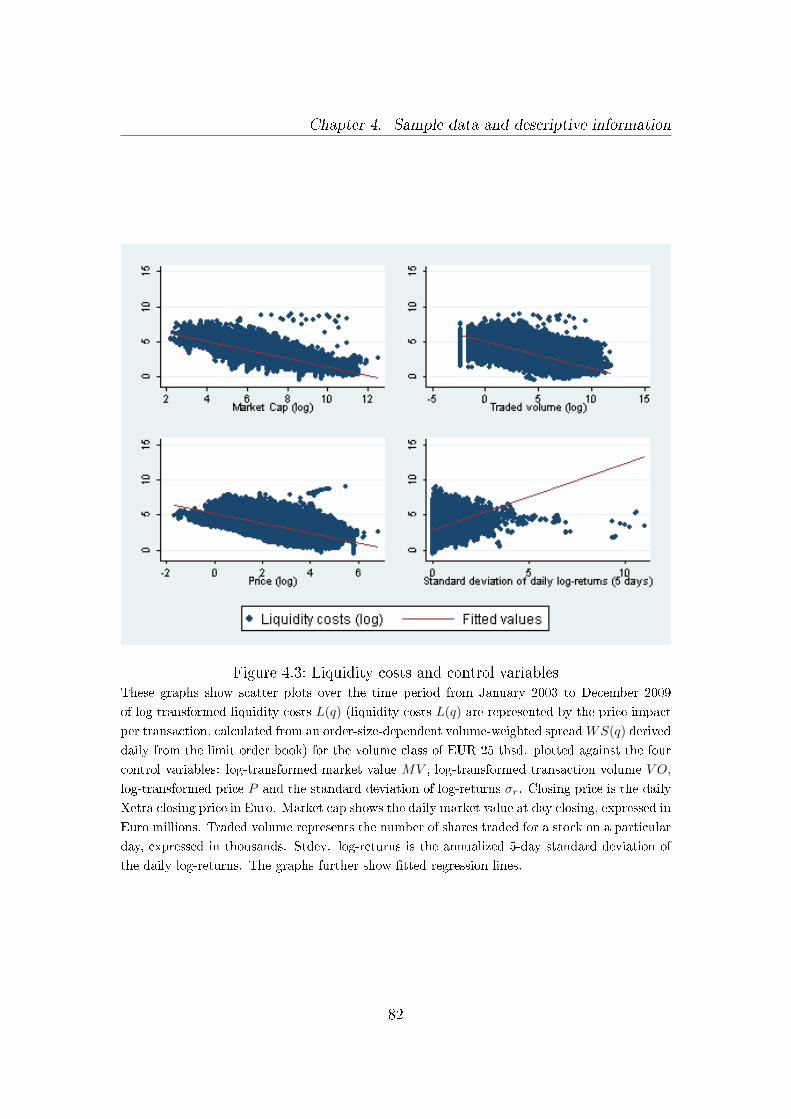
Chapter 4. Sample data and descriptive information
Figure 4.3: Liquidity costs and control variablesThese graphs show scatter plots over the time period from January 2003 to December 2009
of log-transformed liquidity costs L(q) (liquidity costs L(q) are represented by the price impact
per transaction, calculated from an order-size-dependent volume-weighted spreadWS(q) derived
daily from the limit order book) for the volume class of EUR 25 thsd. plotted against the four
control variables: log-transformed market value MV , log-transformed transaction volume V O,
log-transformed price P and the standard deviation of log-returns σr. Closing price is the daily
Xetra closing price in Euro. Market cap shows the daily market value at day closing, expressed in
Euro millions. Traded volume represents the number of shares traded for a stock on a particular
day, expressed in thousands. Stdev. log-returns is the annualized 5-day standard deviation of
the daily log-returns. The graphs further show �tted regression lines.
82
Chapter 4. Sample data and descriptive information
focusing on ownership structures and market liquidity, we calculated yearly av-
erages from these inputs; we also calculated the standard deviations of the stock
log-returns for each year. For the portion of our research focusing on the �nan-
cial crisis and insider trading, we calculated the 5-day standard deviation of daily
stock log-returns from the daily price data.
For most of our empirical regression analyses in Chapter 5 we log-transform the
liquidity costs in line with Stange and Kaserer (2008) in our regressions to account
for the skewness in the liquidity data. We further transform the control variables
transaction volume V O, the Xetra closing price P and the market capitalization
MV by taking their natural logarithms. The linear relationship between our log-
transformed liquidity costs and our log-transformed control variables MV , V O
and P and our control variable σr can be seen in Figure 4.3. Liquidity costs,
therefore, appear to have, as predicted, an inverse relationship with price, market
capitalization and trading volume, whereas liquidity costs appear to increase with
the return volatility.
4.2 Descriptive information
4.2.1 Market liquidity and the �nancial crisis110
Table 4.4 gives an descriptive overview of all of the variables used in the following
empirical analyses of the impact of the �nancial crisis on market liquidity by
the four major indices. As already mentioned above, the average liquidity costs
are 121 basis points. The average Xetra closing price is Euro 28.29, the average
market capitalization is over Euro 5.1 billion and on average there are 1.1 million
110 This section is largely based on Rösch and Kaserer (2012).
83
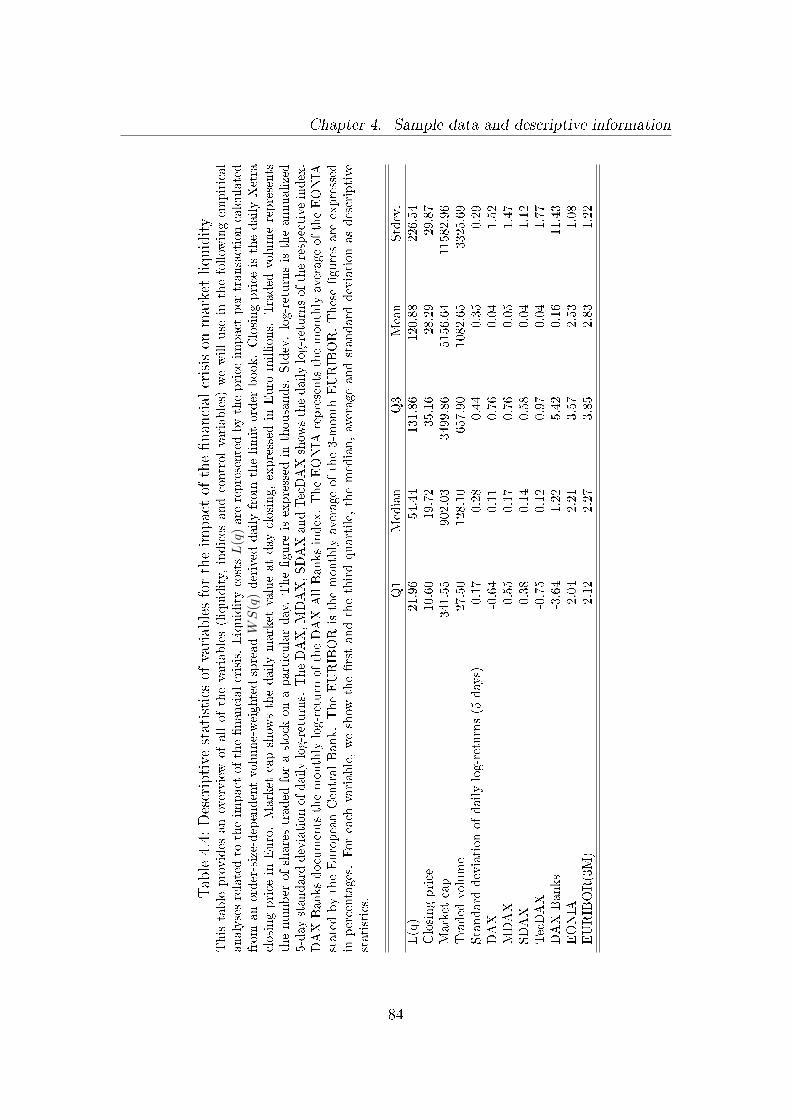
Chapter 4. Sample data and descriptive information
Table4.4:
Descriptive
statistics
ofvariablesfortheim
pactof
the�nancial
crisison
marketliquidity
Thistable
provides
anoverview
ofallofthevariables(liquidity,
indices
andcontrolvariables)
wewilluse
inthefollow
ingem
pirical
analysesrelatedto
theim
pact
ofthe�nancialcrisis.LiquiditycostsL
(q)are
representedbytheprice
impact
per
transactioncalculated
from
anorder-size-dependentvolume-weightedspreadWS
(q)derived
dailyfrom
thelimitorder
book.Closingprice
isthedailyXetra
closingprice
inEuro.Market
capshow
sthedailymarket
valueatday
closing,expressed
inEuro
millions.
Traded
volumerepresents
thenumber
ofsharestraded
forastock
onaparticularday.The�gure
isexpressed
inthousands.
Stdev.log-returnsistheannualized
5-day
standard
deviationofdailylog-returns.TheDAX,MDAX,SDAXandTecDAXshow
sthedailylog-returnsoftherespectiveindex.
DAXBanksdocumentsthemonthly
log-return
oftheDAXAllBanksindex.TheEONIA
representsthemonthly
averageoftheEONIA
statedbytheEuropeanCentralBank.TheEURIBORisthemonthly
averageofthe3-m
onth
EURIBOR.These�guresare
expressed
inpercentages.Foreach
variable,weshow
the�rstandthethirdquartile,
themedian,averageandstandard
deviationasdescriptive
statistics.
Q1
Median
Q3
Mean
Stdev.
L(q)
21.96
54.44
131.86
120.88
226.54
Closingprice
10.60
19.72
35.16
28.29
29.87
Market
cap
341.55
902.03
3499.86
5156.64
11582.96
Traded
volume
27.50
128.10
657.90
1082.65
3325.69
Standard
deviationofdailylog-returns(5
days)
0.17
0.28
0.44
0.35
0.29
DAX
-0.64
0.11
0.76
0.04
1.52
MDAX
-0.55
0.17
0.76
0.05
1.47
SDAX
-0.38
0.14
0.58
0.04
1.12
TecDAX
-0.75
0.12
0.97
0.04
1.77
DAXBanks
-3.64
1.22
5.42
0.16
11.43
EONIA
2.04
2.21
3.57
2.53
1.08
EURIBOR(3M)
2.12
2.27
3.85
2.83
1.22
84
Chapter 4. Sample data and descriptive information
shares traded per company. The three indices DAX, SDAX and TecDAX have an
average daily log-return of 0.04% while the one of the SDAX is 0.05%. The DAX
All Banks index has a monthly log-return of 0.16%, the average of the EONIA
over our sample period is 2.53% and the average of the 3-month EURIBOR is
2.83% and therefore 30 bps higher than the EONIA.
According to a variance in�ation factor (VIF) threshold level of 10, which is
proposed in Belsley et al. (1980), none of our following analyses that are related
to the portion of our research focusing on the impact of the �nancial crisis on
market liquidity su�er from problematic levels of multi-collinearity; see Table 4.5
that includes the maximum values of the individual variance in�ation factors of
our regression speci�cations that are dedicated to the impact of the �nancial crisis.
85
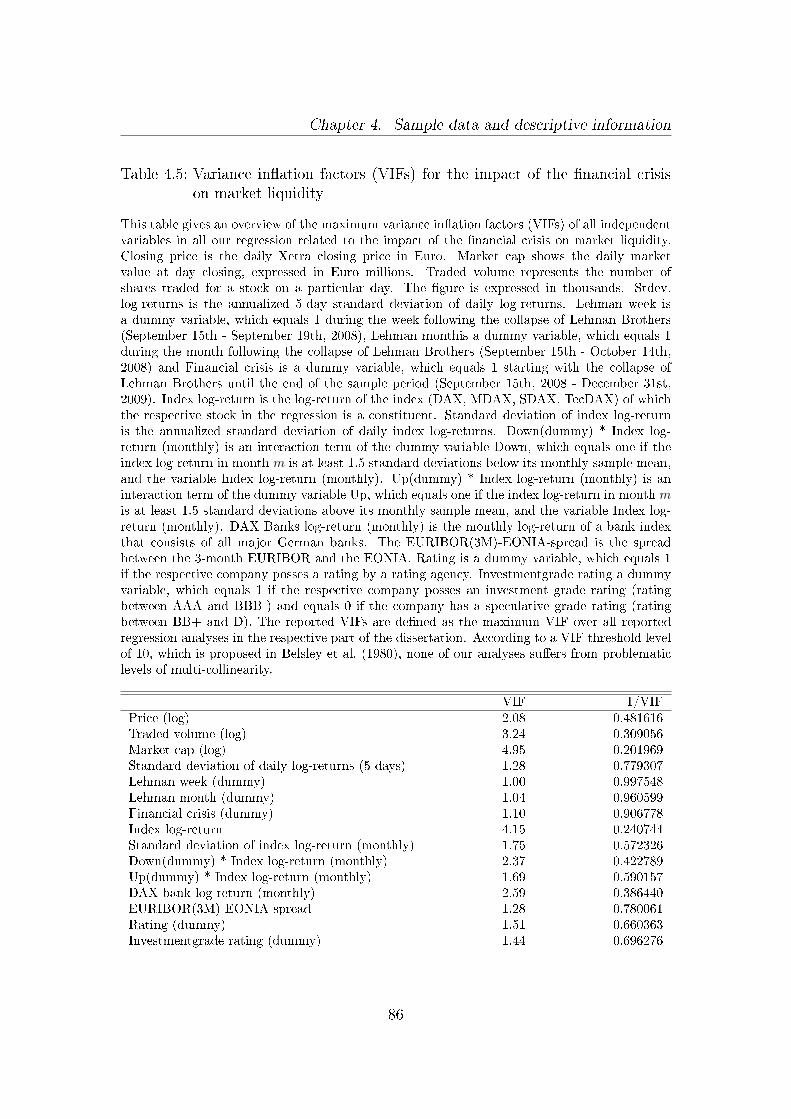
Chapter 4. Sample data and descriptive information
Table 4.5: Variance in�ation factors (VIFs) for the impact of the �nancial crisison market liquidity
This table gives an overview of the maximum variance in�ation factors (VIFs) of all independentvariables in all our regression related to the impact of the �nancial crisis on market liquidity.Closing price is the daily Xetra closing price in Euro. Market cap shows the daily marketvalue at day closing, expressed in Euro millions. Traded volume represents the number ofshares traded for a stock on a particular day. The �gure is expressed in thousands. Stdev.log-returns is the annualized 5-day standard deviation of daily log-returns. Lehman week isa dummy variable, which equals 1 during the week following the collapse of Lehman Brothers(September 15th - September 19th, 2008), Lehman monthis a dummy variable, which equals 1during the month following the collapse of Lehman Brothers (September 15th - October 14th,2008) and Financial crisis is a dummy variable, which equals 1 starting with the collapse ofLehman Brothers until the end of the sample period (September 15th, 2008 - December 31st,2009). Index log-return is the log-return of the index (DAX, MDAX, SDAX, TecDAX) of whichthe respective stock in the regression is a constituent. Standard deviation of index log-returnis the annualized standard deviation of daily index log-returns. Down(dummy) * Index log-return (monthly) is an interaction term of the dummy variable Down, which equals one if theindex log-return in month m is at least 1.5 standard deviations below its monthly sample mean,and the variable Index log-return (monthly). Up(dummy) * Index log-return (monthly) is aninteraction term of the dummy variable Up, which equals one if the index log-return in month mis at least 1.5 standard deviations above its monthly sample mean, and the variable Index log-return (monthly). DAX Banks log-return (monthly) is the monthly log-return of a bank indexthat consists of all major German banks. The EURIBOR(3M)-EONIA-spread is the spreadbetween the 3-month EURIBOR and the EONIA. Rating is a dummy variable, which equals 1if the respective company posses a rating by a rating agency. Investmentgrade rating a dummyvariable, which equals 1 if the respective company posses an investment grade rating (ratingbetween AAA and BBB-) and equals 0 if the company has a speculative grade rating (ratingbetween BB+ and D). The reported VIFs are de�ned as the maximum VIF over all reportedregression analyses in the respective part of the dissertation. According to a VIF threshold levelof 10, which is proposed in Belsley et al. (1980), none of our analyses su�ers from problematiclevels of multi-collinearity.
VIF 1/VIFPrice (log) 2.08 0.481616Traded volume (log) 3.24 0.309056Market cap (log) 4.95 0.201969Standard deviation of daily log-returns (5 days) 1.28 0.779307Lehman week (dummy) 1.00 0.997548Lehman month (dummy) 1.04 0.960599Financial crisis (dummy) 1.10 0.906778Index log-return 4.15 0.240744Standard deviation of index log-return (monthly) 1.75 0.572326Down(dummy) * Index log-return (monthly) 2.37 0.422789Up(dummy) * Index log-return (monthly) 1.69 0.590157DAX bank log-return (monthly) 2.59 0.386440EURIBOR(3M)-EONIA-spread 1.28 0.780061Rating (dummy) 1.51 0.660363Investmentgrade rating (dummy) 1.44 0.696276
86
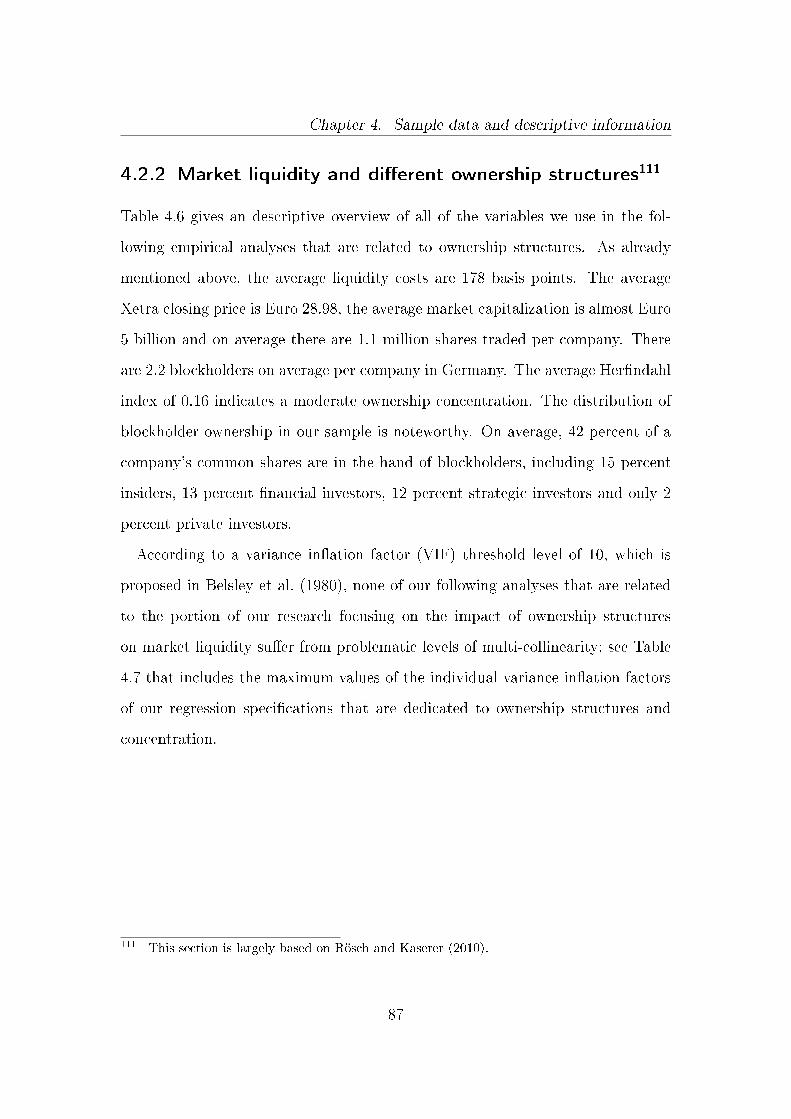
Chapter 4. Sample data and descriptive information
4.2.2 Market liquidity and di�erent ownership structures111
Table 4.6 gives an descriptive overview of all of the variables we use in the fol-
lowing empirical analyses that are related to ownership structures. As already
mentioned above, the average liquidity costs are 178 basis points. The average
Xetra closing price is Euro 28.98, the average market capitalization is almost Euro
5 billion and on average there are 1.1 million shares traded per company. There
are 2.2 blockholders on average per company in Germany. The average Her�ndahl
index of 0.16 indicates a moderate ownership concentration. The distribution of
blockholder ownership in our sample is noteworthy. On average, 42 percent of a
company's common shares are in the hand of blockholders, including 15 percent
insiders, 13 percent �nancial investors, 12 percent strategic investors and only 2
percent private investors.
According to a variance in�ation factor (VIF) threshold level of 10, which is
proposed in Belsley et al. (1980), none of our following analyses that are related
to the portion of our research focusing on the impact of ownership structures
on market liquidity su�er from problematic levels of multi-collinearity; see Table
4.7 that includes the maximum values of the individual variance in�ation factors
of our regression speci�cations that are dedicated to ownership structures and
concentration.
111 This section is largely based on Rösch and Kaserer (2010).
87
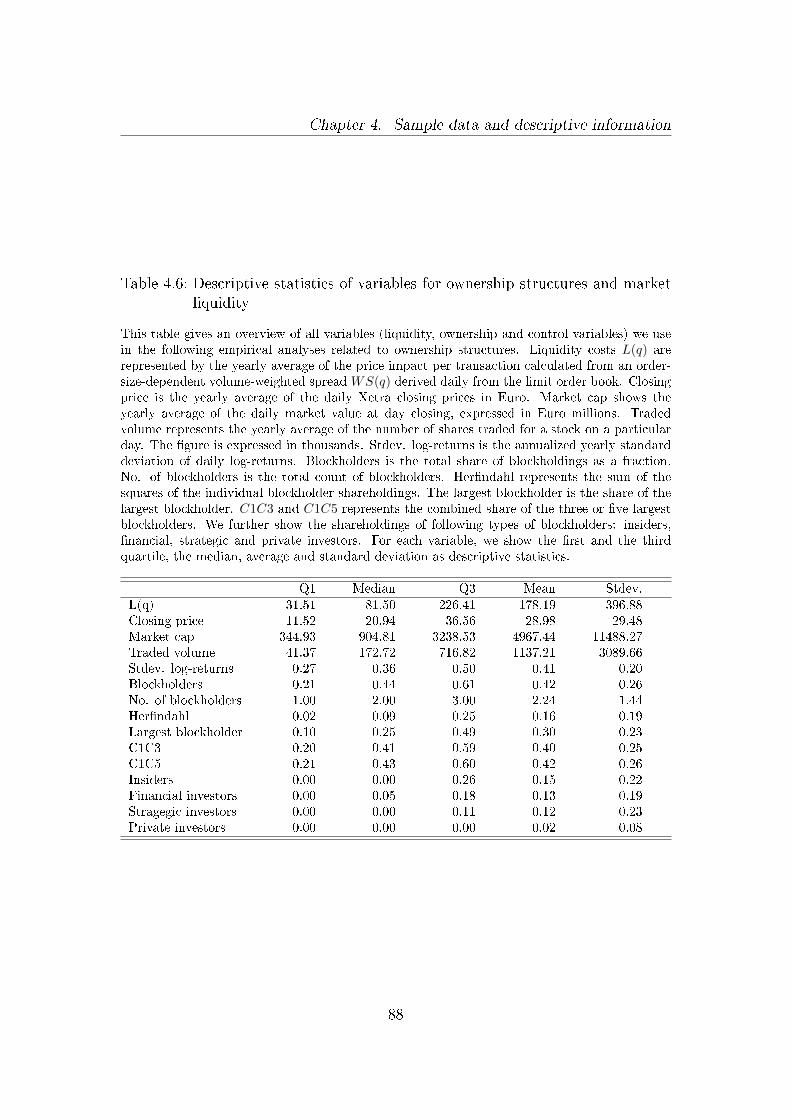
Chapter 4. Sample data and descriptive information
Table 4.6: Descriptive statistics of variables for ownership structures and marketliquidity
This table gives an overview of all variables (liquidity, ownership and control variables) we usein the following empirical analyses related to ownership structures. Liquidity costs L(q) arerepresented by the yearly average of the price impact per transaction calculated from an order-size-dependent volume-weighted spread WS(q) derived daily from the limit order book. Closingprice is the yearly average of the daily Xetra closing prices in Euro. Market cap shows theyearly average of the daily market value at day closing, expressed in Euro millions. Tradedvolume represents the yearly average of the number of shares traded for a stock on a particularday. The �gure is expressed in thousands. Stdev. log-returns is the annualized yearly standarddeviation of daily log-returns. Blockholders is the total share of blockholdings as a fraction.No. of blockholders is the total count of blockholders. Her�ndahl represents the sum of thesquares of the individual blockholder shareholdings. The largest blockholder is the share of thelargest blockholder. C1C3 and C1C5 represents the combined share of the three or �ve largestblockholders. We further show the shareholdings of following types of blockholders: insiders,�nancial, strategic and private investors. For each variable, we show the �rst and the thirdquartile, the median, average and standard deviation as descriptive statistics.
Q1 Median Q3 Mean Stdev.L(q) 31.51 81.50 226.41 178.19 396.88Closing price 11.52 20.94 36.56 28.98 29.48Market cap 344.93 904.81 3238.53 4967.44 11488.27Traded volume 41.37 172.72 716.82 1137.21 3089.66Stdev. log-returns 0.27 0.36 0.50 0.41 0.20Blockholders 0.21 0.44 0.61 0.42 0.26No. of blockholders 1.00 2.00 3.00 2.24 1.44Her�ndahl 0.02 0.09 0.25 0.16 0.19Largest blockholder 0.10 0.25 0.49 0.30 0.23C1C3 0.20 0.41 0.59 0.40 0.25C1C5 0.21 0.43 0.60 0.42 0.26Insiders 0.00 0.00 0.26 0.15 0.22Financial investors 0.00 0.05 0.18 0.13 0.19Stragegic investors 0.00 0.00 0.11 0.12 0.23Private investors 0.00 0.00 0.00 0.02 0.08
88
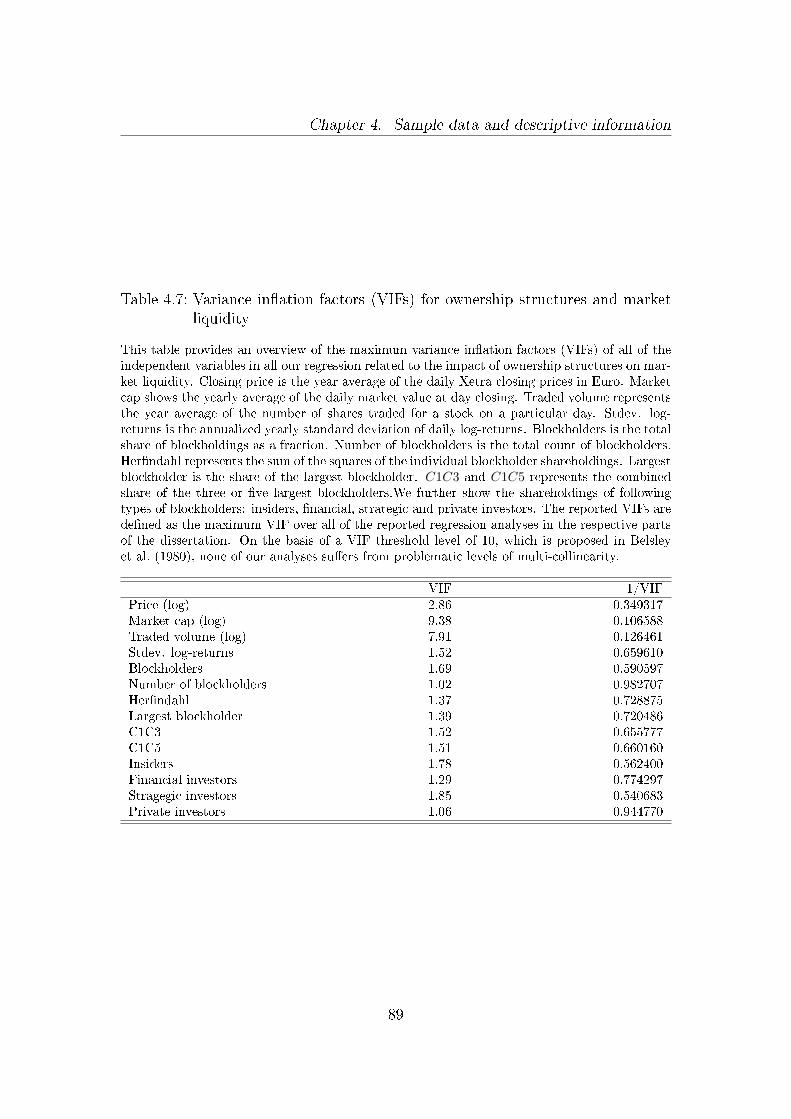
Chapter 4. Sample data and descriptive information
Table 4.7: Variance in�ation factors (VIFs) for ownership structures and marketliquidity
This table provides an overview of the maximum variance in�ation factors (VIFs) of all of theindependent variables in all our regression related to the impact of ownership structures on mar-ket liquidity. Closing price is the year average of the daily Xetra closing prices in Euro. Marketcap shows the yearly average of the daily market value at day closing. Traded volume representsthe year average of the number of shares traded for a stock on a particular day. Stdev. log-returns is the annualized yearly standard deviation of daily log-returns. Blockholders is the totalshare of blockholdings as a fraction. Number of blockholders is the total count of blockholders.Her�ndahl represents the sum of the squares of the individual blockholder shareholdings. Largestblockholder is the share of the largest blockholder. C1C3 and C1C5 represents the combinedshare of the three or �ve largest blockholders.We further show the shareholdings of followingtypes of blockholders: insiders, �nancial, strategic and private investors. The reported VIFs arede�ned as the maximum VIF over all of the reported regression analyses in the respective partsof the dissertation. On the basis of a VIF threshold level of 10, which is proposed in Belsleyet al. (1980), none of our analyses su�ers from problematic levels of multi-collinearity.
VIF 1/VIFPrice (log) 2.86 0.349317Market cap (log) 9.38 0.106588Traded volume (log) 7.91 0.126461Stdev. log-returns 1.52 0.659610Blockholders 1.69 0.590597Number of blockholders 1.02 0.982707Her�ndahl 1.37 0.728875Largest blockholder 1.39 0.720486C1C3 1.52 0.655777C1C5 1.51 0.660160Insiders 1.78 0.562400Financial investors 1.29 0.774297Stragegic investors 1.85 0.540683Private investors 1.06 0.944770
89
Chapter 4. Sample data and descriptive information
4.2.3 Market liquidity and insider trading112
Table 4.8 gives an descriptive overview of all the variables used in the following
empirical analyses that are related to the impact of insider trading activities by
the four major indices. As already mentioned above, the average liquidity costs
are 125 basis points. The average Xetra closing price is Euro 27.76, the average
market capitalization is Euro 5 billion and on average there are almost 1.1 million
shares traded per company. The annualized average 5-day standard deviation of
daily log-returns is 0.36. The pecking order between the DAX, MDAX and SDAX
is demonstrated very clearly by the �gures in our table, e.g., the companies listed
in the DAX have the largest average market capitalization with, over Euro 21
billion; their shares are the most actively traded with 4.6 million shares traded
on average per day per company; they possess the smallest average liquidity costs
with 66 basis points and they show the smallest volatility.
In total, there were 4,891 buy and 3,112 sell transactions by insiders in our
sample. The average size of an insider buy transaction was 81,000 shares, and
for a sell transaction initiated by an insider, the average size was 92,000 shares.
An interesting point is that the insiders of MDAX companies appear to be the
most active insiders, both in terms of the numbers of transactions (1,837 buy and
984 sell transactions) and the average transaction size (148,000 shares bought and
141,000 shares sold in an insider transaction). On average, over 8 percent of the
total shares held by insiders are sold in an insider sale, whereas an average insider
purchase represents a transaction size of only 2 percent of the total shares held
by insiders.
According to a variance in�ation factor threshold level of 10, which is proposed
112 This section is largely based on Rösch and Kaserer (2011).
90
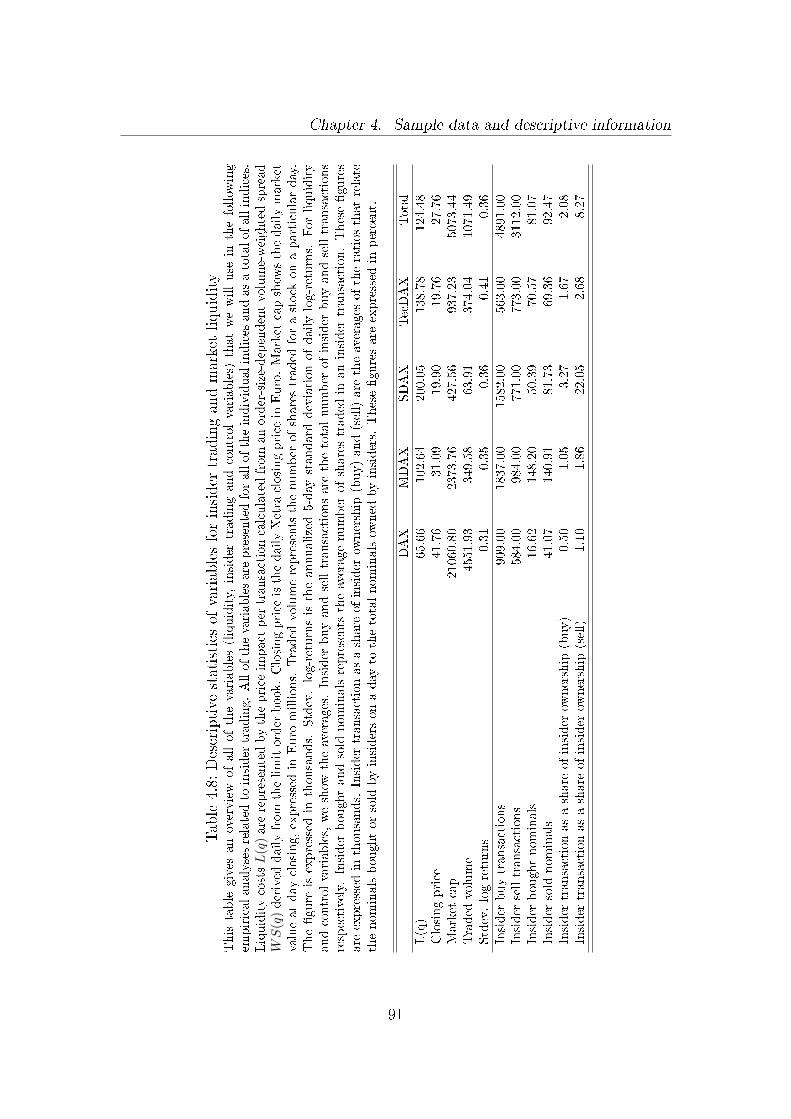
Chapter 4. Sample data and descriptive information
Table4.8:
Descriptive
statistics
ofvariablesforinsider
tradingandmarketliquidity
Thistable
gives
anoverview
ofallofthevariables(liquidity,
insider
tradingandcontrolvariables)
thatwewilluse
inthefollow
ing
empiricalanalysesrelatedto
insider
trading.Allofthevariablesare
presentedforalloftheindividualindices
andasatotalofallindices.
LiquiditycostsL
(q)are
representedbytheprice
impact
per
transactioncalculatedfrom
anorder-size-dependentvolume-weightedspread
WS
(q)derived
dailyfrom
thelimitorder
book.Closingprice
isthedailyXetra
closingprice
inEuro.Market
capshow
sthedailymarket
valueatday
closing,expressed
inEuro
millions.
Traded
volumerepresents
thenumber
ofsharestraded
forastock
onaparticularday.
The�gure
isexpressed
inthousands.
Stdev.log-returnsistheannualized
5-day
standard
deviationofdailylog-returns.
Forliquidity
andcontrolvariables,weshow
theaverages.Insider
buyandselltransactionsare
thetotalnumber
ofinsider
buyandselltransactions
respectively.Insider
boughtandsold
nominalsrepresents
theaveragenumber
ofsharestraded
inaninsider
transaction.These�gures
are
expressed
inthousands.
Insider
transactionasashare
ofinsider
ownership
(buy)and(sell)are
theaverages
oftheratiosthatrelate
thenominalsboughtorsold
byinsidersonaday
tothetotalnominalsow
ned
byinsiders.
These�guresare
expressed
inpercent.
DAX
MDAX
SDAX
TecDAX
Total
L(q)
65.66
102.64
200.05
138.78
124.48
Closingprice
41.76
31.09
19.90
19.76
27.76
Market
cap
21060.80
2373.76
427.56
937.23
5073.44
Traded
volume
4551.93
349.58
63.91
374.04
1071.49
Stdev.log-returns
0.31
0.35
0.36
0.41
0.36
Insider
buytransactions
909.00
1837.00
1582.00
563.00
4891.00
Insider
selltransactions
584.00
984.00
771.00
773.00
3112.00
Insider
boughtnominals
16.62
148.20
50.39
70.57
81.07
Insider
sold
nominals
41.07
140.91
81.73
69.36
92.47
Insider
transactionasashare
ofinsider
ownership
(buy)
0.50
1.05
3.27
1.67
2.08
Insider
transactionasashare
ofinsider
ownership
(sell)
1.10
1.86
22.05
2.68
8.27
91

Chapter 4. Sample data and descriptive information
in Belsley et al. (1980), none of the following analyses that are related to the
portion of our research on insider trading su�er from problematic levels of multi-
collinearity; see Table 4.9 that includes the maximum values of the individual
variance in�ation factors of our regression speci�cations that are dedicated to
insider trading.
92
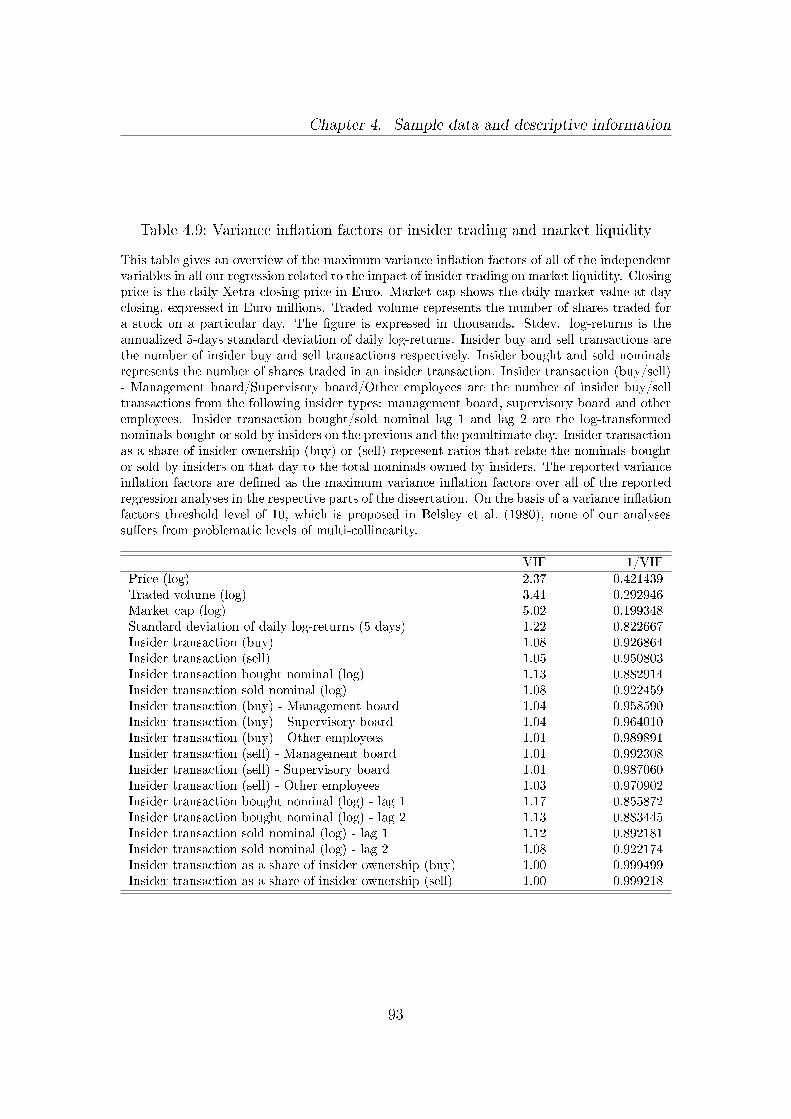
Chapter 4. Sample data and descriptive information
Table 4.9: Variance in�ation factors or insider trading and market liquidity
This table gives an overview of the maximum variance in�ation factors of all of the independentvariables in all our regression related to the impact of insider trading on market liquidity. Closingprice is the daily Xetra closing price in Euro. Market cap shows the daily market value at dayclosing, expressed in Euro millions. Traded volume represents the number of shares traded fora stock on a particular day. The �gure is expressed in thousands. Stdev. log-returns is theannualized 5-days standard deviation of daily log-returns. Insider buy and sell transactions arethe number of insider buy and sell transactions respectively. Insider bought and sold nominalsrepresents the number of shares traded in an insider transaction. Insider transaction (buy/sell)- Management board/Supervisory board/Other employees are the number of insider buy/selltransactions from the following insider types: management board, supervisory board and otheremployees. Insider transaction bought/sold nominal lag 1 and lag 2 are the log-transformednominals bought or sold by insiders on the previous and the penultimate day. Insider transactionas a share of insider ownership (buy) or (sell) represent ratios that relate the nominals boughtor sold by insiders on that day to the total nominals owned by insiders. The reported variancein�ation factors are de�ned as the maximum variance in�ation factors over all of the reportedregression analyses in the respective parts of the dissertation. On the basis of a variance in�ationfactors threshold level of 10, which is proposed in Belsley et al. (1980), none of our analysessu�ers from problematic levels of multi-collinearity.
VIF 1/VIFPrice (log) 2.37 0.421439Traded volume (log) 3.41 0.292946Market cap (log) 5.02 0.199348Standard deviation of daily log-returns (5 days) 1.22 0.822667Insider transaction (buy) 1.08 0.926864Insider transaction (sell) 1.05 0.950803Insider transaction bought nominal (log) 1.13 0.882914Insider transaction sold nominal (log) 1.08 0.922459Insider transaction (buy) - Management board 1.04 0.958590Insider transaction (buy) - Supervisory board 1.04 0.964010Insider transaction (buy) - Other employees 1.01 0.989891Insider transaction (sell) - Management board 1.01 0.992308Insider transaction (sell) - Supervisory board 1.01 0.987060Insider transaction (sell) - Other employees 1.03 0.970902Insider transaction bought nominal (log) - lag 1 1.17 0.855872Insider transaction bought nominal (log) - lag 2 1.13 0.883445Insider transaction sold nominal (log) - lag 1 1.12 0.892181Insider transaction sold nominal (log) - lag 2 1.08 0.922174Insider transaction as a share of insider ownership (buy) 1.00 0.999499Insider transaction as a share of insider ownership (sell) 1.00 0.999218
93
Chapter 5Empirical analysis
This chapter is dedicated to the empirical analysis of our three main research
questions and, more explicitly, to the testing of our more detailed research hy-
potheses that we derived in Chapter 3. We begin by examining the impact of the
�nancial crisis on market liquidity. This exploration is followed by analyses that
concentrate on the in�uence of ownership structures, ownership concentration, and
blockholder types on market liquidity. The last section of this chapter focuses on
one speci�c type of shareholder, the insider, and investigates the in�uence of its
trading behavior on market liquidity.
5.1 Market liquidity and the �nancial crisis113
This section focuses on the empirical analysis of the impact of the �nancial crisis
on market liquidity. For these analyses, we use the dataset that we presented in
section 4.1.1. We begin with a more general analysis of the evolution of market
liquidity over time and the e�ect of the �nancial crisis. To better understand the
113 This section is largely based on Rösch and Kaserer (2012).
94
Chapter 5. Empirical analysis
time-series determinants of market liquidity, we will then analyze two main phe-
nomena of market liquidity research in the context of the �nancial crisis: Liquidity
commonality and the �ight-to-quality.
5.1.1 Market liquidity over time - the impact of the
�nancial crisis
5.1.1.1 A description of the evolution of market liquidity over time in
light of the �nancial crisis
First, we attempt to discover wether the �nancial turmoil of the �nancial crisis
had any impact on market liquidity. As a �rst indication, we therefore graph the
development of the liquidity costs measured by the volume-weighted spread mea-
sure XLM for all four major German indices (DAX, MDAX, SDAX, and TecDAX)
over time. In Figure 5.1, we see that, with the abating of the previous large cri-
sis (the internet bubble and September 11th, 2001), the volume-weighted spreads
narrowed in 2003 and 2004 and were relatively stable for the following years, from
2005 to mid-2007. The spreads then started to widen with the �rst signs of the
�nancial crisis in mid-2007, dramatically increased after the collapse of Lehman
Brothers Holdings Inc. in August 2008, and peaked in October and November
2008, after the collapse and bail-out of Hypo Real Estate AG in Germany. At
that point of time in the midst of the �nancial crisis, the average volume-weighted
spreads were as high as 1,000 bps for SDAX stocks, 600 bps for TecDAX stocks,
500 bps for MDAX stocks and 400 bps for DAX stocks. In 2009, the spreads
began to recover and almost reached pre-crisis levels for the larger indices at the
end of 2009.
On the basis of our volume-weighted spread measure XLM, we are also able to
95
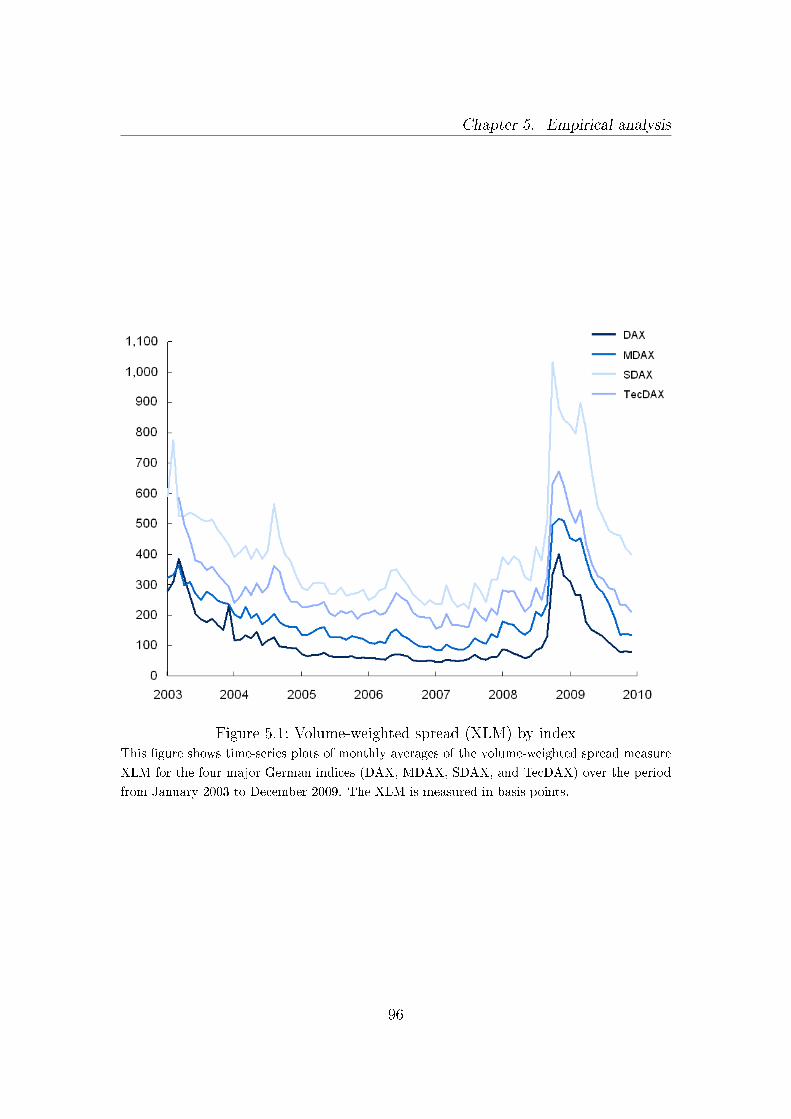
Chapter 5. Empirical analysis
Figure 5.1: Volume-weighted spread (XLM) by indexThis �gure shows time-series plots of monthly averages of the volume-weighted spread measure
XLM for the four major German indices (DAX, MDAX, SDAX, and TecDAX) over the period
from January 2003 to December 2009. The XLM is measured in basis points.
96
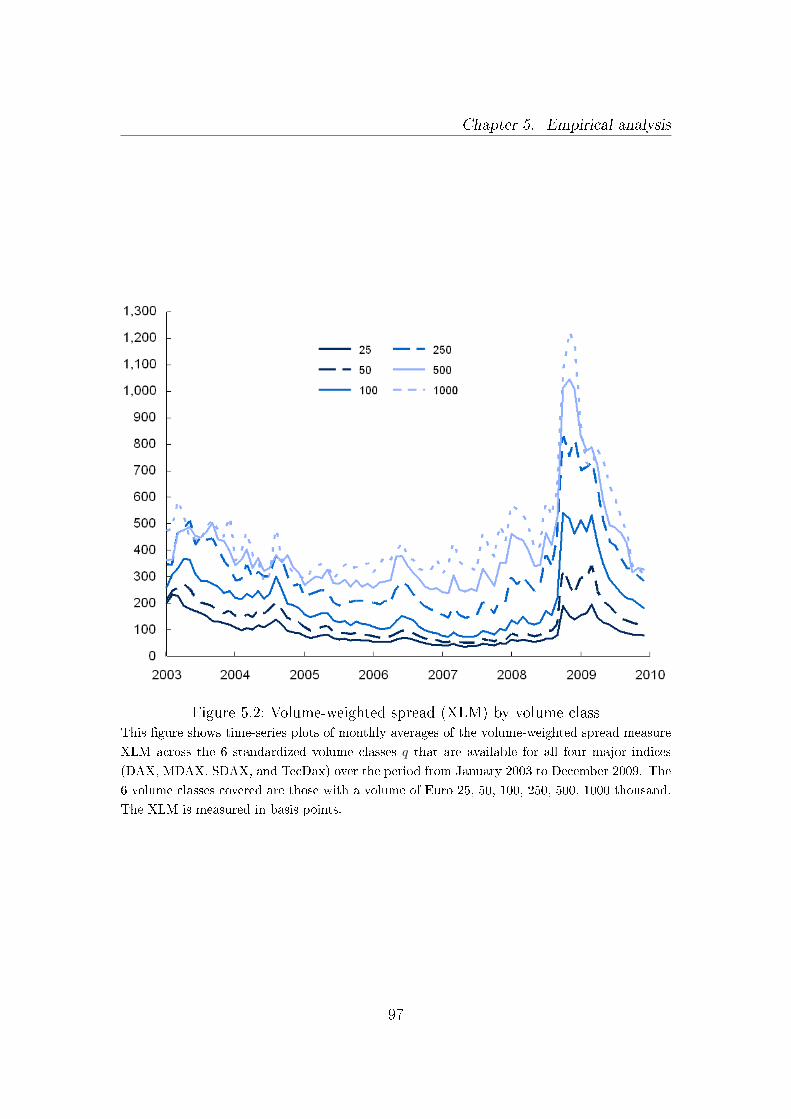
Chapter 5. Empirical analysis
Figure 5.2: Volume-weighted spread (XLM) by volume classThis �gure shows time-series plots of monthly averages of the volume-weighted spread measure
XLM across the 6 standardized volume classes q that are available for all four major indices
(DAX, MDAX, SDAX, and TecDax) over the period from January 2003 to December 2009. The
6 volume classes covered are those with a volume of Euro 25, 50, 100, 250, 500, 1000 thousand.
The XLM is measured in basis points.
97
Chapter 5. Empirical analysis
look into the dynamics inside the limit order book. This ability gives us the unique
possibility to uncover previously unexplored market liquidity risk phenomena in
the context of the �nancial crisis for larger order sizes, which might be of special
interest to institutional investors who trade larger positions. Figure 5.2 displays
the monthly averages of the XLM across the 6 standardized volume classes q
that are available for all of the four major indices over the same period of time.
These are the volume classes of Euro 25, 50, 100, 250, 500 and 1,000 thousand.
We observe a pattern across all 6 volume classes that is similar to the pattern
described before. However, the larger volume classes appear to su�er more from
the �nancial crisis than do the smaller order sizes; therefore, the impact of the
�nancial crisis on market liquidity becomes stronger the more deeply we look into
the limit order book. In the midst of the �nancial crisis, the monthly average of the
XLM across all four indices rose dramatically to levels above 1,200 basis points for
order sizes of Euro 1 million and even transaction sizes of Euro 0.5 million peaked
at over 1,000 basis points. These values are almost three times as high as the
initial values for these volume classes in our sample. At the same time, the volume-
weighted spreads for smaller volume classes also rose signi�cantly but only reached
levels of 190 and 320 basis points for order sizes of Euro 25 and 50 thousand,
respectively. This unique insight is particularly important for market liquidity risk
management, as the impact of order size on liquidity is substantial and therefore
cannot be neglected, particularly in times of crisis. Any market liquidity risk
management concept needs to account for the peaks in market liquidity risk in
times of crisis, which are especially pronounced in larger volume classes. This
reasoning leads us to the conclusion that bid-ask-spread data (which are often used
to measure market liquidity risk due to their easy availability) might tremendously
understate the liquidity risk for large trading positions and therefore can only
98
Chapter 5. Empirical analysis
poorly serve as proxies for the level and especially the variation in liquidity costs
for larger volume classes during times of crisis. Therefore, our unique dataset with
the order-size-dependent volume-weighted spread measure, which better captures
the liquidity dynamics of the whole limit order book, will help us to shed further
light on existing market liquidity puzzles in times of crisis.
5.1.1.2 The impact of the �nancial crisis on our measure of market
liquidity
We now have a closer look at the impact of the �nancial crisis on market liquidity
and therefore scrutinize the liquidity data in a panel-data regression analysis. For
our panel-data regression analysis, we use a log-log speci�cation. Consistent with
Stange and Kaserer (2008), we log-transform the liquidity costs as the dependent
variable in our regressions to account for the skewness in the liquidity data. We
further transform the control variables transaction volume V O, the Xetra closing
prices P and the market capitalization MV by taking their natural logarithms.
For our unique panel data set with order-size-dependent liquidity costs, we use
a company and volume class114 �xed e�ects model115 for the estimation. In the
remainder of this dissertation, all our panel data models116 include the dependent
variable logL(q) and all of the standard control variables in the following form:
logL(q) = αo + α1logV O + α2logP + α3logMV + α4σr + ε (5.1)
We separately add three di�erent dummy variables to capture the impact of the
114 The volume class q is an inherent characteristic of our order-size-dependent liquidity costsmeasure.
115 The Hausman (1978) test statistic supports the usage of a �xed e�ects model comparedwith a random e�ects model.
116 All variables are time- and company-dependent, but we do not subscript the variables inthe representation.
99
Chapter 5. Empirical analysis
�nancial crisis: Lehman week, which equals 1 during the 5 trading days imme-
diately following the collapse of Lehman Brothers (September 15th - September
19th, 2008); Lehman month, which equals 1 during the subsequent month of
the Lehman collapse (September 15th - October 14th, 2008); and a �nancial cri-
sis dummy covering the period from the Lehman collapse until the end of 2009
(September 15th, 2008 - December 31st, 2009). On the basis of our more descrip-
tive results in Figures 5.1 and 5.2 and on other studies that discovered liquidity
dry-ups during times of crisis, see, e.g., Hegde and Paliwal (2005), we would ex-
pect these dummy variables to be positively signi�cant, indicating that liquidity
costs are larger and stock market liquidity is impaired during the �nancial crisis.
However, this expectation would only hold if these variables capture market liq-
uidity dynamics that are not already explained by our other four control variables,
especially through increased return volatility during the �nancial turmoil. There-
fore, a positive relationship between these dummy variables and the liquidity costs
would show that there are unexplained crisis-speci�c liquidity dynamics.
Table 5.1 presents the results for these regressions. First, we can assert that the
estimates of the coe�cients for all of our four control variables (price level, market
capitalization, volume and return volatility) are signi�cant and have the predicted
signs. Liquidity costs are therefore, as predicted, a decreasing function of price
level, market capitalization and trading volume, whereas these costs increase with
the return volatility, which is a proxy for the general market risk. These results
are, as expected, consistent with results reported in previous studies.
Furthermore, Table 5.1 gives ample evidence that the �nancial crisis had a major
impact on the market liquidity, as all of our three dummy variables are positive
signi�cant at the 1 percent signi�cance level, with the Lehman week dummy
having the largest impact on liquidity costs. This observation clearly shows that
100
Chapter 5. Empirical analysis
market liquidity is impaired during times of crisis and that this increase in liquidity
costs cannot be fully explained by the standard control variables. These positive
relationships between liquidity costs and our dummy variables for the �nancial
crisis justify a further exploration of the liquidity dynamics during times of crisis,
as there are, thus far, unexplained crisis-speci�c liquidity dynamics.
Thus far, our results are in line with several empirical studies that showed that
market crises lead to market liquidity dry-ups, see, e.g., Yeyati et al. (2008) and
Næs et al. (2011), and several theoretical works, see, e.g., Bookstaber (2000),
Kyle and Xiong (2001), Xiong (2001), Bernardo and Welch (2004), Garleanu and
Pedersen (2007) and Brunnermeier and Pedersen (2009), that argue that market
declines cause asset illiquidity. As a �rst step towards a better understanding
of the dynamics of market liquidity during the �nancial crisis, we now want to
analyze the relationship between individual stock liquidity and aggregate index re-
turns. This analysis provides further empirical insights whether there is a negative
relationship, as postulated by the theoretical works.
5.1.1.3 The impact of market returns on our measure of market liquidity
Therefore, we add the variable index log-return, which is the daily log-return of
the index (DAX, MDAX, SDAX, and TecDAX) in which the respective stock is
a constituent to our reference speci�cation (see equation 5.1).117 We analyze this
relationship for three di�erent subsamples to assess whether there are variations
in the relationship in times of crises and non-crises: (5.2.1) covers the pre-crisis
period from January 2003 to September 14th, 2008, (5.2.2) covers the period
of �nancial crisis from September 15th, 2008 (collapse of Lehman Brothers) to
117 We also analyzed the same regressions for the CDAX, which is a broad German marketindex, instead of the four individual indices. However, the results were very similar to theones reported for the indices and can be found in Table A.3 in the Appendix.
101

Chapter 5. Empirical analysisTable5.1:
Thee�ectof
the�nancial
crisison
marketliquidity
Thistable
reportscompanyandvolume-class
�xed
e�ects
regressionsthatanalyze
thee�ects
ofthe�nancialcrisisonliquiditycosts
duringthesampleperiodofJanuary
2003to
Decem
ber
2009.Thedependentvariableofliquiditycostsisrepresentedbythedailyprice
impact
per
transactionL
(q),whichiscalculatedfrom
anorder-size-dependentvolume-weightedspreadWS
(q)derived
dailyfrom
the
limitorder
book.Price
(log)isthelogarithm
ofthedailyXetra
closingprices.
Market
cap(log)isthelog-transform
eddailymarket
valueatday
closing.Traded
volume(log)represents
thelogarithm
ofthedailytradingvolumeoftraded
shares.
Standard
deviationof
dailylog-returnsistheannualized5day
standard
deviationofthedailylog-returns.
Inadditionto
theaforementioned
controlvariables,
wewilltest
theim
pact
ofthe�nancialcrisisusingthreedi�erentdummyvariables:
Lehman
week(5.1.1),whichequals1duringthe
weekfollow
ingthecollapse
ofLehmanBrothers(September
15th
-September
19th,2008),Lehmanmonth
(5.1.2),whichequals1during
themonth
follow
ingthecollapse
ofLehmanBrothers(September
15th
-October
14th,2008)andFinancialcrisis(5.1.3),whichequals1
startingwiththecollapse
ofLehmanBrothersuntiltheendofthesampleperiod(September
15th,2008-Decem
ber
31st,2009).
This
tableshow
stheestimatedcoe�
cients,withthet-statisticsreported
inparentheses
below
theircorrespondingestimatedcoe�
cients
and
theadjusted
R2values
are
presentedbelow
thecorrespondingmodel.
(5.1.1)
(5.1.2)
(5.1.3)
Price
(log)
-0.507∗∗
∗-0.505∗∗
∗-0.341∗∗
∗
(-225.52)
(-225.24)
(-148.07)
Traded
volume(log)
-0.223∗∗
∗-0.224∗∗
∗-0.223∗∗
∗
(-617.26)
(-621.05)
(-624.88)
Market
cap(log)
-0.291∗∗
∗-0.294∗∗
∗-0.409∗∗
∗
(-130.44)
(-132.23)
(-182.16)
Standard
deviationofdailylog-returns(5
days)
0.677∗∗
∗0.651∗∗
∗0.609∗∗
∗
(581.62)
(552.70)
(518.02)
Lehmanweek(dummy)
0.404∗∗
∗
(74.93)
Lehmanmonth
(dummy)
0.360∗∗
∗
(138.39)
Financialcrisis(dummy)
0.242∗∗
∗
(270.82)
Constant
8.565∗
∗∗8.591∗∗
∗8.898∗∗
∗
(881.56)
(886.52)
(920.92)
Observations
2373418
2373418
2373418
Adjusted
R2
0.524
0.527
0.537
F522742.2
528420.6
551153.8
tstatisticsin
parentheses
∗p<
0.1
0,∗∗p<
0.0
5,∗∗
∗p<
0.01
102
Chapter 5. Empirical analysis
December 2009, while (5.2.3) covers the whole data for our sample period January
2003 to December 2009. A better understanding of the relationship between
aggregate market returns and individual stock liquidity is an important building
block for tackling the liquidity dynamics during the �nancial market crisis.
Table 5.2 shows the results for our three di�erent subsamples. Across all sub-
samples, we observe a signi�cant negative relationship between aggregate index
returns and individual stock liquidity, indicating that, in all types of general mar-
ket conditions, market declines (negative index returns) impair individual stock
liquidity as measured by an increase in liquidity costs, whereas rising markets
improve individual stock liquidity. This analysis provides support for former the-
oretical works and is consistent with �ndings of Chen and Poon (2008), which
demonstrate local stock market returns to be one of the greatest causes of illiquid-
ity. Furthermore, this analysis worryingly implies that market liquidity evaporates
when it is most needed, as investors might need to cover their losses in market
downturns, and further demonstrates that there is clearly a positive relationship
between market risk and liquidity risk.
Hence, Figure 5.1 and our empirical results in Tables 5.1 and 5.2 clearly show
that market liquidity was heavily a�ected during the �nancial crisis, and therefore,
a more thorough analysis is required to understand the dynamics behind it. We
begin with an analysis of a widely stated phenomenon in market liquidity: liquidity
commonality.
5.1.2 Liquidity commonality
In brief, liquidity commonality describes the phenomenon of the synchronicity
of an individual asset's liquidity variation with aggregate market-wide liquidity
103
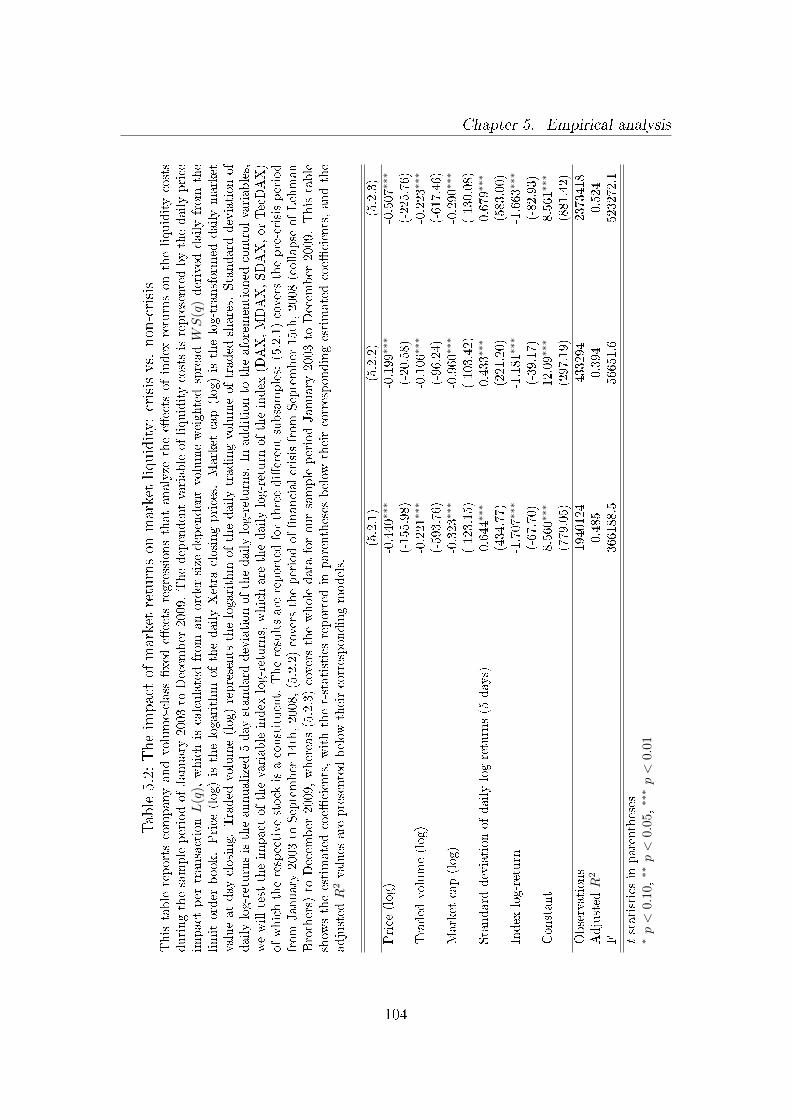
Chapter 5. Empirical analysis
Table5.2:
Theim
pactof
marketreturnson
marketliquidity:crisisvs.
non-crisis
Thistable
reportscompanyandvolume-class
�xed
e�ects
regressionsthat
analyze
thee�ects
ofindex
returnsontheliquiditycosts
duringthesampleperiodofJanuary
2003to
Decem
ber
2009.Thedependentvariableofliquiditycostsisrepresentedbythedailyprice
impact
per
transactionL
(q),whichiscalculatedfrom
anorder-size-dependentvolume-weightedspreadWS
(q)derived
dailyfrom
the
limitorder
book.Price
(log)isthelogarithm
ofthedailyXetra
closingprices.
Market
cap(log)isthelog-transform
eddailymarket
valueatday
closing.Traded
volume(log)represents
thelogarithm
ofthedailytradingvolumeoftraded
shares.
Standard
deviationof
dailylog-returnsistheannualized5day
standard
deviationofthedailylog-returns.
Inadditionto
theaforementioned
controlvariables,
wewilltesttheim
pact
ofthevariableindex
log-returns,whichare
thedailylog-return
oftheindex
(DAX,MDAX,SDAX,orTecDAX)
ofwhichtherespectivestock
isaconstituent.Theresultsare
reported
forthreedi�erentsubsamples:
(5.2.1)coversthepre-crisisperiod
from
January
2003to
September
14th,2008,(5.2.2)covers
theperiodof�nancialcrisisfrom
September
15th,2008(collapse
ofLehman
Brothers)
toDecem
ber
2009,whereas(5.2.3)coversthewholedata
foroursampleperiodJanuary
2003to
Decem
ber
2009.Thistable
show
stheestimatedcoe�
cients,withthet-statisticsreported
inparentheses
below
theircorrespondingestimatedcoe�
cients,andthe
adjusted
R2values
are
presentedbelow
theircorrespondingmodels.
(5.2.1)
(5.2.2)
(5.2.3)
Price
(log)
-0.440∗∗
∗-0.199∗∗
∗-0.507∗∗
∗
(-155.98)
(-20.58)
(-225.76)
Traded
volume(log)
-0.221∗∗
∗-0.106∗∗
∗-0.223∗∗
∗
(-593.76)
(-96.24)
(-617.46)
Market
cap(log)
-0.323∗∗
∗-0.960∗∗
∗-0.290∗∗
∗
(-123.15)
(-103.42)
(-130.08)
Standard
deviationofdailylog-returns(5
days)
0.644∗∗
∗0.433∗∗
∗0.679∗∗
∗
(434.77)
(221.20)
(583.00)
Index
log-return
-1.707∗
∗∗-1.181∗∗
∗-1.663∗∗
∗
(-67.70)
(-39.17)
(-82.93)
Constant
8.560∗
∗∗12.09∗∗
∗8.561∗∗
∗
(779.05)
(297.19)
(881.42)
Observations
1940124
433294
2373418
Adjusted
R2
0.485
0.394
0.524
F366188.5
56651.6
523272.1
tstatisticsin
parentheses
∗p<
0.1
0,∗∗p<
0.0
5,∗∗
∗p<
0.01
104
Chapter 5. Empirical analysis
movements and was initially discovered by Chordia et al. (2000). Extending the
stream of research presented in 3.1.2, we �rst seek to explore two characteristics
of liquidity commonality using our unique volume-dependent liquidity measure:
Is liquidity commonality a phenomenon that holds for the whole limit order book,
and is it sensitive to shocks, such as the �nancial crises? We will then pursue a
line of possible further research suggested by the aforementioned discussion and
examine factors determining the observed liquidity commonality.
5.1.2.1 Liquidity commonality and the �nancial crisis
Following the work of Chordia et al. (2000), we adapt the return market model
used in asset pricing and apply it in the context of liquidity to estimate the
sensitivity of an individual �rm's liquidity to changes in the aggregate market liq-
uidity. We extend the original speci�cation of Chordia et al. (2000) to account for
our volume-dependent liquidity measure to derive our extended liquidity market
model. For each individual �rm i, we therefore estimate the following time-series
regression:
∆WS (q)i,t = αi + βi ·∆WS (q)M,i,t +X · A+ εi,t (5.2)
where ∆WS (q)i,t measures the proportional change (∆) in the volume-weighted
spread WS(q) across successive trading days:
∆WS(q)i,t =WS(q)i,t −WS(q)i,t−1
WS(q)i,t−1
(5.3)
The market volume-weighted spread WS(q)M,i is an equal weighted average of all
individual stocks' volume-weighted spreads in the market, excluding, as in prior
105
Chapter 5. Empirical analysis
research, e.g., Chordia et al. (2000) and Coughenour and Saad (2004), the volume-
weighted spread of �rm i, i.e., the dependent variable. The proportional change
in the market volume-weighted spread ∆WS(q)M,i is derived as in equation (5.3).
Following Chordia et al. (2000) we include further variables (vector (A)): lead
and lag variables118 of the proportional change in market volume-weighted spread
∆WS(q)M,i,t−1 and ∆WS(q)M,i,t+1; the contemporaneous, lead, and lag market
return, which is an equal weighted average of all individual stocks' daily returns119;
and the proportional change in the individual squared return of stock i. The lead
and lag liquidity variables capture any non-synchronous liquidity co-movement,
whereas the return and volatility variables in our regression control for general
market conditions and changes in stock-speci�c volatility.
Our main interest lies in the analysis of the co-movement of an individual stock's
liquidity with the aggregate market liquidity and, therefore, in the coe�cient
estimates of βi. Following the linguistic usage in the context of asset pricing,
the coe�cient estimate βi is called liquidity beta in most of the literature and,
henceforth, in our research. As in asset pricing, the liquidity beta can be viewed as
a measure for systematic liquidity risk. We use individual liquidity beta estimates
to calculate an equal-weighted cross-sectional average for the liquidity beta, which
is reported in Tables 5.3 to 5.5. However, we also provide information on the
cross-sectional distribution of the individual liquidity betas, as we further report
the percentage of positive slope coe�cients and the percentage of signi�cantly120
positive slope coe�cients, as estimated from the individual regressions. On the
basis of the �nding of Kamara et al. (2008), who found a strong time variation
118 Lead and lag variables refer to the previous and next trading day observations of thevariable.
119 As in the market volume-weighted spread, we exclude the dependent variable stock fromthe calculation of the market averages.
120 At the 5% signi�cance level.
106
Chapter 5. Empirical analysis
in commonality, we want to analyze whether the sudden liquidity dry-up in the
market induced by the �nancial crisis, which we discovered earlier in this work, can
at least to a certain extent be explained by an increase in the liquidity commonality
during times of crisis. To scrutinize the impact of the �nancial crisis on the
liquidity commonality, we therefore estimate the liquidity betas for our three sub-
periods de�ned above, to reveal the impact of the �nancial crisis on liquidity
co-movements.
Tables 5.3 to 5.5 provide strong support for the existence of liquidity com-
monality. As the averages of the contemporaneous liquidity beta estimates are
signi�cantly di�erent from zero across all sub-periods, we �nd a co-movement of
individual stocks' liquidity with the aggregate market liquidity. We further ob-
serve in Table 5.3, which covers all of the data of our sample period, that almost
80% of the individual liquidity beta estimates are signi�cantly positive, which
shows that liquidity co-movement is a pervasive phenomenon across all stocks
and that almost all stocks are in�uenced by changes in the aggregate market liq-
uidity. Our results reported for the non-crisis subsample in Table 5.4 are very
much in the range of liquidity betas reported in earlier research that did not focus
on crises in their samples, see, e.g., Chordia et al. (2000), Brockman and Chung
(2002) and Kempf and Mayston (2008). As we use a volume-dependent liquidity
measure, we are able to show that liquidity commonality is a phenomenon that
holds for the whole limit order book. Consistent with previous research, the co-
e�cient estimates for leading and lagged aggregate market liquidity are mostly
positive and often signi�cant; however, they are very small in magnitude.
As Kamara et al. (2008) have shown that liquidity betas vary over time, we
now want to focus on the inter-sample di�erences and, therefore, on the impact
of the �nancial crisis: Most notably, the average liquidity beta is more than 5
107
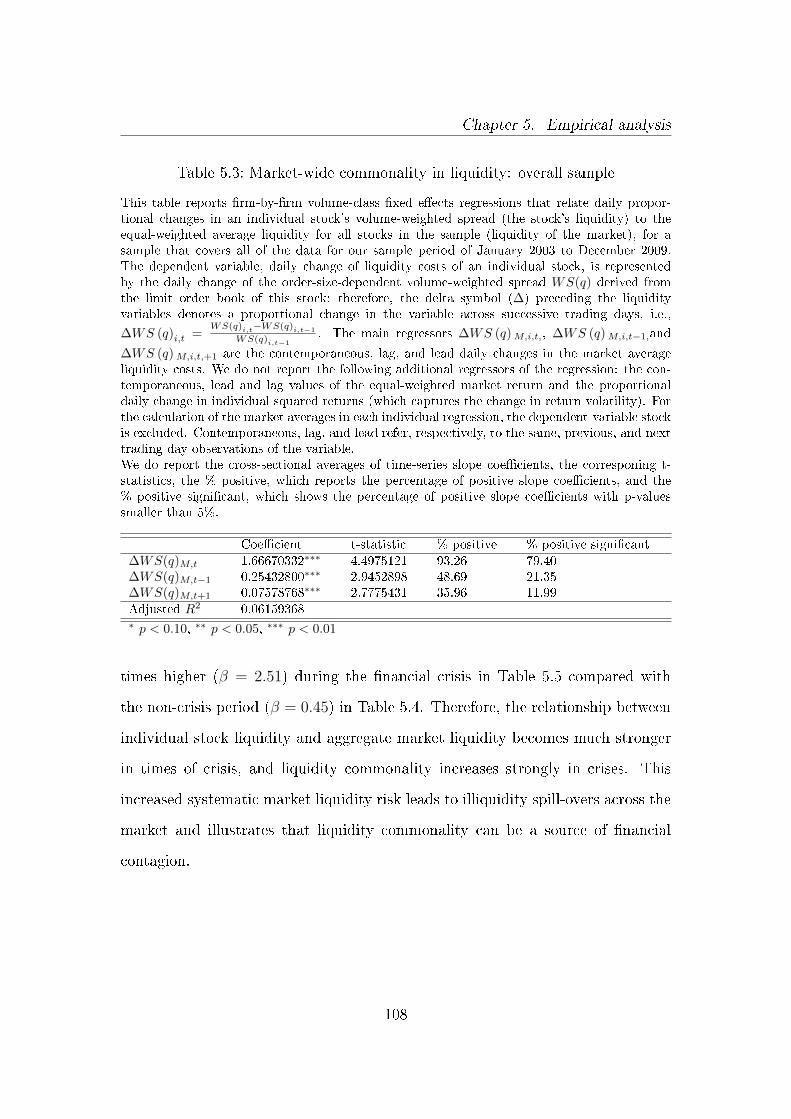
Chapter 5. Empirical analysis
Table 5.3: Market-wide commonality in liquidity: overall sample
This table reports �rm-by-�rm volume-class �xed e�ects regressions that relate daily propor-tional changes in an individual stock's volume-weighted spread (the stock's liquidity) to theequal-weighted average liquidity for all stocks in the sample (liquidity of the market), for asample that covers all of the data for our sample period of January 2003 to December 2009.The dependent variable, daily change of liquidity costs of an individual stock, is representedby the daily change of the order-size-dependent volume-weighted spread WS(q) derived fromthe limit order book of this stock; therefore, the delta symbol (Δ) preceding the liquidityvariables denotes a proportional change in the variable across successive trading days, i.e.,
∆WS (q)i,t =WS(q)i,t−WS(q)i,t−1
WS(q)i,t−1. The main regressors ∆WS (q)M,i,t,, ∆WS (q)M,i,t−1,and
∆WS (q)M,i,t,+1 are the contemporaneous, lag, and lead daily changes in the market averageliquidity costs. We do not report the following additional regressors of the regression: the con-temporaneous, lead and lag values of the equal-weighted market return and the proportionaldaily change in individual squared returns (which captures the change in return volatility). Forthe calculation of the market averages in each individual regression, the dependent-variable stockis excluded. Contemporaneous, lag, and lead refer, respectively, to the same, previous, and nexttrading day observations of the variable.We do report the cross-sectional averages of time-series slope coe�cients, the corresponing t-statistics, the % positive, which reports the percentage of positive slope coe�cients, and the% positive signi�cant, which shows the percentage of positive slope coe�cients with p-valuessmaller than 5%.
Coe�cient t-statistic % positive % positive signi�cant∆WS(q)M,t 1.66670332∗∗∗ 4.4975121 93.26 79.40∆WS(q)M,t−1 0.25432800∗∗∗ 2.9452898 48.69 21.35∆WS(q)M,t+1 0.07578768∗∗∗ 2.7775431 35.96 11.99Adjusted R2 0.06159368∗ p < 0.10, ∗∗ p < 0.05, ∗∗∗ p < 0.01
times higher (β = 2.51) during the �nancial crisis in Table 5.5 compared with
the non-crisis period (β = 0.45) in Table 5.4. Therefore, the relationship between
individual stock liquidity and aggregate market liquidity becomes much stronger
in times of crisis, and liquidity commonality increases strongly in crises. This
increased systematic market liquidity risk leads to illiquidity spill-overs across the
market and illustrates that liquidity commonality can be a source of �nancial
contagion.
108
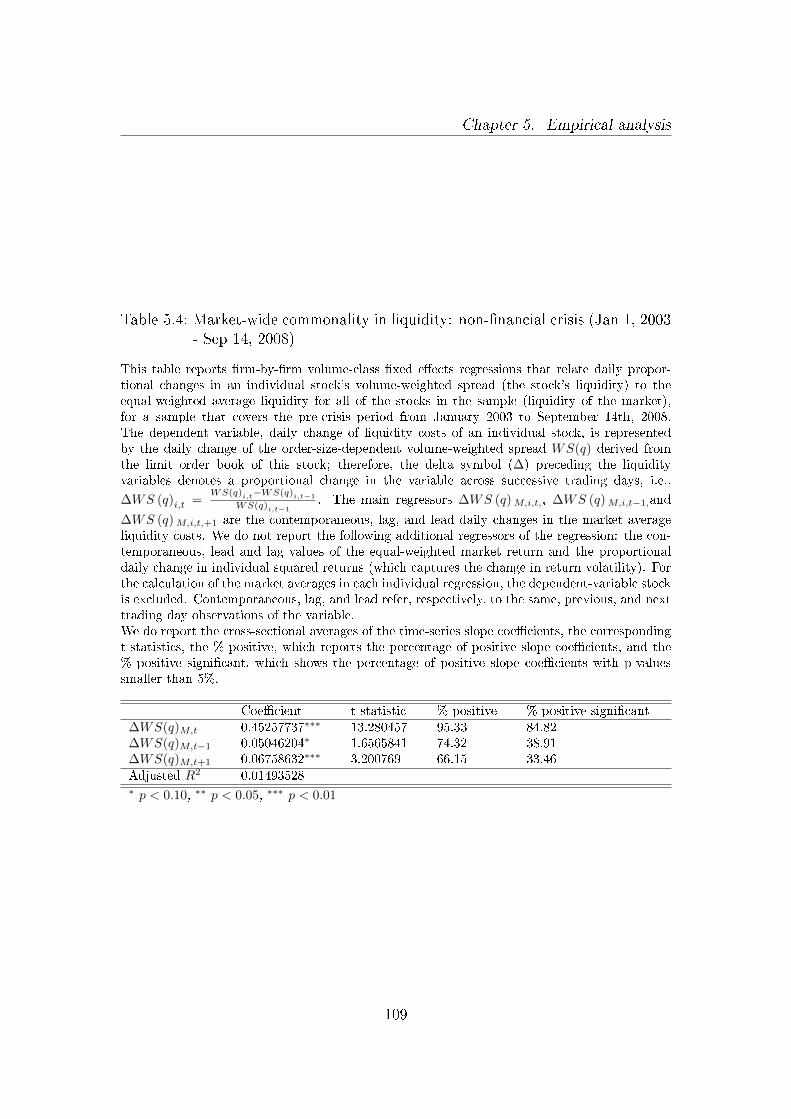
Chapter 5. Empirical analysis
Table 5.4: Market-wide commonality in liquidity: non-�nancial crisis (Jan 1, 2003- Sep 14, 2008)
This table reports �rm-by-�rm volume-class �xed e�ects regressions that relate daily propor-tional changes in an individual stock's volume-weighted spread (the stock's liquidity) to theequal-weighted average liquidity for all of the stocks in the sample (liquidity of the market),for a sample that covers the pre-crisis period from January 2003 to September 14th, 2008.The dependent variable, daily change of liquidity costs of an individual stock, is representedby the daily change of the order-size-dependent volume-weighted spread WS(q) derived fromthe limit order book of this stock; therefore, the delta symbol (Δ) preceding the liquidityvariables denotes a proportional change in the variable across successive trading days, i.e.,
∆WS (q)i,t =WS(q)i,t−WS(q)i,t−1
WS(q)i,t−1. The main regressors ∆WS (q)M,i,t,, ∆WS (q)M,i,t−1,and
∆WS (q)M,i,t,+1 are the contemporaneous, lag, and lead daily changes in the market averageliquidity costs. We do not report the following additional regressors of the regression: the con-temporaneous, lead and lag values of the equal-weighted market return and the proportionaldaily change in individual squared returns (which captures the change in return volatility). Forthe calculation of the market averages in each individual regression, the dependent-variable stockis excluded. Contemporaneous, lag, and lead refer, respectively, to the same, previous, and nexttrading day observations of the variable.We do report the cross-sectional averages of the time-series slope coe�cients, the correspondingt-statistics, the % positive, which reports the percentage of positive slope coe�cients, and the% positive signi�cant, which shows the percentage of positive slope coe�cients with p-valuessmaller than 5%.
Coe�cient t-statistic % positive % positive signi�cant∆WS(q)M,t 0.45257737∗∗∗ 13.280457 95.33 84.82∆WS(q)M,t−1 0.05046204∗ 1.6565841 74.32 38.91∆WS(q)M,t+1 0.06758632∗∗∗ 3.200769 66.15 33.46Adjusted R2 0.01493528∗ p < 0.10, ∗∗ p < 0.05, ∗∗∗ p < 0.01
109
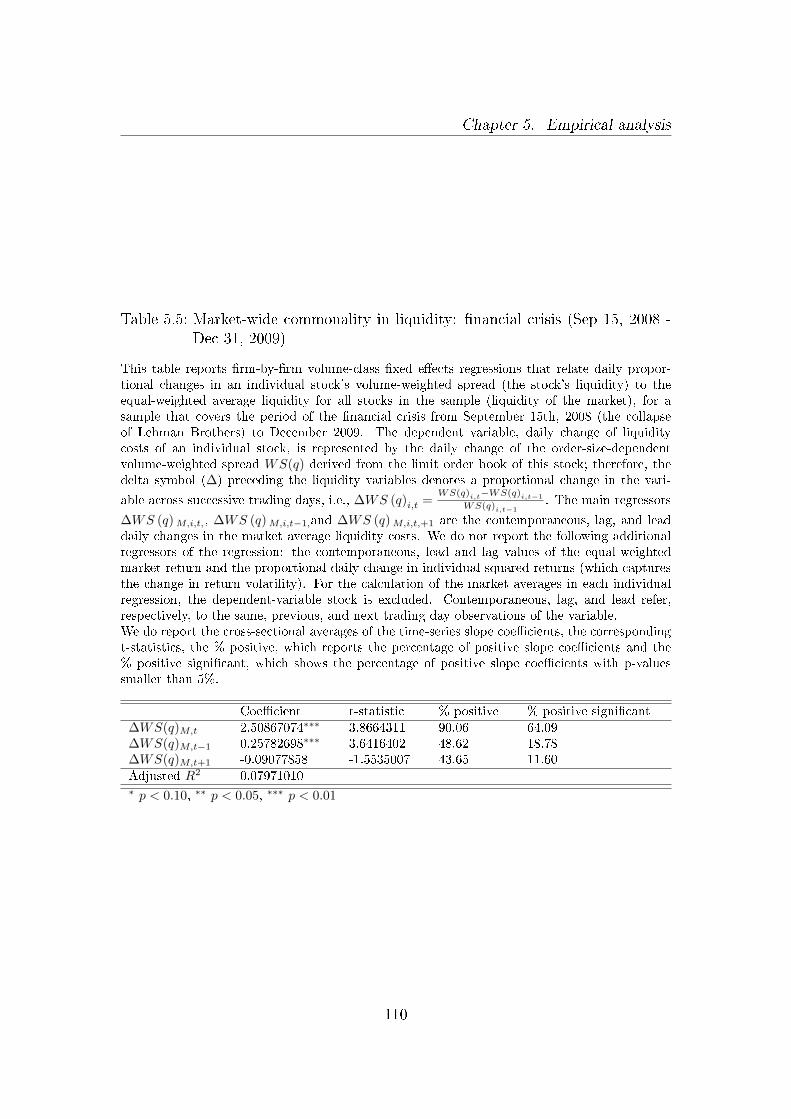
Chapter 5. Empirical analysis
Table 5.5: Market-wide commonality in liquidity: �nancial crisis (Sep 15, 2008 -Dec 31, 2009)
This table reports �rm-by-�rm volume-class �xed e�ects regressions that relate daily propor-tional changes in an individual stock's volume-weighted spread (the stock's liquidity) to theequal-weighted average liquidity for all stocks in the sample (liquidity of the market), for asample that covers the period of the �nancial crisis from September 15th, 2008 (the collapseof Lehman Brothers) to December 2009. The dependent variable, daily change of liquiditycosts of an individual stock, is represented by the daily change of the order-size-dependentvolume-weighted spread WS(q) derived from the limit order book of this stock; therefore, thedelta symbol (Δ) preceding the liquidity variables denotes a proportional change in the vari-
able across successive trading days, i.e., ∆WS (q)i,t =WS(q)i,t−WS(q)i,t−1
WS(q)i,t−1. The main regressors
∆WS (q)M,i,t,, ∆WS (q)M,i,t−1,and ∆WS (q)M,i,t,+1 are the contemporaneous, lag, and leaddaily changes in the market average liquidity costs. We do not report the following additionalregressors of the regression: the contemporaneous, lead and lag values of the equal-weightedmarket return and the proportional daily change in individual squared returns (which capturesthe change in return volatility). For the calculation of the market averages in each individualregression, the dependent-variable stock is excluded. Contemporaneous, lag, and lead refer,respectively, to the same, previous, and next trading day observations of the variable.We do report the cross-sectional averages of the time-series slope coe�cients, the correspondingt-statistics, the % positive, which reports the percentage of positive slope coe�cients and the% positive signi�cant, which shows the percentage of positive slope coe�cients with p-valuessmaller than 5%.
Coe�cient t-statistic % positive % positive signi�cant∆WS(q)M,t 2.50867074∗∗∗ 3.8664311 90.06 64.09∆WS(q)M,t−1 0.25782698∗∗∗ 3.6416402 48.62 18.78∆WS(q)M,t+1 -0.09077858 -1.5535007 43.65 11.60Adjusted R2 0.07971010∗ p < 0.10, ∗∗ p < 0.05, ∗∗∗ p < 0.01
110
Chapter 5. Empirical analysis
5.1.2.2 Liquidity commonality over time
Given this strong liquidity commonality variation in times of crises, we now want
to further explore the dynamics of the liquidity commonality over time, as, despite
the strong evidence for the existence of commonality in liquidity, few studies
have focused on the drivers of liquidity co-movement. We particularly want to
understand the source of and dynamics behind liquidity commonality, especially
in times of crises. As a �rst step towards a better understanding of liquidity
commonality dynamics, we use a measure for the degree of liquidity commonality
called the R2 statistic, which has proven its relevance in the measurement of
individual stock return synchronicity, to further analyze the liquidity commonality
behavior over time and for di�erent order sizes.
The usage of the R2 statistic in the context of stock price co-movement with the
market was �rst proposed by Roll (1988) and later further developed and used,
among others, by Morck et al. (2000) and Chen et al. (2007b). The idea of market
model return R2s was recently adapted to measure the degree of individual stock
liquidity synchronicity by Hameed et al. (2010) and was also used by Karolyi
et al. (2011). This measure for the degree of liquidity commonality is simply the
coe�cient of determination R2 resulting from a regression of the following single-
factor liquidity market model, which is a simpli�cation of speci�cation (5.2):
∆WS (q)i,t = αi + βi ·∆WS (q)M,i,t + εi,t (5.4)
For every stock and each month in our sample, we estimate the R2 statistic
if there are at least 15 observations121 available for the respective company in
121 The requirement of at least 15 observations is in line with Hameed et al. (2010) and Karolyiet al. (2011).
111
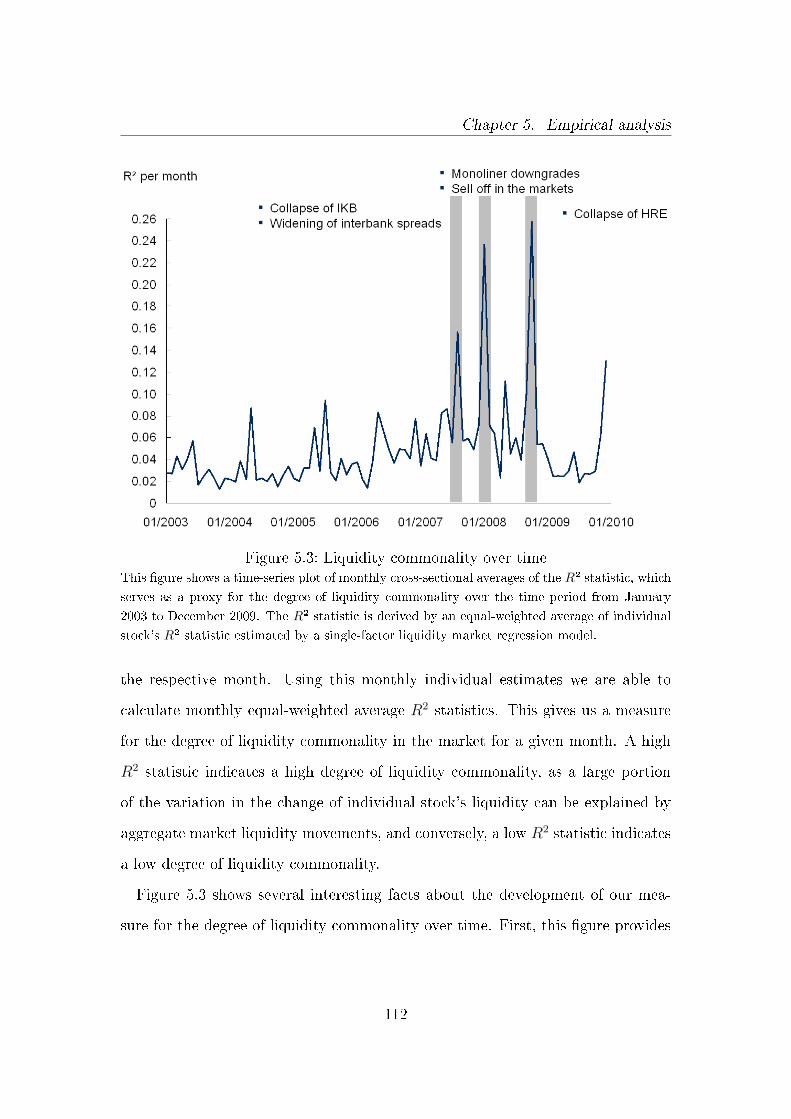
Chapter 5. Empirical analysis
Figure 5.3: Liquidity commonality over timeThis �gure shows a time-series plot of monthly cross-sectional averages of the R² statistic, which
serves as a proxy for the degree of liquidity commonality over the time period from January
2003 to December 2009. The R² statistic is derived by an equal-weighted average of individual
stock's R² statistic estimated by a single-factor liquidity market regression model.
the respective month. Using this monthly individual estimates we are able to
calculate monthly equal-weighted average R2 statistics. This gives us a measure
for the degree of liquidity commonality in the market for a given month. A high
R2 statistic indicates a high degree of liquidity commonality, as a large portion
of the variation in the change of individual stock's liquidity can be explained by
aggregate market liquidity movements, and conversely, a low R2 statistic indicates
a low degree of liquidity commonality.
Figure 5.3 shows several interesting facts about the development of our mea-
sure for the degree of liquidity commonality over time. First, this �gure provides
112
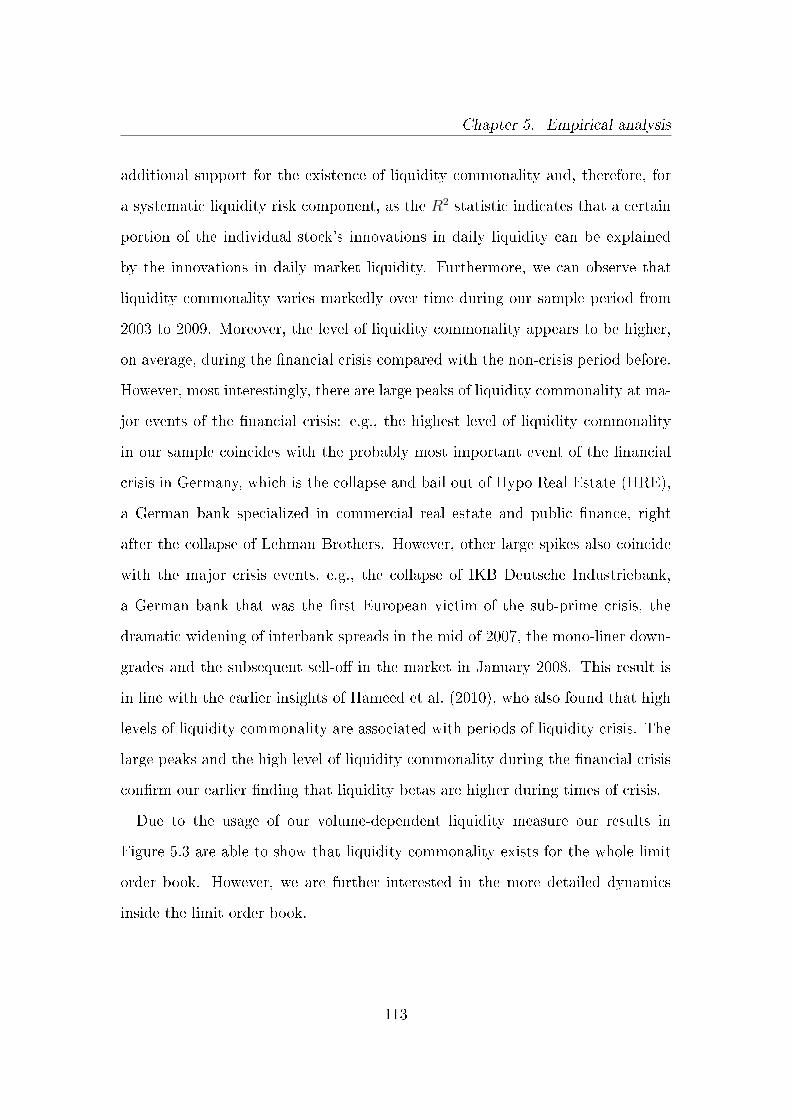
Chapter 5. Empirical analysis
additional support for the existence of liquidity commonality and, therefore, for
a systematic liquidity risk component, as the R2 statistic indicates that a certain
portion of the individual stock's innovations in daily liquidity can be explained
by the innovations in daily market liquidity. Furthermore, we can observe that
liquidity commonality varies markedly over time during our sample period from
2003 to 2009. Moreover, the level of liquidity commonality appears to be higher,
on average, during the �nancial crisis compared with the non-crisis period before.
However, most interestingly, there are large peaks of liquidity commonality at ma-
jor events of the �nancial crisis: e.g., the highest level of liquidity commonality
in our sample coincides with the probably most important event of the �nancial
crisis in Germany, which is the collapse and bail out of Hypo Real Estate (HRE),
a German bank specialized in commercial real estate and public �nance, right
after the collapse of Lehman Brothers. However, other large spikes also coincide
with the major crisis events, e.g., the collapse of IKB Deutsche Industriebank,
a German bank that was the �rst European victim of the sub-prime crisis, the
dramatic widening of interbank spreads in the mid of 2007, the mono-liner down-
grades and the subsequent sell-o� in the market in January 2008. This result is
in line with the earlier insights of Hameed et al. (2010), who also found that high
levels of liquidity commonality are associated with periods of liquidity crisis. The
large peaks and the high level of liquidity commonality during the �nancial crisis
con�rm our earlier �nding that liquidity betas are higher during times of crisis.
Due to the usage of our volume-dependent liquidity measure our results in
Figure 5.3 are able to show that liquidity commonality exists for the whole limit
order book. However, we are further interested in the more detailed dynamics
inside the limit order book.
113
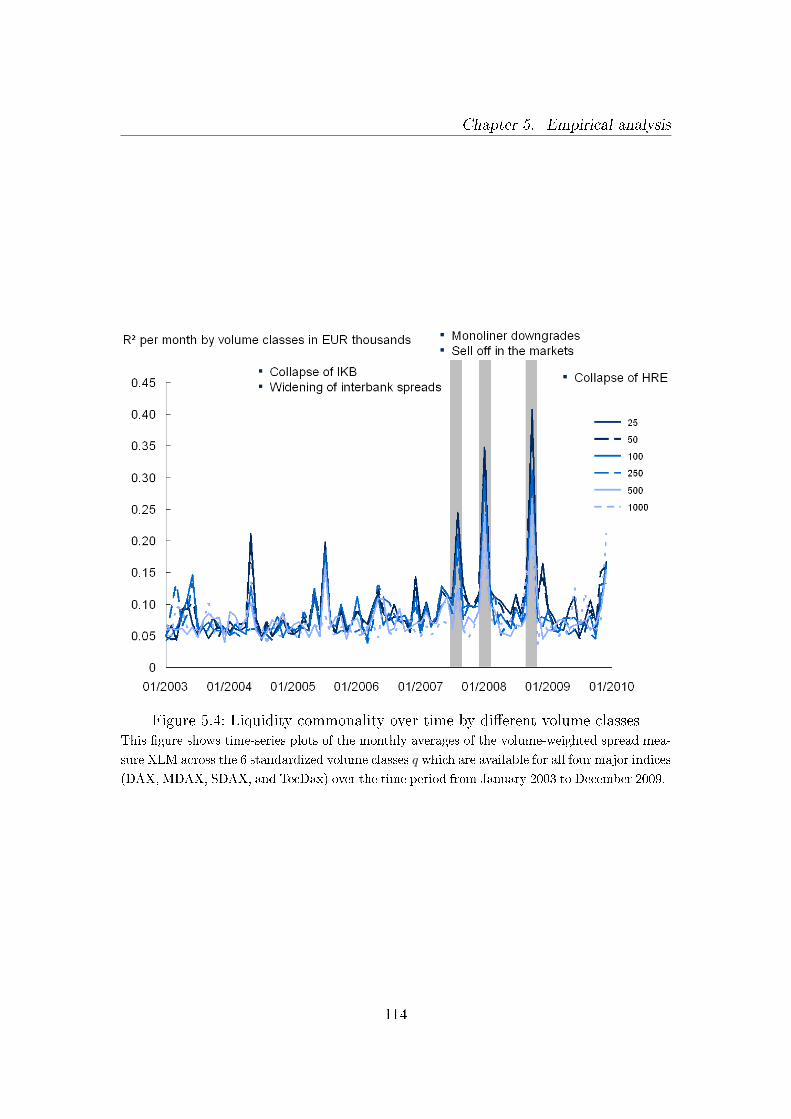
Chapter 5. Empirical analysis
Figure 5.4: Liquidity commonality over time by di�erent volume classesThis �gure shows time-series plots of the monthly averages of the volume-weighted spread mea-
sure XLM across the 6 standardized volume classes q which are available for all four major indices
(DAX, MDAX, SDAX, and TecDax) over the time period from January 2003 to December 2009.
114
Chapter 5. Empirical analysis
5.1.2.3 Liquidity commonality and the impact of di�erent order sizes
Therefore, we redo the same analysis using speci�cation (5.4); however, this time,
we estimate the R2 statistic for every volume class of every individual stock inde-
pendently in each month of our sample. Using these monthly individual estimates,
we are able to calculate monthly equal-weighted average R2 statistics for every
standardized volume class q across all companies.
Figure 5.4 shows the same liquidity commonality development over time as
Figure 5.3. Hence, the liquidity commonality dynamics over time do not di�er
signi�cantly for di�erent order-sizes. Liquidity commonality is, therefore, a phe-
nomenon that is relevant for all order-sizes, prevails throughout the whole limit
order book and is heavily in�uenced by crises. However, Figure 5.4 gives a �rst
indication that the absolute level of liquidity commonality might di�er across vol-
ume classes. One can easily see that larger volume classes, e.g., order sizes of
EUR 1 million, feature lower levels of liquidity commonality than smaller volume
classes. As a further proof, we calculate the average monthly R2 statistics for all 6
standardized volume classes q that are available for all four major German indices
(DAX, MDAX, SDAX, and TecDAX).
Figure 5.5 shows a clear liquidity commonality ranking across the volume classes
from small to large volume classes, i.e., the larger the order size, the smaller
the average liquidity commonality, and therefore, the systematic liquidity risk.
Whereas, for example, the average monthly R2 statistic for order sizes of EUR
25,000 is 9.51%, it is only 8.70% for order sizes of EUR 100,000 and 7.27% for
order sizes of EUR 1 million. Hence, the liquidity commonality becomes weaker
as we look more deeply into the limit order book.122 These �ndings, however,
122 The decreasing liquidity commonality with order size cannot be explained by a change inthe composition of the sample stocks that went into the calculation between times of low
115
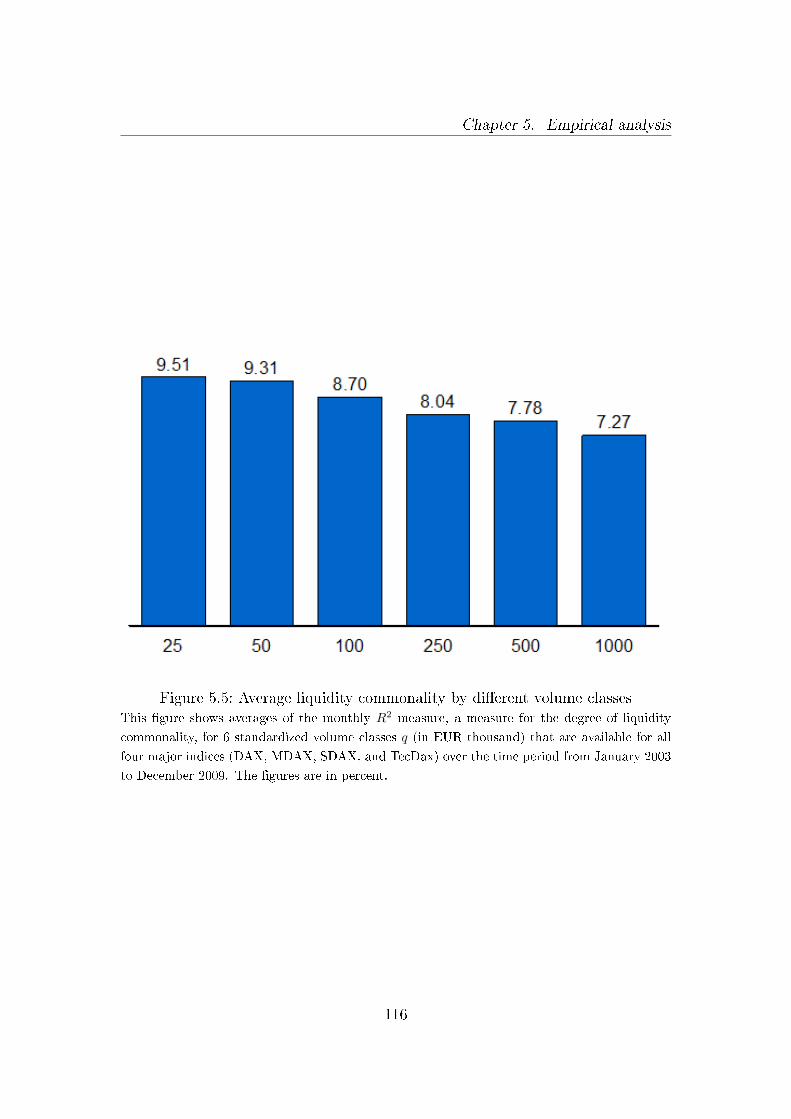
Chapter 5. Empirical analysis
Figure 5.5: Average liquidity commonality by di�erent volume classesThis �gure shows averages of the monthly R2 measure, a measure for the degree of liquidity
commonality, for 6 standardized volume classes q (in EUR thousand) that are available for all
four major indices (DAX, MDAX, SDAX, and TecDax) over the time period from January 2003
to December 2009. The �gures are in percent.
116
Chapter 5. Empirical analysis
contradict those of Kempf and Mayston (2008), who showed in their analysis that
commonality in liquidity becomes stronger the more deeply they look into the
limit order book.
Thus far, we can record four interesting facts about liquidity commonality:
liquidity commonality exists (in the whole limit order book), it varies over time,
it is particularly pronounced in times of crisis, and it becomes weaker the more
deeply we look into the limit order book.
5.1.2.4 Liquidity commonality and market declines
After having analyzed the dynamics of liquidity commonality, we now want to
focus on the drivers behind liquidity commonality, as few studies to date have
focused on the factors in�uencing liquidity commonality. By and large, liquidity
commonality can have three basic sources: co-variation in liquidity supply, co-
movement in liquidity demand, or both.
Earlier, we observed that individual stock liquidity is in�uenced by index re-
turns (see Table 5.2), i.e., aggregate stock market declines reduce individual stock
liquidity. Further research on return co-movement, see, e.g., Ang and Chen (2002),
showed that co-variation in stock returns increases after large market declines. We
now want to determine wether there is a similar pattern in liquidity commonality
as in return co-movement after market declines. We want to test the hypothesis
that aggregate stock market return is a major driver of liquidity commonality. We
base this hypothesis on a broad range of theoretical research, see, e.g., Bookstaber
(2000), Kyle and Xiong (2001), Vayanos (2004), Garleanu and Pedersen (2007)
liquidity commonality (pre-crisis period) and high liquidity commonality (crisis period).See Figure A.1 in the Appendix, which shows that the distribution of the stocks by indexthat are used to calculate our (average) liquidity commonality measure R2 is virtuallyconstant in a comparison of a pre-crisis and a crisis period for every volume class.
117
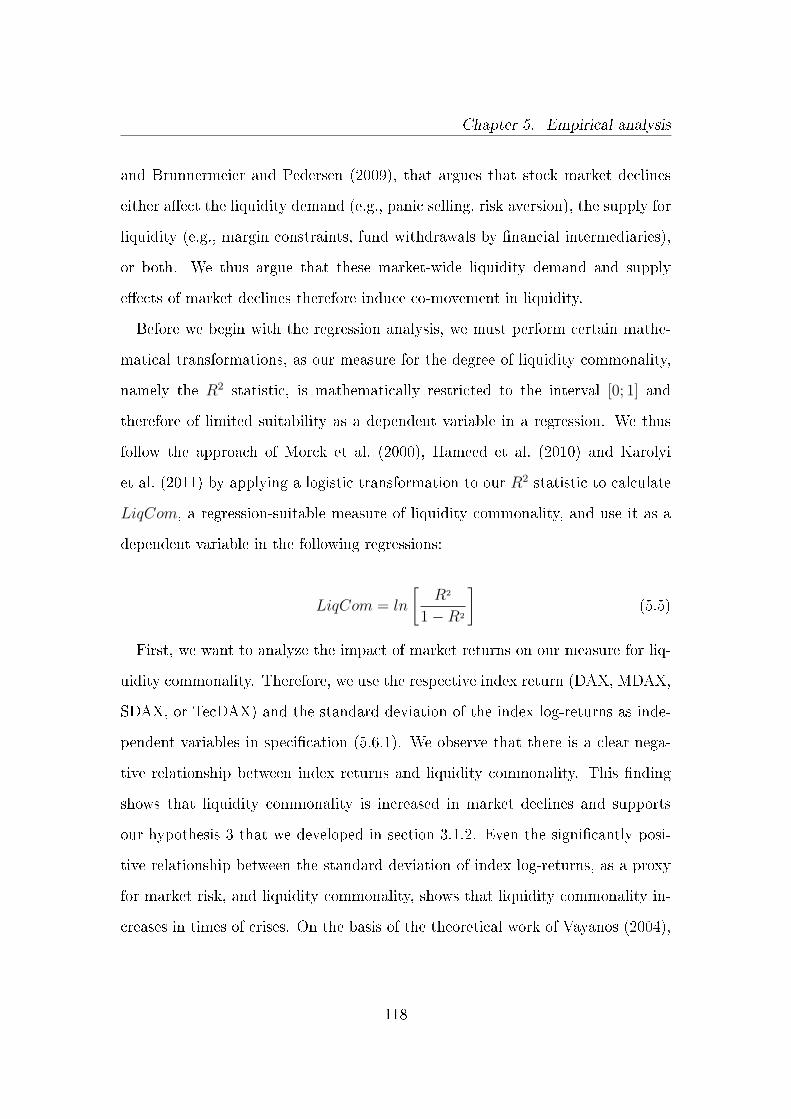
Chapter 5. Empirical analysis
and Brunnermeier and Pedersen (2009), that argues that stock market declines
either a�ect the liquidity demand (e.g., panic selling, risk aversion), the supply for
liquidity (e.g., margin constraints, fund withdrawals by �nancial intermediaries),
or both. We thus argue that these market-wide liquidity demand and supply
e�ects of market declines therefore induce co-movement in liquidity.
Before we begin with the regression analysis, we must perform certain mathe-
matical transformations, as our measure for the degree of liquidity commonality,
namely the R2 statistic, is mathematically restricted to the interval [0; 1] and
therefore of limited suitability as a dependent variable in a regression. We thus
follow the approach of Morck et al. (2000), Hameed et al. (2010) and Karolyi
et al. (2011) by applying a logistic transformation to our R2 statistic to calculate
LiqCom, a regression-suitable measure of liquidity commonality, and use it as a
dependent variable in the following regressions:
LiqCom = ln
[R2
1−R2
](5.5)
First, we want to analyze the impact of market returns on our measure for liq-
uidity commonality. Therefore, we use the respective index return (DAX, MDAX,
SDAX, or TecDAX) and the standard deviation of the index log-returns as inde-
pendent variables in speci�cation (5.6.1). We observe that there is a clear nega-
tive relationship between index returns and liquidity commonality. This �nding
shows that liquidity commonality is increased in market declines and supports
our hypothesis 3 that we developed in section 3.1.2. Even the signi�cantly posi-
tive relationship between the standard deviation of index log-returns, as a proxy
for market risk, and liquidity commonality, shows that liquidity commonality in-
creases in times of crises. On the basis of the theoretical work of Vayanos (2004),
118
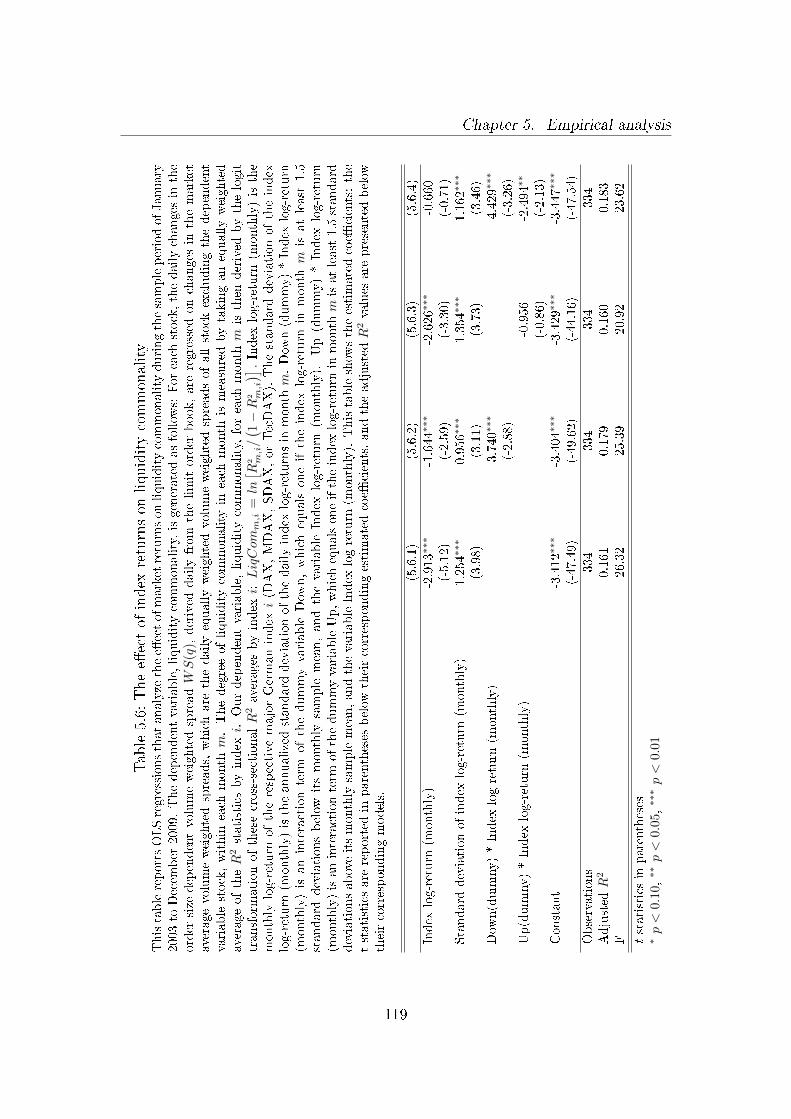
Chapter 5. Empirical analysisTable5.6:
Thee�ectof
index
returnson
liquiditycommonality
ThistablereportsOLSregressionsthatanalyze
thee�ectofmarketreturnsonliquiditycommonality
duringthesampleperiodofJanuary
2003to
Decem
ber
2009.Thedependentvariable,liquiditycommonality,isgeneratedasfollow
s:Foreach
stock,thedailychanges
inthe
order-size-dependentvolume-weightedspreadWS
(q),derived
dailyfrom
thelimitorder
book,are
regressed
onchanges
inthemarket
averagevolume-weightedspreads,whichare
thedailyequallyweightedvolume-weightedspreadsofallstock
excludingthedependent
variable
stock,within
each
month
m.Thedegreeofliquiditycommonality
ineach
month
ismeasuredbytakinganequallyweighted
averageoftheR
2statisticsbyindex
i.Ourdependentvariable,liquiditycommonality,foreach
month
misthen
derived
bythelogit
transform
ationofthesecross-sectionalR
2averages
byindex
i:LiqCom
m,i
=ln[ R2 m
,i/( 1−R
2 m,i
)] .Index
log-return
(monthly)isthe
monthly
log-return
oftherespective
majorGermanindex
i(D
AX,MDAX,SDAX,orTecDAX).Thestandard
deviationoftheindex
log-return
(monthly)istheannualizedstandard
deviationofthedailyindex
log-returnsin
monthm.Dow
n(dummy)*Index
log-return
(monthly)is
aninteractionterm
ofthedummyvariable
Dow
n,whichequals
oneiftheindex
log-return
inmonth
mis
atleast
1.5
standard
deviationsbelow
itsmonthly
sample
mean,andthevariable
Index
log-return
(monthly).
Up(dummy)*Index
log-return
(monthly)isaninteractionterm
ofthedummyvariableUp,whichequalsoneiftheindex
log-return
inmonthm
isatleast1.5standard
deviationsaboveitsmonthly
samplemean,andthevariableIndex
log-return
(monthly).Thistableshow
stheestimated
coe�
cients:the
t-statisticsare
reported
inparentheses
below
theircorrespondingestimatedcoe�
cients,andtheadjusted
R2values
are
presentedbelow
theircorrespondingmodels.
(5.6.1)
(5.6.2)
(5.6.3)
(5.6.4)
Index
log-return
(monthly)
-2.913∗∗
∗-1.644∗∗
∗-2.626∗∗
∗-0.660
(-5.12)
(-2.59)
(-3.30)
(-0.71)
Standard
deviationofindex
log-return
(monthly)
1.254∗∗
∗0.956∗∗
∗1.354∗∗
∗1.162∗∗
∗
(3.98)
(3.11)
(3.73)
(3.46)
Dow
n(dummy)*Index
log-return
(monthly)
-3.740∗∗
∗-4.429∗∗
∗
(-2.88)
(-3.26)
Up(dummy)*Index
log-return
(monthly)
-0.956
-2.494∗∗
(-0.86)
(-2.13)
Constant
-3.412∗∗
∗-3.404∗∗
∗-3.429∗∗
∗-3.447∗∗
∗
(-47.49)
(-49.62)
(-44.16)
(-47.54)
Observations
334
334
334
334
Adjusted
R2
0.161
0.179
0.160
0.183
F26.32
25.39
20.92
23.62
tstatisticsin
parentheses
∗p<
0.1
0,∗∗p<
0.0
5,∗∗
∗p<
0.01
119
Chapter 5. Empirical analysis
this phenomenon can be at least partially attributed to liquidity demand e�ects,
as in times of volatile markets, institutional investors, mainly due to a higher
probability of fund withdrawals that are subject to performance thresholds, be-
come more risk-avers and have an increased liquidity preference. Therefore, an
increase in market volatility is associated with an increase in liquidity demand
and hence leads to higher levels of liquidity commonality.
We further separately add a variable that captures abnormally large negative
one-day returns and a variable that captures abnormally large positive returns in
speci�cations (5.6.2) and (5.6.3), respectively. Technically, these two variables are
interaction terms of a dummy variable that equals one if the one-day index return
is at least 1.5 standard deviations123 above or below its sample mean, respectively,
and the respective index log-return. These two variables should shed light on
the liquidity dynamics on days with strong market reactions. We hypothesize
that stronger market reactions will even magnify the impact of the relationship
between liquidity commonality and aggregate index returns, as most theoretical
explanations, e.g., panic selling or higher margin requirements, are even more
relevant for large market reactions. Finally, we use all of the aforementioned
control variables together in the speci�cation (5.6.4).
The results in model (5.6.2) show that large negative market shocks signi�-
cantly magnify even the liquidity co-movement induced by index returns. This
�nding provides further support to the theoretical liquidity demand and supply
explanations, as most of these explanations should only loom large for large mar-
ket drops. This interesting observation for unusual large market downturns also
con�rms other empirical results of Chordia et al. (2001), Chordia et al. (2002) and
123 Consistent with Hameed et al. (2010), we use a threshold of 1.5 standard deviations; how-ever, also other threshold levels, e.g., 1 and 2 standard deviations, also lead to similarresults.
120
Chapter 5. Empirical analysis
Hameed et al. (2010), who found a highly signi�cant bid-ask spread widening at
the days of or days following negative market returns, which can be attributed to
an increase in liquidity commonality on days of strong negative market reactions.
This relationship has an important consequence for liquidity risk management, as
diversifying liquidity risk in times of market downturns, when diversi�cation is
most needed, becomes more di�cult due to the strong liquidity commonality.
The speci�cation (5.6.3), which only includes abnormally large positive returns
in addition to index returns and volatility, does not yield any signi�cant results for
the impact of large positive market reactions. However, in speci�cation (5.6.4),
we see that only large, either negative or positive, market reactions signi�cantly
impact liquidity commonality and that the index return variable is not signi�cant.
However, large negative market returns have, by far a greater impact on liquidity
commonality than abnormal positive returns. This result is important because it
demonstrates the asymmetry in liquidity commonality and again highlights the
soaring liquidity risk induced by liquidity commonality in market downturns.
Our �ndings, therefore, give support for our hypothesis that stock market de-
clines by a�ecting liquidity demand (e.g., panic selling, risk aversion) or liquidity
supply (e.g., margin constraints, fund withdrawals by �nancial intermediaries)
lead to liquidity commonality.
5.1.2.5 Liquidity commonality and funding liquidity
The theoretical concept that market-wide supply e�ects in liquidity during mar-
ket declines impair market liquidity by inducing market commonality, which is
also known as the funding and market liquidity spiral, see, e.g., Brunnermeier
and Pedersen (2009), has recently received huge attention. In their theoretical
work (see section 3.1.2), they argue that a large market-wide price decline could
121
Chapter 5. Empirical analysis
initiate a spiral of funding and market liquidity dry-ups that induces liquidity
commonality. This e�ect should even have intensi�ed with an increasing �nancial
integration in the last decade.
We therefore want to empirically test this liquidity supply side e�ect on liquidity
commonality and investigate the dynamic interactions between �nancial liquidity
and market liquidity. We separately use two proxies for funding liquidity tightness:
the banking sector returns and the EURIBOR-EONIA-spreads.
Banking sector returns measure the change in the aggregate market value of
the banking sector and therefore serve as proxies for their performance. As the
tendency of investors to withdraw funds from intermediary �nancial institutions,
such as banks, is linked to the intermediaries' performance, a drop in the market
valuation of the banking sector is therefore a good proxy for a weak aggregate
funding liquidity situation.
Hence, we start o� with speci�cation (5.7.1) that adds the DAX Banks log-
returns, a bank index that consists of all major German banks, to speci�cation
(5.6.1), that consists of index returns and the standard deviation of the index log-
returns. The signi�cant negative relationship between the DAX Banks log-returns
and our liquidity commonality measure supports our liquidity supply hypothesis.
If we further add the two variables that capture abnormally large negative and
positive one-day returns in the speci�cation (5.7.2), we see that the index return
becomes insigni�cant, whereas the impact of abnormally large negative and large
positive one-day returns remains signi�cant; however, become less signi�cant, and
the impact of the DAX Banks log-returns remains robust. Thus, we see that
under-performance of the banking sector, which proxies a tight aggregate funding
liquidity situation, leads to an increase in liquidity commonality.
To test the robustness of this result we use a second proxy for funding liquidity
122
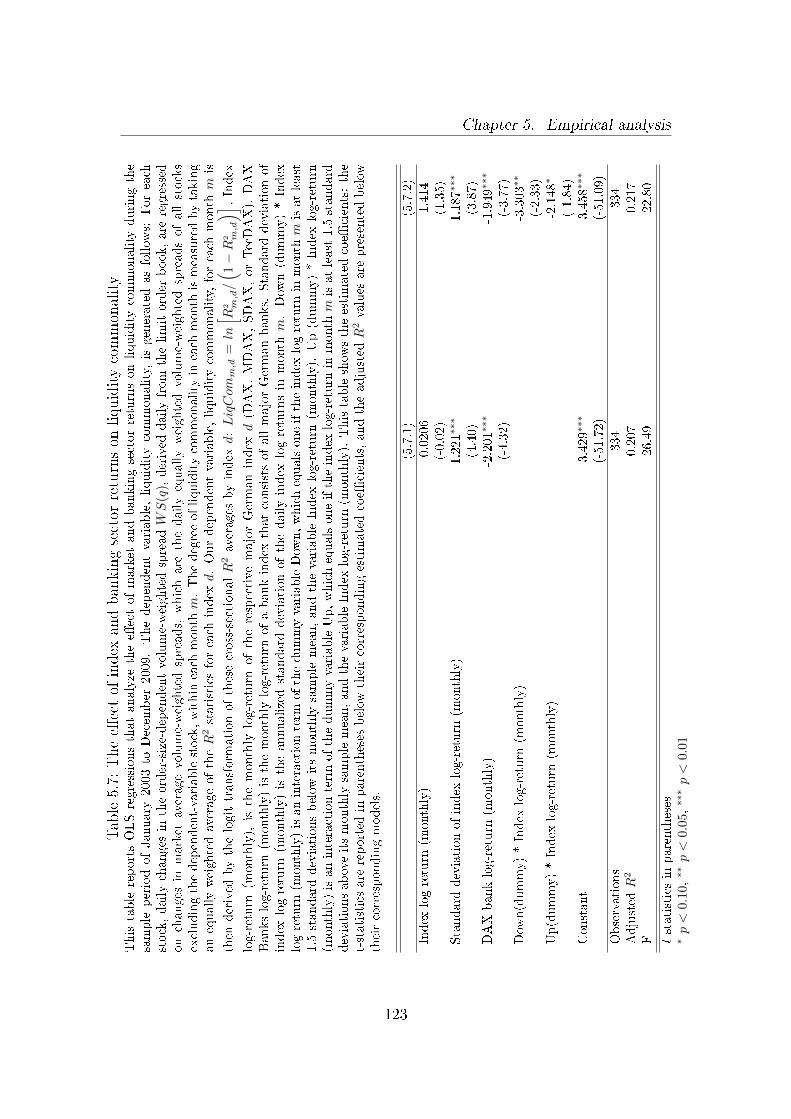
Chapter 5. Empirical analysisTable5.7:
Thee�ectof
index
andbankingsector
returnson
liquiditycommonality
Thistable
reportsOLSregressionsthatanalyze
thee�ectofmarket
andbankingsectorreturnsonliquiditycommonality
duringthe
sample
periodofJanuary
2003to
Decem
ber
2009.Thedependentvariable,liquiditycommonality,isgeneratedasfollow
s:Foreach
stock,dailychanges
intheorder-size-dependentvolume-weightedspreadWS
(q),derived
dailyfrom
thelimitorder
book,are
regressed
onchanges
inmarket
averagevolume-weightedspreads,
whichare
thedailyequallyweightedvolume-weightedspreadsofallstocks
excludingthedependent-variablestock,within
each
monthm.Thedegreeofliquiditycommonality
ineach
month
ismeasuredbytaking
anequallyweightedaverageoftheR
2statisticsforeach
index
d.Ourdependentvariable,liquiditycommonality,foreach
month
mis
then
derived
bythelogittransform
ationofthesecross-sectionalR
2averages
byindex
d:LiqCom
m,d
=ln[ R
2 m,d/( 1−R
2 m,d
)] .Index
log-return
(monthly),
isthemonthly
log-return
oftherespective
majorGermanindex
d(D
AX,MDAX,SDAX,orTecDAX).
DAX
Bankslog-return
(monthly)isthemonthly
log-return
ofabankindex
thatconsistsofallmajorGermanbanks.
Standard
deviationof
index
log-return
(monthly)istheannualizedstandard
deviationofthedailyindex
log-returnsin
month
m.Dow
n(dummy)*Index
log-return
(monthly)isaninteractionterm
ofthedummyvariableDow
n,whichequalsoneiftheindex
log-return
inmonthm
isat
least
1.5
standard
deviationsbelow
itsmonthly
samplemean,andthevariableIndex
log-return
(monthly).
Up(dummy)*Index
log-return
(monthly)isaninteractionterm
ofthedummyvariableUp,whichequalsoneiftheindex
log-return
inmonthm
isatleast1.5standard
deviationsaboveitsmonthly
samplemean,andthevariableIndex
log-return
(monthly).Thistableshow
stheestimatedcoe�
cients:the
t-statisticsare
reported
inparentheses
below
theircorrespondingestimatedcoe�
cients,andtheadjusted
R2values
are
presentedbelow
theircorrespondingmodels.
(5.7.1)
(5.7.2)
Index
log-return
(monthly)
-0.0206
1.414
(-0.02)
(1.35)
Standard
deviationofindex
log-return
(monthly)
1.221∗∗
∗1.187∗∗
∗
(4.40)
(3.87)
DAXbanklog-return
(monthly)
-2.201∗
∗∗-1.949∗∗
∗
(-4.32)
(-3.77)
Dow
n(dummy)*Index
log-return
(monthly)
-3.303∗∗
(-2.33)
Up(dummy)*Index
log-return
(monthly)
-2.148∗
(-1.84)
Constant
-3.429∗∗
∗-3.458∗∗
∗
(-51.72)
(-51.09)
Observations
334
334
Adjusted
R2
0.207
0.217
F26.49
22.80
tstatisticsin
parentheses
∗p<
0.1
0,∗∗p<
0.0
5,∗∗
∗p<
0.01
123
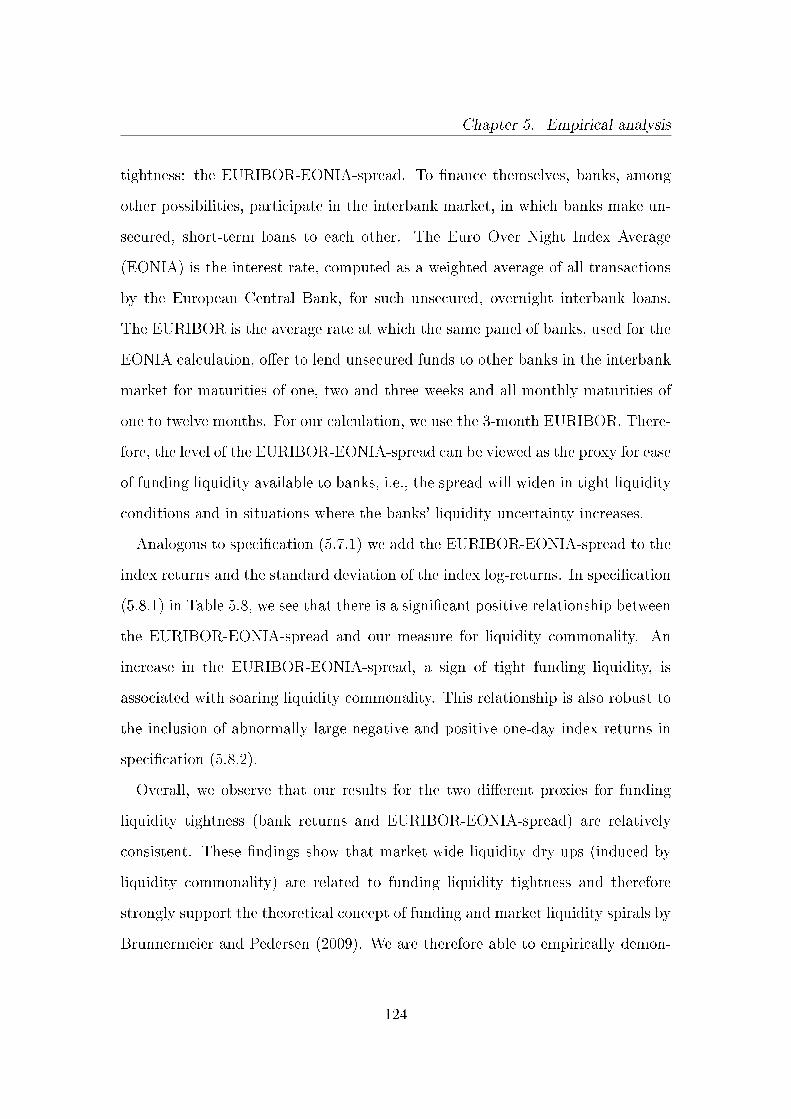
Chapter 5. Empirical analysis
tightness: the EURIBOR-EONIA-spread. To �nance themselves, banks, among
other possibilities, participate in the interbank market, in which banks make un-
secured, short-term loans to each other. The Euro Over Night Index Average
(EONIA) is the interest rate, computed as a weighted average of all transactions
by the European Central Bank, for such unsecured, overnight interbank loans.
The EURIBOR is the average rate at which the same panel of banks, used for the
EONIA calculation, o�er to lend unsecured funds to other banks in the interbank
market for maturities of one, two and three weeks and all monthly maturities of
one to twelve months. For our calculation, we use the 3-month EURIBOR. There-
fore, the level of the EURIBOR-EONIA-spread can be viewed as the proxy for ease
of funding liquidity available to banks, i.e., the spread will widen in tight liquidity
conditions and in situations where the banks' liquidity uncertainty increases.
Analogous to speci�cation (5.7.1) we add the EURIBOR-EONIA-spread to the
index returns and the standard deviation of the index log-returns. In speci�cation
(5.8.1) in Table 5.8, we see that there is a signi�cant positive relationship between
the EURIBOR-EONIA-spread and our measure for liquidity commonality. An
increase in the EURIBOR-EONIA-spread, a sign of tight funding liquidity, is
associated with soaring liquidity commonality. This relationship is also robust to
the inclusion of abnormally large negative and positive one-day index returns in
speci�cation (5.8.2).
Overall, we observe that our results for the two di�erent proxies for funding
liquidity tightness (bank returns and EURIBOR-EONIA-spread) are relatively
consistent. These �ndings show that market-wide liquidity dry-ups (induced by
liquidity commonality) are related to funding liquidity tightness and therefore
strongly support the theoretical concept of funding and market liquidity spirals by
Brunnermeier and Pedersen (2009). We are therefore able to empirically demon-
124
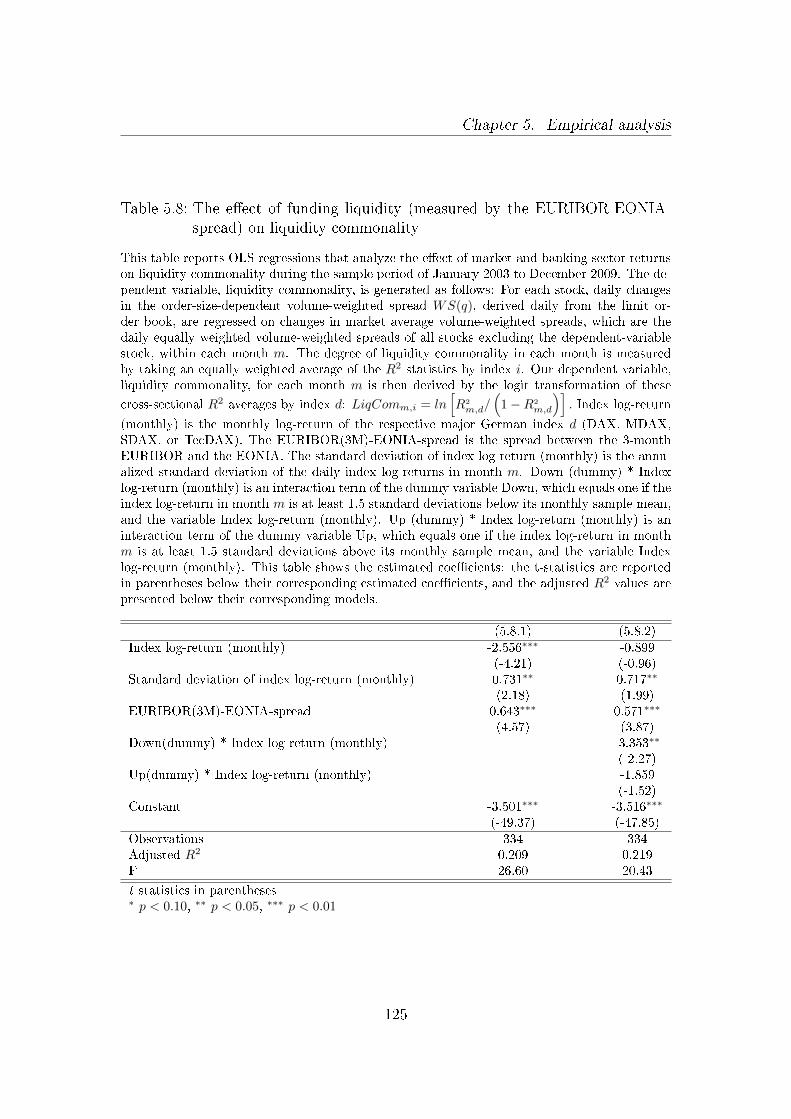
Chapter 5. Empirical analysis
Table 5.8: The e�ect of funding liquidity (measured by the EURIBOR-EONIA-spread) on liquidity commonality
This table reports OLS regressions that analyze the e�ect of market and banking sector returnson liquidity commonality during the sample period of January 2003 to December 2009. The de-pendent variable, liquidity commonality, is generated as follows: For each stock, daily changesin the order-size-dependent volume-weighted spread WS(q), derived daily from the limit or-der book, are regressed on changes in market average volume-weighted spreads, which are thedaily equally weighted volume-weighted spreads of all stocks excluding the dependent-variablestock, within each month m. The degree of liquidity commonality in each month is measuredby taking an equally weighted average of the R2 statistics by index i. Our dependent variable,liquidity commonality, for each month m is then derived by the logit transformation of these
cross-sectional R2 averages by index d: LiqComm,i = ln[R2
m,d/(
1−R2
m,d
)]. Index log-return
(monthly) is the monthly log-return of the respective major German index d (DAX, MDAX,SDAX, or TecDAX). The EURIBOR(3M)-EONIA-spread is the spread between the 3-monthEURIBOR and the EONIA. The standard deviation of index log-return (monthly) is the annu-alized standard deviation of the daily index log-returns in month m. Down (dummy) * Indexlog-return (monthly) is an interaction term of the dummy variable Down, which equals one if theindex log-return in month m is at least 1.5 standard deviations below its monthly sample mean,and the variable Index log-return (monthly). Up (dummy) * Index log-return (monthly) is aninteraction term of the dummy variable Up, which equals one if the index log-return in monthm is at least 1.5 standard deviations above its monthly sample mean, and the variable Indexlog-return (monthly). This table shows the estimated coe�cients: the t-statistics are reportedin parentheses below their corresponding estimated coe�cients, and the adjusted R2 values arepresented below their corresponding models.
(5.8.1) (5.8.2)Index log-return (monthly) -2.556∗∗∗ -0.899
(-4.21) (-0.96)Standard deviation of index log-return (monthly) 0.731∗∗ 0.717∗∗
(2.18) (1.99)EURIBOR(3M)-EONIA-spread 0.643∗∗∗ 0.571∗∗∗
(4.57) (3.87)Down(dummy) * Index log-return (monthly) -3.353∗∗
(-2.27)Up(dummy) * Index log-return (monthly) -1.859
(-1.52)Constant -3.501∗∗∗ -3.516∗∗∗
(-49.37) (-47.85)Observations 334 334Adjusted R2 0.209 0.219F 26.60 20.43
t statistics in parentheses∗ p < 0.10, ∗∗ p < 0.05, ∗∗∗ p < 0.01
125
Chapter 5. Empirical analysis
strate that the rather elusive theoretical concept, that the lack of market liquidity
is both a symptom of the �nancial crisis and, at the same time, responsible for
exacerbating its consequences, holds.
Having analyzed the liquidity commonality dynamics during the �nancial crisis,
we now want to turn our focus to another phenomenon in the market liquidity
context: the �ight-to-quality.
5.1.3 Flight-to-quality or �ight-to-liquidity in the stock
market
Previous theoretical and empirical research on the impact of credit quality, i.e.,
the likelihood of default of an asset, on market liquidity almost exclusively fo-
cuses on the bond or CDS market (see, e.g., Longsta� et al. (2005), Ericsson and
Renault (2006) and Chen et al. (2007a)), which indicates that there is an inverse
relationship between liquidity costs and credit quality. In the context of crisis,
there further has been a stream of literature that focuses on the liquidity spread
widening between high- and low-credit-quality assets as a reaction to increased
market uncertainty, i.e., a tendency of assets with a high credit quality to become
more liquid compared with low-credit-quality assets during times of �nancial mar-
ket distress. This phenomenon is argued to be the result of the investor's tendency
to shift their portfolios toward less risky and more liquid assets in times of crisis.
This is known as the �ight-to-quality or �ight-to-liquidity phenomenon, see, e.g.,
Vayanos (2004), Longsta� (2004), Acharya and Pedersen (2005) and Beber et al.
(2009).
To the best of our knowledge, however no research relating the e�ect of the
likelihood of default, as measured by the company's rating, on market liquidity
126
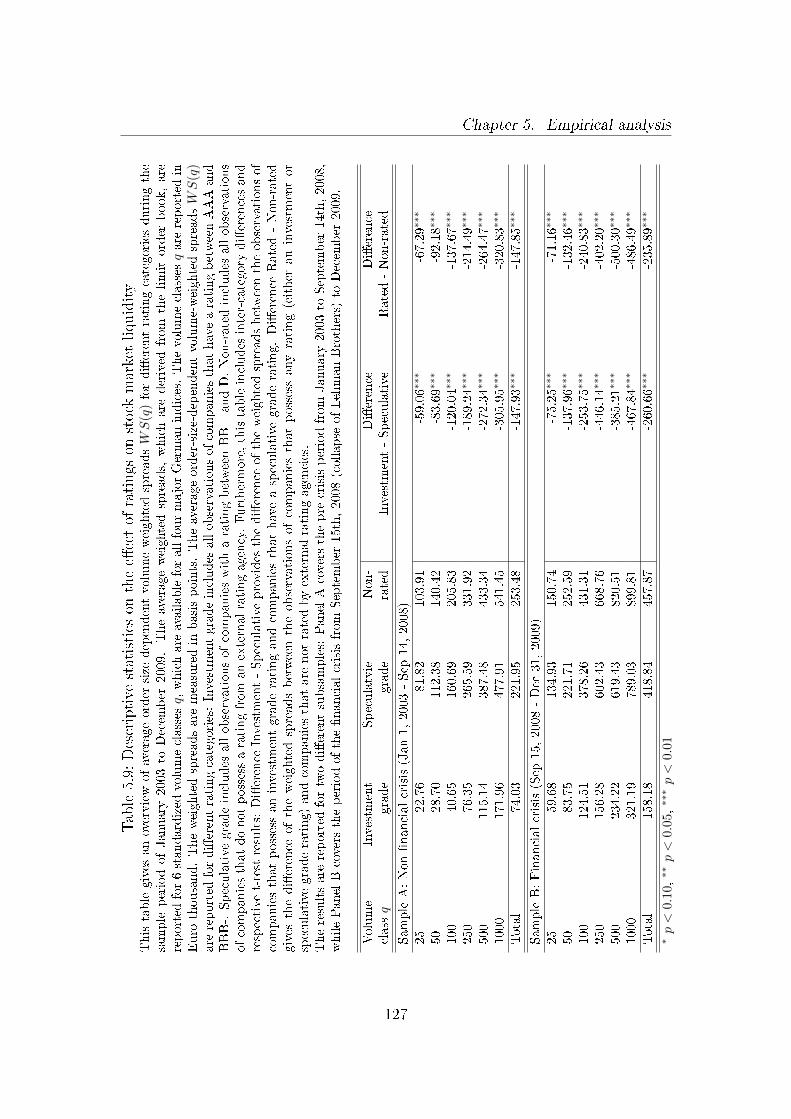
Chapter 5. Empirical analysisTable5.9:
Descriptive
statistics
onthee�ectof
ratings
onstock
marketliquidity
Thistablegives
anoverviewofaverageorder-size-dependentvolume-weightedspreadsWS
(q)fordi�erentratingcategories
duringthe
sample
periodofJanuary
2003to
Decem
ber
2009.Theaverageweightedspreads,
whichare
derived
from
thelimitorder
book,are
reported
for6standardized
volumeclassesq,whichare
availableforallfourmajorGermanindices.Thevolumeclassesqare
reported
inEuro
thousand.Theweightedspreadsare
measuredin
basispoints.Theaverageorder-size-dependentvolume-weightedspreadsWS
(q)
are
reported
fordi�erentratingcategories:Investm
entgradeincludes
allobservationsofcompaniesthathavearatingbetweenAAAand
BBB-.Speculative
gradeincludes
allobservationsofcompanieswitharatingbetweenBB+
andD.Non-ratedincludes
allobservations
ofcompaniesthatdonotpossessaratingfrom
anexternalratingagency.Furthermore,thistableincludes
inter-category
di�erencesand
respective
t-test
results:
Di�erence
Investment-Speculative
provides
thedi�erence
oftheweightedspreadsbetweentheobservationsof
companiesthatpossessaninvestm
entgraderatingandcompaniesthathaveaspeculativegraderating.Di�erence
Rated-Non-rated
gives
thedi�erence
oftheweightedspreadsbetweentheobservationsofcompaniesthatpossessanyrating(either
aninvestmentor
speculative
graderating)andcompaniesthatare
notratedbyexternal
ratingagencies.
Theresultsare
reported
fortwodi�erentsubsamples:
PanelAcovers
thepre-crisisperiodfrom
January
2003to
September
14th,2008,
whilePanelBcovers
theperiodofthe�nancialcrisisfrom
September
15th,2008(collapse
ofLehmanBrothers)
toDecem
ber
2009.
Volume
Investment
Speculatvie
Non-
Di�erence
Di�erence
classq
grade
grade
rated
Investm
ent-Speculative
Rated-Non-rated
SampleA:Non�nancialcrisis(Jan1,2003-Sep
14,2008)
25
22.76
81.82
103.91
-59.06∗∗
∗-67.29∗∗
∗
50
28.70
112.38
140.42
-83.69∗∗
∗-92.18∗∗
∗
100
40.65
160.69
205.83
-120.04∗∗
∗-137.67∗∗
∗
250
76.35
265.59
331.92
-189.24∗∗
∗-214.49∗∗
∗
500
115.14
387.48
433.34
-272.34∗∗
∗-264.47∗∗
∗
1000
171.96
477.91
541.45
-305.95∗∗
∗-320.83∗∗
∗
Total
74.03
221.95
253.48
-147.93∗∗
∗-147.85∗∗
∗
SampleB:Financialcrisis(Sep
15,2008-Dec
31,2009)
25
59.68
134.93
150.74
-75.25∗∗
∗-71.16∗∗
∗
50
83.75
221.71
252.59
-137.96∗∗
∗-132.46∗∗
∗
100
124.51
378.26
431.31
-253.75∗∗
∗-240.83∗∗
∗
250
156.28
602.43
668.76
-446.14∗∗
∗-402.20∗∗
∗
500
234.22
619.43
820.51
-385.21∗∗
∗-500.30∗∗
∗
1000
321.19
789.03
899.81
-467.84∗∗
∗-486.49∗∗
∗
Total
158.18
418.84
457.87
-260.66∗∗
∗-235.89∗∗
∗
∗p<
0.1
0,∗∗p<
0.0
5,∗∗
∗p<
0.01
127
Chapter 5. Empirical analysis
has focused on the stock market. This part of our research will therefore look into
this area of market liquidity.
5.1.3.1 Descriptive statistics uncovering the �ight-to-quality
To analyze the �ight-to-quality e�ect, we will �rst explore several univariate statis-
tics. This process is followed by a panel-data regression analysis that examines
the e�ect of di�erent company ratings on liquidity costs in great detail, while con-
trolling for variables that have proven to at least partially explain liquidity costs
(e.g., share price, return volatility, trading activity and �rm size).
First, we want to obtain an impression of how liquidity costs di�er across rating
categories and what in�uence the �nancial crisis has on these di�erences. Table 5.9
shows average volume-weighted spreads WS(q)124 for three di�erent rating cate-
gories (investment grade, speculative grade and non-rated) and for two di�erent
periods (pre-crisis vs. crisis). We can observe that there is a clear liquidity ranking
across rating categories during both pre-crisis and crisis period. Liquidity costs
for investment grade stocks are the lowest, followed by speculative grade stocks
and companies that do not possess external ratings. This liquidity ranking can be
best seen in the di�erences between the rating categories on the right side of the
table. The di�erence between rated (both investment and speculative grades) and
non-rated companies is 148 bps during the pre-crisis period and 254 bps during
the crisis. This di�erence between rated and non-rated companies gives support
for the adverse selection component of liquidity costs, which was theoretically in-
troduced by Copeland and Galai (1983) and Glosten and Milgrom (1985). Rating
agencies are a means of private information production and therefore alleviate
124 For a better comparison and to avoid an index bias in the volume-weighted spreads, weonly focus on the 6 standardized volume classes q, which are available for all four majorindices. These are the volume classes of EUR 25, 50, 100, 250, 500 thousand and 1 million.
128
Chapter 5. Empirical analysis
the adverse selection component of liquidity costs by decreasing the information
asymmetry problem.125 The reduced information asymmetry therefore explains
the comparatively lower liquidity costs of rated stocks.
The pre-crisis di�erence of 148 bps and the crisis di�erence of 261 bps for the
spread between investment and speculative grade ratings clearly show that stocks
associated with a higher credit quality of the company possess lower liquidity costs.
These results are in line with our hypothesis that there is a positive relationship
between credit risk/default probability and liquidity risk and the �ndings in the
bond and CDS market (see, e.g., Ericsson and Renault (2006) and Chen et al.
(2007a)). All of those di�erences across rating categories hold across all volume
classes for both sub-periods and are signi�cant at a 1 percent signi�cance level.
However, in the context of the impact of credit risk on market liquidity, the
analysis of the �ight-to-quality or �ight-to-liquidity phenomenon appears to be
most interesting, as this phenomenon has been widely discussed in market liquidity
research, see, e.g., Vayanos (2004), Longsta� (2004), and Acharya and Pedersen
(2005). In brief, the �ight-to-quality phenomenon in market liquidity states that in
times of increased market uncertainty, e.g., during the �nancial crisis, the impact
of credit risk on liquidity risk is expected to intensify, mostly due to an increase
in the investor's risk aversion and preference for liquidity. Therefore, we should
see an increase in liquidity cost deltas between investment and speculative grade
ratings. Indeed, if we look at Table 5.9, we clearly see an increase in the liquidity
spread between stocks with a high and low probability of default, as the pre-
crisis di�erence of 148 bps between investment- and speculative-grade rated stocks
increases to 261 bps during the crisis. These �ndings give support to the �ight-
125 For an overview on the impact of rating agencies on information asymmetry see Healy andPalepu (2001).
129
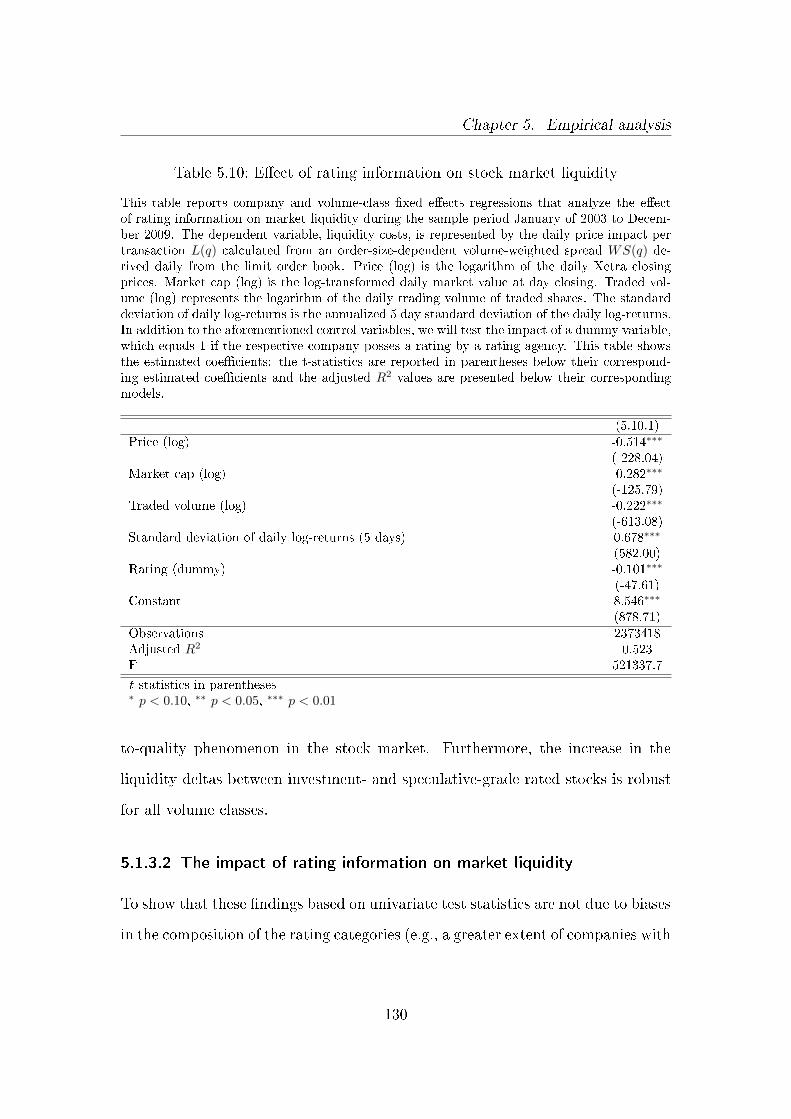
Chapter 5. Empirical analysis
Table 5.10: E�ect of rating information on stock market liquidity
This table reports company and volume-class �xed e�ects regressions that analyze the e�ectof rating information on market liquidity during the sample period January of 2003 to Decem-ber 2009. The dependent variable, liquidity costs, is represented by the daily price impact pertransaction L(q) calculated from an order-size-dependent volume-weighted spread WS(q) de-rived daily from the limit order book. Price (log) is the logarithm of the daily Xetra closingprices. Market cap (log) is the log-transformed daily market value at day closing. Traded vol-ume (log) represents the logarithm of the daily trading volume of traded shares. The standarddeviation of daily log-returns is the annualized 5 day standard deviation of the daily log-returns.In addition to the aforementioned control variables, we will test the impact of a dummy variable,which equals 1 if the respective company posses a rating by a rating agency. This table showsthe estimated coe�cients: the t-statistics are reported in parentheses below their correspond-ing estimated coe�cients and the adjusted R2 values are presented below their correspondingmodels.
(5.10.1)Price (log) -0.514∗∗∗
(-228.04)Market cap (log) -0.282∗∗∗
(-125.79)Traded volume (log) -0.222∗∗∗
(-613.08)Standard deviation of daily log-returns (5 days) 0.678∗∗∗
(582.00)Rating (dummy) -0.101∗∗∗
(-47.61)Constant 8.546∗∗∗
(878.71)Observations 2373418Adjusted R2 0.523F 521337.7
t statistics in parentheses∗ p < 0.10, ∗∗ p < 0.05, ∗∗∗ p < 0.01
to-quality phenomenon in the stock market. Furthermore, the increase in the
liquidity deltas between investment- and speculative-grade rated stocks is robust
for all volume classes.
5.1.3.2 The impact of rating information on market liquidity
To show that these �ndings based on univariate test statistics are not due to biases
in the composition of the rating categories (e.g., a greater extent of companies with
130
Chapter 5. Empirical analysis
large market cap, see Figure 4.2, which are usually associated with lower liquidity
costs among the investment-grade companies), we proceed with a multivariate
analysis of this issue. In detail, we will extend the panel data regression speci�ca-
tion (5.1), which accounts for well-known variables, that have proven to at least
partially explain the variation in liquidity costs (e.g., share price, return volatility,
trading activity and �rm size), to analyze the impact of ratings on market liquid-
ity. We start o� with an analysis of the impact of rating information in general.
Therefore, we introduce a dummy variable that indicates if a company possesses a
rating by an external rating agency. This setting should analyze whether a rating
produced by an external rating agency conveys additional private information to
reduce the information asymmetry, leading to a reduction in the adverse selection
component of the weighted spread and �nally leading to lower liquidity costs.
The negative impact of the rating dummy in our speci�cation provides further
empirical support for the adverse selection component of liquidity costs and shows
that rating agencies, by providing company credit ratings, are able to reduce
the information asymmetry; see Table 5.10. To quantify the impact of external
ratings, we can observe that an external rating reduces the liquidity costs by
roughly 10%. The result is also signi�cant at the 1% signi�cance level.
5.1.3.3 The �ight-to-quality - the impact of credit quality/default
probability on market liquidity during the �nancial crisis
We now want to turn our focus to the multivariate analysis of the �ight-to-quality
or �ight-to-liquidity phenomenon. We particularly seek to answer two fundamen-
tal questions in this analysis: Is there a liquidity cost spread between companies
with a high and companies with a low credit quality, and does this spread intensify
in times of increased market uncertainty, supporting the �ight-to-quality theory?
131
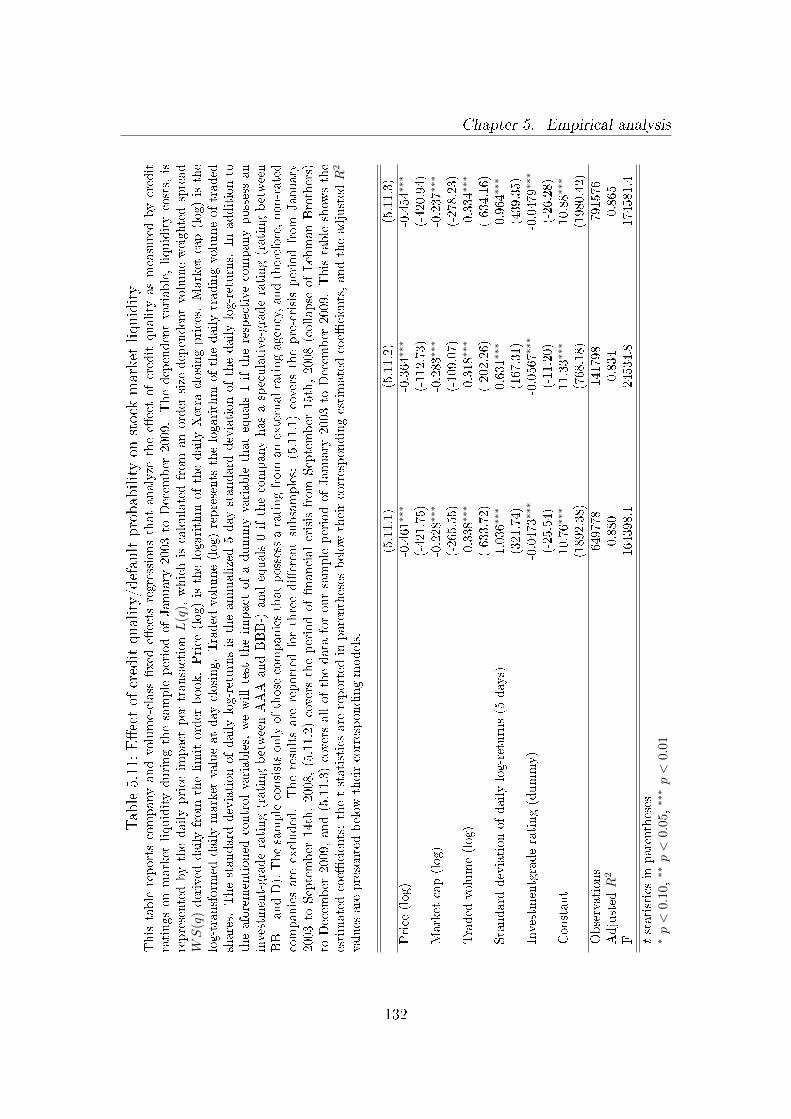
Chapter 5. Empirical analysisTable5.11:E�ectof
creditquality/defaultprobabilityon
stock
marketliquidity
Thistable
reportscompanyandvolume-class
�xed
e�ects
regressionsthatanalyze
thee�ectofcreditquality
asmeasuredbycredit
ratingsonmarket
liquidityduringthesample
periodofJanuary
2003to
Decem
ber
2009.Thedependentvariable,liquiditycosts,
isrepresentedbythedailyprice
impact
per
transactionL
(q),whichiscalculatedfrom
anorder-size-dependentvolume-weightedspread
WS
(q)derived
dailyfrom
thelimitorder
book.Price
(log)isthelogarithm
ofthedailyXetra
closingprices.
Market
cap(log)isthe
log-transform
eddailymarket
valueatday
closing.Traded
volume(log)represents
thelogarithm
ofthedailytradingvolumeoftraded
shares.
Thestandard
deviationofdailylog-returnsistheannualized5day
standard
deviationofthedailylog-returns.
Inadditionto
theaforementioned
controlvariables,wewilltest
theim
pact
ofadummyvariable
thatequals1iftherespective
companypossessan
investment-graderating(ratingbetweenAAA
andBBB-)andequals0ifthecompanyhasaspeculative-graderating(ratingbetween
BB+andD).Thesampleconsistsonlyofthose
companiesthatpossessaratingfrom
anexternalratingagency,andtherefore,non-rated
companiesare
excluded.Theresultsare
reported
forthreedi�erentsubsamples:
(5.11.1)covers
thepre-crisisperiodfrom
January
2003to
September
14th,2008,(5.11.2)covers
theperiodof�nancialcrisisfrom
September
15th,2008(collapse
ofLehmanBrothers)
toDecem
ber
2009,and(5.11.3)coversallofthedata
foroursampleperiodofJanuary
2003to
Decem
ber
2009.Thistableshow
sthe
estimatedcoe�
cients:thet-statisticsare
reported
inparentheses
below
theircorrespondingestimatedcoe�
cients,andtheadjusted
R2
values
are
presentedbelow
theircorrespondingmodels.
(5.11.1)
(5.11.2)
(5.11.3)
Price
(log)
-0.461∗∗
∗-0.364∗∗
∗-0.454∗∗
∗
(-421.75)
(-112.73)
(-420.94)
Market
cap(log)
-0.228∗∗
∗-0.283∗∗
∗-0.237∗∗
∗
(-265.55)
(-109.07)
(-278.23)
Traded
volume(log)
-0.338∗
∗∗-0.318∗∗
∗-0.334∗∗
∗
(-633.72)
(-202.26)
(-634.16)
Standard
deviationofdailylog-returns(5
days)
1.036∗∗
∗0.631∗∗
∗0.964∗∗
∗
(321.74)
(167.31)
(439.35)
Investmentgraderating(dummy)
-0.0473∗
∗∗-0.0567∗∗
∗-0.0479∗∗
∗
(-25.54)
(-11.20)
(-26.28)
Constant
10.76∗
∗∗11.33∗∗
∗10.88∗∗
∗
(1892.38)
(768.18)
(1980.42)
Observations
649778
141798
791576
Adjusted
R2
0.880
0.834
0.865
F164398.1
24534.8
174581.4
tstatisticsin
parentheses
∗p<
0.1
0,∗∗p<
0.0
5,∗∗
∗p<
0.01
132
Chapter 5. Empirical analysis
Therefore, we add a dummy variable to our panel data regression speci�cation
(5.1) that captures the di�erence between investment- and speculative-grade-rated
companies and which we call investment grade rating (dummy). To test our �ight-
to-quality hypothesis that during time of crisis the spread between the liquidity
costs of high- and low-credit-quality stocks widens, we separately estimate the
impact of this dummy for three di�erent subsamples: (5.11.1) covers the pre-
crisis period, (5.11.2) covers the period of the �nancial crisis, and (5.11.3) covers
our entire sample period. A comparison of the two �rst subsamples in particular
will yield insight into the �ight-to-quality phenomenon.
Table 5.11 shows that the coe�cient of our dummy variable is signi�cantly
negative across all subsamples and that, therefore, investment grade stocks have
liquidity costs that are roughly 5% less than those of speculative grade stocks.
This �nding clearly indicates that, in the stock market, liquidity costs increase
with credit risk. By comparing the coe�cient for the investment grade rating
dummy for the pre-crisis period (5.11.1) with the coe�cient during the �nancial
crisis (5.11.2), we clearly see that the impact of credit risk, as expected, intensi�es
during the �nancial crisis. This e�ect shows that the �ight-to-quality or �ight-to-
liquidity phenomenon also holds for the stock market which demonstrates that, in
times of crisis investors become increasingly risk-averse and exhibit a preference
for more liquid instruments. As we are using a volume-weighted spread measure
derived from the limit order book, our results, which are all signi�cant at the 1%
signi�cance level, prove that the �ight-to-quality phenomenon holds for the whole
depth of the limit order book in the stock market.
133
Chapter 5. Empirical analysis
5.2 Market liquidity and ownership structures126
In this section, we focus on the empirical analysis of the impact of di�erent owner-
ship structures on market liquidity. For our analyses, we use the dataset presented
in section 4.1.2. We begin with an analysis of the impact of di�erent measures of
ownership concentration on market liquidity in subsection 5.2.1. The subsequent
analyses in subsection 5.2.2 should then help us to better understand the liquidity
e�ect that di�erent types of blockholders have. To �nalize this section, we will
provide several robustness tests for our empirical �ndings in subsection 5.2.3.
As a basis for our empirical analysis on the impact of ownership concentration
and blockholder types on market liquidity, we use the log-log speci�cation (5.1)
that we introduced in section 5.1.1.2 and a company and volume class127 �xed
e�ects model128 for the estimation.129
5.2.1 Market liquidity and ownership concentration
To test our initial hypothesis that information asymmetry problems impair stock
market liquidity for companies with a concentrated ownership structure, we add
several ownership concentration measures, one after the other, to the reference
speci�cation above. In turn, we add the following measures, all of serve as proxies
for the ownership concentration: the total percentage of blockholdings, the num-
ber of blockholders, the Her�ndahl index and the percentage share of the largest
126 This section is largely based on Rösch and Kaserer (2010).127 The volume class q is an inherent characteristic of our order-size-dependent liquidity costs
measure.128 The Hausman (1978) test statistic supports the usage of a �xed e�ects model compared
with a random e�ects model.129 In addition, we also test the same models with company, volume and time �xed e�ects.
The results are consistent with those reported in Tables 5.12 to 5.14 and can be found inthe Appendix in Tables B.1 and B.2.
134
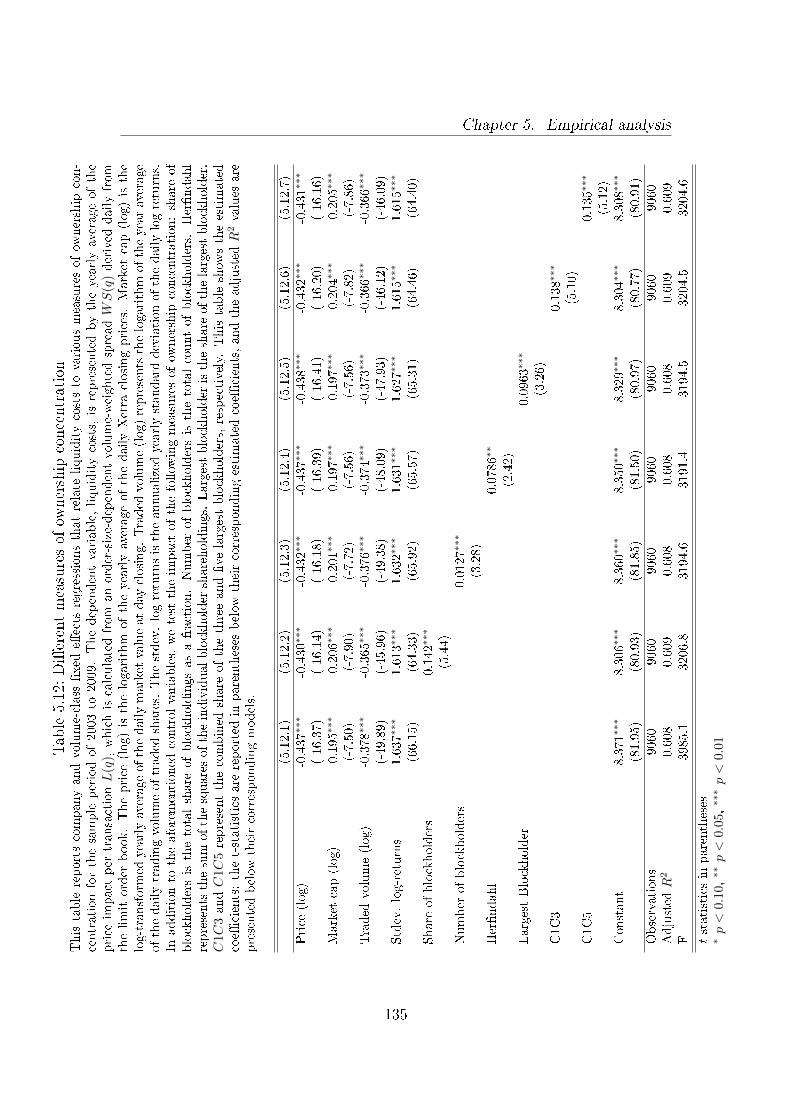
Chapter 5. Empirical analysis
Table5.12:Di�erentmeasuresof
ownership
concentration
Thistablereportscompanyandvolume-class
�xed
e�ects
regressionsthatrelate
liquiditycoststo
variousmeasuresofow
nership
con-
centrationforthesample
periodof2003to
2009.Thedependentvariable,liquiditycosts,isrepresentedbytheyearlyaverageofthe
price
impact
per
transactionL
(q),whichiscalculatedfrom
anorder-size-dependentvolume-weightedspreadWS
(q)derived
dailyfrom
thelimitorder
book.Theprice
(log)isthelogarithm
oftheyearlyaverageofthedaily
Xetra
closingprices.
Market
cap(log)isthe
log-transform
edyearlyaverage
ofthedailymarket
valueatday
closing.Traded
volume(log)representsthelogarithm
oftheyearaverage
ofthedailytradingvolumeoftraded
shares.
Thestdev.log-returnsistheannualizedyearlystandard
deviationofthedailylog-returns.
Inadditionto
theaforementioned
controlvariables,wetest
theim
pact
ofthefollow
ingmeasuresofow
nership
concentration:share
of
blockholdersisthetotalshare
ofblockholdingsasafraction.Number
ofblockholdersisthetotalcountofblockholders.
Her�ndahl
representsthesum
ofthesquaresoftheindividualblockholder
shareholdings.Largestblockholder
istheshare
ofthelargestblockholder.
C1C
3andC
1C
5representthecombined
share
ofthethreeand�ve
largestblockholders,respectively.Thistableshow
stheestimated
coe�
cients:thet-statisticsare
reported
inparentheses
below
theircorrespondingestimatedcoe�
cients,andtheadjusted
R2values
are
presentedbelow
theircorrespondingmodels.
(5.12.1)
(5.12.2)
(5.12.3)
(5.12.4)
(5.12.5)
(5.12.6)
(5.12.7)
Price
(log)
-0.437∗∗
∗-0.430∗∗
∗-0.432∗∗
∗-0.437∗∗
∗-0.438∗∗
∗-0.432∗∗
∗-0.431∗∗
∗
(-16.37)
(-16.14)
(-16.18)
(-16.39)
(-16.41)
(-16.20)
(-16.16)
Market
cap(log)
-0.195∗∗
∗-0.206∗∗
∗-0.201∗∗
∗-0.197∗∗
∗-0.197∗∗
∗-0.204∗∗
∗-0.205∗∗
∗
(-7.50)
(-7.90)
(-7.72)
(-7.56)
(-7.56)
(-7.82)
(-7.86)
Traded
volume(log)
-0.378∗∗
∗-0.365∗∗
∗-0.376∗∗
∗-0.374∗∗
∗-0.373∗∗
∗-0.366∗∗
∗-0.366∗∗
∗
(-49.89)
(-45.96)
(-49.38)
(-48.09)
(-47.93)
(-46.12)
(-46.09)
Stdev.log-returns
1.637
∗∗∗
1.613∗∗
∗1.632∗∗
∗1.631∗∗
∗1.627∗∗
∗1.615∗∗
∗1.615∗∗
∗
(66.15)
(64.33)
(65.92)
(65.57)
(65.31)
(64.46)
(64.40)
Share
ofblockholders
0.142∗∗
∗
(5.44)
Number
ofblockholders
0.0127∗∗
∗
(3.28)
Her�ndahl
0.0786∗∗
(2.42)
LargestBlockholder
0.0963∗∗
∗
(3.26)
C1C3
0.138∗∗
∗
(5.10)
C1C5
0.135∗∗
∗
(5.12)
Constant
8.371∗
∗∗8.306∗∗
∗8.360∗∗
∗8.350∗∗
∗8.329∗∗
∗8.304∗∗
∗8.308∗∗
∗
(81.95)
(80.93)
(81.85)
(81.50)
(80.97)
(80.77)
(80.91)
Observations
9060
9060
9060
9060
9060
9060
9060
Adjusted
R2
0.608
0.609
0.608
0.608
0.608
0.609
0.609
F3985.1
3206.8
3194.6
3191.4
3194.5
3204.5
3204.6
tstatisticsin
parentheses
∗p<
0.1
0,∗∗p<
0.0
5,∗∗
∗p<
0.01
135
Chapter 5. Empirical analysis
and the three and �ve largest blockholders, C1C3 and C1C5, respectively.
Table 5.12 presents the results for the �rst set of regressions. The reference
model (5.12.1) that only includes the control variables shows that the estimates
of the coe�cients of price level, market capitalization, volume and return volatility
are, as expected, consistent with the results reported in previous studies and our
results reported in subsection 5.1.1.2. Liquidity costs are, therefore, once again a
decreasing function of price level, market capitalization and trading volume. In
contrast, the return volatility, which is a proxy for the general market condition
and risk, increases liquidity costs.
Adding the proxy variables for ownership concentration consecutively to the ref-
erence speci�cation in the speci�cations (5.12.2) to (5.12.7), we see that the results
support our information asymmetry hypothesis. Models (5.12.2) to (5.12.7) show
that liquidity costs, represented by our order-size-dependent volume-weighted
spread measure, increase with ownership concentration. Therefore, stock mar-
ket liquidity is impaired by blockholder ownership, as overall blockholders possess
economies of scale in the collection of information or might have access to private,
value-relevant information. These results are signi�cant at the 1% signi�cance
level and robust for all our measures of ownership concentration, i.e., total share
of blockholdings, total number of blockholders and share of the largest and three
and �ve largest shareholders, except for the Her�ndahl index, which is only sig-
ni�cant at the 5% signi�cance level. The total share held by blockholders (see
speci�cation 5.12.2) displays the highest level of signi�cance, with a t-statistic of
5.44.
These �ndings contribute to the existing literature the fact that our liquidity
price impact measure L(q), derived from the limit order book shows a positive
linkage to ownership concentration and therefore con�rms research, see, for ex-
136
Chapter 5. Empirical analysis
ample He�in and Shaw (2000), on other direct and indirect measures of liquidity.
5.2.2 Market liquidity and blockholder types
In the previous subsection, we found evidence that ownership concentration sig-
ni�cantly matters for stock market liquidity. However, we further hypothesized
that access to private or value-relevant information or the willingness to exploit
this information is not uniformly distributed across all types of blockholders and
that, therefore, di�erent blockholder types have di�erent impacts on the stock
market liquidity.
To test this hypothesis, we scrutinize the impact of di�erent types of block-
holders on the stock market liquidity. Table 5.13 shows that separate analyses of
di�erent blockholder types yield interesting results. In model (5.13.1), we begin
with the same speci�cation as in model (5.12.2), which includes all control vari-
ables and the total share of blockholdings, which showed the highest signi�cance
among all measures of ownership concentration. In succession, we then add the
following four mutually exclusive and collectively exhaustive blockholder types:
insiders and �nancial, strategic and private investors.
We �nd that �rms with insider blockholders exhibit a signi�cantly lower market
liquidity or higher liquidity costs, even after controlling for total blockholder own-
ership (see model 5.13.2).130 This e�ect can be explained by the fact that inside
blockholders are more likely to possess private information than any other outside
blockholder131 and therefore to exacerbate the information asymmetry problem
compared with other blockholder types. Therefore, it is not surprising that intro-
130 This result is consistent with the �ndings of Ginglinger and Hamon (2007a).131 Consistent with this argument, Lakonishok and Lee (2001) �nd that managerial trades are
more informative than large shareholder trades.
137
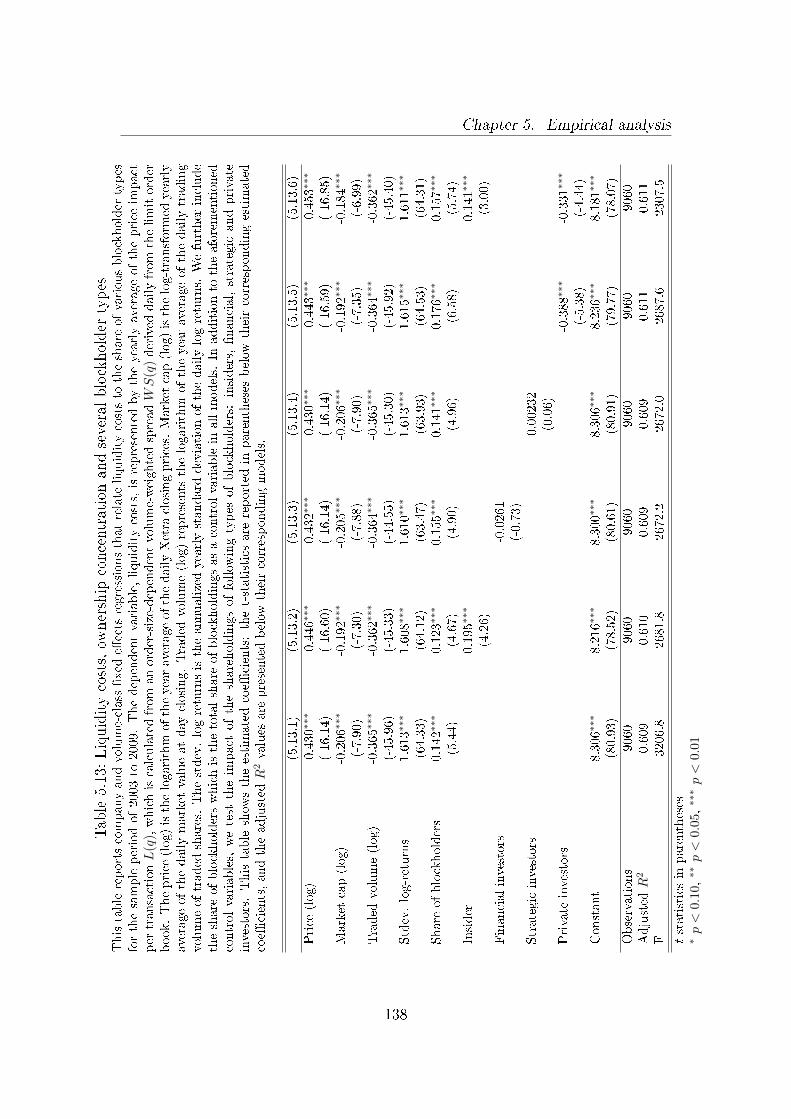
Chapter 5. Empirical analysis
Table5.13:Liquiditycosts,ow
nership
concentrationandseveralblockholder
types
Thistablereportscompanyandvolume-class�xed
e�ectsregressionsthatrelate
liquiditycoststo
theshare
ofvariousblockholder
types
forthesampleperiodof2003
to2009.Thedependentvariable,liquiditycosts,isrepresentedbytheyearlyaverageoftheprice
impact
per
transactionL
(q),whichiscalculatedfrom
anorder-size-dependentvolume-weightedspreadWS
(q)derived
dailyfrom
thelimitorder
book.Theprice
(log)isthelogarithm
oftheyearaverageofthedailyXetra
closingprices.Market
cap(log)isthelog-transform
edyearly
averageofthedailymarket
valueatday
closing.Traded
volume(log)represents
thelogarithm
oftheyearaverageofthedailytrading
volumeoftraded
shares.
Thestdev.log-returnsistheannualizedyearlystandard
deviationofthedailylog-returns.
Wefurther
include
theshare
ofblockholderswhichisthetotalshare
ofblockholdingsasacontrolvariablein
allmodels.
Inadditionto
theaforementioned
controlvariables,
wetest
theim
pact
oftheshareholdingsoffollow
ingtypes
ofblockholders:
insiders,
�nancial,strategic
andprivate
investors.Thistableshow
stheestimatedcoe�
cients:thet-statisticsare
reported
inparentheses
below
theircorrespondingestimated
coe�
cients,andtheadjusted
R2values
are
presentedbelow
theircorrespondingmodels.
(5.13.1)
(5.13.2)
(5.13.3)
(5.13.4)
(5.13.5)
(5.13.6)
Price
(log)
-0.430∗∗
∗-0.446∗∗
∗-0.432∗∗
∗-0.430∗∗
∗-0.443∗∗
∗-0.453∗∗
∗
(-16.14)
(-16.60)
(-16.14)
(-16.14)
(-16.59)
(-16.85)
Market
cap(log)
-0.206∗∗
∗-0.192∗∗
∗-0.205∗∗
∗-0.206∗∗
∗-0.192∗∗
∗-0.184∗∗
∗
(-7.90)
(-7.30)
(-7.88)
(-7.90)
(-7.35)
(-6.99)
Traded
volume(log)
-0.365
∗∗∗
-0.362∗∗
∗-0.364∗∗
∗-0.365∗∗
∗-0.364∗∗
∗-0.362∗∗
∗
(-45.96)
(-45.33)
(-44.55)
(-45.30)
(-45.92)
(-45.40)
Stdev.log-returns
1.613∗
∗∗1.608∗∗
∗1.610∗∗
∗1.613∗∗
∗1.615∗∗
∗1.611∗∗
∗
(64.33)
(64.12)
(63.47)
(63.93)
(64.53)
(64.31)
Share
ofblockholders
0.142∗∗
∗0.123∗∗
∗0.155∗∗
∗0.141∗∗
∗0.176∗∗
∗0.157∗∗
∗
(5.44)
(4.67)
(4.90)
(4.96)
(6.58)
(5.74)
Insider
0.195∗∗
∗0.141∗∗
∗
(4.26)
(3.00)
Financialinvestors
-0.0261
(-0.73)
Strategicinvestors
0.00232
(0.06)
Private
investors
-0.388∗∗
∗-0.331∗∗
∗
(-5.38)
(-4.44)
Constant
8.306∗
∗∗8.216∗∗
∗8.300∗∗
∗8.306∗∗
∗8.236∗∗
∗8.181∗∗
∗
(80.93)
(78.52)
(80.61)
(80.91)
(79.77)
(78.07)
Observations
9060
9060
9060
9060
9060
9060
Adjusted
R2
0.609
0.610
0.609
0.609
0.611
0.611
F3206.8
2681.8
2672.2
2672.0
2687.6
2307.5
tstatisticsin
parentheses
∗p<
0.1
0,∗∗p<
0.0
5,∗∗
∗p<
0.01
138
Chapter 5. Empirical analysis
ducing �nancial and strategic investors to the regression, while controlling for the
total blockholder share (see models 5.13.3 and 5.13.4), does not yield any signi�-
cant result. These variables do not seem to convey any further information that
is not already included in the total blockholder share.
However, if we add the share of private blockholders to our initial model of
control variables and total blockholder share (see model 5.13.5), we see that private
blockholders have a positive e�ect on stock market liquidity and decrease liquidity
costs.
One explanation for this result is that private blockholders might not have ac-
cess to private information (in contrast to insiders or likely strategic investors)
or cannot leverage economies of scale in the information acquisition and explo-
ration (in contrast to �nancial and strategic investors). Another highly probable
explanation might be that private investors simply face a (self-imposed) restric-
tion on engaging in information-based trading, as they are usually more long-term
oriented investors. Hence, private blockholders allay the information asymmetry
problem and decrease the liquidity costs.
If we combine both signi�cant variables, insider and private blockholders, with
the total blockholder share in one regression (see model 5.13.6), the results remain
stable: insider blockholders increase liquidity costs, whereas private blockholders
have a bene�cial impact on liquidity costs.
To further explore the impact of di�erent blockholder types on stock market
liquidity, we set up another model that includes the share of all four mutually
exclusive and collectively exhaustive blockholder types (insiders and �nancial,
strategic and private investors), together with the control variables, omitting the
total share of blockholders that we included in the previous regressions. Table
5.14 shows the results of this model. Not surprisingly, insiders have the largest
139

Chapter 5. Empirical analysis
Table 5.14: Liquidity costs and several blockholder types
This table reports company and volume-class �xed e�ects regressions that relate liquidity coststo the share of various blockholder types for the sample period of 2003 to 2009. The dependentvariable, liquidity costs, is represented by the yearly average of the price impact per transactionL(q), which is calculated from an order-size-dependent volume-weighted spread WS(q) deriveddaily from the limit order book.The price (log) is the logarithm of the yearly average of the dailyXetra closing prices. Market cap (log) is the log-transformed yearly average of the daily marketvalue at day closing. Traded volume (log) represents the logarithm of the yearly average of thedaily trading volume of traded shares. The stdev. log-returns is the annualized yearly standarddeviation of the daily log-returns. In addition to the aforementioned control variables, we testthe impact of the shareholdings of the following types of blockholders: insiders and �nancial,strategic and private investors. This table shows the estimated coe�cients: the t-statistics arereported in parentheses next to their corresponding estimated coe�cients, and the adjusted R2
values are presented below their corresponding models.
(5.14.1)Insider 0.299∗∗∗ (6.11)Financial investors 0.154∗∗∗ (4.86)Strategic investors 0.162∗∗∗ (4.51)Private investors -0.172∗∗ (-2.40)Price (log) -0.453∗∗∗ (-16.83)Market cap (log) -0.184∗∗∗ (-6.99)Traded volume (log) -0.361∗∗∗ (-44.30)Stdev. log-returns (annualized) 1.610∗∗∗ (63.63)Constant 8.181∗∗∗ (78.03)Observations 9060Adjusted R2 0.611F 2018.8
t statistics in parentheses∗ p < 0.10, ∗∗ p < 0.05, ∗∗∗ p < 0.01
impact on liquidity costs, but this time �nancial and strategic investors have a
signi�cant impact on stock market liquidity. These three blockholder types im-
pair stock market liquidity and therefore increase the liquidity costs, as presented
by our volume-weighted spread measure. These results are consistent with the
hypothesis that certain blockholder types possess economies of scale in the collec-
tion of information or have access to private, value-relevant information and may
trade on this information to extract the private bene�ts of control. Thus, mar-
ket makers and other market participants face an adverse selection problem from
these informed traders and therefore increase the spreads, which leads to poorer
140
Chapter 5. Empirical analysis
market liquidity. In contrast, private blockholders reduce the liquidity costs, as
they are not able to extract value-relevant information or willing to trade on this
information, due to their often more long-term oriented investment style.
As in the case of private blockholders, we would have expected that strategic
investors are also not willing to trade on private information and therefore reduce
liquidity costs, as strategic investors typically assume a long-term perspective on
their investment if they acquire the control of another company. However, this
intuition might only hold for �real� strategic investors who possess a majority stake
(≥ 50%) in the acquired company, are therefore in control of this company and
are usually closely interconnected. To test this hypothesis, we take a closer look
at the impact of di�erent strategic blockholder sizes and therefore split the total
strategic blockholder share into two parts: one representing the share of majority
blockholders, i.e., the share of individual blockholders holding more than or equal
to 50%, and the other representing the share of minority blockholders, i.e., the
share of individual blockholders holding less than 50%. Table 5.15 shows the
results of a model that adds these two variables to our initial model of control
variables and total blockholder share. This model supports our hypothesis that
only �real� strategic blockholders with a majority share are not willing to trade on
their private information and therefore reduce the liquidity costs compared with
other blockholders, whereas those strategic blockholders with a minority share are
willing to trade on the information, which they acquire through economies of scale
in the collection of information or access to private, value-relevant information,
and therefore increase liquidity costs.
Overall, our results prove that the often-claimed tradeo� between the liquid-
ity bene�ts obtained through dispersed corporate ownership and the bene�ts from
e�cient management control achieved by a certain degree of ownership concentra-
141
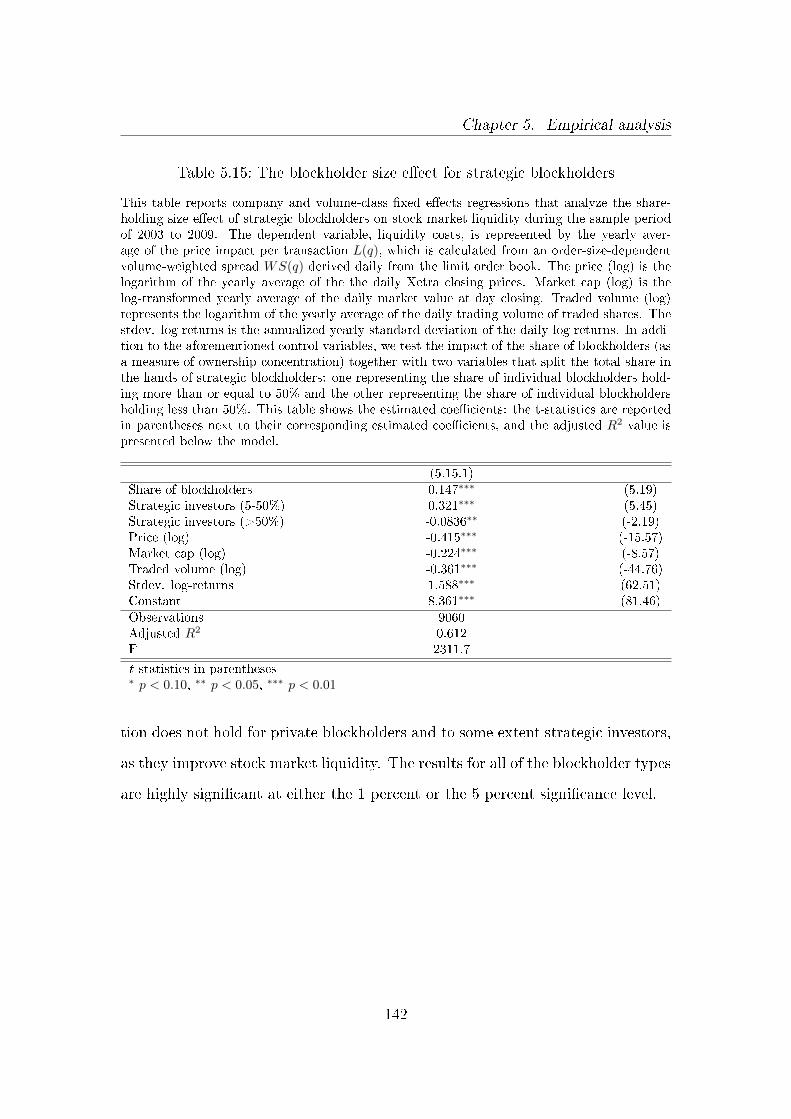
Chapter 5. Empirical analysis
Table 5.15: The blockholder size e�ect for strategic blockholders
This table reports company and volume-class �xed e�ects regressions that analyze the share-holding size e�ect of strategic blockholders on stock market liquidity during the sample periodof 2003 to 2009. The dependent variable, liquidity costs, is represented by the yearly aver-age of the price impact per transaction L(q), which is calculated from an order-size-dependentvolume-weighted spread WS(q) derived daily from the limit order book. The price (log) is thelogarithm of the yearly average of the the daily Xetra closing prices. Market cap (log) is thelog-transformed yearly average of the daily market value at day closing. Traded volume (log)represents the logarithm of the yearly average of the daily trading volume of traded shares. Thestdev. log-returns is the annualized yearly standard deviation of the daily log-returns. In addi-tion to the aforementioned control variables, we test the impact of the share of blockholders (asa measure of ownership concentration) together with two variables that split the total share inthe hands of strategic blockholders: one representing the share of individual blockholders hold-ing more than or equal to 50% and the other representing the share of individual blockholdersholding less than 50%. This table shows the estimated coe�cients: the t-statistics are reportedin parentheses next to their corresponding estimated coe�cients, and the adjusted R2 value ispresented below the model.
(5.15.1)Share of blockholders 0.147∗∗∗ (5.19)Strategic investors (5-50%) 0.321∗∗∗ (5.45)Strategic investors (>50%) -0.0836∗∗ (-2.19)Price (log) -0.415∗∗∗ (-15.57)Market cap (log) -0.224∗∗∗ (-8.57)Traded volume (log) -0.361∗∗∗ (-44.76)Stdev. log-returns 1.588∗∗∗ (62.51)Constant 8.361∗∗∗ (81.46)Observations 9060Adjusted R2 0.612F 2311.7
t statistics in parentheses∗ p < 0.10, ∗∗ p < 0.05, ∗∗∗ p < 0.01
tion does not hold for private blockholders and to some extent strategic investors,
as they improve stock market liquidity. The results for all of the blockholder types
are highly signi�cant at either the 1 percent or the 5 percent signi�cance level.
142
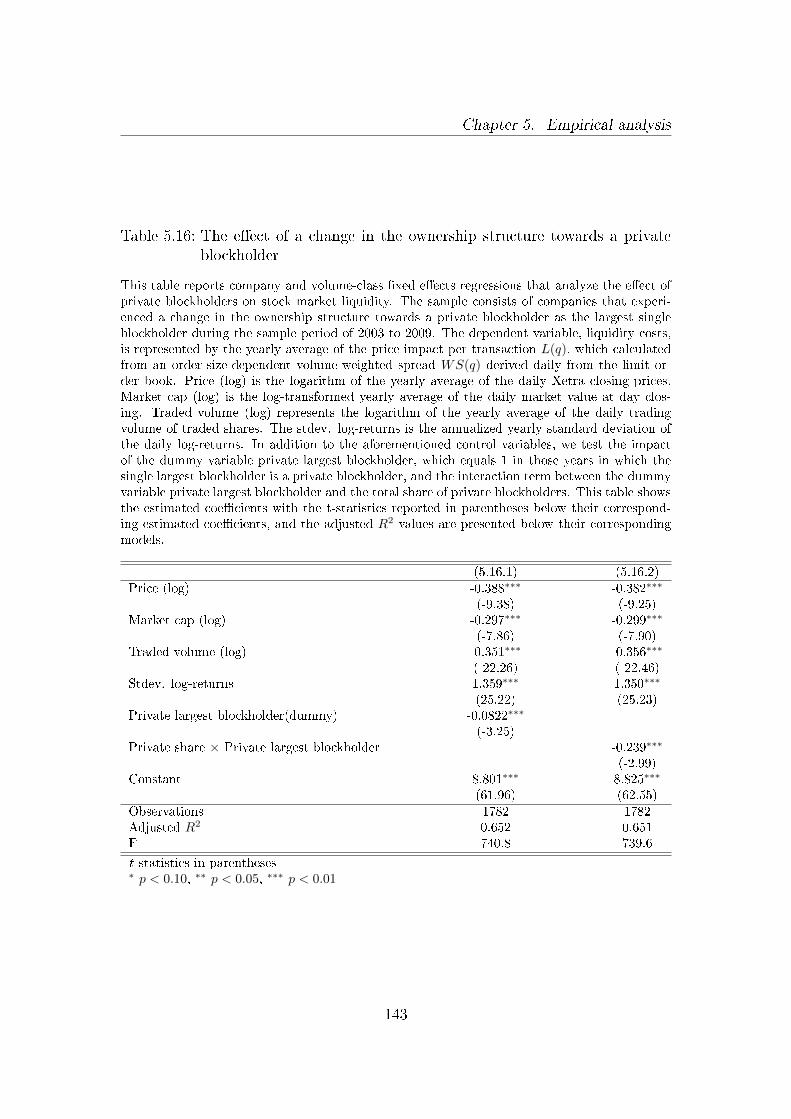
Chapter 5. Empirical analysis
Table 5.16: The e�ect of a change in the ownership structure towards a privateblockholder
This table reports company and volume-class �xed e�ects regressions that analyze the e�ect ofprivate blockholders on stock market liquidity. The sample consists of companies that experi-enced a change in the ownership structure towards a private blockholder as the largest singleblockholder during the sample period of 2003 to 2009. The dependent variable, liquidity costs,is represented by the yearly average of the price impact per transaction L(q), which calculatedfrom an order-size-dependent volume-weighted spread WS(q) derived daily from the limit or-der book. Price (log) is the logarithm of the yearly average of the daily Xetra closing prices.Market cap (log) is the log-transformed yearly average of the daily market value at day clos-ing. Traded volume (log) represents the logarithm of the yearly average of the daily tradingvolume of traded shares. The stdev. log-returns is the annualized yearly standard deviation ofthe daily log-returns. In addition to the aforementioned control variables, we test the impactof the dummy variable private largest blockholder, which equals 1 in those years in which thesingle largest blockholder is a private blockholder, and the interaction term between the dummyvariable private largest blockholder and the total share of private blockholders. This table showsthe estimated coe�cients with the t-statistics reported in parentheses below their correspond-ing estimated coe�cients, and the adjusted R2 values are presented below their correspondingmodels.
(5.16.1) (5.16.2)Price (log) -0.388∗∗∗ -0.382∗∗∗
(-9.38) (-9.25)Market cap (log) -0.297∗∗∗ -0.299∗∗∗
(-7.86) (-7.90)Traded volume (log) -0.351∗∗∗ -0.356∗∗∗
(-22.26) (-22.46)Stdev. log-returns 1.359∗∗∗ 1.350∗∗∗
(25.22) (25.23)Private largest blockholder(dummy) -0.0822∗∗∗
(-3.25)Private share × Private largest blockholder -0.239∗∗∗
(-2.99)Constant 8.801∗∗∗ 8.825∗∗∗
(61.96) (62.55)Observations 1782 1782Adjusted R2 0.652 0.651F 740.8 739.6
t statistics in parentheses∗ p < 0.10, ∗∗ p < 0.05, ∗∗∗ p < 0.01
143
Chapter 5. Empirical analysis
5.2.3 Robustness tests
5.2.3.1 Endogeneity
To test the robustness of our results for the impact of ownership concentration and
di�erent blockholder types, we �rst analyze the endogeneity that might potentially
prevail in the ownership structure determination, especially private blockholder
ownership, and market liquidity. We want to ensure that it is unlikely that the
negative relationship between the share of private blockholders and stock market
liquidity is due to an alternative explanation, i.e., private investors tend to invest
in companies with more liquid stocks. Therefore, we use a subsample of our
dataset that consists only of companies that experienced a change in the ownership
structure towards a private blockholder as the largest single blockholder during our
sample period of 2003 to 2009, to analyze whether there are signi�cant di�erences
in the stock market liquidity after the private blockholder becomes the largest
single blockholder.
Together with our reference speci�cation (equation 5.1), we test the impact of
a dummy variable `private largest blockholder' (see model 5.16.1), which equals
1 in those years in which the single largest blockholder is a private blockholder.
This variable captures the e�ect on the stock market liquidity of the change in
the ownership structure towards a private blockholder as the largest blockholder.
We further test an interaction term between the above dummy variable `private
largest blockholder' and the total share of private blockholders of the respective
company (see model 5.16.2). The results of both models can be found in Table
5.16.
If the negative relationship that we found in our analyses thus far is only due
to di�erences in the stock selection between private investors and other investors,
144
Chapter 5. Empirical analysis
then we should not �nd any signi�cant results for the two variables as the stock
market liquidity should not be a�ected by the change in the ownership structure.
However, as our results indicate a signi�cant negative relation for both variables,
we are con�dent that endogeneity is not a problem in our analyses and private
investors, therefore, do not speci�cally seek out stocks with relatively small liq-
uidity costs. Instead, these results support our previous �ndings that private
blockholders reduce the liquidity costs.
5.2.3.2 Disclosure thresholds
If our hypothesis holds that the positive e�ect of private investors and majority
strategic blockholders on stock market liquidity can be explained by the fact that
they face a (self-imposed) restriction on engaging in information-based trading
because they are typically more long-term oriented investors, then other block-
holders should also decrease liquidity costs if they are in situations where they are
not willing to trade on private information.
One of these situations could be if the blockholder is holding a position that is
close to an o�cial disclosure threshold, at which a shareholder must publicly dis-
close an additional purchase or sale of shares, if the total shareholding owned by
this particular shareholder reaches, exceeds or falls below this disclosure thresh-
old132. This disclosure requirement might therefore also lead to an unwillingness
to engage in information-based trading. Therefore, we analyze the e�ects of dif-
ferent types of blockholder ownership around important disclosure thresholds on
stock market liquidity. Table 5.17 shows the impact on market liquidity of the
132 According to �21 WpHG, a shareholder must publicly disclose an additional purchase orsale of shares of a company listed in Germany, if the total shareholding owned by thisparticular shareholder reaches, exceeds or falls below the o�cial disclosure thresholds of3%, 5%, 10%, 15%, 20%, 25%, 30%, 50% and 75%.
145
Chapter 5. Empirical analysis
shareholdings of our four types of blockholders - insiders, �nancial, strategic and
private investors - when they are in the range of ± 1.5% of the following major
disclosure thresholds: 25%, 50% and 75%.
Not surprisingly, private investors at major disclosure thresholds decrease liq-
uidity costs.133 However, strategic blockholders and insiders at major disclosure
thresholds also have a positive e�ect on the market liquidity. Insiders, strate-
gic and private investors appear to be unwilling to trade on private information
because doing so would result in a public disclosure requirement. These results
support our hypothesis that a (self-imposed) restriction of blockholders on engag-
ing in information-based trading lowers liquidity costs.
Only �nancial blockholders do not appear to care about the disclosure require-
ment and do appear to be willing on engaging information-based trading at major
disclosure thresholds. This �nding is not very surprising, as their business model
is based on, amongst others, the trading of stocks; therefore, a disclosure threshold
should not hinder them from exploiting private information. Therefore, �nancial
blockholders also lead to increased liquidity costs at disclosure thresholds.
5.2.3.3 Further robustness tests
We further conduct a series of robustness tests134 and therefore re-estimate the
regressions in Table 5.12, Table 5.13 and Table 5.14 for di�erent subsamples.
First, we create two subsamples using the volume classes q of our order-size-
dependent volume-weighted liquidity cost measure L(q) as a split criterion. The
133 Because less than 13% of the private investor ownership observations in our sample are atdisclosure thresholds, our results presented in the subsection 5.2.3.2 cannot be used as anexplanation for our results in subsection 5.2.2.
134 For the remaining robustness tests, we focus on the volume classes smaller than Euro 1million, as the volume classes larger than Euro 1 million are only represented in the DAXindex.
146
Chapter 5. Empirical analysis
�rst subsample contains all of the volume classes q smaller than or equal to Euro
100,000, whereas the second subsample consists of the �ve volume classes q that
are larger than Euro 100,000. Our results for ownership concentration and block-
holder types remain robust for both the large and the small volume-class subsam-
ples. Only the in�uence of the private blockholders in the regression together with
the three other blockholder types is insigni�cant for the small volume classes (see
model 5.21.5). Detailed results can be found in Tables 5.18 to Tables 5.21.
Second, we re-estimate the same regressions considering subsamples by index
a�liation. The �rst subsample contains the two indices with the larger companies,
namely the DAX and MDAX, whereas the second subsample consists of all of the
companies listed in the SDAX or the TecDAX, which are, by de�nition, smaller
companies. For our DAX and MDAX subsample, all our model speci�cations
remain highly signi�cant. For the smaller companies in the second subsample,
most of the regressions using ownership concentration proxies are also signi�cant,
indicating that a concentrated ownership structure impairs stock market liquidity.
Only the regression including the Her�ndahl index and the largest blockholder
are insigni�cant, although even these still have the right sign. If we consider
the impact of di�erent blockholders, only the impact of three out of the four
blockholder types (namely, insiders, �nancial and strategic investors) is signi�cant.
Tables 5.22 to Tables 5.25 report more detailed results.
Third, we re-estimate the same regressions for daily liquidity data and daily
values for the control variables. This time, our results are also robust and highly
signi�cant for all our speci�cations.
Thus, overall, we can conclude that our �ndings for ownership concentration and
blockholder types discussed in sections 5.2.1 and 5.2.2 are robust. However, the
liquidity bene�t from private blockholders appear to be more pronounced for larger
147

Chapter 5. Empirical analysis
companies and when trading larger volumes. Therefore, it is not surprising that,
by now, this e�ect was undiscovered, as only our order-size-dependent liquidity
measure is able to scrutinize the liquidity cost e�ects for the whole limit order
book.
148
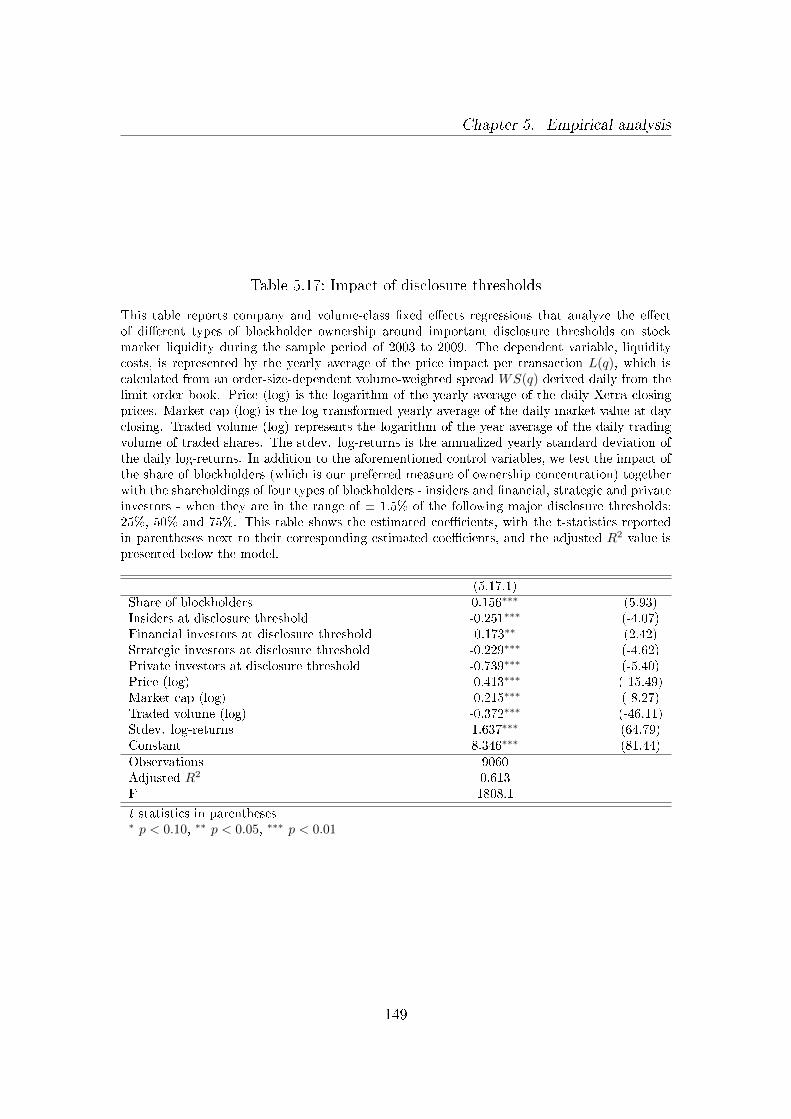
Chapter 5. Empirical analysis
Table 5.17: Impact of disclosure thresholds
This table reports company and volume-class �xed e�ects regressions that analyze the e�ectof di�erent types of blockholder ownership around important disclosure thresholds on stockmarket liquidity during the sample period of 2003 to 2009. The dependent variable, liquiditycosts, is represented by the yearly average of the price impact per transaction L(q), which iscalculated from an order-size-dependent volume-weighted spread WS(q) derived daily from thelimit order book. Price (log) is the logarithm of the yearly average of the daily Xetra closingprices. Market cap (log) is the log-transformed yearly average of the daily market value at dayclosing. Traded volume (log) represents the logarithm of the year average of the daily tradingvolume of traded shares. The stdev. log-returns is the annualized yearly standard deviation ofthe daily log-returns. In addition to the aforementioned control variables, we test the impact ofthe share of blockholders (which is our preferred measure of ownership concentration) togetherwith the shareholdings of four types of blockholders - insiders and �nancial, strategic and privateinvestors - when they are in the range of ± 1.5% of the following major disclosure thresholds:25%, 50% and 75%. This table shows the estimated coe�cients, with the t-statistics reportedin parentheses next to their corresponding estimated coe�cients, and the adjusted R2 value ispresented below the model.
(5.17.1)Share of blockholders 0.156∗∗∗ (5.93)Insiders at disclosure threshold -0.251∗∗∗ (-4.07)Financial investors at disclosure threshold 0.173∗∗ (2.42)Strategic investors at disclosure threshold -0.229∗∗∗ (-4.62)Private investors at disclosure threshold -0.739∗∗∗ (-5.40)Price (log) -0.413∗∗∗ (-15.49)Market cap (log) -0.215∗∗∗ (-8.27)Traded volume (log) -0.372∗∗∗ (-46.11)Stdev. log-returns 1.637∗∗∗ (64.79)Constant 8.346∗∗∗ (81.44)Observations 9060Adjusted R2 0.613F 1808.1
t statistics in parentheses∗ p < 0.10, ∗∗ p < 0.05, ∗∗∗ p < 0.01
149
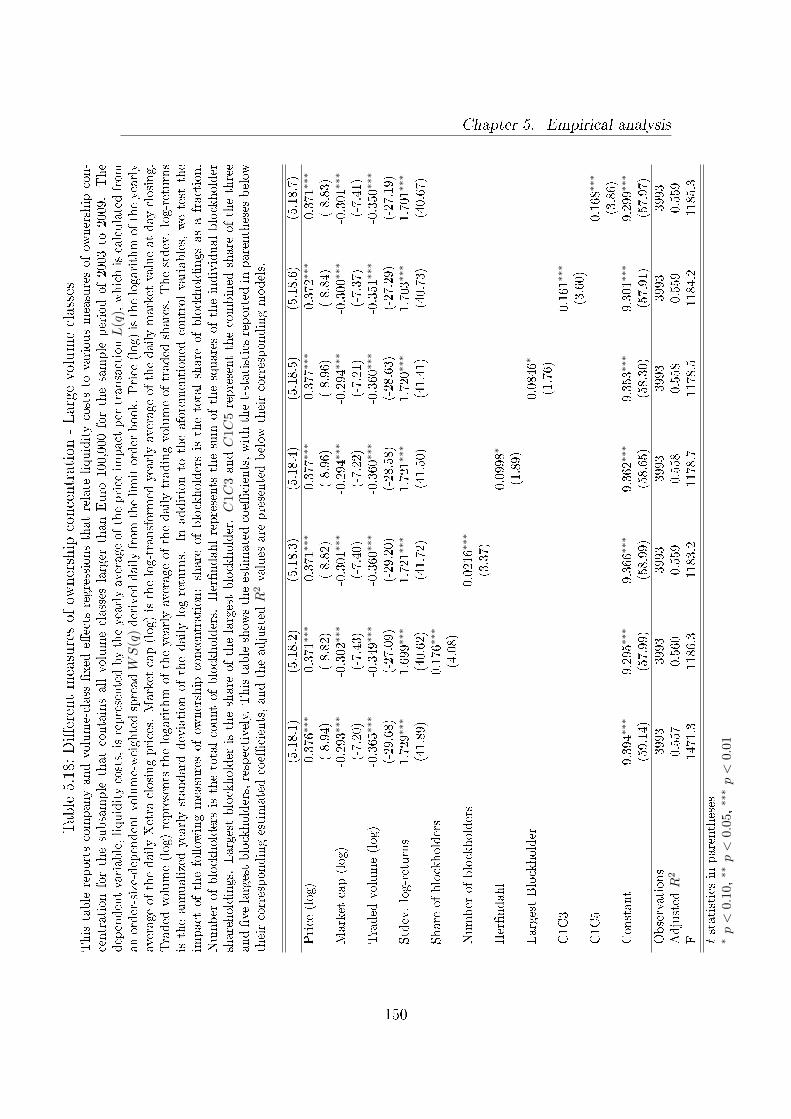
Chapter 5. Empirical analysis
Table5.18:Di�erentmeasuresof
ownership
concentration-Large
volumeclasses
Thistablereportscompanyandvolume-class
�xed
e�ects
regressionsthatrelate
liquiditycoststo
variousmeasuresofow
nership
con-
centrationforthesubsample
thatcontainsallvolumeclasses
larger
thanEuro
100,000forthesample
periodof2003to
2009.The
dependentvariable,liquiditycosts,isrepresentedbytheyearlyaverageoftheprice
impact
per
transactionL
(q),whichiscalculatedfrom
anorder-size-dependentvolume-weightedspreadWS
(q)derived
dailyfrom
thelimitorder
book.Price
(log)isthelogarithm
oftheyearly
averageofthedailyXetra
closingprices.
Market
cap(log)isthelog-transform
edyearlyaverageofthedailymarket
valueatday
closing.
Traded
volume(log)represents
thelogarithm
oftheyearlyaverageofthedailytradingvolumeoftraded
shares.
Thestdev.log-returns
istheannualizedyearlystandard
deviationofthedailylog-returns.
Inadditionto
theaforementioned
controlvariables,
wetest
the
impact
ofthefollow
ingmeasuresofow
nership
concentration:share
ofblockholdersisthetotalshare
ofblockholdingsasafraction.
Number
ofblockholdersisthetotalcountofblockholders.
Her�ndahlrepresents
thesum
ofthesquaresoftheindividualblockholder
shareholdings.
Largestblockholder
istheshare
ofthelargestblockholder.C
1C
3andC
1C5representthecombined
share
ofthethree
and�ve
largestblockholders,respectively.
Thistableshow
stheestimatedcoe�
cients,withthet-statisticsreported
inparentheses
below
theircorrespondingestimatedcoe�
cients,andtheadjusted
R2values
are
presentedbelow
theircorrespondingmodels.
(5.18.1)
(5.18.2)
(5.18.3)
(5.18.4)
(5.18.5)
(5.18.6)
(5.18.7)
Price
(log)
-0.376∗
∗∗-0.371∗∗
∗-0.371∗∗
∗-0.377∗∗
∗-0.377∗∗
∗-0.372∗∗
∗-0.371∗∗
∗
(-8.94)
(-8.82)
(-8.82)
(-8.96)
(-8.96)
(-8.84)
(-8.83)
Market
cap(log)
-0.293∗
∗∗-0.302∗∗
∗-0.301∗∗
∗-0.294∗∗
∗-0.294∗∗
∗-0.300∗∗
∗-0.301∗∗
∗
(-7.20)
(-7.43)
(-7.40)
(-7.22)
(-7.21)
(-7.37)
(-7.41)
Traded
volume(log)
-0.365∗∗
∗-0.349∗∗
∗-0.360∗∗
∗-0.360∗∗
∗-0.360∗∗
∗-0.351∗∗
∗-0.350∗∗
∗
(-29.68)
(-27.09)
(-29.20)
(-28.58)
(-28.63)
(-27.29)
(-27.19)
Stdev.log-returns
1.729∗∗
∗1.699∗∗
∗1.721∗∗
∗1.721∗∗
∗1.720∗∗
∗1.703∗∗
∗1.701∗∗
∗
(41.89)
(40.62)
(41.72)
(41.50)
(41.41)
(40.73)
(40.67)
Share
ofblockholders
0.176∗
∗∗
(4.08)
Number
ofblockholders
0.0216∗
∗∗
(3.37)
Her�ndahl
0.0998∗
(1.89)
LargestBlockholder
0.0846∗
(1.76)
C1C3
0.161∗∗
∗
(3.60)
C1C5
0.168∗∗
∗
(3.86)
Constant
9.394∗∗
∗9.295∗∗
∗9.366∗∗
∗9.362∗∗
∗9.353∗∗
∗9.301∗∗
∗9.299∗∗
∗
(59.14)
(57.99)
(58.99)
(58.65)
(58.30)
(57.91)
(57.97)
Observations
3993
3993
3993
3993
3993
3993
3993
Adjusted
R2
0.557
0.560
0.559
0.558
0.558
0.559
0.559
F1471.3
1186.3
1183.2
1178.7
1178.5
1184.2
1185.3
tstatisticsin
parentheses
∗p<
0.1
0,∗∗p<
0.0
5,∗∗
∗p<
0.01
150
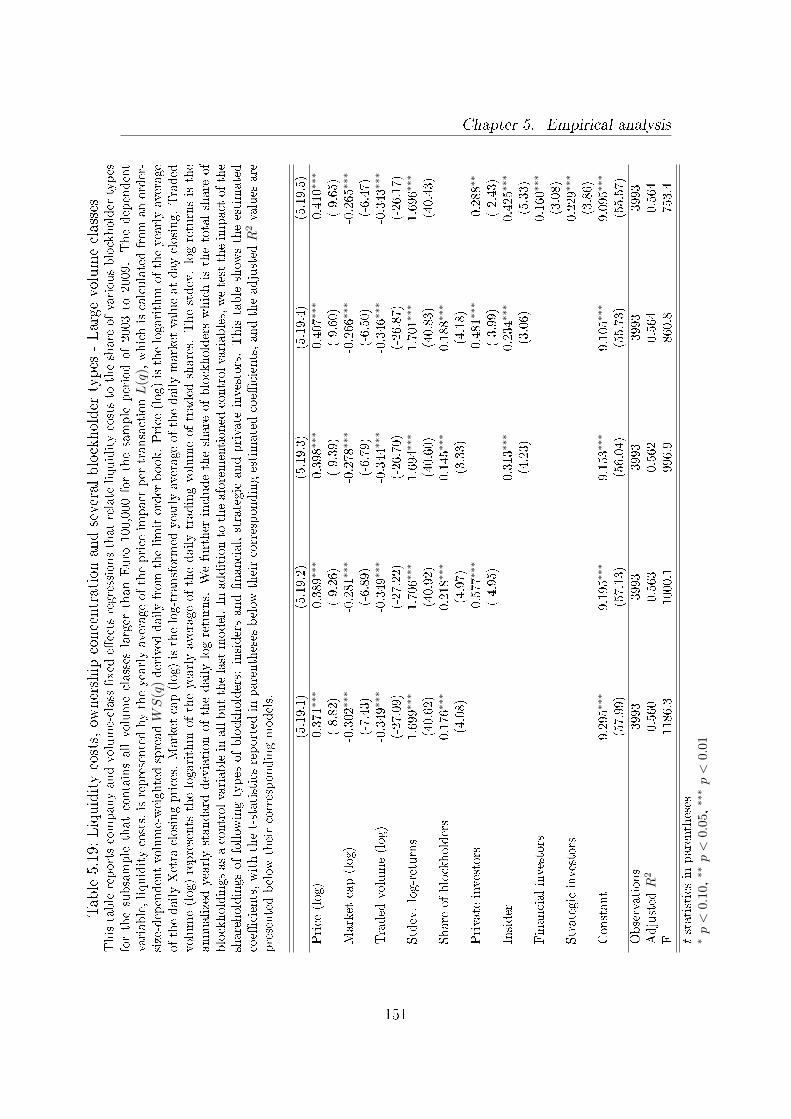
Chapter 5. Empirical analysis
Table5.19:Liquiditycosts,ow
nership
concentrationandseveralblockholder
types
-Large
volumeclasses
Thistablereportscompanyandvolume-class�xed
e�ectsregressionsthatrelate
liquiditycoststo
theshare
ofvariousblockholder
types
forthesubsample
thatcontainsallvolumeclasses
larger
thanEuro
100,000forthesample
periodof2003to
2009.Thedependent
variable,liquiditycosts,isrepresentedbytheyearlyaverageoftheprice
impact
per
transactionL
(q),whichiscalculatedfrom
anorder-
size-dependentvolume-weightedspreadWS
(q)derived
dailyfrom
thelimitorder
book.Price
(log)isthelogarithm
oftheyearlyaverage
ofthedailyXetra
closingprices.
Market
cap(log)isthelog-transform
edyearlyaverageofthedailymarket
valueatday
closing.Traded
volume(log)represents
thelogarithm
oftheyearlyaverageofthedailytradingvolumeoftraded
shares.
Thestdev.log-returnsisthe
annualizedyearlystandard
deviationofthedailylog-returns.
Wefurther
includetheshare
ofblockholderswhichisthetotalshare
of
blockholdingsasacontrolvariablein
allbutthelastmodel.In
additionto
theaforementioned
controlvariables,wetesttheim
pact
ofthe
shareholdingsoffollow
ingtypes
ofblockholders:
insidersand�nancial,strategicandprivate
investors.Thistableshow
stheestimated
coe�
cients,withthet-statisticsreported
inparentheses
below
theircorrespondingestimatedcoe�
cients,andtheadjusted
R2values
are
presentedbelow
theircorrespondingmodels.
(5.19.1)
(5.19.2)
(5.19.3)
(5.19.4)
(5.19.5)
Price
(log)
-0.371∗
∗∗-0.389∗∗
∗-0.398∗∗
∗-0.407∗∗
∗-0.410∗∗
∗
(-8.82)
(-9.26)
(-9.39)
(-9.60)
(-9.65)
Market
cap(log)
-0.302∗∗
∗-0.281∗∗
∗-0.278∗∗
∗-0.266∗∗
∗-0.265∗∗
∗
(-7.43)
(-6.89)
(-6.79)
(-6.50)
(-6.47)
Traded
volume(log)
-0.349∗∗
∗-0.349∗∗
∗-0.344∗∗
∗-0.346∗∗
∗-0.343∗∗
∗
(-27.09)
(-27.22)
(-26.70)
(-26.87)
(-26.17)
Stdev.log-returns
1.699∗∗
∗1.706∗∗
∗1.694∗∗
∗1.701∗∗
∗1.696∗∗
∗
(40.62)
(40.92)
(40.60)
(40.83)
(40.43)
Share
ofblockholders
0.176∗∗
∗0.218∗∗
∗0.145∗∗
∗0.188∗∗
∗
(4.08)
(4.97)
(3.33)
(4.18)
Private
investors
-0.577∗∗
∗-0.481∗∗
∗-0.288∗∗
(-4.95)
(-3.99)
(-2.43)
Insider
0.313∗∗
∗0.234∗∗
∗0.425∗∗
∗
(4.23)
(3.06)
(5.33)
Financialinvestors
0.160∗∗
∗
(3.08)
Strategicinvestors
0.229∗∗
∗
(3.86)
Constant
9.295∗∗
∗9.195∗∗
∗9.153∗∗
∗9.105∗∗
∗9.095∗∗
∗
(57.99)
(57.13)
(56.04)
(55.73)
(55.57)
Observations
3993
3993
3993
3993
3993
Adjusted
R2
0.560
0.563
0.562
0.564
0.564
F1186.3
1000.1
996.9
860.8
753.4
tstatisticsin
parentheses
∗p<
0.1
0,∗∗p<
0.0
5,∗∗
∗p<
0.01
151
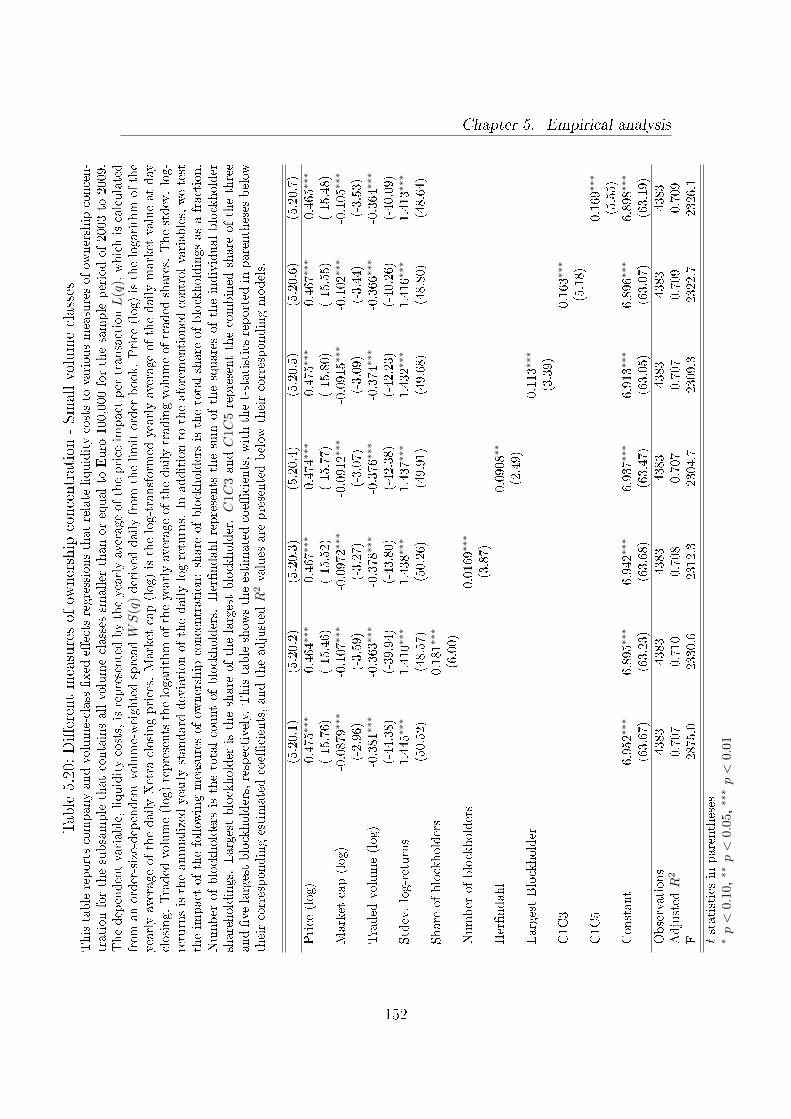
Chapter 5. Empirical analysis
Table5.20:Di�erentmeasuresof
ownership
concentration-Smallvolumeclasses
Thistablereportscompanyandvolume-class�xed
e�ectsregressionsthatrelate
liquiditycoststo
variousmeasuresofow
nership
concen-
trationforthesubsamplethatcontainsallvolumeclasses
smaller
thanorequalto
Euro
100,000forthesampleperiodof2003to
2009.
Thedependentvariable,liquiditycosts,isrepresentedbytheyearlyaverageoftheprice
impact
per
transactionL
(q),whichiscalculated
from
anorder-size-dependentvolume-weightedspreadWS
(q)derived
dailyfrom
thelimitorder
book.Price
(log)isthelogarithm
ofthe
yearlyaverageofthedailyXetra
closingprices.
Market
cap(log)isthelog-transform
edyearlyaverageofthedailymarket
valueatday
closing.Traded
volume(log)representsthelogarithm
oftheyearlyaverageofthedailytradingvolumeoftraded
shares.
Thestdev.log-
returnsistheannualizedyearlystandard
deviationofthedailylog-returns.
Inadditionto
theaforementioned
controlvariables,wetest
theim
pact
ofthefollow
ingmeasuresofow
nership
concentration:share
ofblockholdersisthetotalshare
ofblockholdingsasafraction.
Number
ofblockholdersisthetotalcountofblockholders.
Her�ndahlrepresents
thesum
ofthesquaresoftheindividualblockholder
shareholdings.
Largestblockholder
istheshare
ofthelargestblockholder.C
1C
3andC
1C5representthecombined
share
ofthethree
and�ve
largestblockholders,respectively.
Thistableshow
stheestimatedcoe�
cients,withthet-statisticsreported
inparentheses
below
theircorrespondingestimatedcoe�
cients,andtheadjusted
R2values
are
presentedbelow
theircorrespondingmodels.
(5.20.1)
(5.20.2)
(5.20.3)
(5.20.4)
(5.20.5)
(5.20.6)
(5.20.7)
Price
(log)
-0.475∗
∗∗-0.464∗∗
∗-0.467∗∗
∗-0.474∗∗
∗-0.475∗∗
∗-0.467∗∗
∗-0.465∗∗
∗
(-15.76)
(-15.46)
(-15.52)
(-15.77)
(-15.80)
(-15.55)
(-15.48)
Market
cap(log)
-0.0879∗∗
∗-0.107∗∗
∗-0.0972∗∗
∗-0.0912∗∗
∗-0.0915∗∗
∗-0.102∗∗
∗-0.105∗∗
∗
(-2.96)
(-3.59)
(-3.27)
(-3.07)
(-3.09)
(-3.44)
(-3.53)
Traded
volume(log)
-0.381∗∗
∗-0.363∗∗
∗-0.378∗∗
∗-0.376∗∗
∗-0.374∗∗
∗-0.366∗∗
∗-0.364∗∗
∗
(-44.38)
(-39.94)
(-43.80)
(-42.38)
(-42.23)
(-40.26)
(-40.09)
Stdev.log-returns
1.445∗∗
∗1.410∗∗
∗1.438∗∗
∗1.437∗∗
∗1.432∗∗
∗1.416∗∗
∗1.413∗∗
∗
(50.52)
(48.57)
(50.26)
(49.91)
(49.68)
(48.80)
(48.64)
Share
ofblockholders
0.181∗∗
∗
(6.00)
Number
ofblockholders
0.0169∗
∗∗
(3.87)
Her�ndahl
0.0908∗∗
(2.49)
LargestBlockholder
0.113∗∗
∗
(3.39)
C1C3
0.163∗∗
∗
(5.18)
C1C5
0.169∗∗
∗
(5.55)
Constant
6.952∗∗
∗6.895∗∗
∗6.942∗∗
∗6.937∗∗
∗6.913∗∗
∗6.896∗∗
∗6.898∗∗
∗
(63.67)
(63.23)
(63.68)
(63.47)
(63.05)
(63.07)
(63.19)
Observations
4383
4383
4383
4383
4383
4383
4383
Adjusted
R2
0.707
0.710
0.708
0.707
0.707
0.709
0.709
F2875.0
2330.6
2312.3
2304.7
2309.3
2322.7
2326.1
tstatisticsin
parentheses
∗p<
0.1
0,∗∗p<
0.0
5,∗∗
∗p<
0.01
152
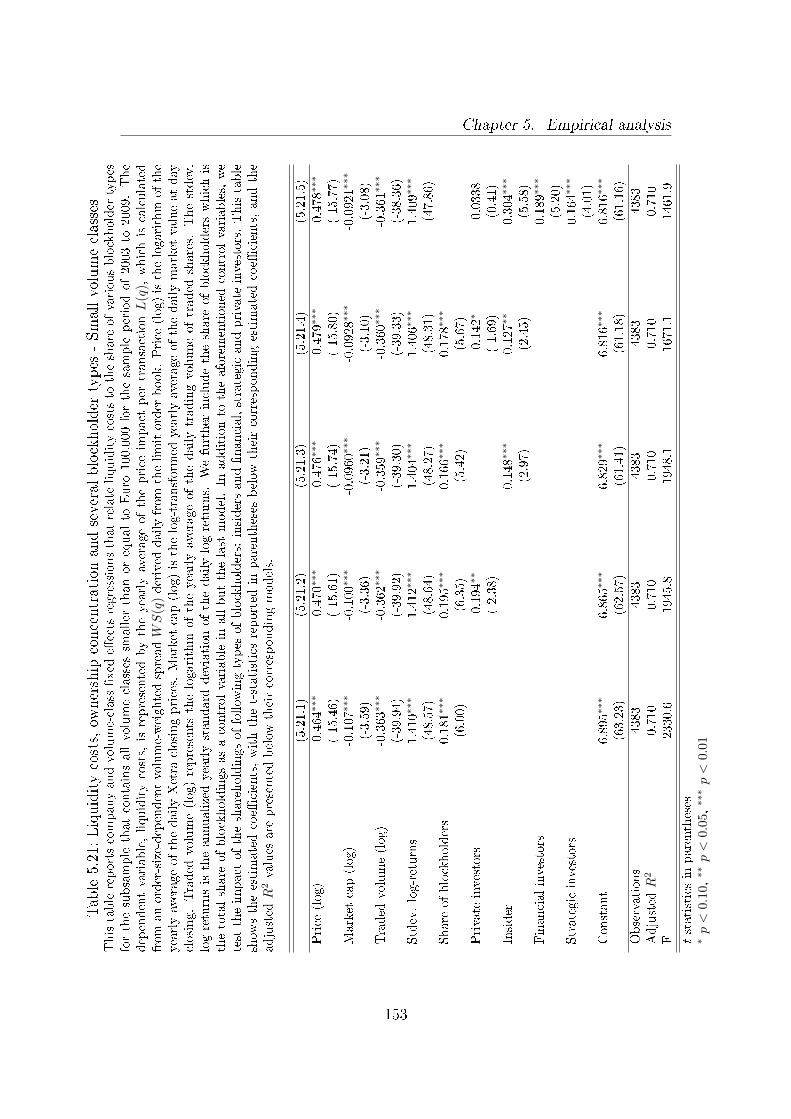
Chapter 5. Empirical analysis
Table5.21:Liquiditycosts,ow
nership
concentrationandseveralblockholder
types
-Smallvolumeclasses
Thistablereportscompanyandvolume-class�xed
e�ectsregressionsthatrelate
liquiditycoststo
theshare
ofvariousblockholder
types
forthesubsample
thatcontainsallvolumeclasses
smaller
thanorequalto
Euro
100,000forthesample
periodof2003to
2009.The
dependentvariable,liquiditycosts,isrepresentedbytheyearlyaverageoftheprice
impact
per
transactionL
(q),whichiscalculated
from
anorder-size-dependentvolume-weightedspreadWS
(q)derived
dailyfrom
thelimitorder
book.Price
(log)isthelogarithm
ofthe
yearlyaverageofthedailyXetra
closingprices.
Market
cap(log)isthelog-transform
edyearlyaverageofthedailymarket
valueatday
closing.Traded
volume(log)represents
thelogarithm
oftheyearlyaverageofthedailytradingvolumeoftraded
shares.
Thestdev.
log-returnsistheannualizedyearlystandard
deviationofthedailylog-returns.
Wefurther
includetheshare
ofblockholderswhichis
thetotalshare
ofblockholdingsasacontrolvariablein
allbutthelast
model.In
additionto
theaforementioned
controlvariables,we
test
theim
pact
oftheshareholdingsoffollow
ingtypes
ofblockholders:
insidersand�nancial,strategicandprivate
investors.Thistable
show
stheestimatedcoe�
cients,withthet-statisticsreported
inparentheses
below
theircorrespondingestimatedcoe�
cients,andthe
adjusted
R2values
are
presentedbelow
theircorrespondingmodels.
(5.21.1)
(5.21.2)
(5.21.3)
(5.21.4)
(5.21.5)
Price
(log)
-0.464∗∗
∗-0.470∗∗
∗-0.476∗∗
∗-0.479∗∗
∗-0.478∗∗
∗
(-15.46)
(-15.61)
(-15.74)
(-15.80)
(-15.77)
Market
cap(log)
-0.107∗∗
∗-0.100∗∗
∗-0.0960∗∗
∗-0.0928∗∗
∗-0.0921∗∗
∗
(-3.59)
(-3.36)
(-3.21)
(-3.10)
(-3.08)
Traded
volume(log)
-0.363∗∗
∗-0.362∗∗
∗-0.359∗∗
∗-0.360∗∗
∗-0.361∗∗
∗
(-39.94)
(-39.92)
(-39.30)
(-39.33)
(-38.36)
Stdev.log-returns
1.410
∗∗∗
1.412∗∗
∗1.404∗∗
∗1.406∗∗
∗1.409∗∗
∗
(48.57)
(48.64)
(48.27)
(48.31)
(47.86)
Share
ofblockholders
0.181∗∗
∗0.195∗∗
∗0.166∗∗
∗0.178∗∗
∗
(6.00)
(6.35)
(5.42)
(5.67)
Private
investors
-0.194∗∗
-0.142∗
0.0338
(-2.38)
(-1.69)
(0.41)
Insider
0.148∗∗
∗0.127∗∗
0.304∗∗
∗
(2.97)
(2.45)
(5.58)
Financialinvestors
0.189∗∗
∗
(5.20)
Strategicinvestors
0.164∗∗
∗
(4.01)
Constant
6.895∗
∗∗6.865∗∗
∗6.829∗∗
∗6.816∗∗
∗6.816∗∗
∗
(63.23)
(62.57)
(61.41)
(61.18)
(61.16)
Observations
4383
4383
4383
4383
4383
Adjusted
R2
0.710
0.710
0.710
0.710
0.710
F2330.6
1945.8
1948.1
1671.1
1461.9
tstatisticsin
parentheses
∗p<
0.1
0,∗∗p<
0.0
5,∗∗
∗p<
0.01
153
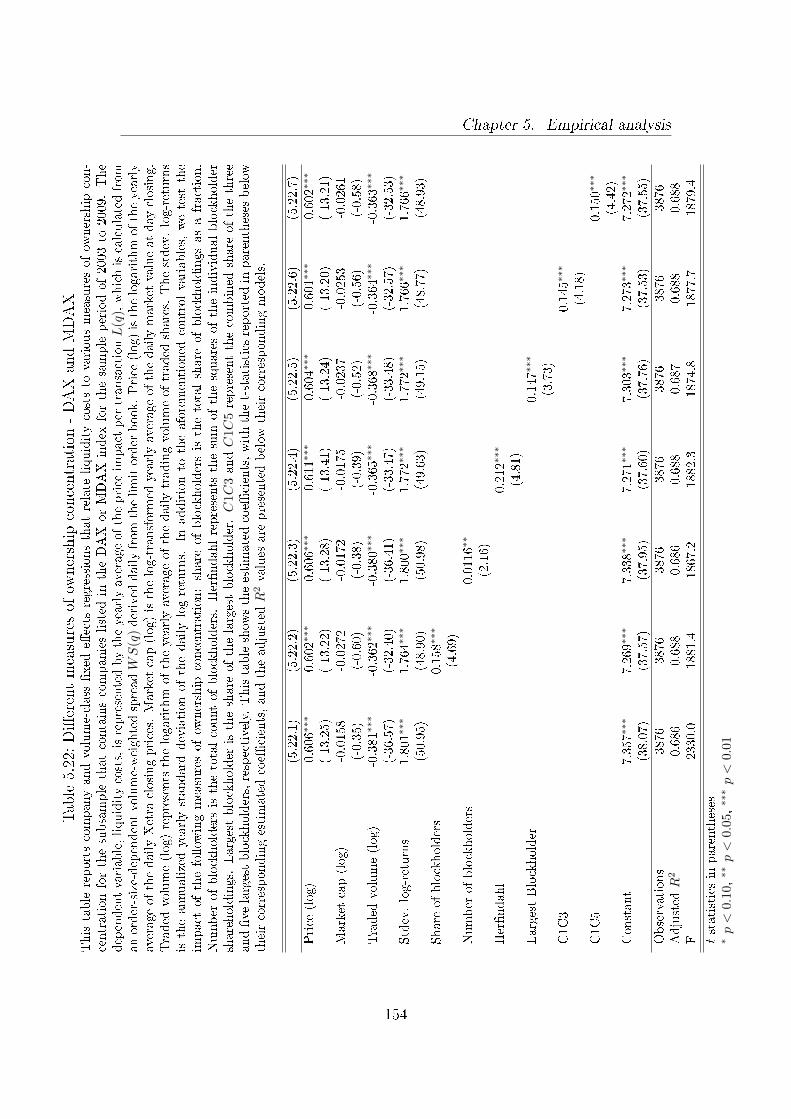
Chapter 5. Empirical analysis
Table5.22:Di�erentmeasuresof
ownership
concentration-DAXandMDAX
Thistablereportscompanyandvolume-class
�xed
e�ects
regressionsthatrelate
liquiditycoststo
variousmeasuresofow
nership
con-
centrationforthesubsample
thatcontainscompanieslisted
intheDAX
orMDAX
index
forthesample
periodof2003to
2009.The
dependentvariable,liquiditycosts,isrepresentedbytheyearlyaverageoftheprice
impact
per
transactionL
(q),whichiscalculatedfrom
anorder-size-dependentvolume-weightedspreadWS
(q)derived
dailyfrom
thelimitorder
book.Price
(log)isthelogarithm
oftheyearly
averageof
thedailyXetra
closingprices.
Market
cap(log)isthelog-transform
edyearlyaverageofthedailymarket
valueatday
closing.
Traded
volume(log)represents
thelogarithm
oftheyearlyaverageofthedailytradingvolumeoftraded
shares.
Thestdev.log-returns
istheannualizedyearlystandard
deviationofthedailylog-returns.
Inadditionto
theaforementioned
controlvariables,
wetest
the
impact
ofthefollow
ingmeasuresofow
nership
concentration:share
ofblockholdersisthetotalshare
ofblockholdingsasafraction.
Number
ofblockholdersisthetotalcountofblockholders.
Her�ndahlrepresents
thesum
ofthesquaresoftheindividualblockholder
shareholdings.
Largestblockholder
istheshare
ofthelargestblockholder.C
1C
3andC
1C5representthecombined
share
ofthethree
and�ve
largestblockholders,respectively.
Thistableshow
stheestimatedcoe�
cients,withthet-statisticsreported
inparentheses
below
theircorrespondingestimatedcoe�
cients,andtheadjusted
R2values
are
presentedbelow
theircorrespondingmodels.
(5.22.1)
(5.22.2)
(5.22.3)
(5.22.4)
(5.22.5)
(5.22.6)
(5.22.7)
Price
(log)
-0.606∗∗
∗-0.602∗∗
∗-0.606∗∗
∗-0.611∗∗
∗-0.604∗∗
∗-0.601∗∗
∗-0.602∗∗
∗
(-13.25)
(-13.22)
(-13.28)
(-13.41)
(-13.24)
(-13.20)
(-13.21)
Market
cap(log)
-0.0158
-0.0272
-0.0172
-0.0175
-0.0237
-0.0253
-0.0261
(-0.35)
(-0.60)
(-0.38)
(-0.39)
(-0.52)
(-0.56)
(-0.58)
Traded
volume(log)
-0.381∗∗
∗-0.362∗∗
∗-0.380∗∗
∗-0.365∗∗
∗-0.368∗∗
∗-0.364∗∗
∗-0.363∗∗
∗
(-36.57)
(-32.40)
(-36.41)
(-33.47)
(-33.48)
(-32.57)
(-32.53)
Stdev.log-returns
1.801∗∗
∗1.764∗∗
∗1.800∗∗
∗1.772∗∗
∗1.772∗∗
∗1.766∗∗
∗1.766∗∗
∗
(50.95)
(48.90)
(50.98)
(49.63)
(49.15)
(48.77)
(48.93)
Share
ofblockholders
0.158∗∗
∗
(4.69)
Number
ofblockholders
0.0116∗
∗
(2.16)
Her�ndahl
0.212∗∗
∗
(4.81)
LargestBlockholder
0.147∗∗
∗
(3.73)
C1C3
0.145∗∗
∗
(4.18)
C1C5
0.150∗∗
∗
(4.42)
Constant
7.357∗∗
∗7.269∗∗
∗7.338∗∗
∗7.271∗∗
∗7.303∗∗
∗7.273∗∗
∗7.272∗∗
∗
(38.07)
(37.57)
(37.95)
(37.60)
(37.76)
(37.53)
(37.55)
Observations
3876
3876
3876
3876
3876
3876
3876
Adjusted
R2
0.686
0.688
0.686
0.688
0.687
0.688
0.688
F2330.0
1881.4
1867.2
1882.3
1874.8
1877.7
1879.4
tstatisticsin
parentheses
∗p<
0.1
0,∗∗p<
0.0
5,∗∗
∗p<
0.01
154
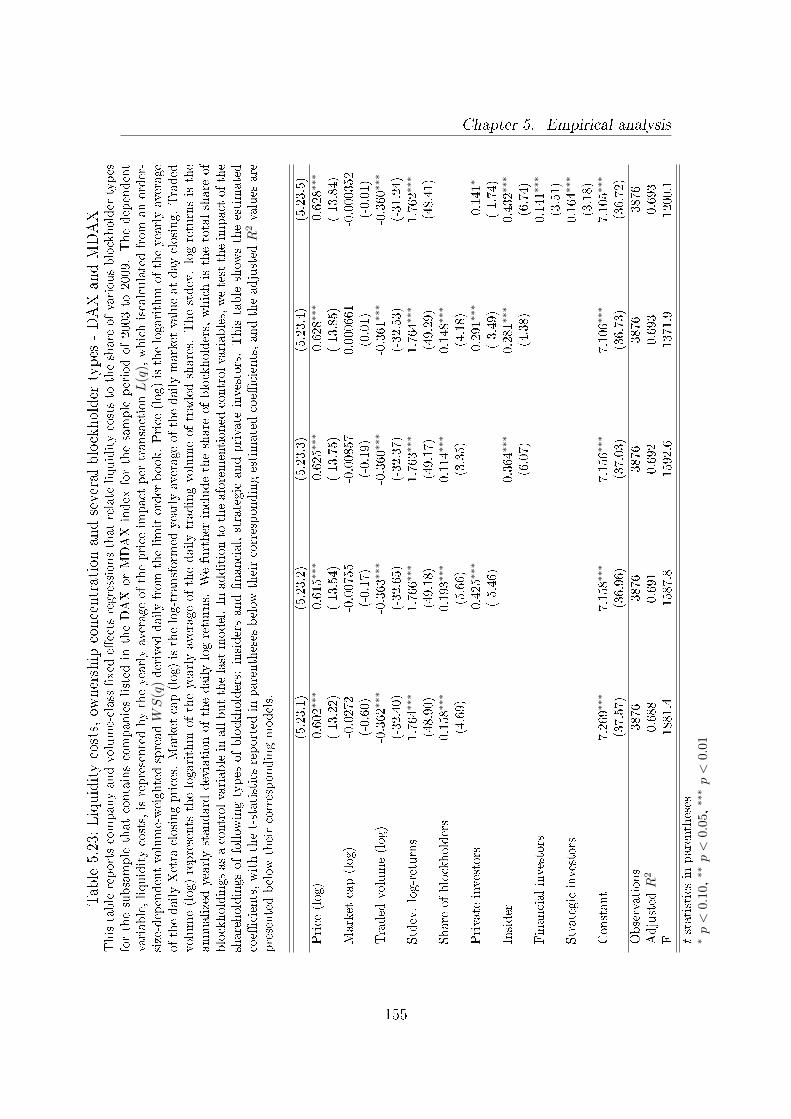
Chapter 5. Empirical analysis
Table5.23:Liquiditycosts,ow
nership
concentrationandseveralblockholder
types
-DAXandMDAX
Thistablereportscompanyandvolume-class�xed
e�ectsregressionsthatrelate
liquiditycoststo
theshare
ofvariousblockholder
types
forthesubsample
thatcontainscompanieslisted
intheDAX
orMDAX
index
forthesample
periodof2003to
2009.Thedependent
variable,liquiditycosts,isrepresentedbytheyearlyaverageoftheprice
impact
per
transactionL
(q),whichiscalculatedfrom
anorder-
size-dependentvolume-weightedspreadWS
(q)derived
dailyfrom
thelimitorder
book.Price
(log)isthelogarithm
oftheyearlyaverage
ofthedailyXetra
closingprices.
Market
cap(log)isthelog-transform
edyearlyaverageofthedailymarket
valueatday
closing.Traded
volume(log)represents
thelogarithm
oftheyearlyaverageofthedailytradingvolumeoftraded
shares.
Thestdev.log-returnsisthe
annualizedyearlystandard
deviationofthedailylog-returns.
Wefurther
includetheshare
ofblockholders,whichisthetotalshare
ofblockholdingsasacontrolvariablein
allbutthelastmodel.In
additionto
theaforementioned
controlvariables,wetesttheim
pact
ofthe
shareholdingsoffollow
ingtypes
ofblockholders:
insidersand�nancial,strategicandprivate
investors.Thistableshow
stheestimated
coe�
cients,withthet-statisticsreported
inparentheses
below
theircorrespondingestimatedcoe�
cients,andtheadjusted
R2values
are
presentedbelow
theircorrespondingmodels.
(5.23.1)
(5.23.2)
(5.23.3)
(5.23.4)
(5.23.5)
Price
(log)
-0.602∗
∗∗-0.615∗∗
∗-0.625∗∗
∗-0.628∗∗
∗-0.628∗∗
∗
(-13.22)
(-13.54)
(-13.75)
(-13.85)
(-13.84)
Market
cap(log)
-0.0272
-0.00755
-0.00857
0.000661
-0.000352
(-0.60)
(-0.17)
(-0.19)
(0.01)
(-0.01)
Traded
volume(log)
-0.362∗∗
∗-0.363∗∗
∗-0.360∗∗
∗-0.361∗∗
∗-0.360∗∗
∗
(-32.40)
(-32.65)
(-32.37)
(-32.53)
(-31.24)
Stdev.log-returns
1.764∗∗
∗1.766∗∗
∗1.763∗∗
∗1.764∗∗
∗1.762∗∗
∗
(48.90)
(49.18)
(49.17)
(49.29)
(48.41)
Share
ofblockholders
0.158∗∗
∗0.193∗∗
∗0.114∗∗
∗0.148∗∗
∗
(4.69)
(5.66)
(3.35)
(4.18)
Private
investors
-0.425∗
∗∗-0.291∗∗
∗-0.141∗
(-5.46)
(-3.49)
(-1.74)
Insider
0.364
∗∗∗
0.281∗∗
∗0.432∗∗
∗
(6.07)
(4.38)
(6.74)
Financialinvestors
0.141∗∗
∗
(3.51)
Strategicinvestors
0.164∗∗
∗
(3.18)
Constant
7.269∗∗
∗7.158∗∗
∗7.156∗∗
∗7.106∗∗
∗7.105∗∗
∗
(37.57)
(36.96)
(37.03)
(36.73)
(36.72)
Observations
3876
3876
3876
3876
3876
Adjusted
R2
0.688
0.691
0.692
0.693
0.693
F1881.4
1587.8
1592.6
1371.9
1200.1
tstatisticsin
parentheses
∗p<
0.1
0,∗∗p<
0.0
5,∗∗
∗p<
0.01
155
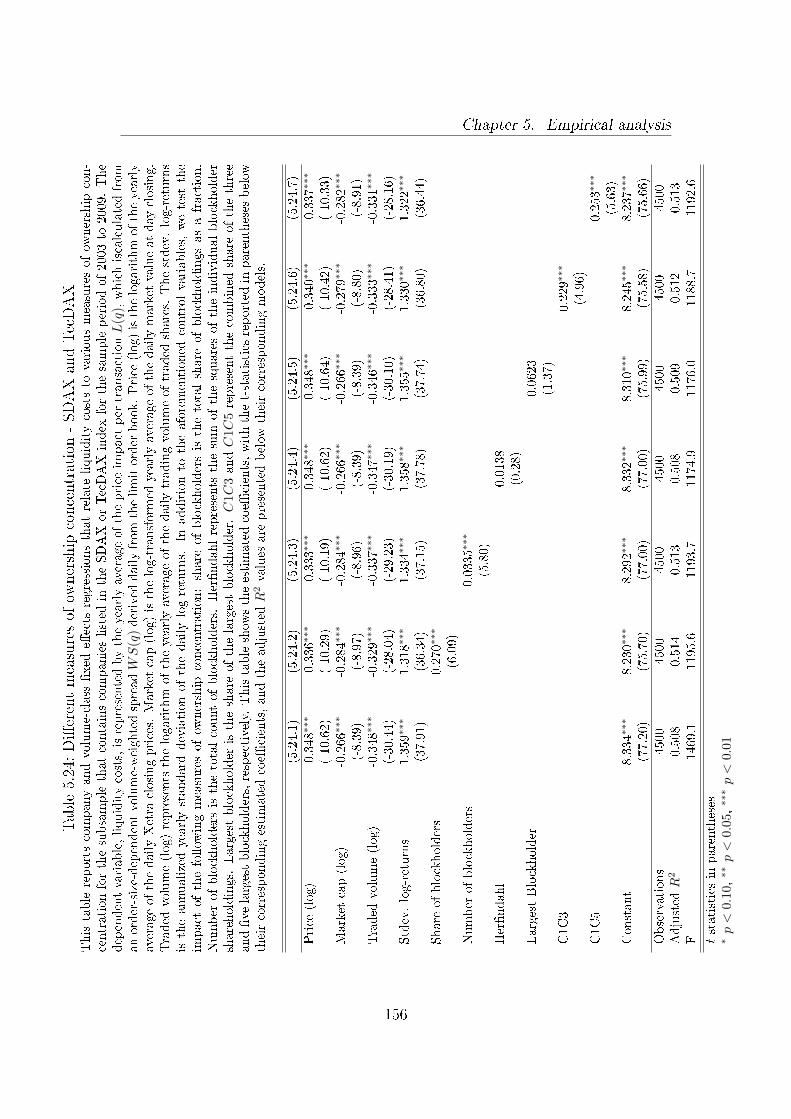
Chapter 5. Empirical analysis
Table5.24:Di�erentmeasuresof
ownership
concentration-SDAXandTecDAX
Thistablereportscompanyandvolume-class
�xed
e�ects
regressionsthatrelate
liquiditycoststo
variousmeasuresofow
nership
con-
centrationforthesubsamplethatcontainscompanieslisted
intheSDAXorTecDAXindex
forthesampleperiodof2003to
2009.The
dependentvariable,liquiditycosts,isrepresentedbytheyearlyaverage
oftheprice
impact
per
transactionL
(q),whichiscalculatedfrom
anorder-size-dependentvolume-weightedspreadWS
(q)derived
dailyfrom
thelimitorder
book.Price
(log)isthelogarithm
oftheyearly
averageof
thedailyXetra
closingprices.
Market
cap(log)isthelog-transform
edyearlyaverageofthedailymarket
valueatday
closing.
Traded
volume(log)represents
thelogarithm
oftheyearlyaverageofthedailytradingvolumeoftraded
shares.
Thestdev.log-returns
istheannualizedyearlystandard
deviationofthedailylog-returns.
Inadditionto
theaforementioned
controlvariables,
wetest
the
impact
ofthefollow
ingmeasuresofow
nership
concentration:share
ofblockholdersisthetotalshare
ofblockholdingsasafraction.
Number
ofblockholdersisthetotalcountofblockholders.
Her�ndahlrepresents
thesum
ofthesquaresoftheindividualblockholder
shareholdings.
Largestblockholder
istheshare
ofthelargestblockholder.C
1C
3andC
1C5representthecombined
share
ofthethree
and�ve
largestblockholders,respectively.
Thistableshow
stheestimatedcoe�
cients,withthet-statisticsreported
inparentheses
below
theircorrespondingestimatedcoe�
cients,andtheadjusted
R2values
are
presentedbelow
theircorrespondingmodels.
(5.24.1)
(5.24.2)
(5.24.3)
(5.24.4)
(5.24.5)
(5.24.6)
(5.24.7)
Price
(log)
-0.348∗
∗∗-0.336∗∗
∗-0.333∗∗
∗-0.348∗∗
∗-0.348∗∗
∗-0.340∗∗
∗-0.337∗∗
∗
(-10.62)
(-10.29)
(-10.19)
(-10.62)
(-10.64)
(-10.42)
(-10.33)
Market
cap(log)
-0.266∗
∗∗-0.284∗∗
∗-0.284∗∗
∗-0.266∗∗
∗-0.266∗∗
∗-0.279∗∗
∗-0.282∗∗
∗
(-8.39)
(-8.97)
(-8.96)
(-8.39)
(-8.39)
(-8.80)
(-8.91)
Traded
volume(log)
-0.348∗∗
∗-0.329∗∗
∗-0.337∗∗
∗-0.347∗∗
∗-0.346∗∗
∗-0.333∗∗
∗-0.331∗∗
∗
(-30.44)
(-28.04)
(-29.23)
(-30.19)
(-30.10)
(-28.41)
(-28.16)
Stdev.log-returns
1.359∗∗
∗1.318∗∗
∗1.334∗∗
∗1.358∗∗
∗1.355∗∗
∗1.330∗∗
∗1.322∗∗
∗
(37.91)
(36.34)
(37.15)
(37.78)
(37.74)
(36.80)
(36.44)
Share
ofblockholders
0.270∗
∗∗
(6.09)
Number
ofblockholders
0.0335∗
∗∗
(5.80)
Her�ndahl
0.0138
(0.28)
LargestBlockholder
0.0623
(1.37)
C1C3
0.229∗∗
∗
(4.96)
C1C5
0.253∗∗
∗
(5.63)
Constant
8.334∗∗
∗8.230∗∗
∗8.292∗∗
∗8.332∗∗
∗8.310∗∗
∗8.245∗∗
∗8.237∗∗
∗
(77.20)
(75.70)
(77.00)
(77.00)
(75.99)
(75.58)
(75.66)
Observations
4500
4500
4500
4500
4500
4500
4500
Adjusted
R2
0.508
0.514
0.513
0.508
0.509
0.512
0.513
F1469.1
1195.6
1193.7
1174.9
1176.0
1188.7
1192.6
tstatisticsin
parentheses
∗p<
0.1
0,∗∗p<
0.0
5,∗∗
∗p<
0.01
156

Chapter 5. Empirical analysis
Table5.25:Liquiditycosts,ow
nership
concentrationandseveralblockholder
types
-SDAXandTecDAX
Thistablereportscompanyandvolume-class�xed
e�ectsregressionsthatrelate
liquiditycoststo
theshare
ofvariousblockholder
types
forthesubsamplethatcontainscompanieslisted
intheSDAXorTecDAXindex
forthesampleperiodof2003to
2009.Thedependent
variable,liquiditycosts,
isrepresentedbytheyearlyaverageoftheprice
impact
per
transactionL
(q),
whichis
calculatedfrom
an
order-size-dependentvolume-weightedspreadWS
(q)derived
dailyfrom
thelimitorder
book.Price
(log)isthelogarithm
oftheyearly
averageof
thedailyXetra
closingprices.
Market
cap(log)isthelog-transform
edyearlyaverageofthedailymarket
valueatday
closing.
Traded
volume(log)represents
thelogarithm
oftheyearlyaverageofthedailytradingvolumeoftraded
shares.
Thestdev.log-returns
istheannualizedyearlystandard
deviationofthedailylog-returns.
Wefurther
includetheshare
ofblockholders,whichisthetotal
share
ofblockholdingsasacontrolvariablein
allbutthelast
model.In
additionto
theaforementioned
controlvariables,wetest
the
impact
oftheshareholdingsoffollow
ingtypes
ofblockholders:
insidersand�nancial,strategicandprivate
investors.Thistableshow
stheestimatedcoe�
cients,withthet-statisticsreported
inparentheses
below
theircorrespondingestimatedcoe�
cients,andtheadjusted
R2values
are
presentedbelow
theircorrespondingmodels.
(5.25.1)
(5.25.2)
(5.25.3)
(5.25.4)
(5.25.5)
Price
(log)
-0.336∗
∗∗-0.339∗∗
∗-0.342∗∗
∗-0.345∗∗
∗-0.346∗∗
∗
(-10.29)
(-10.25)
(-10.30)
(-10.26)
(-10.26)
Market
cap(log)
-0.284∗∗
∗-0.281∗∗
∗-0.278∗∗
∗-0.276∗∗
∗-0.276∗∗
∗
(-8.97)
(-8.77)
(-8.66)
(-8.52)
(-8.51)
Traded
volume(log)
-0.329∗∗
∗-0.329∗∗
∗-0.327∗∗
∗-0.327∗∗
∗-0.326∗∗
∗
(-28.04)
(-28.03)
(-27.40)
(-27.40)
(-26.91)
Stdev.log-returns
1.318∗∗
∗1.319∗∗
∗1.315∗∗
∗1.316∗∗
∗1.314∗∗
∗
(36.34)
(36.30)
(36.13)
(36.06)
(35.73)
Share
ofblockholders
0.270∗∗
∗0.277∗∗
∗0.264∗∗
∗0.269∗∗
∗
(6.09)
(6.09)
(5.88)
(5.84)
Private
investors
-0.0965
-0.0789
0.194
(-0.65)
(-0.53)
(1.32)
Insider
0.0674
0.0629
0.330∗∗
∗
(1.01)
(0.94)
(4.42)
Financialinvestors
0.256∗∗
∗
(4.72)
Strategicinvestors
0.283∗∗
∗
(5.21)
Constant
8.230∗∗
∗8.220∗∗
∗8.197∗∗
∗8.191∗∗
∗8.191∗∗
∗
(75.70)
(74.78)
(72.19)
(71.72)
(71.71)
Observations
4500
4500
4500
4500
4500
Adjusted
R2
0.514
0.514
0.514
0.514
0.514
F1195.6
996.3
996.5
854.0
747.1
tstatisticsin
parentheses
∗p<
0.1
0,∗∗p<
0.0
5,∗∗
∗p<
0.01
157
Chapter 5. Empirical analysis
5.3 Market liquidity and insider trading135
This section focuses on the empirical analysis of the impact of insider trading
on market liquidity. For our empirical analyses, we use our dataset presented in
section 4.1.3. We begin with an application of the standard event study method-
ology to analyze the behavior of market liquidity around insider trading days.
The event study is followed by a panel-data regression analysis that examines the
e�ect of insider trading activity on liquidity costs in great detail, while controlling
for variables that have proven to at least partially explain liquidity costs (e.g.,
share price, return volatility, trading activity and �rm size).
5.3.1 Event study
5.3.1.1 Theoretical framework for a market liquidity event study
As a �rst indicator of the magnitude and direction of the impact of insider trading
on market liquidity, we conduct an event study. This statistical method has
been widely used to measure the impact of a speci�c event (e.g., mergers and
acquisitions, earnings announcements, issues of new debt or equity) on the value
of a �rm; see, e.g., Campbell et al. (1996) and MacKinlay (1997). These studies
typically scrutinize the abnormal equity return to appraise the event's impact on
the �rm value. However, this method can be easily adapted to use abnormal
liquidity costs around speci�c events instead, see, e.g., Chung and Charoenwong
(1998), to analyze the event's impact on the market liquidity. The rationale for
this procedure is that the e�ects of an event are re�ected immediately in the bid
and ask prices.
135 This section is largely based on Rösch and Kaserer (2011).
158
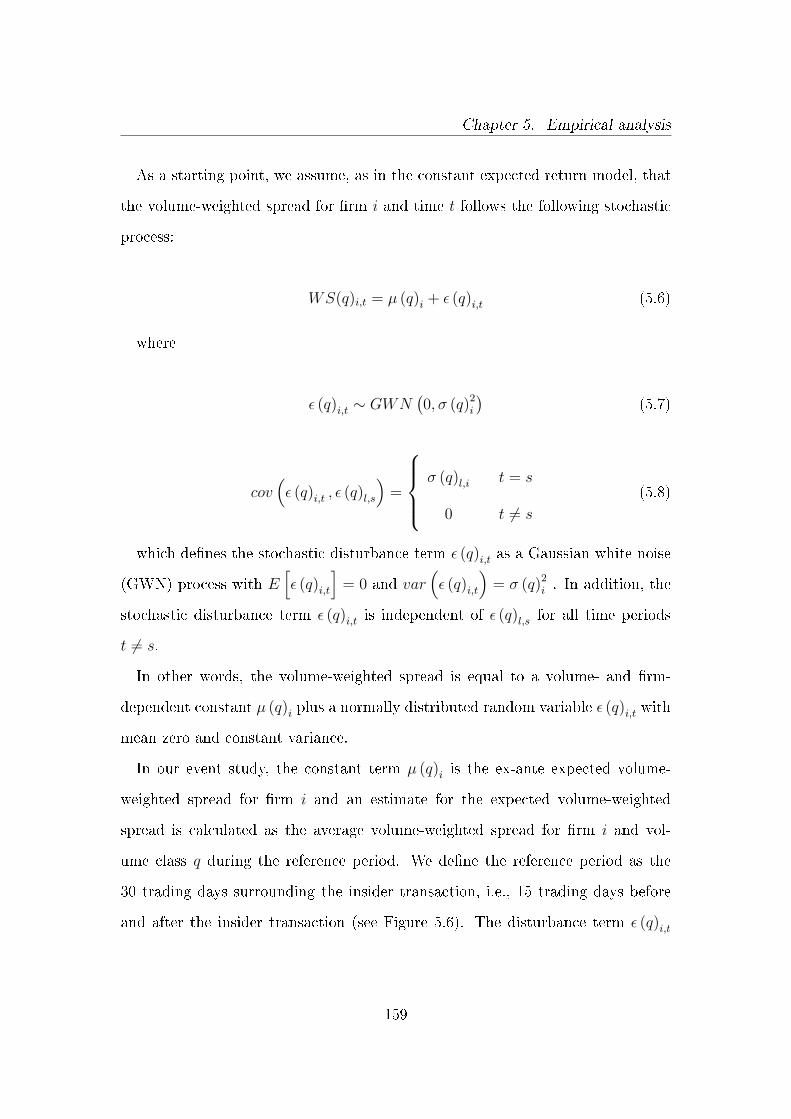
Chapter 5. Empirical analysis
As a starting point, we assume, as in the constant expected return model, that
the volume-weighted spread for �rm i and time t follows the following stochastic
process:
WS(q)i,t = µ (q)i + ε (q)i,t (5.6)
where
ε (q)i,t ∼ GWN(0, σ (q)2i
)(5.7)
cov(ε (q)i,t , ε (q)l,s
)=
σ (q)l,i
0
t = s
t 6= s
(5.8)
which de�nes the stochastic disturbance term ε (q)i,t as a Gaussian white noise
(GWN) process with E[ε (q)i,t
]= 0 and var
(ε (q)i,t
)= σ (q)2i . In addition, the
stochastic disturbance term ε (q)i,t is independent of ε (q)l,s for all time periods
t 6= s.
In other words, the volume-weighted spread is equal to a volume- and �rm-
dependent constant µ (q)i plus a normally distributed random variable ε (q)i,t with
mean zero and constant variance.
In our event study, the constant term µ (q)i is the ex-ante expected volume-
weighted spread for �rm i and an estimate for the expected volume-weighted
spread is calculated as the average volume-weighted spread for �rm i and vol-
ume class q during the reference period. We de�ne the reference period as the
30 trading days surrounding the insider transaction, i.e., 15 trading days before
and after the insider transaction (see Figure 5.6). The disturbance term ε (q)i,t
159
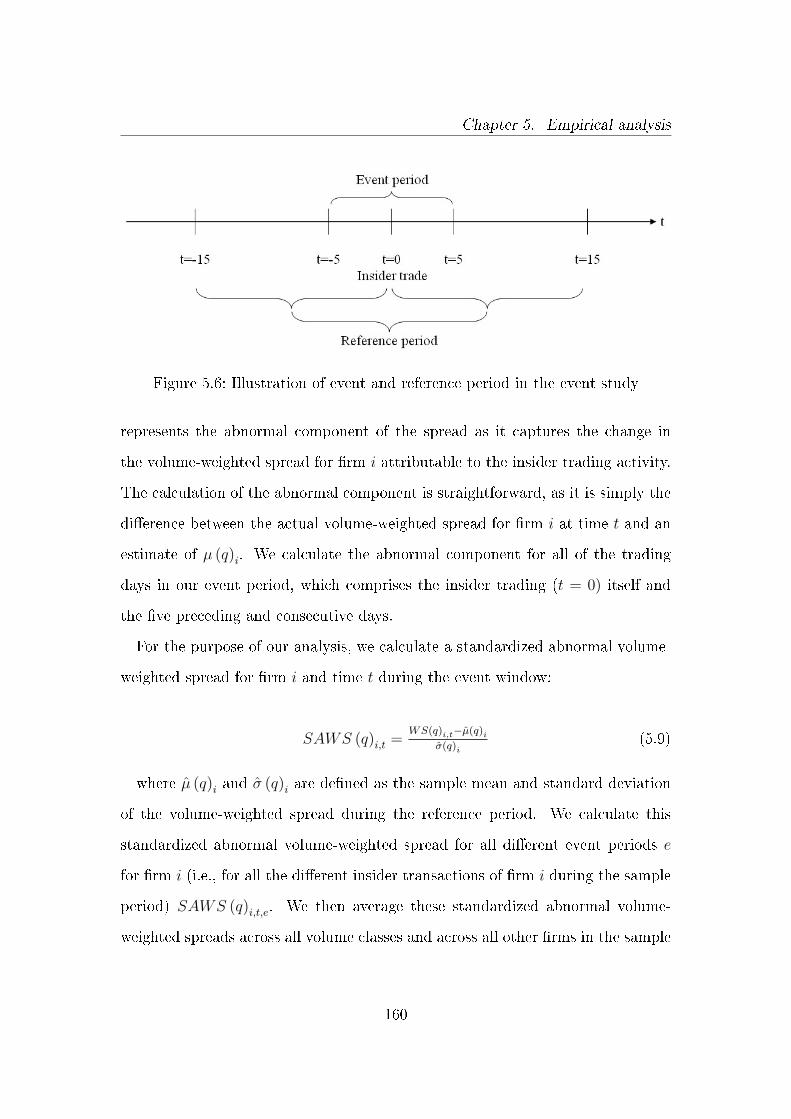
Chapter 5. Empirical analysis
Figure 5.6: Illustration of event and reference period in the event study
represents the abnormal component of the spread as it captures the change in
the volume-weighted spread for �rm i attributable to the insider trading activity.
The calculation of the abnormal component is straightforward, as it is simply the
di�erence between the actual volume-weighted spread for �rm i at time t and an
estimate of µ (q)i. We calculate the abnormal component for all of the trading
days in our event period, which comprises the insider trading (t = 0) itself and
the �ve preceding and consecutive days.
For the purpose of our analysis, we calculate a standardized abnormal volume-
weighted spread for �rm i and time t during the event window:
SAWS (q)i,t =WS(q)i,t−µ̂(q)i
σ̂(q)i(5.9)
where µ̂ (q)i and σ̂ (q)i are de�ned as the sample mean and standard deviation
of the volume-weighted spread during the reference period. We calculate this
standardized abnormal volume-weighted spread for all di�erent event periods e
for �rm i (i.e., for all the di�erent insider transactions of �rm i during the sample
period) SAWS (q)i,t,e. We then average these standardized abnormal volume-
weighted spreads across all volume classes and across all other �rms in the sample
160
Chapter 5. Empirical analysis
to derive an average abnormal volume-weighted spread on day t:
AAWSt =∑
i,q,e SAWS(q)i,t,eIQE
(5.10)
where IQE is the total number of insider transactions across all �rms i and
volume classes q. We further compute a cumulative abnormal volume-weighted
spread CAWSτ as the sum of the average abnormal volume-weighted spread for
a period τ ⊆ [−5; 5] during the event period:
CAWSτ =∑
τ AAWSt (5.11)
In our event study, we use three di�erent periods: one period covers the �ve
days preceding the insider transaction (τ = [1; 5]), one period consists of the �ve
days following the insider transaction (τ = [−5;−1]) and the last period covers
the whole event window (τ = [−5; 5]).
5.3.1.2 Univariate results from the event study
Tables 5.26 and 5.27 show the results for three di�erent subsamples: one con-
sists of all insider transactions in the sample period, one only comprises exclusive
insider buy transactions (i.e., on the event date t = 0, insiders only initiated
buy transactions) and another only consists of exclusive sell transactions. These
results are insightful in several ways.
First, on the day of the insider transaction (t = 0), the abnormal volume-
weighted spreads are signi�cantly negative for all three subsamples, which shows
that the stocks are more liquid on the day of the insider transactions compared
with the reference period, which is consistent with our expectation for the insider
161
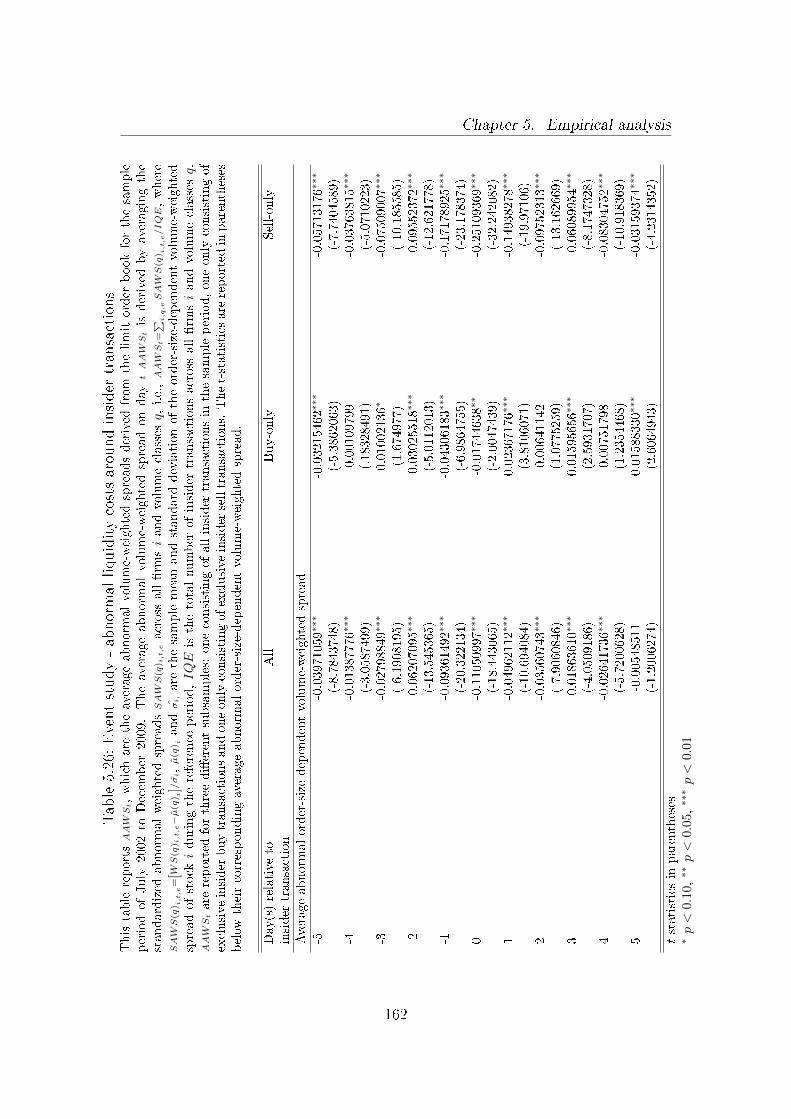
Chapter 5. Empirical analysisTable5.26:Eventstudy-abnormal
liquiditycostsaroundinsider
transactions
Thistable
reportsAAWSt,whichare
theaverageabnorm
alvolume-weightedspreadsderived
from
thelimitorder
bookforthesample
periodofJuly
2002to
Decem
ber
2009.Theaverageabnorm
alvolume-weightedspreadonday
tAAWStis
derived
byaveragingthe
standardized
abnorm
alweightedspreadsSAWS(q
) i,t,eacross
all�rm
siandvolumeclassesq,
i.e.,AAWSt=∑ i
,q,eSAWS(q
) i,t,e/IQE,where
SAWS(q
) i,t,e=
[WS(q
) i,t,e−µ̂(q
) i]/σ̂i,µ̂(q
) iandσ̂i,are
thesamplemeanandstandard
deviationoftheorder-size-dependentvolume-weighted
spreadofstock
iduringthereference
period,IQE
isthetotalnumber
ofinsider
transactionsacross
all�rm
siandvolumeclassesq.
AAWStare
reported
forthreedi�erentsubsamples:
oneconsistingofallinsider
transactionsin
thesampleperiod,oneonly
consistingof
exclusive
insiderbuytransactionsandoneonlyconsistingofexclusive
insiderselltransactions.Thet-statisticsarereported
inparentheses
below
theircorrespondingaverageabnorm
alorder-size-dependentvolume-weightedspread.
Day(s)relative
toAll
Buy-only
Sell-only
insider
transaction
Averageabnorm
alorder-sizedependentvolume-weightedspread
-5-0.03971059∗∗
∗-0.03215462∗∗
∗-0.05713176∗∗
∗
(-8.7843748)
(-5.3862063)
(-7.7404589)
-4-0.01387776∗∗
∗0.00109799
-0.03763815∗∗
∗
(-3.0587499)
(.18328491)
(-5.0710223)
-3-0.02798849∗∗
∗0.01002136∗
-0.07509007∗∗
∗
(-6.1908195)
(1.674977)
(-10.185585)
-2-0.06207095∗∗
∗-0.03025518∗∗
∗-0.09552372∗∗
∗
(-13.545365)
(-5.0112013)
(-12.621778)
-1-0.09361492∗∗
∗-0.04306183∗∗
∗-0.17178925∗∗
∗
(-20.322134)
(-6.9864755)
(-23.178374)
0-0.11050997∗∗
∗-0.01744638∗∗
-0.25109369∗∗
∗
(-18.443065)
(-2.0047439)
(-32.242082)
1-0.04962112∗∗
∗0.02367176∗∗
∗-0.14938278∗∗
∗
(-10.694084)
(3.8106071)
(-19.97106)
2-0.03560743∗∗
∗0.00641142
-0.09752313∗∗
∗
(-7.9060846)
(1.0775259)
(-13.162669)
3-0.01863610∗∗
∗0.01595656∗∗
∗-0.06089954∗∗
∗
(-4.0509186)
(2.5931707)
(-8.1747328)
4-0.02641736∗∗
∗0.00751798
-0.08304752∗∗
∗
(-5.7200628)
(1.2354468)
(-10.918369)
5-0.00548511
0.01588330∗∗
∗-0.03159374∗
∗∗
(-1.2006274)
(2.6064943)
(-4.2314352)
tstatisticsin
parentheses
∗p<
0.1
0,∗∗p<
0.0
5,∗∗
∗p<
0.01
162
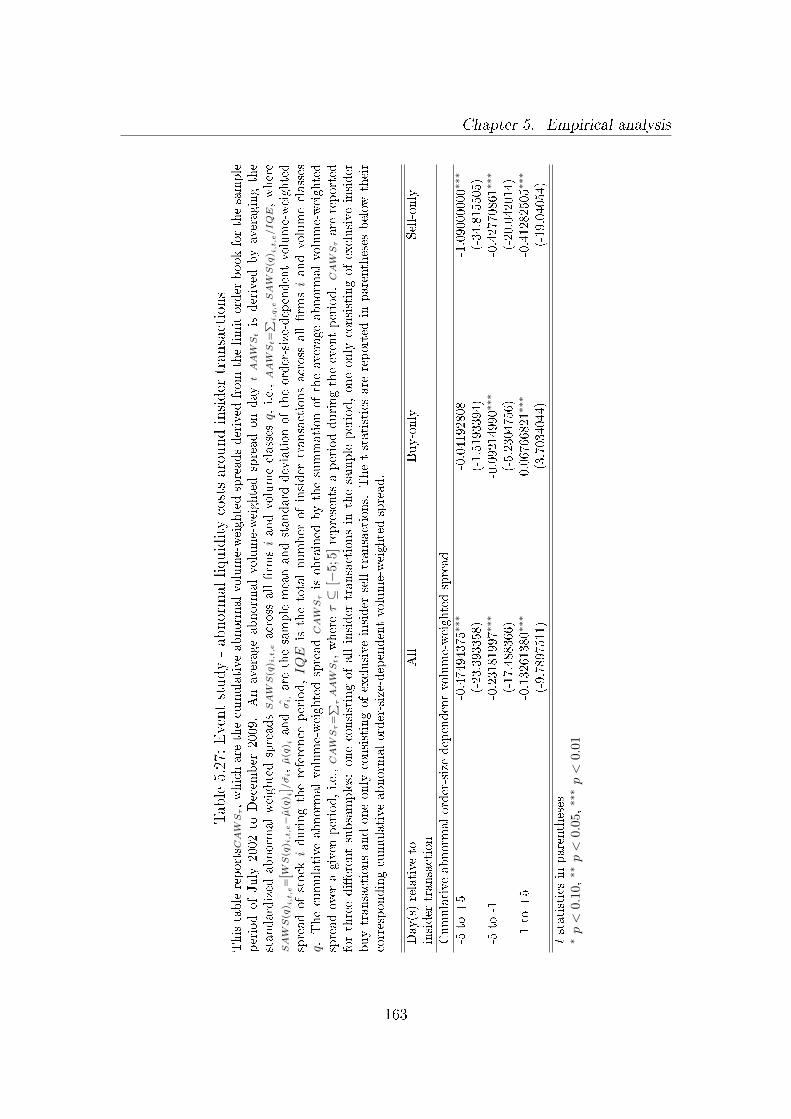
Chapter 5. Empirical analysis
Table5.27:Eventstudy-abnormal
liquiditycostsaroundinsider
transactions
ThistablereportsCAWSτ,whichare
thecumulative
abnorm
alvolume-weightedspreadsderived
from
thelimitorder
bookforthesample
periodofJuly
2002to
Decem
ber
2009.Anaverageabnorm
alvolume-weightedspreadonday
tAAWStis
derived
byaveragingthe
standardized
abnorm
alweightedspreadsSAWS(q
) i,t,eacross
all�rm
siandvolumeclassesq,
i.e.,AAWSt=∑ i
,q,eSAWS(q
) i,t,e/IQE,where
SAWS(q
) i,t,e=
[WS(q
) i,t,e−µ̂(q
) i]/σ̂i,µ̂(q
) iandσ̂i,are
thesamplemeanandstandard
deviationoftheorder-size-dependentvolume-weighted
spreadofstock
iduringthereference
period,IQE
isthetotalnumber
ofinsider
transactionsacross
all�rm
siandvolumeclasses
q.Thecumulative
abnorm
alvolume-weightedspreadCAWSτisobtained
bythesummationoftheaverageabnorm
alvolume-weighted
spreadover
agiven
period,i.e.,CAWSτ=∑ τ
AAWSt,whereτ⊆
[−5;5
]represents
aperiodduringtheeventperiod.CAWSτare
reported
forthreedi�erentsubsamples:
oneconsistingofallinsider
transactionsin
thesample
period,oneonly
consistingofexclusive
insider
buytransactionsandoneonly
consistingofexclusive
insider
selltransactions.
Thet-statistics
are
reported
inparentheses
below
their
correspondingcumulative
abnormalorder-size-dependentvolume-weightedspread.
Day(s)relative
toAll
Buy-only
Sell-only
insider
transaction
Cumulative
abnorm
alorder-sizedependentvolume-weightedspread
-5to
+5
-0.47494375∗∗
∗-0.04192808
-1.09000000∗
∗∗
(-23.393358)
(-1.5193394)
(-34.815505)
-5to
-1-0.23181997∗∗
∗-0.09214990∗∗
∗-0.42770861∗∗
∗
(-17.488366)
(-5.2304756)
(-20.042014)
+1to
+5
-0.13261380∗
∗∗0.06766821∗∗
∗-0.41282505∗∗
∗
(-9.7897511)
(3.7034044)
(-19.04054)
tstatisticsin
parentheses
∗p<
0.1
0,∗∗p<
0.0
5,∗∗
∗p<
0.01
163
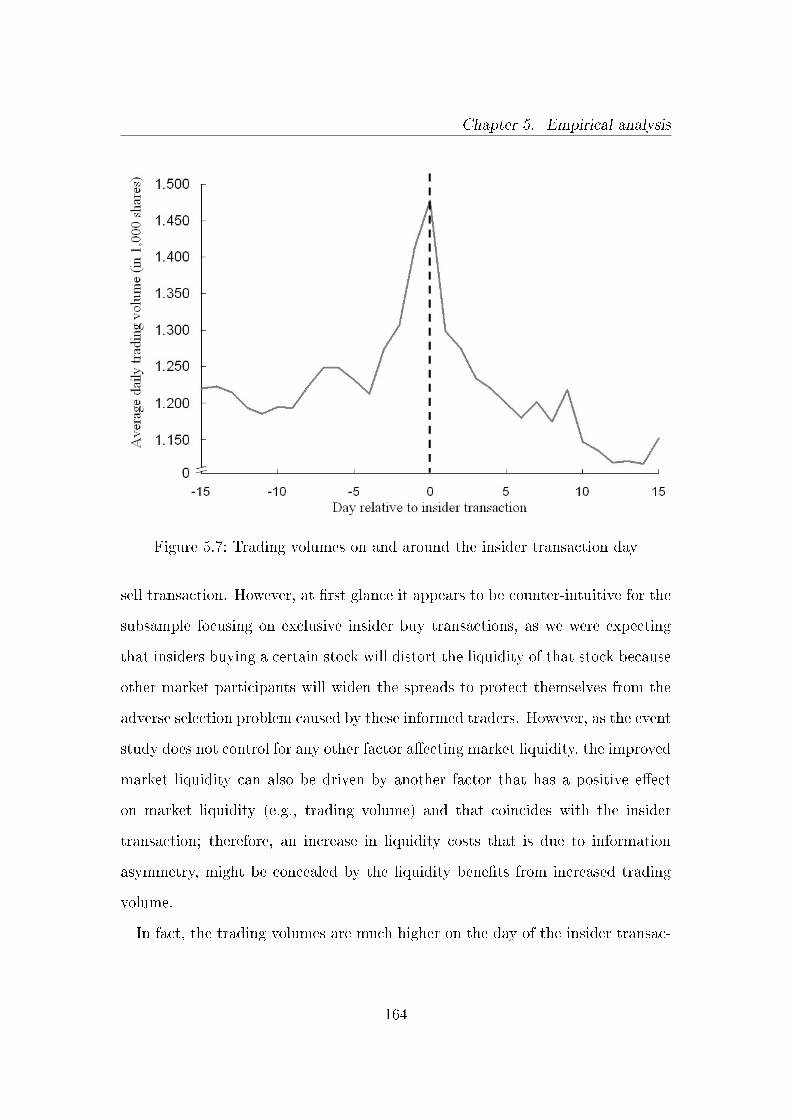
Chapter 5. Empirical analysis
Figure 5.7: Trading volumes on and around the insider transaction day
sell transaction. However, at �rst glance it appears to be counter-intuitive for the
subsample focusing on exclusive insider buy transactions, as we were expecting
that insiders buying a certain stock will distort the liquidity of that stock because
other market participants will widen the spreads to protect themselves from the
adverse selection problem caused by these informed traders. However, as the event
study does not control for any other factor a�ecting market liquidity, the improved
market liquidity can also be driven by another factor that has a positive e�ect
on market liquidity (e.g., trading volume) and that coincides with the insider
transaction; therefore, an increase in liquidity costs that is due to information
asymmetry, might be concealed by the liquidity bene�ts from increased trading
volume.
In fact, the trading volumes are much higher on the day of the insider transac-
164
Chapter 5. Empirical analysis
tions136: Figure 5.7 shows that trading volumes peak for the whole sample on the
day of the insider transaction, with almost 1.5 million shares traded, which is more
than 20% higher than in the reference period and almost 40% higher compared
with the average of the whole sample.137 This �nding supports the hypothe-
sis that insiders trade at times of unusually high trading volumes to conceal their
information-based trading activity. We can therefore conclude that insider appear
to trade on days that are very active, most likely to hide their information-based
trading in higher trading volumes. The fact that the abnormal volume-weighted
spread is less pronounced for insider-initiated buy transactions may indicate that
buy transactions have a negative counter-e�ect on the market liquidity compared
with the high market liquidity resulting from insider sell transactions that are
ampli�ed by high trading volumes.
The e�ect of an improved market liquidity already emerges in the �ve days
preceding the insider transaction. This e�ect is be best observed in Table 5.27 on
the cumulative abnormal volume-weighted spread covering the period before the
insider transaction but also on the individual abnormal volume-weighted spreads
in Table 5.26 in the days before the insider transactions, which are almost all
signi�cantly negative. This observation also supports our �nding that insiders try
to time their transaction to trade on days of high liquidity.
For the days immediately following the insider transactions, we would expect
to observe di�erent outcomes depending on the type of the insider transaction.
For the buy transaction subsample, we would expect that the asset liquidity
is impaired after the insider transaction, as the total insider ownership is in-
136 Meulbroek (1992) amongst others also found higher trading volume on insider trading days.137 The increased trading volume cannot be solely attributed to the insider transactions, as the
average transaction size traded by insiders in a day is 81,000 shares for buy transactions and92,500 shares for sell transactions, which is far less than the increased volume we observeon the insider transaction day.
165

Chapter 5. Empirical analysis
creased through the transaction; alread, several other studies (see, e.g., He�in
and Shaw (2000) and our research in section 5.2) have shown that market liquid-
ity is impaired by insider ownership, due to the information asymmetry problem
between the insiders and other market participants. However, as the sell transac-
tions decrease the share of insider ownership and, therefore the share of potential
information-based trading, we anticipate an asset liquidity improvement on the
days following the insider sell transaction as the information asymmetry problem is
attenuated through the transaction. Tables 5.26 and 5.27 show that the results are
consistent with our expectations: Both the cumulative abnormal volume-weighted
spread covering the period following the insider transaction and the individual ab-
normal volume-weighted spreads on the days after the insider transactions are all
signi�cantly negative for the subsample consisting of the insider sell transactions
and all positive for the insider buy transactions.
5.3.1.3 Panel data analysis for abnormal volume-weighted spreads from
the event study
Thus far, our event study design does not control for any other variable than the
insider transaction. However, it has given us several interesting indications and
�ndings, which can now be explored in more detail. We therefore scrutinize the im-
pact of insider transactions on the standardized abnormal volume-weighted spread
and the cumulative abnormal volume-weighted spread in a multivariate analysis
that also controls for the following variables, that are known to at least partially
explain liquidity costs: the transaction volume V O, the Xetra closing price P ,
the market capitalization MV and the standard deviation of daily log-returns σr.
For the regression analysis, we transform the control variables transaction volume
V O, the Xetra closing prices P and the market capitalizationMV by taking their
166
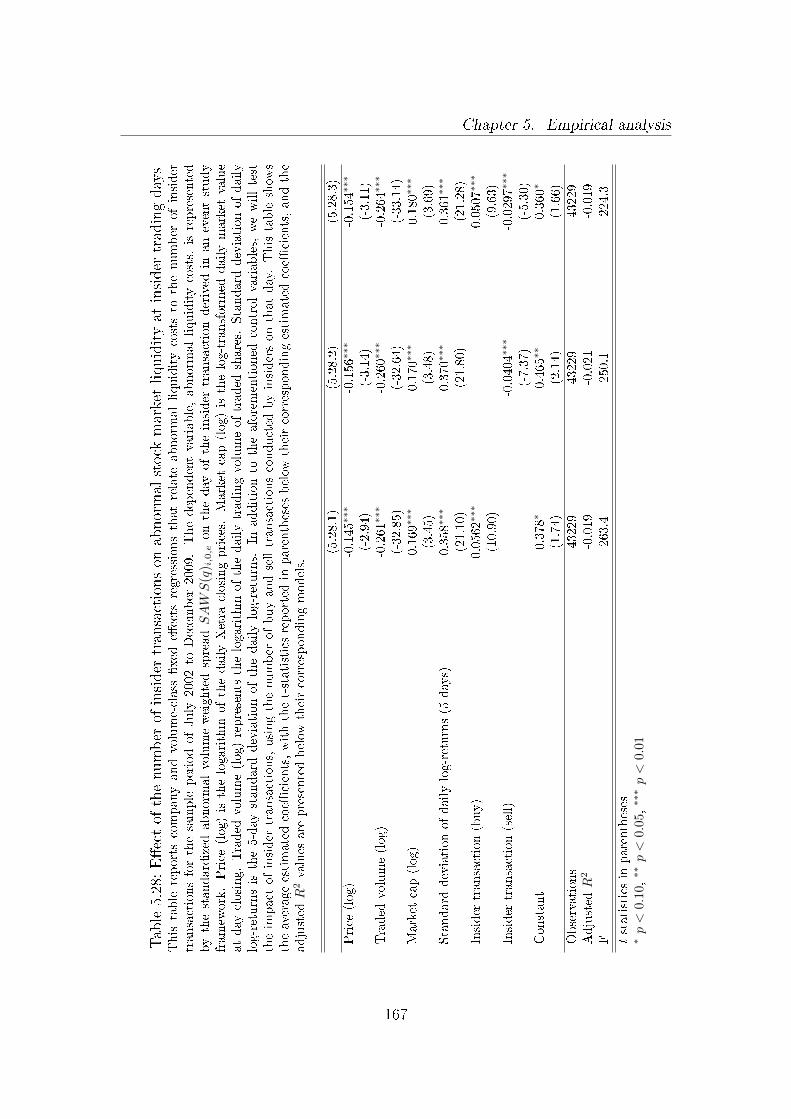
Chapter 5. Empirical analysis
Table5.28:E�ectof
thenumber
ofinsider
transactionson
abnormal
stock
marketliquidityat
insider
tradingdays
This
table
reportscompanyandvolume-class
�xed
e�ects
regressionsthatrelate
abnorm
alliquiditycoststo
thenumber
ofinsider
transactionsforthesample
periodofJuly
2002to
Decem
ber
2009.Thedependentvariable,abnorm
alliquiditycosts,
isrepresented
bythestandardized
abnorm
alvolume-weightedspreadSAWS
(q) i,0,eontheday
oftheinsider
transactionderived
inaneventstudy
framew
ork.Price
(log)isthelogarithm
ofthedailyXetra
closingprices.
Market
cap(log)isthelog-transform
eddailymarket
value
atday
closing.Traded
volume(log)represents
thelogarithm
ofthedailytradingvolumeoftraded
shares.
Standard
deviationofdaily
log-returnsisthe5-day
standard
deviationofthedailylog-returns.
Inadditionto
theaforem
entioned
controlvariables,
wewilltest
theim
pact
ofinsider
transactions,usingthenumber
ofbuyandselltransactionsconducted
byinsidersonthatday.Thistableshow
stheaverageestimatedcoe�
cients,withthet-statisticsreported
inparentheses
below
theircorrespondingestimatedcoe�
cients,andthe
adjusted
R2values
are
presentedbelow
theircorrespondingmodels.
(5.28.1)
(5.28.2)
(5.28.3)
Price
(log)
-0.145∗∗
∗-0.156∗∗
∗-0.154∗∗
∗
(-2.94)
(-3.14)
(-3.11)
Traded
volume(log)
-0.261∗∗
∗-0.260∗∗
∗-0.264∗∗
∗
(-32.85)
(-32.64)
(-33.14)
Market
cap(log)
0.169∗∗
∗0.170∗∗
∗0.180∗∗
∗
(3.45)
(3.48)
(3.69)
Standard
deviationofdailylog-returns(5
days)
0.358∗∗
∗0.370∗∗
∗0.361∗∗
∗
(21.10)
(21.80)
(21.28)
Insider
transaction(buy)
0.0562∗
∗∗0.0507∗∗
∗
(10.90)
(9.63)
Insider
transaction(sell)
-0.0404∗∗
∗-0.0297∗∗
∗
(-7.37)
(-5.30)
Constant
0.378∗
0.465∗∗
0.360∗
(1.74)
(2.14)
(1.66)
Observations
43229
43229
43229
Adjusted
R2
-0.019
-0.021
-0.019
F263.4
250.1
224.3
tstatisticsin
parentheses
∗p<
0.1
0,∗∗p<
0.0
5,∗∗
∗p<
0.01
167
Chapter 5. Empirical analysis
natural logarithms.138 For our panel data set with order-size-dependent abnor-
mal volume-weighted spreads, we use a company and volume class139 �xed e�ects
model140 for the estimation. The models141 that analyze the abnormal volume-
weighted spreads from the event study either include the dependent variable stan-
dardized abnormal volume-weighted spread SAWS (q)t or the dependent variable
cumulative abnormal volume-weighted spread CAWS (q) τ and all the standard
control variables in the following form:
SAWS (q)t
CAWS (q) τ
= αo + α1logV O + α2logP + α3logMV + α4σr + ε (5.12)
First, we analyze the impact of an insider transaction on the standardized ab-
normal volume-weighted spread derived from the event study framework on the
day of the transaction. As we expect that insider transactions have a di�erent
impact on stock market liquidity depending on the type of the transaction, e.g.,
either a sell or buy transaction, we separately add the number of buy (see model
5.28.1) and sell (see model 5.28.2) transactions performed by insiders and then
add both together (see model 5.28.3) to the standard set of control variables.
Table 5.28 shows the results for this panel data analysis of the standardized
abnormal volume-weighted spread on the day of the insider transaction. If we
recall the results from the event study in section 5.3.1.2, we observed that, on
days of insider purchases, the standardized abnormal volume-weighted spread was
138 This transformation is consistent with Stange and Kaserer (2008).139 The volume class q is an inherent characteristic of our order-size-dependent liquidity costs
measure.140 The Hausman (1978) test statistic supports the usage of a �xed e�ects model compared
with a random e�ects model.141 All variables are time and company dependent, but we do not subscript the variables in
the representation.
168
Chapter 5. Empirical analysis
negative, although we hypothesized that an insider purchase should lead to an
increase in the abnormal volume-weighted spread. We argued that this negative
standardized abnormal volume-weighted spread can be explained by the increased
traded volume on the day of the insider transaction, as we saw in Figure 5.7,
that counteracts the expected increase induced by the insider purchase. The
results in (5.28.1) provide support for this argumentation, as the coe�cient for
insider purchases is signi�cantly positive and the coe�cient for the traded volume
is signi�cantly negative. Speci�cation (5.28.2) shows that insider sales decrease
the abnormal volume-weighted spread, as expected. Additionally, speci�cation
(5.28.3) supports our initial hypothesis that insider purchases increase liquidity
costs (positive impact on abnormal spreads) and insider sales decrease liquidity
costs (negative impact on abnormal spreads).
We also analyze the same speci�cation as in model (5.28.3) for the 5 days
following the insider transactions. The results, which can be found in Table 5.29,
are qualitatively the same and also signi�cant142 as on the day of the insider
transaction and therefore support our hypotheses.
Furthermore, we redo the same analysis as in Table 5.28 for the cumulative
abnormal volume-weighted spread for the 5 days following the insider transaction.
The results presented in Table 5.30 are consistent with our hypotheses by showing
that insider purchases lead to increased abnormal volume-weighted spreads on the
5 days following the insider transaction and insider sales induce a decrease in the
abnormal volume-weighted spreads on the 5 days following the insider transaction.
After having analyzed the impact of insider transactions on abnormal volume-
weighted spreads in an event study framework, we will now scrutinize our liquidity
data in a panel-data regression analysis to further explore the impact of insider
142 However, the coe�cients for the sell transactions for t = 2 and t = 5 are not signi�cant.
169
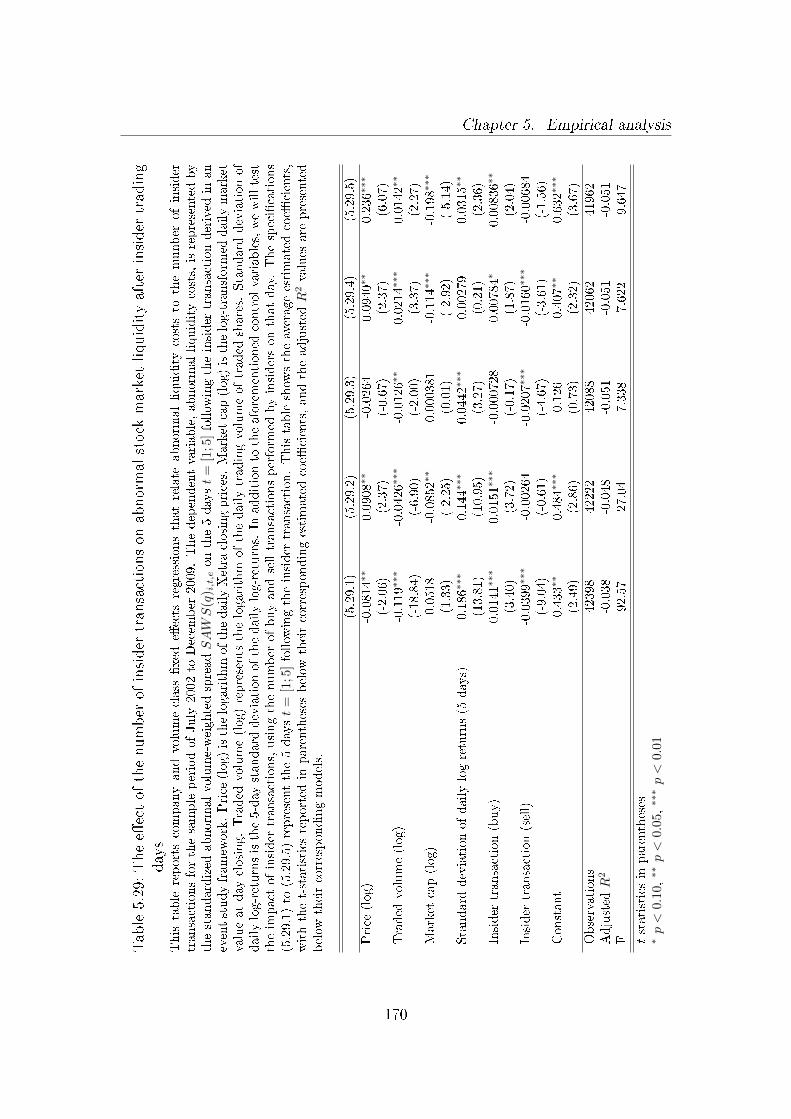
Chapter 5. Empirical analysisTable5.29:Thee�ectof
thenumber
ofinsider
transactionson
abnormalstock
marketliquidityafterinsider
trading
days
This
table
reportscompanyandvolume-class
�xed
e�ects
regressionsthatrelate
abnorm
alliquiditycoststo
thenumber
ofinsider
transactionsforthesampleperiodofJuly
2002to
Decem
ber
2009.Thedependentvariable,abnorm
alliquiditycosts,isrepresentedby
thestandardized
abnorm
alvolume-weightedspreadSAWS
(q) i,t,eonthe5dayst
=[1
;5]follow
ingtheinsider
transactionderived
inan
eventstudyframew
ork.Price
(log)isthelogarithmofthedailyXetra
closingprices.Marketcap(log)isthelog-transform
eddailymarket
valueatday
closing.Traded
volume(log)represents
thelogarithm
ofthedailytradingvolumeoftraded
shares.
Standard
deviationof
dailylog-returnsisthe5-day
standard
deviationofthedailylog-returns.In
additionto
theaforementioned
controlvariables,wewilltest
theim
pact
ofinsider
transactions,usingthenumber
ofbuyandselltransactionsperform
edbyinsidersonthatday.Thespeci�cations
(5.29.1)to
(5.29.5)representthe5dayst
=[1
;5]follow
ingtheinsider
transaction.Thistableshow
stheaverageestimatedcoe�
cients,
withthet-statisticsreported
inparentheses
below
theircorrespondingestimatedcoe�
cients,andtheadjusted
R2values
are
presented
below
theircorrespondingmodels.
(5.29.1)
(5.29.2)
(5.29.3)
(5.29.4)
(5.29.5)
Price
(log)
-0.0814∗∗
0.0908∗∗
-0.0264
0.0940∗∗
0.236∗∗
∗
(-2.06)
(2.37)
(-0.67)
(2.37)
(6.07)
Traded
volume(log)
-0.119∗∗
∗-0.0426∗∗
∗-0.0126∗∗
0.0214∗∗
∗0.0142∗∗
(-18.84)
(-6.90)
(-2.00)
(3.37)
(2.27)
Market
cap(log)
0.0518
-0.0852∗∗
0.000381
-0.114∗∗
∗-0.198∗∗
∗
(1.33)
(-2.25)
(0.01)
(-2.92)
(-5.14)
Standard
deviationofdailylog-returns(5
days)
0.186∗∗
∗0.144∗∗
∗0.0442∗∗
∗0.00279
0.0315∗∗
(13.81)
(10.95)
(3.27)
(0.21)
(2.36)
Insider
transaction(buy)
0.0141∗∗
∗0.0151∗∗
∗-0.000728
0.00784∗
0.00836∗∗
(3.40)
(3.72)
(-0.17)
(1.87)
(2.04)
Insider
transaction(sell)
-0.0399∗∗
∗-0.00264
-0.0207∗∗
∗-0.0160∗∗
∗-0.00684
(-9.04)
(-0.61)
(-4.67)
(-3.61)
(-1.56)
Constant
0.433∗∗
0.484∗∗
∗0.126
0.407∗
∗0.632∗∗
∗
(2.49)
(2.86)
(0.73)
(2.32)
(3.67)
Observations
42398
42222
42088
42062
41962
Adjusted
R2
-0.038
-0.048
-0.051
-0.051
-0.051
F92.57
27.04
7.338
7.622
9.647
tstatisticsin
parentheses
∗p<
0.1
0,∗∗p<
0.0
5,∗∗
∗p<
0.01
170
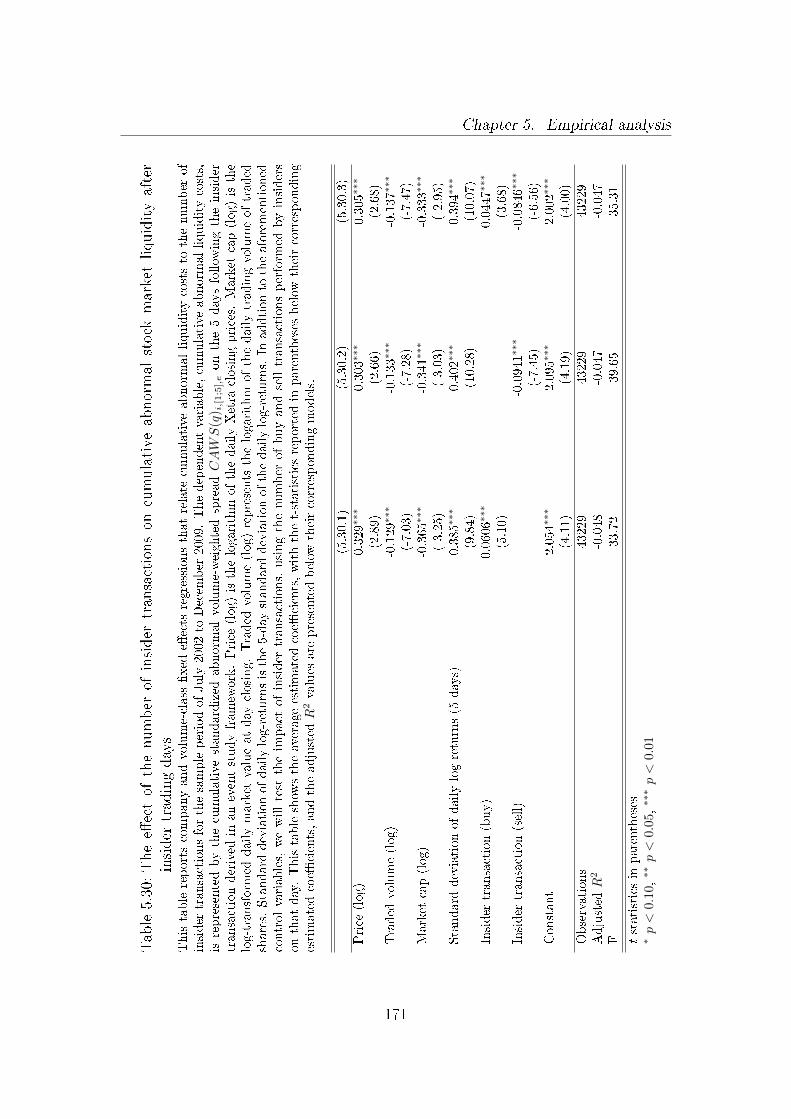
Chapter 5. Empirical analysis
Table5.30:Thee�ectof
thenumber
ofinsider
transactionson
cumulative
abnormal
stock
marketliquidityafter
insider
tradingdays
Thistablereportscompanyandvolume-class
�xed
e�ects
regressionsthatrelate
cumulativeabnorm
alliquiditycoststo
thenumber
of
insider
transactionsforthesampleperiodofJuly
2002to
Decem
ber
2009.Thedependentvariable,cumulative
abnorm
alliquiditycosts,
isrepresentedbythecumulative
standardized
abnorm
alvolume-weightedspreadCAWS
(q) i,[1;5],eonthe5daysfollow
ingtheinsider
transactionderived
inaneventstudyframew
ork.Price
(log)isthelogarithm
ofthedailyXetra
closingprices.
Market
cap(log)
isthe
log-transform
eddailymarket
valueatday
closing.Traded
volume(log)represents
thelogarithm
ofthedailytradingvolumeoftraded
shares.Standard
deviationofdailylog-returnsisthe5-day
standard
deviationofthedailylog-returns.In
addtionto
theaforementioned
controlvariables,wewilltest
theim
pact
ofinsider
transactions,usingthenumber
ofbuyandselltransactionsperform
edbyinsiders
onthatday.Thistableshow
stheaverageestimatedcoe�
cients,withthet-statisticsreported
inparentheses
below
theircorresponding
estimatedcoe�
cients,andtheadjusted
R2values
are
presentedbelow
theircorrespondingmodels.
(5.30.1)
(5.30.2)
(5.30.3)
Price
(log)
0.329∗∗
∗0.303∗∗
∗0.305∗∗
∗
(2.89)
(2.66)
(2.68)
Traded
volume(log)
-0.129∗∗
∗-0.133∗∗
∗-0.137∗∗
∗
(-7.03)
(-7.28)
(-7.47)
Market
cap(log)
-0.365
∗∗∗
-0.341∗∗
∗-0.333∗∗
∗
(-3.25)
(-3.03)
(-2.95)
Standard
deviationofdailylog-returns(5
days)
0.385∗∗
∗0.402∗∗
∗0.394∗∗
∗
(9.84)
(10.28)
(10.07)
Insider
transaction(buy)
0.0606∗
∗∗0.0447∗∗
∗
(5.10)
(3.68)
Insider
transaction(sell)
-0.0941∗∗
∗-0.0846∗∗
∗
(-7.45)
(-6.56)
Constant
2.054∗∗
∗2.095∗∗
∗2.002∗∗
∗
(4.11)
(4.19)
(4.00)
Observations
43229
43229
43229
Adjusted
R2
-0.048
-0.047
-0.047
F33.72
39.65
35.31
tstatisticsin
parentheses
∗p<
0.1
0,∗∗p<
0.0
5,∗∗
∗p<
0.01
171
Chapter 5. Empirical analysis
transactions on market liquidity.
5.3.2 Panel data analysis for the impact of insider trading
on market liquidity
For our panel-data regression analysis on the impact of insider transactions on
market liquidity, we once again use the log-log speci�cation (5.1) as a basis and a
company and volume-class143 �xed e�ects model144 for the estimation.
5.3.2.1 Market liquidity on the day of the insider transaction
First, we analyze the e�ect of an insider transaction on the day of the transac-
tion. We expect that insider transactions have a di�erent impact on stock market
liquidity depending on the type of the transaction, e.g., either a sell or buy trans-
action. Initially, we verify our hypothesis by adding the log-transformed size of
total volume transacted by insiders on a particular day (measured as the number
of traded shares) for buy and sell transactions individually (see models 5.31.1 and
5.31.2, respectively) and then together (see model 5.31.3) to the standard set of
control variables.
Table 5.31 presents the results for this set of regressions. First and foremost,
we can observe that the estimates of the coe�cients for the control variables price
level, market capitalization, volume and return volatility are signi�cant, have the
correct signs and are, as expected, consistent with results reported in previous
studies. Liquidity costs, in accord with our �ndings in subsection 5.1.1.2, are
therefore a decreasing function of price level, market capitalization and trading
143 The volume class q is an inherent characteristic of our order-size-dependent liquidity costsmeasure.
144 The Hausman (1978) test statistic supports the usage of a �xed e�ects model instead of arandom e�ects model.
172
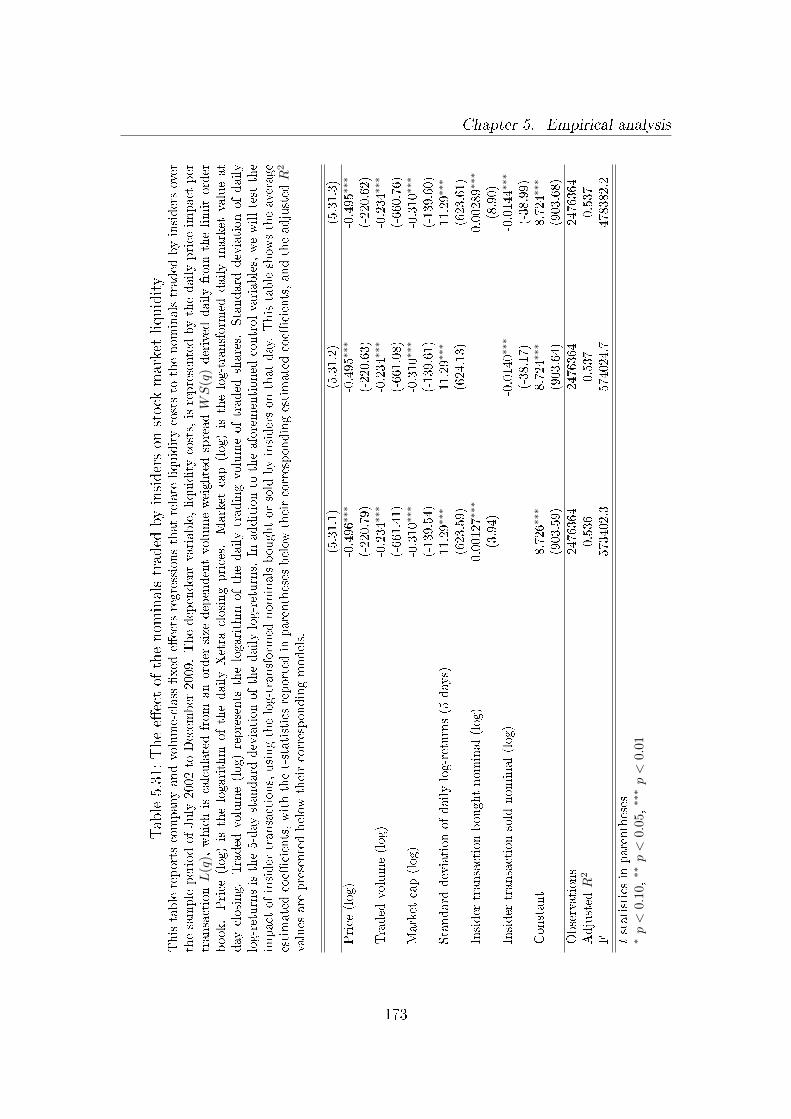
Chapter 5. Empirical analysis
Table5.31:Thee�ectof
thenom
inalstraded
byinsiderson
stock
marketliquidity
Thistablereportscompanyandvolume-class
�xed
e�ects
regressionsthatrelate
liquiditycoststo
thenominalstraded
byinsidersover
thesampleperiodofJuly
2002to
Decem
ber
2009.Thedependentvariable,liquiditycosts,isrepresentedbythedailyprice
impact
per
transactionL
(q),whichiscalculatedfrom
anorder-size-dependentvolume-weightedspreadWS
(q)derived
dailyfrom
thelimitorder
book.Price
(log)is
thelogarithm
ofthedailyXetra
closingprices.
Market
cap(log)is
thelog-transform
eddailymarket
valueat
day
closing.Traded
volume(log)represents
thelogarithm
ofthedailytradingvolumeoftraded
shares.
Standard
deviationofdaily
log-returnsisthe5-day
standard
deviationofthedailylog-returns.
Inadditionto
theaforementioned
controlvariables,wewilltest
the
impact
ofinsider
transactions,usingthelog-transform
ednominalsboughtorsold
byinsidersonthatday.Thistableshow
stheaverage
estimatedcoe�
cients,withthet-statisticsreported
inparentheses
below
theircorrespondingestimatedcoe�
cients,andtheadjusted
R2
values
are
presentedbelow
theircorrespondingmodels.
(5.31.1)
(5.31.2)
(5.31.3)
Price
(log)
-0.496∗∗
∗-0.495∗∗
∗-0.495∗∗
∗
(-220.79)
(-220.63)
(-220.62)
Traded
volume(log)
-0.234∗∗
∗-0.234∗∗
∗-0.234∗∗
∗
(-661.41)
(-661.08)
(-660.76)
Market
cap(log)
-0.310∗∗
∗-0.310∗∗
∗-0.310∗∗
∗
(-139.54)
(-139.61)
(-139.60)
Standard
deviationofdailylog-returns(5
days)
11.29∗∗
∗11.29∗∗
∗11.29∗∗
∗
(623.59)
(624.13)
(623.61)
Insider
transactionboughtnominal(log)
0.00127∗∗
∗0.00289∗∗
∗
(3.94)
(8.90)
Insider
transactionsold
nominal(log)
-0.0140∗∗
∗-0.0144∗∗
∗
(-38.17)
(-38.99)
Constant
8.726∗∗
∗8.724∗∗
∗8.724∗∗
∗
(903.59)
(903.64)
(903.68)
Observations
2476364
2476364
2476364
Adjusted
R2
0.536
0.537
0.537
F573402.3
574024.7
478382.2
tstatisticsin
parentheses
∗p<
0.1
0,∗∗p<
0.0
5,∗∗
∗p<
0.01
173
Chapter 5. Empirical analysis
volume. By contrast, greater return volatility, which is a proxy for the general
market conditions and risks, increases liquidity costs.
We also observe that the inclusion of the total volume bought by insiders sup-
port our information asymmetry hypothesis. Model (5.31.1) shows that liquidity
costs, represented by the log-transformed half of our order-size-dependent volume-
weighted spread measure, increase with the number of shares bought by insiders.
Thus, stock market liquidity is impaired by insider purchases, as insiders have
access to private, value-relevant information and in response, other market par-
ticipants increase the spreads to cover potential losses to these informed traders.
This is consistent with Lakonishok and Lee (2001), who showed that the infor-
mativeness of insider activities derives from insider purchases. The increase in
the spread should be maintained as long as insiders hold their position, as our
research on the impact of insider ownership on market liquidity showed that in-
sider ownership impairs market liquidity. This occurs due to the same information
asymmetry problem (see section 5.2), as other uninformed market participants wil
continue to use the level of insider holdings as a measure of information asymme-
try145. As a logical consequence, we should be able to see a positive impact on
market liquidity immediately after the sale of an insider position, as this decreases
the share of insider ownership and therefore the share of informed shareholders.
Indeed, model (5.31.2) shows that an insider sale leads to a signi�cant reduction
in liquidity costs and therefore to an improved market liquidity on the day of
the insider transaction. Later in this dissertation, we will determine whether this
reduction persists on the days following the insider sale. The results also remain
stable if we add both variables for insider purchases and sales to the model at the
same time; indeed, in this case, the results are even more pronounced and signi�-
145 See, e.g., Chiang and Venkatesh (1988).
174
Chapter 5. Empirical analysis
cant (see model 5.31.3). All results, however, are signi�cant at the 1% signi�cance
level.
We now analyze the same situation, but instead of using total volume trans-
acted by insiders, we now add the number of insider transactions on a particular
day as a proxy for insider trading activity. As before, we are able to distinguish
between purchases and sales by insiders. Not surprisingly, the results are similar
as before: The asset's liquidity is signi�cantly impaired by the number of insider-
initiated buy transactions (see speci�cation 5.32.1), and the market liquidity is
again improved once the insiders leave that particular stock by selling their shares,
as measured by the number of individual insider sales (see speci�cation 5.32.2).
Additionally, speci�cation (5.32.3), which includes both the number of insider pur-
chases and sales, again displays results that are more pronounced and signi�cant.
Therefore, the results are also robust for another proxy of insider trading activity,
particularly as all results are signi�cant at the 1% signi�cance level.
As a third analysis of the day of the insider transaction, we test the impact of
an insider transaction on market liquidity using a ratio that relates the nominals
bought or sold by insiders on that day to the total nominals owned by insiders146.
We use this ratio because we assume that the perceived impact on the information
asymmetry problem induced by an insider transaction is greater if insiders transact
larger portions of their shareholdings. The results, as reported in Table 5.33, also
reveal that the market liquidity is signi�cantly impaired by insider purchases,
while insider sales once again improve market liquidity. Therefore, these results
146 For those insider purchases where we do not have any information on the insider holdings(either because there actually were no insider holdings at the end of the year or becausethe insider holdings were too small to be reported among the 12 largest shareholders inHoppenstedt �Aktienführer�), we impute the average sample ratio. For insider sales, wepresume that all shares were sold in this insider transaction, if there is no insider holdingremaining at the end of the year.
175

Chapter 5. Empirical analysis
Table5.32:Thee�ectof
thenumber
ofinsider
transactionson
stock
marketliquidity
Thistablereportscompanyandvolume-class
�xed
e�ectsregressionsthatrelate
liquiditycoststo
thenumber
ofinsider
transactionsfor
thesampleperiodofJuly
2002to
Decem
ber
2009.Thedependentvariable,liquiditycosts,isrepresentedbythedailyprice
impact
per
transactionL
(q),whichiscalculatedfrom
anorder-size-dependentvolume-weightedspreadWS
(q)derived
dailyfrom
thelimitorder
book.Price
(log)is
thelogarithm
ofthedailyXetra
closingprices.
Market
cap(log)is
thelog-transform
eddailymarket
valueat
day
closing.Traded
volume(log)represents
thelogarithm
ofthedailytradingvolumeoftraded
shares.
Standard
deviationofdaily
log-returnsisthe5-day
standard
deviationofthedailylog-returns.
Inadditionto
theaforem
entioned
controlvariables,
wewilltest
theim
pact
ofinsider
transactions,usingthenumber
ofbuyandselltransactionsperform
edbyinsidersonthatday.Thistableshow
stheaverageestimatedcoe�
cients,withthet-statisticsreported
inparentheses
below
theircorrespondingestimatedcoe�
cients,andthe
adjusted
R2values
are
presentedbelow
theircorrespondingmodels.
(5.32.1)
(5.32.2)
(5.32.3)
Price
(log)
-0.496∗
∗∗-0.496∗∗
∗-0.496∗∗
∗
(-220.81)
(-220.76)
(-220.79)
Traded
volume(log)
-0.234∗∗
∗-0.234∗∗
∗-0.234∗∗
∗
(-661.70)
(-661.69)
(-661.51)
Market
cap(log)
-0.310∗∗
∗-0.310∗∗
∗-0.310∗∗
∗
(-139.53)
(-139.52)
(-139.50)
Standard
deviationofdailylog-returns(5
days)
11.29∗
∗∗11.30∗∗
∗11.29∗∗
∗
(623.67)
(624.46)
(624.11)
Insider
transaction(buy)
0.00702∗∗
∗0.0121∗∗
∗
(4.95)
(8.50)
Insider
transaction(sell)
-0.0555∗
∗∗-0.0569∗∗
∗
(-33.68)
(-34.38)
Constant
8.726∗∗
∗8.724∗∗
∗8.724∗∗
∗
(903.60)
(903.59)
(903.62)
Observations
2476364
2476364
2476364
Adjusted
R2
0.536
0.537
0.537
F573406.2
573885.3
478263.6
tstatisticsin
parentheses
∗p<
0.1
0,∗∗p<
0.0
5,∗∗
∗p<
0.01
176

Chapter 5. Empirical analysis
also support our earlier �ndings regarding the day of the insider transaction. All
results are again signi�cant at the 1% signi�cance level.
177
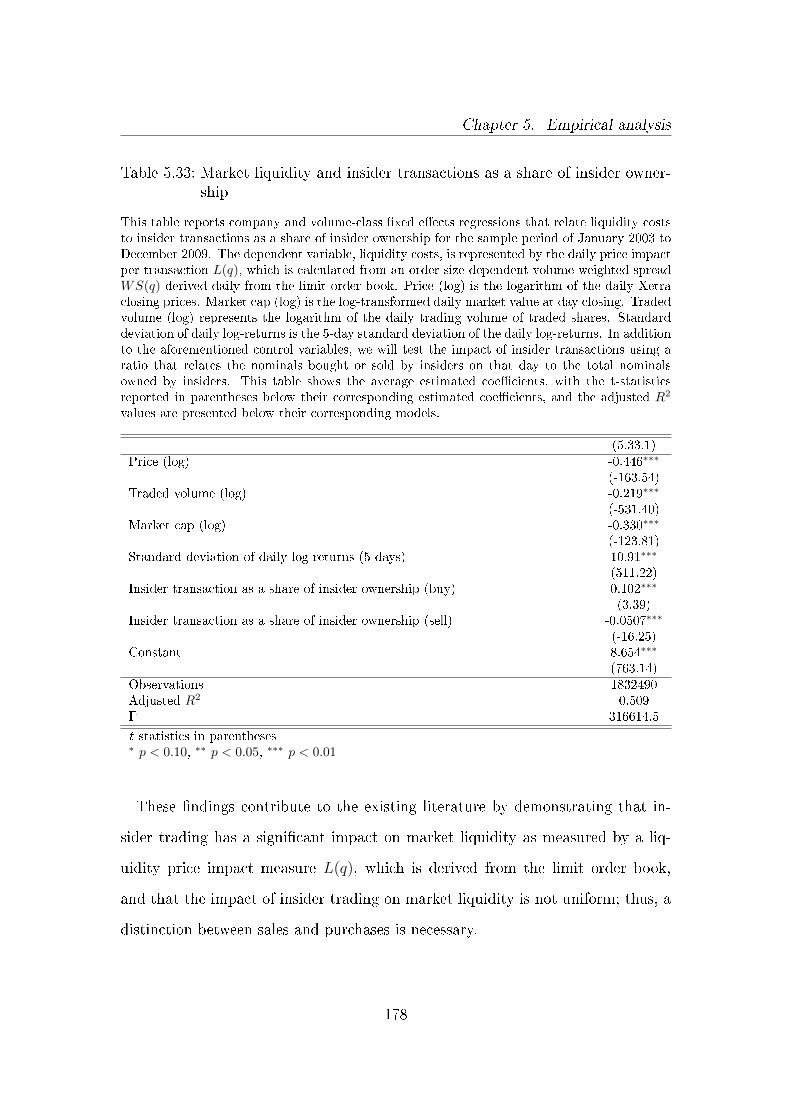
Chapter 5. Empirical analysis
Table 5.33: Market liquidity and insider transactions as a share of insider owner-ship
This table reports company and volume-class �xed e�ects regressions that relate liquidity coststo insider transactions as a share of insider ownership for the sample period of January 2003 toDecember 2009. The dependent variable, liquidity costs, is represented by the daily price impactper transaction L(q), which is calculated from an order-size-dependent volume-weighted spreadWS(q) derived daily from the limit order book. Price (log) is the logarithm of the daily Xetraclosing prices. Market cap (log) is the log-transformed daily market value at day closing. Tradedvolume (log) represents the logarithm of the daily trading volume of traded shares. Standarddeviation of daily log-returns is the 5-day standard deviation of the daily log-returns. In additionto the aforementioned control variables, we will test the impact of insider transactions using aratio that relates the nominals bought or sold by insiders on that day to the total nominalsowned by insiders. This table shows the average estimated coe�cients, with the t-statisticsreported in parentheses below their corresponding estimated coe�cients, and the adjusted R2
values are presented below their corresponding models.
(5.33.1)Price (log) -0.446∗∗∗
(-163.54)Traded volume (log) -0.219∗∗∗
(-531.40)Market cap (log) -0.330∗∗∗
(-123.81)Standard deviation of daily log-returns (5 days) 10.91∗∗∗
(511.22)Insider transaction as a share of insider ownership (buy) 0.102∗∗∗
(3.39)Insider transaction as a share of insider ownership (sell) -0.0507∗∗∗
(-16.25)Constant 8.654∗∗∗
(763.14)Observations 1832490Adjusted R2 0.509F 316614.5
t statistics in parentheses∗ p < 0.10, ∗∗ p < 0.05, ∗∗∗ p < 0.01
These �ndings contribute to the existing literature by demonstrating that in-
sider trading has a signi�cant impact on market liquidity as measured by a liq-
uidity price impact measure L(q), which is derived from the limit order book,
and that the impact of insider trading on market liquidity is not uniform; thus, a
distinction between sales and purchases is necessary.
178
Chapter 5. Empirical analysis
5.3.2.2 Market liquidity and the di�erent types of insiders on the day of
the insider transaction
In the previous section, we found evidence that insider trading signi�cantly im-
pacts stock market liquidity. However, we have the additional hypothesis that
access to private or value-relevant information is not uniformly distributed across
all types of insiders, causing di�erent insider types to have di�erent impacts on
stock market liquidity. Therefore, we further scrutinize both buy and sell trans-
actions for three mutually exclusive insider types: members of the management
board, members of the supervisory board and other employees.
Table 5.34 shows the results of a speci�cation that consists of the reference
speci�cation (5.1) and separate variables for the log-transformed daily trading
volume of members of the management board, members of the supervisory board
and other employees. We note that purchases initiated by members of the man-
agement board have the worst impact on market liquidity, as the market views
members of the management board as the best-informed insiders. In addtion,
shares bought by members of the supervisory board signi�cantly impair the stock
market liquidity, as one would expect given that supervisory board members also
have access to price-sensitive information. However, in contrast to members of
either the management board or the supervisory board, the shares traded by other
employees improve the market liquidity. Thus, uninformed market participants
assume that other employees do not have access to private information and there-
fore their trading activity generates additional liquidity.
We repeat the same analysis for insider sales. As uninformed market partici-
pants use the share of insider ownership as a proxy for the level of information
asymmetry in a particular stock among others, we would expect a market liq-
179

Chapter 5. Empirical analysis
Table 5.34: The e�ect of buy transactions from di�erent types of insiders on stockmarket liquidity
This table reports company and volume-class �xed e�ects regressions that relate liquidity coststo the number of insider buy transactions from di�erent types of insiders over the sample periodof July 2002 to December 2009. The dependent variable, liquidity costs, is represented bythe daily price impact per transaction L(q), which is calculated from an order-size-dependentvolume-weighted spread WS(q) derived daily from the limit order book. Price (log) is thelogarithm of the daily Xetra closing prices. Market cap (log) is the log-transformed daily marketvalue at day closing. Traded volume (log) represents the logarithm of the daily trading volumeof traded shares. Standard deviation of daily log-returns is the 5-day standard deviation of thedaily log-returns. In addition to the aforementioned control variables, we will test the impactof the number of insider buy transactions from the following insider types: management board,supervisory board and other employees. This table shows the average estimated coe�cients,with the t-statistics reported in parentheses below their corresponding estimated coe�cients,and the adjusted R2 values are presented below their corresponding models.
(5.34.1)Price (log) -0.748∗∗∗
(-41.14)Traded volume (log) -0.209∗∗∗
(-68.64)Market cap (log) -0.178∗∗∗
(-9.94)Standard deviation of daily log-returns (5 days) 7.190∗∗∗
(69.60)Insider transaction (buy) - Management board 0.0354∗∗∗
(13.94)Insider transaction (buy) - Supervisory board 0.00784∗∗∗
(2.67)Insider transaction (buy) - Other employees -0.0430∗∗∗
(-5.20)Constant 8.467∗∗∗
(105.90)Observations 44502Adjusted R2 0.469F 5918.4
t statistics in parentheses∗ p < 0.10, ∗∗ p < 0.05, ∗∗∗ p < 0.01
180
Chapter 5. Empirical analysis
uidity improvement for all types of insiders on the day of the insider sale. This
hypothesis is supported by the results presented in Table 5.35, which shows a stock
market liquidity enhancement for all types of insiders on the day of the insider
transaction. This stock market liquidity improvement can further be attributed
to the �ndings of Lakonishok and Lee (2001), who showed that insider sales have
no predictive ability. All results are signi�cant at the 1% signi�cance level.
181
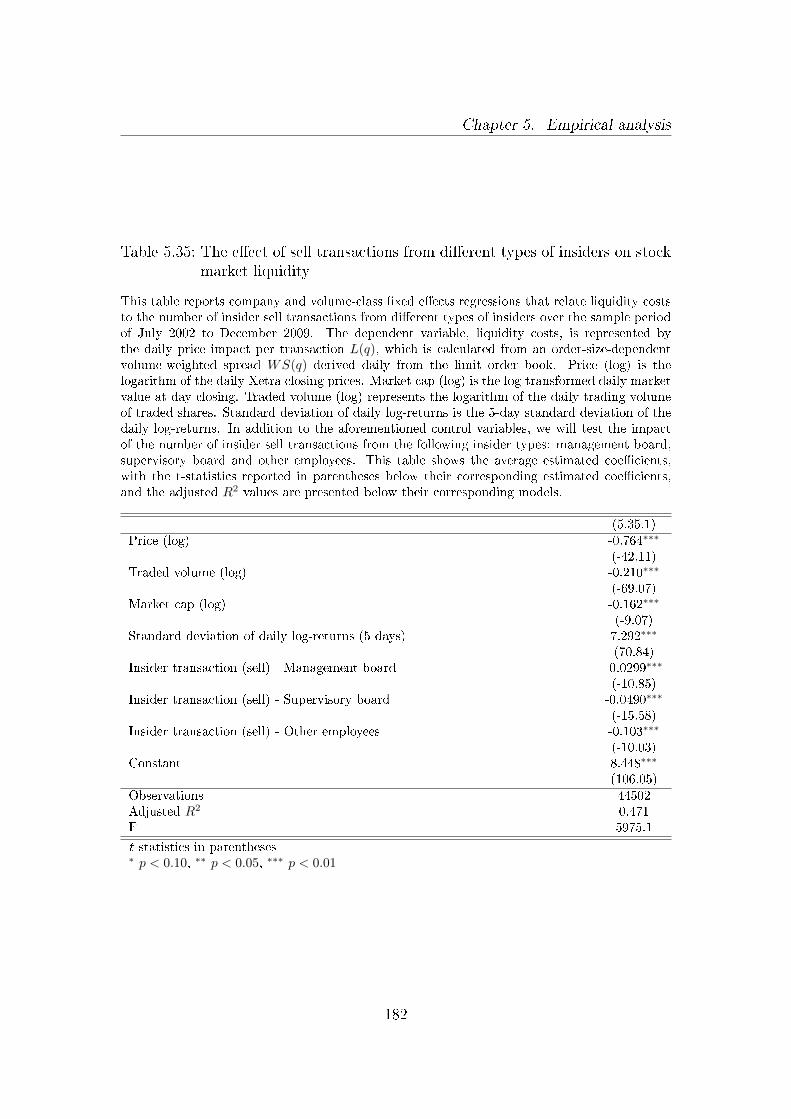
Chapter 5. Empirical analysis
Table 5.35: The e�ect of sell transactions from di�erent types of insiders on stockmarket liquidity
This table reports company and volume-class �xed e�ects regressions that relate liquidity coststo the number of insider sell transactions from di�erent types of insiders over the sample periodof July 2002 to December 2009. The dependent variable, liquidity costs, is represented bythe daily price impact per transaction L(q), which is calculated from an order-size-dependentvolume-weighted spread WS(q) derived daily from the limit order book. Price (log) is thelogarithm of the daily Xetra closing prices. Market cap (log) is the log-transformed daily marketvalue at day closing. Traded volume (log) represents the logarithm of the daily trading volumeof traded shares. Standard deviation of daily log-returns is the 5-day standard deviation of thedaily log-returns. In addition to the aforementioned control variables, we will test the impactof the number of insider sell transactions from the following insider types: management board,supervisory board and other employees. This table shows the average estimated coe�cients,with the t-statistics reported in parentheses below their corresponding estimated coe�cients,and the adjusted R2 values are presented below their corresponding models.
(5.35.1)Price (log) -0.764∗∗∗
(-42.11)Traded volume (log) -0.210∗∗∗
(-69.07)Market cap (log) -0.162∗∗∗
(-9.07)Standard deviation of daily log-returns (5 days) 7.292∗∗∗
(70.84)Insider transaction (sell) - Management board -0.0299∗∗∗
(-10.85)Insider transaction (sell) - Supervisory board -0.0490∗∗∗
(-15.58)Insider transaction (sell) - Other employees -0.103∗∗∗
(-10.03)Constant 8.448∗∗∗
(106.05)Observations 44502Adjusted R2 0.471F 5975.1
t statistics in parentheses∗ p < 0.10, ∗∗ p < 0.05, ∗∗∗ p < 0.01
182
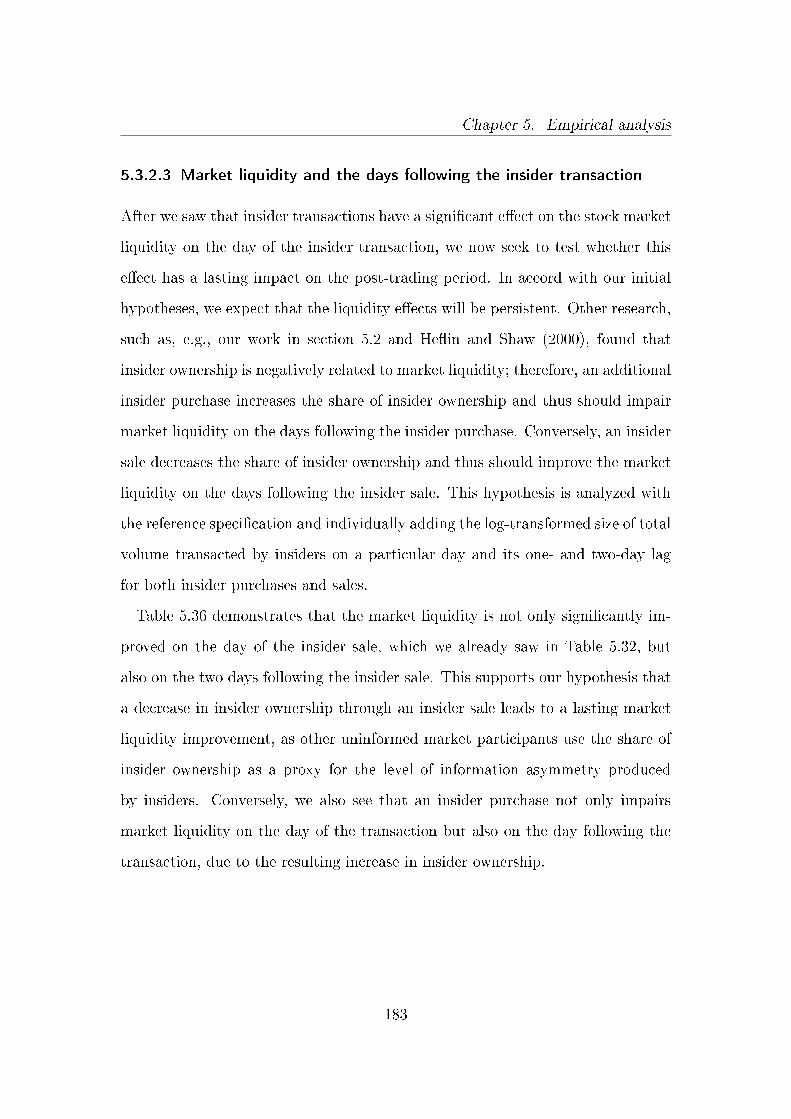
Chapter 5. Empirical analysis
5.3.2.3 Market liquidity and the days following the insider transaction
After we saw that insider transactions have a signi�cant e�ect on the stock market
liquidity on the day of the insider transaction, we now seek to test whether this
e�ect has a lasting impact on the post-trading period. In accord with our initial
hypotheses, we expect that the liquidity e�ects will be persistent. Other research,
such as, e.g., our work in section 5.2 and He�in and Shaw (2000), found that
insider ownership is negatively related to market liquidity; therefore, an additional
insider purchase increases the share of insider ownership and thus should impair
market liquidity on the days following the insider purchase. Conversely, an insider
sale decreases the share of insider ownership and thus should improve the market
liquidity on the days following the insider sale. This hypothesis is analyzed with
the reference speci�cation and individually adding the log-transformed size of total
volume transacted by insiders on a particular day and its one- and two-day lag
for both insider purchases and sales.
Table 5.36 demonstrates that the market liquidity is not only signi�cantly im-
proved on the day of the insider sale, which we already saw in Table 5.32, but
also on the two days following the insider sale. This supports our hypothesis that
a decrease in insider ownership through an insider sale leads to a lasting market
liquidity improvement, as other uninformed market participants use the share of
insider ownership as a proxy for the level of information asymmetry produced
by insiders. Conversely, we also see that an insider purchase not only impairs
market liquidity on the day of the transaction but also on the day following the
transaction, due to the resulting increase in insider ownership.
183
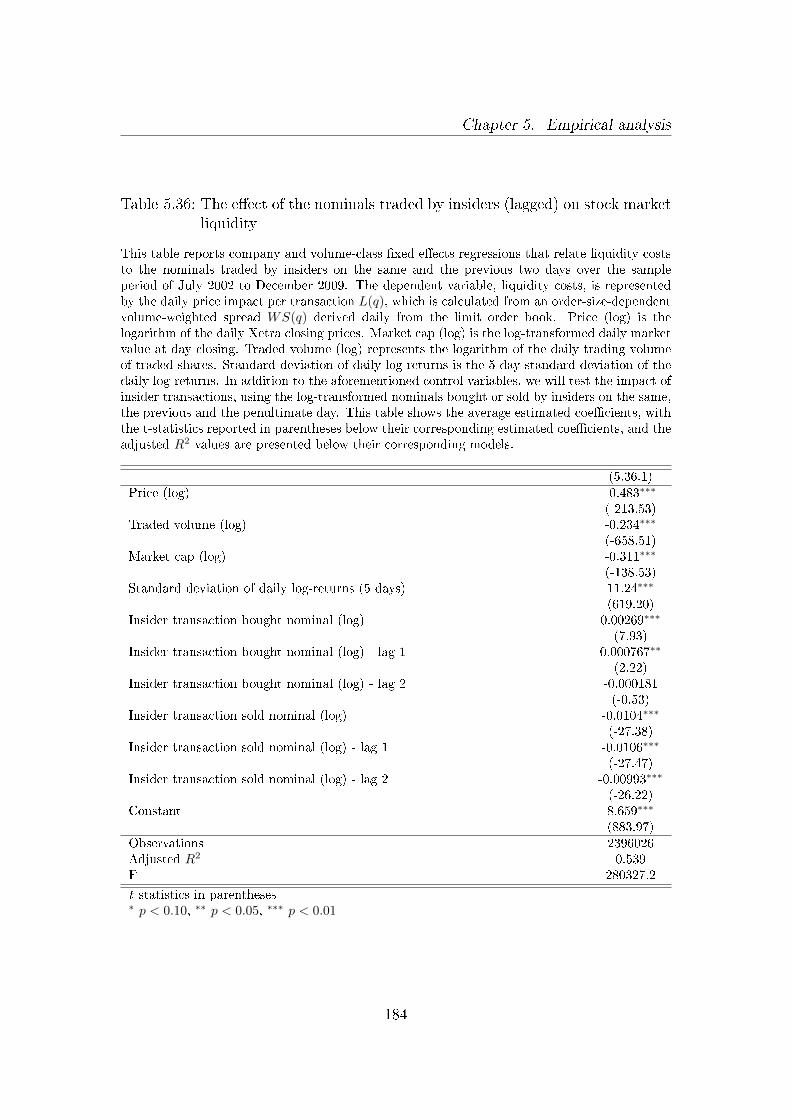
Chapter 5. Empirical analysis
Table 5.36: The e�ect of the nominals traded by insiders (lagged) on stock marketliquidity
This table reports company and volume-class �xed e�ects regressions that relate liquidity coststo the nominals traded by insiders on the same and the previous two days over the sampleperiod of July 2002 to December 2009. The dependent variable, liquidity costs, is representedby the daily price impact per transaction L(q), which is calculated from an order-size-dependentvolume-weighted spread WS(q) derived daily from the limit order book. Price (log) is thelogarithm of the daily Xetra closing prices. Market cap (log) is the log-transformed daily marketvalue at day closing. Traded volume (log) represents the logarithm of the daily trading volumeof traded shares. Standard deviation of daily log-returns is the 5-day standard deviation of thedaily log-returns. In addition to the aforementioned control variables, we will test the impact ofinsider transactions, using the log-transformed nominals bought or sold by insiders on the same,the previous and the penultimate day. This table shows the average estimated coe�cients, withthe t-statistics reported in parentheses below their corresponding estimated coe�cients, and theadjusted R2 values are presented below their corresponding models.
(5.36.1)Price (log) -0.483∗∗∗
(-213.53)Traded volume (log) -0.234∗∗∗
(-658.51)Market cap (log) -0.311∗∗∗
(-138.53)Standard deviation of daily log-returns (5 days) 11.24∗∗∗
(619.20)Insider transaction bought nominal (log) 0.00269∗∗∗
(7.93)Insider transaction bought nominal (log) - lag 1 0.000767∗∗
(2.22)Insider transaction bought nominal (log) - lag 2 -0.000181
(-0.53)Insider transaction sold nominal (log) -0.0104∗∗∗
(-27.38)Insider transaction sold nominal (log) - lag 1 -0.0106∗∗∗
(-27.47)Insider transaction sold nominal (log) - lag 2 -0.00993∗∗∗
(-26.22)Constant 8.659∗∗∗
(883.97)Observations 2396026Adjusted R2 0.539F 280327.2
t statistics in parentheses∗ p < 0.10, ∗∗ p < 0.05, ∗∗∗ p < 0.01
184
Chapter 5. Empirical analysis
5.3.3 Robustness tests
If our hypothesis holds that market liquidity is impaired at and after insider pur-
chases and improved at and after insider sales because uninformed market par-
ticipants price protect against adverse selection and they use the share of insider
ownership as a proxy for the level of information asymmetry introduced by insid-
ers, several other expectations can be assessed. For instance, quasi-cross-sectional
analysis using yearly averages for insider transactions should reveal liquidity im-
pacts, as a higher number of average insider purchases should coincide with a
higher share of insider ownership in that year, whereas a higher number of aver-
age insider sales should lead to a decrease in the insider ownership. Hence, we also
expect that in our quasi-cross-sectional analysis, insider purchases have a delete-
rious e�ect on the market liquidity, whereas insider sales will improve the market
liquidity. To assess these expectation, we average all variables over one-year pe-
riods; in particular, we calculate the annual average number of insider purchases
and insider sales per year.
The results in Table 5.37 support our hypothesis, as average liquidity costs
signi�cantly increase with average number of insider purchases and signi�cantly
decrease with the average number of insider sales.147
We conduct a series of additional robustness tests148 and therefore re-estimate
the speci�cations of (5.31.3) and (5.32.3) for di�erent subsamples.
First, we create two subsamples with the volume class q of our order-size-
147 In addition, we also test a similar speci�cation with the log-transformed annual averageof nominals bought or sold by insiders instead of the annual average number of insiderpurchases and sales. The results are consistent with those reported in Table 5.37 and canbe found in the Appendix in Table C.1.
148 For the remaining robustness tests, we focus on the volume classes smaller than Euro 1million, as the volume classes larger than Euro 1 million are only represented in the DAXindex.
185
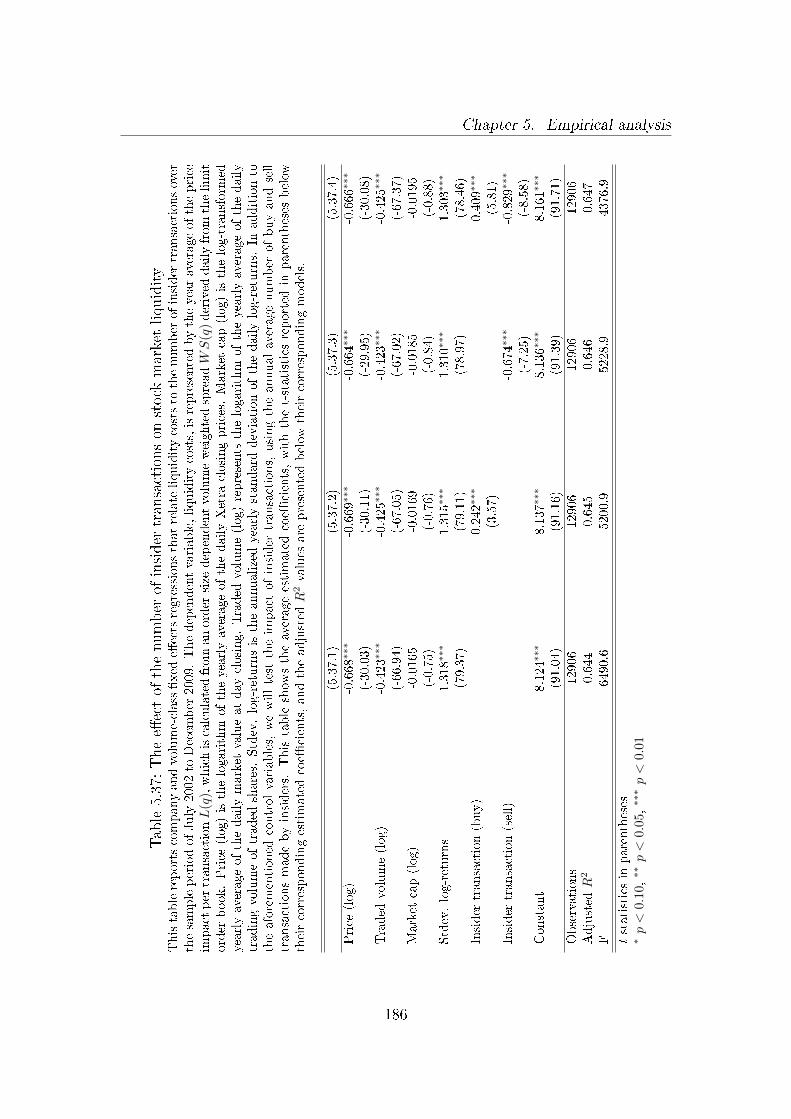
Chapter 5. Empirical analysis
Table5.37:Thee�ectof
thenumber
ofinsider
transactionson
stock
marketliquidity
Thistablereportscompanyandvolume-class�xed
e�ectsregressionsthatrelate
liquiditycoststo
thenumber
ofinsider
transactionsover
thesampleperiodofJuly2002to
Decem
ber
2009.Thedependentvariable,liquiditycosts,isrepresentedbytheyearaverageoftheprice
impactpertransactionL
(q),whichiscalculatedfroman
order-size-dependentvolume-weightedspreadWS
(q)derived
dailyfromthelimit
order
book.Price
(log)isthelogarithm
oftheyearlyaverageofthedailyXetra
closingprices.
Market
cap(log)isthelog-transform
edyearlyaverageofthedaily
market
valueatday
closing.Traded
volume(log)represents
thelogarithm
oftheyearlyaverageofthedaily
tradingvolumeoftraded
shares.
Stdev.log-returnsistheannualizedyearlystandard
deviationofthedailylog-returns.
Inadditionto
theaforementioned
controlvariables,wewilltest
theim
pact
ofinsider
transactions,usingtheannualaveragenumber
ofbuyandsell
transactionsmadebyinsiders.
Thistableshow
stheaverageestimatedcoe�
cients,withthet-statisticsreported
inparentheses
below
theircorrespondingestimatedcoe�
cients,andtheadjusted
R2values
are
presentedbelow
theircorrespondingmodels.
(5.37.1)
(5.37.2)
(5.37.3)
(5.37.4)
Price
(log)
-0.668∗∗
∗-0.669∗∗
∗-0.664∗∗
∗-0.666∗∗
∗
(-30.03)
(-30.11)
(-29.95)
(-30.08)
Traded
volume(log)
-0.423∗
∗∗-0.425∗∗
∗-0.423∗∗
∗-0.425∗∗
∗
(-66.94)
(-67.05)
(-67.02)
(-67.37)
Market
cap(log)
-0.0165
-0.0169
-0.0185
-0.0195
(-0.75)
(-0.76)
(-0.84)
(-0.88)
Stdev.log-returns
1.318∗∗
∗1.315∗∗
∗1.310∗∗
∗1.303∗∗
∗
(79.37)
(79.11)
(78.97)
(78.46)
Insider
transaction(buy)
0.242∗∗
∗0.409∗∗
∗
(3.57)
(5.81)
Insider
transaction(sell)
-0.674∗∗
∗-0.829∗∗
∗
(-7.25)
(-8.58)
Constant
8.124∗∗
∗8.137∗∗
∗8.136∗∗
∗8.161∗∗
∗
(91.04)
(91.16)
(91.39)
(91.71)
Observations
12906
12906
12906
12906
Adjusted
R2
0.644
0.645
0.646
0.647
F6490.6
5200.9
5228.9
4376.9
tstatisticsin
parentheses
∗p<
0.1
0,∗∗p<
0.0
5,∗∗
∗p<
0.01
186
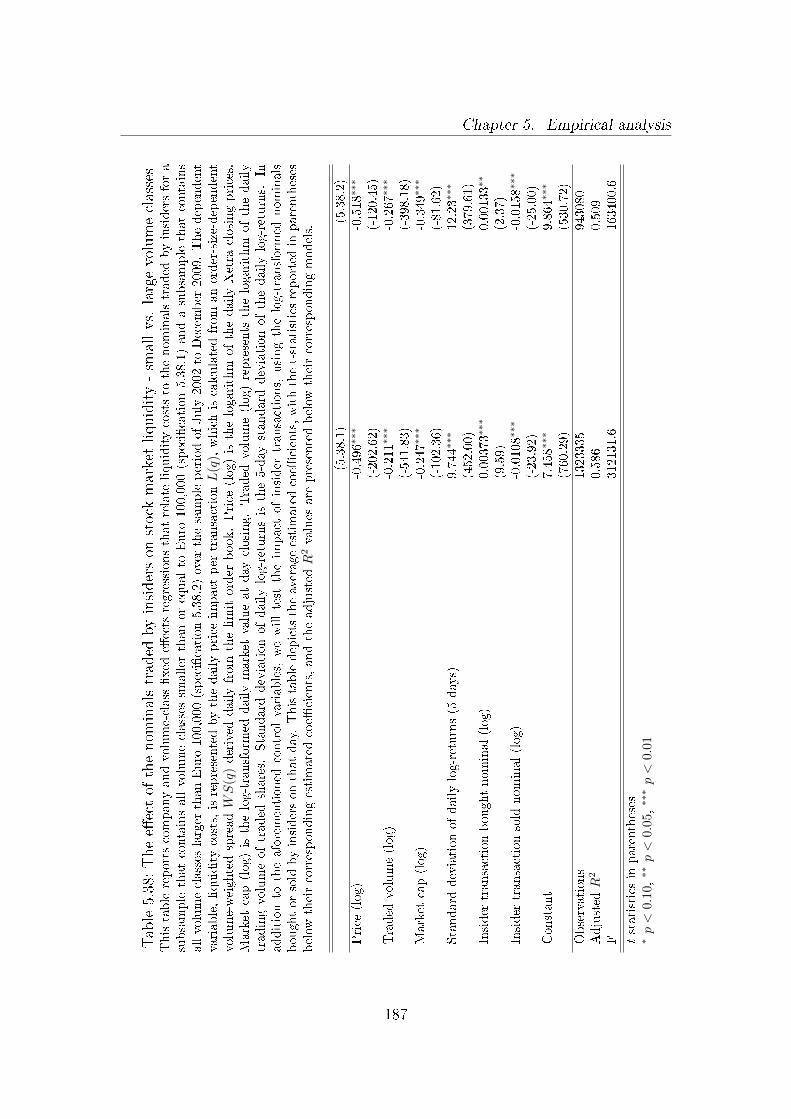
Chapter 5. Empirical analysis
Table5.38:Thee�ectof
thenom
inalstraded
byinsiderson
stock
marketliquidity-sm
allvs.
largevolumeclasses
Thistablereportscompanyandvolume-class
�xed
e�ects
regressionsthatrelate
liquiditycoststo
thenominalstraded
byinsidersfora
subsamplethatcontainsallvolumeclasses
smaller
thanorequalto
Euro
100,000(speci�cation5.38.1)andasubsamplethatcontains
allvolumeclasses
larger
thanEuro
100,000(speci�cation5.38.2)over
thesampleperiodofJuly
2002to
Decem
ber
2009.Thedependent
variable,liquiditycosts,isrepresentedbythedailyprice
impact
per
transactionL
(q),whichiscalculatedfrom
anorder-size-dependent
volume-weightedspreadWS
(q)derived
dailyfrom
thelimitorder
book.Price
(log)isthelogarithm
ofthedailyXetra
closingprices.
Market
cap(log)isthelog-transform
eddailymarket
valueatday
closing.Traded
volume(log)represents
thelogarithm
ofthedaily
tradingvolumeoftraded
shares.
Standard
deviationofdailylog-returnsisthe5-day
standard
deviationofthedailylog-returns.
Inadditionto
theaforementioned
controlvariables,
wewilltest
theim
pact
ofinsider
transactions,
usingthelog-transform
ednominals
boughtorsold
byinsidersonthatday.Thistabledepictstheaverageestimatedcoe�
cients,withthet-statisticsreported
inparentheses
below
theircorrespondingestimatedcoe�
cients,andtheadjusted
R2values
are
presentedbelow
theircorrespondingmodels.
(5.38.1)
(5.38.2)
Price
(log)
-0.496∗∗
∗-0.518∗∗
∗
(-202.62)
(-120.45)
Traded
volume(log)
-0.211∗∗
∗-0.267∗∗
∗
(-541.83)
(-398.18)
Market
cap(log)
-0.247∗∗
∗-0.349∗∗
∗
(-102.36)
(-81.62)
Standard
deviationofdailylog-returns(5
days)
9.744∗
∗∗12.23∗∗
∗
(452.00)
(379.61)
Insider
transactionboughtnominal(log)
0.00373∗
∗∗0.00133∗∗
(9.59)
(2.37)
Insider
transactionsold
nominal(log)
-0.0108∗∗
∗-0.0158∗∗
∗
(-23.92)
(-25.00)
Constant
7.458∗∗
∗9.864∗∗
∗
(760.29)
(530.72)
Observations
1323335
943080
Adjusted
R2
0.586
0.509
F312131.6
163400.6
tstatisticsin
parentheses
∗p<
0.1
0,∗∗p<
0.0
5,∗∗
∗p<
0.01
187
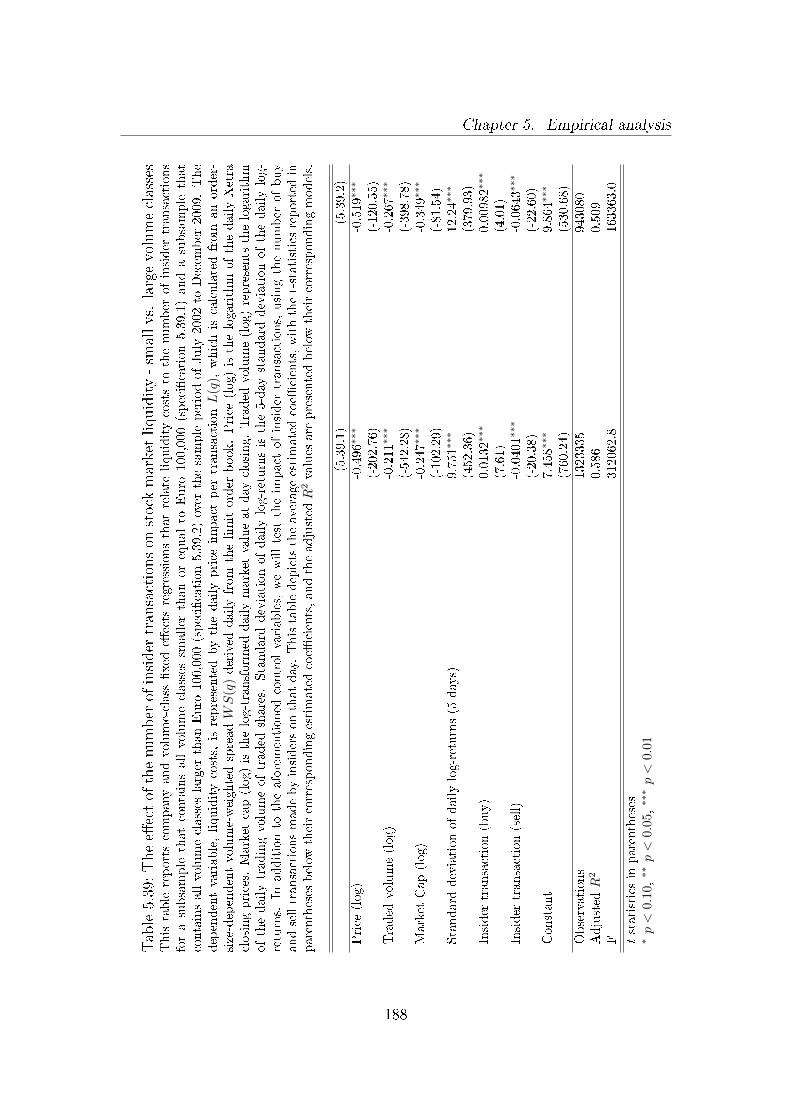
Chapter 5. Empirical analysis
Table5.39:Thee�ectofthenumber
ofinsider
transactionson
stock
marketliquidity-sm
allvs.largevolumeclasses
Thistable
reportscompanyandvolume-class
�xed
e�ects
regressionsthatrelate
liquiditycoststo
thenumber
ofinsider
transactions
forasubsample
thatcontainsallvolumeclasses
smaller
thanorequalto
Euro
100,000(speci�cation5.39.1)andasubsample
that
containsallvolumeclasses
larger
thanEuro
100,000(speci�cation5.39.2)over
thesampleperiodofJuly
2002to
Decem
ber
2009.The
dependentvariable,liquiditycosts,
isrepresentedbythedailyprice
impact
per
transactionL
(q),
whichiscalculatedfrom
anorder-
size-dependentvolume-weightedspreadWS
(q)derived
dailyfrom
thelimitorder
book.Price
(log)isthelogarithm
ofthedailyXetra
closingprices.
Market
cap(log)isthelog-transform
eddaily
market
valueatday
closing.Traded
volume(log)represents
thelogarithm
ofthedailytradingvolumeoftraded
shares.
Standard
deviationofdailylog-returnsisthe5-day
standard
deviationofthedailylog-
returns.
Inadditionto
theaforementioned
controlvariables,wewilltest
theim
pact
ofinsider
transactions,usingthenumber
ofbuy
andselltransactionsmadebyinsidersonthatday.Thistabledepictstheaverageestimatedcoe�
cients,withthet-statisticsreported
inparentheses
below
theircorrespondingestimatedcoe�
cients,andtheadjustedR
2values
are
presentedbelow
theircorrespondingmodels.
(5.39.1)
(5.39.2)
Price
(log)
-0.496∗∗
∗-0.519∗∗
∗
(-202.76)
(-120.55)
Traded
volume(log)
-0.211∗∗
∗-0.267∗∗
∗
(-542.28)
(-398.78)
Market
Cap(log)
-0.247∗
∗∗-0.349∗∗
∗
(-102.29)
(-81.54)
Standard
deviationofdailylog-returns(5
days)
9.751∗
∗∗12.24∗∗
∗
(452.36)
(379.93)
Insider
transaction(buy)
0.0132∗∗
∗0.00982∗∗
∗
(7.61)
(4.01)
Insider
transaction(sell)
-0.0401∗∗
∗-0.0643∗∗
∗
(-20.38)
(-22.60)
Constant
7.458∗∗
∗9.864∗∗
∗
(760.24)
(530.68)
Observations
1323335
943080
Adjusted
R2
0.586
0.509
F312062.8
163363.0
tstatisticsin
parentheses
∗p<
0.1
0,∗∗p<
0.0
5,∗∗
∗p<
0.01
188
Chapter 5. Empirical analysis
dependent volume-weighted liquidity cost measure L(q) as a split criterion. The
�rst subsample contains all volume classes q smaller than or equal to Euro 100,000,
whereas the second subsample consists of the �ve volume classes q which are larger
than Euro 100,000. Our results for impact of insider purchases and sales on market
liquidity remain robust for both the large and the small volume class subsamples.
Detailed results can be found in Table 5.38 and Table 5.39.
Second, we re-estimate the same regressions considering subsamples by index
a�liation. The �rst subsample consists of all companies listed in the SDAX or
the TecDAX, which are by de�nition smaller companies, whereas the second sub-
samples contains �rms from the two indices with the larger companies; namely,
the DAX and MDAX. For our SDAX and TecDAX subsample, all of our model
speci�cations remain highly signi�cant and robust. For the larger companies in
the second subsample, the results for the speci�cation, which includes the number
of insider transactions are also signi�cant, indicating that insider purchases im-
pair stock market liquidity, whereas insider sales improve market liquidity. Only
the speci�cation which includes the log-transformed volume transacted by insid-
ers report a liquidity improvement by insider purchases at the 5% signi�cance
level. However, the relationship between insider sales remains also robust for this
speci�cation at the 1% signi�cance level. Table 5.40 and Table 5.41 report more
detailed results.
Thus, we can conclude overall that our �ndings for the relationship between
insider transactions and market liquidity discussed in section 5.3.2 are robust.
189
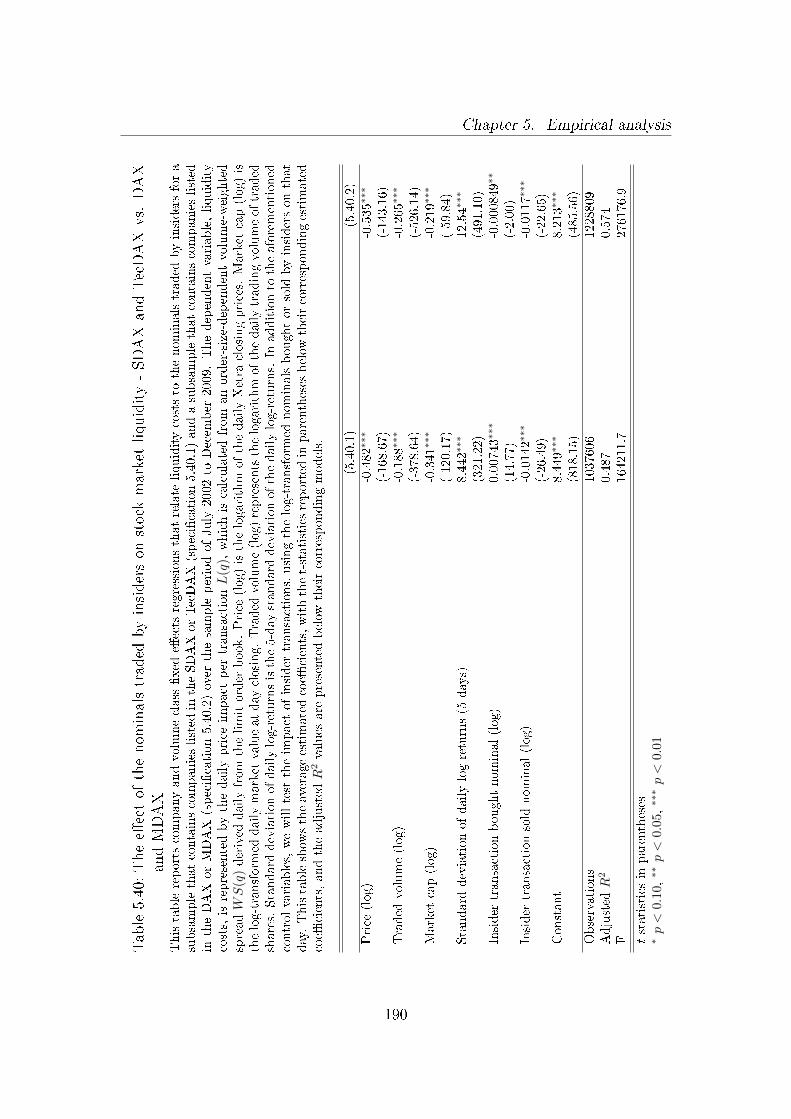
Chapter 5. Empirical analysisTable5.40:Thee�ectof
thenom
inalstraded
byinsiderson
stock
marketliquidity-SDAX
andTecDAX
vs.
DAX
andMDAX
Thistablereportscompanyandvolume-class
�xed
e�ects
regressionsthatrelate
liquiditycoststo
thenominalstraded
byinsidersfora
subsamplethatcontainscompanieslisted
intheSDAXorTecDAX(speci�cation
5.40.1)andasubsamplethatcontainscompanieslisted
intheDAX
orMDAX
(speci�cation5.40.2)over
thesampleperiodofJuly
2002to
Decem
ber
2009.Thedependentvariable,liquidity
costs,isrepresentedbythedailyprice
impact
per
transactionL
(q),whichiscalculatedfrom
anorder-size-dependentvolume-weighted
spreadWS
(q)derived
dailyfrom
thelimitorder
book.Price
(log)isthelogarithm
ofthedailyXetra
closingprices.
Market
cap(log)is
thelog-transform
eddailymarket
valueatday
closing.Traded
volume(log)representsthelogarithmofthedailytradingvolumeoftraded
shares.Standard
deviationofdailylog-returnsisthe5-day
standard
deviationofthedailylog-returns.In
additionto
theaforementioned
controlvariables,wewilltest
theim
pact
ofinsider
transactions,usingthelog-transform
ednominalsboughtorsold
byinsidersonthat
day.Thistableshow
stheaverageestimatedcoe�
cients,withthet-statisticsreported
inparentheses
below
theircorrespondingestimated
coe�
cients,andtheadjusted
R2values
are
presentedbelow
theircorrespondingmodels.
(5.40.1)
(5.40.2)
Price
(log)
-0.482∗∗
∗-0.535∗∗
∗
(-168.67)
(-143.16)
Traded
volume(log)
-0.188∗∗
∗-0.265∗∗
∗
(-378.64)
(-526.14)
Market
cap(log)
-0.341∗∗
∗-0.219∗∗
∗
(-120.17)
(-59.84)
Standard
deviationofdailylog-returns(5
days)
8.442∗
∗∗12.54∗∗
∗
(321.22)
(491.10)
Insider
transactionboughtnominal(log)
0.00743∗
∗∗-0.000849∗
∗
(14.77)
(-2.00)
Insider
transactionsold
nominal(log)
-0.0142∗∗
∗-0.0117∗∗
∗
(-26.49)
(-22.65)
Constant
8.449∗∗
∗8.213∗∗
∗
(818.15)
(485.56)
Observations
1037606
1228809
Adjusted
R2
0.487
0.574
F164211.7
276176.9
tstatisticsin
parentheses
∗p<
0.1
0,∗∗p<
0.0
5,∗∗
∗p<
0.01
190
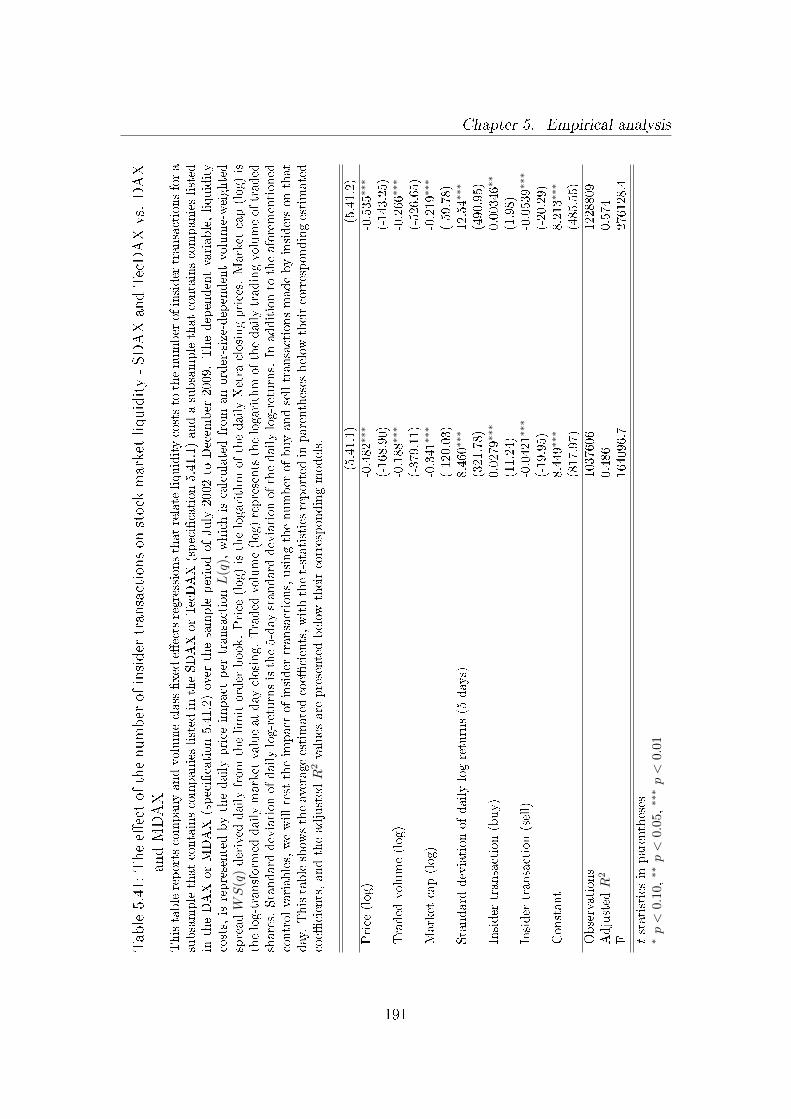
Chapter 5. Empirical analysisTable5.41:Thee�ectofthenumber
ofinsider
transactionson
stock
marketliquidity-SDAXandTecDAXvs.DAX
andMDAX
Thistablereportscompanyandvolume-class�xed
e�ectsregressionsthatrelate
liquiditycoststo
thenumber
ofinsider
transactionsfora
subsamplethatcontainscompanieslisted
intheSDAXorTecDAX(speci�cation
5.41.1)andasubsamplethatcontainscompanieslisted
intheDAX
orMDAX
(speci�cation5.41.2)over
thesampleperiodofJuly
2002to
Decem
ber
2009.Thedependentvariable,liquidity
costs,isrepresentedbythedailyprice
impact
per
transactionL
(q),whichiscalculatedfrom
anorder-size-dependentvolume-weighted
spreadWS
(q)derived
dailyfrom
thelimitorder
book.Price
(log)isthelogarithm
ofthedailyXetra
closingprices.
Market
cap(log)is
thelog-transform
eddailymarket
valueatday
closing.Traded
volume(log)representsthelogarithmofthedailytradingvolumeoftraded
shares.Standard
deviationofdailylog-returnsisthe5-day
standard
deviationofthedailylog-returns.In
additionto
theaforementioned
controlvariables,wewilltesttheim
pact
ofinsider
transactions,usingthenumber
ofbuyandselltransactionsmadebyinsidersonthat
day.Thistableshow
stheaverageestimatedcoe�
cients,withthet-statisticsreported
inparentheses
below
theircorrespondingestimated
coe�
cients,andtheadjusted
R2values
are
presentedbelow
theircorrespondingmodels.
(5.41.1)
(5.41.2)
Price
(log)
-0.482∗
∗∗-0.535∗∗
∗
(-168.90)
(-143.25)
Traded
volume(log)
-0.188∗∗
∗-0.266∗∗
∗
(-379.11)
(-526.65)
Market
cap(log)
-0.341∗
∗∗-0.219∗∗
∗
(-120.03)
(-59.78)
Standard
deviationofdailylog-returns(5
days)
8.460∗∗
∗12.54∗∗
∗
(321.78)
(490.95)
Insider
transaction(buy)
0.0279∗∗
∗0.00346∗∗
(11.24)
(1.98)
Insider
transaction(sell)
-0.0421∗∗
∗-0.0539∗∗
∗
(-19.95)
(-20.29)
Constant
8.449∗
∗∗8.213∗∗
∗
(817.97)
(485.55)
Observations
1037606
1228809
Adjusted
R2
0.486
0.574
F164096.7
276128.4
tstatisticsin
parentheses
∗p<
0.1
0,∗∗p<
0.0
5,∗∗
∗p<
0.01
191
Chapter 6Summary and conclusion
In this last chapter, we summarize the contribution of this dissertation and suggest
some avenues for further research in the area of market liquidity.
6.1 Concluding remarks149
The literature on market microstructure has seen tremendous growth in the last
two decades. In particular, market liquidity, the main topic of this dissertation,
is at the core of this area of �nance and has received a great deal of attention
from researchers, regulators, exchange o�cials, traders and �nancial institutions in
recent years. This dissertation provides a thorough discussion of market liquidity
and particularly addresses the impact of the �nancial crisis, ownership structures
and insider trading on market liquidity. It contributes to a wider understanding
of the dynamics, phenomena and in�uencing factors that underlie stock market
liquidity.
In Chapter 1, we highlighted the importance of market liquidity for today's
149 This section is largely based on Rösch and Kaserer (2010), Rösch and Kaserer (2011) andRösch and Kaserer (2012).
192
Chapter 6. Summary and conclusion
�nancial markets and introduced the main research questions of this dissertation.
Chapter 2 provided the foundation and basic principles of market liquidity,
including a detailed delimitation and de�nition of market liquidity, a description of
key characteristics and associated theoretical concepts, a presentation of existing
liquidity measures and �nally, a detailed introduction to the liquidity measure
(XLM - the Xetra liquidity measure) and market structure (the Xetra market)
used in our empirical analysis.
In Chapter 3, we gave an overview of the existing literature on market liquidity,
especially those studies that are related to our main research questions. We also
derived testable research hypotheses.
The subsequent chapter, Chapter 4, was dedicated to a detailed description of
our data sets. We analyzed a highly representative sample of German companies
listed in the four major German indices (DAX, MDAX, SDAX, and TecDAX) that
comprise almost 90% of the total German market capitalization using a liquidity
measure, called Xetra liquidity measure, that is able to simultaneously capture
liquidity e�ects on both depth and breadth in a limit order book. Due to the
fact that we were using an order-size-dependent liquidity measure derived from
the limit order book, we were able to show that the presented liquidity e�ects in
Chapter 5 hold for the entire depth of the limit order book.
In the following subsections, we summarize the key results of our main research
questions on market liquidity that we analyzed in Chapter 5 and present the
primary contributions of our work to the existing research on market liquidity.
193
Chapter 6. Summary and conclusion
6.1.1 Main results regarding market liquidity and the
�nancial crisis
The �rst part of the empirical analysis of this dissertation, which addresses stock
market liquidity during the �nancial crisis in Germany, supports our improved
understanding of the dynamics and phenomena of stock market liquidity in times
of crisis and increased market uncertainty. In our analysis of the e�ect of the
�nancial crisis on market liquidity, we scrutinize the impact of market declines
on stock market liquidity and assist in unearthing several puzzling market liquid-
ity phenomena in the stock market during times of crisis, such as the liquidity
commonality, the �ight-to-quality and the �ight-to-liquidity.
We empirically show that stock market liquidity is impaired during market
declines and in times of crisis, implying a positive relationship between market risk
and liquidity risk and resulting in investors frequently being struck by both risks
at the same time. Using our order-size-dependent liquidity measure, we show that
peaks in market liquidity risk in times of crisis are especially pronounced for larger
volume classes, and therefore any adequate market liquidity risk management
concept needs to account for this. This leads us to the conclusion that bid-ask-
spread data (which is often used to measure market liquidity risk due to its easy
availability) might tremendously understate the liquidity risk for larger trading
positions and therefore can only poorly act as a proxy of the level and especially
the variation of liquidity costs during times of crisis for larger volume classes.
The analysis of liquidity commonality demonstrates that liquidity commonality
is time-varying and particularly increases in times of crisis and during market
downturns, leading to soaring liquidity betas. Furthermore, peaks of liquidity
commonality are associated with major crisis events. The use of our order-size-
194
Chapter 6. Summary and conclusion
dependent liquidity measure enables us to establish that liquidity commonality
becomes weaker as one probes more deeply into the limit order book. Our results
present empirical evidence supportive of a supply e�ect in market liquidity as the-
oretically proposed by prior researchers e.g., Brunnermeier and Pedersen (2009).
We show that liquidity commonality is induced by a lack of funding liquidity of
�nancial intermediaries, leading to funding and market liquidity spirals.
We document that credit ratings produced by external rating agencies are able
to decrease liquidity costs in the stock market by alleviating information asymme-
try and hence decreasing the adverse selection component of liquidity costs. As
the decision to obtain an external rating is at the discretion of the company in
question, that �rm can therefore opt for an external rating as a means to improve
the liquidity of its own shares. We further show that liquidity costs increase with
credit risk/default probability and that this e�ect intensi�es during times of crisis,
giving empirical support for the �ight-to-quality or �ight-to-liquidity hypothesis
in the stock market.
Overall, our results clearly show that liquidity has played an important role in
the current �nancial crisis, as the lack of market liquidity was a symptom of the
crisis and at the same time responsible for exacerbating its consequences.
6.1.2 Main results regarding market liquidity and ownership
structures
The second main research question focuses on the relationship between ownership
concentration, blockholder types and stock market liquidity. This analysis, which
also focuses on the German market, helps to shed light on the impact of owner-
ship structure and corporate governance mechanisms on stock market liquidity.
195
Chapter 6. Summary and conclusion
Our results clearly show that market liquidity is signi�cantly reduced for com-
panies with highly concentrated ownership structures. This result is robust for
various measures of ownership concentration, and it proves our initial hypothesis
that stock market liquidity is a�ected by stock ownership concentration due to
an information asymmetry problem. Speci�cally, it appears that large sharehold-
ers possess economies of scale in the collection of information and the ability to
access private, value-relevant information and may trade on this information to
extract the private bene�ts of control; as a consequence, other market participants
increase the spreads to compensate.
Publications in the area of corporate governance have argued that ownership
concentration is required as an controlling instrument. However, studies exploring
the e�ects of blockholders on corporate governance and market liquidity demon-
strated that this controlling e�ect results in increased liquidity costs. Therefore,
they state that investors should accept a tradeo� between liquidity costs and the
monitoring e�ect of blockholders. However, in our analyses we further consider
the e�ect of speci�c types of shareholders on market liquidity. Although a highly
concentrated ownership structure already reduces market liquidity, we show that
insider blockholders worsen the market liquidity by even more than might be ex-
pected from structural e�ects alone. We pinpoint that insider, �nancial, and, to
some extent strategic blockholders all reduce stock market liquidity. However, we
�nd that in accordance to our second hypothesis, private blockholders and strate-
gic majority blockholders alleviate information asymmetry and therefore improve
stock market liquidity, as such blockholders are typically long-term investors.
Thus, we were able to show that not all types of blockholders impair stock
market liquidity and that the apparent tradeo� between the bene�cial impact of
shareholders activism from blockholders and the reduced market liquidity through
196
Chapter 6. Summary and conclusion
ownership concentration is not valid for private blockholders.
6.1.3 Main results regarding market liquidity and insider
trading
The last major thrust of our empirical research is dedicated to one speci�c type of
shareholder, the insider, and investigates the in�uence of insider trading behavior
on market liquidity. The analysis of the relationship between insider trading and
stock market liquidity in Germany deepens the understanding of the impact of
adverse selection on stock market liquidity. We scrutinize the e�ect of insider
trading on market liquidity both in an event study framework and through a
panel data analysis.
Our study reveals that insiders trade on days that are very active, presumably
to hide their own trading activity in higher trading volumes. Our results clearly
show that the liquidity impact of an insider transaction is highly dependent on
the type of the transaction. This is a �nding that has not been featured in the
previous empirical research on market liquidity. We demonstrate that market
liquidity is signi�cantly reduced on and (to some extent) after the days of insider
purchases and it is signi�cantly improved on and after the days of insider sales.
We argue that this liquidity e�ect is due to adverse selection as uninformed
market participants price protect against the adverse selection generated by in-
formed insiders, and this price protection is re�ected in the liquidity costs. We
reason that uninformed market participants use the share of insider ownership as
a proxy for the level of information asymmetry induced by insiders, which links
our study to our empirical research on ownership structures and to the other ex-
isting literature addressing the relationship between insider ownership and market
197
Chapter 6. Summary and conclusion
liquidity. Hence, any transaction that alters the share of insider ownership will
have a liquidity impact: Insider purchases, by increasing the insider ownership and
therefore the information asymmetry generated by insiders, impair market liquid-
ity on and after the day of the transaction. Consequently, insider sales therefore
alleviate information asymmetry, as the share of insider holdings is decreased;
thus, market liquidity is improved on and after the day of this insider transaction.
6.2 Outlook
Although this dissertation provides a solid and in-depth discussion of market
liquidity, particularly with regard to the impact of the �nancial crisis, ownership
structures and insider trading on market liquidity, several important questions
could not be addressed by this dissertation and are left for future research. Indeed,
the topic of market liquidity continues to provide an abundance of areas for future
research, and we will now point out some possible avenues for such research that
are related to our main research questions on market liquidity.
First, we look at possible further research that centers around the impact of
crises on market liquidity. A transfer and integration of our results regarding the
impact of crisis scenarios on market liquidity into (market liquidity) risk man-
agement models remains an open avenue for further investigation and would be
a logical next step in this area. Current research in the area of market liquidity
risk management mainly focuses upon the development of theoretical models that
integrate a liquidity risk component into existing market risk frameworks that are
mostly based on the value-at-risk (VaR) framework, as seen in, e.g., Stange and
Kaserer (2009). However, those research e�orts fail to model and integrate the
special properties, dynamics and phenomena of stock market liquidity in times
198
Chapter 6. Summary and conclusion
of crisis that we found in our dissertation and therefore underestimate the mag-
nitude and variance of the market liquidity risk. In particular, an integration of
our insights on liquidity commonality and the �ight-to-quality can signi�cantly
improve existing market liquidity risk frameworks. As we empirically showed that
funding and market liquidity risk are closely intertwined, another very interest-
ing and challenging avenue for further research could be the development of a
consistent and holistic risk management framework that integrates both types of
risks.
At the core of our two remaining main research questions lies the impact of
information asymmetry on market liquidity or, stated di�erently, the adverse se-
lection component of liquidity costs. Therefore, a possible area of future research
is the market liquidity impact analysis of further circumstances that should plau-
sibly a�ect the information asymmetry in the market, such as analyst coverage,
disclosure policies, signaling e�ects of share repurchases or other capital struc-
ture measures. The analysis of these circumstances using a liquidity measure
derived from the limit order book would deepen the understanding of the impact
of information asymmetry on market liquidity even further. In our analysis of
the impact of ownership structures on market liquidity, we argued that there is
a clear tradeo� between liquidity costs and the bene�cial impact of shareholder
activism induced by most blockholders. A future stream of literature might fo-
cus on the development of an integrated model that quanti�es and optimizes this
tradeo� depending on various �rm characteristics, which should assist companies
to optimally choose and manage their ownership and capital structures. This
stream of literature would also bene�t from analysis of management e�orts, like
an enhanced disclosure policy, to counteract and mitigate the negative liquidity
impact from certain blockholders. Our research into insider trading activity used
199
Chapter 6. Summary and conclusion
daily liquidity data, enabling us to scrutinize the liquidity impact over a relatively
long period of 7.5 years; however, with the recent advent of high frequency liq-
uidity and trading data, future research could possibly address and bene�t from
analyzing the impact of insider trading activity on intraday liquidity data.
As we already stated, the interest in the topic of market liquidity by researchers
and practitioners is not new; however, the relevance and reoccurrence of market
liquidity as a central topic in several of the recent �nancial crises along with
the recent advent of high-frequency data, has intensi�ed the research on this
topic. However, further study in this area of �nance remains possible beyond the
aforementioned suggestions, which were mere re�nements and extensions of the
topics that were the focus of our main research questions. For instance, the role
of liquidity could be elucidated in the areas of asset pricing or risk management,
among other possibilities.
With this dissertation and our new empirical �ndings, we hope to have con-
tributed to a better understanding about the properties, dynamics, role and im-
pact of market liquidity.
200
Bibliography
Viral V. Acharya and Lasse Heje Pedersen. Asset pricing with liquidity risk.
Journal of Financial Economics, 77(2):375�410, August 2005.
Michael Aitken and Carole Comerton-Forde. How should liquidity be measured?
Paci�c-Basin Finance Journal, 11(1):45�59, January 2003.
George A. Akerlof. The market for "lemons": Quality uncertainty and the market
mechanism. Quarterly Journal of Economics, 84(3):488�500, 1970.
Robert Almgren and Neil Chriss. Value under liquidation. Risk, 12:61�63, 1999.
Robert Almgren and Neil Chriss. Optimal execution of portfolio transactions.
Journal of Risk, 3(2):5�39, 2000.
Robert F. Almgren. Optimal execution with nonlinear impact functions and
trading-enhanced risk. Applied Mathematical Finance, 10(1):1�18, March 2003.
Yakov Amihud. Illiquidity and stock returns: Cross-section and time-series e�ects.
Journal of Financial Markets, 5(1):31�56, January 2002.
Yakov Amihud and Haim Mendelson. Dealership market: Market-making with
inventory. Journal of Financial Economics, 8(1):31�53, 1980.
201
Bibliography
Yakov Amihud and Haim Mendelson. Asset pricing and the bid-ask spread. Jour-
nal of Financial Economics, 17(2):223�249, December 1986.
Yakov Amihud and Haim Mendelson. Stock and bond liquidity and its e�ect on
prices and �nancial policies. Financial Markets and Portfolio Management, 20
(1):19�32, April 2006.
Yakov Amihud, Haim Mendelson, and Robert A. Wood. Liquidity and the 1987
stock market crash. Journal of Portfolio Management, 16(3):65�69, 1990.
Yakov Amihud, Haim Mendelson, and Beni Lauterbach. Market microstructure
and securities values: Evidence from the Tel Aviv Stock Exchange. Journal of
Financial Economics, 45(3):365�390, 1997.
Yakov Amihud, Haim Mendelson, and Lasse Heje Pedersen. Liquidity and asset
prices. Foundations and Trends in Finance, 1(4):269�364, 2005.
Andrew Ang and Joseph Chen. Asymmetric correlations of equity portfolios.
Journal of Financial Economics, 63(3):443�494, 2002.
Najah Attig, Wai-Ming Fong, Yoser Gadhoum, and Larry H.P. Lang. E�ects of
large shareholding on information asymmetry and stock liquidity. Journal of
Banking & Finance, 30(10):2875�2892, 2006.
Benjamin Bachrach and Dan Galai. The risk-return relationship and stock prices.
The Journal of Financial and Quantitative Analysis, 14(2):421�441, June 1979.
W. Bagehot. The only game in town. Financial Analysts Journal, 27:31�53, 1974.
Stephen M. Bainbridge. Insider trading. Encyclopedia of Law and Economics III,
pages 772�812, 2000.
202
Bibliography
Klaas Baks and Charles Kramer. Global liquidity and asset prices: Measurement,
implications, and spillovers. International Monetary Fund Working Paper, 168,
1999.
Anil Bangia, Francis X. Diebold, Til Schuermann, and John D. Stroughair. Liq-
uidity on the ouside. Risk, 12:68�73, 1999.
Michael J. Barclay and Cli�ord G. Holderness. Private bene�ts from control of
public corporations. Journal of Financial Economics, 25(2):371�395, 1989.
Michael J. Barclay and Cli�ord G. Holderness. Negotiated block trades and cor-
porate control. The Journal of Finance, 46(3):861�878, 1991.
Michael J. Barclay and Cli�ord W. Smith. Corporate payout policy: Cash divi-
dends versus open-market repurchases. Journal of Financial Economics, 22(1):
61�82, 1988.
Michael J. Barclay, William G. Christie, Je�rey H. Harris, Eugene Kandel, and
Paul H. Schultz. E�ects of market reform on the trading costs and depths of
NASDAQ stocks. The Journal of Finance, 54:1�34, February 1999.
Basel Committee on Banking Supervision. Principles for sound liquidity risk man-
agement and supervision. Technical report, Bank for International Settlement,
September 2008a.
Basel Committee on Banking Supervision. Liquidity risk: Management and super-
visory challenges. Technical report, Bank for International Settlement, February
2008b.
203
Bibliography
Basel Committee on Banking Supervision. International framework for liquid-
ity risk measurement, standards and monitoring. Technical report, Bank for
International Settlement, December 2010.
Alessandro Beber, Michael W. Brandt, and Kenneth A. Kavajecz. Flight-to-
quality or �ight-to-liquidity? Evidence from the Euro-area bond market. Review
of Financial Studies, 22(3):925�957, 2009.
Marco Becht. European corporate governance: Trading o� liquidity against con-
trol. European Economic Review, 43(4-6):1071�1083, 1999.
Gary S. Becker. Altruism, egoism, and genetic �tness: Economics and sociobiol-
ogy. Journal of Economic Literature, 14(3):817�826, 1976.
Gary S. Becker. A Treatise on the Family. Harvard University Press, 1981.
G. Bekaert, C. R. Harvey, and C. Lundblad. Liquidity and expected returns:
Lessons from emerging markets. Review of Financial Studies, 20:1783�1831,
2007.
David A. Belsley, Edwin Kuh, and Roy E. Welsch. Regression Diagnostics: Iden-
tifying In�uential Data and Sources of Collinearity. Wiley-Interscience, New
York, 1980.
George J. Benston. Determinants of bid-asked spreads in the over-the-counter
market. Journal of Financial Economics, 1(4):353�364, December 1974.
Henk Berkman and Venkat R. Eleswarapu. Short-term traders and liquidity: A
test using Bombay Stock Exchange data. Journal of Financial Economics, 47
(3):339�355, 1998.
204
Bibliography
Antonio E. Bernardo and Ivo Welch. Liquidity and �nancial market runs. Quar-
terly Journal of Economics, 119(1):135�158, February 2004.
Marianne Bertrand and Antoinette Schoar. The role of family in family �rms.
Journal of Economic Perspectives, 20(2):73�96, 2006.
Dimitris Bertsimas and Andrew W. Lo. Optimal control of execution costs. Jour-
nal of Financial Markets, 1(1):1�50, April 1998.
Arnaud Bervas. Market liquidity and its incorporation into risk management.
Technical report, Bank de France, May 2006.
J. C. Bettis, J. L. Coles, and M. L. Lemmon. Corporate policies restricting trading
by insiders. Journal of Financial Economics, 57(2):191�220, 2000.
Utpal Bhattacharya and Hazem Daouk. The world price of insider trading. The
Journal of Finance, 57(1):75�108, 2002.
Amar Bhide. The hidden costs of stock market liquidity. Journal of Financial
Economics, 34(1):31�51, 1993.
Fisher Black. Towards a fully automated exchange, part I. Financial Analysts
Journal, 27:28�35 and 44, July / Agust 1971.
Patrick Bolton and Ernst-Ludwig von Thadden. Blocks, liquidity, and corporate
control. The Journal of Finance, 53(1):1�25, 1998.
Richard Bookstaber. Understanding and monitoring the liquidity crisis cycle.
Financial Analysts Journal, 56(5):17�22, 2000.
205
Bibliography
Michael J. Brennan and Avanidhar Subrahmanyam. Market microstructure and
asset pricing: On the compensation for illiquidity in stock returns. Journal of
Financial Economics, 41(3):441�464, July 1996.
Michael J. Brennan, Tarun Chordia, and Avanidhar Subrahmanyam. Alternative
factor speci�cations, security characteristics, and the cross-section of expected
stock returns. Journal of Financial Economics, 49(3):345�373, September 1998.
Paul Brockman and Dennis Y. Chung. Managerial timing and corporate liquidity:
Evidence from actual share repurchases. Journal of Financial Economics, 61
(3):417�448, 2001.
Paul Brockman and Dennis Y. Chung. Commonality in liquidity: Evidence from
an order-driven market structure. Journal of Financial Research, 25(4):521�539,
2002.
Paul Brockman, Dennis Y. Chung, and Christophe Pérignon. Commonality in
liquidity: A global perspective. Journal of Financial and Quantitative Analysis,
44(04):851�882, 2009a.
Paul Brockman, Dennis Y. Chung, and Xuemin (Sterling) Yan. Block ownership,
trading activity, and market liquidity. Journal of Financial and Quantitative
Analysis, 44(06):1403�1426, 2009b.
Markus K. Brunnermeier. Deciphering the liquidity and credit crunch 2007-2008.
Journal of Economic Perspectives, 23(1):77�100, 2009.
Markus K. Brunnermeier and Lasse Heje Pedersen. Market liquidity and funding
liquidity. Review of Financial Studies, 22(6):2201�2238, 2009.
206
Bibliography
Bundesanstalt für Finanzdienstleistungsaufsicht (BaFin). Directors' dealings. In-
ternet, www.ba�n.de, 2012.
John W. Campbell, Andrew W. Lo, and A. Craig MacKinlay. The Econometrics
of Financial Markets. University Presses of Cambridge, 1996.
Join Y. Campbell, Sanford J. Grossman, and Jiang Wang. Trading volume and
serial correlation in stock returns. Quarterly Journal of Economics, 108(4):
905�939, November 1993.
Charles Cao, Laura Casares Field, and Gordon Hanka. Does insider trading impair
market liquidity? Evidence from IPO lockup expirations. Journal of Financial
and Quantitative Analysis, 39(1):25�46, 2004.
Mark Casson. The economics of the family �rm. Scandinavian Economic History
Review, 47:10�23, 1999.
Sugato Chakravarty and John J. McConnell. An analysis of prices, bid/ask
spreads, and bid and ask depths surrounding Ivan Boesky's illegal trading in
Carnation's stock. FM: The Journal of the Financial Management Association,
26(2):18�34, 1997.
Ralph Chami. What is di�erent about family businesses? IMF Working Paper,
2001.
Louis K. C. Chan and Josef Lakonishok. Institutional trades and intraday stock
price behavior. Journal of Financial Economics, 33(2):173�199, 1993.
Long Chen, David A. Lesmond, and Jason Wei. Corporate yield spreads and bond
liquidity. The Journal of Finance, 62(1):119�149, 2007a.
207
Bibliography
Qi Chen, Itay Goldstein, and Wei Jiang. Price informativeness and investment
sensitivity to stock price. Review of Financial Studies, 20(3):619�650, 2007b.
Sichong Chen and Ser-Huang Poon. International stock market liquidity and
�nancial crisis. SSRN eLibrary, 2008.
Louis Cheng, Michael Firth, T.Y. Leung, and Oliver Rui. The e�ects of insider
trading on liquidity. Paci�c-Basin Finance Journal, 14(5):467�483, 2006.
Raymond Chiang and P. C. Venkatesh. Insider holdings and perceptions of infor-
mation asymmetry: A note. The Journal of Finance, 43(4):1041�1048, 1988.
Tarun Chordia, Richard Roll, and Avanidhar Subrahmanyam. Commonality in
liquidity. Journal of Financial Economics, 56(1):3�28, April 2000.
Tarun Chordia, Richard Roll, and Avanidhar Subrahmanyam. Market liquidity
and trading activity. The Journal of Finance, 56(2):501�530, April 2001.
Tarun Chordia, Richard Roll, and Avanidhar Subrahmanyam. Order imbalance,
liquidity, and market returns. Journal of Financial Economics, 65(1):111�130,
July 2002.
Kee H. Chung and Charlie Charoenwong. Insider trading and the bid-ask spread.
Financial Review, 33(3):1�20, 1998.
Rodrigo Cifuentes, Gianluigi Ferrucci, and Hyun Song Shin. Liquidity risk and
contagion. Journal of the European Economic Association, 3(2-3):556�566,
2005.
Peter B. Clark and Jacques J. Polak. International liquidity and the role of the
sdr in the international monetary system. IMF Sta� Paper, 51(1), 2004.
208
Bibliography
Carole Comerton-Forde and James Rydge. Director holdings, shareholder concen-
tration and illiquidity. SSRN eLibrary, 2006.
Carole Comerton-Forde, Terence Hendershott, Charles M. Jones, Pamela C. Moul-
ton, and Mark S. Saesholes. Time variation in liquidity: The role of market-
maker inventories and revenues. The Journal of Finance, 65(1):295 �331, 2010.
Thomas E. Copeland and Dan Galai. Information e�ects on the bid-ask spread.
The Journal of Finance, 38(5):1457�1469, 1983.
Mark T. Coppejans, Ian H. Domowitz, and Ananth Madhavan. Liquidity in an
automated auction. AFA 2002 Atlanta Meetings, 2002.
Bradford Cornell and Erik R. Sirri. The reaction of investors and stock prices to
insider trading. The Journal of Finance, 47(3):1031�1059, 1992.
Shane A. Corwin. Di�erences in trading behavior across NYSE specialist �rms.
The Journal of Finance, 54(2):72�745, 1999.
Jay F. Coughenour and Mohsen M. Saad. Common market makers and common-
ality in liquidity. Journal of Financial Economics, 73(1):37�69, July 2004.
Andrew Duncan Crockett. Market liquidity and �nancial stability. Financial
Stability Review - Special issue on liquidity, 11:13�17, February 2008.
John Cubbin and Dennis Leech. The e�ect of shareholding dispersion on the
degree of control in British companies: Theory and measurement. Economic
Journal, 93(370):35�369, 1983.
Vinay T. Datar, Narayan Y. Naik, and Robert Radcli�e. Liquidity and stock re-
turns: An alternative test. Journal of Financial Markets, 1(2):203�219, August
1998.
209
Bibliography
Harold Demsetz. The cost of transacting. Quarterly Journal of Economics, 82(1):
33�53, 1968.
Harold Demsetz. Corporate control, insider trading, and rates of return. American
Economic Review, 76(2):313�316, 1986.
Harold Demsetz and Kenneth Lehn. The structure of corporate ownership: Causes
and consequences. Journal of Political Economy, 93:1155�1177, 1985.
Patrick J. Dennis and James P. Weston. Who's informed? An analysis of stock
ownership and informed trading. SSRN eLibrary, 2001.
Deutsche Boerse. Xetra: The whole world on a single plattform. Internet,
www.deutsche-boerse.de, 2009.
Deutsche Boerse. The electronic trading platform. Internet, www.boerse-
frankfurt.de, 2010.
Deutsche Boerse. Market model equities (XETRA release 12.0). Internet,
www.deutsche-boerse.de, 2011.
Ian Domowitz, Oliver Hansch, and Xiaoxin Wang. Liquidity commonality and
return co-movement. Journal of Financial Markets, 8(4):351�376, November
2005.
Kevin Dowd. Beyond Value at Risk - The New Science of Risk Management.
Wiley & Sons, 2001.
Kwamie Dunbar. US corporate default swap valuation: The market liquidity
hypothesis and autonomous credit risk. Quantitative Finance, 8(3):321�334,
2008.
210
Bibliography
David Easley and Maureen O'Hara. Price, trade size, and information in securities
markets. Journal of Financial Economics, 19(1):69�90, September 1987.
The Economist. When the sea dries up, September 1999.
Ronel Elul. Liquidity crises. Business Review, (Q2):13�22, 2008.
Jan Ericsson and Olivier M. Renault. Liquidity and credit risk. The Journal of
Finance, 61(5):2219�2250, 2006.
Frank Fehle. Bid-ask spreads and institutional ownership. Review of Quantitative
Finance and Accounting, 22(4):275�292, June 2004.
Joseph E. Finnerty. Insiders and market e�ciency. The Journal of Finance, 31
(4):1141�1148, 1976.
F. Douglas Foster and S. Viswanathan. Variations in trading volume, return
volatility, and trading costs: Evidence on recent price formation models. The
Journal of Finance, 48(1):187�211, March 1993.
Alexandros Gabrielsen, Massimiliano Marzo, and Paolo Zagaglia. Measuring mar-
ket liquidity: An introductory survey. SSRN eLibrary, 2011.
Nicolae Garleanu and Lasse Heje Pedersen. Liquidity and risk management. Amer-
ican Economic Review, 97(2):193�197, May 2007.
Nicholas L. Georgakopoulos. Insider trading as a transactional cost: A market
micostructure justi�cation and optimization of insider trading regulation. Con-
neticut Law Review, 26(1):1�52, 1993.
211
Bibliography
Thomas J. George, Gautam Kaul, and M Nimalendran. Estimation of the bid -
ask spread and its components: A new approach. Review of Financial Studies,
4(4):623�656, 1991.
Edith Ginglinger and Jacques Hamon. Ownership, control and market liquidity.
SSRN eLibrary, 2007a.
Edith Ginglinger and Jacques Hamon. Actual share repurchases, timing and liq-
uidity. Journal of Banking & Finance, 31(3):915�938, 2007b.
Pierre Giot and Joachim Grammig. How large is liquidity risk in an automated
auction market? Empirical Economics, 30(4):867�887, November 2005.
Lawrence R. Glosten and Lawrence E. Harris. Estimating the components of the
bid-ask spread. Journal of Financial Economics, 21(1):123�142, 1988.
Lawrence R. Glosten and Paul R. Milgrom. Bid, ask and transaction prices in a
specialist market with heterogeneously informed traders. Journal of Financial
Economics, 14(1):71�100, March 1985.
Charles Goodhart. Liquidity risk management. Financial Stability Review - Spe-
cial issue on liquidity, 11:39�44, 2008.
Ruslan Y. Goyenko, Craig W. Holden, and Charles A. Trzcinka. Do liquidity
measures measure liquidity? Journal of Financial Economics, 92(2):153�181,
2009.
Robin Greenwood. Short- and long-term demand curves for stocks: Theory and
evidence on the dynamics of arbitrage. Journal of Financial Economics, 75(3):
607�649, 2005.
212
Bibliography
Alexandra Hachmeister. Informed Traders as Liquidity Providers: Evidence from
the German Equity Market. Duv, 2007.
Allaudeen Hameed, Wenjin Kang, and S. Viswanathan. Stock market declines
and liquidity. The Journal of Finance, 65(1):257�293, 2010.
Kathleen Weiss Hanley, A. Arun Kumar, and Paul J. Seguin. Price stabilization
in the market for new issues. Journal of Financial Economics, 34(2):177�197,
1993.
Lawrence Harris. Minimum price variations, discrete bid-ask spreads, and quota-
tion sizes. Review of Financial Studies, 7(1):149�178, 1994.
Joel Hasbrouck. Measuring the information content of stock trades. The Journal
of Finance, 46(1):179�207, 1991.
Joel Hasbrouck and Duane J. Seppi. Common factors in prices, order �ows, and
liquidity. Journal of Financial Economics, 59(3):383�411, March 2001.
Jerry A. Hausman. Speci�cation tests in econometrics. Econometrica, 46(6):
1251�1271, November 1978.
Paul M Healy and Krishna G Palepu. Information asymmetry, corporate disclo-
sure, and the capital markets: A review of the empirical disclosure literature.
Journal of Accounting and Economics, 31(1-3):405�440, 2001.
Kaj Hedvall, Jonas Niemeyer, and Gunnar Rosenqvist. Do buyers and sellers
behave similarly in a limit order book? A high-frequency data examination
of the Finnish stock exchange. Journal of Empirical Finance, 4(2-3):279�293,
1997.
213
Bibliography
Frank He�in and Kenneth W. Shaw. Blockholder ownership and market liquidity.
Journal of Financial and Quantitative Analysis, 35(4):621�633, 2000.
Shantaram Hegde and Rupendra Paliwal. Financial contagion and market liquid-
ity - Evidence from the Asian crisis. SSRN eLibrary, 2005.
Thomas Ho and Hans R. Stoll. Optimal dealer pricing under transactions and
return uncertainty. Journal of Financial Economics, 9(1):47�73, 1981.
Cli�ord G. Holderness. A survey of blockholders and corporate control. Economic
Policy Review, 9(1):51�64, April 2003.
Cli�ord G. Holderness and Dennis P. Sheehan. The role of majority shareholders
in publicly held corporations: An exploratory analysis. Journal of Financial
Economics, 20:317�346, 1988.
Burton Holli�eld, Robert Miller, Patrik Sandas, and Joshua Slive. Liquidity sup-
ply and demand: Empirical evidence from the vancouver stock exchange. Work-
ing Paper, 2001.
Bengt Holmström and Jean Tirole. Market liquidity and performance monitoring.
Journal of Political Economy, 101(4):678�709, 1993.
Roger D. Huang and Hans R. Stoll. The components of the bid-ask spread: A
general approach. Review of Financial Studies, 10(4):995�1034, 1997.
Gur Huberman and Dominika Halka. Systematic liquidity (cover story). Journal
of Financial Research, 24(2):161�178, 2001.
International Monetary Fund. Global �nancial stability report - containing sys-
tematic risks and restoring �nancial soundness. Technical report, International
Monetary Fund, April 2008.
214
Bibliography
Paul J. Irvine, George J. Benston, and Eugene Kandel. Liquidity beyond the
inside spread: Measuring and using information in the limit order book. SSRN
eLibrary, 2000.
Je�rey P. Ja�e. Special information and insider trading. Journal of Business, 47
(3):410�428, 1974.
Avraham Kamara, Xiaoxia Lou, and Ronnie Sadka. The divergence of liquidity
commonality in the cross-section of stocks. Journal of Financial Economics, 89
(3):444�466, 2008.
George A. Karolyi, Kuan-Hui Lee, and Mathijs A. Van Dijk. Understanding
commonality in liquidity around the world. Journal of Financial Economics
(Forthcoming), 2011.
Alexander Kempf and Daniel Mayston. Liquidity commonality beyond best prices.
Journal of Financial Research, 31:25�40, 2008.
Andrew Koch, Laura Starks, and Stefan Ruenzi. Commonality in liquidity - A
demand-side explanation. Working Paper, March 2011.
Stacey R. Kole. Measuring managerial equity ownership: a comparison of sources
of ownership data. Journal of Corporate Finance, 1(3-4):413�435, 1995.
Hizuru Konishi and Naoki Makimoto. Optimal slice of a block trade. Journal of
Risk, 3(4):33�51, 2001.
R. A. Korajczyk and R. Sadka. Pricing the commonality across alternative mea-
sures of liquidity. Journal of Financial Economics, 87:45�72, 2008.
215
Bibliography
Meeta Kothare. The e�ects of equity issues on ownership structure and stock
liquidity: A comparison of rights and public o�erings. Journal of Financial
Economics, 43(1):131�148, 1997.
Chandrasekhar Krishnamurti and Tiong Yang Thong. Lockup expiration, insider
selling and bid-ask spreads. International Review of Economics & Finance, 17
(2):230�244, 2008.
Kuan-Hui and Lee. The world price of liquidity risk. Journal of Financial Eco-
nomics, 99(1):136�161, 2011.
Albert S. Kyle. Continuous auctions and insider trading. Econometrica, 53(6):
1315�1335, November 1985.
Albert S. Kyle and Wei Xiong. Contagion as a wealth e�ect. The Journal of
Finance, 56(4):1401�1440, 2001.
Josef Lakonishok and Inmoo Lee. Are insider trades informative? Review of
Financial Studies, 14(1):79�11, 2001.
Hayne E. Leland. Insider trading: Should it be prohibited? Journal of Political
Economy, 100(4):859�887, 1992.
David A. Lesmond. Liquidity of emerging markets. Journal of Financial Eco-
nomics, 77(2):411�452, August 2005.
David A. Lesmond, Joseph P. Ogden, and Charles A. Trzcinka. A new estimate
of transaction costs. Review of Financial Studies, 12(5), 1999.
Weimin Liu. A liquidity-augmented capital asset pricing model. Journal of Fi-
nancial Economics, 82(3):631�671, December 2006.
216
Bibliography
Francis A. Longsta�. How much can marketability a�ect security values? The
Journal of Finance, 50(5):1767�1774, December 1995.
Francis A. Longsta�. The �ight-to-liquidity premium in u.s. treasury bond prices.
Journal of Business, 77(3):511�526, July 2004.
Francis A. Longsta�, Sanjay Mithal, and Eric Neis. Corporate yield spreads:
Default risk or liquidity? New evidence from the Credit Default Swap market.
The Journal of Finance, 60(5):2213�2253, 2005.
A. Craig MacKinlay. Event studies in economics and �nance. Journal of Economic
Literature, 35(1):13�39, 1997.
Ananth Madhavan and Seymour Smidt. A bayesian model of intraday specialist
pricing. Journal of Financial Economics, 30(1):99�134, 1991.
Lisa K Meulbroek. An empirical analysis of illegal insider trading. The Journal
of Finance, 47(5):1661�1699, December 1992.
Wayne H. Mikkelson and Hailu Regassa. Premiums paid in block transactions.
Managerial and Decision Economics, 12(6):511�517, 1991.
Wayne H. Mikkelson and Richard S. Ruback. An empirical analysis of the inter�rm
equity investment process. Journal of Financial Economics, 14(4):523�553,
1985.
Randall Morck, Andrei Shleifer, and Robert W. Vishny. Management ownership
and market valuation: An empirical analysis. Journal of Financial Economics,
20:293�315, 1988.
217
Bibliography
Randall Morck, Bernard Yeung, and Wayne Yu. The information content of stock
markets: Why do emerging markets have synchronous stock price movements?
Journal of Financial Economics, 58(1-2):215�260, 2000.
Randi Næs, Johannes A. Skjeltorp, and Bernt Arne Ødegaard. Stock market
liquidity and the business cycle. The Journal of Finance, 66(1):139�176, 2011.
Maureen O'Hara. Market microstructure theory. Blackwell Business, March 1997.
Lubos Pastor and Robert F. Stambaugh. Liquidity risk and expected stock re-
turns. Journal of Political Economy, 111(3):642�685, June 2003.
Rasmus Rü�er and Livio Stracca. What is global excess liquidity, and does it
matter? European Central Bank Working Paper Series, (696), November 2006.
Richard Roll. A simple implicit measure of the e�ective bid-ask spread in an
e�cient model. The Journal of Finance, 39(4):1127�1139, September 1984.
Richard Roll. R2. The Journal of Finance, 43(3):541�566, 1988.
Ioanid Rosu. A dynamic model of the limit order book. Review of Financial
Studies, 22(11):4601�4641, 2009.
Christoph G. Rösch and Christoph Kaserer. Ownership concentration, blockholder
types and stock market liquidity. SSRN eLibrary, 2010.
Christoph G. Rösch and Christoph Kaserer. Market liquidity: Does insider trading
matter? SSRN eLibrary, 2011.
Christoph G. Rösch and Christoph Kaserer. Market Liquidity in the �nancial
crisis: The role of liquidity commonality and �ight-to-quality. SSRN eLibrary,
2012.
218
Bibliography
Ronnie Sadka. Momentum and post-earnings-announcement drift anomalies: The
role of liquidity risk. Journal of Financial Economics, 80(2):309�349, May 2006.
Atulya Sarin, Karen A. Shastri, and Kuldeep Shastri. Ownership structure and
stock market liquidity. SSRN eLibrary, 2000.
Abdourahmane Sarr and Tonny Lybek. Measuring liquidity in �nancial markets.
IMF Working Paper No. 02/232, Dec 2002.
H. Nejat Seyhun. Insiders' pro�ts, costs of trading, and market e�ciency. Journal
of Financial Economics, 16(2):189�212, 1986.
Andrei Shleifer. Do demand curves for stocks slope down? The Journal of
Finance, 41(3):579�590, 1986.
Andrei Shleifer and Robert W. Vishny. Large shareholders and corporate control.
Journal of Political Economy, 94(3):461�488, 1986.
Sebastian Stange and Christoph Kaserer. The impact of order size on stock liq-
uidity - a representative study. SSRN eLibrary, 2008.
Sebastian Stange and Christoph Kaserer. Market liquidity risk - an overview.
SSRN eLibrary, 2009.
Sebastian Stange and Christoph Kaserer. The impact of lquidity risk: A fresh
look. International Review of Finance, 11(3):269�301, 2011.
Hans R. Stoll. The pricing of security dealer services: An empirical study of
NASDAQ stocks. The Journal of Finance, 33(4):1153�1172, 1978a.
Hans R. Stoll. The supply of dealer services in securities markets. The Journal of
Finance, 33(4):1133�1151, 1978b.
219
Bibliography
Hans R. Stoll. Inferring the components of the bid-ask spread: Theory and em-
pirical tests. The Journal of Finance, 44:115�134, 1989.
Hans R. Stoll. Presidential address: Friction. The Journal of Finance, 55(4):
1479�1514, 2000.
René M. Stulz. Managerial control of voting rights: Financing policies and the
market for corporate control. Journal of Financial Economics, 20:25�54, 1988.
Ajay Subramanian and Robert A. Jarrow. The liquidity discount. Mathematical
Finance, 11(4):447�474, October 2001.
Seha M. Tinic. The economics of liquidity services. The Quarterly Journal of
Economics, 86(1):79�93, 1972.
Dimitri Vayanos. Flight to quality, �ight to liquidity, and the pricing of risk.
NBER working paper, 2004.
World Federation of Exchanges. Statistics - domestic market capitalization. In-
ternet, http://www.world-exchanges.org/ as of 11.03.2010, 2010.
World Federation of Exchanges. 2010 market highlights, 2011.
Wei Xiong. Convergence trading with wealth e�ects: An ampli�cation mechanism
in �nancial markets. Journal of Financial Economics, 62(2):247�292, 2001.
Eduardo Levy Yeyati, Sergio L. Schmukler, and Neeltje Van Horen. Emerging
market liquidity and crises. Journal of the European Economic Association, 6
(2-3):668�682, 2008.
220

Appendix AMarket liquidity and the �nancial crisis
221
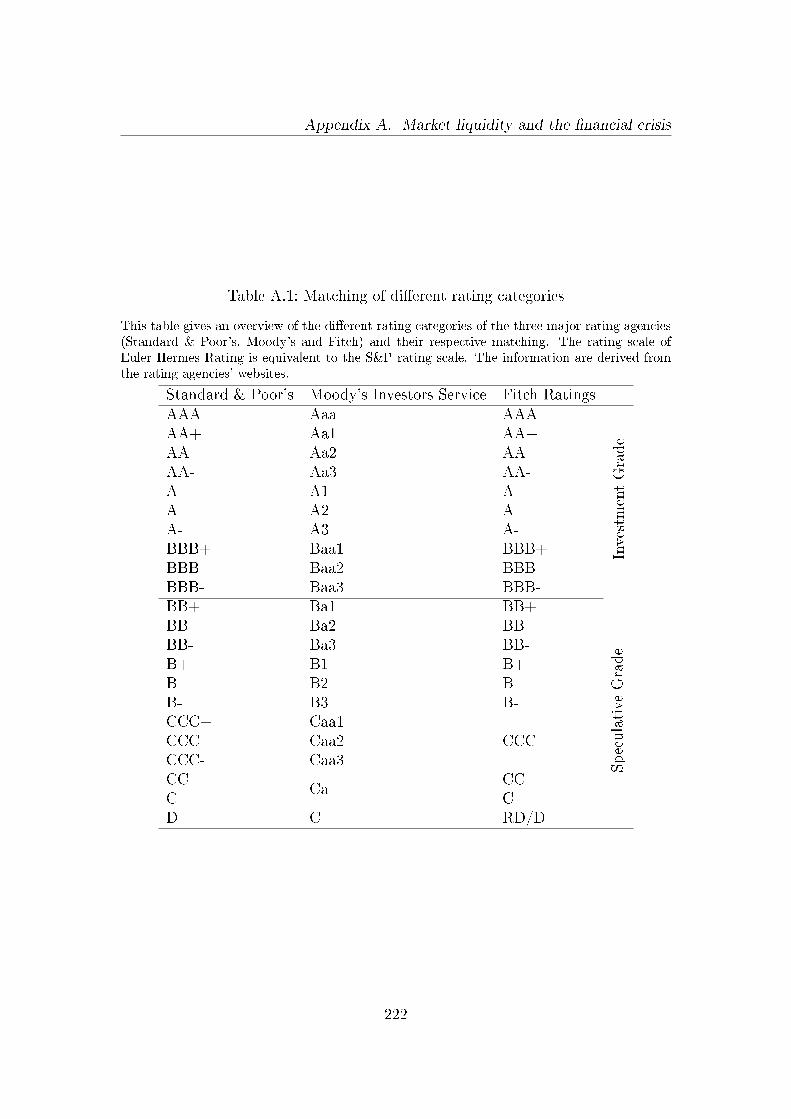
Appendix A. Market liquidity and the �nancial crisis
Table A.1: Matching of di�erent rating categories
This table gives an overview of the di�erent rating categories of the three major rating agencies(Standard & Poor's, Moody's and Fitch) and their respective matching. The rating scale ofEuler Hermes Rating is equivalent to the S&P rating scale. The information are derived fromthe rating agencies' websites.
Standard & Poor's Moody's Investors Service Fitch RatingsAAA Aaa AAA
InvestmentGradeAA+ Aa1 AA+
AA Aa2 AAAA- Aa3 AA-A+ A1 A+A A2 AA- A3 A-BBB+ Baa1 BBB+BBB Baa2 BBBBBB- Baa3 BBB-BB+ Ba1 BB+
Speculative
Grade
BB Ba2 BBBB- Ba3 BB-B+ B1 B+B B2 BB- B3 B-CCC+ Caa1
CCCCCC Caa2CCC- Caa3CC
CaCC
C CD C RD/D
222
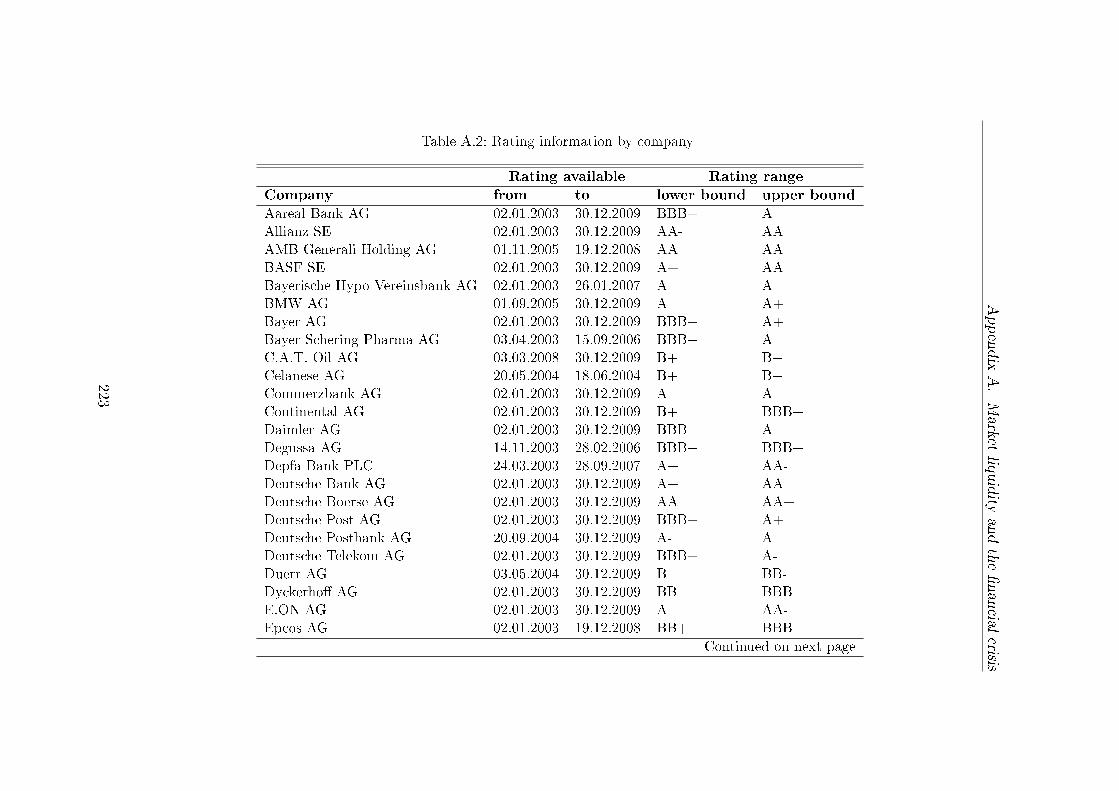
Appendix
A.Market
liquidity
andthe�nancia
lcrisis
Table A.2: Rating information by company
Rating available Rating range
Company from to lower bound upper bound
Aareal Bank AG 02.01.2003 30.12.2009 BBB+ A
Allianz SE 02.01.2003 30.12.2009 AA- AA
AMB Generali Holding AG 01.11.2005 19.12.2008 AA AA
BASF SE 02.01.2003 30.12.2009 A+ AA-
Bayerische Hypo-Vereinsbank AG 02.01.2003 26.01.2007 A- A
BMW AG 01.09.2005 30.12.2009 A- A+
Bayer AG 02.01.2003 30.12.2009 BBB+ A+
Bayer Schering Pharma AG 03.04.2003 15.09.2006 BBB+ A
C.A.T. Oil AG 03.03.2008 30.12.2009 B+ B+
Celanese AG 20.05.2004 18.06.2004 B+ B+
Commerzbank AG 02.01.2003 30.12.2009 A- A
Continental AG 02.01.2003 30.12.2009 B+ BBB+
Daimler AG 02.01.2003 30.12.2009 BBB A-
Degussa AG 14.11.2003 28.02.2006 BBB+ BBB+
Depfa Bank PLC 24.03.2003 28.09.2007 A+ AA-
Deutsche Bank AG 02.01.2003 30.12.2009 A+ AA
Deutsche Boerse AG 02.01.2003 30.12.2009 AA AA+
Deutsche Post AG 02.01.2003 30.12.2009 BBB+ A+
Deutsche Postbank AG 20.09.2004 30.12.2009 A- A
Deutsche Telekom AG 02.01.2003 30.12.2009 BBB+ A-
Duerr AG 03.05.2004 30.12.2009 B BB-
Dyckerho� AG 02.01.2003 30.12.2009 BB BBB
E.ON AG 02.01.2003 30.12.2009 A AA-
Epcos AG 02.01.2003 19.12.2008 BB+ BBB+
Continued on next page
223
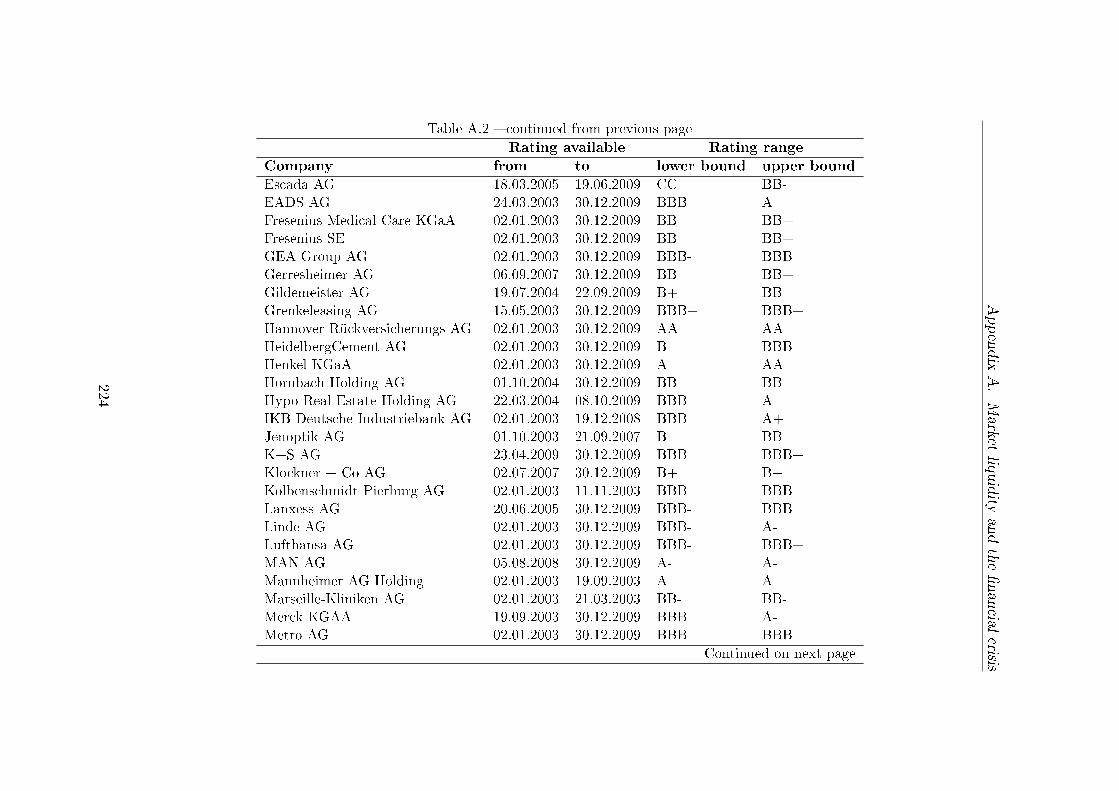
Appendix
A.Market
liquidity
andthe�nancia
lcrisis
Table A.2 � continued from previous page
Rating available Rating range
Company from to lower bound upper bound
Escada AG 18.03.2005 19.06.2009 CC BB-
EADS AG 24.03.2003 30.12.2009 BBB+ A
Fresenius Medical Care KGaA 02.01.2003 30.12.2009 BB BB+
Fresenius SE 02.01.2003 30.12.2009 BB BB+
GEA Group AG 02.01.2003 30.12.2009 BBB- BBB
Gerresheimer AG 06.09.2007 30.12.2009 BB BB+
Gildemeister AG 19.07.2004 22.09.2009 B+ BB-
Grenkeleasing AG 15.05.2003 30.12.2009 BBB+ BBB+
Hannover Rückversicherungs AG 02.01.2003 30.12.2009 AA- AA
HeidelbergCement AG 02.01.2003 30.12.2009 B- BBB-
Henkel KGaA 02.01.2003 30.12.2009 A- AA-
Hornbach Holding AG 01.10.2004 30.12.2009 BB BB
Hypo Real Estate Holding AG 22.03.2004 08.10.2009 BBB A
IKB Deutsche Industriebank AG 02.01.2003 19.12.2008 BBB- A+
Jenoptik AG 01.10.2003 21.09.2007 B BB-
K+S AG 23.04.2009 30.12.2009 BBB BBB+
Klockner + Co AG 02.07.2007 30.12.2009 B+ B+
Kolbenschmidt Pierburg AG 02.01.2003 11.11.2003 BBB BBB
Lanxess AG 20.06.2005 30.12.2009 BBB- BBB
Linde AG 02.01.2003 30.12.2009 BBB- A-
Lufthansa AG 02.01.2003 30.12.2009 BBB- BBB+
MAN AG 05.08.2008 30.12.2009 A- A-
Mannheimer AG Holding 02.01.2003 19.09.2003 A A
Marseille-Kliniken AG 02.01.2003 21.03.2003 BB- BB-
Merck KGAA 19.09.2003 30.12.2009 BBB A-
Metro AG 02.01.2003 30.12.2009 BBB BBB+
Continued on next page
224
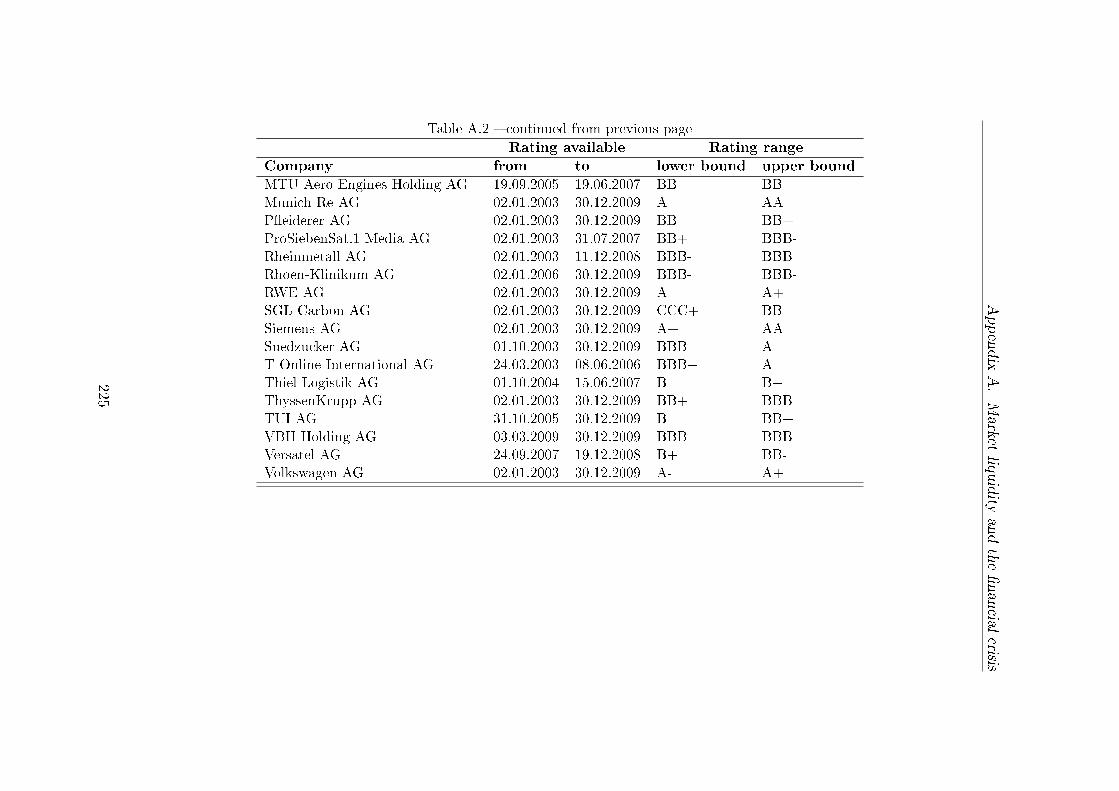
Appendix
A.Market
liquidity
andthe�nancia
lcrisis
Table A.2 � continued from previous page
Rating available Rating range
Company from to lower bound upper bound
MTU Aero Engines Holding AG 19.09.2005 19.06.2007 BB BB+
Munich Re AG 02.01.2003 30.12.2009 A+ AA+
P�eiderer AG 02.01.2003 30.12.2009 BB BB+
ProSiebenSat.1 Media AG 02.01.2003 31.07.2007 BB+ BBB-
Rheinmetall AG 02.01.2003 11.12.2008 BBB- BBB
Rhoen-Klinikum AG 02.01.2006 30.12.2009 BBB- BBB-
RWE AG 02.01.2003 30.12.2009 A A+
SGL Carbon AG 02.01.2003 30.12.2009 CCC+ BB
Siemens AG 02.01.2003 30.12.2009 A+ AA-
Suedzucker AG 01.10.2003 30.12.2009 BBB A-
T-Online International AG 24.03.2003 08.06.2006 BBB+ A-
Thiel Logistik AG 01.10.2004 15.06.2007 B B+
ThyssenKrupp AG 02.01.2003 30.12.2009 BB+ BBB
TUI AG 31.10.2005 30.12.2009 B- BB+
VBH Holding AG 03.03.2009 30.12.2009 BBB- BBB-
Versatel AG 24.09.2007 19.12.2008 B+ BB-
Volkswagen AG 02.01.2003 30.12.2009 A- A+
225
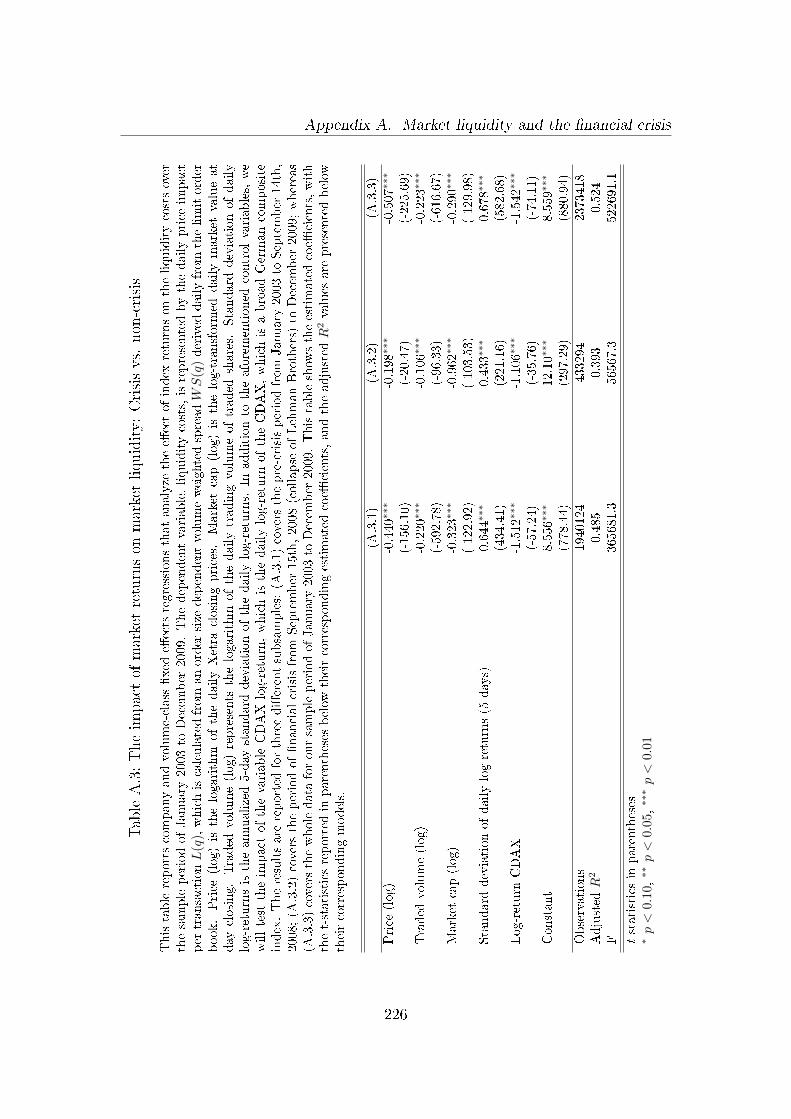
Appendix A. Market liquidity and the �nancial crisisTableA.3:Theim
pactof
marketreturnson
marketliquidity:Crisisvs.
non-crisis
Thistablereportscompanyandvolume-class
�xed
e�ects
regressionsthatanalyze
thee�ectofindex
returnsontheliquiditycostsover
thesampleperiodofJanuary
2003to
Decem
ber
2009.Thedependentvariable,liquiditycosts,isrepresentedbythedailyprice
impact
per
transactionL
(q),whichiscalculatedfrom
anorder-size-dependentvolume-weightedspreadWS
(q)derived
dailyfrom
thelimitorder
book.Price
(log)is
thelogarithm
ofthedailyXetra
closingprices.
Market
cap(log)is
thelog-transform
eddailymarket
valueat
day
closing.Traded
volume(log)represents
thelogarithm
ofthedailytradingvolumeoftraded
shares.
Standard
deviationofdaily
log-returnsistheannualized5-day
standard
deviationofthedailylog-returns.
Inadditionto
theaforementioned
controlvariables,we
willtest
theim
pact
ofthevariableCDAX
log-return,whichisthedailylog-return
oftheCDAX,whichisabroadGermancomposite
index.Theresultsare
reported
forthreedi�erentsubsamples:(A
.3.1)coversthepre-crisisperiodfrom
January
2003to
September
14th,
2008;(A
.3.2)coverstheperiodof�nancialcrisisfrom
September
15th,2008(collapse
ofLehmanBrothers)
toDecem
ber
2009;whereas
(A.3.3)coversthewholedataforoursampleperiodofJanuary
2003to
Decem
ber
2009.Thistableshow
stheestimatedcoe�
cients,with
thet-statisticsreported
inparentheses
below
theircorrespondingestimatedcoe�
cients,andtheadjusted
R2values
are
presentedbelow
theircorrespondingmodels.
(A.3.1)
(A.3.2)
(A.3.3)
Price
(log)
-0.440∗∗
∗-0.198∗∗
∗-0.507∗∗
∗
(-156.10)
(-20.47)
(-225.69)
Traded
volume(log)
-0.220∗∗
∗-0.106∗∗
∗-0.223∗∗
∗
(-592.78)
(-96.33)
(-616.67)
Market
cap(log)
-0.323∗∗
∗-0.962∗∗
∗-0.290∗∗
∗
(-122.92)
(-103.53)
(-129.98)
Standard
deviationofdailylog-returns(5
days)
0.644∗∗
∗0.433∗∗
∗0.678∗∗
∗
(434.41)
(221.16)
(582.68)
Log-return
CDAX
-1.512∗∗
∗-1.106∗∗
∗-1.542∗∗
∗
(-57.24)
(-35.76)
(-74.11)
Constant
8.556∗
∗∗12.10∗∗
∗8.559∗∗
∗
(778.44)
(297.29)
(880.94)
Observations
1940124
433294
2373418
Adjusted
R2
0.485
0.393
0.524
F365681.3
56567.3
522691.1
tstatisticsin
parentheses
∗p<
0.1
0,∗∗p<
0.0
5,∗∗
∗p<
0.01
226
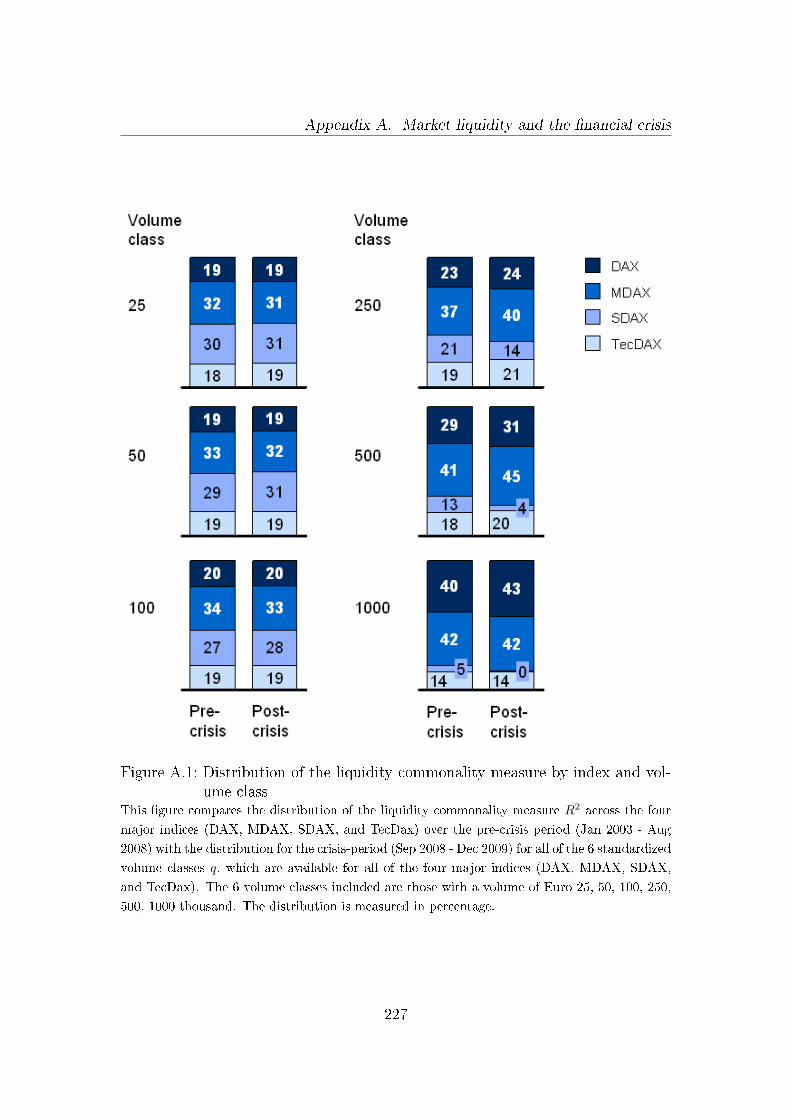
Appendix A. Market liquidity and the �nancial crisis
Figure A.1: Distribution of the liquidity commonality measure by index and vol-ume class
This �gure compares the distribution of the liquidity commonality measure R2 across the four
major indices (DAX, MDAX, SDAX, and TecDax) over the pre-crisis period (Jan 2003 - Aug
2008) with the distribution for the crisis-period (Sep 2008 - Dec 2009) for all of the 6 standardized
volume classes q, which are available for all of the four major indices (DAX, MDAX, SDAX,
and TecDax). The 6 volume classes included are those with a volume of Euro 25, 50, 100, 250,
500, 1000 thousand. The distribution is measured in percentage.
227

Appendix BMarket liquidity and ownership structures
228
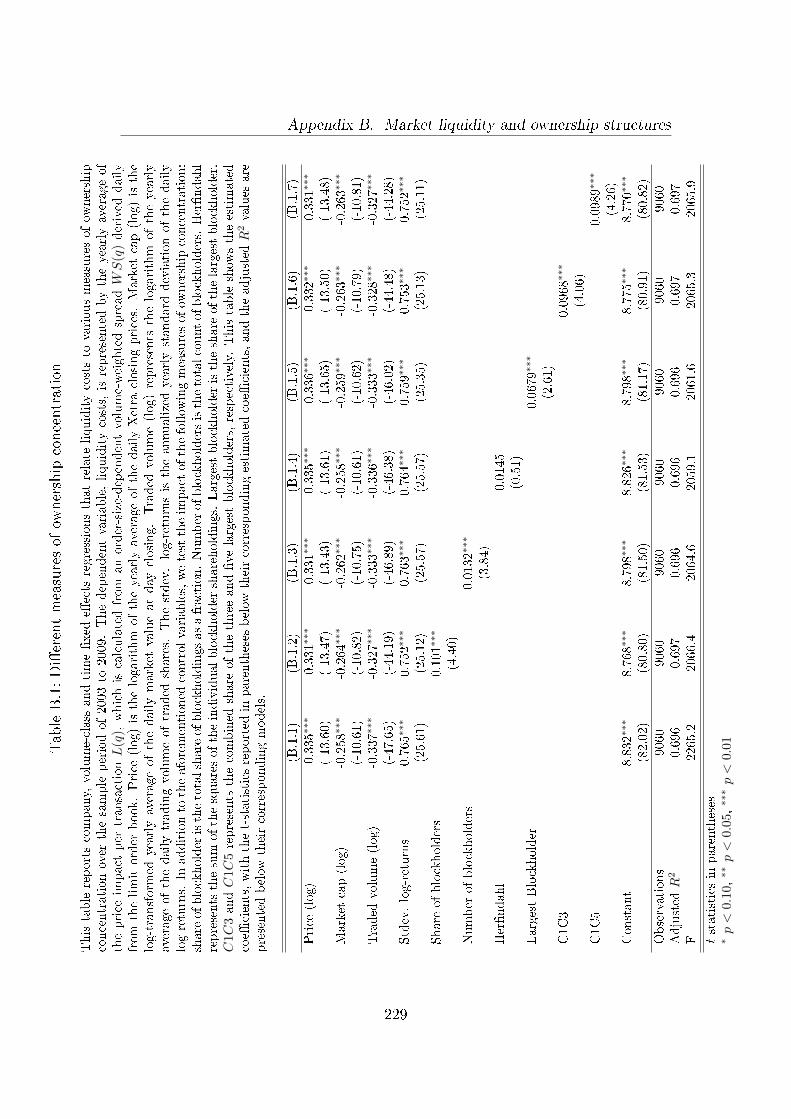
Appendix B. Market liquidity and ownership structures
TableB.1:Di�erentmeasuresof
ownership
concentration
Thistablereportscompany,volume-class
andtime�xed
e�ects
regressionsthatrelate
liquiditycoststo
variousmeasuresofow
nership
concentrationover
thesampleperiodof2003to
2009.Thedependentvariable,liquiditycosts,isrepresentedbytheyearlyaverageof
theprice
impact
per
transactionL
(q),whichiscalculatedfrom
anorder-size-dependentvolume-weightedspreadWS
(q)derived
daily
from
thelimitorder
book.Price
(log)isthelogarithm
oftheyearlyaverageofthedailyXetra
closingprices.
Market
cap(log)isthe
log-transform
edyearlyaverageofthedailymarket
valueatday
closing.Traded
volume(log)represents
thelogarithm
oftheyearly
averageofthedailytradingvolumeoftraded
shares.
Thestdev.log-returnsistheannualizedyearlystandard
deviationofthedaily
log-returns.In
additionto
theaforementioned
controlvariables,wetesttheim
pact
ofthefollow
ingmeasuresofow
nership
concentration:
shareofblockholderisthetotalshareofblockholdingsasafraction.Numberofblockholdersisthetotalcountofblockholders.Her�ndahl
representsthesum
ofthesquaresoftheindividualblockholder
shareholdings.Largestblockholder
istheshare
ofthelargestblockholder.
C1C
3andC
1C
5represents
thecombined
share
ofthethreeand�ve
largestblockholders,respectively.Thistableshow
stheestimated
coe�
cients,withthet-statisticsreported
inparentheses
below
theircorrespondingestimatedcoe�
cients,andtheadjusted
R2values
are
presentedbelow
theircorrespondingmodels.
(B.1.1)
(B.1.2)
(B.1.3)
(B.1.4)
(B.1.5)
(B.1.6)
(B.1.7)
Price
(log)
-0.335∗∗
∗-0.331∗∗
∗-0.331∗∗
∗-0.335∗∗
∗-0.336∗∗
∗-0.332∗∗
∗-0.331∗∗
∗
(-13.60)
(-13.47)
(-13.43)
(-13.61)
(-13.65)
(-13.50)
(-13.48)
Market
cap(log)
-0.258∗∗
∗-0.264∗∗
∗-0.262∗∗
∗-0.258∗∗
∗-0.259∗∗
∗-0.263∗∗
∗-0.263∗∗
∗
(-10.61)
(-10.82)
(-10.75)
(-10.61)
(-10.62)
(-10.79)
(-10.81)
Traded
volume(log)
-0.337∗
∗∗-0.327∗∗
∗-0.333∗∗
∗-0.336∗∗
∗-0.333∗∗
∗-0.328∗∗
∗-0.327∗∗
∗
(-47.65)
(-44.19)
(-46.89)
(-46.38)
(-46.02)
(-44.48)
(-44.28)
Stdev.log-returns
0.765∗∗
∗0.752∗∗
∗0.763∗∗
∗0.764∗∗
∗0.759∗∗
∗0.753∗∗
∗0.752∗∗
∗
(25.61)
(25.12)
(25.57)
(25.57)
(25.35)
(25.13)
(25.11)
Share
ofblockholders
0.101∗∗
∗
(4.40)
Number
ofblockholders
0.0132∗∗
∗
(3.84)
Her�ndahl
0.0145
(0.51)
LargestBlockholder
0.0679∗∗
∗
(2.61)
C1C3
0.0968∗∗
∗
(4.06)
C1C5
0.0989∗∗
∗
(4.26)
Constant
8.832∗∗
∗8.768∗∗
∗8.798∗∗
∗8.826∗∗
∗8.798∗∗
∗8.775∗∗
∗8.770∗∗
∗
(82.02)
(80.80)
(81.50)
(81.53)
(81.17)
(80.91)
(80.82)
Observations
9060
9060
9060
9060
9060
9060
9060
Adjusted
R2
0.696
0.697
0.696
0.696
0.696
0.697
0.697
F2265.2
2066.4
2064.6
2059.1
2061.6
2065.3
2065.9
tstatisticsin
parentheses
∗p<
0.1
0,∗∗p<
0.0
5,∗∗
∗p<
0.01
229
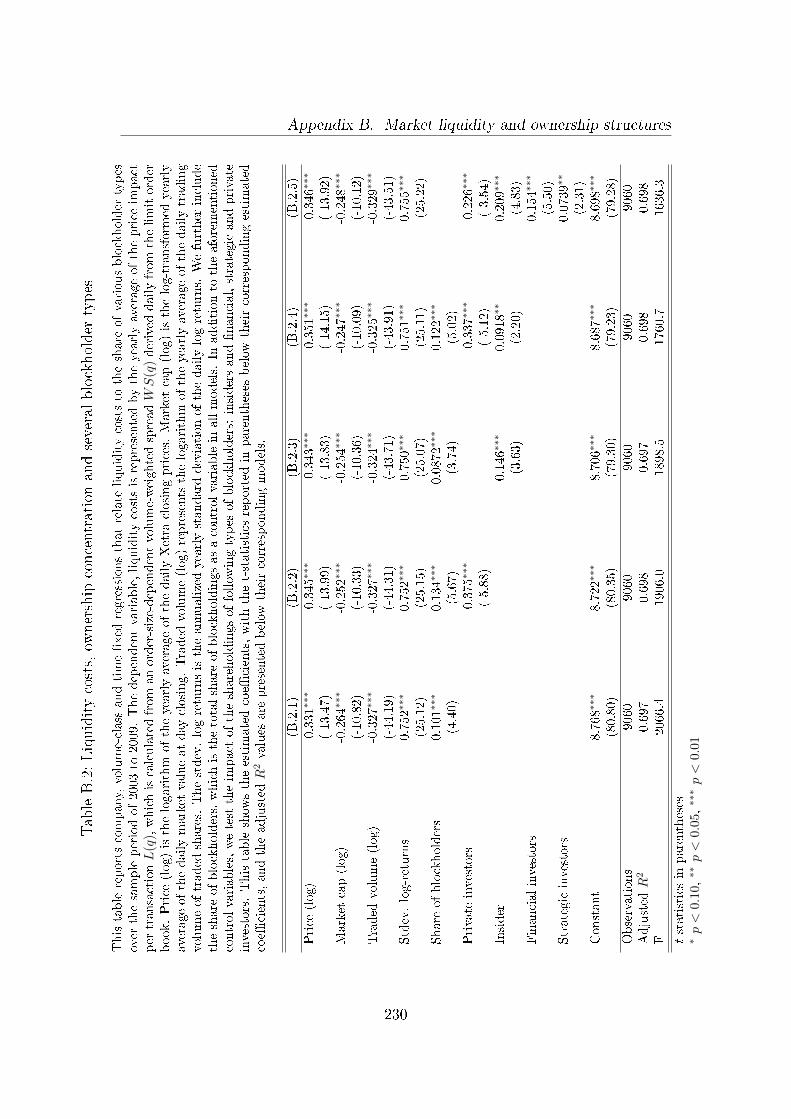
Appendix B. Market liquidity and ownership structures
TableB.2:Liquiditycosts,ow
nership
concentrationandseveralblockholder
types
Thistablereportscompany,volume-class
andtime�xed
regressionsthatrelate
liquiditycoststo
theshare
ofvariousblockholder
types
over
thesampleperiodof2003to
2009.Thedependentvariable,liquiditycostsisrepresentedbytheyearlyaverageoftheprice
impact
per
transactionL
(q),whichiscalculatedfrom
anorder-size-dependentvolume-weightedspreadWS
(q)derived
dailyfrom
thelimitorder
book.Price
(log)isthelogarithm
oftheyearlyaverageofthedailyXetra
closingprices.
Market
cap(log)isthelog-transform
edyearly
averageofthedailymarket
valueatday
closing.Traded
volume(log)representsthelogarithm
oftheyearlyaverageofthedailytrading
volumeoftraded
shares.
Thestdev.log-returnsistheannualizedyearlystandard
deviationofthedailylog-returns.
Wefurther
include
theshare
ofblockholders,whichisthetotalshare
ofblockholdingsasacontrolvariablein
allmodels.
Inadditionto
theaforementioned
controlvariables,wetest
theim
pact
oftheshareholdingsoffollow
ingtypes
ofblockholders:
insidersand�nancial,strategicandprivate
investors.Thistableshow
stheestimatedcoe�
cients,withthet-statisticsreported
inparentheses
below
theircorrespondingestimated
coe�
cients,andtheadjusted
R2values
are
presentedbelow
theircorrespondingmodels.
(B.2.1)
(B.2.2)
(B.2.3)
(B.2.4)
(B.2.5)
Price
(log)
-0.331∗∗
∗-0.345∗∗
∗-0.343∗∗
∗-0.351∗∗
∗-0.346∗∗
∗
(-13.47)
(-13.99)
(-13.83)
(-14.15)
(-13.92)
Market
cap(log)
-0.264
∗∗∗
-0.252∗∗
∗-0.254∗∗
∗-0.247∗∗
∗-0.248∗∗
∗
(-10.82)
(-10.33)
(-10.36)
(-10.09)
(-10.12)
Traded
volume(log)
-0.327∗∗
∗-0.327∗∗
∗-0.324∗∗
∗-0.325∗∗
∗-0.329∗∗
∗
(-44.19)
(-44.31)
(-43.71)
(-43.91)
(-43.51)
Stdev.log-returns
0.752∗∗
∗0.752∗∗
∗0.750∗∗
∗0.751∗∗
∗0.755∗∗
∗
(25.12)
(25.15)
(25.07)
(25.11)
(25.22)
Share
ofblockholders
0.101∗∗
∗0.134∗∗
∗0.0872∗∗
∗0.122∗∗
∗
(4.40)
(5.67)
(3.74)
(5.02)
Private
investors
-0.375∗∗
∗-0.337∗∗
∗-0.226∗∗
∗
(-5.88)
(-5.12)
(-3.54)
Insider
0.146∗∗
∗0.0918∗∗
0.209∗∗
∗
(3.63)
(2.20)
(4.83)
Financialinvestors
0.154∗∗
∗
(5.50)
Strategicinvestors
0.0739∗∗
(2.31)
Constant
8.768∗∗
∗8.722∗∗
∗8.706∗∗
∗8.687∗∗
∗8.698∗∗
∗
(80.80)
(80.35)
(79.30)
(79.23)
(79.28)
Observations
9060
9060
9060
9060
9060
Adjusted
R2
0.697
0.698
0.697
0.698
0.698
F2066.4
1906.0
1898.5
1760.7
1636.3
tstatisticsin
parentheses
∗p<
0.1
0,∗∗p<
0.0
5,∗∗
∗p<
0.01
230

Appendix CMarket liquidity and insider trading
231
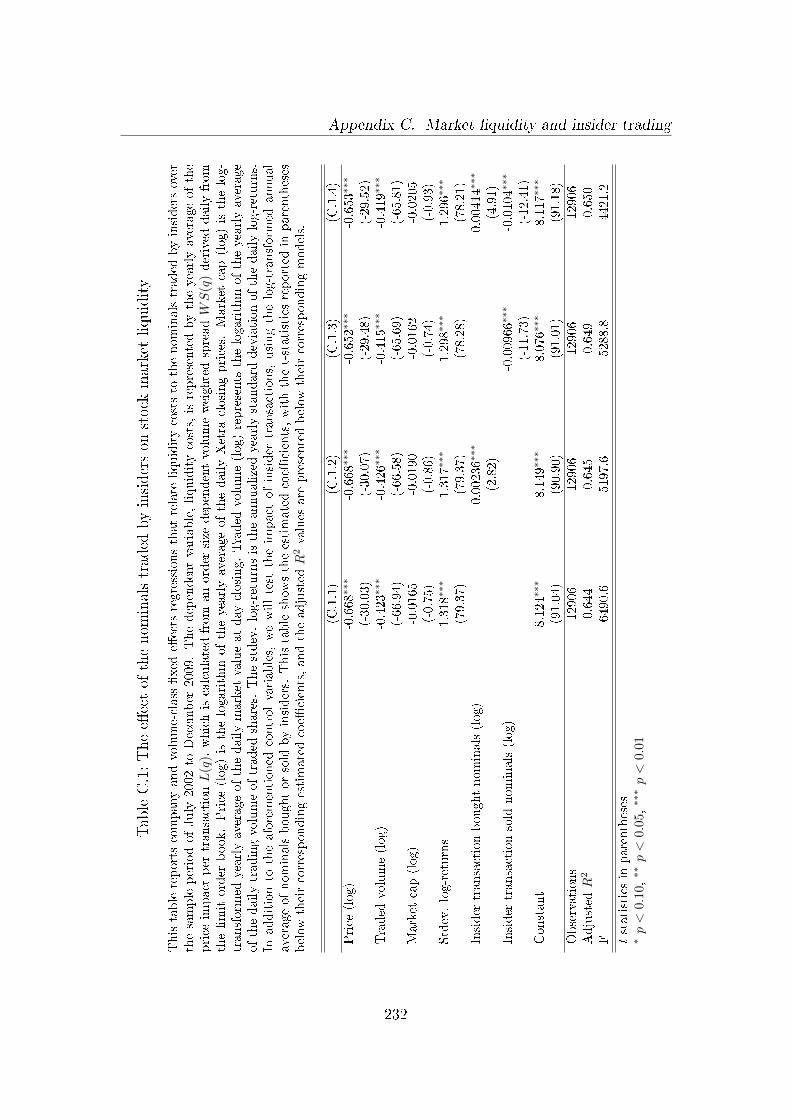
Appendix C. Market liquidity and insider tradingTableC.1:Thee�ectof
thenom
inalstraded
byinsiderson
stock
marketliquidity
Thistablereportscompanyandvolume-class
�xed
e�ects
regressionsthatrelate
liquiditycoststo
thenominalstraded
byinsidersover
thesampleperiodofJuly
2002to
Decem
ber
2009.Thedependentvariable,liquiditycosts,isrepresentedbytheyearlyaverage
ofthe
price
impact
per
transactionL
(q),whichiscalculatedfrom
anorder-size-dependentvolume-weightedspreadWS
(q)derived
dailyfrom
thelimitorder
book.Price
(log)isthelogarithm
oftheyearlyaverageofthedailyXetra
closingprices.
Market
cap(log)isthelog-
transform
edyearlyaverageofthedailymarket
valueatday
closing.Traded
volume(log)represents
thelogarithm
oftheyearlyaverage
ofthedailytradingvolumeoftraded
shares.
Thestdev.log-returnsistheannualizedyearlystandard
deviationofthedailylog-returns.
Inadditionto
theaforementioned
controlvariables,wewilltest
theim
pact
ofinsider
transactions,usingthelog-transform
edannual
averageofnominalsboughtorsold
byinsiders.
Thistableshow
stheestimatedcoe�
cients,withthet-statisticsreported
inparentheses
below
theircorrespondingestimatedcoe�
cients,andtheadjusted
R2values
are
presentedbelow
theircorrespondingmodels.
(C.1.1)
(C.1.2)
(C.1.3)
(C.1.4)
Price
(log)
-0.668∗∗
∗-0.668∗∗
∗-0.652∗∗
∗-0.653∗∗
∗
(-30.03)
(-30.07)
(-29.48)
(-29.52)
Traded
volume(log)
-0.423∗∗
∗-0.426∗∗
∗-0.415∗∗
∗-0.419∗∗
∗
(-66.94)
(-66.58)
(-65.69)
(-65.81)
Market
cap(log)
-0.0165
-0.0190
-0.0162
-0.0205
(-0.75)
(-0.86)
(-0.74)
(-0.93)
Stdev.log-returns
1.318∗∗
∗1.317∗∗
∗1.298∗∗
∗1.296∗∗
∗
(79.37)
(79.37)
(78.28)
(78.21)
Insider
transactionboughtnominals(log)
0.00236∗
∗∗0.00414∗∗
∗
(2.82)
(4.91)
Insider
transactionsold
nominals(log)
-0.00966∗∗
∗-0.0104∗∗
∗
(-11.73)
(-12.41)
Constant
8.124∗∗
∗8.149∗∗
∗8.076∗∗
∗8.117∗∗
∗
(91.04)
(90.90)
(91.01)
(91.18)
Observations
12906
12906
12906
12906
Adjusted
R2
0.644
0.645
0.649
0.650
F6490.6
5197.6
5288.8
4421.2
tstatisticsin
parentheses
∗p<
0.1
0,∗∗p<
0.0
5,∗∗
∗p<
0.01
232


