85
Jahresbericht 2002 des Lehrstuhls von Prof. Dr. Winfried Petry Physik Department E13 Technische Universit¨ at M ¨ unchen
Jahresbericht 2002
des Lehrstuhls von Prof. Dr. Winfried Petry
Physik Department E13
Technische Universitat Munchen

Prof. Dr. Winfried PetryLehrstuhl fur Experimentalphysik IVPhysik Department E13
Lehrstuhlvertreter 2002/2003:Prof. Dr. Ralf Rohlsberger
Lehrstuhlvertreter 2001/2002:Prof. Dr. Alfons Schulte
Physik Department E13Technische Universitat MunchenJames-Franck-StraßeD-85748 Garching
Sekreteriat: Elke Fehsenfeld
Tel.: 089 289 12452Fax: 089 289 12473
Email: [email protected]@ph.tum.de
http://www.e13.physik.tu-muenchen.de
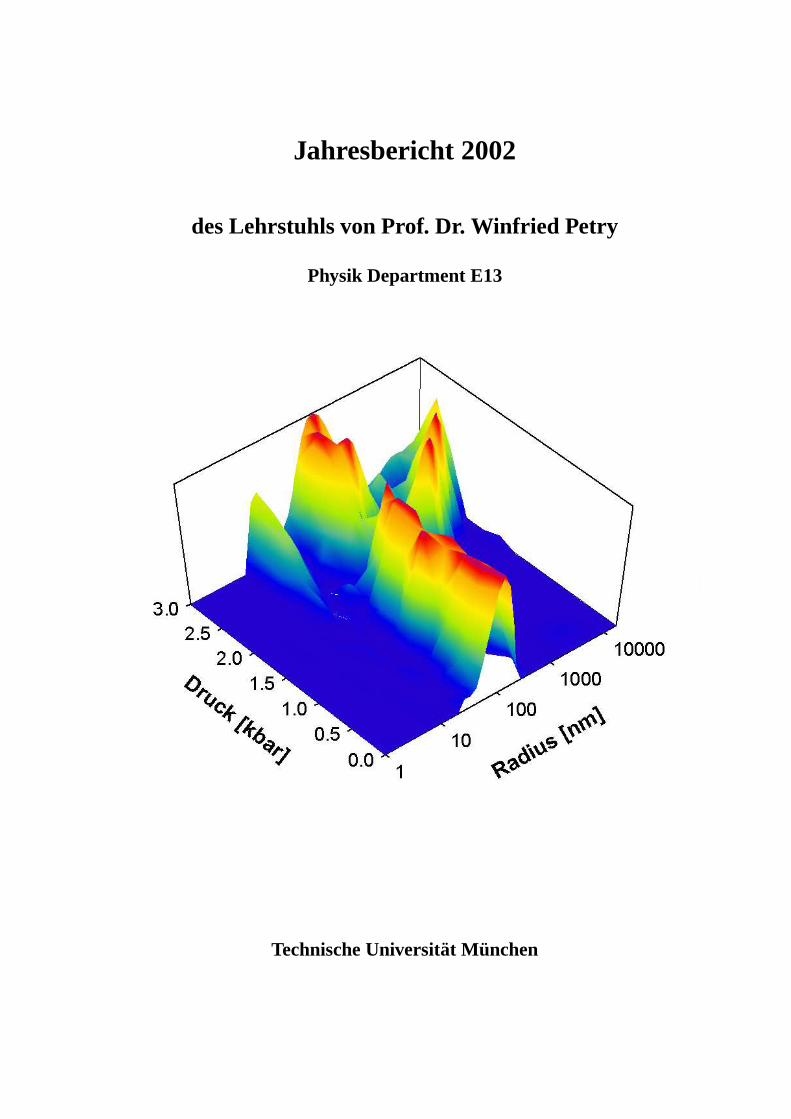
Titelbild:Hochdruckforschung an biomolekularen Komplexen. Dargestellt ist die Radienverteilung derCasein-Mizelle als Funktion des Drucks untersucht mit dynamischer Lichtstreuung und einemspeziellen Ruckstreudetektor. Caseinmizellen sind ca. 100 nm grosse Proteinassoziate der Milch,die das in Wasser wenig losliche Kalziumphosphat speichern. Man erkennt eine Stabilitatsgrenzebei ca. 2 kbar, bei der sich die Mizelle umorganisiert. Untersucht wird u.a., ob die Mizelle amorphstrukturiert, oder aus identischen Submizellen zusammengesetzt ist. Durch Hochdruck kann dieWechselwirkung zwischen den Komponenten moduliert und deren Struktur untersucht werden.
Dezember 2002Andreas Meyer
ii

Vorwort
Mit diesem Jahresbericht blicken wir zuruck auf ein produktives Jahr 2002 am Lehrstuhl E13des Physikdepartments. Die hier versammelten Beitrage spiegeln die Aktivitaten der Gruppe iminterdisziplinaren Gebiet der Physik weicher Materie wider. Das Spektrum der untersuchten Ma-terialien erstreckt sich von Schmelzen und ungeordneten Festkorpern uber Polymere bis hin zubiomolekularen Komplexen. Den Schwerpunkt der Untersuchungsmethoden bilden Lichtstreuungsowie Neutronen- und Rontgenstreuung, wobei letztere zum großten Teil an Großforschungsein-richtungen wie dem ILL, der ESRF oder dem HASYLAB durchgefuhrt werden. Auch in diesemJahr hat es dabei wieder eine Reihe von interessanten Entwicklungen gegeben.
Durch die Bewilligung von Forschungsantragen konnten in einigen Bereichen neue Forschungs-aktivitaten entfaltet werden. Der Arbeitsbereich ’biomolekulare Komplexe’ unter der Leitung vonWolfgang Doster wurde mit einem Projekt zur zeitaufgelosten Kalorimetrie in den Sonderfor-schungbereich 588 der DFG aufgenommen.
Auch die Arbeitsgruppe ’Polymere’ von Peter Muller-Buschbaum konnte sich weiter entfaltendurch die Genehmigung eines Projektes zur Untersuchung von polymeren Klebstoffen, das imRahmen eines BMBF Verbundprojektes angesiedelt ist. Durch die damit bewilligten Personal- undInvestitionsmittel kann das Methodenspektrum der Gruppe weiter ausgebaut werden, z.B. durchUntersuchung des Zusammenhangs zwischen strukturellen Eigenschaften ultradunner Polymer-filme und ihrer Haftfestigkeit. Daruberhinaus ist hervorzuheben, dass Peter Muller-Buschbaum indiesem Jahr seine Habilitationsschrift mit dem Titel “Nanostrukturierte Polymerfilme” eingereichthat und sich im Dezember dieses Jahres habilitiert hat. Zu der erwarteten Intensivierung der Poly-merphysik am Lehrstuhl durch Besetzung der C3 Professur auf Zeit ist es noch nicht gekommen,da der in diesem Jahr ergangene Ruf abgelehnt wurde.
Bei der Untersuchung mehrkomponentiger Schmelzen, die unter der Leitung von Andreas Meyerdurchgefuhrt werden, gibt es eine Reihe von interessanten Ergebnissen zum atomaren Transportin diesen Systemen. Insbesondere haben die Arbeiten der Gruppe zu den Themen Struktur undDynamik von Silikatschmelzen Eingang gefunden in den Jahresbericht 2002 des ILL, in welchemausgewahlte Highlights der Forschung hervorgehoben werden. Andreas Meyer hat im Novem-ber 2002 seine Habilitationsschrift mit dem Titel “Atomarer Transport in mehrkomponentigenSchmelzen” eingereicht.
Bereits im vergangenen Jahr hat die Methode der Kernresonanzstreuung unter Leitung von Uwevan Burck neuen Auftrieb erhalten durch die erstmalige Anwendung der gestorten ��� - Winkel-korrelation mit Synchrotronstrahlung (SRPAC) auf die Untersuchung der Dynamik weicher Ma-terie. Diese Methode konnte in Diskussionen mit Prof. S. Dattagupta wahrend seines mehrtagigenAufenthalts bei E13 theoretisch weiter untermauert werden. Daruberhinaus haben diese Arbeitendurch Aufnahme in die ESRF Highlights 2002 eine besondere Wurdigung erfahren.
Ich freue mich, dass die in diesem Jahr erzielten Resultate auch fur das kommende Jahr spannendeEntwicklungen und interessante Forschungsergebnisse erwarten lassen. Personlich danke ich denMitgliedern des Lehrstuhls E13 fur die freundliche Aufnahme als Lehrstuhlvertreter von Prof. Pe-try fur das akademische Jahr 2002/2003.
Ralf Rohlsberger Dezember 2002
iii

iv
Inhaltsverzeichnis
1 Instrumentelle und methodische Entwicklungen 1
A Super-Mirror Coated Fermi Chopper for the IN6 Time-of-Flight Spectrometer at theILL . . . . . . . . . . . . . . . . . . . . . . . . . . . . . . . . . . . . . . . . . 1
The high resolution time–of–flight spectrometer TOFTOF . . . . . . . . . . . . . . . . 3
Time domain interferometry: Analysis of results in the quantum beat and the radiativecoupling regimes . . . . . . . . . . . . . . . . . . . . . . . . . . . . . . . . . . 5
SRPAC: progress in methodology . . . . . . . . . . . . . . . . . . . . . . . . . . . . 7
Inelastic scattering of synchrotron radiation from FeNi alloys . . . . . . . . . . . . . . 10
2 Polymergrenzflachen 13
Nano-structured diblock copolymer films: A grazing incidence small-angle x-ray scat-tering study . . . . . . . . . . . . . . . . . . . . . . . . . . . . . . . . . . . . . 13
Dewetting of Confined Diblock Copolymer Films . . . . . . . . . . . . . . . . . . . . 15
Wetting behavior of thin polymer films on rough surfaces: A grazing incidence small-angle x-ray scattering study . . . . . . . . . . . . . . . . . . . . . . . . . . . . . 17
New composite materials: magnetic nanoparticles in copolymer films investigated byspecular and off-specular neutron scattering . . . . . . . . . . . . . . . . . . . . 19
Investigation of ultrathin polystyrene films . . . . . . . . . . . . . . . . . . . . . . . . 22
Gradient samples: heterogeneous polymer films . . . . . . . . . . . . . . . . . . . . . 23
Investigation of thin films of diblock-copolymer/metal composites . . . . . . . . . . . 25
Surface morphology of thin immiscible ternary polymer blend films investigated withGISAXS . . . . . . . . . . . . . . . . . . . . . . . . . . . . . . . . . . . . . . . 26
In-situ USAX and GISAXS investigation of adhesive polymers film properties . . . . . 28
Microscopic properties of adhesive polymer films . . . . . . . . . . . . . . . . . . . . 30
Scanning-USAX and Scanning-microfocus SAXS as tools to investigate defects atpolymer-polymer interfaces: A comparison . . . . . . . . . . . . . . . . . . . . 32
3 Struktur und Dynamik von Schmelzen 35
Schnelle Relaxation in Natriumboratschmelzen . . . . . . . . . . . . . . . . . . . . . 35
Struktur und Dynamik von Natriumtrigermanat-Schmelzen . . . . . . . . . . . . . . . 37
Nahordnung in Natriumsilikatschmelzen . . . . . . . . . . . . . . . . . . . . . . . . . 38
Car-Parinello Computer Simulations on Hydrous Silica(te) Systems . . . . . . . . . . 40
Quasielastic Neutron Scattering on PdNiP Melts . . . . . . . . . . . . . . . . . . . . . 42

4 Molek uldynamik 45
Experimente an Benzol in der Zeit– und Frequenzdomane . . . . . . . . . . . . . . . . 45
Der Modenkopplungsansatz in Methanol und Ethanol . . . . . . . . . . . . . . . . . . 47
The order-disorder phase transition in octamethyl-ethinyl-ferrocene (I): an organome-tallic rotator phase . . . . . . . . . . . . . . . . . . . . . . . . . . . . . . . . . . 49
The order-disorder phase transition in octamethyl-ethinyl-ferrocene (II): a nuclear inela-stic absorption study . . . . . . . . . . . . . . . . . . . . . . . . . . . . . . . . 51
Lichtstreuung an molekularen Flussigkeiten unter hohem Druck . . . . . . . . . . . . 54
5 Festkorpertheorie 56
Modenkopplungstheorie fur die Beschreibung anomaler Schwingungseigenschaften vonGlasern . . . . . . . . . . . . . . . . . . . . . . . . . . . . . . . . . . . . . . . 56
Bruchkontakt-Tunnelspektroskopie an dotierten Halbleitern . . . . . . . . . . . . . . . 58
6 Dynamik von Biomolek ulen 60
Assoziation von Myoglobin unter Druck . . . . . . . . . . . . . . . . . . . . . . . . . 60
Casein-Mizellen unter Hochdruck . . . . . . . . . . . . . . . . . . . . . . . . . . . . 61
Protein Diffusion in Crowded Solutions . . . . . . . . . . . . . . . . . . . . . . . . . 62
Elastic Resolution Spectroscopy of Weakly Scattering Samples . . . . . . . . . . . . . 62
FTIR-Spektoskopie an Proteinen und Bakterienmembranen . . . . . . . . . . . . . . . 63
7 Lehrveranstaltungen 65
Vorlesungen und Praktika . . . . . . . . . . . . . . . . . . . . . . . . . . . . . . . . . 65
Fortbildungsveranstaltung fur Gymnasiallehrer . . . . . . . . . . . . . . . . . . . . . 66
8 Allgemeine Zusammenstellungen 67
Diplomarbeiten, Dissertationen, Habilitationschriften, Auszeichnungen . . . . . . . . . 67
Drittmittelforderung . . . . . . . . . . . . . . . . . . . . . . . . . . . . . . . . . . . . 68
Veroffentlichungen . . . . . . . . . . . . . . . . . . . . . . . . . . . . . . . . . . . . 69
Auswartige Vortrage von Institutsmitgliedern . . . . . . . . . . . . . . . . . . . . . . 72
Eingeladene Vortrage an unserem Institut . . . . . . . . . . . . . . . . . . . . . . . . 76
Mitarbeiter und Gaste . . . . . . . . . . . . . . . . . . . . . . . . . . . . . . . . . . . 78
vi
1 Instrumentelle und methodische Entwicklungen
A Super-Mirror Coated Fermi Chopper for the IN6 Time-of-Flight Spectrometer atthe ILL
Markus Pohlmann��� �
, Christian Carbogno��� �
, Marek Koza�, Helmut Schober
�
�Physik-Department E13, Technische Universit at M unchen�Institut Laue-Langevin, Grenoble
In recent years much effort has been undertaken to improve existing neutron scattering facilitiesall over the world. In parallel numerical software has been established which allows to answermany “what were if” questions.Here we use the program package McStas [1] to simulate the time-of-flight spectrometer IN6 at theILL. The development of a Fermi chopper component for McStas was mandatory for this project.We provided this new McStas component, based on a straight-forward calculation of the neutrons’trajectory in the chopper with the option of super mirror coated chopper blades [2]. Thus, apartfrom the verification of the existing IN6 spectrometer (Cd chopper blades) we investigate theeffects of an additional super mirror layer on top of the spacers.
Z’
X’
Rw
1 2 3...................................Nslit
Al-Cd-slit packet
AbsorbingChopper walls
slit
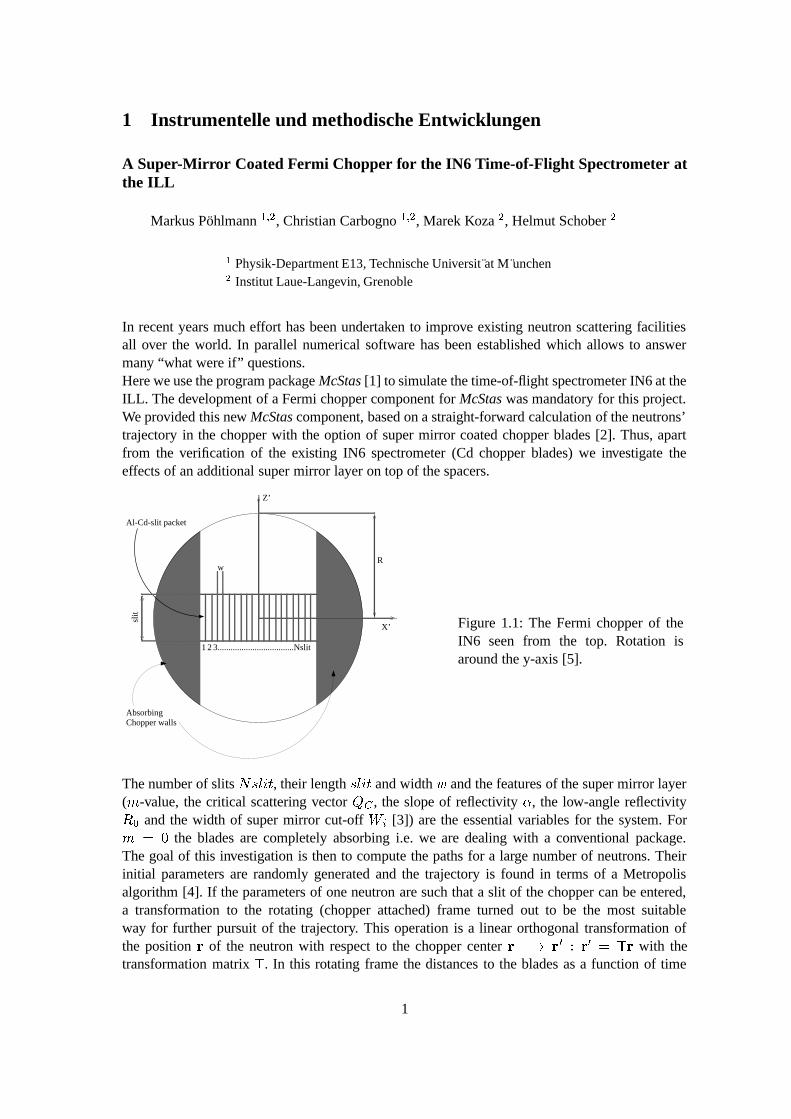
Figure 1.1: The Fermi chopper of theIN6 seen from the top. Rotation isaround the y-axis [5].
The number of slits������
, their length����
and width � and the features of the super mirror layer( � -value, the critical scattering vector ��� , the slope of reflectivity � , the low-angle reflectivity���
and the width of super mirror cut-off ��� [3]) are the essential variables for the system. For����� the blades are completely absorbing i.e. we are dealing with a conventional package.The goal of this investigation is then to compute the paths for a large number of neutrons. Theirinitial parameters are randomly generated and the trajectory is found in terms of a Metropolisalgorithm [4]. If the parameters of one neutron are such that a slit of the chopper can be entered,a transformation to the rotating (chopper attached) frame turned out to be the most suitableway for further pursuit of the trajectory. This operation is a linear orthogonal transformation ofthe position � of the neutron with respect to the chopper center �! #"$�&%(')�%*�,+-� with thetransformation matrix + . In this rotating frame the distances to the blades as a function of time
1
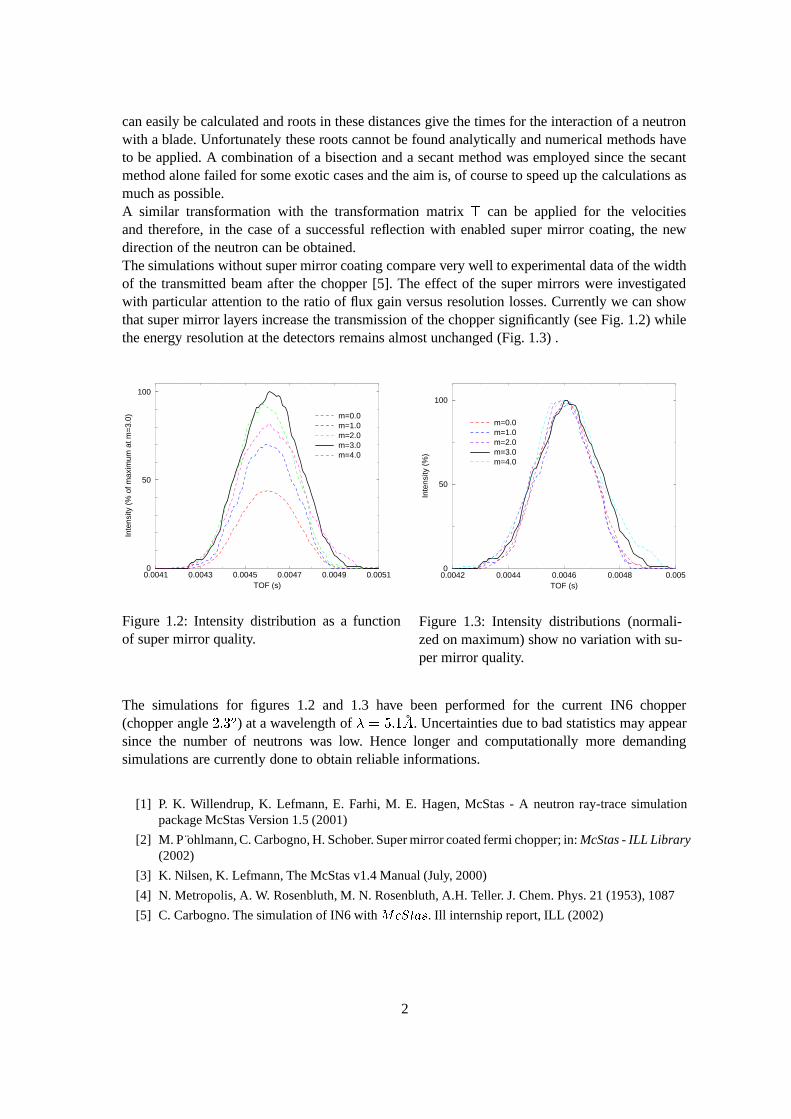
can easily be calculated and roots in these distances give the times for the interaction of a neutronwith a blade. Unfortunately these roots cannot be found analytically and numerical methods haveto be applied. A combination of a bisection and a secant method was employed since the secantmethod alone failed for some exotic cases and the aim is, of course to speed up the calculations asmuch as possible.A similar transformation with the transformation matrix + can be applied for the velocitiesand therefore, in the case of a successful reflection with enabled super mirror coating, the newdirection of the neutron can be obtained.The simulations without super mirror coating compare very well to experimental data of the widthof the transmitted beam after the chopper [5]. The effect of the super mirrors were investigatedwith particular attention to the ratio of flux gain versus resolution losses. Currently we can showthat super mirror layers increase the transmission of the chopper significantly (see Fig. 1.2) whilethe energy resolution at the detectors remains almost unchanged (Fig. 1.3) .
0.0041 0.0043 0.0045 0.0047 0.0049 0.0051TOF (s)
0
50
100
Inte
nsity
(%
of m
axim
um a
t m=
3.0) m=0.0
m=1.0m=2.0m=3.0m=4.0
Figure 1.2: Intensity distribution as a functionof super mirror quality.
0.0042 0.0044 0.0046 0.0048 0.005TOF (s)
0
50
100
Inte
nsity
(%
)m=0.0m=1.0m=2.0m=3.0m=4.0
Figure 1.3: Intensity distributions (normali-zed on maximum) show no variation with su-per mirror quality.
The simulations for figures 1.2 and 1.3 have been performed for the current IN6 chopper(chopper angle ��� ��� ) at a wavelength of � ����� ˚
�. Uncertainties due to bad statistics may appear
since the number of neutrons was low. Hence longer and computationally more demandingsimulations are currently done to obtain reliable informations.
[1] P. K. Willendrup, K. Lefmann, E. Farhi, M. E. Hagen, McStas - A neutron ray-trace simulationpackage McStas Version 1.5 (2001)
[2] M. P ohlmann, C. Carbogno, H. Schober. Super mirror coated fermi chopper; in: McStas - ILL Library(2002)
[3] K. Nilsen, K. Lefmann, The McStas v1.4 Manual (July, 2000)
[4] N. Metropolis, A. W. Rosenbluth, M. N. Rosenbluth, A.H. Teller. J. Chem. Phys. 21 (1953), 1087
[5] C. Carbogno. The simulation of IN6 with �� �������� . Ill internship report, ILL (2002)
2
The high resolution time–of–flight spectrometer TOFTOF
T. Unruh�, J. Ringe
�, J. Neuhaus
�, W. Petry
�Technische Universit at M unchen, ZWE FRM-II
The high resolution time of flight spectrometer TOFTOF is located in the neutron guide hall ofthe FRM–II. The instrument is being built by the Physics Department E13 of the TechnischeUniversitat Munchen. The multichopper instrument is best suited for the investigation of e.g.local motions in polymers, proteins and biological membranes, diffusion mechanisms of atoms ormolecules in condensed matter and dynamics of glass transitions.
The technological concept of the instrument described in detail elsewhere [1,2] has been developedon the basis of the results of Monte–Carlo simulations including the calculation of the elastic andinelastic resolution functions. In the following the progress of the construction of the instrumentis summarized.
The primary spectrometer
Main component of the primary spectrometer is a system of seven chopper discs used to produce anintense pulsed neutron beam with widely configurable intensity / energy resolution ratios. For thisspectrometer special carbon fibre discs with a diameter of 600 mm were developed in cooperationwith the Lehrstuhl fur Leichtbau. The discs have two and four slits respectively and are coatedwith elementary
� �B as neutron absorbing material.
Presently five of the discs are produced, tested and being mounted into the chopper vessels. Ano-ther two discs are under construction. For a first instrument version the chopper discs were testedat a rotation speed of 23000 rpm. An upgrade with discs that work on 26000 rpm or higher speedsis planned and pushed by recent successful tries with speeds up to 29000 rpm. The increase of theangular frequency of the discs leads to a significant improvement of the energy resolution of thespectrometer.
The chopper driving and control system has been completed by ASTRIUM, Friedrichshafen, in-cluding the communication software. The whole system with the mounted discs will be deliveredin spring 2003. The vacuum system for the vessels and the neutron guides and the supports for thevessels and the guide tubes are already installed. Thus the chopper system should be operationalin April 2003.
For neutron flux amplification at the sample position the neutron guide between the chopper ves-sels and the sample is constructed in an anti–trumpet–like configuration. The reflecting multilayerof the elements of the neutron guide which compresses the beam must have enlarged criticalangles. Therefore neutron guides with critical angles of � � � , � � � and � � ��� �
were or-dered from the company S-DH in Heidelberg, Germany. The coating of the glass elements hasrecently been completed and the assembling of the guides will be finished in 2002. Most of theglass elements surpass the demanded specification significantly. The whole guide is expected tobe deliverd and adjusted in the first quarter of 2003.
3

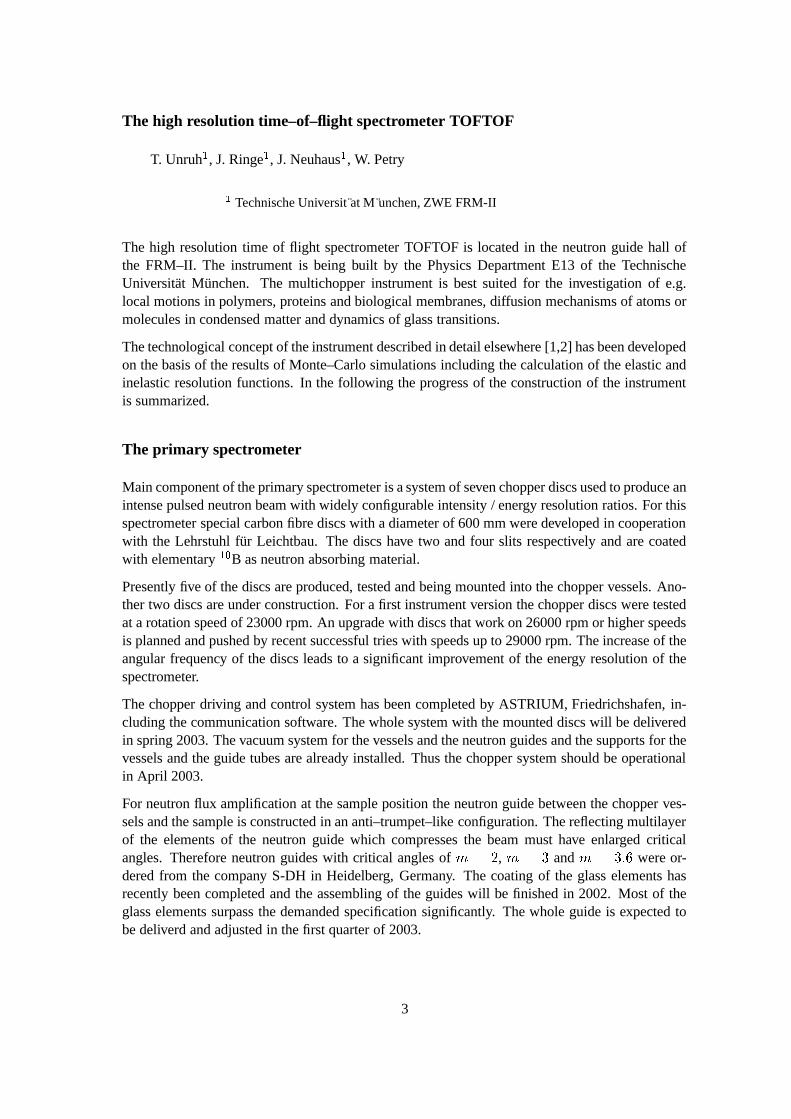
Figure 1.4: Flight chamber of the TOFTOF spectrometer
The secondary spectrometer
The flight chamber was built up in 2002. Fig. 1.4 gives an impression of the construction which isshielded from the outside with more than 11 t of B � C coated polyethylene. This shield will reducethe background signal of the detectors produced by cosmic radiation and parasitic scattering ofneutrons from other experiments. The inner side of the flight chamber is coated with cadmiumsheets which serve as absorption material for neutrons scattered to directions where no detectorsare installed. For fire protection the whole flight chamber has to be covered by a 1 mm Al-sheet.This work will be completed in January 2003.
The last part of the neutron guide, which can be replaced by a collimator to achieve higher � –resolution, is integrated into the sample chamber. A thin aluminium sheet separates the gas volu-mes of the sample and the flight chamber. The installation of the sample chamber will be comple-ted when the Al fire protection sheets are mounted.
In 2002 500�He–detectors were delivered by Canberra Eurisys. The detectors are squashed coun-
ting tubes with an active length of 400 mm and a depth of about 15 mm. The gas pressure is 10bar (9.7 bar
�He and 0.3 bar CF � ). The geometry of all detectors was measured using a specially
constructed semi automatic apparatus in order to check the agreement with the demanded specifi-cations. Presently for all detectors the pulse height spectra are measured using a Californium–252spontaneous fission neutron source.
Concerning the detectors and other electronic components we got excellent service and furthersupport from the central FRM–II detector and electronics laboratory. We greately acknowledgethe members of the mechanical workshop (E13), Reinhold Funer and Joachim Dorbecker, for theirengaged support in the building up of the flight chamber. We also thank the central workshop ofthe Physics Department where several components of the spectrometer were produced.
[1] A. Zirkel, W. Schneider, J. Neuhaus, W. Petry, Physica B, 128, 123 (2000)
[2] S.V. Roth, thesis, Technische Universit at M unchen (2001)
4
Time domain interferometry: Analysis of results in the quantum beat and the radia-tive coupling regimes
U. van Burck, G. V. Smirnov�, H. Franz
�, T. Asthalter
�, O. Leupold � , E. Schreier,
W. Petry
�Russian Research Center ’Kurchatov Institute’, Moscow�Hasylab, Hamburg�Institut f ur Physikalische Chemie, Universit at Stuttgart�Univ. Rostock; Univ. Paderborn; ESRF Grenoble
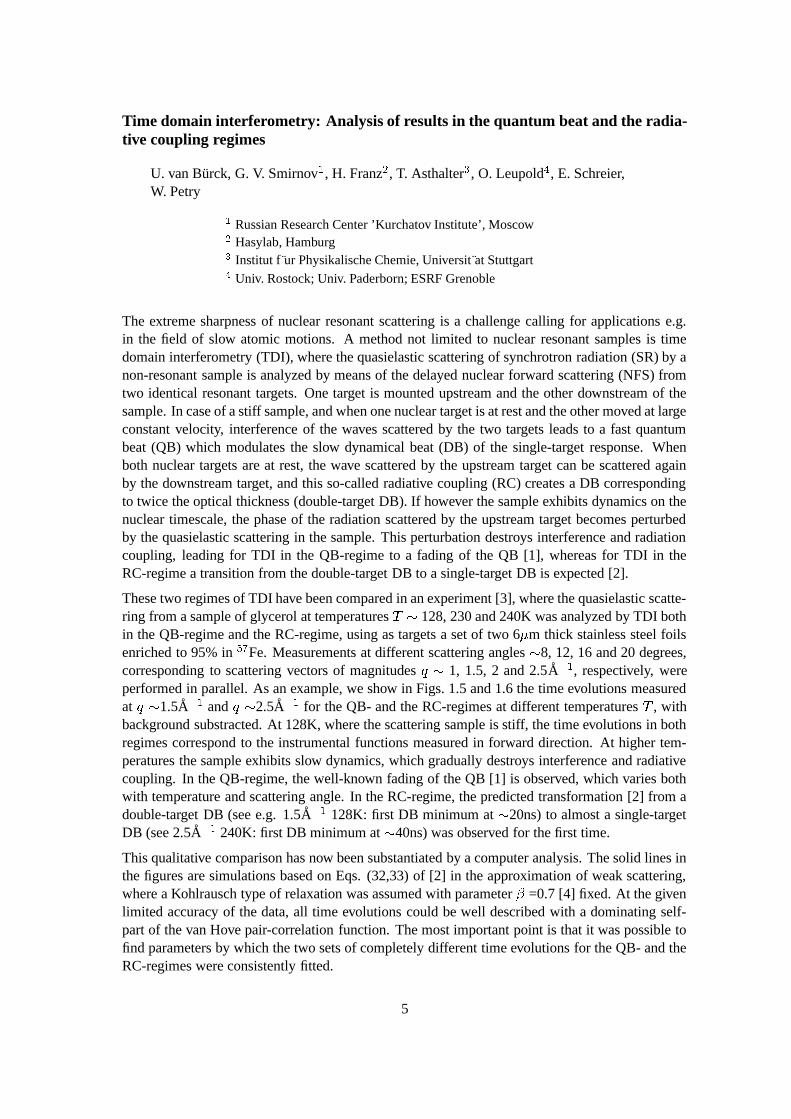
The extreme sharpness of nuclear resonant scattering is a challenge calling for applications e.g.in the field of slow atomic motions. A method not limited to nuclear resonant samples is timedomain interferometry (TDI), where the quasielastic scattering of synchrotron radiation (SR) by anon-resonant sample is analyzed by means of the delayed nuclear forward scattering (NFS) fromtwo identical resonant targets. One target is mounted upstream and the other downstream of thesample. In case of a stiff sample, and when one nuclear target is at rest and the other moved at largeconstant velocity, interference of the waves scattered by the two targets leads to a fast quantumbeat (QB) which modulates the slow dynamical beat (DB) of the single-target response. Whenboth nuclear targets are at rest, the wave scattered by the upstream target can be scattered againby the downstream target, and this so-called radiative coupling (RC) creates a DB correspondingto twice the optical thickness (double-target DB). If however the sample exhibits dynamics on thenuclear timescale, the phase of the radiation scattered by the upstream target becomes perturbedby the quasielastic scattering in the sample. This perturbation destroys interference and radiationcoupling, leading for TDI in the QB-regime to a fading of the QB [1], whereas for TDI in theRC-regime a transition from the double-target DB to a single-target DB is expected [2].
These two regimes of TDI have been compared in an experiment [3], where the quasielastic scatte-ring from a sample of glycerol at temperatures
���128, 230 and 240K was analyzed by TDI both
in the QB-regime and the RC-regime, using as targets a set of two 6 � m thick stainless steel foilsenriched to 95% in
���Fe. Measurements at different scattering angles
�8, 12, 16 and 20 degrees,
corresponding to scattering vectors of magnitudes � 1, 1.5, 2 and 2.5A � , respectively, wereperformed in parallel. As an example, we show in Figs. 1.5 and 1.6 the time evolutions measuredat � 1.5A � and � 2.5A � for the QB- and the RC-regimes at different temperatures
�, with
background substracted. At 128K, where the scattering sample is stiff, the time evolutions in bothregimes correspond to the instrumental functions measured in forward direction. At higher tem-peratures the sample exhibits slow dynamics, which gradually destroys interference and radiativecoupling. In the QB-regime, the well-known fading of the QB [1] is observed, which varies bothwith temperature and scattering angle. In the RC-regime, the predicted transformation [2] from adouble-target DB (see e.g. 1.5A � 128K: first DB minimum at
�20ns) to almost a single-target
DB (see 2.5A � 240K: first DB minimum at�
40ns) was observed for the first time.
This qualitative comparison has now been substantiated by a computer analysis. The solid lines inthe figures are simulations based on Eqs. (32,33) of [2] in the approximation of weak scattering,where a Kohlrausch type of relaxation was assumed with parameter � =0.7 [4] fixed. At the givenlimited accuracy of the data, all time evolutions could be well described with a dominating self-part of the van Hove pair-correlation function. The most important point is that it was possible tofind parameters by which the two sets of completely different time evolutions for the QB- and theRC-regimes were consistently fitted.
5

102
103
104
230 K
102
103
104
q = 1.5 A-1 , RC regimeq = 1.5 A-1 , QB regime
240 K
102
103
104
240 K
102
103
104
230 K
128 K
0 50 100 150
100
101
102
103
104C
ount
s
128 K
Time (ns)
0 50 100 150
100
101
102
103
104
Time (ns)
Figure 1.5:TDI spectra of glycerol in the QB-regime (left) and the RC-regime (right) at �
1.5A � at� �128, 230 and 240K. The solid lines are fits based on the theory [2].
102
103
104
230 K
102
103
104
q = 2.5 A-1 , RC regimeq = 2.5 A-1 , QB regime
240 K
102
103
104
240 K
102
103
104
230 K
128 K
0 50 100 150
100
101
102
103
104
128 K
Cou
nts
Time (ns)
0 50 100 150
100
101
102
103
104
Time (ns)
Figure 1.6:TDI spectra of glycerol in the QB-regime (left) and the RC-regime (right) at �
2.5A � at� �128, 230 and 240K. The solid lines are fits based on the theory [2].
Since the QB is a very pronounced feature of the time evolution measured in the QB-regime, its fa-ding due to sample dynamics is more easily recognized during the experiment than the correspon-ding changes of the DB in the RC-regime. The computer analysis, by contrast, is more sensitiveto relaxation parameters when the time evolutions were measured in the RC-regime. Therefore,for future experiments, we suggest to use the QB-regime for a first orientation and, subsequently,the RC-regime for the major part of the measurements. We also feel that the consistent fit of suchtwo different data sets increases the reliability of the data evaluation.
[1] A. Q. R. Baron, H. Franz, A. Meyer, R. R uffer, A. I. Chumakov, E. Burkel, W. Petry: Phys. Rev. Lett.79, 2823 (1997)
[2] G. V. Smirnov, V. G. Kohn, W. Petry: Phys. Rev. B 63, 144303 (2001)
[3] U. van B urck, G. V. Smirnov, H. Franz, T. Asthalter, O. Leupold, E. Schreier, W. Petry: Ann. ReportTUM Physik-Dep. E13, 42 (2001); ESRF report MI-533 (2002)
[4] J. Wuttke, W. Petry, S. Pouget: J. Chem. Phys. 105, 5177 (1996)
6

SRPAC: progress in methodology
I. Sergueev�, U. van Burck, A. I. Chumakov
� � �, R. Ruffer
�, T. Asthalter � , G. V.
Smirnov�, H. Franz
�, W. Petry
�TUM E13; ESRF Grenoble�ESRF, Grenoble�Russian Research Center ’Kurchatov Institute’, Moscow�Institut f ur Physikalische Chemie, Universit at Stuttgart�Hasylab, Hamburg
Since the first application of Synchrotron Radiation based Perturbed Angular Correlation (SR-PAC) to studies of dynamics in soft matter [1], the method has been improved considerably bychanging several important details. In a recent beamtime at ESRF ID18, a complete set of SR-PAC data has been taken under these conditions for the well-known [2,3] molecular glass formerferrocene/dibutylphthalate.
In contrast to the previous measurements [1], the incident radiation was now monochromatized to�6 meV by a standard high-resolution monochromator. A larger APD detector (area 10 � 10 mm
�)
was placed in a 90�
out-of-plane scattering geometry at closer distance to the scattering samplemounted in the cryostat, yielding a gain in solid angle by a factor of
�36, accepting in the same
time a slight decrease of the contrast due to angular averaging. The most important point, however,was that the measurements were now performed in single-bunch mode: First, the now sufficientlylarge time window enabled us to observe the slowly decaying incoherent signal (SRPAC) after thefast decaying disturbance [4] from the delayed coherent signal in forward direction (NFS) at lowtemperatures. Second, the large time window allowed us to follow the slow asymptotic approachof the SRPAC signal to the natural decay at high temperatures. Typical delayed countrates underthese conditions were
�50/s (
�1/s) with the incident energy set in resonance (off-resonance in a
phonon peak), respectively.
Typical time evolutions measured in resonance are shown in Fig. 1.7, where the left panel exhibitsthe SRPAC signals and the right panel the NFS signals measured in parallel at various tempera-tures. For SRPAC, the anisotropy
� ������������� � is displayed, which shows the deviation from thenatural decay, being connected with the measured intensity � � in the following way
� � �� � ����� � ��� ��� ��� � ������������� ��� (1.1)
where� ��� is the effective anisotropy coefficient, �(����� � the perturbation function, and
��the
natural lifetime (141 ns for���
Fe).
As an example for the low temperature region, the data obtained at 160 K are shown. At thistemperature the Lamb-Mossbauer factor ����� �
0.14, and the NFS signal is still rather intense (seeright panel upper curve), exhibiting even a pronounced dynamical beat envelope. As a result, its’shadow’ by nuclear and electronic 90
�scattering into the SRPAC channel dominates that channel
at early times (compare left panel upper curve). The decay of the NFS signal, however, is muchfaster than natural. Thus after some time, say
�200 ns, the slowly decaying SRPAC signal can
be observed without disturbances. Since there is hardly any slow dynamics yet at 160 K, theSRPAC spectrum exhibits a pronounced quantum beat (due to the electric quadrupole splitting offerrocene) without damping until late times.
7

Figure 1.7:Time evolutions of SRPAC (left) and NFS (right) at various temperatures. The solid lines are fitsaccording to the strong-collision model [8].
Above the glass transition of�
178 K, very fast dynamics becomes dominating, and � ��� decre-ases rapidly. As a consequence, the NFS intensity, which is proportional to � ��� � , vanishes. At206 K, � ��� � 0.01, and the NFS is already very weak, but can still be observed (see right panellower curve). A remarkable feature of this spectrum is its deviation from an exponential decay,giving direct evidence of Kohlrausch stretching and corroborating previous observations in thesame system [5]. The NFS is so weak that it does not disturb the SRPAC evolution any more,which starts now at early times with a clear quantum beat (see left panel second curve from top).However, at this temperature structural relaxation dominates, causing a considerable damping ofthe quantum beat towards later times. At higher temperatures, the signal becomes overdamped,and no quantum beat can be observed any more (see left panel, third curve from top, measured at231 K).
After passing through this intermediate region, at still higher temperatures the regime of fast re-laxation (Abragam-Pound limit [6]) is reached, where a slow asymptotic approach of the naturaldecay is observed. In this regime the time of approach is proportional to the relaxation rate, andfor this reason a large observation window is essential when high relaxation rates are to be deter-mined. A typical spectrum measured at 295 K is shown in the left panel, fourth curve from top,which nicely exhibits this slow approach of the natural decay. In the 90
�out-of-plane scattering
8
geometry, the SRPAC spectra start at time zero with destructive interference, and thus also theasymptotic approach occurs from the negative side. In order to corroborate this small deviationfrom the natural decay - which is essential for highest relaxation rates - SRPAC spectra can bemeasured also in 90
�in-plane scattering geometry, where the initial interference is constructive,
and where the asymptotic approach to the natural decay occurs from the opposite side. Such aspectrum is shown in the left panel, bottom curve. The comparison of these curves clearly demon-strates the sensitivity of the method.
Altogether data were taken in a temperature range of�
100 – 330 K, covering a range of relaxationtimes of � 1 � s - 20 ps, respectively. The evaluation of the comprehensive set of data is under way.Of special interest is here the separation of rotational and translational dynamics, which can beachieved due to the simultaneous measurement of the SRPAC (sensitive to rotation only) andNFS channels (sensitive to translation and rotation). Of further interest is the interpretation of theSRPAC data along different extreme models for rotational diffusion [7–9].
[1] I. Sergueev, U. van B urck, A. I. Chumakov, T. Asthalter, G. V. Smirnov, H. Franz, R. R uffer, W.Petry: Ann. Report TUM Physik-Dep. E13, 39 (2001); ESRF Highlights 2002
[2] S. L. Ruby, B. J. Zabransky, P. A. Flinn: J. Physique C6 37, 745 (1976)
[3] A. Meyer, H. Franz, J. Wuttke, W. Petry, N. Wiele, R. R uffer, C. H ubsch: Z. Phys. B 103, 479 (1997)
[4] G. V. Smirnov, V. G. Kohn: Phys. Rev. B 52, 3356 (1995)
[5] I. Sergueev, H. Franz, T. Asthalter, W. Petry, U. van B urck, G. V. Smirnov: Phys. Rev. B 66, 184210(2002)
[6] A. Abragam, R. V. Pound: Phys. Rev. 92, 943 (1953)
[7] H. Winkler: Z. Physik A 276, 225 (1976)
[8] S. Dattagupta: Relaxation phenomena in condensed matter physics, Orlando: Academic Press Inc.(1987)
[9] G. Diezemann, H. Sillescu: J. Chem. Phys. 111, 1126 (1999)
9
Inelastic scattering of synchrotron radiation from FeNi alloys
H. Franz�, K. Messel
�, G.V. Smirnov
�, W. Petry
�Hamburger Synchrotronstrahlungslabor am DESY, Hamburg�Russian Research Center ”Kurchatov Institute”, Moscow
In the last six years Nuclear Inelastic Absorption (NIA) has found an increasing number of appli-cations[1]. Most experiments use the 14.4 keV resonance of
���Fe, but also other isotopes like Sn
or Dy have been used. By its nature NIA gives a direct access to one important thermodynamicfunction: phonon density-of-states (DOS). This is a primary advantage of the method. The inter-pretation of the NIA data is straightforward and model independent. A specific feature of NIAis that the vibrational characteristics of the local environment of the resonant atom are probed inthe experiment. This may deliver a useful insight view on the relationship of various vibrationalmodes in complex molecular systems. However, NIA being by its nature an integrating measu-rement does not give a direct access to the phonon dispersion relations in contrast to inelasticneutron scattering. To overcome this drawback we have developed a code that allows, based on aBorn-van-Karman model, to derive force constants from the DOS and then use these to determinedispersion relations numerically.
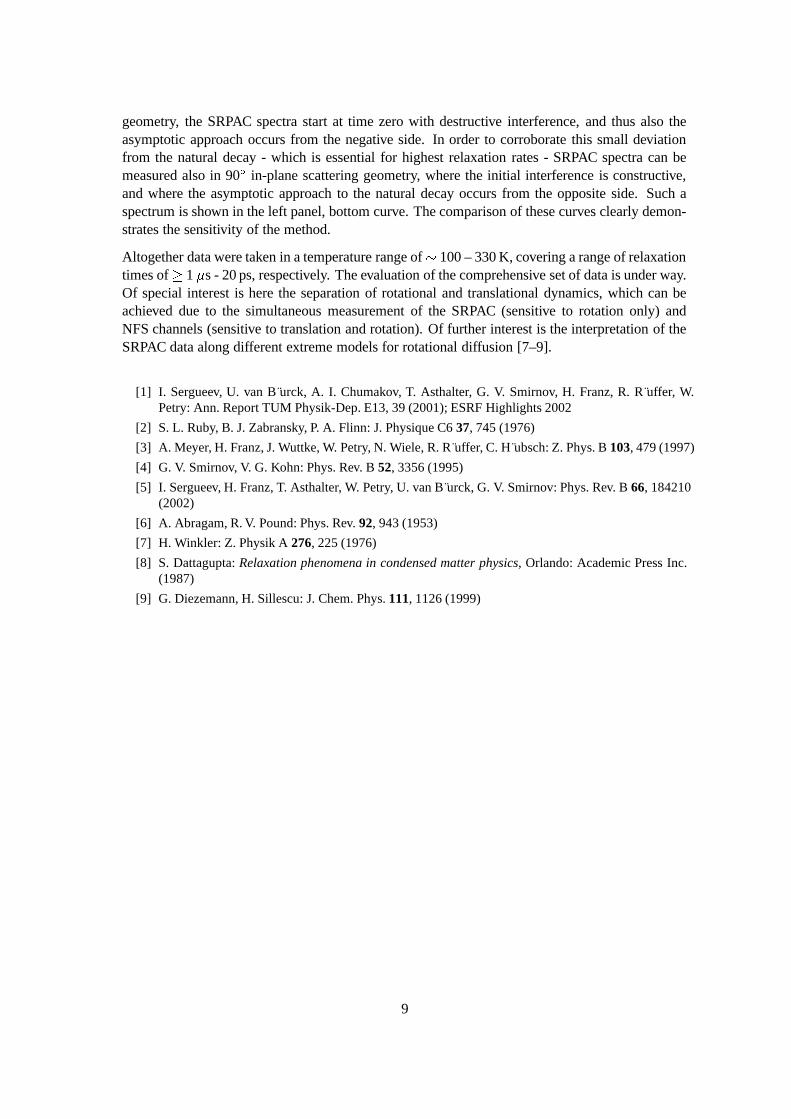
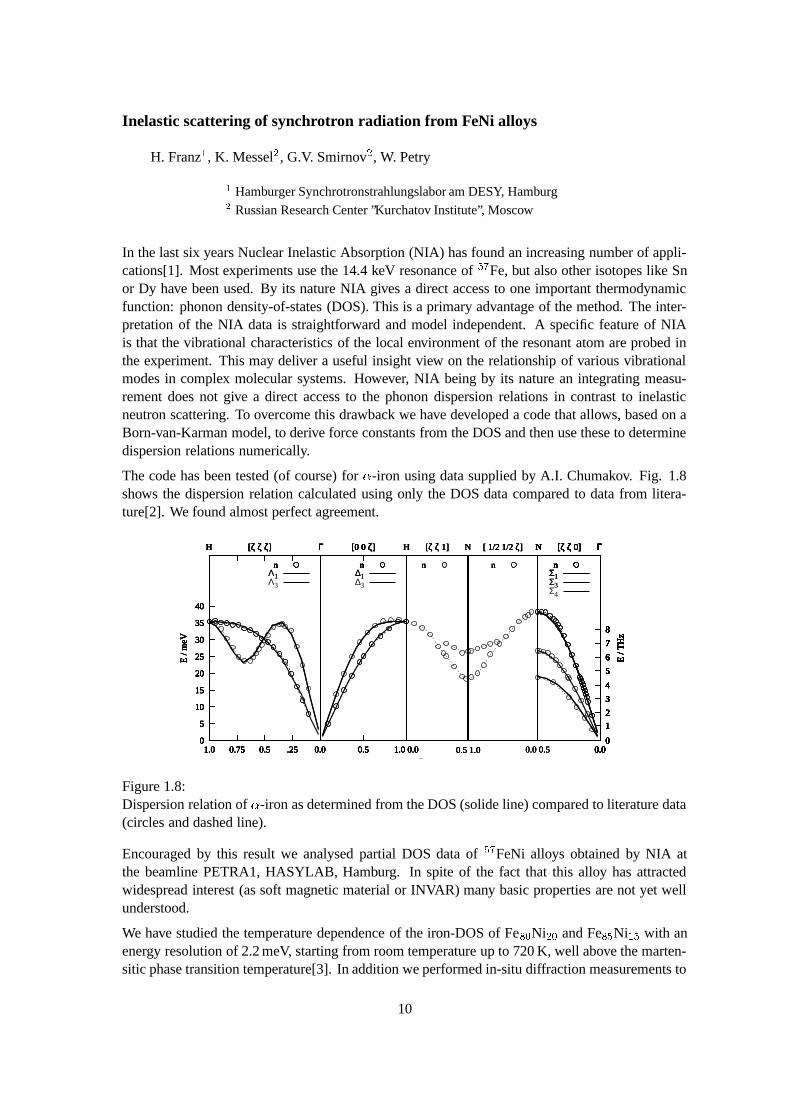
The code has been tested (of course) for � -iron using data supplied by A.I. Chumakov. Fig. 1.8shows the dispersion relation calculated using only the DOS data compared to data from litera-ture[2]. We found almost perfect agreement.
0
5
10
15
20
25
30
35
40
0.0.250.50.751.0
E /
meV
H [ζ ζ ζ] Γ
n
0
5
10
15
20
25
30
35
40
0.0.250.50.751.0
E /
meV
H [ζ ζ ζ] Γ
n
0
5
10
15
20
25
30
35
40
0.0.250.50.751.0
E /
meV
H [ζ ζ ζ] Γ
n
0
5
10
15
20
25
30
35
40
0.0.250.50.751.0
E /
meV
H [ζ ζ ζ] Γ
n
0
5
10
15
20
25
30
35
40
0.0.250.50.751.0
E /
meV
H [ζ ζ ζ] Γ
nΛ1
0
5
10
15
20
25
30
35
40
0.0.250.50.751.0
E /
meV
H [ζ ζ ζ] Γ
nΛ1Λ3
0.5 1.0 0.0
[0 0 ζ]
n
0.5 1.0 0.0
[0 0 ζ]
n
0.5 1.0 0.0
[0 0 ζ]
n
0.5 1.0 0.0
[0 0 ζ]
n
0.5 1.0 0.0
[0 0 ζ]
n∆1
0.5 1.0 0.0
[0 0 ζ]
n∆1∆3
0.5 1.0
ζ (2 π/ a0)
H [ζ ζ 1] N
n
0.5 1.0
ζ (2 π/ a0)
H [ζ ζ 1] N
n
0.5 1.0
ζ (2 π/ a0)
H [ζ ζ 1] N
n
0.5 1.0
ζ (2 π/ a0)
H [ζ ζ 1] N
n
0.0 0.5
[ 1/2 1/2 ζ]
n
0.0 0.5
[ 1/2 1/2 ζ]
n
0.0 0.5
[ 1/2 1/2 ζ]
n
0.0 0.5
[ 1/2 1/2 ζ]
n
0.00
1
2
3
4
5
6
7
8E
/ T
Hz
N [ζ ζ 0] Γ
n
0.00
1
2
3
4
5
6
7
8E
/ T
Hz
N [ζ ζ 0] Γ
n
0.00
1
2
3
4
5
6
7
8E
/ T
Hz
N [ζ ζ 0] Γ
n
0.00
1
2
3
4
5
6
7
8E
/ T
Hz
N [ζ ζ 0] Γ
n
0.00
1
2
3
4
5
6
7
8E
/ T
Hz
N [ζ ζ 0] Γ
n
0.00
1
2
3
4
5
6
7
8E
/ T
Hz
N [ζ ζ 0] Γ
n
0.00
1
2
3
4
5
6
7
8E
/ T
Hz
N [ζ ζ 0] Γ
nΣ1
0.00
1
2
3
4
5
6
7
8E
/ T
Hz
N [ζ ζ 0] Γ
nΣ1Σ3
0.00
1
2
3
4
5
6
7
8E
/ T
Hz
N [ζ ζ 0] Γ
nΣ1Σ3Σ4
Figure 1.8:Dispersion relation of � -iron as determined from the DOS (solide line) compared to literature data(circles and dashed line).
Encouraged by this result we analysed partial DOS data of���
FeNi alloys obtained by NIA atthe beamline PETRA1, HASYLAB, Hamburg. In spite of the fact that this alloy has attractedwidespread interest (as soft magnetic material or INVAR) many basic properties are not yet wellunderstood.
We have studied the temperature dependence of the iron-DOS of Fe ��Ni � � and Fe � � Ni � � with an
energy resolution of 2.2 meV, starting from room temperature up to 720 K, well above the marten-sitic phase transition temperature[3]. In addition we performed in-situ diffraction measurements to
10
control the phase purity and the transformation behaviour at the beamline PETRA2, HASYLAB.Moreover the exact composition of the alloys was determined by X-ray fluorescence analysis atbeamline L, HASYLAB.
As already reported in the previous year we
� observed a strong softening of the DOS while increasing the temperature and
� found phonon frequencies significantly below the values obtained in simulations[3].
0
0.005
0.01
0.015
0.02
0.025
0.03
0.035
0.04
0.045
0.05
0 2e+12 4e+12 6e+12 8e+12 1e+13 1.2e+13 1.4e+13
DO
S / T
Hz-1
ω / Hz
PartdosExperimental
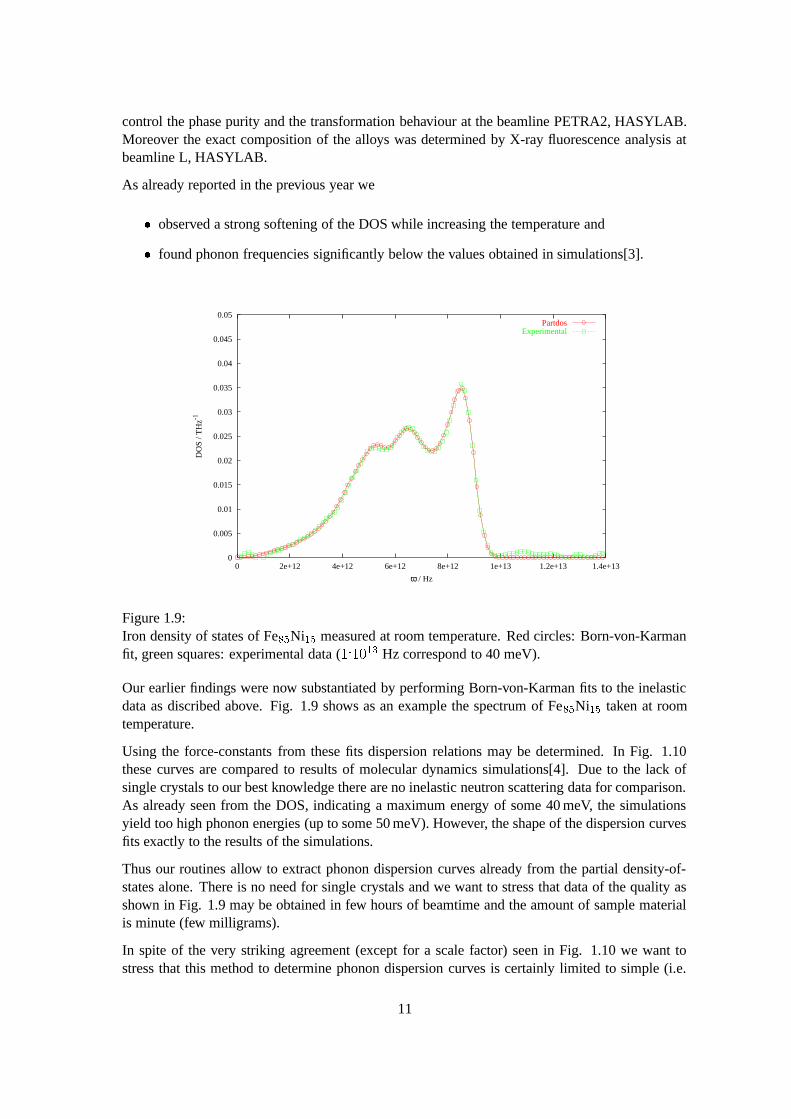
Figure 1.9:Iron density of states of Fe � � Ni � � measured at room temperature. Red circles: Born-von-Karmanfit, green squares: experimental data ( �� � � �
Hz correspond to 40 meV).
Our earlier findings were now substantiated by performing Born-von-Karman fits to the inelasticdata as discribed above. Fig. 1.9 shows as an example the spectrum of Fe � � Ni � � taken at roomtemperature.
Using the force-constants from these fits dispersion relations may be determined. In Fig. 1.10these curves are compared to results of molecular dynamics simulations[4]. Due to the lack ofsingle crystals to our best knowledge there are no inelastic neutron scattering data for comparison.As already seen from the DOS, indicating a maximum energy of some 40 meV, the simulationsyield too high phonon energies (up to some 50 meV). However, the shape of the dispersion curvesfits exactly to the results of the simulations.
Thus our routines allow to extract phonon dispersion curves already from the partial density-of-states alone. There is no need for single crystals and we want to stress that data of the quality asshown in Fig. 1.9 may be obtained in few hours of beamtime and the amount of sample materialis minute (few milligrams).
In spite of the very striking agreement (except for a scale factor) seen in Fig. 1.10 we want tostress that this method to determine phonon dispersion curves is certainly limited to simple (i.e.
11

0
5
10
15
20
25
30
35
40
0.0.250.50.751.0
E /
meV
H [ζ ζ ζ] Γ
n
0
5
10
15
20
25
30
35
40
0.0.250.50.751.0
E /
meV
H [ζ ζ ζ] Γ
n
0
5
10
15
20
25
30
35
40
0.0.250.50.751.0
E /
meV
H [ζ ζ ζ] Γ
n
0
5
10
15
20
25
30
35
40
0.0.250.50.751.0
E /
meV
H [ζ ζ ζ] Γ
n
0
5
10
15
20
25
30
35
40
0.0.250.50.751.0
E /
meV
H [ζ ζ ζ] Γ
nΛ1
0
5
10
15
20
25
30
35
40
0.0.250.50.751.0
E /
meV
H [ζ ζ ζ] Γ
nΛ1Λ3
0.5 1.0 0.0
[0 0 ζ]
n
0.5 1.0 0.0
[0 0 ζ]
n
0.5 1.0 0.0
[0 0 ζ]
n
0.5 1.0 0.0
[0 0 ζ]
n
0.5 1.0 0.0
[0 0 ζ]
n∆1
0.5 1.0 0.0
[0 0 ζ]
n∆1∆3
0.5 1.0
ζ (2 π/ a0)
H [ζ ζ 1] N
n
0.5 1.0
ζ (2 π/ a0)
H [ζ ζ 1] N
n
0.5 1.0
ζ (2 π/ a0)
H [ζ ζ 1] N
n
0.5 1.0
ζ (2 π/ a0)
H [ζ ζ 1] N
n
0.5 1.0
ζ (2 π/ a0)
H [ζ ζ 1] N
n
0.5 1.0
ζ (2 π/ a0)
H [ζ ζ 1] N
n
0.0 0.5
[ 1/2 1/2 ζ]
n
0.0 0.5
[ 1/2 1/2 ζ]
n
0.0 0.5
[ 1/2 1/2 ζ]
n
0.0 0.5
[ 1/2 1/2 ζ]
n
0.0 0.5
[ 1/2 1/2 ζ]
n
0.0 0.5
[ 1/2 1/2 ζ]
n
0.00
1
2
3
4
5
6
7
8
E /
TH
z
N [ζ ζ 0] Γ
n
0.00
1
2
3
4
5
6
7
8
E /
TH
z
N [ζ ζ 0] Γ
n
0.00
1
2
3
4
5
6
7
8
E /
TH
z
N [ζ ζ 0] Γ
n
0.00
1
2
3
4
5
6
7
8
E /
TH
z
N [ζ ζ 0] Γ
n
0.00
1
2
3
4
5
6
7
8
E /
TH
z
N [ζ ζ 0] Γ
n
0.00
1
2
3
4
5
6
7
8
E /
TH
z
N [ζ ζ 0] Γ
n
0.00
1
2
3
4
5
6
7
8
E /
TH
z
N [ζ ζ 0] Γ
nΣ1
0.00
1
2
3
4
5
6
7
8
E /
TH
z
N [ζ ζ 0] Γ
nΣ1Σ3
0.00
1
2
3
4
5
6
7
8
E /
TH
z
N [ζ ζ 0] Γ
nΣ1Σ3Σ4
Figure 1.10:Dispersion relations of Fe �
�Ni � � as determined from the DOS (solide line) compared to results of
molecular dynamics simulations[4] (circles and dashed lines).
few component) systems containing a significant amount of resonant isotopes. In this sense theiron rich FeNi alloys are certainly an ideal model case. Nevertheless there is quite a numberof Mossbauer isotopes suitable for this kind of investigations. Concerning the investigations ofcomplex systems, like for example molecular crystals where the resonant isotope may couple tofew modes only, the strength of NIA is certainly the ”filtering” of a limited number of interestingmodes.
[1] E. Gerdau, H. de Waard (Hrsg.): Nuclear resonant scattering of synchrotron radiation, Bussum:Baltzer Science Publishers (1999)
[2] Landolt-B ornstein Vol. 13a p 54
[3] H. Franz, T. Asthalter, M. Dommach, A. Ehnes, K. Messel, I. Sergueev, Hyperfine Interact. 141/142,131 (2002)
[4] R. Meyer, P. Entel, Phys.Rev.B 57, 5140 (1998)
12
2 Polymergrenzflachen
Nano-structured diblock copolymer films: A grazing incidence small-angle x-rayscattering study
P. Muller-Buschbaum, P. Panagiotou, M. Cristofolini�, P. Volodin
�
�Chemistry Department, Reading University�Institut f ur Polymerforschung, Dresden
Nano-structured polymer surfaces are of strong interest with respect to several applications. Fre-quently lithographic pattern techniques are utilized. One alternative way to prepare isotropic na-nostructures is based on the destabilization of extremely thin initially homogeneous films [1]. Dueto mass conservation both major dewetting process, the spinodal decomposition as well as thenucleation and growth process, give rise to an increase of the most prominent in-plane length sca-le with increasing thickness of the initial film. In a dewetting scenario the most prominent in-planelength is given by the distance between isolated drops [2]. In addition the drop diameter and thedrop distance are correlated. With decreasing drop distance the drop diameter decreases as welland frequently the denotation drop is replaced by droplet. To enter the regime of nanostructuresthe initial films used have to have extremely small thicknesses. In many systems these films areprepared by spin coating. Due to the film thickness which is small as compared to the radius ofgyration of the unperturbed molecule, the films are confined with respect to the spatial dimensi-on perpendicular to the substrate surface. Common destabilization techniques are the annealingabove the glass transition temperature or the storage under a solvent atmosphere [3].
Surface structures right after the spin coating process are an usual phenomena in thin blend ordiblock copolymer films [4]. Anyhow, most of these structures are rather large with typical laterallength scales in the order of several micrometers. In the present investigation we present thepossibility to gain nanostructured polymer surfaces right after the spin coating by just followingthe similar rout which usually works in dewetting systems: Decreasing the film thickness bydecreasing the polymer concentration in the solution used for the spin coating.
As model system we chose a symmetric poly(styrene-block-isoprene) diblock copolymer, denotedP(S-b-I), with a molecular weight of 13k. The investigation of the surface structures in real spacewas performed with scanning force microscopy, depicting the surface topography. To learn aboutpossible internal structures inside the nanostructures we used an advanced scattering technique:Grazing incidence small angle x-ray scattering and grazing incidence ultra-small angle scattering.Due to extremely small scattering volume of the polymeric nanostructures these experiments wererestricted to synchrotron radiation.
The grazing incidence small angle x-ray scattering (GISAXS) measurements were performed atthe BW4 USAX beamline of the DORIS III storage ring at HASYLAB/DESY in Hamburg. Thusthe common transmission geometry was replaced by a reflection geometry and the sample was pla-ced horizontally on a two-circle goniometer with a z-translation table. Only one Be-window sepa-rated the storage ring from the detector side. By avoiding any additional windows the backgroundwas minimized. The selected wavelength was 0.15 nm. The scattered intensity was recorded witha two dimensional detector which consists of a 512x512 pixel array. To enlarge the accessiblewave vector range two different sample-detector distances were operated. At a small distance of
13
1.9 m length scales between 6 and 380 nm can be resolved (GISAXS) and at a large distance of12.8 m this interval is shifted to 39 and 2500 nm (GIUSAX) respectively. The beam divergence inand out of the plane of reflection was set by two entrance cross-slits. At one fixed angle of incidentthe two-dimensional intensity distribution can be cut in several vertical and horizontal slices withrespect to the sample surface. Vertical slices contain mainly scattering information from structuresperpendicular to the sample surface, whereas horizontal slices contain only scattering contributi-ons with an in-plane information. Thus for the investigation of surface morphologies we restrictourselves to horizontal slices, which are frequently called ’out-of plane-scans’.
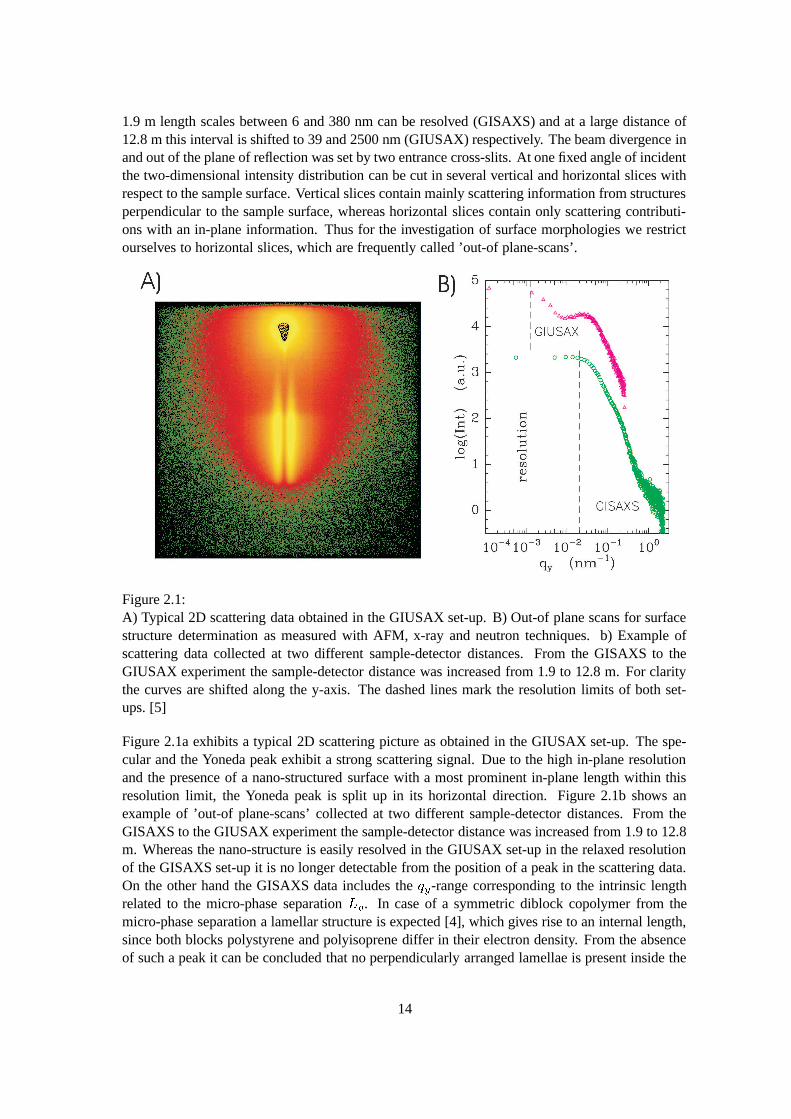
Figure 2.1:A) Typical 2D scattering data obtained in the GIUSAX set-up. B) Out-of plane scans for surfacestructure determination as measured with AFM, x-ray and neutron techniques. b) Example ofscattering data collected at two different sample-detector distances. From the GISAXS to theGIUSAX experiment the sample-detector distance was increased from 1.9 to 12.8 m. For claritythe curves are shifted along the y-axis. The dashed lines mark the resolution limits of both set-ups. [5]
Figure 2.1a exhibits a typical 2D scattering picture as obtained in the GIUSAX set-up. The spe-cular and the Yoneda peak exhibit a strong scattering signal. Due to the high in-plane resolutionand the presence of a nano-structured surface with a most prominent in-plane length within thisresolution limit, the Yoneda peak is split up in its horizontal direction. Figure 2.1b shows anexample of ’out-of plane-scans’ collected at two different sample-detector distances. From theGISAXS to the GIUSAX experiment the sample-detector distance was increased from 1.9 to 12.8m. Whereas the nano-structure is easily resolved in the GIUSAX set-up in the relaxed resolutionof the GISAXS set-up it is no longer detectable from the position of a peak in the scattering data.On the other hand the GISAXS data includes the �� -range corresponding to the intrinsic lengthrelated to the micro-phase separation
�
� . In case of a symmetric diblock copolymer from themicro-phase separation a lamellar structure is expected [4], which gives rise to an internal length,since both blocks polystyrene and polyisoprene differ in their electron density. From the absenceof such a peak it can be concluded that no perpendicularly arranged lamellae is present inside the
14

nano-strcuture [3]. Combining both information we obtain a statistical description of the surfacestructure: Objects are located in a mean next neighbour distance giving rise to a structure factorsignal. Neither a form factor nor an internal length scale are detected. Visualised by atomic for-ce microscopy, droplets of polymeric material are sitting on top of the silicon surface yielding astructure factor signal. The mean diameter of the droplets is varying which suppresses the formfactor information.
[1] P. M uller-Buschbaum, J. S. Gutmann, M. Stamm; Phys. Chem. Chem. Phys. 1, 3857 (1999)
[2] F. Brochard-Wyart, J. Daillant; Can. J. Phys. 68, 1084 (1990)
[3] P. M uller-Buschbaum, M. Wolkenhauer, O. Wunnicke, M. Stamm, R. Cubitt, W. Petry; Langmuir17, 5567 (2001)
[4] I. W. Hamley, The Physics of Block Copolymers, Oxford University Press (1998)
[5] P. M uller-Buschbaum, N. Hermsdorf, J. S. Gutmann, M. Stamm, S. Cunis, R. Gehrke, W. Petry; tobe published
Dewetting of Confined Diblock Copolymer Films
P. Muller-Buschbaum, S. Loi, E. Maurer, A. Gotzendorfer, R. Cubitt�
�ILL, Grenoble
Engineered nanostructures like quantum dots, nanowires, nanotubes or nanolayers are of stronginterest for basic research as well as with respect to future applications. This includes the optionof new properties due to surface effects and size reduction down to a regime in which a characte-ristic length scale of a physical phenomenon becomes comparable with the typical length scale ofthe nanostructure. As a consequence the control of nano-structured surfaces marks the first basicstep. Complementary to lithographic patterning techniques the creation of nanostructures due toself-organization has become increasingly important. Following the approach of soft-lithographystructures down to several 10 nm are accessible and most likely these techniques are utilized forthe creation on an isotropic surface pattern comparable to the common resist technique in semi-conductor industry. Isotropic structures are easily created by the concept of self-assembly. Whilephase separated surface structures in polymer blend films are typically of micrometer size, micro-phase separation in diblock copolymer systems is well known to offer nanostructures in the bulk aswell as in thin films [1]. Recently, it was shown, that from a destabilization of confined ultra-thinfilms nano-structured polymeric surfaces result as well [2]. Following the scaling laws of dewet-ting due to the reduced amount of polymeric material available, the size of the resulting structuresdecreases with decreasing film thickness. Destabilizing confined ultra-thin diblock copolymerfilms thus offers the opportunity to introduce two intrinsic lateral length scales, the characteristicperiodicity of the micro phase separation structure
�
� and the most prominent in-plane lengthof the dewetting structure
�. For a large range of molecular weights of the diblock copolymers
�
�� �
is fulfilled and the primary structure is given by the dewetting process. The resultingstructure are pancake shaped droplets with an internally periodically arranged micro phase sepa-ration structure [3]. As usual for self-assembled structures it is isotropic which is helpful for manyapplications like sensors or templates (function does not depend on the orientation of the struc-ture) [4]. In case, not only the characteristic lateral length have to be controlled but in additionthe type of structure installed at the surface is of importance, final dewetting states are no longer
15
sufficient. Due to the minimization of the contact line area the final dewetting state is given by adrop which degenerates in case of ultra-thin films into a pancake shaped droplet. However, sincethere is no need to restrict only to final states, with the presented investigation we address theintermediate states which are accessible during the destabilization process.
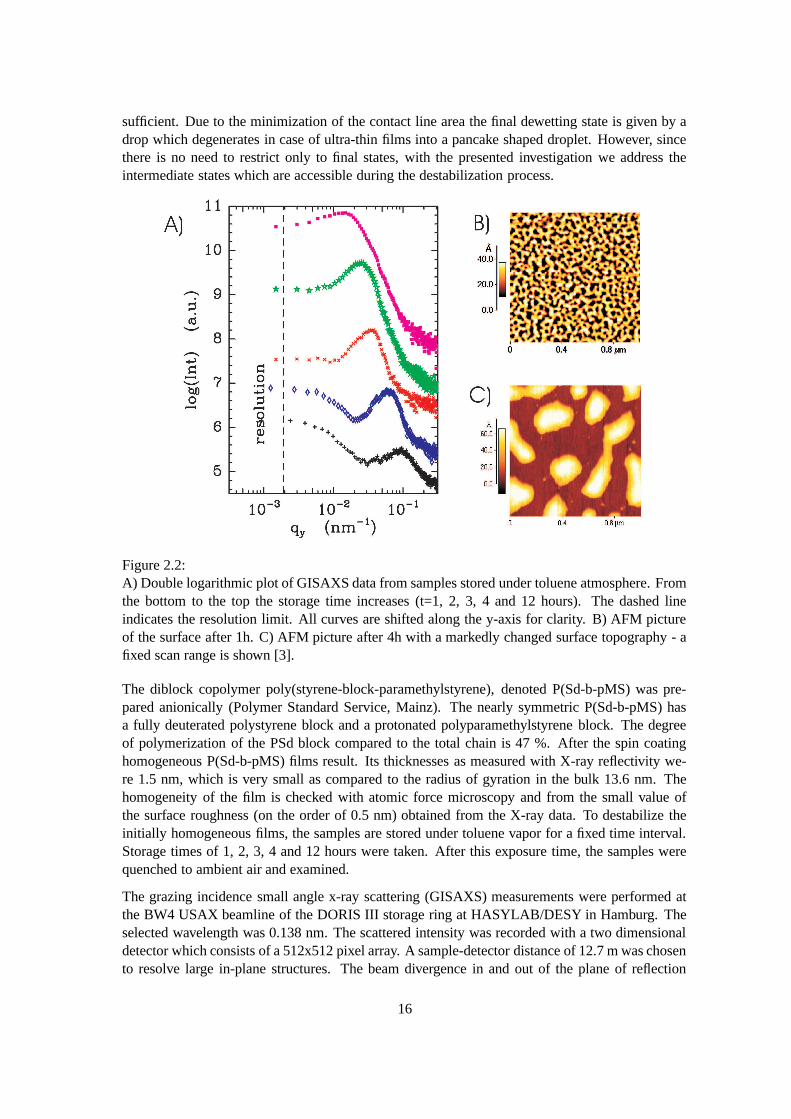
Figure 2.2:A) Double logarithmic plot of GISAXS data from samples stored under toluene atmosphere. Fromthe bottom to the top the storage time increases (t=1, 2, 3, 4 and 12 hours). The dashed lineindicates the resolution limit. All curves are shifted along the y-axis for clarity. B) AFM pictureof the surface after 1h. C) AFM picture after 4h with a markedly changed surface topography - afixed scan range is shown [3].
The diblock copolymer poly(styrene-block-paramethylstyrene), denoted P(Sd-b-pMS) was pre-pared anionically (Polymer Standard Service, Mainz). The nearly symmetric P(Sd-b-pMS) hasa fully deuterated polystyrene block and a protonated polyparamethylstyrene block. The degreeof polymerization of the PSd block compared to the total chain is 47 %. After the spin coatinghomogeneous P(Sd-b-pMS) films result. Its thicknesses as measured with X-ray reflectivity we-re 1.5 nm, which is very small as compared to the radius of gyration in the bulk 13.6 nm. Thehomogeneity of the film is checked with atomic force microscopy and from the small value ofthe surface roughness (on the order of 0.5 nm) obtained from the X-ray data. To destabilize theinitially homogeneous films, the samples are stored under toluene vapor for a fixed time interval.Storage times of 1, 2, 3, 4 and 12 hours were taken. After this exposure time, the samples werequenched to ambient air and examined.
The grazing incidence small angle x-ray scattering (GISAXS) measurements were performed atthe BW4 USAX beamline of the DORIS III storage ring at HASYLAB/DESY in Hamburg. Theselected wavelength was 0.138 nm. The scattered intensity was recorded with a two dimensionaldetector which consists of a 512x512 pixel array. A sample-detector distance of 12.7 m was chosento resolve large in-plane structures. The beam divergence in and out of the plane of reflection
16

was set by two entrance cross-slits. At one fixed angle of incident the two-dimensional intensitydistribution can be cut in several vertical and horizontal slices with respect to the sample surface.For the investigation of surface morphologies we restrict ourselves to horizontal slices, which arefrequently called out-of plane-scans.
Figure 2.2A shows GISAXS data. Data measured at different destabilization times are compared.From the bottom to the top the storage time under toluene vapour increases. Irrespective of theannealing time all GISAXS data show a peak, which shifts towards smaller � values with incre-asing toluene atmosphere storage time. Thus with ongoing destabilization the evolving structuresare increasing in their lateral size. In addition, the peak height increases which results from anincreased scattering contrast. During the destabilization the height of the structures increases aswell. In real space this is nicely pictured with AFM (see figure 2.2B, C). Already after 1 hour sto-rage time (figure 2.1B) a nano-structured surface has evolved. A highly interconnected network ofribbon like structures covers the substrate surface. This nanostructure observed in the early state ofstructure creation is basically determined by the dimensions of the diblock copolymer moleculesitself. It marks a sort of lower limit with respect to the size unless only single chains are addressed.After 4 hours of storage time (figure 2.1C) this ribbon structure is broken into isolated droplets.
[1] T. P. Russell; Science 297, 964 (2002)
[2] P. M uller-Buschbaum, M. Wolkenhauer, O. Wunnicke, M. Stamm, R. Cubitt, W. Petry; Langmuir17, 5567 (2001)
[3] P. M uller-Buschbaum, R. Cubitt, W. Petry; to be published
[4] G. Bauer, F. Pittner, T. Schalkhammer; Mikochim. Acta 131, 107 (1999)
Wetting behavior of thin polymer films on rough surfaces: A grazing incidencesmall-angle x-ray scattering study
P. Volodin�, N. Hermsdorf
�, P. Panagiotou,T. Titz, P. Muller-Buschbaum, M. Stamm
�
�Institut f ur Polymerforschung, Dresden
The stability of thin polymer films on solid substrates is an interesting phenomenon from thetechnological and scientific point of view. Polymeric coating, paints, lubrication of thin films,lithography, dielectric layers are often used in different modern technologies.
In principle, two kinds of instability of a thin film on a solid substrate are distinguished [1]. Spino-dal dewetting is caused by amplified fluctuations of the film surface in field of repulsive interactiveforces between the solid substrate and the films. In this case, the film is unstable. Nucleated de-wetting is the rupture of the film due to a contamination or impurities on the substrate surface.In the past, spinodal dewetting of unstable thin films on smooth substrates was well studied. De-wetting of unstable thin films on physically and chemically heterogeneous substrates has beenanalysed [2,3]. If interactive forces between a film and a substrate are changed from repulsive toattractive forces along the film thickness the film becomes metastable [4]. In this case, spinodaldewetting is not observable. Break-up of the film can be caused by nucleation only. In repor-ted study we investigate the stability of metastable polystyrene films on physically heterogeneoussubstrate surfaces.
17
As substrates we used different treated silicon wafers. The silicon wafers were washed in am-monium peroxide solution (NH � 40 %, H � O � 40 %, H � O 20 %) and rinsed several times withMilli-Q water. Then the substrate were etched in 20 % KOH-methanol solution in an ultra sonicbath at temperature 600 � C for several minutes. After etching, samples were washed several timesin methanol, then in piranha (H � SO � 30 %, H � O � 70 %) and ammonium peroxide solution (NH 40%, H � O � 40 %, H � O 20 %) followed by rinsing with Milli-Q water. Control of roughness of thesesubstrates was carried out by atomic force microscopy measurements at scan ranges of typically25 � m x 25 � m. The root mean square (RMS) roughness parameter of the silicon surfaces etchedwith 20 % KOH-methanol can be varied within a range between 10 to 80 nm. In order to preparesamples with roughness smaller than 20 nm we changed the solvent for our etching conditionsfrom methanol to ethanol. Etching in 20 % KOH-ethanol solution was applied in ultra sonic bathat temperature 60 � C for several minutes. In this case, the roughness of 20 % KOH-ethanol etchedsilicon surfaces ranges between 3 to 20 nm.
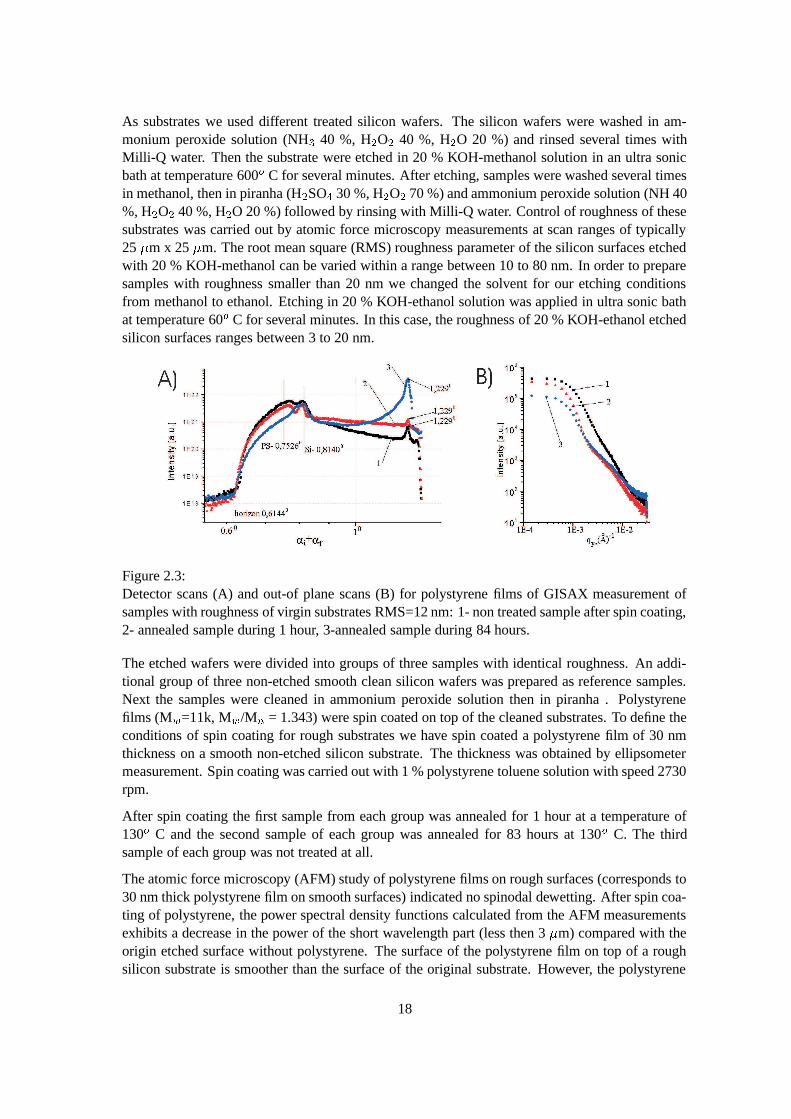
Figure 2.3:Detector scans (A) and out-of plane scans (B) for polystyrene films of GISAX measurement ofsamples with roughness of virgin substrates RMS=12 nm: 1- non treated sample after spin coating,2- annealed sample during 1 hour, 3-annealed sample during 84 hours.
The etched wafers were divided into groups of three samples with identical roughness. An addi-tional group of three non-etched smooth clean silicon wafers was prepared as reference samples.Next the samples were cleaned in ammonium peroxide solution then in piranha . Polystyrenefilms (M � =11k, M � /M � = 1.343) were spin coated on top of the cleaned substrates. To define theconditions of spin coating for rough substrates we have spin coated a polystyrene film of 30 nmthickness on a smooth non-etched silicon substrate. The thickness was obtained by ellipsometermeasurement. Spin coating was carried out with 1 % polystyrene toluene solution with speed 2730rpm.
After spin coating the first sample from each group was annealed for 1 hour at a temperature of130 � C and the second sample of each group was annealed for 83 hours at 130 � C. The thirdsample of each group was not treated at all.
The atomic force microscopy (AFM) study of polystyrene films on rough surfaces (corresponds to30 nm thick polystyrene film on smooth surfaces) indicated no spinodal dewetting. After spin coa-ting of polystyrene, the power spectral density functions calculated from the AFM measurementsexhibits a decrease in the power of the short wavelength part (less then 3 � m) compared with theorigin etched surface without polystyrene. The surface of the polystyrene film on top of a roughsilicon substrate is smoother than the surface of the original substrate. However, the polystyrene
18
film repeats big structural features (more than 5 � m). After annealing of the polystyrene films, weobserve a continuous decrease of the short wavelength part of the power spectral density. Due tothe annealing of the polystyrene film the surface becomes smoother compared with an untreatedpolystyrene film. The grazing incidence small angle x-ray scattering (GISAXS) measurementswere performed at the BW4 USAX beamline of the DORIS III storage ring at HASYLAB/DESYin Hamburg. We used a set-up of high-quality entrance slits and a completely evacuated pathway.The two-dimensional 512x512 pixels array detector was used. Distance between sample and de-tector was chosen to be 12690 mm. The angle of incidence was aligned to be 0.6144 � .
The specular reflected beam is observable at exit angles ��� � � � . At ��� � ��� the Yoneda peakis measured. Due to the dependence of the Yoneda peak position on the electron density the po-sition is characteristic for the material illuminated with the x-ray beam. Slices with � � =const.and ��� =const. are called out-of plane scans. These scans only include information about late-ral structures. At a fixed incident angle of � � =0.6144 � the prominent features in a detector scan,the specular as well as the Yoneda Peak are well-separated. The specular peak showed a strongdecrease in its intensity with increasing surface roughness. At a rms-roughness of 12 nm it wascompletely vanished at the chosen angle of incidence. As a consequence, with increasing rough-ness the diffusely scattering intensity increases as well. Figure 2.3a shows the detector scans fora fixed medium surface roughness (1- non treated sample, 2- annealed sample during 1 hour and3-annealed sample during 84 hours) exhibiting marked differences. In the view of our AFM study,the decrease in the intensity at the position of the Yoneda peak corresponding to PS can be explai-ned by the decrease of the rms- surface roughness for polystyrene films during annealing aboveglass transition temperature. The corresponding out-of plane scans are shown in figure 2.3b. Whi-le the untreated film is characterized by a power-law decay of the intensity due to the roughenedsurface, in the annealed PS film already a first indication of a dominant in-plane length is present.With ongoing annealing its lateral length is not modified, but becomes more pronounced.
[1] F. Brochard-Wyart, J. Daillant; Can. J. Phys. 68, 1084 (1990)
[2] K. Kargupa, R. Konnur, A. Sharma; Langmuir 16, 10243 (2000)
[3] K. Kargupa, A. Sharma; Langmuir 18, 1893 (2002)
[4] R. Seemann, S. Herminghaus, K. Jacobs; Phys. Rev. Lett. 86, 5534 (2001)
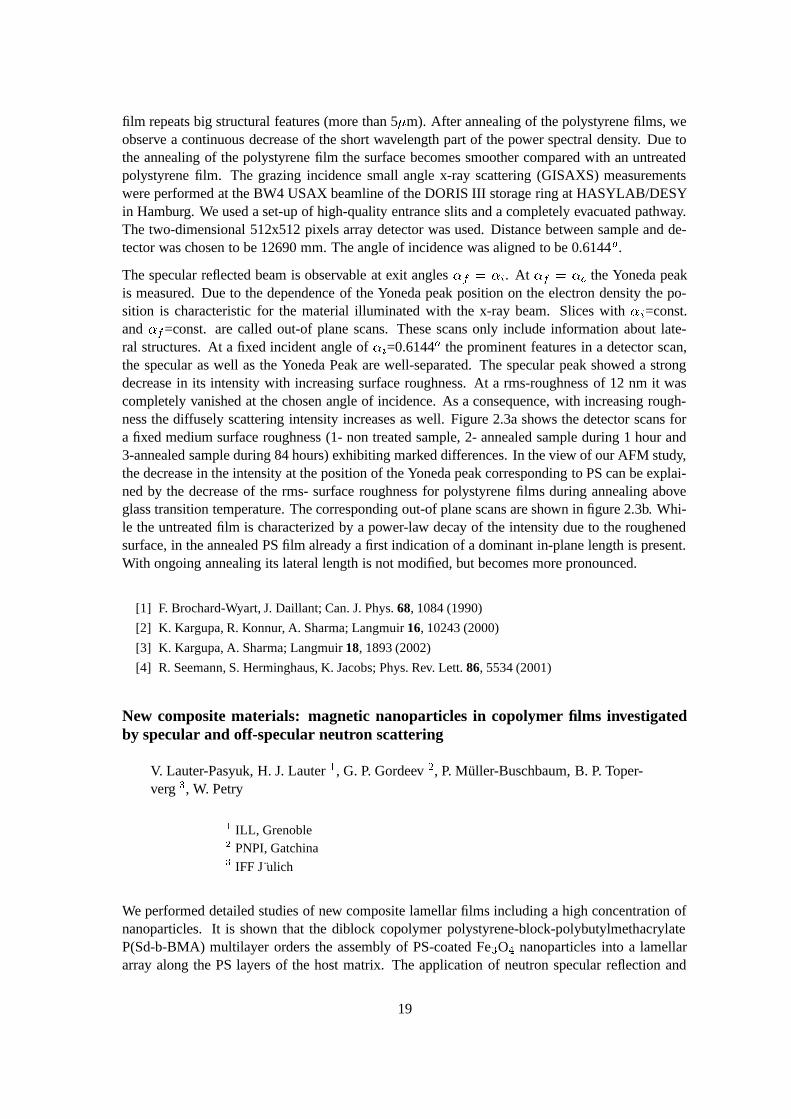
New composite materials: magnetic nanoparticles in copolymer films investigatedby specular and off-specular neutron scattering
V. Lauter-Pasyuk, H. J. Lauter�, G. P. Gordeev
�, P. Muller-Buschbaum, B. P. Toper-
verg�, W. Petry
�ILL, Grenoble�PNPI, Gatchina�IFF J ulich
We performed detailed studies of new composite lamellar films including a high concentration ofnanoparticles. It is shown that the diblock copolymer polystyrene-block-polybutylmethacrylateP(Sd-b-BMA) multilayer orders the assembly of PS-coated Fe � O � nanoparticles into a lamellararray along the PS layers of the host matrix. The application of neutron specular reflection and
19

off-specular scattering accompanied by a two-dimensional data analysis allows a detailed descrip-tion of the nanoparticles distribution inside the copolymer matrix. As a result, the parametersof the transverse and the lateral structure without as well as with incorporated magnetite Fe � O �
nanoparticles (with the average diameter of 5 nm) is yielded.
Figure 2.4:A) Experimental 2-dimensional intensity map from not annealed samples of pure P(Sd-b-BMA)thin films and B) similar copolymer films with incorporated Fe � O � nanoparticles; �#� and � � are thecomponents of the incoming and outgoing neutron wave vectors perpendicular to the surface, re-spectively. The strong intensity along the line � � � �� � � � � corresponds to the specular reflection,the Yoneda scattering intensity spreads to the left from the specular line.
Figure 2.5:Experimental 2-dimesional intensity maps from the samples as shown in the figure above, afterannealing during 3 hours at a temperature T = 165 � C for (A) a pure diblock copolymer film and(B) a film including nanoparticles.
The diblock copolymers were dissolved in toluene and spin-coated on top of silicon substrates.The self-assembly of the copolymer matrix is determined by the non-miscibility of the two che-mical components. The lamellae are oriented parallel to the substrate and the surface of the filmand their thickness is given by �
��� � with � integer even and�
the lamellar period (PBMA-PS-PS-PBMA). By coating the nanoparticles with one or another type of the polymer chains (priorto the adding to a toluene solution of the copolymer) we provide a control on the nanoparticledistribution within one or another part of the lamellar structure. We succeeded to incorporateFe � O � nanoparticles with the average diameter of 5 nm up to 7 % volume fraction. Even for a
20
high concentration, particles stay included in the film and the lamellar structure is not destroyed.Periodic location of the particles as well as the transverse and lateral structure of the lamellar purecopolymer and composite films was determined using neutron specular reflection and off-specularscattering. The presence of the nanoparticles induces distortion of the copolymer matrix. The neu-tron off-specular scattering contains valuable information about the internal structure of the film,including the nanoparticles distribution, the lateral structure of the roughness and its conformitythough the lamellar multilayer as well as the surface structure of the film.
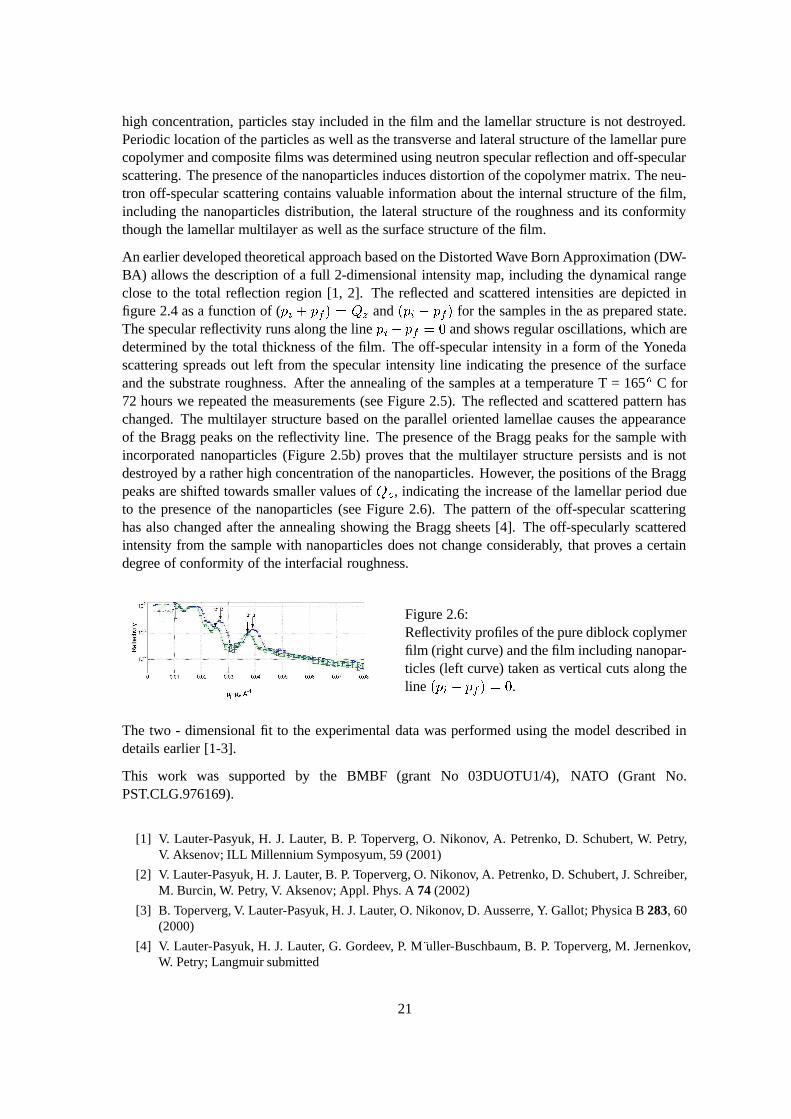
An earlier developed theoretical approach based on the Distorted Wave Born Approximation (DW-BA) allows the description of a full 2-dimensional intensity map, including the dynamical rangeclose to the total reflection region [1, 2]. The reflected and scattered intensities are depicted infigure 2.4 as a function of (� ��� � � � � ��� and � � � � � � for the samples in the as prepared state.The specular reflectivity runs along the line � � � � � � and shows regular oscillations, which aredetermined by the total thickness of the film. The off-specular intensity in a form of the Yonedascattering spreads out left from the specular intensity line indicating the presence of the surfaceand the substrate roughness. After the annealing of the samples at a temperature T = 165 � C for72 hours we repeated the measurements (see Figure 2.5). The reflected and scattered pattern haschanged. The multilayer structure based on the parallel oriented lamellae causes the appearanceof the Bragg peaks on the reflectivity line. The presence of the Bragg peaks for the sample withincorporated nanoparticles (Figure 2.5b) proves that the multilayer structure persists and is notdestroyed by a rather high concentration of the nanoparticles. However, the positions of the Braggpeaks are shifted towards smaller values of ��� , indicating the increase of the lamellar period dueto the presence of the nanoparticles (see Figure 2.6). The pattern of the off-specular scatteringhas also changed after the annealing showing the Bragg sheets [4]. The off-specularly scatteredintensity from the sample with nanoparticles does not change considerably, that proves a certaindegree of conformity of the interfacial roughness.
Figure 2.6:Reflectivity profiles of the pure diblock coplymerfilm (right curve) and the film including nanopar-ticles (left curve) taken as vertical cuts along theline � � � � � � � � .
The two - dimensional fit to the experimental data was performed using the model described indetails earlier [1-3].
This work was supported by the BMBF (grant No 03DUOTU1/4), NATO (Grant No.PST.CLG.976169).
[1] V. Lauter-Pasyuk, H. J. Lauter, B. P. Toperverg, O. Nikonov, A. Petrenko, D. Schubert, W. Petry,V. Aksenov; ILL Millennium Symposyum, 59 (2001)
[2] V. Lauter-Pasyuk, H. J. Lauter, B. P. Toperverg, O. Nikonov, A. Petrenko, D. Schubert, J. Schreiber,M. Burcin, W. Petry, V. Aksenov; Appl. Phys. A 74 (2002)
[3] B. Toperverg, V. Lauter-Pasyuk, H. J. Lauter, O. Nikonov, D. Ausserre, Y. Gallot; Physica B 283, 60(2000)
[4] V. Lauter-Pasyuk, H. J. Lauter, G. Gordeev, P. M uller-Buschbaum, B. P. Toperverg, M. Jernenkov,W. Petry; Langmuir submitted
21
Investigation of ultrathin polystyrene films
A. Gotzendorfer, P. Muller-Buschbaum, W. Petry
The technological drive to place into service ever-thinner polymer films prepared on top of so-lid substrates has advanced beyond the current level of fundamental scientific understanding. Inapplications such as adhesion, dielectric isolation, and lubrication, successful performance candepend critically on the details of the thin film behaviour. One of the basic questions concerns theproperties of homogeneous films thinner than the extension of a single polymer molecule in themelt given by the radius of gyration
���.
Utilizing the experimental technique of spin-coating it is possible to produce such films. Recentpioneering experiments [1] suggest a lower limit for the achievable thickness of homogeneousfilms of about � � ��� . We now tackle the task of exploring this frontier in a more systematicway. Our special interest aimed at the dewetting patterns obtained when the “films” fell belowthe critical thickness for dewetting. In contrast to other experimentalists who study the dewettingprocess upon annealing [2,3] we are interested in the surface structure directly after spin-coatingthe polymer.
We studied monodisperse polystyrene films on silicon (100) surfaces covered with a native oxidelayer. Before coating the substrates were etched at
� � ��� for 15 minutes in a bath of sulfuricacid, hydrogenperoxide and deionized water to remove residual hydrocarbons, then rinsed underdeionized water and dried with compressed nitrogen. We prepared two series of films differingin the molecular weight of the polystyrene molecules ( � � � � ����� �� ���� , � �
� � � � � � �,��� � � � ˚
�and � � � ��� ���� �� ���� , � �
� � � � � � ,��� � ��� � ˚
�). Polystyrene was
spin-coated (2000 rpm) onto the substrates from toluene solution. Different film thickness wereachieved by a variation of the polymer concentration in the solution used.
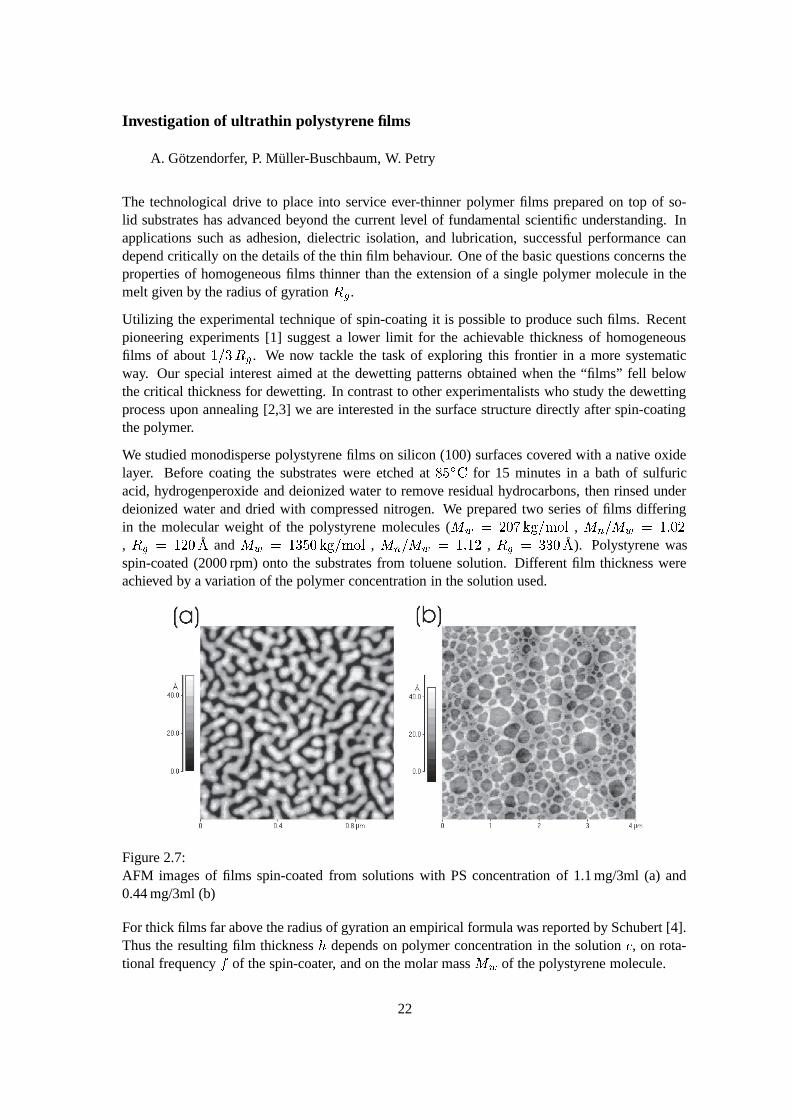
Figure 2.7:AFM images of films spin-coated from solutions with PS concentration of 1.1 mg/3ml (a) and0.44 mg/3ml (b)
For thick films far above the radius of gyration an empirical formula was reported by Schubert [4].Thus the resulting film thickness � depends on polymer concentration in the solution � , on rota-tional frequency � of the spin-coater, and on the molar mass � � of the polystyrene molecule.
22
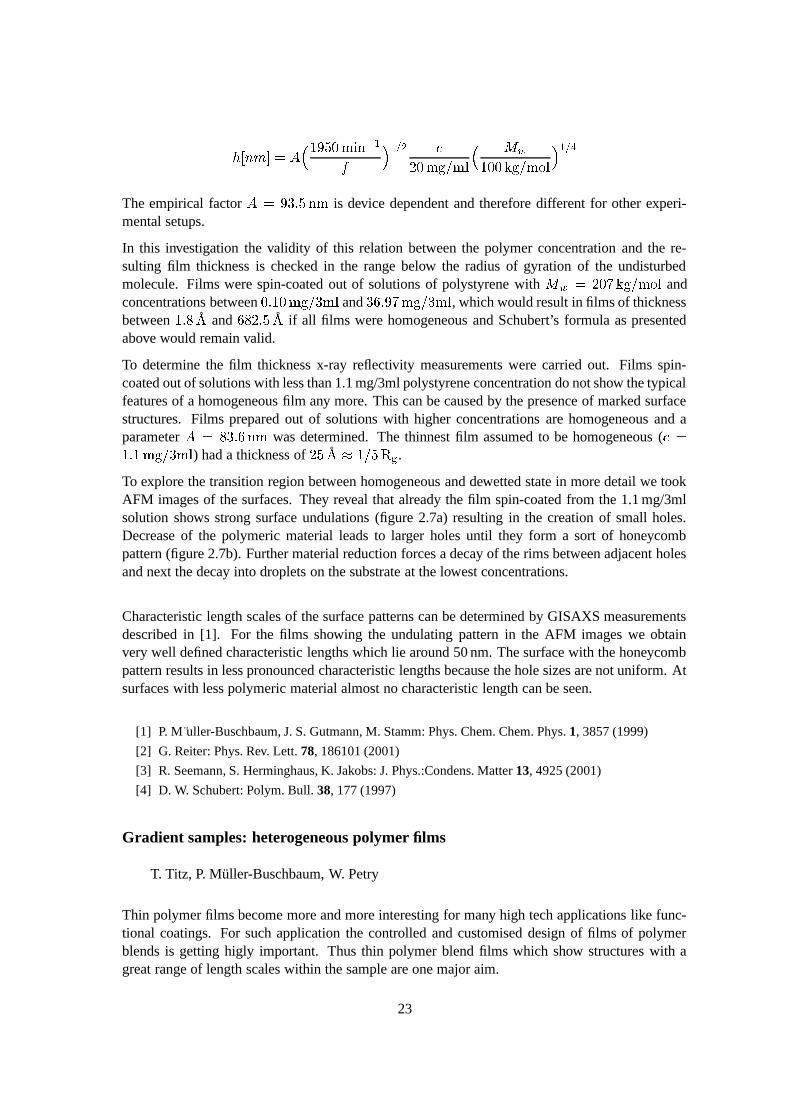
��� � ��� � ��� ���� � �� �� �
�� � �� � � �� �
� � �
� ���� �� ���� ��� �
The empirical factor� ������� � is device dependent and therefore different for other experi-
mental setups.
In this investigation the validity of this relation between the polymer concentration and the re-sulting film thickness is checked in the range below the radius of gyration of the undisturbedmolecule. Films were spin-coated out of solutions of polystyrene with � � � � ����� �� ���� andconcentrations between � � � � � � � and � � � ��� � � � � , which would result in films of thicknessbetween � � ˚
�and
� � ��� � ˚�
if all films were homogeneous and Schubert’s formula as presentedabove would remain valid.
To determine the film thickness x-ray reflectivity measurements were carried out. Films spin-coated out of solutions with less than 1.1 mg/3ml polystyrene concentration do not show the typicalfeatures of a homogeneous film any more. This can be caused by the presence of marked surfacestructures. Films prepared out of solutions with higher concentrations are homogeneous and aparameter
� � � ��� � was determined. The thinnest film assumed to be homogeneous ( � �
� � � � � ) had a thickness of ��� ˚���
� ����� .To explore the transition region between homogeneous and dewetted state in more detail we tookAFM images of the surfaces. They reveal that already the film spin-coated from the 1.1 mg/3mlsolution shows strong surface undulations (figure 2.7a) resulting in the creation of small holes.Decrease of the polymeric material leads to larger holes until they form a sort of honeycombpattern (figure 2.7b). Further material reduction forces a decay of the rims between adjacent holesand next the decay into droplets on the substrate at the lowest concentrations.
Characteristic length scales of the surface patterns can be determined by GISAXS measurementsdescribed in [1]. For the films showing the undulating pattern in the AFM images we obtainvery well defined characteristic lengths which lie around 50 nm. The surface with the honeycombpattern results in less pronounced characteristic lengths because the hole sizes are not uniform. Atsurfaces with less polymeric material almost no characteristic length can be seen.
[1] P. M uller-Buschbaum, J. S. Gutmann, M. Stamm: Phys. Chem. Chem. Phys. 1, 3857 (1999)
[2] G. Reiter: Phys. Rev. Lett. 78, 186101 (2001)
[3] R. Seemann, S. Herminghaus, K. Jakobs: J. Phys.:Condens. Matter 13, 4925 (2001)
[4] D. W. Schubert: Polym. Bull. 38, 177 (1997)
Gradient samples: heterogeneous polymer films
T. Titz, P. Muller-Buschbaum, W. Petry
Thin polymer films become more and more interesting for many high tech applications like func-tional coatings. For such application the controlled and customised design of films of polymerblends is getting higly important. Thus thin polymer blend films which show structures with agreat range of length scales within the sample are one major aim.
23

A new way to prepare these structures is the use of gradients. Gradient samples are based onpolymer blends and thus have three independent free variables within the system. In a blendof two homopolymers the external gradient is the third free variable. Gradients are introducedby temperature, film thickness and polymer blend ratio. Along the gradient local equilibriumstructures will change steadily and therefore the gradient will introduce an artificial length on thestructure of the observed system.
To produce a temperature gradient a temper-cell (figure 2.8) has been planned which is now underconstruction. The temper-cell is designed to work under inert gas or vacuum and the samplescan be observed in situ with synchrotron radiation and optical microscopy by using a portablevideo microscope. The video microscope will be installed on top of the temper cell on a micropositioning system and will picture the sample surface through a glass window with a maximummagnification of 11.8.
Figure 2.8: a) side view of the open temper-cell and b) top view, respectively
To produce the temperature gradient the sample is placed on two copper plates thermally separatedby a teflon block. One copper plate is heated by a heating foil and the other copper plate iscooled by peltier elements to get a temperature difference through the sample. With regard to thetemperature-time superposition the temperature gradient is equivalent to a time gradient and wewill get different local phase separation or microphase separation structures.
Figure 2.9:Sample with film thickness gradient introduced by solution casting, film thickness is increasingfrom left to right
A second possibility for producing an external gradient is to change the film thickness, by usinggravitational force. The easiest way is by tilting the substrate and than casting the polymer solu-tion on the inclined substrate. Figure 2.8 shows a microscope picture of a sample casted under
24

gravitational force. The film thickness is increasing from left to right and the size of the structuresis changing.
Investigation of thin films of diblock-copolymer/metal composites
J. S. Gutmann�, P. Panagiotou, P. Muller-Buschbaum
�MPI f ur Polymerforschung, Mainz
Diblock-copolymers are a class of polymers in which two chemically different polymers are likedtogether via a covalent bond. Since polymeric systems are typically imiscible due to their verysmall entropy of mixing, both block of the block copolymer typically phase separate from eachother. The size scale of the phase separation is however limited due to the additional topologicalconstraint introduced by the covalent linkage between the two blocks. The structures resulting areextremely rich and span a phase range from cubic to hexagonal to lamellar structures. This phasebehavior has found extensive use in the past in the creation of organic-inorganic composites viasol-gel chemistry [1] with a very high control over the morphology of the composites. Currentwork is now progressing toward the incorporation of metal into these composite materials, whileretaining the established high degree of shape and size control.
In this study we addressed the possibility of metal incorporation into thin films of a poly-isoprene-block-poly-dimethylaminoethylmethacrylate (PI-b-PDMAEMA) copolymer. The block-copolymer had a molecular weight of 33113 g/mol and a polydispersity index of 1.03 as measuredby GPC. The mole fraction of the PDMAEMA block was 0.18 resulting in a cubic arrangement ofPDMAEMA spheres inside a PI matrix.
The thin films were prepared by spin-coating from toluene solutions onto silicon (100) wafersand had a typical film thickness of around 100 nm. Since the PDMAEMA block provides ternaryamine groups as potential metal complexing ligands we used copper(II)chloride as a metal source.In order to incorporate the metal into the thin films we immersed the as spin-coated films in a 9.69mmol metal salt solution.
Since the total amount of sample within the thin film is of the order of a few ?g, it is not fea-sible to investigate these thin films in a transmission geometry SAXS experiment. We thereforeused a set-up at the BW4 beam-line for ultra-low angle X-ray scattering under grazing incidence(GIUSAXS) [2]. The experimental set-up at the BW4 beam-line consisted of a 2D wire detectorpositioned at a distance of 12.7 m from the sample. In order to reduce the background the samplechamber and the sample-detector flight-tube were completely evacuated. The angle of incidencewas kept constant during each measurement and was set to about 0.6 � . For more details about thebeam-line see [3].
Figure 2.10a shows a typical 2D scattering image as obtained from the GIUSAXS experiments.On the top, the specular reflected peak is clearly visible. In the lower half an additional peak, the socalled Yoneda peak is present, indicating that the thin films exhibits lateral structures. Furthermorethe Yoneda peak is broadened along the horizontal from the presence of laterals structures withinthe resolution limit of the experiment.
In order to further analyze the scattering image, horizontal cuts through the Yoneda peak aretaken. These so called out-of-plane scans probe only the � component of the scattering vector
25
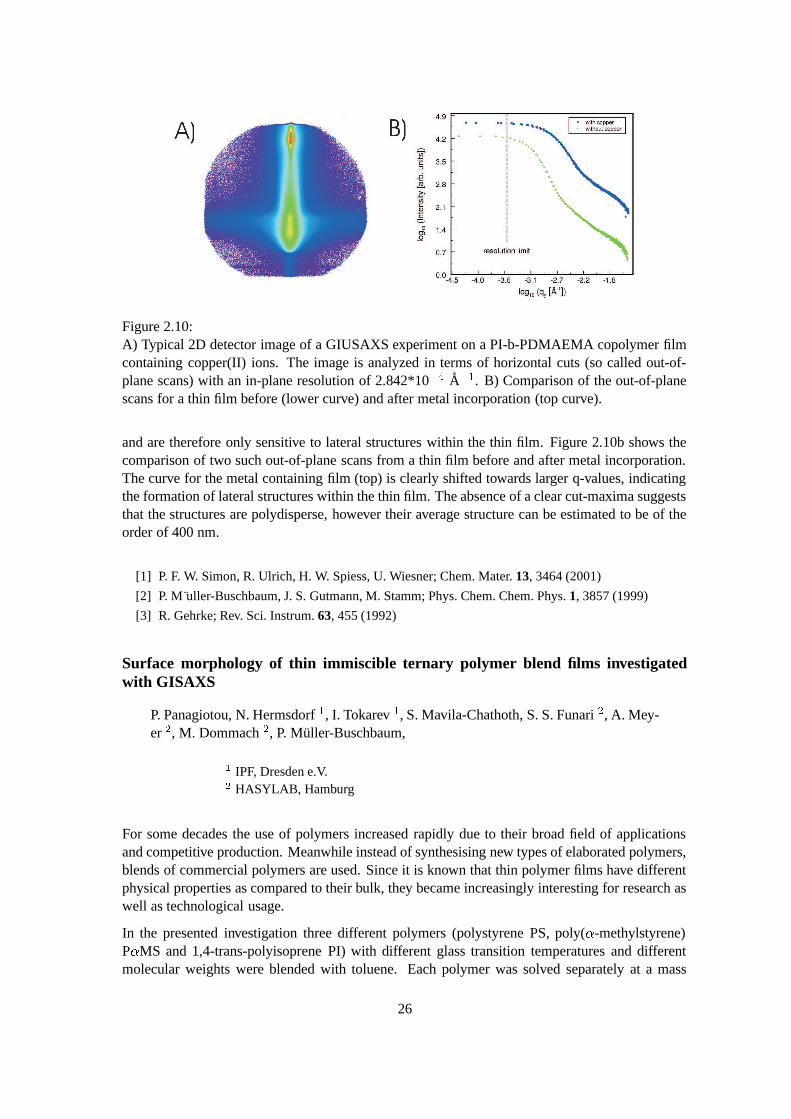
Figure 2.10:A) Typical 2D detector image of a GIUSAXS experiment on a PI-b-PDMAEMA copolymer filmcontaining copper(II) ions. The image is analyzed in terms of horizontal cuts (so called out-of-plane scans) with an in-plane resolution of 2.842*10 � A � . B) Comparison of the out-of-planescans for a thin film before (lower curve) and after metal incorporation (top curve).
and are therefore only sensitive to lateral structures within the thin film. Figure 2.10b shows thecomparison of two such out-of-plane scans from a thin film before and after metal incorporation.The curve for the metal containing film (top) is clearly shifted towards larger q-values, indicatingthe formation of lateral structures within the thin film. The absence of a clear cut-maxima suggeststhat the structures are polydisperse, however their average structure can be estimated to be of theorder of 400 nm.
[1] P. F. W. Simon, R. Ulrich, H. W. Spiess, U. Wiesner; Chem. Mater. 13, 3464 (2001)
[2] P. M uller-Buschbaum, J. S. Gutmann, M. Stamm; Phys. Chem. Chem. Phys. 1, 3857 (1999)
[3] R. Gehrke; Rev. Sci. Instrum. 63, 455 (1992)
Surface morphology of thin immiscible ternary polymer blend films investigatedwith GISAXS
P. Panagiotou, N. Hermsdorf�, I. Tokarev
�, S. Mavila-Chathoth, S. S. Funari
�, A. Mey-
er�, M. Dommach
�, P. Muller-Buschbaum,
�IPF, Dresden e.V.�HASYLAB, Hamburg
For some decades the use of polymers increased rapidly due to their broad field of applicationsand competitive production. Meanwhile instead of synthesising new types of elaborated polymers,blends of commercial polymers are used. Since it is known that thin polymer films have differentphysical properties as compared to their bulk, they became increasingly interesting for research aswell as technological usage.
In the presented investigation three different polymers (polystyrene PS, poly( � -methylstyrene)P � MS and 1,4-trans-polyisoprene PI) with different glass transition temperatures and differentmolecular weights were blended with toluene. Each polymer was solved separately at a mass
26
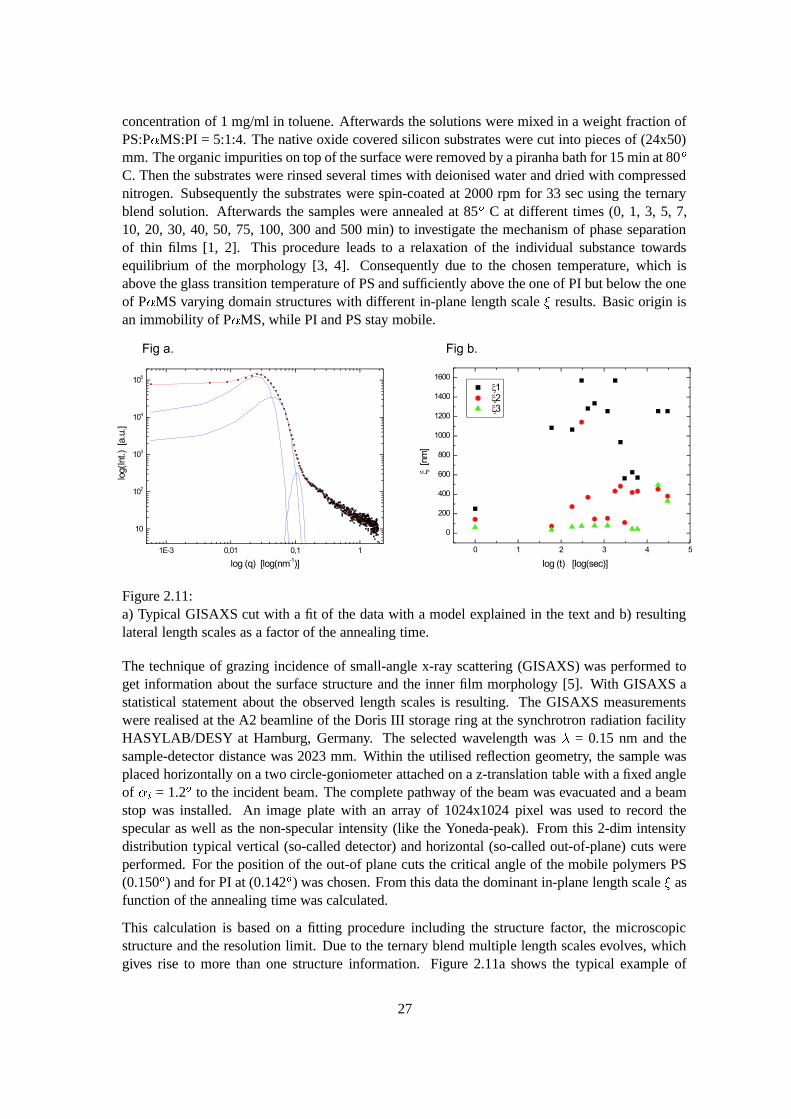
concentration of 1 mg/ml in toluene. Afterwards the solutions were mixed in a weight fraction ofPS:P � MS:PI = 5:1:4. The native oxide covered silicon substrates were cut into pieces of (24x50)mm. The organic impurities on top of the surface were removed by a piranha bath for 15 min at 80 �C. Then the substrates were rinsed several times with deionised water and dried with compressednitrogen. Subsequently the substrates were spin-coated at 2000 rpm for 33 sec using the ternaryblend solution. Afterwards the samples were annealed at 85 � C at different times (0, 1, 3, 5, 7,10, 20, 30, 40, 50, 75, 100, 300 and 500 min) to investigate the mechanism of phase separationof thin films [1, 2]. This procedure leads to a relaxation of the individual substance towardsequilibrium of the morphology [3, 4]. Consequently due to the chosen temperature, which isabove the glass transition temperature of PS and sufficiently above the one of PI but below the oneof P � MS varying domain structures with different in-plane length scale � results. Basic origin isan immobility of P � MS, while PI and PS stay mobile.
Figure 2.11:a) Typical GISAXS cut with a fit of the data with a model explained in the text and b) resultinglateral length scales as a factor of the annealing time.
The technique of grazing incidence of small-angle x-ray scattering (GISAXS) was performed toget information about the surface structure and the inner film morphology [5]. With GISAXS astatistical statement about the observed length scales is resulting. The GISAXS measurementswere realised at the A2 beamline of the Doris III storage ring at the synchrotron radiation facilityHASYLAB/DESY at Hamburg, Germany. The selected wavelength was � = 0.15 nm and thesample-detector distance was 2023 mm. Within the utilised reflection geometry, the sample wasplaced horizontally on a two circle-goniometer attached on a z-translation table with a fixed angleof � � = 1.2 � to the incident beam. The complete pathway of the beam was evacuated and a beamstop was installed. An image plate with an array of 1024x1024 pixel was used to record thespecular as well as the non-specular intensity (like the Yoneda-peak). From this 2-dim intensitydistribution typical vertical (so-called detector) and horizontal (so-called out-of-plane) cuts wereperformed. For the position of the out-of plane cuts the critical angle of the mobile polymers PS(0.150 � ) and for PI at (0.142 � ) was chosen. From this data the dominant in-plane length scale � asfunction of the annealing time was calculated.
This calculation is based on a fitting procedure including the structure factor, the microscopicstructure and the resolution limit. Due to the ternary blend multiple length scales evolves, whichgives rise to more than one structure information. Figure 2.11a shows the typical example of
27

GISAXS cut. The solid lines are the resulting fit and the extracted structure factor information. Inthis particular case three different length scales were detected. Figure 2.11b exhibits the obtainedstructure factor information as function of the annealing time. Clearly three different length scalescan be separated.
On a first view the value of these length scales seems to be independent of the annealing time. Itshould be noted anyhow with AFM and optical microscopy its change in the surface structures wasobserved. In addition the GISAXS signal changes drastically during annealing time. Therefore theobtained structure information at different times corresponds to different real space structures. Ina detailed assignment the values obtained from AFM have to be linked to the data obtained fromthe GISAXS experiment. Only with the help of the real space information an understanding of thekinetic phase separation process is possible. This behaviour is quit typically for complex blendsystems like ternary blends.
[1] K. Binder: Journal of Chemical Physics 79 (12), 6387 (1983)
[2] G. Krausch: Material Science and Engineering R14 (1), 1 (1995)
[3] P. M uller-Buschbaum, J. S. Gutmann, M. Stamm: Macromolecules 33, 4886 (2000)
[4] S. Walheim, M. Ramstein, U. Steiner: Langmuir 15, 4828 (1999)
[5] P. M uller-Buschbaum, J. S. Gutmann, R. Cubitt, M. Stamm: Colloid and Polymer Science 277, 1193(1999)
In-situ USAX and GISAXS investigation of adhesive polymers film properties
S. Loi, E. Maurer, A. Gotzendorfer, P. Muller-Buschbaum
The adhesion between different polymers as well as between polymer and nonpolymer surfaces isimportant for a wide range of applications. In many cases a high adhesion is required, like in theglue industries or coating and paint techniques. On the other hand, some adhesives combine thehigh tackiness with the ability to be removable. The pressure sensitive adhesives (PSA) belongto this class of adhesives and allow the bond formation by simple contact with the surface [1].Examples from the everyday life are stick-on-notes or adhesives stickers. The peculiarity of thePSA is that the tackiness depends strongly on the bond history, which means on parameters likecontact pressure, contact time, temperature and debonding rate [2, 3]. It has been observed thatthe surface roughness and topology greatly affect the tack energy, too [4]. This is attributed to therestriction of the true area of contact between probe and polymer film. In practise, the tackiness istested by the following procedure (figure 2.12a): The adhesive film is deposited on a glass substrateand a flat ended cylindrical punch is brought into contact with the adhesive, under certain values ofpressure and contact time. Then the probe is withdrawn from the surface with a constant velocity.The measured force presents a strong peak and does not fall to zero but rather stays essentiallyconstant, till the probe finally separates from the film at a relatively high probe-sample distance.Corresponding to the region of constant force, the adhesive film splits into separate filaments orfibrils that are elongated giving rise to a plateau in the force. The measured force versus distancecurves allow a mechanical characterisation of the adhesive. Anyway the debonding phase andfibrils formation are not quantitatively explained. In order to achieve information on a microscopicscale, we perform experiments with x-ray scattering during the debonding phase.
The PSA films consist of blend of 10% polystyrene (PS) and 90% poly(n-butylacrylat) (PnBA).They are prepared by solution casting. In the utilised thin film, a phase separation occured inducing
28
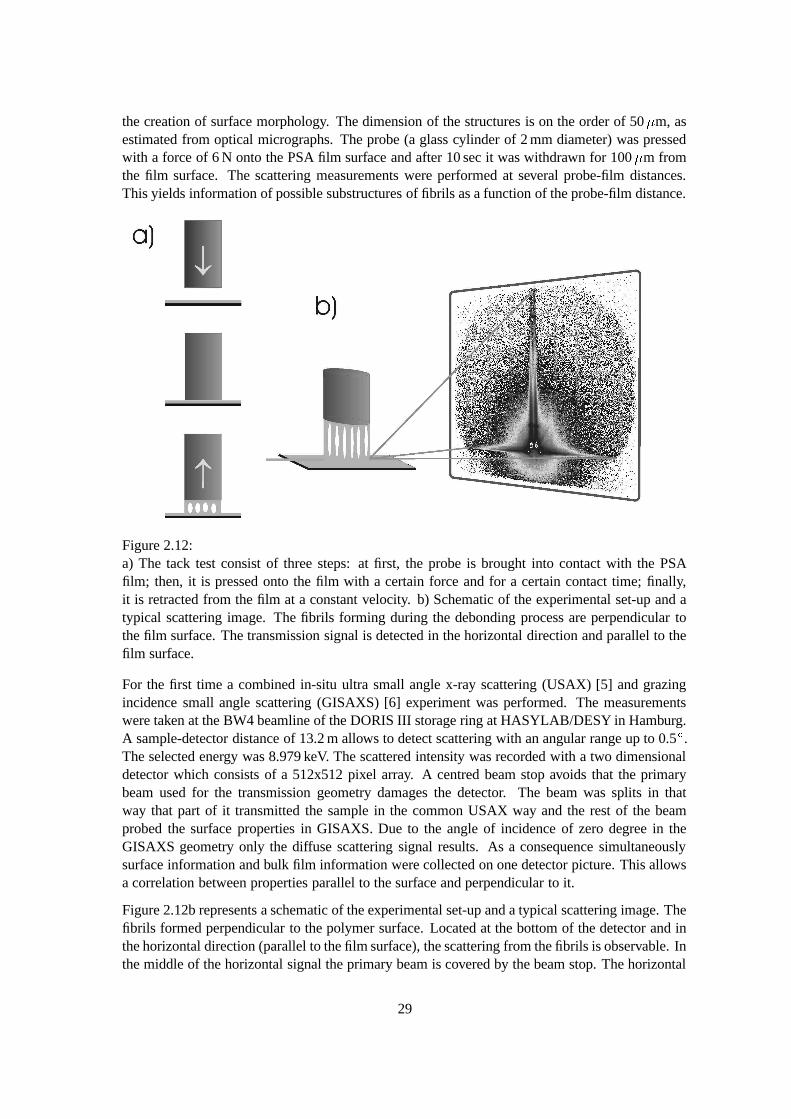
the creation of surface morphology. The dimension of the structures is on the order of 50 � m, asestimated from optical micrographs. The probe (a glass cylinder of 2 mm diameter) was pressedwith a force of 6 N onto the PSA film surface and after 10 sec it was withdrawn for 100 � m fromthe film surface. The scattering measurements were performed at several probe-film distances.This yields information of possible substructures of fibrils as a function of the probe-film distance.
Figure 2.12:a) The tack test consist of three steps: at first, the probe is brought into contact with the PSAfilm; then, it is pressed onto the film with a certain force and for a certain contact time; finally,it is retracted from the film at a constant velocity. b) Schematic of the experimental set-up and atypical scattering image. The fibrils forming during the debonding process are perpendicular tothe film surface. The transmission signal is detected in the horizontal direction and parallel to thefilm surface.
For the first time a combined in-situ ultra small angle x-ray scattering (USAX) [5] and grazingincidence small angle scattering (GISAXS) [6] experiment was performed. The measurementswere taken at the BW4 beamline of the DORIS III storage ring at HASYLAB/DESY in Hamburg.A sample-detector distance of 13.2 m allows to detect scattering with an angular range up to 0.5
�.
The selected energy was 8.979 keV. The scattered intensity was recorded with a two dimensionaldetector which consists of a 512x512 pixel array. A centred beam stop avoids that the primarybeam used for the transmission geometry damages the detector. The beam was splits in thatway that part of it transmitted the sample in the common USAX way and the rest of the beamprobed the surface properties in GISAXS. Due to the angle of incidence of zero degree in theGISAXS geometry only the diffuse scattering signal results. As a consequence simultaneouslysurface information and bulk film information were collected on one detector picture. This allowsa correlation between properties parallel to the surface and perpendicular to it.
Figure 2.12b represents a schematic of the experimental set-up and a typical scattering image. Thefibrils formed perpendicular to the polymer surface. Located at the bottom of the detector and inthe horizontal direction (parallel to the film surface), the scattering from the fibrils is observable. Inthe middle of the horizontal signal the primary beam is covered by the beam stop. The horizontal
29

cut through the position of the primary beam displays information from the fibrils structure as incommon USAX experiments. Along the vertical direction the GISAXS signal is located. At thecritical angle of the sample the Yoneda peak is observed. Its horizontal intensity decay showsmarked modulation carrying information about the structure parallel to the surface. A detaileddata analysis is in progress.
[1] H. Lakrout: Adhesion 69, 307 (1999)
[2] C. Creton, L. Leibler: J. Polym. Sci. 34, 545 (1996)
[3] A. Zosel: J. Adhesion Sci. Technol. 11, 1447 (1997)
[4] K. N. G. Fuller, D. Tabor: Proc. R. Soc. Lond. A.345, 3275 (1975)
[5] U. Lode, T. Pomper, A. Karl, G. von Krosigk, S. Cunis, W. Wile, R. Gerke: Macromol. Rapid Com-mun 19, 35 (1998)
[6] P. M uller-Buschbaum, M. Casagrande, J. Gutmann, T. Kuhlmann, M. Stamm, G. von Krosigk, U. Lo-de, S. Cunis, R. Gehrke: Europhys. Lett. 42(5), 517 (1998)
Microscopic properties of adhesive polymer films
E. Maurer, S. Loi, A. Gotzendorfer, P. Muller-Buschbaum
Most glues typically are based on polymers. One way to distinguish them is based on the durabi-lity of the connection created by the glue. Either a permanent connection between two interfacesis formed by a chemical bonding or a controlled bonding and debonding is allowed. Pressure sen-sitive adhesives (PSA) are of the second type [1,2]. Examples in daily life are adhesive stickers,Scotch tape or stick-on notes. Beside these industrial applications PSA are of interest in basicresearch, too. Characteristic of PSA is a sensitivity of the adhesion on the bonding history. Besidethe material characteristics of the applied polymer there is a number of parameters determiningthe quality of the adhesion. Examples are the force applied to press the interfaces together, thecontact time during which the force is present or the temperature. In order to debond the interfa-ces, a characteristic force has to be applied as well. The value of this force is a function of all thebonding parameters and in addition of the parameters characterizing debonding like the retractingvelocity. Frequently, fibrils are created between the former connected interfaces during the debon-ding [3,4,5]. Up to now, no fundamental understanding of the fibrils role in the debonding processis established.
Especially, the microscopic properties of the creation and failure of fibrils is of great interest. Amacroscopic understanding is usually performed by mechanical testing experiments [4,6,5]. In theso-called tack test the debonding process is quantified in terms of force versus distance (in-betweeninterfaces) curves. The tack test can be subdivided into three steps (see figure 2.13A). First a probepunch, like a flat-ended glass cylinder is pressed onto a polymer film with a defined force. Second,the force is maintained for a defined time. Finally, in order to study the debonding the prope isretracted from the film with a constant velocity. During the process the force versus distance curveis recorded. Normally, the curve shows characteristic features as a maximum force and a forceplateau. This plateau is caused by the stretching of fibrils. In order to find a possible microscopicsubstructure of the fibrils we investigate the debonding with x-ray scattering. PSA films of 0.20polymethylmethacrylat (PMMA) and 0.80 polyethylhexylacrylat (PEHA) were prepared by solu-tion casting. A glass cylinder of 2 mm diameter was pressed with a force of 6 N onto the PSAfilm surface. After 10 sec the debonding process was started. At several probe-film distances the
30

scattering measurement was performed. This yields to information of possible substructures offibrils as a function of the probe-film distance. In scattering experiment a transmission geometrywas used. In order to detect length scales of several nanometers we utilized ultra small angle x-rayscattering (USAX).
The measurements were performed at the BW4 beamline of the DORIS III storage ring at HA-SYLAB/DESY in Hamburg. A sample-detector distance of 13.2 meter allows to detect scatteringwith an angular range below 0.5 . The selected energy was 8.979 keV. Two entrance cross-slits setthe beam divergence. The scattered intensity was recorded with a two dimensional detector whichconsists of a 512x512 pixel array. A centered beam stop avoids that the primary beam is detected.A calibration resulted from a lupolen test measurement. The tack geometry forces the fibrils to beperpendicular to the film surface. The film is placed horizontally and thus we are only interested inthe horizontal signal on the detector (see figure 2.13B). As a consequence horizontal cuts throughthe position defined by the primary beam display the information.
Figure 2.13:A) The tack test is proceeded in three steps: 1. A glass cylinder (probe) is pressed onto a PSAfilm. 2. The applied force is maintained. 3. The probe is retracted from the film. B) Scatteringgeometry: The fibrils created in the debonding process are oriented perpendicular to the scatteringplane (gray plan). The transmission signal is detected. Horizontal cuts including the primary beamposition yield information about the substructure of the fibrils.
During the debonding for small film-probe distances a modulation of the USAXS signal is detec-ted [7,8,9]. It is originated by a substructure of the fibrils giving rise to a modulation due to itsform factor. It was verified that the scattering before tacking did not show any sign of a modula-tion. During the debonding we could not detect any structure factor peak, which possibly meansthat there are no regular distances between the nanofibrils or that their length scale is out of the re-solution limit [8]. For larger probe-film distances the modulation of the horizontal signal becomesweaker. This either means an increase of nanofibrils failures or that the nanofibrils sizes becomeless well defined
[1] C. Gay, L. Leiber; Phys. Rev. Lett. 82, 936 (1999)
31

[2] J. S. Higgins, H. C. Benoit; Polymers and Neutron Scattering, pp.192-244. New York: Oxford Uni-versity Press (1996)
[3] C. Hui, Y. Lin, J. Baney; J. Polym. Sci. 38, 1485 (2000)
[4] H. Lakrout; Adhesion 69, 307-359
[5] U. Lode, T. Pomper, A. Karl, G. von Krosigk, S. Cunis, W. Wilke, R. Gehrke; Macromol. RapidCommun 19, 35 (1998)
[6] A. Paiva, N. Sheller, M. Foster, A. Crosby, K. Shull; 34 2269-2276 (2001)
[7] S. Roth, M. Burghammer, C. Ferrero, A. Diethert, P. M uller-Buschbaum; J. Appl. Cryst. 36, in press(2003)
[8] A. Zosel; J. Adhesion Sci. Technol. 11, 1447 (1997)
Scanning-USAX and Scanning-microfocus SAXS as tools to investigate defects atpolymer-polymer interfaces: A comparison
C. Lorenz-Haas�, P. Muller-Buschbaum, M. Stamm
�
�Max-Planck-Institut f ur Polymerforschung, Mainz�Institut f ur Polymerforschung Dresden e.V., Dresden
In the previous two years we reported about Scanning-USAX (Jahresbericht 2000) and Scanning-microfocus SAXS (Jahresbericht 2001) as techniques for the investigation of failure at polymer-polymer interfaces. This year we will compare both complementary methods and draw conclusi-ons from our analysis.
Figure 2.14:Comparison of beam diameters: 300 � m S-USAX at BW4 (Hasylab/DESY Hamburg,big circle), 5 � m SM-SAXS at ID13 (ESRFGrenoble, tiny circle in the middle). The mi-crograph in the background shows the zonearound a crack.
The sample consisted of two welded PMMA-plates with a crack along the interface between them.Defects in the zone around the crack tip were investigated by scanning X-ray scattering in twodifferent ways:
1. Scanning-USAX. The experiments were carried out at the BW4 beam-line at HASYLAB/DESYin Hamburg with a beam diameter of 300 � m and an observable q-range of 0.018 � � ��� �0.29 � � � .
32
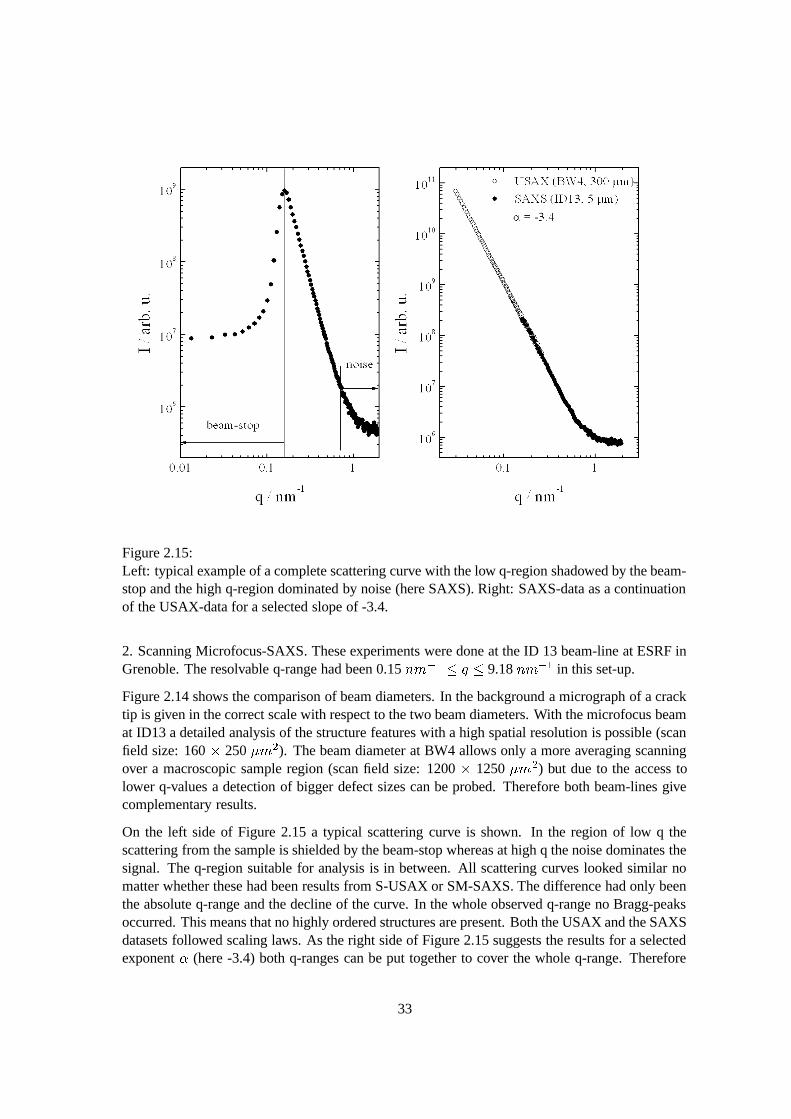
Figure 2.15:Left: typical example of a complete scattering curve with the low q-region shadowed by the beam-stop and the high q-region dominated by noise (here SAXS). Right: SAXS-data as a continuationof the USAX-data for a selected slope of -3.4.
2. Scanning Microfocus-SAXS. These experiments were done at the ID 13 beam-line at ESRF inGrenoble. The resolvable q-range had been 0.15 � � � � � 9.18 � � � in this set-up.
Figure 2.14 shows the comparison of beam diameters. In the background a micrograph of a cracktip is given in the correct scale with respect to the two beam diameters. With the microfocus beamat ID13 a detailed analysis of the structure features with a high spatial resolution is possible (scanfield size: 160 � 250 � � � ). The beam diameter at BW4 allows only a more averaging scanningover a macroscopic sample region (scan field size: 1200 � 1250 � � � ) but due to the access tolower q-values a detection of bigger defect sizes can be probed. Therefore both beam-lines givecomplementary results.
On the left side of Figure 2.15 a typical scattering curve is shown. In the region of low q thescattering from the sample is shielded by the beam-stop whereas at high q the noise dominates thesignal. The q-region suitable for analysis is in between. All scattering curves looked similar nomatter whether these had been results from S-USAX or SM-SAXS. The difference had only beenthe absolute q-range and the decline of the curve. In the whole observed q-range no Bragg-peaksoccurred. This means that no highly ordered structures are present. Both the USAX and the SAXSdatasets followed scaling laws. As the right side of Figure 2.15 suggests the results for a selectedexponent � (here -3.4) both q-ranges can be put together to cover the whole q-range. Therefore
33

techniques can be treated with the same analysis. The observed exponents reach from -5.0 up to-3.0 depending on the measurement position on the sample. An interpretation of the whole intervalof exponents is given with a variation of Porod’s Law for scattering from craze fibrils with diffuseboundaries by Salomons et al. [1]:
� ����� ��� ��� � �� � � � � � � � � (2.1)
Thus � can vary between -3 ( � " 1) for perfectly sharp boundaries and -5 ( � " 0) for a completelysmeared out density profile of the defect structures. The defect boundaries were found to be diffuseclose to the crack and getting sharper with increasing distance from it. The area with the highestamount of dissipated energy is close to the crack. Therefore most of the energy is placed in thecreation of diffuse boundaries. This can be also interpreted as the generation of a bigger interfaceon nanometer scale although it is not fractal.
[1] G. J. Salomons, M. A. Singh, T. Bardouille, W. A. Foran, M. S. Capel; J. Appl. Cryst. 32, 71 (1999)
34
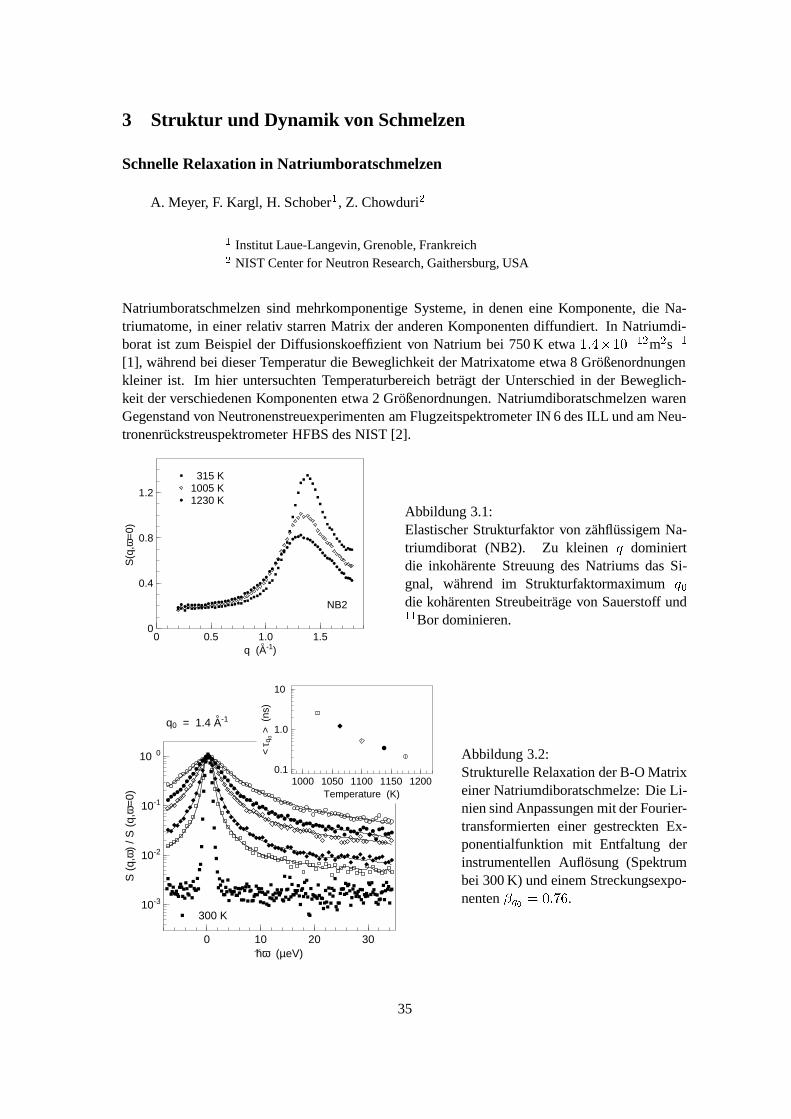
3 Struktur und Dynamik von Schmelzen
Schnelle Relaxation in Natriumboratschmelzen
A. Meyer, F. Kargl, H. Schober�, Z. Chowduri
�
�Institut Laue-Langevin, Grenoble, Frankreich�NIST Center for Neutron Research, Gaithersburg, USA
Natriumboratschmelzen sind mehrkomponentige Systeme, in denen eine Komponente, die Na-triumatome, in einer relativ starren Matrix der anderen Komponenten diffundiert. In Natriumdi-borat ist zum Beispiel der Diffusionskoeffizient von Natrium bei 750 K etwa � ��� � � � m � s �[1], wahrend bei dieser Temperatur die Beweglichkeit der Matrixatome etwa 8 Großenordnungenkleiner ist. Im hier untersuchten Temperaturbereich betragt der Unterschied in der Beweglich-keit der verschiedenen Komponenten etwa 2 Großenordnungen. Natriumdiboratschmelzen warenGegenstand von Neutronenstreuexperimenten am Flugzeitspektrometer IN 6 des ILL und am Neu-tronenruckstreuspektrometer HFBS des NIST [2].
0 0.5 1.0 1.50
0.4
0.8
1.2
q (A-1)
S(q
,ω=
0)
315 K1005 K1230 K
NB2
Abbildung 3.1:Elastischer Strukturfaktor von zahflussigem Na-triumdiborat (NB2). Zu kleinen dominiertdie inkoharente Streuung des Natriums das Si-gnal, wahrend im Strukturfaktormaximum �die koharenten Streubeitrage von Sauerstoff und���
Bor dominieren.
0 10 20 30
10-3
10-2
10-1
10 0
hω (µeV)
S (
q,ω
) / S
(q,
ω=
0)
300 K
q0 = 1.4 A-1
1000 1050 1100 1150 12000.1
1.0
10
Temperature (K)
< τ q
0 > (
ns)
Abbildung 3.2:Strukturelle Relaxation der B-O Matrixeiner Natriumdiboratschmelze: Die Li-nien sind Anpassungen mit der Fourier-transformierten einer gestreckten Ex-ponentialfunktion mit Entfaltung derinstrumentellen Auflosung (Spektrumbei 300 K) und einem Streckungsexpo-nenten ����� � � � � �
.
35
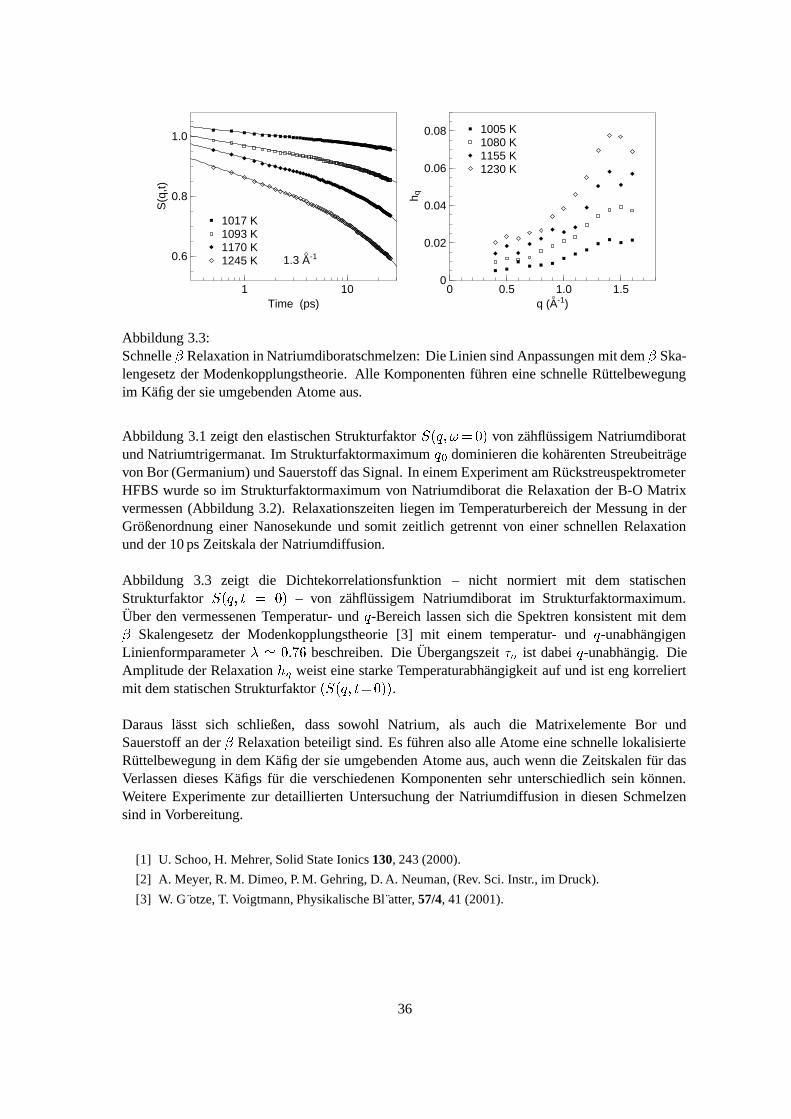
1 10
0.6
0.8
1.0
Time (ps)
S(q
,t)
1017 K1093 K1170 K1245 K 1.3 A-1
0 0.5 1.0 1.50
0.02
0.04
0.06
0.08
h q
q (A-1)
1005 K1080 K1155 K1230 K
Abbildung 3.3:Schnelle � Relaxation in Natriumdiboratschmelzen: Die Linien sind Anpassungen mit dem � Ska-lengesetz der Modenkopplungstheorie. Alle Komponenten fuhren eine schnelle Ruttelbewegungim Kafig der sie umgebenden Atome aus.
Abbildung 3.1 zeigt den elastischen Strukturfaktor � � ���� ��� � von zahflussigem Natriumdiboratund Natriumtrigermanat. Im Strukturfaktormaximum � dominieren die koharenten Streubeitragevon Bor (Germanium) und Sauerstoff das Signal. In einem Experiment am RuckstreuspektrometerHFBS wurde so im Strukturfaktormaximum von Natriumdiborat die Relaxation der B-O Matrixvermessen (Abbildung 3.2). Relaxationszeiten liegen im Temperaturbereich der Messung in derGroßenordnung einer Nanosekunde und somit zeitlich getrennt von einer schnellen Relaxationund der 10 ps Zeitskala der Natriumdiffusion.
Abbildung 3.3 zeigt die Dichtekorrelationsfunktion – nicht normiert mit dem statischenStrukturfaktor � � �� � � � – von zahflussigem Natriumdiborat im Strukturfaktormaximum.Uber den vermessenen Temperatur- und -Bereich lassen sich die Spektren konsistent mit dem� Skalengesetz der Modenkopplungstheorie [3] mit einem temperatur- und -unabhangigenLinienformparameter ��� � � � �
beschreiben. Die Ubergangszeit���
ist dabei -unabhangig. DieAmplitude der Relaxation ��� weist eine starke Temperaturabhangigkeit auf und ist eng korreliertmit dem statischen Strukturfaktor � � � �� � � ��� .Daraus lasst sich schließen, dass sowohl Natrium, als auch die Matrixelemente Bor undSauerstoff an der � Relaxation beteiligt sind. Es fuhren also alle Atome eine schnelle lokalisierteRuttelbewegung in dem Kafig der sie umgebenden Atome aus, auch wenn die Zeitskalen fur dasVerlassen dieses Kafigs fur die verschiedenen Komponenten sehr unterschiedlich sein konnen.Weitere Experimente zur detaillierten Untersuchung der Natriumdiffusion in diesen Schmelzensind in Vorbereitung.
[1] U. Schoo, H. Mehrer, Solid State Ionics 130, 243 (2000).
[2] A. Meyer, R. M. Dimeo, P. M. Gehring, D. A. Neuman, (Rev. Sci. Instr., im Druck).
[3] W. G otze, T. Voigtmann, Physikalische Bl atter, 57/4, 41 (2001).
36
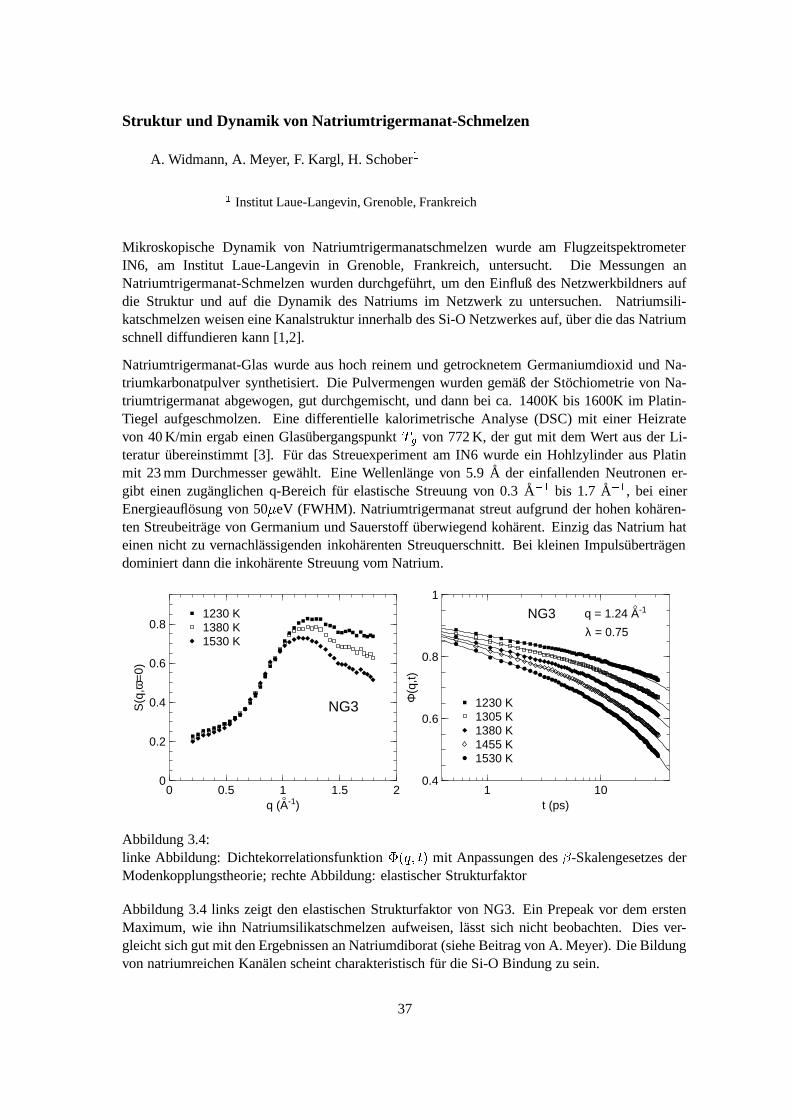
Struktur und Dynamik von Natriumtrigermanat-Schmelzen
A. Widmann, A. Meyer, F. Kargl, H. Schober�
�Institut Laue-Langevin, Grenoble, Frankreich
Mikroskopische Dynamik von Natriumtrigermanatschmelzen wurde am FlugzeitspektrometerIN6, am Institut Laue-Langevin in Grenoble, Frankreich, untersucht. Die Messungen anNatriumtrigermanat-Schmelzen wurden durchgefuhrt, um den Einfluß des Netzwerkbildners aufdie Struktur und auf die Dynamik des Natriums im Netzwerk zu untersuchen. Natriumsili-katschmelzen weisen eine Kanalstruktur innerhalb des Si-O Netzwerkes auf, uber die das Natriumschnell diffundieren kann [1,2].
Natriumtrigermanat-Glas wurde aus hoch reinem und getrocknetem Germaniumdioxid und Na-triumkarbonatpulver synthetisiert. Die Pulvermengen wurden gemaß der Stochiometrie von Na-triumtrigermanat abgewogen, gut durchgemischt, und dann bei ca. 1400K bis 1600K im Platin-Tiegel aufgeschmolzen. Eine differentielle kalorimetrische Analyse (DSC) mit einer Heizratevon 40 K/min ergab einen Glasubergangspunkt
� �von 772 K, der gut mit dem Wert aus der Li-
teratur ubereinstimmt [3]. Fur das Streuexperiment am IN6 wurde ein Hohlzylinder aus Platinmit 23 mm Durchmesser gewahlt. Eine Wellenlange von 5.9 A der einfallenden Neutronen er-gibt einen zuganglichen q-Bereich fur elastische Streuung von 0.3 A � bis 1.7 A � , bei einerEnergieauflosung von 50 � eV (FWHM). Natriumtrigermanat streut aufgrund der hohen koharen-ten Streubeitrage von Germanium und Sauerstoff uberwiegend koharent. Einzig das Natrium hateinen nicht zu vernachlassigenden inkoharenten Streuquerschnitt. Bei kleinen Impulsubertragendominiert dann die inkoharente Streuung vom Natrium.
0 0.5 1 1.5 20
0.2
0.4
0.6
0.8
q (A-1)
S(q
,ω=
0)
NG3
1230 K1380 K1530 K
1 100.4
0.6
0.8
1
t (ps)
Φ(q
,t)
1230 K1305 K1380 K1455 K1530 K
q = 1.24 A-1
λ = 0.75
NG3
Abbildung 3.4:linke Abbildung: Dichtekorrelationsfunktion � � �� � mit Anpassungen des � -Skalengesetzes derModenkopplungstheorie; rechte Abbildung: elastischer Strukturfaktor
Abbildung 3.4 links zeigt den elastischen Strukturfaktor von NG3. Ein Prepeak vor dem erstenMaximum, wie ihn Natriumsilikatschmelzen aufweisen, lasst sich nicht beobachten. Dies ver-gleicht sich gut mit den Ergebnissen an Natriumdiborat (siehe Beitrag von A. Meyer). Die Bildungvon natriumreichen Kanalen scheint charakteristisch fur die Si-O Bindung zu sein.
37

Die rechte Abbildung zeigt die Dichtekorrelationsfunktion � � �� � der Natriumtrigermanatschel-zen. Wie in Natriumdiborat lasst sich die mikroskopische Dynamik mit dem � -Skalengesetz derModenkopplungstheorie beschreiben [4]. Auch in Natriumtrigermanat gibt es einen ausgepragten� -Relaxationsprozeß.
[1] A. Meyer, H. Schober, D. B. Dingwell, Europhys. Lett. 59 708-713 (2002)
[2] F. Kargl: Struktur und Dynamik von Natrium-Silikat-Schmelzen untersucht mit inelastischer Neutro-nenstreuung, Diplomarbeit, Technische Universit at M unchen (2002)
[3] T. J. Kiczenski, Chris Ma, E. Hammarsten, J. Non-Cryst.Solids 272, 57-66 (2000)
[4] W. G otze, T. Voigtmann, Physikalische Bl atter, 57/4, 41 (2001)
Nahordnung in Natriumsilikatschmelzen
F. Kargl, A. Meyer, H. Schober�, W. Kob
�, J. Horbach
�
�Institut Laue-Langevin, Grenoble, Frankreich�Laboratoire des Verres, Universit �e Montpellier II, Frankreich�Johannes Gutenberg Universit at Mainz
In Alkalisilikaten, die als einfache binare Analoga zur Magma und als Prototypen fur glasbildendeIonenleiter betrachtet werden konnen, ist das Verhalten grundlegender physikalischer Eigen-schaften noch weitgehend unverstanden. Eine erste Modellbildung der Struktur wurde schonvon Zachariasen vorgenommen, welche von einer statistischen Verteilung der Alkaliatome in derSiO-Matrix ausging [1]. Mit diesem Modell kann jedoch weder die Abhangigkeit der Viskositatvon der Natriumkonzentration, noch die schnelle Dynamik der Na-Atome erklart werden. VonGreaves et al. wurden zahlreiche Untersuchungen zur Struktur der Silikate unter anderem mitEXAFS durchgefuhrt. Ausgehend von diesen Messungen zur lokalen Umgebung der Si undNa Atome postuliert er eine modifizierte Netzwerkstruktur, in der die Na-Atome Cluster bilden[2]. Im Fall der Erdalkalisilikate wurde von Gaskell mittels Neutronendiffraktion die Strukturim Glas untersucht. Die Messungen gaben einen ersten Hinweis, dass eine Korrelation derCa-Atome auf mittlerer Langenskala besteht [3]. In geschmolzenem Natriumdisilikat konnten wirim elastischen Strukturfaktor einen Prepeak vor dem ersten Strukturfaktormaximum nachweisen[4]. Molekulardynamik(MD)-Simulationen identifizieren die Position des Prepeaks mit demtypischen Abstand von Na-reichen Kanalen im Silikatnetzwerk [5]. Die Bildung von Na Clusternwird nicht beobachtet.
Mit inelastischer Neutronenstreuung haben wir die strukturelle Nahordnung in Alkalisilika-ten in Abhangigkeit von der Alkalikonzentration untersucht. Fur die Messungen wurdenNa � Si � O � (NS1.5), Na � Si � O � (NS3) und Na � Si � O � (NS4) reinsten SiO � - und Na � CO � -Pulvernsynthetisiert. Die Experimente wurden am Flugzeitspektrometer IN6 des ILL in Grenoble beieiner Wellenlange von � ����� � A der einfallenden Neutronen durchgefuhrt. Gemessen wurde beiRaumtemperatur und in der Schmelze bei Temperaturen bis zu 1600 K.
In Abb. 3.5 a) sind die elastischen Strukturfaktoren fur NS2, NS3 und NS4 bei 1600 K aufge-tragen. Man erkennt deutlich den Prepeak bei � � � � A � . Der Prepeak ist mit steigenderNa-Konzentration starker ausgebildet. Die Position des Prepeaks andert sich jedoch in diesem
38
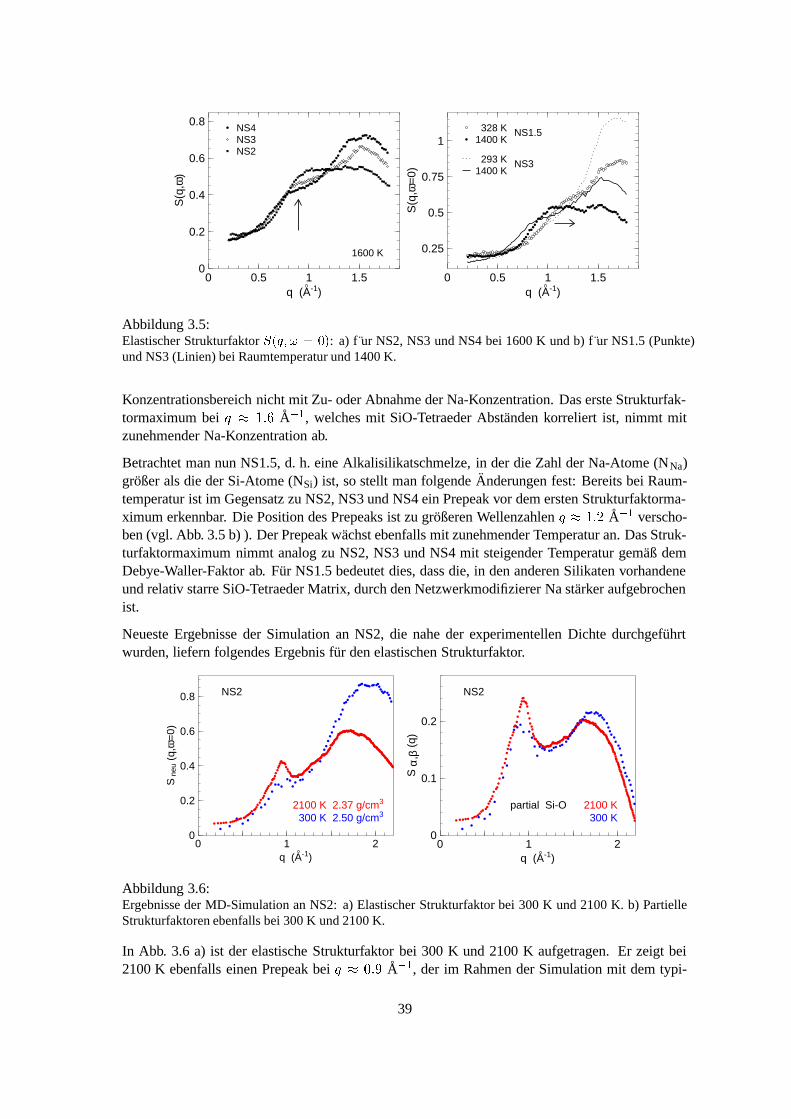
0 0.5 1 1.50
0.2
0.4
0.6
0.8
q (A-1)
S(q
,ω)
NS4NS3NS2
1600 K
0 0.5 1 1.5
0.25
0.5
0.75
1
q (A-1)
S(q
,ω=
0)
328 K1400 K
NS1.5
293 K1400 K
NS3
Abbildung 3.5:Elastischer Strukturfaktor � �����������
: a) f ur NS2, NS3 und NS4 bei 1600 K und b) f ur NS1.5 (Punkte)und NS3 (Linien) bei Raumtemperatur und 1400 K.
Konzentrationsbereich nicht mit Zu- oder Abnahme der Na-Konzentration. Das erste Strukturfak-tormaximum bei � � �
A � , welches mit SiO-Tetraeder Abstanden korreliert ist, nimmt mitzunehmender Na-Konzentration ab.
Betrachtet man nun NS1.5, d. h. eine Alkalisilikatschmelze, in der die Zahl der Na-Atome (NNa)großer als die der Si-Atome (NSi) ist, so stellt man folgende Anderungen fest: Bereits bei Raum-temperatur ist im Gegensatz zu NS2, NS3 und NS4 ein Prepeak vor dem ersten Strukturfaktorma-ximum erkennbar. Die Position des Prepeaks ist zu großeren Wellenzahlen � � � A � verscho-ben (vgl. Abb. 3.5 b) ). Der Prepeak wachst ebenfalls mit zunehmender Temperatur an. Das Struk-turfaktormaximum nimmt analog zu NS2, NS3 und NS4 mit steigender Temperatur gemaß demDebye-Waller-Faktor ab. Fur NS1.5 bedeutet dies, dass die, in den anderen Silikaten vorhandeneund relativ starre SiO-Tetraeder Matrix, durch den Netzwerkmodifizierer Na starker aufgebrochenist.
Neueste Ergebnisse der Simulation an NS2, die nahe der experimentellen Dichte durchgefuhrtwurden, liefern folgendes Ergebnis fur den elastischen Strukturfaktor.
0 1 20
0.2
0.4
0.6
0.8
q (A-1)
S n
eu (
q,ω
=0)
NS2
2100 K 2.37 g/cm3
300 K 2.50 g/cm3
0 1 20
0.1
0.2
q (A-1)
S α
,β (
q)
NS2
2100 K300 K
partial Si-O
Abbildung 3.6:Ergebnisse der MD-Simulation an NS2: a) Elastischer Strukturfaktor bei 300 K und 2100 K. b) PartielleStrukturfaktoren ebenfalls bei 300 K und 2100 K.
In Abb. 3.6 a) ist der elastische Strukturfaktor bei 300 K und 2100 K aufgetragen. Er zeigt bei2100 K ebenfalls einen Prepeak bei � � � � A � , der im Rahmen der Simulation mit dem typi-
39
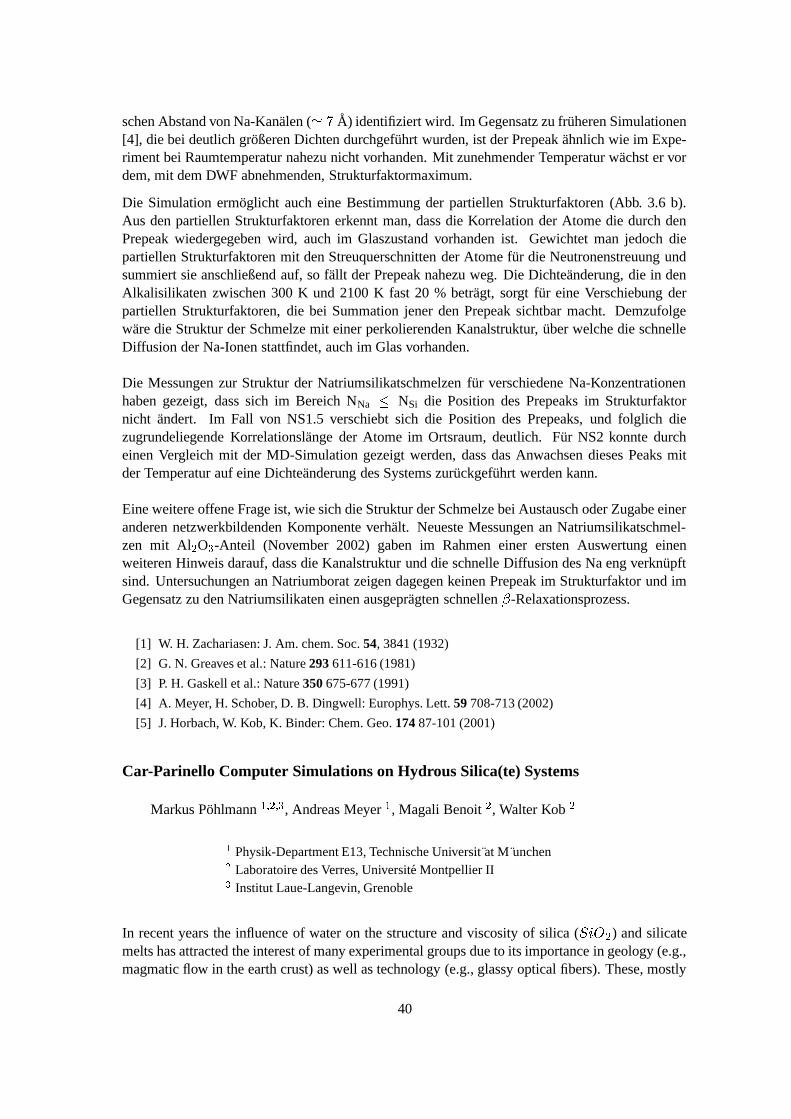
schen Abstand von Na-Kanalen ( � � A) identifiziert wird. Im Gegensatz zu fruheren Simulationen[4], die bei deutlich großeren Dichten durchgefuhrt wurden, ist der Prepeak ahnlich wie im Expe-riment bei Raumtemperatur nahezu nicht vorhanden. Mit zunehmender Temperatur wachst er vordem, mit dem DWF abnehmenden, Strukturfaktormaximum.
Die Simulation ermoglicht auch eine Bestimmung der partiellen Strukturfaktoren (Abb. 3.6 b).Aus den partiellen Strukturfaktoren erkennt man, dass die Korrelation der Atome die durch denPrepeak wiedergegeben wird, auch im Glaszustand vorhanden ist. Gewichtet man jedoch diepartiellen Strukturfaktoren mit den Streuquerschnitten der Atome fur die Neutronenstreuung undsummiert sie anschließend auf, so fallt der Prepeak nahezu weg. Die Dichteanderung, die in denAlkalisilikaten zwischen 300 K und 2100 K fast 20 % betragt, sorgt fur eine Verschiebung derpartiellen Strukturfaktoren, die bei Summation jener den Prepeak sichtbar macht. Demzufolgeware die Struktur der Schmelze mit einer perkolierenden Kanalstruktur, uber welche die schnelleDiffusion der Na-Ionen stattfindet, auch im Glas vorhanden.
Die Messungen zur Struktur der Natriumsilikatschmelzen fur verschiedene Na-Konzentrationenhaben gezeigt, dass sich im Bereich NNa
�NSi die Position des Prepeaks im Strukturfaktor
nicht andert. Im Fall von NS1.5 verschiebt sich die Position des Prepeaks, und folglich diezugrundeliegende Korrelationslange der Atome im Ortsraum, deutlich. Fur NS2 konnte durcheinen Vergleich mit der MD-Simulation gezeigt werden, dass das Anwachsen dieses Peaks mitder Temperatur auf eine Dichteanderung des Systems zuruckgefuhrt werden kann.
Eine weitere offene Frage ist, wie sich die Struktur der Schmelze bei Austausch oder Zugabe eineranderen netzwerkbildenden Komponente verhalt. Neueste Messungen an Natriumsilikatschmel-zen mit Al � O � -Anteil (November 2002) gaben im Rahmen einer ersten Auswertung einenweiteren Hinweis darauf, dass die Kanalstruktur und die schnelle Diffusion des Na eng verknupftsind. Untersuchungen an Natriumborat zeigen dagegen keinen Prepeak im Strukturfaktor und imGegensatz zu den Natriumsilikaten einen ausgepragten schnellen � -Relaxationsprozess.
[1] W. H. Zachariasen: J. Am. chem. Soc. 54, 3841 (1932)
[2] G. N. Greaves et al.: Nature 293 611-616 (1981)
[3] P. H. Gaskell et al.: Nature 350 675-677 (1991)
[4] A. Meyer, H. Schober, D. B. Dingwell: Europhys. Lett. 59 708-713 (2002)
[5] J. Horbach, W. Kob, K. Binder: Chem. Geo. 174 87-101 (2001)
Car-Parinello Computer Simulations on Hydrous Silica(te) Systems
Markus Pohlmann��� � � �
, Andreas Meyer�, Magali Benoit
�, Walter Kob
�
�Physik-Department E13, Technische Universit at M unchen�Laboratoire des Verres, Universite Montpellier II�Institut Laue-Langevin, Grenoble
In recent years the influence of water on the structure and viscosity of silica ( � ��� � ) and silicatemelts has attracted the interest of many experimental groups due to its importance in geology (e.g.,magmatic flow in the earth crust) as well as technology (e.g., glassy optical fibers). These, mostly
40
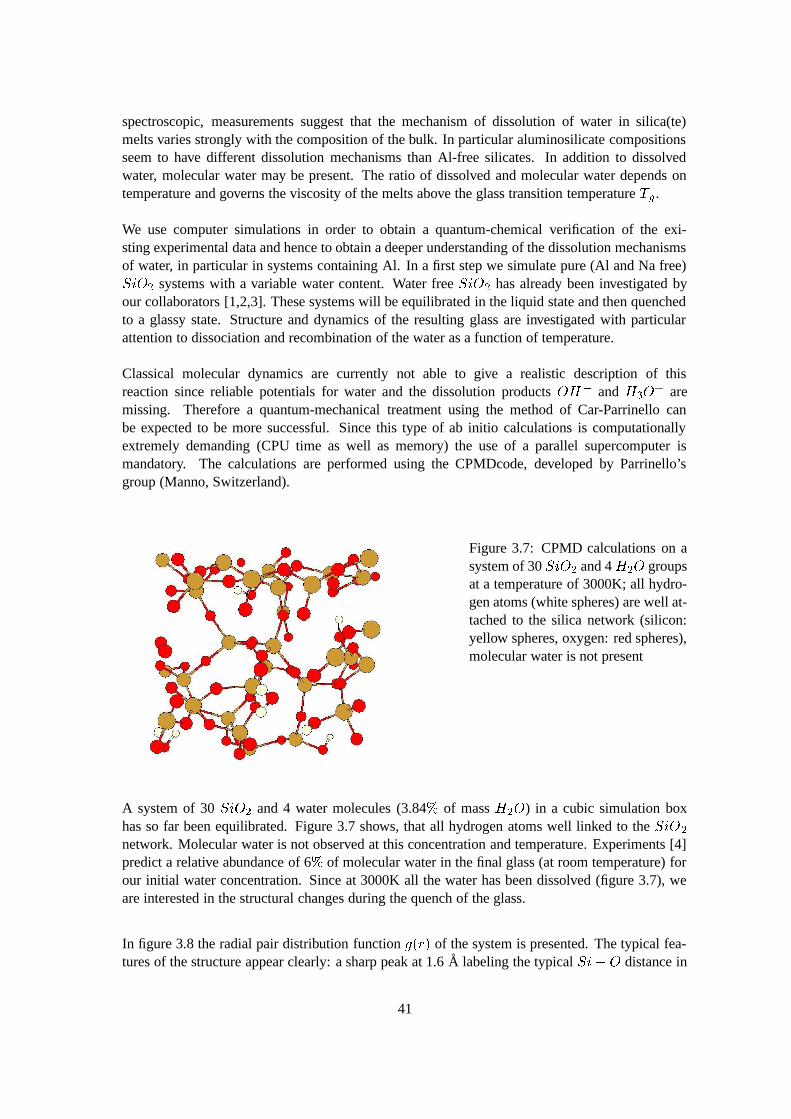
spectroscopic, measurements suggest that the mechanism of dissolution of water in silica(te)melts varies strongly with the composition of the bulk. In particular aluminosilicate compositionsseem to have different dissolution mechanisms than Al-free silicates. In addition to dissolvedwater, molecular water may be present. The ratio of dissolved and molecular water depends ontemperature and governs the viscosity of the melts above the glass transition temperature
� �.
We use computer simulations in order to obtain a quantum-chemical verification of the exi-sting experimental data and hence to obtain a deeper understanding of the dissolution mechanismsof water, in particular in systems containing Al. In a first step we simulate pure (Al and Na free)� ��� � systems with a variable water content. Water free � ��� � has already been investigated byour collaborators [1,2,3]. These systems will be equilibrated in the liquid state and then quenchedto a glassy state. Structure and dynamics of the resulting glass are investigated with particularattention to dissociation and recombination of the water as a function of temperature.
Classical molecular dynamics are currently not able to give a realistic description of thisreaction since reliable potentials for water and the dissolution products
��� and� � �
�are
missing. Therefore a quantum-mechanical treatment using the method of Car-Parrinello canbe expected to be more successful. Since this type of ab initio calculations is computationallyextremely demanding (CPU time as well as memory) the use of a parallel supercomputer ismandatory. The calculations are performed using the CPMDcode, developed by Parrinello’sgroup (Manno, Switzerland).
Figure 3.7: CPMD calculations on asystem of 30 � ��� � and 4
� � � groupsat a temperature of 3000K; all hydro-gen atoms (white spheres) are well at-tached to the silica network (silicon:yellow spheres, oxygen: red spheres),molecular water is not present
A system of 30 � ��� � and 4 water molecules (3.84 � of mass� � � ) in a cubic simulation box
has so far been equilibrated. Figure 3.7 shows, that all hydrogen atoms well linked to the � ��� �network. Molecular water is not observed at this concentration and temperature. Experiments [4]predict a relative abundance of 6 � of molecular water in the final glass (at room temperature) forour initial water concentration. Since at 3000K all the water has been dissolved (figure 3.7), weare interested in the structural changes during the quench of the glass.
In figure 3.8 the radial pair distribution function � ��� � of the system is presented. The typical fea-tures of the structure appear clearly: a sharp peak at 1.6 A labeling the typical � � �
distance in
41

0 2 4 6 8 10r [Angstrom]
0
2
4
6
8
10g(
r)Si−SiSi−OO−OSi−HO−HH−H
Figure 3.8: CPMD calculations on asystem of 30 � ��� � and 4
� � � groupsat a temperature of 3000K; radial pairdistribution function.
� ��� � tetrahedras and the O-H bond length of about 0.99 A.The calculations are in strong relation to investigations on similar systems with neutron scatteringat the Institut Laue-Langevin. Elastic and inelastic neutron spectroscopy is able to measure the ti-me and space correlation function of silica melts. In particular the presented radial pair distributionis the Fourier transform of the neutron scattering cross section:
� ��� � � ���� � � � � � � � �� ��� ��� (3.1)
Since equivalent data to the observables of our calculations can be extracted from neutron scatte-ring, these experiments serve as cross check for the reliability of our simulations and vice versa.
[1] J. Horbach, W. Kob. Phys. Rev. B 60, 3169 (1999)
[2] K. Vollmayr, W. Kob , K. Binder Phys. Rev B, 54, 15808 (1996)
[3] M. Benoit, S. Ispas, R. Jullien Eur. Phys. J., B 13 , 631 (2000)
[4] B. O. Mysen, D. Virgo. Chem. Geology 57, 303-331 (1986)
Quasielastic Neutron Scattering on PdNiP Melts
S. Mavila Chathoth , A. Meyer, W. Petry and F. Juranyi�
�Paul Scherrer Institute, Villigen, Switzerland
The dynamic of glass formation and its puzzling features have been the subject of many experi-mental and theoretical studies. Multicomponent metallic alloys, that exhibit a high degree of glassforming ability, show a structural relaxation known for nonmetallic glass forming liquids. Evenat well above melting point, the structrual relaxation in these metallic liquids is nonexpontionaland the diffusivity is two orders of magnitude smaller than that in simple metallic liquids. Inthe present study we investigated the slow dynamics of Pd �
�Ni ��P � � using a cold neutron time
of flight spectrometer FOCUS, at Paul scherrer institute, Villigen Switzerland with a measuringwavelength of 5.4 A. As compared to bulk glass forming Pd � � Ni � � Cu ��� P � � [1], Pd �
�Ni ��P � � re-
veals a higher liquidus temperature and a reduced glass forming ability. Both alloys are in good
42

approximation hard-sphere like dense liquids and are characterized by packing fraction of about0.52 at their melting points.
Pd ��Ni ��P � � was prepared from a mixture of pure elements by arc melting Pd and Ni and follwed
by induction melting PdNi with Phosphorus. The melt was subjected to a B � O � flux treatmentin order to remove oxide impurities. Differential scanning calorimetery with a heating rate of40 K/s resulted in a
� ���� �
� � � K and a�� � � � � � �
K in accordance with literature values [2].For the neutron time of flight experiment a thin walled Al � O � contanier has been used giving ahollow cylinder sample geometry of 22mm in diameter. A wavelength of � = 5.4 A of the incidentneutrons result in an accessible wavenumber range � � � � to 1.8A � at zero energy transfer. Inthis range scattering is dominated by the incoherent contributions from Nickel.
0 1
0.01
0.1
1
10
hω (meV)
S (
q,ω
) (
meV
-1)
1383 K 300 K
Figure 3.9:Scattering law � � ���� � (logarithmic scale)of liquid Pd �
�Ni ��P � � . The signal is domi-
nated by the incoherent scattering from Ni.The data at 300 K represent the instrumen-tal energy resolution. Spectra in the liquidshow a broad quasielastic signal.
1 100
0.25
0.5
0.75
1
Time (ps)
Φ (
q,t)
963 K1063 K1203 K1293 K1383 K
0.9A-1
Figure 3.10:Normalized density correlation function
� � �� � of liquid Pd ��Ni ��P � � at 0.9A � as
obtained by Fourier deconvolution of mea-sured � � ���� � . The lines are fits with a stret-ched exponential function.
Figure 3.9 shows the scattering law � � ���� � of liquid Pd ��Ni ��P � � at = 0.9A � . The spectra exhi-
bit a broad quasielastic line with wings extending upto several meV. The quasielastic signal is bestanalysed in time with a removal of the instrumental resolution function. The density correlationfunction � (q,t) has been obtained by Fourier transformation of measured � � ���� � , deconvolutionof the instrumental resolution function, and normalization with the value at
� � . Figure 3.10shows the log-time decay of � � �� � at �� � � � A � . In contrast to simple metallic liquids, liquidPd ��Ni ��P � � exhibit a structural relaxation that exhibits stretching in time. The lines fits with a
stretched exponential function:� � �� � � � � ����� � � ��� � � ��� � . In a first fitting process the stret-
ching exponent � � � � � was treated as a parameter. � � � � � shows a scattering arround a mean �
43

= 0.85. For the further data analysis a � = 0.85 was used. As compared to Pd � � Ni � � Cu ��� P � �( � � � � � � ) stretching is less pronounced in Pd �
�Ni ��P � � .
In the hydrodynamic limit for !" � the mean relaxation time � � ��� is indirectly proportionalto the momentum transfer square. In liquid PdNiP the 1/ � dependence holds even up to 1.8A � (Figure 3.11). This allows to read off the Ni self diffusivity � � � � � ��� � . Figure 3.12displays the Nickel diffusivities in liquid Pd �
�Ni ��P � � as a function of temperature. Values range
from � � ��� � � �m�/s to ��� � � � �
m�/s. For a comparison the mean Cu/Ni diffusivities of
Pd ��Ni � � Cu � � P � � [3] and Pd � � Ni � � Cu ��� P � � are shown. Absolute values of the Ni diffusion in
Pd ��Ni ��P � � and Pd �
�Ni � � Cu � � P � � are equal within the statistical error. The presence of Cu does
not influence the Ni mobility in these alloys.
0 1 20
0.2
0.4
0.6
q 2 (A -2)
1 / ⟨
τq ⟩
(ps
-1)
1383 K1293 K1203 K1063 K 963 K
PdNiP
Figure 3.11:Mean relaxation time � � ��� of self motion inliquid Pd �
�Ni ��P � � . 1/ � � ��� shows a q
�de-
pendence as expected for long range atomictransport for q " 0. The slope correspon-dance to the diffusion coefficient �
0.6 0.8 1.0 1.2
10-10
10 -9
1000 / T (K-1)
D (
m2
s-1)
PdNiPPd43NiCuPPd40NiCuP
Ni diffusion Figure 3.12:Self diffusion coefficient of Ni in liquidPd ��Ni ��P � � and PdNiCuP alloys
In conclusion, the stretching of the structural relaxation in Pd ��Ni ��P � � is with � � � � � � less
pronounced than in Pd � � Ni � � Cu ��� P � � with � � � � � � . It appears that glass formation and stretchingdepend on the alloy composition. The diffusity in contrast only depends on the packing fraction.
[1] A. Meyer, Phys. Rev. B 66, 134205 (2002)
[2] H. W. Kui and D. Turnbull, J. Non-Cry.Solids. 94, 62 (1987)
[3] A. Meyer, R. Busch, H. Schober, Phys. Rev. Lett. 83, 5027 (1999)
44

4 Molekuldynamik
Experimente an Benzol in der Zeit– und Frequenzdomane
S. Wiebel, P. Bartolini�, A. Taschin
�, M. Ricci
�, R. Righini
�, W. Petry, R. Torre
�
�LENS (European Laboratory for Non Linear Spectroscopy), Firenze
Depolarisierte Lichtstreumessungen an flussigem und unterkuhltem Benzol haben demonstriert,dass diese denkbar einfache molekulare Flussigkeit auch mit Modellen beschrieben werden kann,die ursprunglich fur glasbildende Systeme entwickelt wurden [1]. Dies wurde bereits im Jahres-bericht 2001 diskutiert.
Die Untersuchungen wurden um Experimente in der Zeitdomane erweitert. Dabei wurde mit ei-nem Anregungspuls eine Doppelbrechung in der Probe induziert (optischer Kerr-Effekt, OKE),die dann mit einem schwacheren Sondenpuls abgetastet wurde. Diese Experimente wurden amLENS (European Laboratory for Non Linear Spectroscopy) in Firenze (Italien) durchgefuhrt. Beidieser Methode entspricht das Messsignal der zeitlichen Ableitung der Korrelationsfunktion � � � ,in der Lichtstreuung arbeiten wir mit der dynamischen Suszeptibilitat � % % ��� � . Beide Messsigna-le beruhen auf Fluktuationen des dielektrischen Tensors und gehen durch Fouriertransformationineinander uber. In Abb. 4.1 sind die beiden Datensatze gegenubergestellt.
1 10 100 1000
1
10
ν (GHz)
χ’’(ν
) (
arb.
uni
ts)
258
K
352
K
Lichtstreuung
1 1010-5
10-4
10-3
10-2
0.1
1
t (ps)
dΦ(t
) / d
t (a
rb. u
nits
)
258 K350 K
optischer Kerr-Effekt
Abbildung 4.1:Messdaten von Benzol im Temperaturbereich zwischen 258 und 350 K. Links sind die dyna-mischen Suszeptibilitaten aus der Lichtstreuung gezeigt; rechts der Zerfall des optischen Kerr-Effekts.
Die komplementaren Messungen erlauben uns einen sehr genauen Blick auf die strukturelle Re-laxation und bieten zusatzlich die Moglichkeit, die beiden experimentellen Methoden intensiv zuvergleichen. Ein erster qualitativer Vergleich [2] legt nahe, die beiden Datensatze als gleichwertigzu betrachten. Wir belegen dies durch die Fouriertransformation unserer Daten. Zusatzlich ver-wenden wir das schematische F � � -Modenkopplungsmodell, das wir mit identischen Parametern anbeide Datensatze angepasst haben. Die Parametrisierung durch das Modell umgeht das Problem,dass die gemessenen Datensatze nur in einem endlichen Zeit– bzw. Frequenzfenster verfugbar sindund deshalb nur naherungsweise transformiert werden konnen.
45

1 10 100 1000 10000
1e-2
0.1
1
10
ν (GHz)
χ’’(ν
) (
arb.
uni
ts)
280 K
350 K
Abbildung 4.2:Dynamische Suszeptibilitaten von Benzol aus qua-sielastischer Lichtstreuung (offene Symbole) unddas fouriertransformierte Signal des optischenKerr-Effekts (ausgefullte Symbole).
Bei der Fouriertransformation der optischen Kerr-Daten zeigt sich, dass das Verhaltnis von Hoch–und Niederfrequenzintensitat stark von der Form der Auflosungsfunktion abhangt, die nicht genauanalytisch beschrieben werden kann. Die Entfaltung gelingt nicht bei allen Messungen gleichgut, insgesamt ist die Ubereinstimmung mit den Lichtstreuergebnissen jedoch, wie in (Abb. 4.2)gezeigt, zufriedenstellend.
Das schematische F � � -Modell der Modenkopplungstheorie [3], ist in der Lage, beide experimen-tellen Datensatze konsistent mit einem einzigen Parametersatz zu beschreiben. Die Fitkurven sindin Abb. 4.1 mit eingezeichnet. Sie gehen durch Fouriertransformation ineinander uber.
Es wurde bereits in mehreren Flussigkeiten beobachtet, das die strukturelle Relaxation in der Zeit-domane weniger gestreckt erscheint als in der Frequenzdomane. Dies ist in erster Linie auf dieDarstellungsform zuruckzufuhren. Im Fall von Benzol, wo die in der Lichtstreuung beobachteteStreckung der Relaxation ein uberraschendes Resultat war, schien es deshalb lohnend, die Analysein diesem Bereich an den neuen Daten zu wiederholen. Abb. 4.3 zeigt die in diesem Bereich ska-
1 10 100
0.1
0.3
ν / να
χ’’(ν
/να)
/ A
α
10-2 0.1 1 1010-5
10-4
10-3
10-2
0.1
1
10
t / τα
dΦ /d
t (t /
τα)
/ A
α
Abbildung 4.3:Das Skalengesetz und die Streckung der � –Relaxation lasst sich in der Zeitdomane (aus Licht-streuung, links) und in der Frequenzdomane (aus OKE, rechts) bestatigen.
lierten Datensatze. Bei den Lichtstreudaten sind eine Cole-Davidson-Funktion mit ����� � � � ���(durchgezogen), eine gestreckte Exponentialfunktion nach Kohlrausch mit ����� � � � � (gestrichelt)und eine einfache Exponentialfunktion (gepunktet) eingezeichnet. Auch die in der Zeitdomane ge-messenen Daten werden durch eine Kohlrauschfunktion deutlich besser beschrieben als durch eineeinfache Exponentialfunktion. Dabei finden wir ��� � � � � �
.
[1] S. Wiebel, J. Wuttke: N. J. Phys. 4, 56 (2002)
[2] S. Kinoshita, Y. Kai,M. Yamaguchi und T. Yagi: Phys. Rev. Lett. 75, 148 (1995)
[3] W. G otze: Z. Phys.B 56, 139 (1984)
46

Der Modenkopplungsansatz in Methanol und Ethanol
S. Wiebel, M. Goldammer und J. Wuttke
Im Rahmen von systematischen Untersuchungen an molekularen Flussigkeiten haben wir depo-larisierte Lichtstreumessungen an Methanol und Ethanol durchgefuhrt. Diese beiden Substanzenwurden als zwei strukturell verwandte, relativ einfache Systeme ausgewahlt, die mit ihren Was-serstoffbruckenbindungen zwischen van-der-Waals-Flussigkeiten wie n-Butyl-Benzol oder Toluolund chemisch gebundenen Systemen wie etwas Quarzglas liegen. Wir finden in beiden Alkoholen
1 10 100 1000
1
10
ν (GHz)
χ’’(ν
) (
arb.
uni
ts)
142 K
350
K
Ethanol
1 10 100 1000
1
10
100
ν (GHz)
152 K
336
K
Methanol
Abbildung 4.4:Dynamische Suszeptibilitaten von Ethanol (links) bei
� � 142, 147, 152, 164, 180, 200, 220, 230,240, 250, 270, 290, 310, 320, 330, 340 und 350 K und Methanol (rechts) bei
� � 152, 160, 168,178, 195, 220, 245, 270, 293, 320, 328 und 336 K.
eine strukturelle Relaxation, die dem Zeit-Temperatur-Verschiebungssatz gehorcht. In beiden Sub-stanzen lasst sich diese � -Relaxation durch eine gestreckte Exponentialfunktion von Kohlrauschmit dem einheitlichen Streckungsexponenten � � � � � � beschreiben. Die aus diesen Fits extrahier-ten mittleren Relaxationszeiten � � � sind nicht proportional zur Viskositat � der beiden Substanzen,sondern verhalten sich annahernd proportional zu �
� �, was der Stokes-Einstein-Beziehung ent-
spricht.
0.1 1 10 100
1
ν / νσ
χ / χ
σ
142
K
240
K
Ethanolλ=0.8
λ=0.7
Abbildung 4.5:Skalenplot der schnellen � -Relaxation in Ethanol,eingezeichnet sind die Skalenfunktionen mit � � � � �und � � � � �
Da beide Substanzen ein Minimum der schnellen � -Relaxation zeigen, haben wir die Gultig-keit der asymptotischen Skalenfunktion �
� ��� ��� � � ��� der Modenkopplungstheorie ausgelotet. Die
47

Suszeptibilitaten von Ethanol lassen sich fur 7 Temperaturen auf eine Meisterkurve reskalieren.(Abb. 4.5) Eine iterative Skalenanalyse liefert einen Exponentenparameter �
� � � � ; die zugehori-ge Skalenfunktion passt im Niederfrequenzflugel hervorragend an die Daten, weicht bei Frequen-zen oberhalb des Minimums jedoch ab. Aus den charakteristischen Frequenzen und Amplitudenkann man auf eine Ubergangstemperatur von
��� � � � K extrapolieren. Die Methanol-Spektrenskalieren im Bereich der Minimums nicht, es sind deshalb auch keine asymptotischen Moden-kopplungsfits mit einem konsistenten Exponentenparameter moglich.
Fur beide Substanzen liegen Datensatze in einem großen Temperaturintervall vor, die einen sehreingeschrankten asymptotischen Bereich haben. Deshalb bietet sich die Analyse durch ein sche-matisches Modenkopplungsmodell [1] an. Die Daten weisen keinen starken Bosonpeak auf undkonnen durch das F � � -Modell beschrieben werden. Dieses Modell wurde im Jahresbericht 2001bereits fur Benzol eingesetzt. Uber weite Bereiche erreichen wir eine gute Fitqualitat (Abb. 4.6),lediglich bei niedrigen Temperaturen kann der Bereich der schnellen � -Relaxation nicht optimalangepasst werden.
1 10 100 1000
10
χ’’(ν
) (
arb.
uni
ts)
Ethanol
1 10 100 1000
10
ν (GHz)
χ’’(ν
) (
arb.
uni
ts)
Methanol
1 10 100 1000
10
Ethanol
1 10 100 1000
10
ν (GHz)
Methanol
Abbildung 4.6:Auf der rechten Seite sind die Fits an Ethanol und Methanol fur alle gemessenen Temperaturenmit dem schematischen
� � � Modell der Modenkopplungstheorie gezeigt; auf der linken Seite dieFitkurven mit den zugehorigen Messdaten bei ausgewahlten Temperaturen.
Die Werte der Fitparameter� � � � und � � konnen dabei konstant gehalten werden. Die Kopplungs-
konstanten � � , � � und � � fallen in Ubereinstimmung mit der Theorie mit steigender Temperaturkontinuierlich ab.
Das Phasendiagramm der � � �� � -Ebene verdeutlicht, wie sich die Flussigkeiten der idealenGlasubergangstemperatur nahern, ohne sie im gegebenen Temperaturintervall ganz zu erreichen.Der Verlauf der Kopplungskonstanten im diesem Phasendiagramm erlaubt Ruckschlusse auf denExponentenparameter � . Damit haben wir bei den Ethanol und Methanol die Moglichkeit, dieasymptotischen Modenkopplungsfits auf Konsistenz mit den Fits durch das schematische F � � -Modell zu prufen. Eine Extrapolation auf die Phasengrenze fuhrt auf die Exponentenparameter� � � � � � bei Ethanol und � � � � � �
bei Methanol.
48

Bei Ethanol wurde die Asymptote mit � � � � � � als gestrichelte Linie mit in Abb. 4.5 einge-zeichnet. Man sieht, dass diese Asymptote im Niederfrequenzflugel weniger gut an die skaliertenSuszeptibilitaten passt, im Hochfrequenzflugel jedoch die Daten sehr viel besser beschreibt. Diesbestatigt, wie empfindlich ein aus dem asymptotischen Verhalten bestimmter Exponentenpara-meter vom gewahlten Fitbereich abhangt und demonstriert, dass die aus den schematischen Fitsgewonnene Funktion ebenfalls fur die Messdaten gultig ist.
Im Fall von Methanol liegt die Asymptote mit ��� � � � �zwischen den verschiedenen moglichen
asymptotischen Fitfunktionen, die fur die verschiedenen Temperaturen an die Messdaten ange-passt werden konnten. Die Spektren liegen also durchaus im relevanten Temperaturbereich, derGultigkeitsbereich der asymptotischen Gesetze ist jedoch hier zu stark eingeschrankt fur eine ite-rative Skalenanalyse.
[1] W. G otze: Z. Phys.B 56, 139 (1984)
The order-disorder phase transition in octamethyl-ethinyl-ferrocene (I): an organo-metallic rotator phase
T. Asthalter�, H. Franz
�, U. van Burck, K. Messel
�, E. Schreier, R. Dinnebier
�
�IPC, Universit at Stuttgart�Hasylab/DESY, Hamburg�MPI f ur Festk orperforschung, Stuttgart
Substituted ferrocenes exhibit a variety of interesting properties, in view of possible applications(UV photocathodes, photochemical quenching agents, anionic photoinitiators), but also under mo-re fundamental aspects of the properties of soft condensed matter. In particular, several ferrocenederivatives were reported to exhibit a mesophase with translational symmetry but rotational dis-order between the ordered crystalline and the liquid phase [1–3]. Octamethyl-ethinyl-ferrocene(OMFA) exhibits a sharp decrease of the Lamb-Mossbauer factor at a temperature
������ � � K,
well below the melting point [4–7]. It has been suggested that this phenomenon is of intramo-lecular origin, e.g. due to the coupling of librations of the whole molecule to the rotation of thesubstituted cyclopentadienyl rings [4,5]. No single crystal X-ray diffraction data could be obtainedat room temperature due to lack of suitable samples [7].
We have used a combination of quasielastic nuclear forward scattering (QNFS), high-resolutionX-ray powder diffraction (XRD) and differential scanning calorimetry (DSC), in order to elucidatesome aspects of the associated phase transition on a microscopic basis, dealing with the dynamicprocesses as well as with the structural changes in the vicinity of
���� [8].
Quasielastic nuclear forward scattering (QNFS) provides information about slow dynamics on thens- � s scale as well as about the fast dynamics as described by the Lamb-Mossbauer factor. Usingthis technique at the beamlines PETRA1, Hasylab [9], and ID18, ESRF [10], we were able todemonstrate that below 246 K the dynamics of the Fe atom associated with the phase transitionis much slower than the QNFS timescale ( 141 ns); at 246 and 247 K, the relaxation times are(2.4
�1.7) � s and (1.3
�1.0) � s, respectively; and at 248 K, the relaxation immediately becomes so
fast that it can not be monitored any longer by QNFS, but leads to a sharp (however finite) decrease
49

200 210 220 230 240 250 260T / K
0
0,05
0,1
0,15
0,2
f LM
<x >
/ A2
o2
0.04
0.06
0.080.10
200 210 220 230 240 250 260T / K
0
20
40
60
80
100
% in
ten
sity
-0,2
-0,1
0
0,1
0,2
0,3
Q [
mW
/mg
]
200 210 220 230 240 250 260T [K]
Figure 4.7:Hysteresis of the order-disorder transition in OMFA. Arrows indicate the direction of hea-ting/cooling. Left: Lamb-Mossbauer factor as determined form QNFS; centre: intensity of XRDpeak at ��� = 6.93
�; right: DSC trace at a heating/cooling rate of 10 K/min.
c
ab
Figure 4.8:Left: relation between rhombohedral and pseudo-cubic unit cell of the HT phase of OMFA; right:sketch of the OMFA molecule
in the LMF. Furthermore, a strong thermal hysteresis of the LMF was found and confirmed bothby XRD and DSC investigations, see Fig. 4.7.
The extremely low number of Bragg reflections and the high diffuse background as obtained bystandard laboratory XRD suggested that a rotator phase, where the molecules are positionally or-dered but rotationally disordered, is present above the transition temperature. XRD data obtainedat the X3B1 beamline (NSLS) allowed us to determine the space group at room temperature (RT).Indexing with ITO led to a hexagonal unit cell ( � = 1) with lattice parameters � = � = 12.9475(1)A, � = 9.5578(1) A, which in the rhombohedral setting correspond to � = 8.1258(1) A, � = 105.63
�.
Since the rhombohedral angle is close to the tetrahedral angle of 109.47�, it is possible to deduce
a related body-centered cubic packing with a ”pseudo-cubic” unit cell parameter of 9.383A. Thegeometrical relations between the cubic and the rhombohedral unit cell and the locations of theOMFA molecules are depicted in Fig. 4.8 (left), a sketch of the molecule is shown in Fig. 4.8(right). No extinctions were found in the powder pattern, indicating
���� � as the most probablespace group. This space group has a higher symmetry than would be compatible with a fixed arran-gement of OMFA molecules, whose point symmetry is much lower in all possible conformations,which confirms the assumption of orientational disorder of OMFA in its HT phase.
Using differential scanning calorimetry, an order-disorder transition enthalpy of (9.85�
1.05)J g � or (3186
�340) J mol � was determined, corresponding to a transition entropy of
(13.3�
1.4)J mol � K � . In a very simple model, where all molecular orientations are energeti-cally equal and have well-defined rotation angles for each minimum of the potential well, these
50
values are compatible with – but no proof for – the assumption that the transition involves theonset of rotation of a substituted cyclopentadienyl ring.
In summary, we conclude that the solid-solid phase transition in OMFA, first found by Mossbauerspectroscopy, is a first-order transition from a low-symmetry low-temperature phase to a high-symmetry high-temperature phase having nearly body-centered cubic symmetry, where the cen-tral iron atom moves with a large but finite amplitude around its equilibrium position. Severalquestions, however, remain to be answered:
What are the driving forces of the observed order-disorder transition? Is it exclusively due tointramolecular degrees of freedom, or does intermolecular steric hindrance come into play? Arethe involved degrees of freedom pure rotations of the cyclopentadienyl rings? Is it possible tofreeze orientational disorder on a short-range scale and thus to obtain an orientational glass, ordoes the LT phase simply undergo domain formation?
To this end, XRD investigations of the low-temperature phase, as well as SRPAC (synchrotronradiation-based perturbed angular correlation) experiments, which will allow us to determine ro-tational relaxation times in the high-temperature phase, are planned or under way.
[1] M. F. Daniel, A. J. Leadbetter, R. M. Richardson, J. Chem. Soc.: Faraday Trans. 2 77, 1851 (1981)
[2] K. Sato, M. Iwai, H. Sano, M. Konno, Bull. Chem. Soc. Jpn. 57, 634 (1984)
[3] K. Sato, M. Katada, H. Sano, M. Konno, Bull. Chem. Soc. Jpn. 57, 2361 (1984)
[4] I. Nowik and R. H. Herber, Inorg. Chim. Acta 310, 191 (2000)
[5] R. H. Herber and I. Nowik, Hyperfine Int. 126, 127 (2000)
[6] R. H. Herber, Inorg. Chim. Acta 291, 74 (1999)
[7] H. Schottenberger, K. Wurst, and R. H. Herber, J. Organomet. Chem. 625, 200 (2001)
[8] T. Asthalter, H. Franz, U. van B urck, K. Messel, E. Schreier, R. Dinnebier, J. Phys. Chem. Solids, inpress
[9] H. Franz, B. Hukelmann, J. R. Schneider, Hyperfine Int. 126, 397 (2000)
[10] R. R uffer, A. I. Chumakov, Hyperfine Int. 97/98, 589 (1996)
The order-disorder phase transition in octamethyl-ethinyl-ferrocene (II): a nuclearinelastic absorption study
T. Asthalter�, U. van Burck, H. Franz
�, E. Schreier, I. Sergueev
�, A. I. Chumakov � � �
�IPC, Universit at Stuttgart�Hasylab/DESY, Hamburg�TUM E13/ESRF, Grenoble�ESRF, Grenoble�Russian Research Centre ’Kurchatov Institute’, Moscow
The low-frequency vibrational properties of glasses and other disordered systems are a topic oflong-term interest in condensed matter physics [1]. Especially the microscopic origin of the Bo-son peak is a recent matter of debate. We have applied nuclear inelastic absorption (NIA) to anorganometallic compound, octamethyl-ethinyl-ferrocene (OMFA), which was recently found to
51

undergo a first-order solid-solid phase transition to a rotator phase above���� = 248 K [2,3]. NIA
is a powerful tool for element-selective studies of the vibrational dynamics of crystalline solidsand glasses [4]. It yields the vibrational density of states (VDOS) selectively for the resonantMossbauer nuclei in a material at a resolution that is now comparable to standard infra-red andRaman measurements, and it provides background-free measurements because only the resonantnuclei contribute to the delayed signal.
The issue of the present experiment was twofold:
[1] First, to find out whether the orientationally disordered state might be undercooled, yieldingan orientational glass. Thus, in one and the same compound the acoustic modes and inparticular the Boson peak might be investigated both for the orientationally ordered and theorientationally disordered state.
[2] Second, to obtain precise phonon densities of states above and below the order-disorderphase transition and to identify the phonons whose DOS undergoes significant changes at� �� and thus possible the driving forces for the phase transition on a microscopic basis.
After first tentative NIA experiments at PETRA1, Hasylab [5] with an energy resolution of 2 meV,the necessity of very high energy resolution, which allows to separate elastic and inelastic contri-butions also for soft acoustic modes, became obvious. A subsequent experiment was carried outat ID18, ESRF [6], using a three-bounce high-resolution monochromator (HRM) with two highlyasymmetrically cut Si (9 7 5) reflections and a Ge(3 3 1) symmetrically cut crystal that ensuresan approximately horizontally outgoing beam. A new set of crystals providing an energy resolu-tion of about 0.5 meV was used. Within this bandwidth, a high flux of 3 � 10 � s � was achieved bycollimating the beam in front of the HRM by a compound refractive lens. The sample, a pellet ofabout 0.35 mm thickness, was mounted between thin Be sheets into a copper holder sealed withKapton windows in a closed-cycle cryostat.
The extraction of the one-phonon contribution and the evaluation of the phonon DOS was carriedout using DOS V2.1 [7]. Five spectra were measured, four for OMFA cooled down slowly fromroom temperature and one for OMFA quenched by immersion into liquid nitrogen. The percentageof subtraction of the elastic line was optimized as described in [8].
0 1 2 3 4 5 6 7 8E [meV]
0
0,01
0,02
g(E
)/E
2 [m
eV-3
] 60K60K quenched200K230K240K
Figure 4.9: Reduced partial Fe VDOS of OMFA
Fig. 1 shows the reduced DOS � ��� ��� � � for the slowly cooled (annealed) and the quenched sub-stance for the same temperature (60 K), as well as three temperatures below and slightly above the
52
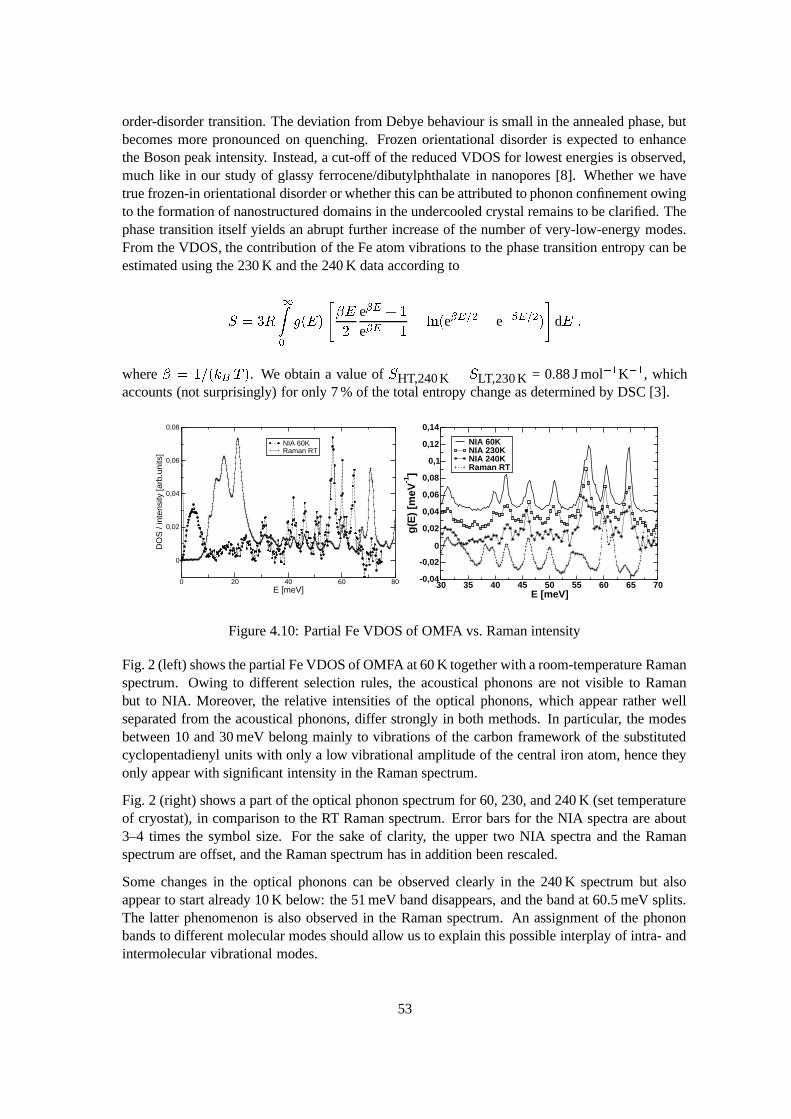
order-disorder transition. The deviation from Debye behaviour is small in the annealed phase, butbecomes more pronounced on quenching. Frozen orientational disorder is expected to enhancethe Boson peak intensity. Instead, a cut-off of the reduced VDOS for lowest energies is observed,much like in our study of glassy ferrocene/dibutylphthalate in nanopores [8]. Whether we havetrue frozen-in orientational disorder or whether this can be attributed to phonon confinement owingto the formation of nanostructured domains in the undercooled crystal remains to be clarified. Thephase transition itself yields an abrupt further increase of the number of very-low-energy modes.From the VDOS, the contribution of the Fe atom vibrations to the phase transition entropy can beestimated using the 230 K and the 240 K data according to
��� � ���� � ��� �
� � �
�e����
e���
�� � e ���� � e ���� � ��� d � �
where � � � ����� � � . We obtain a value of � HT,240 K � LT,230 K = 0.88 J mol � K � , whichaccounts (not surprisingly) for only 7 % of the total entropy change as determined by DSC [3].
0 20 40 60 80E [meV]
0
0,02
0,04
0,06
0,08
DO
S /
inte
nsity
[arb
.uni
ts]
NIA 60KRaman RT
30 35 40 45 50 55 60 65 70E [meV]
-0,04
-0,02
0
0,02
0,04
0,06
0,08
0,1
0,12
0,14
g(E
) [m
eV-1
]
NIA 60KNIA 230KNIA 240KRaman RT
Figure 4.10: Partial Fe VDOS of OMFA vs. Raman intensity
Fig. 2 (left) shows the partial Fe VDOS of OMFA at 60 K together with a room-temperature Ramanspectrum. Owing to different selection rules, the acoustical phonons are not visible to Ramanbut to NIA. Moreover, the relative intensities of the optical phonons, which appear rather wellseparated from the acoustical phonons, differ strongly in both methods. In particular, the modesbetween 10 and 30 meV belong mainly to vibrations of the carbon framework of the substitutedcyclopentadienyl units with only a low vibrational amplitude of the central iron atom, hence theyonly appear with significant intensity in the Raman spectrum.
Fig. 2 (right) shows a part of the optical phonon spectrum for 60, 230, and 240 K (set temperatureof cryostat), in comparison to the RT Raman spectrum. Error bars for the NIA spectra are about3–4 times the symbol size. For the sake of clarity, the upper two NIA spectra and the Ramanspectrum are offset, and the Raman spectrum has in addition been rescaled.
Some changes in the optical phonons can be observed clearly in the 240 K spectrum but alsoappear to start already 10 K below: the 51 meV band disappears, and the band at 60.5 meV splits.The latter phenomenon is also observed in the Raman spectrum. An assignment of the phononbands to different molecular modes should allow us to explain this possible interplay of intra- andintermolecular vibrational modes.
53
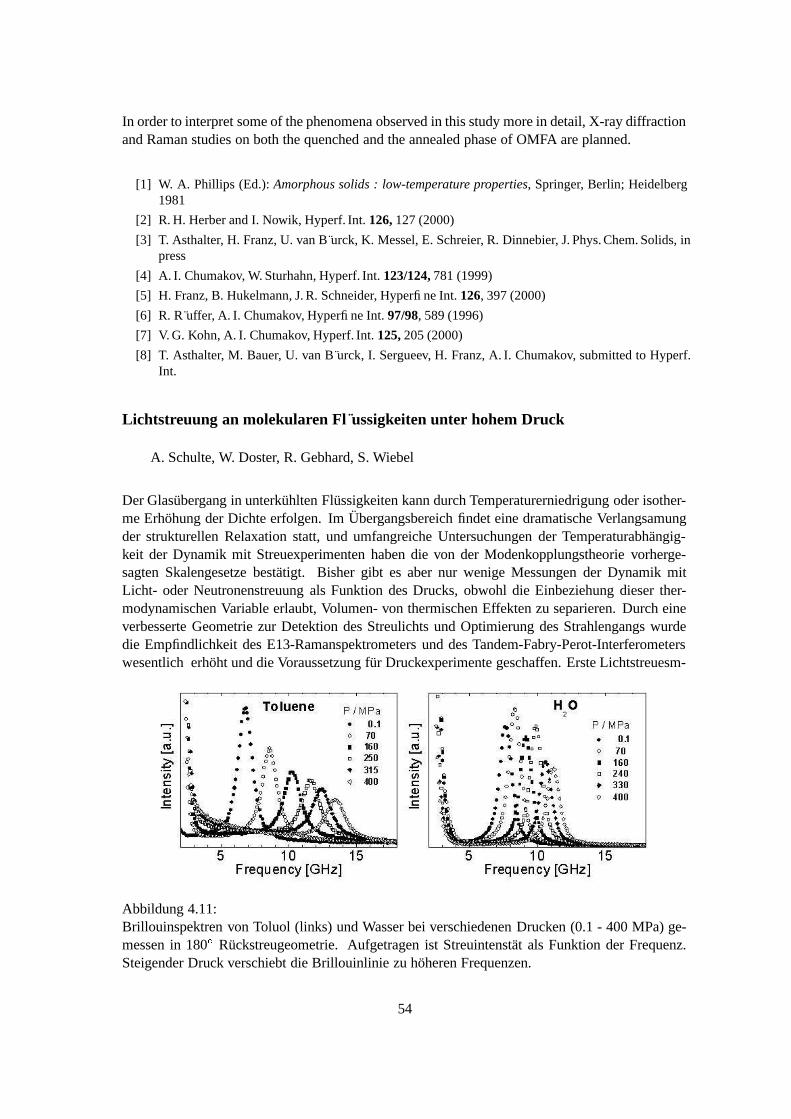
In order to interpret some of the phenomena observed in this study more in detail, X-ray diffractionand Raman studies on both the quenched and the annealed phase of OMFA are planned.
[1] W. A. Phillips (Ed.): Amorphous solids : low-temperature properties, Springer, Berlin; Heidelberg1981
[2] R. H. Herber and I. Nowik, Hyperf. Int. 126, 127 (2000)
[3] T. Asthalter, H. Franz, U. van B urck, K. Messel, E. Schreier, R. Dinnebier, J. Phys. Chem. Solids, inpress
[4] A. I. Chumakov, W. Sturhahn, Hyperf. Int. 123/124, 781 (1999)
[5] H. Franz, B. Hukelmann, J. R. Schneider, Hyperfine Int. 126, 397 (2000)
[6] R. R uffer, A. I. Chumakov, Hyperfine Int. 97/98, 589 (1996)
[7] V. G. Kohn, A. I. Chumakov, Hyperf. Int. 125, 205 (2000)
[8] T. Asthalter, M. Bauer, U. van B urck, I. Sergueev, H. Franz, A. I. Chumakov, submitted to Hyperf.Int.
Lichtstreuung an molekularen Fl ussigkeiten unter hohem Druck
A. Schulte, W. Doster, R. Gebhard, S. Wiebel
Der Glasubergang in unterkuhlten Flussigkeiten kann durch Temperaturerniedrigung oder isother-me Erhohung der Dichte erfolgen. Im Ubergangsbereich findet eine dramatische Verlangsamungder strukturellen Relaxation statt, und umfangreiche Untersuchungen der Temperaturabhangig-keit der Dynamik mit Streuexperimenten haben die von der Modenkopplungstheorie vorherge-sagten Skalengesetze bestatigt. Bisher gibt es aber nur wenige Messungen der Dynamik mitLicht- oder Neutronenstreuung als Funktion des Drucks, obwohl die Einbeziehung dieser ther-modynamischen Variable erlaubt, Volumen- von thermischen Effekten zu separieren. Durch eineverbesserte Geometrie zur Detektion des Streulichts und Optimierung des Strahlengangs wurdedie Empfindlichkeit des E13-Ramanspektrometers und des Tandem-Fabry-Perot-Interferometerswesentlich erhoht und die Voraussetzung fur Druckexperimente geschaffen. Erste Lichtstreuesm-
Abbildung 4.11:Brillouinspektren von Toluol (links) und Wasser bei verschiedenen Drucken (0.1 - 400 MPa) ge-messen in 180
�Ruckstreugeometrie. Aufgetragen ist Streuintenstat als Funktion der Frequenz.
Steigender Druck verschiebt die Brillouinlinie zu hoheren Frequenzen.
54

sungen wurden uber einen Druckbereich von 0.1 bis 400 MPa in einer hydrostatischen Zelle beiRaumtemperatur durchgefuhrt.
Die Anderung des Brillouinspektrums mit dem Druck zeigt die Wechselwirkung longitudinalerSchallwellen mit strukturellen Relaxationsprozessen. Die Brillouinlinie verschiebt sich zu hoher-en Frequenzen und gleichzeitig andert sich die Linienbreite. Eine quantitative Analyse der Li-nienform und Vergleich mit Relaxationsmodellen ist im Gange. Fur druckabhangige Messungender depolarisierten Streuung soll das Fenstermaterial der Hockdruckzelle weiter im Hinblick aufPolarisationseigenschaften optimiert werden.
55
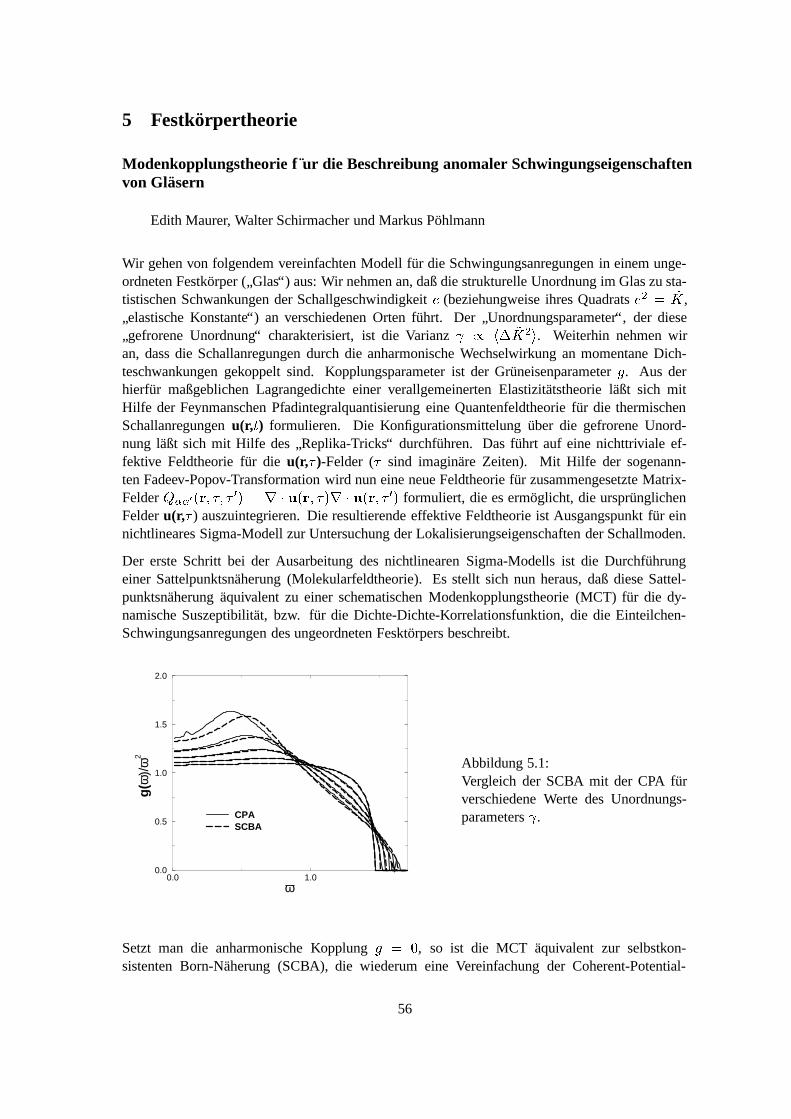
5 Festkorpertheorie
Modenkopplungstheorie f ur die Beschreibung anomaler Schwingungseigenschaftenvon Glasern
Edith Maurer, Walter Schirmacher und Markus Pohlmann
Wir gehen von folgendem vereinfachten Modell fur die Schwingungsanregungen in einem unge-ordneten Festkorper (
”Glas“) aus: Wir nehmen an, daß die strukturelle Unordnung im Glas zu sta-
tistischen Schwankungen der Schallgeschwindigkeit � (beziehungweise ihres Quadrats � � ���� ,
”elastische Konstante“) an verschiedenen Orten fuhrt. Der
”Unordnungsparameter“, der diese
”gefrorene Unordnung“ charakterisiert, ist die Varianz � � ������ � � . Weiterhin nehmen wir
an, dass die Schallanregungen durch die anharmonische Wechselwirkung an momentane Dich-teschwankungen gekoppelt sind. Kopplungsparameter ist der Gruneisenparameter � . Aus derhierfur maßgeblichen Lagrangedichte einer verallgemeinerten Elastizitatstheorie laßt sich mitHilfe der Feynmanschen Pfadintegralquantisierung eine Quantenfeldtheorie fur die thermischenSchallanregungen u(r,
) formulieren. Die Konfigurationsmittelung uber die gefrorene Unord-
nung laßt sich mit Hilfe des”Replika-Tricks“ durchfuhren. Das fuhrt auf eine nichttriviale ef-
fektive Feldtheorie fur die u(r,�
)-Felder (�
sind imaginare Zeiten). Mit Hilfe der sogenann-ten Fadeev-Popov-Transformation wird nun eine neue Feldtheorie fur zusammengesetzte Matrix-Felder ����� � � � � � � % � ��� �� � ��� � � � �� � � � � % � formuliert, die es ermoglicht, die ursprunglichenFelder u(r,
�) auszuintegrieren. Die resultierende effektive Feldtheorie ist Ausgangspunkt fur ein
nichtlineares Sigma-Modell zur Untersuchung der Lokalisierungseigenschaften der Schallmoden.
Der erste Schritt bei der Ausarbeitung des nichtlinearen Sigma-Modells ist die Durchfuhrungeiner Sattelpunktsnaherung (Molekularfeldtheorie). Es stellt sich nun heraus, daß diese Sattel-punktsnaherung aquivalent zu einer schematischen Modenkopplungstheorie (MCT) fur die dy-namische Suszeptibilitat, bzw. fur die Dichte-Dichte-Korrelationsfunktion, die die Einteilchen-Schwingungsanregungen des ungeordneten Fesktorpers beschreibt.
0.0 1.0ω
0.0
0.5
1.0
1.5
2.0
g(ω
)/ω
2
CPASCBA
Abbildung 5.1:Vergleich der SCBA mit der CPA furverschiedene Werte des Unordnungs-parameters � .
Setzt man die anharmonische Kopplung � � � , so ist die MCT aquivalent zur selbstkon-sistenten Born-Naherung (SCBA), die wiederum eine Vereinfachung der Coherent-Potential-
56
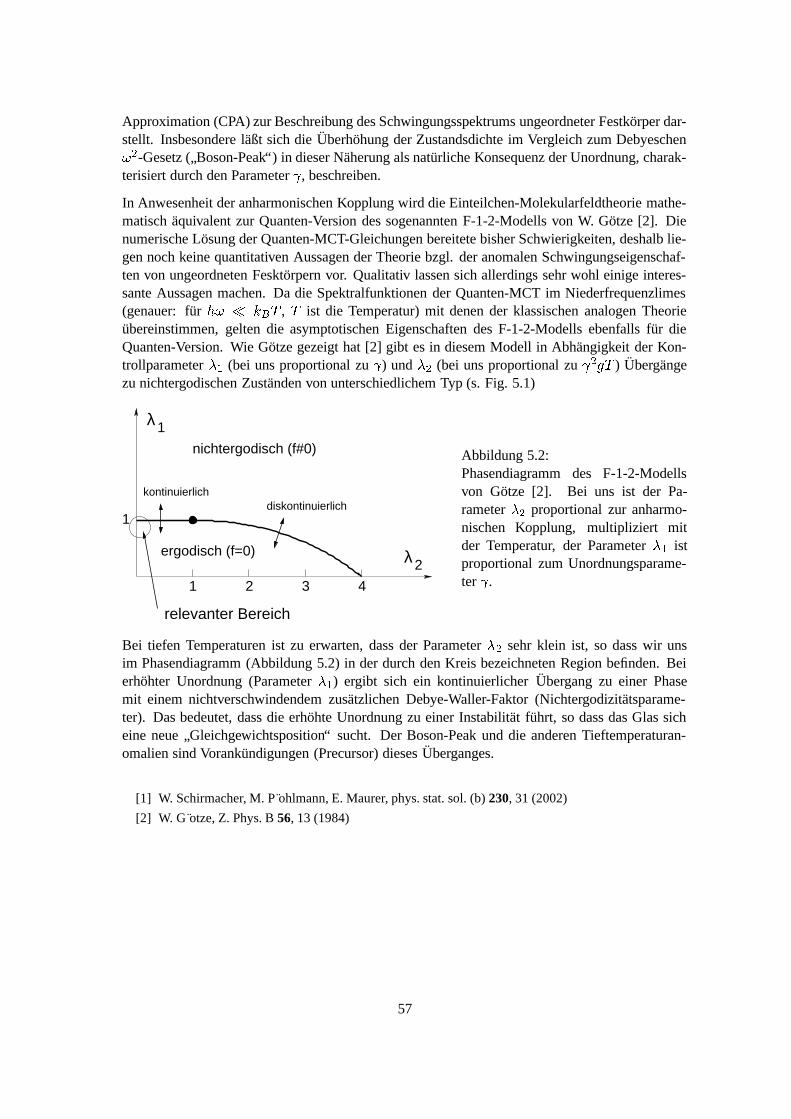
Approximation (CPA) zur Beschreibung des Schwingungsspektrums ungeordneter Festkorper dar-stellt. Insbesondere laßt sich die Uberhohung der Zustandsdichte im Vergleich zum Debyeschen� � -Gesetz (
”Boson-Peak“) in dieser Naherung als naturliche Konsequenz der Unordnung, charak-
terisiert durch den Parameter � , beschreiben.
In Anwesenheit der anharmonischen Kopplung wird die Einteilchen-Molekularfeldtheorie mathe-matisch aquivalent zur Quanten-Version des sogenannten F-1-2-Modells von W. Gotze [2]. Dienumerische Losung der Quanten-MCT-Gleichungen bereitete bisher Schwierigkeiten, deshalb lie-gen noch keine quantitativen Aussagen der Theorie bzgl. der anomalen Schwingungseigenschaf-ten von ungeordneten Fesktorpern vor. Qualitativ lassen sich allerdings sehr wohl einige interes-sante Aussagen machen. Da die Spektralfunktionen der Quanten-MCT im Niederfrequenzlimes(genauer: fur �� ��� � � � ,
�ist die Temperatur) mit denen der klassischen analogen Theorie
ubereinstimmen, gelten die asymptotischen Eigenschaften des F-1-2-Modells ebenfalls fur dieQuanten-Version. Wie Gotze gezeigt hat [2] gibt es in diesem Modell in Abhangigkeit der Kon-trollparameter � � (bei uns proportional zu � ) und � � (bei uns proportional zu �
�� � ) Ubergange
zu nichtergodischen Zustanden von unterschiedlichem Typ (s. Fig. 5.1)
����������������������
λ
λ2
1
1
1 2 3 4
kontinuierlichdiskontinuierlich
ergodisch (f=0)
nichtergodisch (f#0)
relevanter Bereich
Abbildung 5.2:Phasendiagramm des F-1-2-Modellsvon Gotze [2]. Bei uns ist der Pa-rameter � � proportional zur anharmo-nischen Kopplung, multipliziert mitder Temperatur, der Parameter � � istproportional zum Unordnungsparame-ter � .
Bei tiefen Temperaturen ist zu erwarten, dass der Parameter � � sehr klein ist, so dass wir unsim Phasendiagramm (Abbildung 5.2) in der durch den Kreis bezeichneten Region befinden. Beierhohter Unordnung (Parameter � � ) ergibt sich ein kontinuierlicher Ubergang zu einer Phasemit einem nichtverschwindendem zusatzlichen Debye-Waller-Faktor (Nichtergodizitatsparame-ter). Das bedeutet, dass die erhohte Unordnung zu einer Instabilitat fuhrt, so dass das Glas sicheine neue
”Gleichgewichtsposition“ sucht. Der Boson-Peak und die anderen Tieftemperaturan-
omalien sind Vorankundigungen (Precursor) dieses Uberganges.
[1] W. Schirmacher, M. P ohlmann, E. Maurer, phys. stat. sol. (b) 230, 31 (2002)
[2] W. G otze, Z. Phys. B 56, 13 (1984)
57

Bruchkontakt-Tunnelspektroskopie an dotierten Halbleitern
Olaf Bleibaum�-�
, Barbara Sandow�, Walter Schirmacher
�Phys. Dept. Univ. of Oregon, Eugene, OR, USA�Fachbereich Physik, Univ. Magdeburg�Fachbereich Physik, Freie Univ. Berlin
Tunnelspektroskopie ist eine der viel verwendeten Methoden, um die elektronische Zustandsdich-te von Festkorpern auszumessen. Typischerweise wird der Strom zwischen zwei gut leitendenMaterialen (meist Metallen) gemessen, die durch eine isolierende Schicht voneinander getrenntsind. Der resultierende Tunnelstrom ��� � (bei angelegter Spannung � ) ist eine Faltung der Zu-standsdichten der Kontaktmaterialien. Ist die Zustandsdichte des einen Materials bekannt, kanndie des anderen ausgemessen werden. Insbesondere zeigt sich, dass in vielen Fallen die differen-tielle Leitfahigkeit d � d � proportional zu
� ��� � � � � ist, wobei� ��� �
die Zustandsdichte des
Abbildung 5.3:Differentielle Leitfahig-keit eines neutronen-transmutationsdotiertenGermanium-Bruchkontaktesin Abhangigkeit von derSpannung � und der Tempe-ratur
�
zu untersuchenden Materials ist. An der TH Darmstadt und der FU Berlin wurde eine spektrosko-pische Methode entwickelt, um die Zustandsdichte von dotierten Halbleitern auszumessen. Hierwird die Probe auf mechanisch kontrollierte Weise zerbrochen und der Tunnelstrom quer zumBruchkontakt gemessen [1].
Dotierte Halbleiter bei tiefen Temperaturen sind deswegen besonders interessant, weil schon seitlanger Zeit vorhergesagt wird, dass die Zustandsdichte (hier die Dichte der lokalisierten elektro-nischen Zustande) aufgrund der Coulomb-Wechselwirkung zwischen den Elektronen eine para-belformige
”Lucke“ von der Form � � ��� � � (mit �
�� ) in der Nahe des Ferminiveaus ���
aufweisen sollte (”Coulomb-Gap“). Eine solche Anomalie wurde mit Hilfe der Bruchkontakt-
Methode tatsachlich in dotiertem Germanium (Neutronentransmutationsmethode) bei tiefen Tem-peraturen gefunden (Fig. 1, [2]). Neuartig und unerwartet war, dass der Coulomb-Gap sich mitsteigender Temperatur offenbar durch thermische Elektron-Loch-Anregungen auffullt [2]. Die
58

”naive“ Auswertung und Interpretation mit Hilfe der fur Metalle entwickelten theoretischen Aus-
drucke wurde allerdings kritisiert [3] mit dem Hinweis darauf, dass der Transportmechanismuszwischen lokalisierten Zustanden (
”Hopping-Transport“) wesentlich komplizierter als der in Me-
tallen ist und daher auch die Tunnelmessungen anders ausgewertet werden mussten (s. auch dieAntwort [4]). Die Hauptfrage ist, ob der Spannungsabfall, der die Kennlinie produziert, nur amBruchkontakt oder auch schon im Volumen der Kontakte stattfindet.
Wir haben daraufhin eine neue, auf den Fall des Hopping-Transports in dotierten Halbleitern zu-geschnittene Theorie der Tunnelspektroskopie in Bruchkontakten entwickelt. Wichtigstes Ergeb-nis ist, dass man zwar im allgemeinen annehmen muss, dass die Tunnelubergange zwischen denKontakten unter Emission eines Phonons stattfinden. Das modifiziert den Ausdruck fur den Tun-nelstrom so, dass dem
”Absorptionsvermogen“ des Phononenbades Rechnung getragen wird. Hat
diese Spektralfunktion allerdings ein Maximum bei tiefen Frequenzen, ergibt sich die”quasiela-
stische“ Formel, die auch fur Metalle verwendet wird (e ist die Elemetarladung):
��� � ���� ��������� d � � ��� � � ��� � � � � (5.1)
und aus der sich die Daten in Fig. 5.3 als Zustandsdichte interpretieren lassen
[1] B. Sandow, K. Gloos, R. Rentzsch, A. N. Ionov, Physica 284, 1852 (2000)
[2] B. Sandow, K. Gloos, R. Rentzsch, A. N. Ionov and W. Schirmacher, Phys. Rev. Lett. 86, 1845 (2001)
[3] V. Kozub, Phys. Rev. Lett. 89, 229701 (2002)
[4] B. Sandow, K. Gloos, R. Rentzsch, A. N. Ionov and W. Schirmacher, Phys. Rev. Lett. 89, 229702(2002)
59

6 Dynamik von Biomolekulen
Assoziation von Myoglobin unter Druck
R. Gebhardt, W. Doster
Aggregationsprozesse von Proteinen sind von wachsendem wissenschaftlichen und gesellschaftli-chen Interesse, aufgrund ihrer Bedeutung bei einer Vielzahl von Krankheiten wie z.B. BSE (Bo-vine Spongiforme Encephalopathie) und der Alzheimer-Krankheit. Dabei nehmen Proteine eineunkorrekt gefaltete oder ungeordnete Struktur an und verklumpen schliesslich zu sogenanntenPlaques. Um derartige Prozesse verstehen zu konnen, werden die kritischen Bedingungen er-forscht, die eine Aggregation bei Proteinen auslosen. Diese werden durch Temperatur, Druck undchemisches Potential der Komponenten im Phasenraum bestimmt. Die Fahigkeit zur Assoziationmacht Myoglobin zu einem geeigneten Modellsystem, welches wir mit Hilfe der dynamischenLichtstreuung unter Druck untersuchen. Unter speziellen Salz- und pH-Bedingungen [1] konn-te das Auftreten von fibrillaren Myoglobinaggregaten beobachtet werden. Außerdem wurde dieBildung von Myoglobinaggregaten bei Normaldruck nach einer vorherigen Druckbehandlung be-schrieben [2]. Wir konnten zeigen, dass Myoglobin bereits unter Druck assoziiert und Aggregatevon einigen ?m ausbildet [3]. Wir haben weiterfuhrend die kritischen Bedingungen fur die As-soziation von Myoglobin im p-T-Phasenraum und in Abhangigkeit von der Protonen- und Salz-konzentration untersucht. Dabei konnte gezeigt werden, dass die Keimbildung der Assoziationreversibel und bei geringen Drucken weit unterhalb der fur die Proteindenaturierung benotigtenDrucke erfolgt.
Abbildung 6.1: Phasendiagramm der Myoglobin-Assoziation N-nativ, D-denaturiert
Das Phasendiagramm zeigt ahnlich der Proteindenaturierung eine elliptische Form. Unterhalbeines pH-Wertes von 5.4 wird die Assoziation aufgrund einer durch saure Denaturierung beding-ten Konformationsumwandlung unterbunden. Der kritische Druck fur die Myoglobin-Assoziationnimmt mit steigendem pH-Wert zu und liegt bei einer Proteinkonzentration von 1 mg/ml, einempH-Wert von 6.0 und 20
�C bei 1 kbar. Die Reversibilitat der Assoziation wurde mit Hilfe von
Druckzyklen getestet. In der Anfangsphase zerfallen die Assoziate nach Druckverminderung wie-der. Mit ansteigender Assoziatgrosse wird aber die Reversibilitat zunehmend eingeschrankt, wasauf einen Konformationsubergang mit der Ausbildung von intramolekularen ß-sheet-Strukturen
60

zuruckzufuhren ist, wie FT-IR-Messungen zeigen. Unsere weiter Forschung wird sich mit derKlarung des zugrundeliegenden Reaktionsmechanismus und der Auswertung von Assoziationski-netiken befassen.
1 M. F andrich, M.A. Fletcher and C.M. Dobson (2002): Amyloid Fibrils From Muscle Myoglobin.,Nature 410, 165-166 (2001).
2 L. Smeller, P. Rubens, K. Heremans (1999): Pressure Effect on the Temperature-Induced Unfoldingand Tendency To Aggregate of Myoglobin, Biochemistry 38, 3816-3820
3 R. Gebhardt et al. (2003): Critical Association of Myoglobin, High Pressure Research in Bioscienceand Biotechnology, Ed. R. Winter, Springer Verlag (2003) in press
Casein-Mizellen unter Hochdruck
R. Gebhardt, W. Doster, B. Rademacher�, U. Kulozik
�
� Lehrstuhl f ur Lebensmittelverfahrenstechnik und Molkereitechnologie Weihenste-phan, TU M unchen
Im Rahmen des Hochdruckprojektes wird in Zusammenarbeit mit dem Institut fur Lebensmit-telverfahrenstechnik und Molkereitechnologie der Einfluss von Hochdruck auf die Große vonCaseinmizellen untersucht, wobei die Herausforderung in der Messung der Lichtstreuung vontruben Proben liegt. Um das Problem der Vielfachstreuung zu minimieren, messen wir in 177
�-Ruckstreuung mit einem speziellen Ruckstreudetektor nahe an der Probenzelloberflache. Casein-mizellen bilden einen Hauptbestandteil der Milch und sind in der Lage große Mengen des anson-sten schlecht loslichen CaPO4 zu speichern. Die isolierten Proteinmizellen wurden mit Hilfe derdynamischen Lichtstreuung druck- und temperaturabhangig untersucht.
Abbildung 6.2:Caseinmizelle unter Druck im p-T-Diagramm. Die Phasengrenze trennt den strukturell intaktenvom strukturell zerfallenen Zustand der Proteinmizelle.
Im Druckbereich zwischen 2-3 kbar wurde ein Ubergang festgestellt, bei dem die Casein-Mizellestrukturell zerfallt. Abbildung 6.2 zeigt die Abhangigkeit des Ubergangsdrucks bei verschiede-nen Temperaturen. In zukunftigen Messungen soll die Abhangigkeit dieser Stabilitatsgrenze vonweiteren relevanten Parametern wie z.B. der Protonenkonzentration untersucht werden.
61
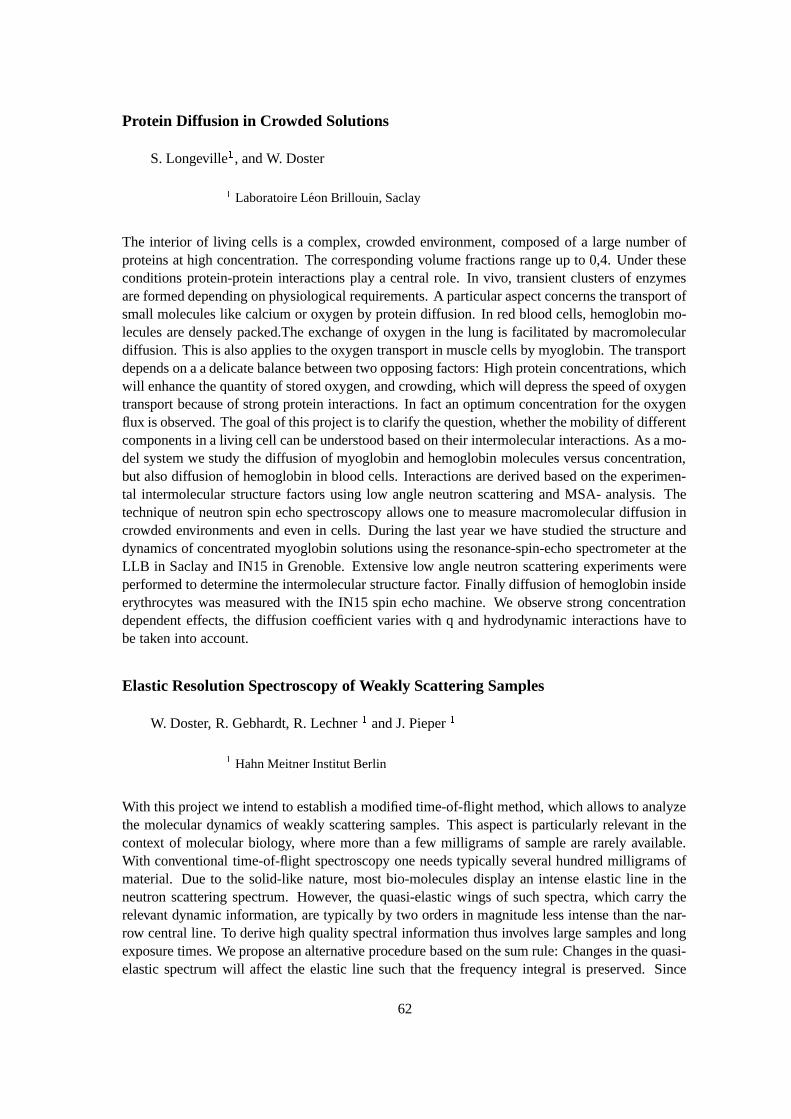
Protein Diffusion in Crowded Solutions
S. Longeville�, and W. Doster
�Laboratoire Leon Brillouin, Saclay
The interior of living cells is a complex, crowded environment, composed of a large number ofproteins at high concentration. The corresponding volume fractions range up to 0,4. Under theseconditions protein-protein interactions play a central role. In vivo, transient clusters of enzymesare formed depending on physiological requirements. A particular aspect concerns the transport ofsmall molecules like calcium or oxygen by protein diffusion. In red blood cells, hemoglobin mo-lecules are densely packed.The exchange of oxygen in the lung is facilitated by macromoleculardiffusion. This is also applies to the oxygen transport in muscle cells by myoglobin. The transportdepends on a a delicate balance between two opposing factors: High protein concentrations, whichwill enhance the quantity of stored oxygen, and crowding, which will depress the speed of oxygentransport because of strong protein interactions. In fact an optimum concentration for the oxygenflux is observed. The goal of this project is to clarify the question, whether the mobility of differentcomponents in a living cell can be understood based on their intermolecular interactions. As a mo-del system we study the diffusion of myoglobin and hemoglobin molecules versus concentration,but also diffusion of hemoglobin in blood cells. Interactions are derived based on the experimen-tal intermolecular structure factors using low angle neutron scattering and MSA- analysis. Thetechnique of neutron spin echo spectroscopy allows one to measure macromolecular diffusion incrowded environments and even in cells. During the last year we have studied the structure anddynamics of concentrated myoglobin solutions using the resonance-spin-echo spectrometer at theLLB in Saclay and IN15 in Grenoble. Extensive low angle neutron scattering experiments wereperformed to determine the intermolecular structure factor. Finally diffusion of hemoglobin insideerythrocytes was measured with the IN15 spin echo machine. We observe strong concentrationdependent effects, the diffusion coefficient varies with q and hydrodynamic interactions have tobe taken into account.
Elastic Resolution Spectroscopy of Weakly Scattering Samples
W. Doster, R. Gebhardt, R. Lechner�
and J. Pieper�
�Hahn Meitner Institut Berlin
With this project we intend to establish a modified time-of-flight method, which allows to analyzethe molecular dynamics of weakly scattering samples. This aspect is particularly relevant in thecontext of molecular biology, where more than a few milligrams of sample are rarely available.With conventional time-of-flight spectroscopy one needs typically several hundred milligrams ofmaterial. Due to the solid-like nature, most bio-molecules display an intense elastic line in theneutron scattering spectrum. However, the quasi-elastic wings of such spectra, which carry therelevant dynamic information, are typically by two orders in magnitude less intense than the nar-row central line. To derive high quality spectral information thus involves large samples and longexposure times. We propose an alternative procedure based on the sum rule: Changes in the quasi-elastic spectrum will affect the elastic line such that the frequency integral is preserved. Since
62
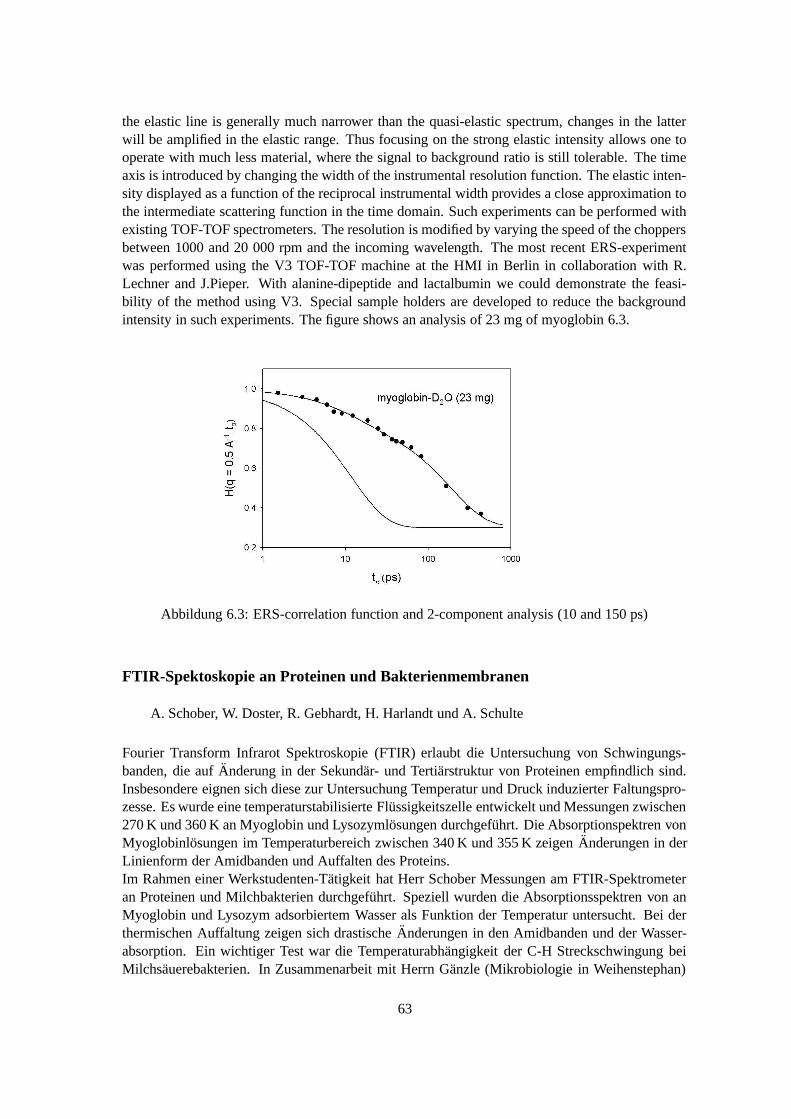
the elastic line is generally much narrower than the quasi-elastic spectrum, changes in the latterwill be amplified in the elastic range. Thus focusing on the strong elastic intensity allows one tooperate with much less material, where the signal to background ratio is still tolerable. The timeaxis is introduced by changing the width of the instrumental resolution function. The elastic inten-sity displayed as a function of the reciprocal instrumental width provides a close approximation tothe intermediate scattering function in the time domain. Such experiments can be performed withexisting TOF-TOF spectrometers. The resolution is modified by varying the speed of the choppersbetween 1000 and 20 000 rpm and the incoming wavelength. The most recent ERS-experimentwas performed using the V3 TOF-TOF machine at the HMI in Berlin in collaboration with R.Lechner and J.Pieper. With alanine-dipeptide and lactalbumin we could demonstrate the feasi-bility of the method using V3. Special sample holders are developed to reduce the backgroundintensity in such experiments. The figure shows an analysis of 23 mg of myoglobin 6.3.
Abbildung 6.3: ERS-correlation function and 2-component analysis (10 and 150 ps)
FTIR-Spektoskopie an Proteinen und Bakterienmembranen
A. Schober, W. Doster, R. Gebhardt, H. Harlandt und A. Schulte
Fourier Transform Infrarot Spektroskopie (FTIR) erlaubt die Untersuchung von Schwingungs-banden, die auf Anderung in der Sekundar- und Tertiarstruktur von Proteinen empfindlich sind.Insbesondere eignen sich diese zur Untersuchung Temperatur und Druck induzierter Faltungspro-zesse. Es wurde eine temperaturstabilisierte Flussigkeitszelle entwickelt und Messungen zwischen270 K und 360 K an Myoglobin und Lysozymlosungen durchgefuhrt. Die Absorptionspektren vonMyoglobinlosungen im Temperaturbereich zwischen 340 K und 355 K zeigen Anderungen in derLinienform der Amidbanden und Auffalten des Proteins.Im Rahmen einer Werkstudenten-Tatigkeit hat Herr Schober Messungen am FTIR-Spektrometeran Proteinen und Milchbakterien durchgefuhrt. Speziell wurden die Absorptionsspektren von anMyoglobin und Lysozym adsorbiertem Wasser als Funktion der Temperatur untersucht. Bei derthermischen Auffaltung zeigen sich drastische Anderungen in den Amidbanden und der Wasser-absorption. Ein wichtiger Test war die Temperaturabhangigkeit der C-H Streckschwingung beiMilchsauerebakterien. In Zusammenarbeit mit Herrn Ganzle (Mikrobiologie in Weihenstephan)
63
wurde die Stabilisierung der Bakterienmembran durch Saccharose nachgewiesen. Die Membranenzeigen einen Phasenubergang bei etwa 20
�C von einer festen zu einer flussig-kristallinen Phase,
die sich uber eine Verschiebung der C-H Streckschwingung beobachten lasst. Durch die Saccha-rose wird die Ubergangstemperatur leicht verschoben (untere Kurve in Abbildung 6.4).
Abbildung 6.4:C-H Streckschwingung der Membran von Milchsauere Bakterien als Funktion der Temperatur mitund ohne Saccharose
64
7 Lehrveranstaltungen
Vorlesungen und Praktika
Sommersemester 2002
Priv. Doz. Dr. W. Doster, Proseminar Physikalische Grundlagen der Biotechnologie
Dr. A. Meyer, Festkorperphysik mit Neutronen II
Dr. P. Muller-Buschbaum, Polymerphysik II
Priv. Doz. Dr. W. Schirmacher, Proseminar Dynamische Systeme und Chaos
Prof. Dr. A. Schulte, Experimentalphysik II fur Vermessungsingenieure und Geologen
Wintersemester 2002/2003
Priv. Doz. Dr. W. Doster, Dynamik der Warme
Dr. A. Meyer, Festkorperphysik mit Neutronen I
Dr. habil. P. Muller-Buschbaum, Polymerphysik I
Prof. Dr. R. Rohlsberger, Experimentalphysik I fur Vermessungsingenieure und Geologen
Priv. Doz. Dr. W. Schirmacher, Computer Physik
Priv. Doz. Dr. W. Schirmacher, Mathematische Erganzungen zur Experimentalphysik I
Betreute Praktikumsversuche
Degree of dissociation and the freezing point depression (DIS)Anfangerpraktikum
Dynamische Lichtstreuung an LatexkugelnFortgeschrittenenpraktikum
Thermische AnalyseFortgeschrittenenpraktikum
ViskositatAnfangerpraktikum
65

Fortbildungsveranstaltung f ur Gymnasiallehrer
EDGAR–LUSCHER–PHYSIKSEMINAR 2002
Klima, Energieversorgung der Zukunft und Probleme der Kernenergie
Freitag, 12. April bis Sonntag, 14. April 2002Gymnasium Zwiesel
Veranstalter: Der Ministerialbeauftragte fur die Gymnasien in Niederbayern, G. Rauprich
Wissenschaftliche Leitung: Prof. Dr. K. Heinloth, Univ. Bonn undPriv. Doz. Dr. W. Schirmacher, Technische Universitat Munchen
Organisation am Ort: Gymnasium Zwiesel (OStD H. Kratzer, OStR G. Haller)
PROGRAMM
Freitag, 12. 4. 200216.15 – 16.30 PD Dr. W. Schirmacher, TU Munchen
Begrußung, Organisatorisches16.30 – 17.30 Prof. Dr. K. Heinloth, Univ. Bonn
Einfuhrung17.30 – 18.00 Pause
16.30 – 17.30 Prof. Dr. K. Heinloth, Univ. BonnKlimavertraglichkeit von Arten der Energiegewinnung
Samstag, 13. 4. 20029.00 – 10.30 Prof. Dr. W. Seiler, Inst. f. Meteorologie, Garmisch
Simulation von Klimaanderungen11.00 – 12.30 Prof. Dr. W. Petry, TU Munchen
Der Hochtemperatur-Kernreaktor: Eine Chance fur die Zukunft15.00 – 16.30 Prof. Dr.-Ing. D. Hein, TU Munchen
Emissionsfreie Energieversolgung mit biogenen und fossilen Brennstoffen17.00 – 18.30 Dr. M. Eikerling, TU Munchen]
BrennstoffzellenSonntag, 14. 4. 2002
9.00 – 10.30 Prof. Dr.-Ing. H. J. Wagner, Ruhr-Univ. BochumWindenergie
11.00 – 12.30 Dr. Ch. Nebel, TU MunchenSonnenenergie
66
8 Allgemeine Zusammenstellungen
Diplomarbeiten, Dissertationen, Habilitationschriften, Auszeichnungen
Diplomarbeiten
Edith, MaurerFeldtheoretische Behandlung von Schwingungen in ungeordneten FestkorpernMai 2002
Florian KarglStruktur und Dynamik von Natrium-Silikat-Schmelzen untersucht mit inelastischer Neutro-nenstreuungJuli 2002
Dissertationen
Ingo KoperInfluence of trehalose on the dynamics of the S-phyco-cyanin Protein; a quasielasticneutron scattering studyJuli 2002
Habilitationschriften
Peter Muller-BuschbaumNanostrukturierte PolymerfilmeJuni 2002
Andreas MeyerAtomarer Transport in mehrkomponentigen, zahen SchmelzenNovember 2002
Auszeichnungen
A. MeyerForschungsstipendium zur Untersuchung des Einfluss von Wasser auf atomare Dynamikund Struktur von Silikatschmelzen und Glasern verliehen vom Bund der Freunde der Tech-nischen Universitat Munchen e.V., Juni 2002
R. RohlsbergerInnovationspreis Synchrotronstrahlung 2002, verliehen vom Verein der Freunde und Forde-rer des BESSY, Berlin, Dezember 2002
67
Drittmittelforderung
Deutsche Forschungsgemeinschaft
Im Rahmen des Schwerpunktprogrammes: “Phasenumwandlungen in mehrkomponentigenSchmelzen”Untersuchung des Einflusses der atomaren Dynamik auf Materietransport, Segregation undErstarrung mehrkomponentiger SchmelzenForderkennzeichen: Me 1958/2-1
Im Rahmen einer Forschergruppe: ”Einfluss von Hochdruck auf molekulare und zellulareSysteme in Lebensmitteln”Forderkennzeichen: FOR358/2-2, Teilprojekt A1
Im Rahmen des Normalverfahrens:Dynamik von einfachen und zahen Flussigkeiten untersucht mit dynamischer Lichtstreuungund inelastischer NeutronenstreuungForderkennzeichen: Me 1958/3-1
Im Rahmen des Normalverfahrens:Warmeleitfahigkeit von GlasernForderkennzeichen Schi308/6-1
Bundesministerium f ur Bildung und Forschung
Weiterentwicklung der Infrastruktur der ESRF-Messplatze fur KernresonanzstreuungForderkennzeichen 05KS1WOC/2
Kollektive Dynamik von Proteinen und ProteinkomplexenForderkennzeichen 03DOE2M/1
Die Morphologie einer neuen Klasse von Verbundmaterialien: Dunne Copolymerfilme miteingebauten magnetischen NanopartikelnForderkennzeichen 03DUOTU1/4
Multiskalige PolymermischungsfilmeForderkennzeichen 03MBE3M1
Abhangigkeit des Haftvermogens dunner Polymerfilme von der OberflachenmorphologieForderkennzeichen 03CO333
Bau eines thermischen Dreiachsenspektrometers am FRM-IIForderkennzeichen 03EC5SRM/1
68
Veroffentlichungen
K. Achterhold, C. Keppler, A. Ostermann, U. van Burck, W. Sturhahn, E. E. Alp, F. G. ParakVibrational dynamics of myoglobin determined by the phonon-assisted Mossbauer effect.Phys. Rev. E 65, 051916 (2002).
T. Asthalter, H. Franz, U. van Burck, K. Messel, E. Schreier, R. DinnebierStructure and dynamics of octamethyl-ethinyl-ferrocene: an organometallic rotator phase.J. Phys. Chem. Solids (im Druck)
T. Asthalter, M. Bauer, U. van Burck, I. Sergueev, H. Franz, A.I. ChumakovPhonons in confinement and the Boson Peak using nuclear inelastic absorption.(zur Veroffentlichung eingereicht)
O. Bleibaum, B. Sandow, W. SchirmacherBreak-Junction Tunneling Spectroscopy for Doped Semiconductors in the Hopping RegimePhys. Rev. B, (eingereicht)
A. Brodin, M. Frank, S. Wiebel, G. Shen, J. Wuttke, H.Z. Cummins, Brillouin ScatteringStudy of Propylene Carbonate: An Evaluation of Phenomenological and Mode CouplingAnalysisPhys. Rev. E 65, 051503 (2002)
U. van Burck, W. Potzel, P. Schindelmann, G. V. Smirnov, S. L. Popov, E. Gerdau, Yu. V. Sh-vyd’ko, H. D. Ruter, O. LeupoldInversion of target sequence in nuclear forward scattering of synchrotron radiation.Hyperfine Interactions 141/142, 151 (2002).
Z. Chowdhuri, R. M. Dimeo, P. M. Gehring, D. A. Neuman, A. Meyer, J. M. RoweThe Backscattering Spectrometer at the NIST Center for Neutron ResearchApplied Physics A. Material Science and Processing (im Druck)
W. Doster, M. Diehl, H. Schober, W. Petry, J. WiedersichEffect of pressure and pressure denaturation on fast molecular motions of solvated myoglo-bin.Trends in High Pressure Bioscience and Biotechnology, Ed. R. HayashiElsevier Science, 107-110 (2002).
W. Doster, R. Gebhardt, A. SoperPressure-induced unfolding of myoglobin: neutron diffraction and dynamic scattering ex-perimentsHigh Pressure Bioscience and Biotechnology, Springer Verlag 2002 (im Druck).
W. DosterTOF-Elastic Resolution Spectroscopy: Dynamic Analysis of Weakly Scattering SamplesChemical Physics 2002, QENS Special Edition, (eingereicht)
H. Franz, T. Asthalter, M. Dommach, A. Ehnes, K. Messel, I. SergueevInvestigations of solid state dynamics at the NRSSR beamline at PETRA II. An overview.Hyperfine Interactions 141/142, 131 (2002).
69
R. Gebhardt, W. Doster, J. Friedrich, W. PetryCritical association of myoglobin under pressureHigh Pressure Bioscience and Biotechnology, Springer Verlag 2002 (im Druck)
J. S. Gutmann, P. Muller-Buschbaum, M. StammFilm thickness dependence of structure formation in ultra-thin polymer blend filmsApplied Phys A 74, S463 (2002)
I. Koper, M.-C. Bellissent-Funel, W. PetryHindered protein dynamics in the presence of a cryoprotecting agentApplied Physics A. Material Science and Processing (im Druck)
C. Lorenz-Haas, P. Muller-Buschbaum, J. Kraus, D. G. Bucknall, M. StammNucleated dewetting of thin polymer filmsApplied Phys A 74, S383 (2002)
A. Meyer, H. Schober, D. B. DingwellStructure, Structural Relaxation and Ion Diffusion in Sodium Disilicate MeltsEurophys. Lett. 59, 708 (2002).
A. MeyerAtomic Transport in Dense, Multicomponent Metallic LiquidsPhys. Rev. B 66, 134205 (2002)
A. Meyer, H. Schober, D. B. DingwellSodium Silicate Melts: Structure, Relaxation and Ion DiffusionScientific Highlights, Institut Laue–Langevin, 56 (2002)
A. Meyer, R. M. Dimeo, P. M. Gehring, D. A. NeumanThe Backscattering Spectrometer at the NIST Center for Neutron ResearchRev. Sci. Instr. (im Druck)
A. MeyerFlussig–Glas–Ubergang in “Effekte der Physik und ihre Anwendungen”, M. von Ardenne,G. Musiol, S. Reball (Hrg.), Harri Deutsch, Frankfurt am Main, 3. Auflage (im Druck)
A. Meyer, W. Petry, M. Koza, M.-P. MachtFast Diffusion in ZrTiNiCuBe Melts(zur Veroffentlichung eingereicht)
P. Muller-Buschbaum, J. S. Gutmann, C. Lorenz-Haas, O. Wunnicke, M. Stamm, W. PetryDewetting of thin diblock copolymer filmsMacromolecules 35, 2017 (2002)
P. Muller-Buschbaum, R. Cubitt, W. PetryPhase separation of weakly incompatible polymer blends confined into isolated dropletsApplied Phys A 74, S342 (2002)
P. Muller-Buschbaum, W. Petry, O. Wunnicke, M. Stamm, R.CubittStabilisation of thin polymer filmsILL Annual Report: 72 (2002)
70
P. Muller-BuschbaumSoft condensed matter investigated with synchrotron radiation: Status and perspectivesin “Application of Synchrotron Radiation in Chemistry”, ISBN 3-924330-53-0 (2002).
W. PetryFRM-II, ein einzigartiges Mikroskop fur Naturwissenschaften, Technik und MedizinTUM Mitteilungen 2 (2001/2002).
W. PetryNeutronen bringen Licht ins Dunkel in “... und er wurfelt doch! Von der Erforschung desganz Grossen, des ganz Kleinen und der ganz vielen DingeHrg.: H. Muller-Krumbhaar und H.-F. Wagner, Wiley-VcH, Weinheim, Seite 482 – 493(2002).
S. Roth, A. Zirkel, J. Bossy, J. Neuhaus, J. Peters, H. Schober, W. PetryMeasurement and Simulation of the Inelastic Resolution Function of a Time-of-Flight Spec-trometerApplied Physics A. Material Science and Processing (im Druck)
B. Sandow, K. Gloos, R. Rentzsch, A. N. Ionov, W. SchirmacherSandow et al. replyPhys. Rev. Lett. 89, 229702 (2002).
P. Schindelmann, U. van Burck, W. Potzel, G. V. Smirnov, S. L. Popov, E. Gerdau, Yu. V. Sh-vyd’ko, J. Jaschke, H. D. Ruter, A. I. Chumakov, R. RufferRadiative decoupling and coupling of nuclear oscillators by stepwise Doppler-energy shifts.Phys. Rev. B 65, 023804 (2002).
W. Schirmacher, M. Pohlmann, E. MaurerAnharmonic Interactions and the Low-Temperature Thermal Anomalies in GlassesPhys. Stat. Sol. (b) 230, 31 (2002).
I. Sergueev, H. Franz, T. Asthalter, W. Petry, U. van Burck, G. V. SmirnovStructural relaxation in a viscous liquid studied by quasielastic nuclear forward scattering.Phys. Rev. B 66, 184210 (2002).
S. Wiebel, J. WuttkeStructural relaxation and mode coupling in a non-glassforming liquid: depolarized lightscattering in benzeneNew J. Phys. 4, 56 (2002).
M. Wolkenhauer, P. Muller-Buschbaum, O. Wunnicke, M. Stamm, J. Roovers, G. von Kro-sigk, R. CubittStructure analysis of adsorbed starlike polymers with GISAS ans SFMApplied Phys A 74, S433 (2002)
O. Wunnicke, C. Lorenz-Haas, P. Muller-Buschbaum, V. Leiner, M. StammRetardation of the dewetting process due to the addition of functional copolymers atpolymer-polymer interfacesApplied Phys A 74, S445 (2002)
71
V. Zollmer, A. Meyer, K. Ratzke, F. FaupelDiffusion in a Metallic Melt at the Critical Temperature of Mode Coupling Theory(zur Veroffentlichung eingereicht)
Auswartige Vortrage von Institutsmitgliedern
U. van Burck, 5���
Seeheim Workshop on Mossbauer Spectroscopy, SeeheimSRPAC - a new method to study hyperfine interactions and dynamics in soft matter22. 5. 2002
W. Doster, American Chemical Soc. Meeting in Boston 2002.Applications of Neutron Scattering in Structural Biology and BiophysicsProbing the dynamical transition of proteins, surface-coupled and internal motions18-22. 8. 2002
W. Doster, Satellite Meeting of ESS-European Conference of Science, Bonn, 2002Perspective of inelastic neutron scattering on proteins15. 5. 2002
W. Doster, Int. Union of Crystallography Meeting in Geneva, SwitzerlandHigh pressure unfolding of proteins12. 8. 2002
W. Doster, QENS 2002, Int. Conference of Quasielastic Neutron Scattering, BerlinMolecular dynamcis and pressure-induced unfolding of proteins4.-7. 9. 2002
W. Doster, Int. Conference on High Pressure Science and Biotechnology in DortmundPressure-induced unfolding of myoglobin studied by dynamic neutron scattering16.-19. 9. 2002
W. Doster, SFB 531, Licht-induzierte Dynamik von Proteinen und Peptiden, LMUMunchen.Time-resolved calorimetry by optical interferometry6. 10. 2002
F. Kargl, Fruhjahrstagung der Deutschen Physikalischen Gesellschaft in RegensburgStrukturelle Anderungen und Ionentransport in Alkalisilikatschmelzen12.3.2002
A. Meyer, Universitat KielRelaxation and Diffusion in Viscous Metallic Melts17. 1. 2002
A. Meyer, Universitat MainzMulticomponent Viscous Metallic Melts as Model Systems for the Test of Mode CouplingTheory5. 2. 2002
A. Meyer, Laboratoire des Verres, Universite MontpellierAtomic Transport in Multicomponent Melts21. 6. 2002
72
A. Meyer, CECAM Workshop on Atomic Structure and Transport in Glassy Networks, LyonStructure and Atomic Transport in Silicate Melts24. 6. 2002
A. Meyer, Kolloquium zum DFG Schwerpunktprogramm: Bildung, Transport und Diffe-renzierung von Silikatschmelzen, HannoverSilicate Melts: Formation of Channels and Consequences for Atomic Transport10. 10. 2002
A. Meyer, Arbeitstreffen zum DFG Schwerpunktprogramm: Phasenumwandlungen inmehrkomponentigen Schmelzen, GottingenAtomic Transport in Multicomponent Metallic Liquids28. 11. 2002
P. Muller-Buschbaum, Status and perspectives of SAXS/WAXS, HASYLAB HamburgGrazing incidence small angle scattering24. 1. 2002
P. Muller-Buschbaum, Seminar des SFB448 Mesoskopisch strukturierte Verbundsysteme,BerlinMesoskopisch-strukturierte Polymeroberflachen29. 1. 2002
P. Muller-Buschbaum, BioSoft-Kolloquium des Hahn-Meitner Institutes, BerlinDiffuse scattering - a tool for the investigation of thin polymer films30. 1. 2002
P. Muller-Buschbaum, Fibers and polymers, GrenobleFailure and fracture of polymer interfaces investigated with scanning micro-SAXS12. 2. 2002
P. Muller-Buschbaum, Fruhjahrstagung der Deutschen Physikalischen Gesellschaft im Rah-men des Sondersymposiums Struktur und Dynamik in dunnen Polymerfilmen, RegensburgNano-structured polymer surfaces14. 3. 2002
P. Muller-Buschbaum, European Conference ESS, BonnNanostructured polymer films16. 5. 2002
P. Muller-Buschbaum, Synchrotron radiation in polymer science II, SheffieldDewetting of confined diblock copolymer films4. 9. 2002
P. Muller-Buschbaum, 5 years of ADAM - neutron reflectometry at the ILL, BochumStabilisation of thin polymer films on top of semiconductor surfaces14. 9. 2002
P. Muller-Buschbaum, Application of Synchrotron Radiation in Chemistry, HamburgSoft condensed matter investigated with synchrotron radiation: status and perspectives17. 9. 2002
73

P. Muller-Buschbaum, Condensed matter applications at PETRA III, HamburgAdvanced scattering techniques for the investigation of thin polymer films1. 10. 2002
P. Muller-Buschbaum, REFILL2002, GrenobleConfined diblock copolymer films investigated with grazing incidence small angle scattering25. 10. 2002
P. Muller-Buschbaum, Experiment and Theory in Polymer Science, DresdenDewetting of ultra-thin polymer films: A grazing incidence small angle scattering study15. 11. 2002
P. Muller-Buschbaum, Projekttreffen Haftklebstoffe, LudwigshafenTackiness of polymer surfaces11. 12. 2002
W. Petry, Rotary Club, TUM, GarchingFRM-II, ein einzigartiges Mikroskop fur Naturwissenschaften, Technik und Medizin17. 01. 2002
W. Petry, DNS-ESS-Meeting, Institute of Science, Bangalore, IndienNeutrons for Science, Engineering and Medicine, the New German Neutron Source FRM-IIat the University of Technology, Munich15. 03. 2002
W. Petry, Edgar-Luscher-Physikseminar am Gymnasium Zwiesel, Thema: Klima, Energie-versorgung der Zukunft und Probleme der KernenergieDer Hochtemperatur-Kernreaktor: Eine Chance fur die Zukunft13. 04. 2002
W. Petry, Diskussionsforum-Zukunft, Akademischer Seglerverein in Munchen e.V.Neutronen bringen Licht ins Dunkel - FRM-II, einzigartiges Mikroskop fur Naturwissen-schaften, Technik und Medizin05. 05. 2002
W. Petry, Symposium Physik, Information und Informationssysteme - Ausgewahlte The-men, Arnold Sommerfeld-Gesellschaft, Leipzig,Die Neutronenquelle FRM-II, ein einzigartiges Mikroskop fur Wissenschaft, Technik undMedizin21. 06. 2002
W. Petry, Status Seminar of the MPG Initiative, Materials Science at the Neutron SourceFRM-II, MPI StuttgartThe Status of the Reactor in Garching26. 06. 2002
W. Petry, DGK Arbeitskreistagung, Nichtkristalline und Partiellkristalline Strukturen, JenaAtomarer Transport in mehrkomponentigen zahen Schmelzen10. 09. 2002
W. Petry, Deutsches Museum, Vortragsserie: Physik und Technik, MunchenLicht im Dunkeln – Spektroskopie mit Neutronen16. 10. 2002
74
W. Petry, MAI-Konferenz im Rathaus, GarchingWirtschaft und Wissenschaft - getrennte Welten? Das Beispiel der Neutronenquelle FRM-II08. 11. 2002
W. Petry, GSF Neuherberg (Prof. Paretzke)Die Garchinger Neutronenquelle FRM-II und ihre geplante Nutzung18. 11. 2002
W. Petry, Festvortrag anlasslich der Diplomandenehrung des VDI/VDEFRM-II, ein einzigartiges Mikroskop fur Naturwissenschaften, Technik und Medizin28. 11. 2002
W. Petry, Symposium on the Neutron Backscattering in honour of Toni Heidemann, ILL,Grenoble, FrankreichNeutrons always tell the truth, self diffusion in metals and the liquid-to-glass transition29. 11. 2002
R. Rohlsberger, International Workshop on Magnetic Heterostructures, BochumImaging the magnetic spin structure of exchange-coupled thin films9. 10. 2002
R. Rohlsberger, International Workshop on X-Ray Spectroscopies of Magnetic Solids 2002,DresdenImaging the spin structure of magnetic thin films8. 12. 2002
R. Rohlsberger, ESRF Seminar, GrenobleImaging the spin structure of exchange-coupled thin films13. 12. 2002
W. Schirmacher, City-College, Univ. of New YorkTheory of vibrational anomalies in disordered solids8. 2. 2002
W. Schirmacher, Universitat AugsburgHopping-Transport in ungeordneten Halbleitern29. 5. 2002
W. Schirmacher, Universitat GiessenTheorie der Schwingungsanomalien in ungeordneten Festkorpern25. 10. 2002
W. Schirmacher, Universitat MarburgTheorie der Schwingungsanomalien in ungeordneten Festkorpern28. 10. 2002
I. Sergueev, VIII. Int. Conference on Mossbauer Spectroscopy and its Applications, St. Pe-tersburgSRPAC - a new method to study hyperfine interactions and dynamics in soft matter11. 7. 2002
75
Eingeladene Vortrage an unserem Institut
Dr. Marilena Ricci, LENS, Universitat FlorenzDynamics of glass-forming liquuids by time resolved optical Kerr-effect31. 01. 2002
Dr. Simona Loi, Universitat SiegenTwo-dimensional structure of self-assembled alkyl substituted polyphenylene dendrimers ongraphite18. 04. 2002
Dr. Stephan Roth, ESRF, GrenobleMaterial science in hard and soft condensed matter at ID 1303. 05. 2002
Tarik Mehaddene, Universit e de Strasbourg und Universit e de Tizi-Ouzou (Algerien)Diffuse and inelastic scattering on FePd alloys06. 06. 2002
Prof. Hermann Z. Cummins, City College, New YorkPolarized and depolarized light scattering in Salol: Effects at translation-rotation coupling06. 06. 2002
Dr. Michael-Peter Macht, HMI, BerlinZwischen Schmelze und Festkorper-Forschung an metallischen Glasern am HMI Berlin14. 06. 2002
Dr. Niklas Engler, Technische Universitat Munchen (E17)Proteinstrukturanalyse mit Neutronen: Struktur und Dynamik der Wasserstoffatome19. 06. 2002
Dr. Herbert Schober, FZ JulichSimulation of Diffusion in Glasses and their Melts11. 07. 2002
Prof. Dr. A.K. Sood, Department of Physics, Indian Institute of Science, Bangalore, IndienChaotic dynamics in nonlinear flow of wormlike micellar systems12. 07. 2002
Prof. Dr. Sushanta Dattagupta, S.N. Bose National Centre for Basic Science, Salt Lake,Calcutta, IndienCoherence versus decoherence in some problems of condensed matter physics30. 07. 2002
Dr. Nadja Hermsdorf, Institut fur Polymerforschung Dresden eVTemplate fur Nanodrahte und Nanorohren - Herstellung und Charakterisierung13. 09. 2002
Dr. Martin Letz, Schott MainzOptische Anisotropie und excitonische Anregungen im Calziumfluorid fur Mikrolithographiebei 157 nm28. 09. 2002
76

Dr. Liliana Birla, Universitat BukarestSalt Effects on Albumin Structure18. 10. 2002
Prof. Dr. Alexei Sokolov, Acron University, MichiganLight Scattering Experiments on Liquids and Protein Solutions28. 10. 2002
PD. Dr. Thomas Nawroth, Technische Universitat Munchen (E17)Struktur-Dynamik von Membranen - Zeitauflosende Neutronenstreuung und Elektronenmi-kroskopie von Liposomen, Proteo-Liposomen und magnetischen Liposomen fur die medizi-nische Anwendung15. 11. 2002
Prof. Dr. Werner Keune, Universitat DuisburgBeobachtung des Boson-Peaks in amorphen FeTM Legierungsfilmen22. 11. 2002
Dr. Munir Tarek, Equipe de Chimie et Biochimie Th eoriques, CNRS NancyGlassy dynamics of proteins and their hydration water from Molecular Dynamics simulati-ons05. 12. 2002
Prof. Dr. Georg Krausch, Universitat BayreuthReorientation of Block Copolymer Microdomains in Electric Fields: An in-situ SAXS Study06. 12. 2002
77

Mitarbeiter und Gaste
Leitung: Univ.-Prof. Dr. Winfried Petry
Prof. Dr. Alfons Schulte, Lehrstuhlvertretung von Herrn Prof. Petry bis August 2002Prof. Dr. Ralf Rohlsberger, Lehrstuhlvertretung von Herrn Prof. Petry ab Oktober 2002
Wissenschaftliche Mitarbeiter
PD Dr. Wolfgang DosterDr. Valeria Lauter-Pasyuk (ILL)Dr. Simona LoiDr. Andreas MeyerDr. habil. Peter Muller-BuschbaumDr. Jurgen Neuhaus (FRM II)PD Dr. Walter SchirmacherDr. Ernst Schreier (bis Juni 2002)Dr. Tobias Unruh (FRM-II)Dr. Uwe van Burck
Doktoranden
Ronald GebhardtFlorian Kargl (ab September 2002)Ingo Koper (bis August 2002)Edith Maurer (ab Juli 2002)Suresh Mavila Chathoth (ab Marz 2002)Kirill MesselPanteleimon PanagiotouMarkus PohlmannIlya SergueevSabine Wiebel
Diplomanden
Patrick Dondl (ab Januar 2002)Andreas Gotzendorfer (ab August 2002)Florian Kargl (bis Juli 2002)Edith Maurer (bis Juni 2002)Axel Muller (ab Dezember 2002)Tobias Titz (ab Oktober 2002)Anita Widmann (ab Februar 2002)
Werkstudenten
Stephan CamererChristian CarbagnoAlexander DiethertAlexander SchoberTobias TitzAnita Widmann
78

Nichtwissenschaftliche Mitarbeiter
Joachim DorbeckerElke FehsenfeldReinhold FunerJosef KaplonskiHelga HarlandtDieter MullerCornelia SimonMax Wittich
Gaste
Dr. Peter Link (FRM-II)Cornelia Lorenz-HaasJandal Ringe (FRM-II)
79


