Fakultät für Medizin HOX genes in pathogenesis of Ewing sarcoma Miriam Verena Manuela Ertl Vollständiger Abdruck der von der Fakultät für Medizin der Technischen Universität München zur Erlangung des akademischen Grades eines Doktors der Medizin genehmigten Dissertation. Vorsitzender: Prof. Dr. Ernst J. Rummeny Prüfer der Dissertation: 1. Prof. Dr. Stephanie Elisabeth Combs 2. Prof. Dr. Stefan Burdach Die Dissertation wurde am 25.09.2017 bei der Technischen Universität München eingereicht und durch die Fakultät für Medizin am 02.05.2018 angenommen.
Transcript
Fakultät für Medizin
HOX genes in pathogenesis of Ewing sarcoma
Miriam Verena Manuela Ertl
Vollständiger Abdruck der von der Fakultät für Medizin der Technischen
Universität München zur Erlangung des akademischen Grades eines
Doktors der Medizin
genehmigten Dissertation.
Vorsitzender: Prof. Dr. Ernst J. Rummeny
Prüfer der Dissertation: 1. Prof. Dr. Stephanie Elisabeth Combs
2. Prof. Dr. Stefan Burdach
Die Dissertation wurde am 25.09.2017 bei der Technischen Universität München
eingereicht und durch die Fakultät für Medizin am 02.05.2018 angenommen.
meiner Mutter
TABLE OF CONTENTS
I
Table of contents
List of abbreviations ......................................................................................................... III
XNP X-linked nuclear protein gene; also known as ATRX
INTRODUCTION
1
1 Introduction
1.1 HOX genes
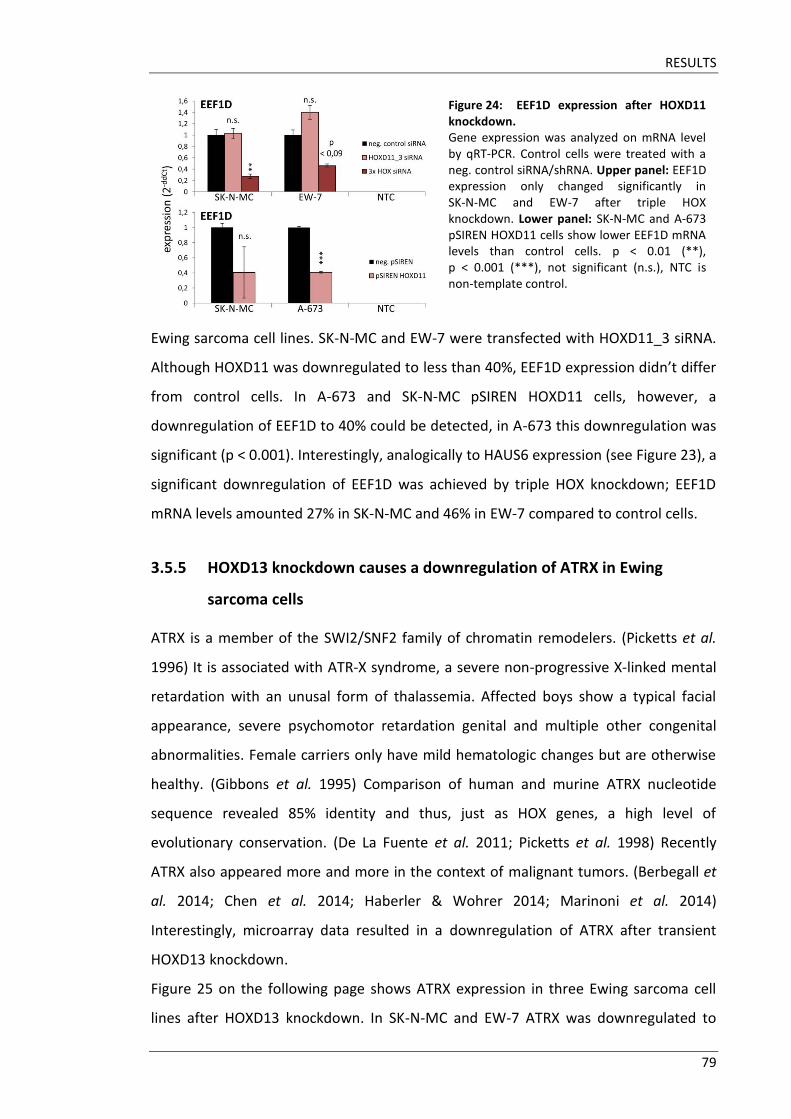
1.1.1 Definition, classification and structure of HOX genes
HOX genes form a subgroup of the family of homeobox genes. Members of this gene
family share a common DNA sequence of 180 bp called “homeobox”. The homeobox
was first discovered in the Drosophila melanogaster genome; since then it was
detected in all multicellular organisms that were analyzed, such as plants, fungi,
sponges, but also vertebrates including humans. (Gehring et al. 1994; McGinnis et al.
1984) Sequences of analysed homeoboxes were very similar to the drosophila
homeobox; changes of particular nucleotides still resulted in identical amino acids.
Thus, it was soon established that the homeobox encodes a certain 60-amino-acid long
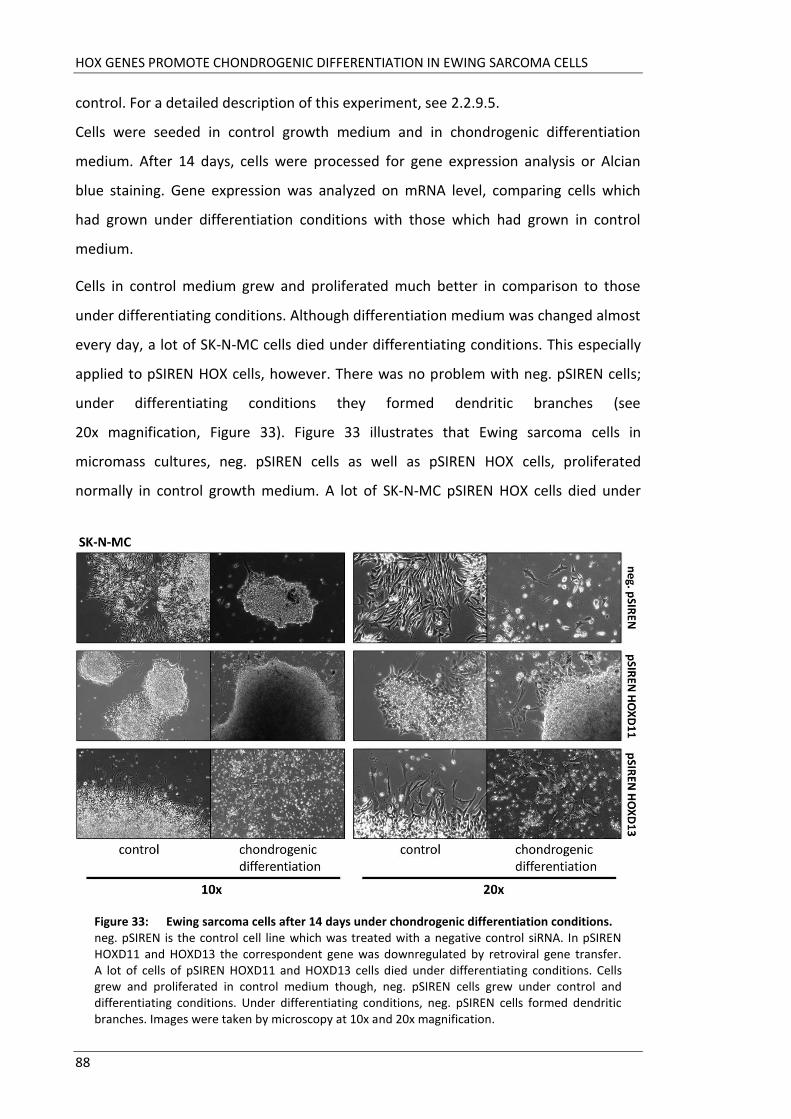
polypeptide segment which was designated as the “homeodomain”. (Duboule 1994;
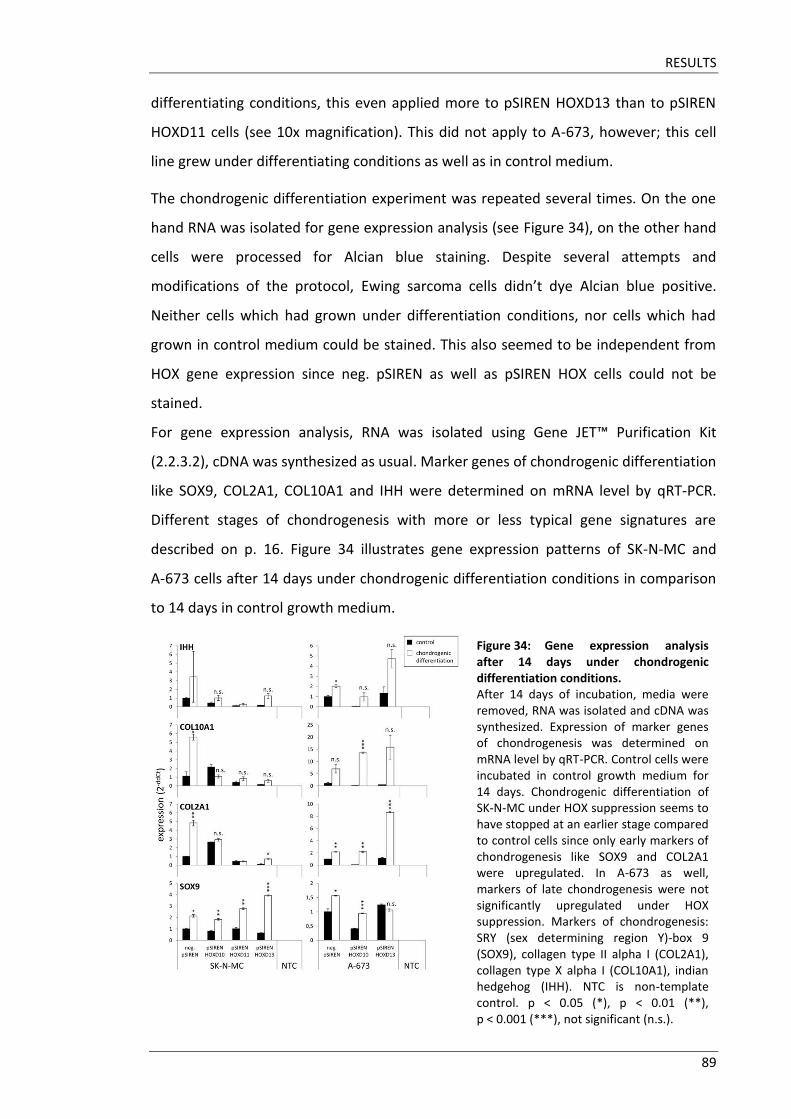
Gehring et al. 1994)
HOX genes are “small” genes with a genomic length of 5-10 kb compared to the mean
size for protein-coding genes of 27 kb. The mean number of exons per gene amounts
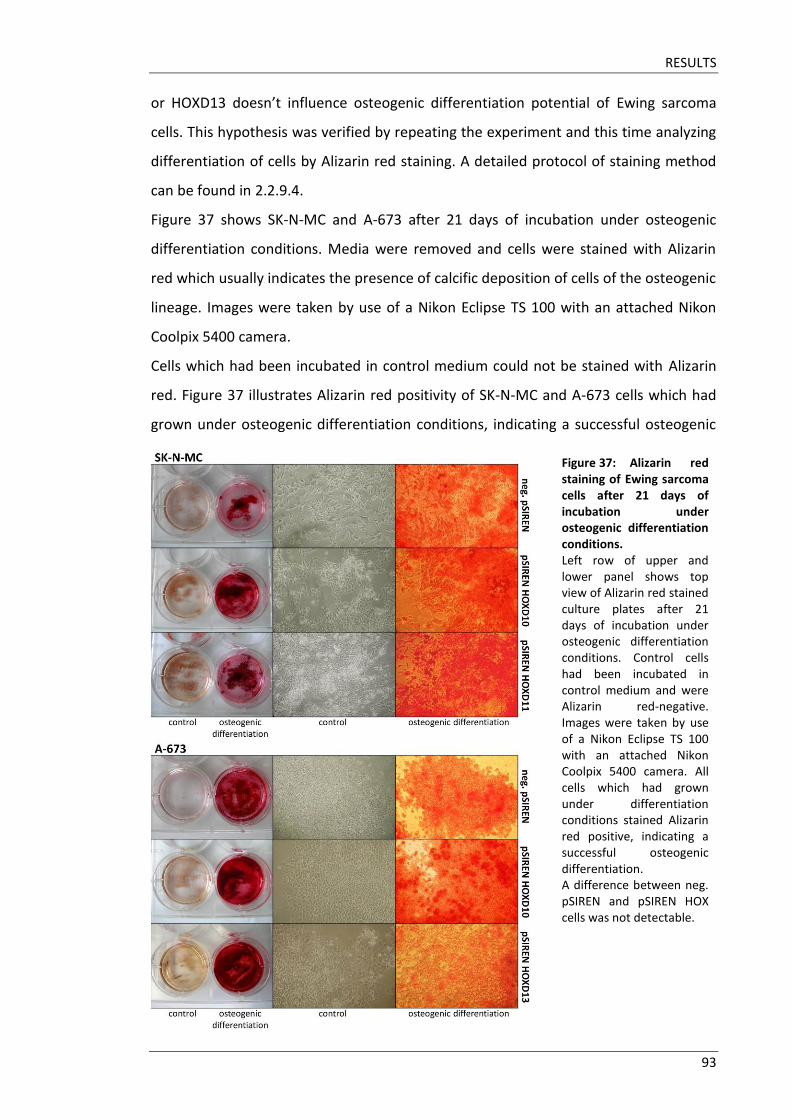
10.4. HOX genes, however, consist of only two exons separated by one intron. The
exon near to the 3’ end contains the 180 bp homeobox encoding the homeodomain of
the HOX protein. (Alberts et al. 2014, p. 184; Grier et al. 2005; Kappen et al. 1989)
Figure 1: Structure of HOX genes and proteins. HOX genes consist of two exons separated from each other by one intron. Exon near 3’end contains homeobox which encodes homeodomain of HOX proteins. Adjacent to the homeodomain, there is a binding site for cofactors. Modified from Grier et al. (2005). Reproduced by permission of John Wiley & Sons.
Homeodomains of many different organisms were analyzed and compared with each
other to elucidate its function. Sequence conformities between the homeodomain and
gene regulatory proteins were detected and suggested a similar function for all
homeodomain proteins. Suspicion was raised that the homeodomain contained a
helix-turn-helix DNA-binding motif, a common structural motif in transcription
HOX GENES
2
regulators, and that HOX genes encoded transcription factors with the homeodomain
acting as the DNA-binding domain. (Alberts et al. 2014, p. 376; Duboule 1994;
Shepherd et al. 1984) The homeodomain was demonstrated to bind to DNA in vitro
and soon the three-dimensional structure of the homeodomain was revealed by NMR
spectroscopy. The assumption that homeobox proteins acted as transcription factors
with the homeodomain as the DNA-binding motif was later functionally confirmed.
(Muller et al. 1988) In most HOX proteins, a certain sequence of six amino acids can be
found near by the homeodomain. This domain was discovered to function as binding
site for cofactors. Cofactors mainly involve TALE proteins such as PBX and MEIS. Some
HOX proteins were documented to lack this hexapeptide. (Erselius et al. 1990; Grier et
al. 2005)
Common structures of a HOX gene and its gene product, the HOX protein, are
illustrated in Figure 1. Figure 2 in turn shows three-dimensional structure of
homeodomain containing three α-helices and a more flexible fourth helix. Two
α-helices form a helix-turn-helix motif. The third α-helix corresponds to the
DNA-recognition site. The N-terminal arm is elongated by a fourth helix which
stabilizes contact to DNA. (Duboule 1994; Otting et al. 1988).
Analysis of amino acid sequences and three-dimensional structures of homeodomains
of different organisms revealed high evolutionary conservation of the homeobox and
its gene product, the homeodomain. This conservation suggested an important
function in organism. Three-dimensional structure of the homeodomain seems to have
been more highly conserved than its amino acid sequence. Despite 25% identity in
amino acid sequences only, three-dimensional structures of two homeodomains are
more or less the same. (Alberts et al. 2014, p. 120)
INTRODUCTION
3
HOX genes were originally called “homeotic selector genes” due to the discovery of
specific mutations observed in Drosophila. These “homeotic mutations” cause bizarre
deformities of the adult fly where one body structure has been replaced by another
which is normally located elsewhere. The term “homeosis” (Greek “homoios” meaning
similar) was coined by the English geneticist William Bateson who had already
described two biological variations in 1894. He reported on the antennapedia mutant
in which legs grew at the top of the head instead of antennae; the bithorax mutant, on
the other hand, was characterized by an additional pair of wings instead of the smaller
appendages called halteres. Later on, the bithorax mutant turned out to be part of a
cluster of genes called the bithorax complex, consisting of the three homeobox genes
Ubx, Abd-A and Abd-B. The antennapedia complex, on the other hand, was shown to
consist of the five homeobox genes Lab, Pb, Dfd, Scr and Antp. (Alberts et al. 2014, p.
235; Grier et al. 2005; McGinnis 1994) HOX genes in vertebrates correspond to the
bithorax and antennapedia cluster in Drosophila. HOX genes were discovered to
control patterning along the anterior-posterior axis during embryonic development of
all animals. They ensure development of correct structures appropriate to respective
body part. Thus, HOX genes are regarded as master regulators of development. (Lewis
1978; McGinnis & Krumlauf 1992)
In humans, there are 39 HOX genes arranged in four HOX clusters A-D which are
located on four different chromosomes. Each cluster is about 100 kb in length and
consists of 9 to 11 genes. (Alberts et al. 2014, p. 235; Scott 1992; Zeltser et al. 1996)
HOXA is located at 7p15, HOXB at 17q21, HOXC at 12q13 and HOXD at 2q31. (Apiou et
al. 1996) Within each cluster HOX genes are subdivided into 13 paralogous groups
according to their similarity in the homeobox region and position within the cluster.
The most 5’ group of each cluster was designated as number 13 and the most 3’ group
as number 1. According to this, paralogs, i.e. genes sharing the same number but from
different clusters, are more related to each other than HOX genes within one cluster.
(Duboule 1994; Lewis 1978; Maconochie et al. 1996)
As mentioned in the beginning, homeobox genes are defined by sharing a common
DNA sequence which encodes the homeodomain. In mammals, there are more than
200 different homeobox-containing genes. According to the sequence of their
homeodomains but also according to other criteria such as similarity in other protein
HOX GENES
4
domains and organization in clusters, they can be subdivided into many different
classes and even more subgroups. For reasons of simplification, homeobox genes can
be classified into HOX genes and non-HOX genes. Only those genes which are located
within the HOX cluster, i.e. the 13 paralogs of cluster A-D respectively, are HOX genes.
Non-HOX genes lie outside the HOX clusters and represent the larger proportion of
homeobox genes. (Duboule 1994; Gehring et al. 1994; Holland 2013)
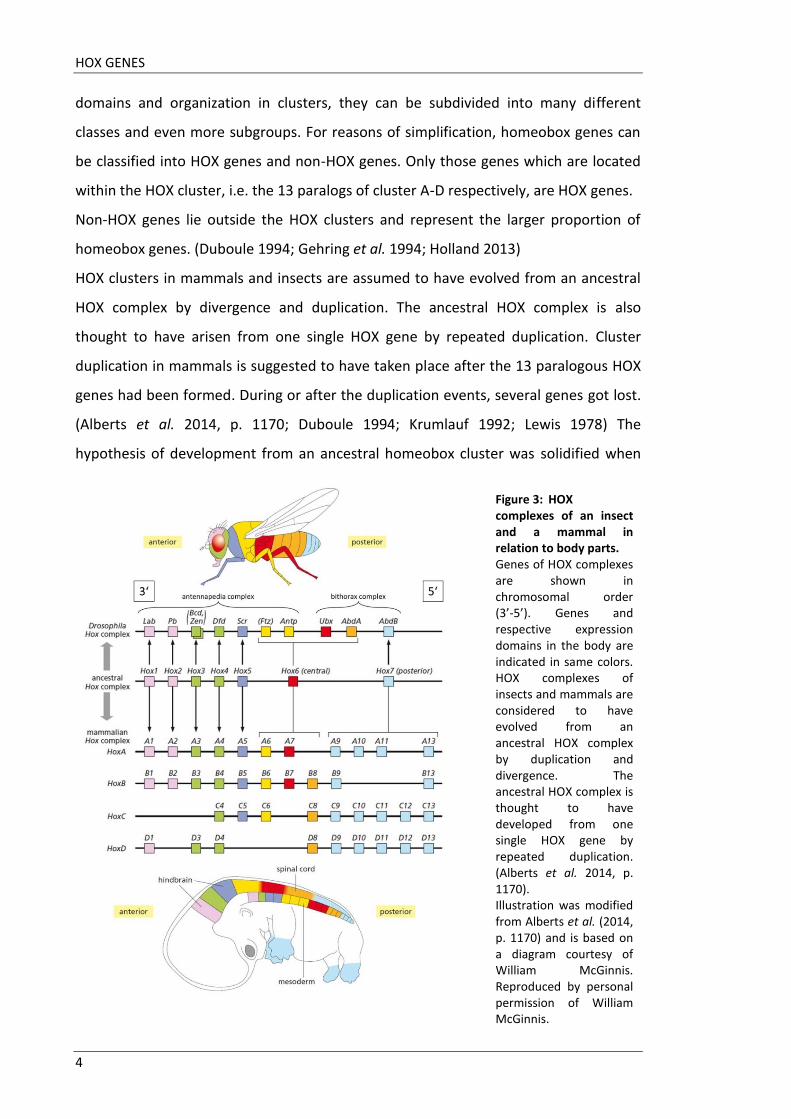
HOX clusters in mammals and insects are assumed to have evolved from an ancestral
HOX complex by divergence and duplication. The ancestral HOX complex is also
thought to have arisen from one single HOX gene by repeated duplication. Cluster
duplication in mammals is suggested to have taken place after the 13 paralogous HOX
genes had been formed. During or after the duplication events, several genes got lost.
(Alberts et al. 2014, p. 1170; Duboule 1994; Krumlauf 1992; Lewis 1978) The
hypothesis of development from an ancestral homeobox cluster was solidified when
Figure 3: HOX complexes of an insect and a mammal in relation to body parts. Genes of HOX complexes are shown in chromosomal order (3’-5’). Genes and respective expression domains in the body are indicated in same colors. HOX complexes of insects and mammals are considered to have evolved from an ancestral HOX complex by duplication and divergence. The ancestral HOX complex is thought to have developed from one single HOX gene by repeated duplication. (Alberts et al. 2014, p. 1170). Illustration was modified from Alberts et al. (2014, p. 1170) and is based on a diagram courtesy of William McGinnis. Reproduced by personal permission of William McGinnis.
INTRODUCTION
5
sequences of mammalian homeoboxes were compared with their drosophila
counterparts and a high degree of homology was determined. Nucleotide sequences of
mammalian homeoboxes of the 3’ end were similar to those of the 3’ end of the
drosophila; the same applied to homeoboxes of the 5’ end, respectively. (Duboule
1994) Mammalian paralogs 9-13 were identified to be closely related to the drosophila
bithorax complex; human paralogs with lower numbers rather corresponded to the
drosophila antennapedia complex. The position of HOX genes within their clusters or
rather their position on the chromosome from 3’-5’ was revealed to correspond to
their expression along the anterior-posterior axis in the animal. 3’ HOX genes are
expressed in the anterior parts of the body such as the head and upper thorax whereas
5’ HOX genes are expressed in more caudal and distal body structures. This is known as
“spatial collinearity”. Furthermore, HOX clusters are expressed temporally from 3’ to 5’
in development. This results in 3’ HOX genes, i.e. low-number HOX genes, being
expressed earlier than higher-number HOX genes. This phenomenon is called
“temporal collinearity”. Moreover, a “posterior prevalence” was observed: being
simultaneously expressed in the same domain, 5’ HOX genes are functionally dominant
over 3’ genes. (Duboule 1994; Duboule & Morata 1994; Izpisua-Belmonte et al. 1991;
Krumlauf 1994; McGinnis & Krumlauf 1992).
Figure 3 illustrates HOX clusters of drosophila and mammals and their assumed origin
from an ancestral HOX complex. Homologs are indicated by same colors, just as
respective gene expression domains in the body.
As already mentioned, HOX proteins function as transcription factors with the
homeodomain binding to the DNA. (Duboule 1994; Shepherd et al. 1984) They are
thought to control axial patterning in development by activation and repression of
specific sets of target genes. Biochemical analyses, however, revealed that isolated
HOX proteins bind to DNA with very low affinity and specificity because respective
DNA domains are all rich in adenine-thymine base pairs. HOX proteins were
subsequently identified to exert specificity by interaction with cofactors in complexes.
Various limb malformations can be referred to alterations of HOX expression and
interestingly, localization of limb defects corresponds to collinearity of HOX genes.
According to this, disruption of more 3’ HOX genes results in a more proximal
phenotype whereas disruption of 5’ HOX genes especially causes defects of distal limb
elements.
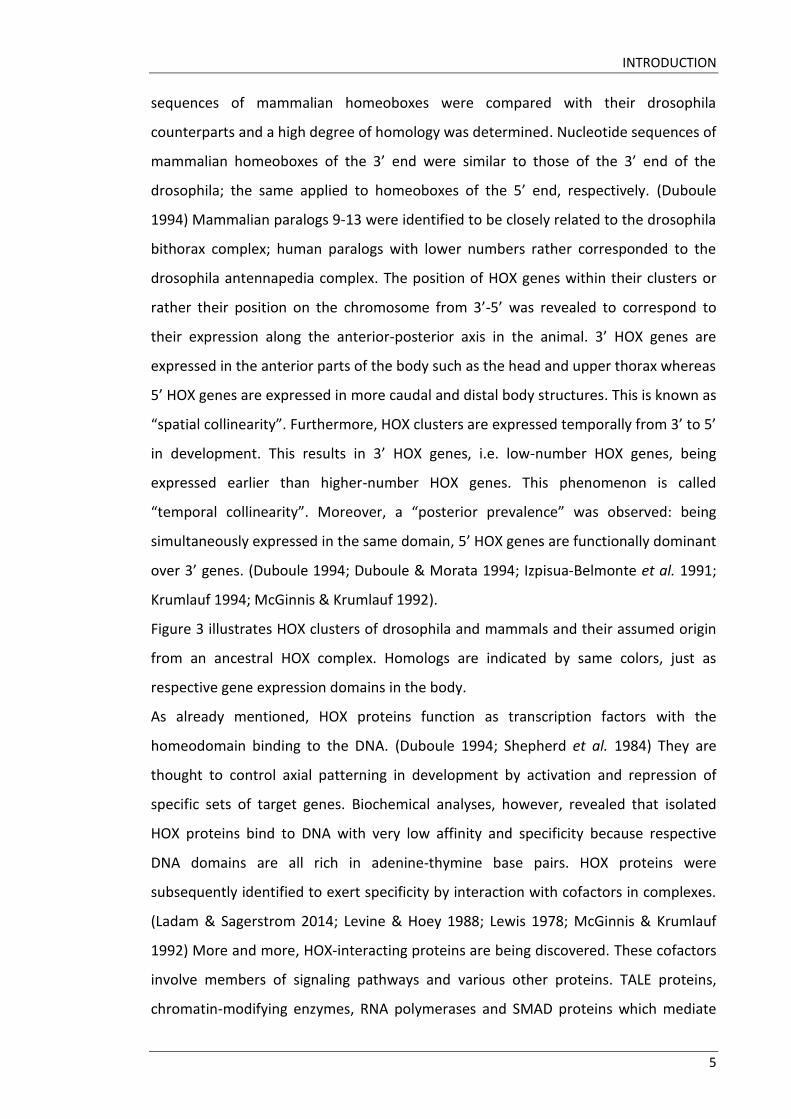
The vertebrate limb is subdivided into three morphogenetic domains from proximal to
distal: the stylopod, the zeugopod and the autopod (see Figure 4).
Figure 4: Functional domains of HOXD10, HOXD11 and HOXD13 in limb development. Simplified illustration according to Zakany and Duboule (1999). Overlaps have been ignored. Paralogous HOXA and HOXD genes represent same functional domains. Carpal bones (yellow) are also affected by HOXD12.
HOXD10, HOXD11 and HOXD13 were identified to have distinct functional domains in
limb development. HOXD10 represents the proximal limb segment, i.e. the stylopod
which gives rise to the humerus and the femur, respectively. HOXD11 is responsible for
the middle skeletal segment, i.e. the zeugopod which contains radius and ulna in the
forelimb and tibia and fibula in the hindlimb. The autopod mainly corresponds to
HOXD13. This domain gives rise to carpal bones, metacarpals and digits in the forelimb
and to tarsal bones, metatarsals and toes in the hindlimb, respectively. (Long & Ornitz
HOXD11 and HOXD13 in a simplified way because domains usually overlap.
HOXD10-HOXD12 were discovered to play a role in digit development as well, though
less substantiated than HOXD13. (Delpretti et al. 2012) Phenotypes due to targeted
disruption of HOXD10, HOXD11 and HOXD13, respectively, are described in detail in
HOX GENES
8
the following chapters.
Besides their involvement in limb development, posterior HOXD genes are also
expressed during skin development and in neuroblastoma where they seem to control
growth and neuronal differentiation. (Kanzler et al. 1994; Zha et al. 2012)
1.1.3.1 Current knowledge on HOXD10
Mice with targeted disruption of HOXD10 have abnormal hindlimbs. Skeletal and
neural defects were observed whereas muscles were not substantially altered. Animals
carrying a double mutation of HOXD9 and HOXD10, however, showed alterations in
axial and appendicular skeletal structures, hindlimb peripheral nerve and distal
hindlimb musculature. (Carpenter et al. 1997; de la Cruz et al. 1999) In humans,
HOXD10 was also shown to be associated with limb malformations. In detail,
mutations of HOXD10 were detected in families with isolated congenital vertical talus,
a severe form of a congenital rigid flatfoot with dislocation of the talonavicular joint
and near-vertical orientation of the talus. One family also suffered from
Charcot-Marie-Tooth disease, a hereditary motor and sensory neuropathy. In this
condition a genetically heterogeneous group of disorders share the same clinical
phenotype: distal limb muscles are wasting and weak, distal sensory can be affected,
skeletal deformities are possible and tendon reflexes are sluggish or even missing.
(Dobbs et al. 2006; McKie & Radomisli 2010; Pareyson 1999; Shrimpton et al. 2004)
Recently, HOXD10 was also shown to maintain a role in the pathogenesis of
intervertebral disc degeneration. (Yu et al. 2013) All these findings indicate an
important role of HOXD10 in skeletal and neural structures in humans. HOXD10 is also
expressed in the developing lumbosacral spinal cord, however, not in the thoracic cord
(Lance-Jones et al. 2001). Together with HOXA10, it was shown to control lumbar
motor neuron pattering (Lin & Carpenter 2003) Ectopic expression of HOXD10 in
thoracic segments in chick embryos induced motoneurons with a lumbosacral
molecular profile and axon projections to the limb. (Shah et al. 2004) HOXD10
expression was also observed in malignancies of skeletal and neural structures, such as
osteosarcoma (Han et al. 2014), neuroblastoma (Merrill et al. 2004) and brain tumors
like astrocytoma and glioblastoma (Abdel-Fattah et al. 2006).
Furthermore, HOXD10 expression was not only detected during kidney development
INTRODUCTION
9
(Fu et al. 2014) but also in renal malignancies such as Wilm’s Tumor (Redline et al.
1994). HOXD10 is also expressed in postnatal developing uterines of mice and is
assumed to regulate endometrial receptivity (Hu et al. 2004; Xu et al. 2014). In
endometrial carcinoma an alteration of HOXD10 expression was detected, varying with
the histologic grade of differentiation. (Osborne et al. 1998) In this case HOXD10
seems to maintain a role in angiogenesis because its overexpression in endometrial
cancer impaired endothelial cell migration and blocked angiogenesis in vivo.
Furthermore, human endothelial cells with HOXD10-overexpression were not able to
form new vessels after implantation into immunocompromised mice. (Myers et al.
2002) A potential role for HOXD10 was also proposed in development of
hemangiomas. (Hansen et al. 2006)
Several data suggest HOXD10 can function as a tumor suppressor. In both breast and
endometrial tumors HOXD10 expression in epithelial cells seemed to conserve a
non-malignant phenotype. Progression of malignancy was associated with a decrease
of HOXD10 expression whereas sustained HOXD10 expression impaired endothelial
cell migration and inhibited tumor growth in vivo. (Carrio et al. 2005) Lower HOXD10
mRNA levels in breast cancer samples were significantly associated with higher
histological grade of the tumor (Sekar et al. 2014; Vardhini et al. 2014)
HOXD10 was also found to positively regulate a microRNA called miR-7 in breast
cancer. HOXD10 expression resulted in increased miR-7 expression and miR-7
expression in turn suppressed motility, invasiveness, anchorage-independent growth,
and tumorigenic potential of breast cancer cells. (Reddy et al. 2008) Several results
suggest that HOXD10 also functions as a tumor suppressor in gastric cancer because
HOXD10 expression is commonly downregulated in gastric cancer tissues and cell lines
compared to normal stomach tissues. Re-expression caused inhibition of cell survival,
induction of apoptosis, impairment of migration and invasion and suppression of
tumor growth in a mouse xenograft. (Wang et al. 2012) Insulin-like growth factor
binding protein 3 was revealed as transcriptional HOXD10 target in gastric cancer. Like
HOXD10, it is frequently downregulated in gastric cancer tissues. Since IGFBP3
expression is related to overall survival and it was already shown to influence
proliferation, apoptosis, invasion in other tumor entities, an important role in gastric
cancer progression is probable. (Xue et al. 2013)
HOX GENES
10
Interestingly, hypermethylation indicating inactivation of HOXD10 was also observed in
follicular lymphoma. (Bennett et al. 2009) All these findings substantiate the
hypothesis of HOXD10 acting as a tumor suppressor in these malignomas.
In another very important finding HOXD10 was shown to be a direct and functional
target of miR-10b. In breast cancer this microRNA promotes tumor invasion and
metastasis. (Ma et al. 2007) Overexpression of miR-10b was also observed in bladder
transitional cell cancer metastases whereas HOXD10 expression was downregulated in
metastases compared to its expression in matched primary tumors. (Baffa et al. 2009)
It was shown that miRNA-10b promoted migration and invasion through HOXD10 in
human bladder cancer. (Xiao et al. 2014) miR-10b was similarly overexpressed in
glioma samples and directly associated with the glioma's pathological grade and
malignancy. The microRNA directly targeted HOXD10 in this tumor as well and thereby
induced glioma cell invasion by modulating tumor invasion factors expression. (Sun et
al. 2011) Similar results, i.e. miR-10b promoting invasion and metastasis via HOXD10,
were obtained in many more tumor entities, involving gastric carcinoma
(Liu et al. 2012), colorectal cancer (Wang et al. 2015), brain tumors such as
glioblastoma multiforme (Lin et al. 2012), other gynecologic tumors such as ovarian
cancer (Nakayama et al. 2013), and hepatocellular carcinoma (Liao et al. 2014). In
hepatocellular carcinoma, HOXD10 can also be targeted by another microRNA
(miR-224) to promote cell proliferation, migration and invasion. (Li et al. 2014)
Generally, HOXD10 seems to be a common target of microRNAs. In gliomas, HOXD10
was also detected to be a target of miR-23a. (Hu et al. 2013)
HOXD10 expression was also observed in several ENT (ear, nose and throat) tumors. In
oral squamous cell carcinoma HOXD10 belongs to the three most upregulated
homeobox genes. (Rodini et al. 2012) Its expression can also be observed in several
esophageal cancer cell lines. (Gu et al. 2007) In head and neck squamous cell
carcinoma, HOXD10 is overexpressed and its knockdown caused decreased
proliferation and invasion. (Sharpe et al. 2014) HOXD10 was also discovered to be
overexpressed in colon carcinoma. (Bhatlekar et al. 2014)
Summing up, HOXD10 maintains an important role in skeletal and neural development
and its expression was observed in many different tumors. It seems to have a dual role
in pathogenesis of tumors since in some tumors there is an overexpression promoting
INTRODUCTION
11
proliferation and invasion whereas in other tumor entities, HOXD10 seems to function
as a tumor suppressor being expressed at very low levels only or even being
inactivated by hypermethylation. However, little is known about the detailed function
of HOXD10 or its targets.
1.1.3.2 Current knowledge on HOXD11
Doing literature research on HOXD11, most works deal with limb development. Double
disruption of HOXD11 and its paralog HOXA11 causes a severe malformation of the
zeugopod in mice. Mesenchymal condensations which, later on, form the basic
structure of the zeugopod (i.e. containing the two bones respectively: radius and ulna,
tibia and fibula), are started normally but ultimately they remain smaller in size; radius
and ulna end up shortened and misshapen. (Boulet & Capecchi 2004) In a different
work radius and ulna in HOXA11/HOXD11 double mutant mice are even described as
“almost entirely absent”. Furthermore, a malformation of the wrist with affection of
the proximal carpal bones is mentioned. (Davis et al. 1995; Kjosness et al. 2014)
Disruption of HOXD11 in mice leads to additional lumbar vertebrae, shortened
metacarpals and second phalanges. (Davis & Capecchi 1994; Zakany et al. 1997)
HOXA11/HOXD11 double mutant mice have eight lumbar vertebrae (normal mice have
six lumbar vertebrae). Number of lumbar vertebrae was reduced to only five by
increasing the number of HOXD11 transcripts in particular cells. In the autopod
increased HOXD11 copy number causes an increase of bone length. (Boulet & Capecchi
2002) Interestingly, it’s not only quantity of HOXD11 transcripts that matters but also
the point in time when HOXD11 is expressed. If it is expressed too early, lumbar
vertebrae might be missing, if HOXD11 is expressed too late, additional lumbar
vertebrae can be found. (Gerard et al. 1997) All three HOX11 paralogs (there is no
HOXB11, see p. 4) are involved in joint formation of the zeugopod, i.e. elbow and knee
joint formation. In triple mutants, the ulna lacks the olecranon, instead there is a sort
of sesamoid bone; knee joints are remodeled with fibula and tibia being equally
involved in articulation with the femur. Interestingly, organization of elbow and knee
joints can be largely restored if one of the three HOX11 genes is functional. (Koyama et
al. 2010)
In mice HOXA11 and HOXD11 were shown to control early steps of chondrocyte
HOX GENES
12
differentiation. In HOXA11/HOXD11 double mutants chondrogenic differentiation in
the zeugopod was generally delayed and chondrocytes were not competent to
undergo hypertrophic differentiation. (Gross et al. 2012)
Beyond their involvement in limb development, HOXD11 and its paralog HOXA11 are
known to maintain a complex and important role in kidney development. They control
certain programs in metanephric kidney induction, parts of which later persist as the
adult kidney. Mutations cause, among others, an abnormal pattern of ureteric bud
branching. Mice with homozygous null mutation of HOXD11 or HOXA11 have normal
kidneys whereas animals carrying a double mutation of HOXD11 and HOXA11 have
rudimentary or absent kidneys. (Mugford et al. 2008; Patterson et al. 2001; Wellik et
al. 2002) Congenital renal malformations in children, however, can also emerge
without mutations of HOXA11 and HOXD11. (Bouba et al. 2009) Deregulation of
HOXD11 expression was also observed in clear cell renal cancer tissues. (Cantile et al.
2011)
HOXD11 also seems to maintain a role in genital development because altered
methylation of its CpG site was associated with hypospadia (Choudhry et al. 2012).
HOXD11 is also expressed in the endometrium. HOXD11 expression seems to be
dependent on menstrual cycle-stage since it can be detected throughout the cycle but
levels decrease severely in the secretory phase compared to the proliferative phase.
(Akbas & Taylor 2004)
HOXD11 also appears in context of several malignancies. In human breast cancer and
ovarian cancer tissue samples, just as in human malignant melanoma cells, HOXD11
was often shown to be aberrantly methylated. (Cai et al. 2007; Furuta et al. 2006;
Miyamoto et al. 2005) In one ovarian cancer cell line HOXD11 was shown to be
overexpressed. (Morgan et al. 2010) By the side of HOXD10 and HOXA5, HOXD11
belongs to the three most upregulated homeobox genes in oral squamous cell
carcinoma (Rodini et al. 2012). Little is known about its function though. Strong
HOXD11 expression was observed in head and neck cancer tissues where its
knockdown impaired invasion (Sharpe et al. 2014). In gastric cancer tissue samples
HOXD11 expression was associated with altered integrin expression profiles compared
to normal mucosa. (Rossi Degl'Innocenti et al. 2007)
HOXD11 also appears in the context of hematological malignancies. NUP98 gene was
INTRODUCTION
13
shown to be fused to several different partner genes in hematological malignancies,
such as MDS and AML with certain translocations. In a 15-year-old boy with acute
myeloid leukemia a certain translocation t (2; 11) (q31; p15) was detected which
caused a fusion of NUP98 to HOXD11. (Taketani et al. 2002)
Like HOXD10, HOXD11 was shown to influence motoneuron subtype specification in
the developing lumbosacral spinal cord of chick embryos. HOXD11 is only expressed in
caudal segments of the lumbosacral spinal cord; ectopic HOXD11 expression lead to a
change of the number of motoneurons and new axonal projections from rostral
segments to thigh muscles. (Misra et al. 2009)
Altogether, little is known about HOXD11 and its functions. Studies mainly concentrate
on its role in development of skeletal, urogenital and neural structures. Comparing to
HOXD10, only few works described aberrant HOXD11 expression in different tumor
entities. Its role in pathology of cancer remains widely unclear.
1.1.3.3 Current knowledge on HOXD13
As previously mentioned, HOXD10, HOXD11 and HOXD13 are involved in limb
formation with each of them representing a certain portion of the limb (see Figure 4
on p. 7). Paralogs HOXA13 and HOXD13 especially correspond to the autopod.
A certain HOXD13 mutation is especially associated with synpolydactyly (SPD). This
rare limb deformity is characterized by a clinically very heterogenous combination of
syndactyly and polydactyly. Main features of SPD are the webbing of digits III/IV and
toes IV/V with partial or complete digit duplication within the syndactylous web. SPD is
inherited in an autosomal dominant manner with incomplete penetrance. Three
genetically distinct SPD malformations are known, SPD1, SPD2 and SPD3. SPD1 is
linked to a HOXD13 mutation (locus: 2q31). SPD2 and SPD3 are mapped on
chromosome 22 and 14, respectively. (Malik & Grzeschik 2008)
In humans, expansions of a polyalanine stretch in the amino-terminal region of
HOXD13 were revealed to cause synpolydactyly. (Muragaki et al. 1996) The polyalanine
expansion was found to cause misfolding, degradation and cytoplasmic aggregation of
the mutant proteins. (Albrecht et al. 2004) Synpolydactyly phenotypes were
discovered to correlate with size of expansions in HOXD13 polyalanine tract (Goodman
et al. 1997). The polyalanine expansion itself is thought to result from unequal
HOX GENES
14
crossing-over of HOXD13. (Warren 1997)
A similar mutation was found in mice. The phenotype of the mouse mutant
synpolydactyly homolog (spdh) corresponds to the human phenotype with polydactyly,
syndactyly and brachydactyly and is also caused by a polyalanine expansion in the
HOXD13 gene. (Albrecht et al. 2002) In these mice, supernumerary digits were shown
to be induced by mutant HOXD13 directly and indirectly, via a decrease of retinoic
acid. Retinoic acid was demonstrated to have an antichondrogenic effect on
mesenchymal cells. (Kuss et al. 2009)
Homozygous mice with a targeted deletion of HOXD11-HOXD13 exhibit several defects
in their distal limbs which are similar to human synpolydactyly. (Zakany & Duboule
1996)
Missense mutations of HOXD13 were also revealed to be associated with
brachydactyly, partially in combination with syndactyly. (Johnson et al. 2003; Zhao et
al. 2007) Furthermore, HOXD13 is suggested to play a role in foot malformations such
as the congenital clubfoot, also known as congenital talipes equinovarus (CTEV).
(Cao et al. 2009; L. L. Wang et al. 2008)
Besides their involvement in limb formation, paralogs HOXA13 and HOXD13 control
development of the terminal parts of the urogenital and digestive tracts. Mice lacking
these genes, for example, exhibit hypogenetic male accessory sex glands,
malpositioning of the vaginal, urethral and anal openings, anomalies of the rectum and
defective morphogenesis of the anal sphincter. (Kondo et al. 1996; Warot et al. 1997)
Specific HOXD13 mutations are linked with both synpolydactyly and hypospadias.
(Tuzel et al. 2007)
A certain deletion of HOXD13 was linked to VACTERL syndrome which is characterized
by an association of multiple malformations. Patients exhibit vertebral defects, anal
atresia, cardiac anomalies, tracheoesophageal fistula with esophageal atresia, renal
dysplasia and limb lesions. (Garcia-Barcelo et al. 2008)
HOXD13 expression was examined across 79 different tumor tissue types. Tissues of
different origins such as adrenal gland, brain, gynecologic organs, digestive tract,
lymphoid tissue and skin were tested. HOXD13 expression varied quantitatively and
qualitatively between normal tissue and tumor types of the same organ. Majority of
cancers showed an increase of HOXD13 expression. Within particular tissue groups,
INTRODUCTION
15
HOXD13 expression varied between distinct histological subtypes. For example,
invasive lobular and tubular carcinomas of the breast showed different HOXD13
expression than mucinous, medullar and ductal invasive carcinomas. Pancreas and
stomach tumor subtypes represent an exception because they displayed negative
HOXD13 expression. In pancreatic cancer, HOXD13 expression was associated with
better prognosis and higher 12-month survival rates. (Cantile et al. 2009)
Certain gene fusions of HOXD13 to NUP98 were detected in myelodysplastic
syndromes and acute myelogenous leukemia. (Raza-Egilmez et al. 1998; Slape et al.
2008) The fusion gene was discovered to cause ineffective hematopoiesis. On the one
hand it increases self-renewal of hematopoietic stem or progenitor cells; on the other
hand, it inhibits differentiation of precursors and increases apoptosis in other lineages
in the bone marrow. (Gough et al. 2011; Slape et al. 2007) NUP98 fusion oncoproteins
were revealed to lead to mitotic spindle defects and chromosome missegregation.
(Salsi et al. 2014) In mice NUP98-HOXD13 fusion also leads to myelodysplastic
syndrome progressing to acute leukemia. (Lin et al. 2005) Impaired DNA break and
repair mechanisms were detected in NUP98-HOXD13 transgenic mice. (Puthiyaveetil et
al. 2013)
1.2 Skeletogenesis and bone formation
The skeleton is composed of cartilage and bone and generally formed in two different
phases. During the first phase which is called skeletal patterning, mesenchymal cells
migrate to putative sites of skeletogenesis, aggregate and form condensations. These
condensations assume the shape of the future skeletal element. Cells of mesenchymal
condensations produce an extracellular matrix which is abundant in type I collagen.
The second phase comprises differentiation of the three specific cell types of skeleton,
chondrocyte in cartilage, osteoclast and osteoblast in bone. (Karsenty et al. 2009;
Lefebvre & Smits 2005)
Bone formation in mammals occurs via two different mechanisms in embryonic
development: intramembranous ossification and endochondral ossification. In process
of intramembranous ossification, cells of mesenchymal condensations directly
differentiate into osteoblasts and osteocytes. Osteoblasts produce bone extracellular
matrix (ECM) and are also responsible for mineralization of this ECM; thus they are
SKELETOGENESIS AND BONE FORMATION
16
considered as bone-forming cells. Mechanism of intramembranous ossification,
however, applies to few bones in mammal skeleton only, more precisely only to the
clavicle and parts of the skull. (Ducy et al. 1997; Karsenty et al. 2009) After
commitment into osteoblast lineage, skeletal precursor cells differentiate towards
osteoprogenitor cells, pre-osteoblasts, osteoblasts and finally osteocytes. Each stage of
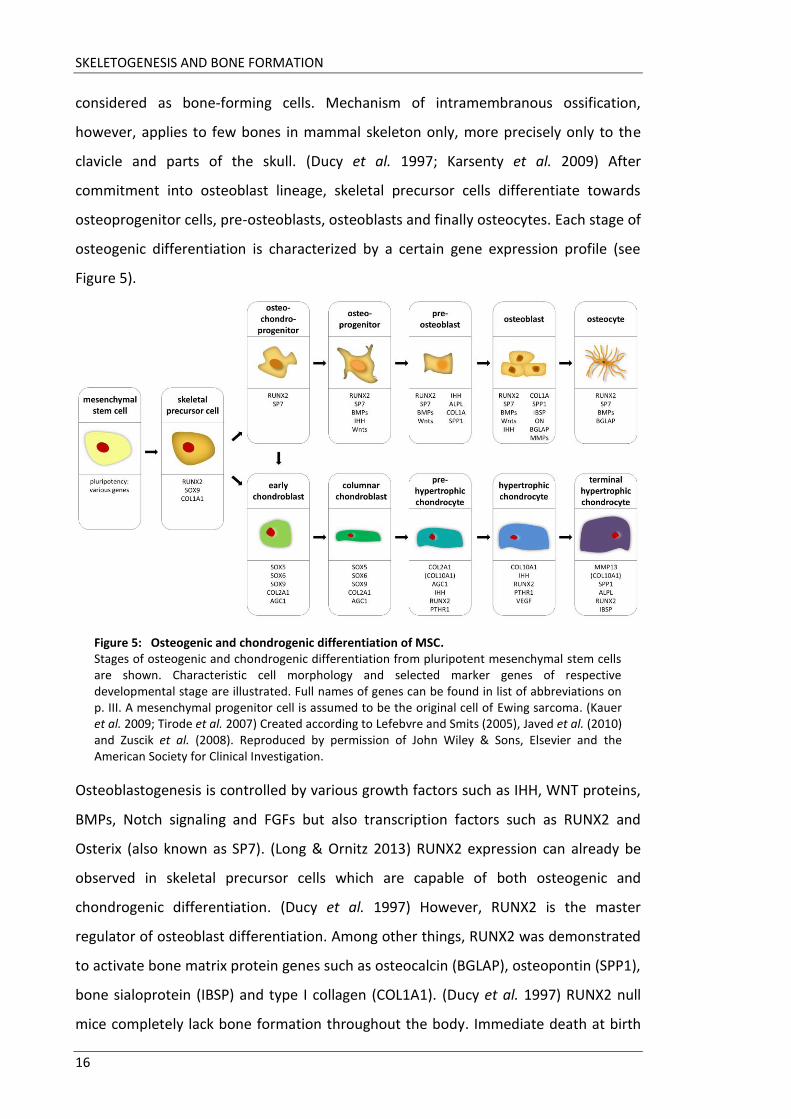
osteogenic differentiation is characterized by a certain gene expression profile (see
Figure 5).
Figure 5: Osteogenic and chondrogenic differentiation of MSC. Stages of osteogenic and chondrogenic differentiation from pluripotent mesenchymal stem cells are shown. Characteristic cell morphology and selected marker genes of respective developmental stage are illustrated. Full names of genes can be found in list of abbreviations on p. III. A mesenchymal progenitor cell is assumed to be the original cell of Ewing sarcoma. (Kauer et al. 2009; Tirode et al. 2007) Created according to Lefebvre and Smits (2005), Javed et al. (2010) and Zuscik et al. (2008). Reproduced by permission of John Wiley & Sons, Elsevier and the American Society for Clinical Investigation.
Osteoblastogenesis is controlled by various growth factors such as IHH, WNT proteins,
BMPs, Notch signaling and FGFs but also transcription factors such as RUNX2 and
Osterix (also known as SP7). (Long & Ornitz 2013) RUNX2 expression can already be
observed in skeletal precursor cells which are capable of both osteogenic and
chondrogenic differentiation. (Ducy et al. 1997) However, RUNX2 is the master
regulator of osteoblast differentiation. Among other things, RUNX2 was demonstrated
to activate bone matrix protein genes such as osteocalcin (BGLAP), osteopontin (SPP1),
bone sialoprotein (IBSP) and type I collagen (COL1A1). (Ducy et al. 1997) RUNX2 null
mice completely lack bone formation throughout the body. Immediate death at birth
INTRODUCTION
17
due to respiratory failure is probably caused by absent ossification of the ribs. (Komori
et al. 1997) RUNX2 haploinsufficiency is associated with cleidocranial dysplasia, an
autosomal dominant inherited syndrome which is, among other things, characterized
by failed closure of the fontanelles, abortive clavicles and short stature. Both
intramembranous and endochondral bone formation seem to be defective. (Mundlos
et al. 1997) Heterozygous mice exhibit similar skeletal abnormalities. (Otto et al. 1997)
In process of endochondral ossification, an intermediate template made of cartilage is
formed. The cartilaginous template prefigures the future skeletal element and is then
gradually replaced by bone tissue. This mechanism applies to most skeletal elements
of the body, especially long bones. (Karsenty et al. 2009; Wuelling & Vortkamp 2011)
For endochondral ossification, cells of mesenchymal condensation mature into
chondrocytes. Immature chondrocytes produce an ECM which is rich in type II, type IX
and XI collagen, glycoproteins and proteoglycans such as aggrecan. (Karsenty et al.
2009; Long & Ornitz 2013) In central diaphyseal regions of long bones cells rapidly
undergo differentiation process towards pre-hypertrophy, hypertrophy and terminal
maturation. Pre-hypertrophic and hypertrophic chondrocytes produce collagen type X
in abundance before they die by apoptosis. (Karsenty et al. 2009; Lefebvre & Smits
2005)
In the meanwhile, peripheral cells of mesenchymal condensations keep producing
type I collagen and become fibroblast-like cells. Those arrange in a layer and surround
the cartilage elements (perichondrium). During hypertrophic maturation of
chondrocytes, inner cells of the perichondrium start expressing RUNX2, the master
gene of osteoblastogenesis which was already mentioned earlier. Those cells
differentiate into osteoblasts and form the periosteum. (Ducy et al. 1997; Karsenty et
al. 2009; Wuelling & Vortkamp 2011) Periosteal osteoblasts produce bone matrix of
the bone collar. This structure prefigures the future cortical bone, in other words the
outer bone layer. Apoptotic terminal hypertrophic chondrocytes have generated a
type X collagen-rich ECM which promotes vascular invasion from the bone collar.
(Karsenty et al. 2009) Cartilage is usually avascular. Coupled with terminal maturation
of chondrocytes, however, blood vessel invasion from the bone collar brings cells of
the osteoblast lineage and osteoclasts into the middle of the hypertrophic cartilage of
the central diaphysis. Osteoblasts establish primary ossification centers. They generate
SKELETOGENESIS AND BONE FORMATION
18
trabecular bone and replace the cartilaginous ECM with osseous, type I collagen-rich
ECM. This ossification occurs centrifugally, i.e. ossification starts in the center and
spreads to the periphery. (Karsenty et al. 2009; Lefebvre & Smits 2005; Long & Ornitz
2013) Osteoclasts, the second bone-specific cell type, are multinuclear cells which
derive from the same hematopoietic progenitors in the bone marrow like monocytes
and macrophages by fusion. Being responsible for bone resorption and remodeling,
they control bone integrity and calcium metabolism. (Bar-Shavit 2007)
Early chondroblasts at each end of a long bone flatten, organize into columns and thus,
form the growth plates. After a phase of proliferation, they mature into hypertrophic
and terminal hypertrophic chondrocytes in the growth plate as well. Systematic
maturation of chondrocytes in the growth plate generates zones of proliferation,
hypertrophy and bone formation which continuously proceed from epiphyseal to
diaphyseal. This is critical for longitudinal growth. (Karsenty et al. 2009; Lefebvre &
Smits 2005; Long & Ornitz 2013) In contrast to primary ossification centers in
embryonic development, secondary ossification centers in the epiphysis don’t develop
until days or weeks after birth. (Lefebvre & Smits 2005)
Formation of respective chondrocyte populations is, just as osteogenic differentiation,
controlled by multiple pathways. Regulation mechanisms involve growth factors such
as IHH, PTHrP, BMPs, FGFs, WNT proteins and NOTCH. (Long & Ornitz 2013; Wuelling &
Vortkamp 2011) Analogically, individual steps of chondrogenic differentiation are also
characterized by specific gene expression profiles (see Figure 5).
Especially SOX9 expression is critical for commitment and differentiation of
mesenchymal cells toward the chondrogenic lineage. SOX9 expression can already be
observed in the common skeletal precursor cell of osteogenic and chondrogenic
differentiation. (Akiyama et al. 2002; Akiyama et al. 2005) However, sustained SOX9
expression and co-expression of two additional SOX family members, SOX5 and SOX6,
are crucial for initiation and early stages of chondrocyte maturation. (Lefebvre et al.
similar phenotypes. Animals suffer from severe generalized chondrodysplasia and die
early. Heterozygous mutations of SOX9 are associated with campomelic dysplasia, a
skeletal malformation syndrome with congenital bowing and angulation of long bones
and defective cartilage formation. SOX5 and SOX6 single null mutants have limited
INTRODUCTION
19
skeletal abnormalities. (Akiyama et al. 2002; Foster et al. 1994; Smits et al. 2001) SOX5,
SOX6 and SOX9 were shown to activate markers for early chondrogenesis (COL2A1 and
AGC) and suppress markers for hypertrophic chondrocytes and osteoblasts at the same
time. (Lefebvre et al. 2001; Lefebvre & Smits 2005) Expression of the three SOX genes
decreases when cells undergo further differentiation. Pre-hypertrophic and
hypertrophic chondrocytes express RUNX2 and COL10A1 among others. (Lefebvre &
Smits 2005) RUNX2 maintains a major role in terminal chondrocyte differentiation. It
was revealed to control COL10A1 expression in hypertrophic chondrocytes and the
expression of SPP1, IBSP and MMP13 in terminal hypertrophic chondrocytes. (Komori
2010) RUNX2-deficient mice also exhibit impaired chondrocyte differentiation besides
their lack of bone formation. (Komori et al. 1997)
Majority of bones in skeleton is formed via endochondral bone formation. This
basically means that chondrogenesis is the first and most important step of bone
formation in mammals, not osteogenesis. (Karsenty et al. 2009) Recently, hypertrophic
chondrocytes were even reported to be competent to transdifferentiate into
osteoblasts during endochondral bone formation. (Yang et al. 2014; Zhou et al. 2014)
Involvement of HOX genes in limb formation was already mentioned in 1.1.
Interestingly, it has almost been 20 years that HOXD gene expression was revealed to
be required for mesenchymal condensation and chondrogenic differentiation. (Jung &
Tsonis 1998)
Besides its involvement in initial cartilage condensation, posterior HOXD genes were
also demonstrated to affect later growth phase of bones. (Goff & Tabin 1997)
1.3 Bone morphogenetic proteins and the TGF β pathway
Bone morphogenetic proteins (BMPs) belong to the transforming growth factor β
(TGFβ) superfamily of proteins, a large family of cytokines which cause multiple
biological effects in multiple different cell types, such as cell growth, differentiation,
migration, adhesion or apoptosis. The family comprises 42 members in the human
genome; the prototype is transforming growth factor β. Other members are nodals,
activins, myostatins and anti-Muellerian hormone (AMH). (Massague et al. 2005)
The active form of a TGFβ ligand is a homodimer. In BMPs monomers are linked by a
disulfide bridge. More than 15 BMPs have been identified in mammals, they can be
BONE MORPHOGENETIC PROTEINS AND THE TGF Β PATHWAY
20
further classified in several subgroups by their amino acid sequence similarity: BMP
2/4 group, BMP 5/6/7/8 group which is also called OP1 group (osteogenic protein 1
group), GDF (growth and differentiation factor) 5/6/7 group and BMP 9/10 group.
Most of these proteins induce formation of bone and cartilage tissues in vivo, except
the members of the GDF group which induce cartilage and tendon-like, but no
bone-like tissues. (Kawabata et al. 1998; Miyazono et al. 2010) Analysis of osteogenic
activity of 14 different BMPs and GDFs resulted in a hierarchical model in which
especially BMP2, BMP6 and BMP9 showed biggest potential in induction of osteoblast
differentiation of mesenchymal stem cells, most BMPs, however, were able to
stimulate osteogenesis in mature osteoblasts. Most studies on BMPs and their
biological activities were carried out using homodimeric proteins, heterodimeric
Figure 6: BMP signaling through SMAD proteins in bone formation. Homodimeric ligand (blue triangle) binds to receptor with serine/threonine kinase activity. After activation receptor phosphorylates R-SMADs, those in turn form a complex with SMAD4. Process is inhibited by I-SMADs. SMAD-complex transfers into the nucleus. Together with cofactors and DNA-binding proteins, the complex functions as a transcription factor and activates various target genes, RUNX2 being one of them. RUNX2 in turn induces mesenchymal stem cells (MSC) to commit into osteogenic lineage and promotes the final step in chondrogenic differentiation. Furthermore RUNX2 is known to interact with SMAD proteins. (Ducy et al. 1997; Komori 2010; Zhang et al. 2000) Created in the style of Chen et al. (2012) and Miyazono et al. (2005).
INTRODUCTION
21
proteins, however, such as BMP2/BMP4 showed even enhanced activities than
corresponding homodimers. (Aono et al. 1995; Cheng et al. 2003; Israel et al. 1996;
Kawabata et al. 1998)
TGFβ signaling initiates when a TGFβ ligand binds to specific cell membrane-associated
receptors with serine/threonine kinase activity. There are two types of these
receptors, type I and type II, which are structurally very similar. So far, seven type I and
five type II receptors have been identified in mammals. (Heldin et al. 1997; Miyazono
et al. 2010)
After receptor activation, signals are transduced via SMAD and non-SMAD signaling
pathways. Receptor I kinase propagates the signal by phosphorylating SMAD proteins.
There are three functional classes of SMAD proteins: receptor-regulated SMADs
(R-SMAD), Co-mediator SMAD (in our case SMAD4) and inhibitory SMADs (I-SMADs).
R-SMADs, which SMADs 1, 2, 3, 5 and 8 belong to, are directly activated through
phosphorylation by receptor I kinase. SMADs 1, 5 and 8 are principally substrates for
BMP and anti-Muellerian receptors, SMADs 2 and 3 for TGFβ, activin and nodal
receptors. R-SMADs form complexes with Co-SMAD SMAD4 which transfer into the
nucleus where they, along with cofactors, control transcription of various target genes.
These target genes involve, among others, transcription factors important for bone
formation such as RUNX2 and collagens. I-SMADs, i.e. SMAD 6 and 7, inhibit TGFβ
signaling. On the one hand they compete with R-SMADs for binding sites; on the other
hand they target receptors and cause their degradation. (Chen et al. 2012; Lee et al.
2000; Massague et al. 2005; Shi & Massague 2003; Volk et al. 1998)
BMP signaling pathway is also controlled via other inhibitory mechanisms. Extracellular
antagonists such as noggin bind BMPs and prevent them from binding to the receptor.
Transmembrane proteins such as BAMBI associate with type I and type II receptors and
inhibit BMP signaling at the cell membrane level. SMURFs (SMAD ubiquitin regulatory
factors) initiate ubiquitination and degradation of R-SMADs and inhibit type I
receptors. (Tsumaki & Yoshikawa 2005)
Non-SMAD signaling pathways involve MAPK (mitogen-activated protein kinase)
cascades. In mammals, the MAPK family comprises ERK (extracellular signal-regulated
kinase), p38 and JNK (c-Jun NH2-terminal kinase). Each signaling axis consists of at least
three components: a MAPK is phosphorylated by a MAP2K (MAPK kinase) which was
EWING SARCOMA
22
phosphorylated by a MAP3K (MAPK kinase kinase) before. Activated MAP kinases, in
turn, phosphorylate various proteins, for example transcription factors. That way, they
influence multiple cellular processes such as proliferation, differentiation, migration,
inflammatory responses and cell death. (Chen et al. 2012; Kim & Choi 2010)
Both, SMAD and non-SMAD pathway were identified to converge at the RUNX2 gene
to control mesenchymal precursor cell differentiation. (Chen et al. 2012; Lee et al.
2002) RUNX2 was already mentioned in chapter 1.2. It is not only the master regulator
of osteoblast differentiation but also maintains a major role in terminal chondrocyte
differentiation. (Ducy et al. 1997; Komori 2010) Furthermore, RUNX2 is not only a
common BMP target but also an important cofactor in BMP signaling. It was identified
to physically interact with R-SMADs and thus cooperatively induce target genes. (Lee et
al. 2000; Zhang et al. 2000) Other common targets of BMP signaling involve genes
which encode type I and type X collagen, in detail COL1A1 and COL10A1. (Ducy et al.
1997; Lee et al. 2000; Volk et al. 1998)
1.4 Ewing sarcoma
Ewing sarcoma is the second most frequent primary bone tumor. (Bernstein et al.
2006) In comparison to other pediatric malignancies, however, Ewing sarcomas are
rather rare. According to numbers of the German Childhood Cancer Registry, the three
most frequent malignancies in children under 18 years, leukemias, CNS tumors and
lymphomas (in this order) constitute more than two thirds of pediatric malignomas.
Malignant bone tumors represent only a small number of 5%. In children, malignant
bone tumors basically comprise osteosarcomas and Ewing sarcomas; chondrosarcomas
and other bone tumors are considered as rarities at this age. (Deutsches
Kinderkrebsregister, p. 4; Niemeyer & Rössler 2013) Most common age of diagnosis is
the second decade of life with peaks at 15 years of age. 20-30% of patients,
respectively, are younger than 10 or older than 20 years at diagnosis. Ewing sarcoma in
children younger than 5 years is very uncommon. In general, boys are afflicted a little
more often than girls (sex ratio male/female: 1.3). (Bernstein et al. 2006; Deutsches
Kinderkrebsregister, p. 48) Interestingly, Caucasians are much more often affected
than Asians and Africans and prevalences, age at time of diagnosis, tumor
characteristics and overall survival differ depending on ethnic background. (Worch et
INTRODUCTION
23
al. 2010)
Classic Ewing sarcoma was first described as “Diffuse endothelioma of bone” by James
Ewing in 1921. (Ewing 1972) These days the term “Ewing sarcoma” represents a whole
family of tumors with same histological appearance and certain immunohistochemical
features. (Bernstein et al. 2006) According to their degree of neuroglial differentiation,
members of the Ewing family of tumors (EFT) are further classified. Classical Ewing
sarcoma, for example, is poorly differentiated while peripheral neuroectodermal
tumors (pPNETs) are more mature. Ewing sarcoma of the chest wall is also called
Askin’s tumor. (Bernstein et al. 2006; Potratz et al. 2012) James Ewing originally
described the tumor as “endothelioma”, a mesenchymal tumor. (Ewing 1972; Staege
et al. 2004) Today, Ewing sarcoma is assumed to originate from a primitive neural
crest-derived progenitor at the transition to mesenchymal and endothelial
differentiation because induction of EWS/FLI1 in mesenchymal progenitor cells caused
a transformation and generated Ewing sarcoma-like tumors. (Riggi et al. 2005; Staege
et al. 2004)
Tumors consist of small round blue cells with large nuclei and narrow rims of
cytoplasm. Cells strongly express cell-surface glycoprotein CD99, also known as MIC2.
More differentiated tumors (pPNETs) may express markers of neural differentiation
such as S100, NSE and LEU7. Immunoreactivity for vimentin and cytokeratins is
possible as well. However, microscopical and immunophenotypic characteristics of
Ewing sarcoma partially coincide with other small round cell tumors of the childhood
such as NHL, rhabdomyosarcoma, neuroblastoma, medulloblastoma and ALL.
Therefore, further immunohistochemical investigations are required. Molecular
genetic studies such as FISH and RT-PCR allow for definitive diagnosis since members
of the Ewing family of tumors are characterized by certain chromosome translocations.
(Bernstein et al. 2006; Dockhorn-Dworniczak et al. 1994) Chromosome translocations
in Ewing sarcomas were already described in the early 1980s. (Turc-Carel et al. 1984)
Soon reciprocal chromosomal translocation t (11; 22), which involves EWS (Ewing
sarcoma gene) and FLI1 (Friend leukemia virus integration site 1), was identified to be
responsible for oncogenic gene fusion in Ewing sarcoma. Resulting fusion protein
EWS-FLI1 alone was revealed to transform mesenchymal progenitor cells and thus, to
induce Ewing sarcoma. There are two different breakpoint regions called EWSR1 and
EWING SARCOMA
24
EWSR2: EWSR1 relates to the breakpoint region of the EWS gene, EWSR2 relates to
different breakpoint regions of the FLI1 gene. EWSR1 can be fused to two different
FLI1 exons. Resulting gene fusions were considered as type 1 and type 2 translocations
and can be observed in more than 85% of all cases. Since then, other fusion partners of
EWS were detected. Just as FLI1, they belong to the ETS family of transcription factors.
In 5% of cases EWS is fused to ERG (chromosome 21). Very infrequent fusion partners
involve ETV1, ETV4 or FEV. Compared to EWS/FLI1, all these translocations are rather
rare though. (Bernstein et al. 2006; Delattre et al. 1994; Delattre et al. 1992; Riggi et al.
2005; Sankar & Lessnick 2011)
About one in two Ewing sarcomas is located in long bones of limbs, preferably in bones
of the lower limb. Around 20% of Ewing sarcomas arise from the femur, another 18%
from tibia or fibula. In these cases, proximal diaphyseal parts of the bones are
predominantly affected. In another 40% of cases Ewing sarcoma is located in flat bones
of the trunk such as the pelvis and chest wall. Affection of the spine and upper limb is
possible but less frequent. Affection of the hand, foot or skull is rather rare. Generally,
Ewing sarcoma can arise from any bone of the body. (Bernstein et al. 2006;
Freyschmidt et al. 2010) In a smaller amount of cases Ewing sarcoma emerges as a soft
tissue tumor beyond the skeletal system. Interestingly, prevalences of soft tissue
tumors differ depending on ethnic background; they range from 20% in Caucasians to
around 40% in Asians and African Americans, respectively. (Worch et al. 2010)
Patients with Ewing sarcoma may report on intermittent pain of the affected bone in
the beginning, especially nocturnal pain is very common. Within weeks or months,
afflictions persist and increase in intensity, a swelling of the affected area may emerge
due to tumor growth. At this point of time patients often develop accompanying
symptoms which remind of a septic clinical picture. Leukocytosis, fever, elevated blood
sedimentation rate as well as anemia can be observed. Elevations of levels of serum
lactate dehydrogenase correlate with tumor burden. These symptoms as well as loss of
weight often indicate an advanced tumor stage. Since most patients are in their second
decade of life at time of diagnosis, intermittent pain of the bone at early stage of
disease is sometimes misinterpreted as pain due to “bone growth” or sports injury.
Accompanying symptoms such as fever and fatigue may also remind of osteomyelitis
at first. As a result, the malignant bone tumor might unfortunately have reached
INTRODUCTION
25
advanced stages at time of diagnosis. Ewing sarcoma mainly metastasizes
hematogenously into lung, bone and bone marrow. Lymph node metastases or
metastases to other sites such as liver or central nervous system can be found but are
rather rare. In about 25% of patients, primary metastases can already be detected at
time of diagnosis. (Bernstein et al. 2006; Freyschmidt et al. 2010)
Specific symptoms occur according to localization of primary tumor or metastases. A
tumor of the spine can cause paraplegia whereas a tumor of the ribs and pulmonary
metastases might trigger respiratory ailments. Depending on localization of tumor
bulk, urinary retention and intestinal obstruction are possible. In case of pelvic or
thoracic tumor localization patients may develop symptoms only at a very late stage.
Differential diagnoses comprise a wide range of diseases. Osteomyelitis and other
small round cell tumors, both of which were already mentioned earlier, Langerhans
cell histiocytosis, juvenile bone cyst, as well as other malignant bone tumors or
metastases have to be excluded. There is no blood or urine test which can prove Ewing
sarcoma. It may be helpful, however, to determine serum and urine catecholamine
levels to exclude neuroblastoma. An x-ray in two planes may show the typical
diaphyseal location of Ewing sarcoma (unlike osteosarcoma) and certain indications of
malignancy. The latter involve pathologic fractures, osteolysis as well as periosteal
reactions such as detachment, a lamellar onion skin-like reaction or formation of
spiculae. These radiological features are not specific for Ewing sarcoma though. Cases
were described in which osteomyelitis looked quite similar in the x-ray. Indeed,
magnetic resonance imaging allows most precise characterization of the tumor
regarding extent and neighboring structures, it doesn’t give a hundred percent proof
either. Definitive diagnosis can be made by biopsy only. Fine needle aspiration biopsy
and core needle biopsy can be considered; diagnostic gold standard, however, is the
open biopsy which provides more material for further investigations.
Immunohistochemistry suggests the diagnosis of a Ewing sarcoma if tumor cells are
CD99-positive and negative for markers of other small round cell tumors such as CD49
(lymphoid), myogenin/desmin/actin (rhabdomyosarcoma) and neurofilament protein
(neuroblastoma). Diagnosis is ultimately proven by detection of the typical Ewing
translocation mentioned earlier. (Bernstein et al. 2006; Freyschmidt et al. 2010)
Once diagnose of Ewing sarcoma is secured, patients should be staged for metastases,
EWING SARCOMA
26
which can be detected in a quarter of patients. As already mentioned, most common
sites are lung, bone and bone marrow. Thoracic CT, bone marrow biopsy and aspirates
as well as whole body 99m-technetium bone scan are appropriate investigations.
FDG-PET can be indicated if available. Suspicious lesions at other sites have to be
further examined. (Bernstein et al. 2006)
Ewing sarcoma therapy includes combination chemotherapy, surgery and
radiotherapy. Current therapeutic regimens intend induction chemotherapy before
appropriate tumor resection by orthopedic surgery, either alone or combined with
radiotherapy. In general, R0 resection with negative margins should be aimed at. If
possible, limbs and joints should be preserved, otherwise reconstruction by means of
allografts or endoprosthetics is required. Since Ewing sarcoma is radiosensitive in
contrast to osteosarcoma, radiotherapy should be considered in case of inoperability.
Local therapy is followed by adjuvant chemotherapy. Applied chemotherapeutics
involve vincristine, doxorubicin, cyclophosphamide, etoposide, ifosfamide and
occasionally actinomycin D and topotecan. High risk patients, i.e. those with primary
metastasis at diagnosis or with recurrent disease, receive remission induction
chemotherapy and local treatment before they undergo myeloablative therapy.
(Bernstein et al. 2006; Burdach & Jurgens 2002; Burdach et al. 2000; Potratz et al.
2012) Myeloablative therapy involves high-dose chemotherapy with autologous
hematopoietic stem cell rescue as well as irradiation of metastases, for example total
bone marrow irradiation or irradiation of the lung. Melphalan, etoposide and
carboplatin are examples of applied high-dose chemotherapeutics. (Burdach & Jurgens
2002; Burdach et al. 1993; Burdach et al. 1996)
Several prognostic factors were revealed to be unfavorable for patients with Ewing
sarcoma. Those involve age > 10 years, tumor size > 200 ml and pelvic tumor location
in general. Moreover, prognosis differs depending on exact type of translocation and
potential cytogenetic changes. (Bernstein et al. 2006) Presence of metastasis,
however, is the most unfavorable prognostic feature for patients and reduces survival
probabilities massively. In the 1980s, survival probability ten years after diagnosis
amounted to less than 55% in Germany. Since then numbers have been improving a
little; altogether, they are still frustrating though. These days, patients with localized
disease have survival rates between 65-70%. In case of metastasis, however, survival
INTRODUCTION
27
rates decrease severely and only amount to 28%. (Bernstein et al. 2006; Deutsches
Kinderkrebsregister, p. 48; Duchman et al. 2015) In contrast to this, survival probability
ten years after diagnosis of an acute lymphoid leukemia, the most frequent pediatric
malignoma, is more than 90%. (Deutsches Kinderkrebsregister, p. 15) Furthermore,
Ewing sarcoma patients with multifocal bone or bone marrow metastases were
revealed to have a poorer prognosis than patients with lung metastases and patients
with a relapse within 24 months were found to have a poorer prognosis than patients
with a relapse later than 24 months after diagnosis. (Burdach & Jurgens 2002)
Disappointing survival rates stress the necessity of alternate therapeutic approaches.
Especially metastatic and recurrent diseases are difficult to treat. In these cases,
chemotherapy options are limited depending on prior treatment and potential
impaired organ function (especially heart and kidney). A general relapse rate of 30% is
unacceptable as well. (Bernstein et al. 2006; Potratz et al. 2012) Furthermore, tumors
develop complex therapy resistance mechanisms. Chemotherapy-resistant cancer
stem cells may give rise to new populations of tumor cells. Other tumor cells may
induce drug-metabolizing enzymes or modulate signaling pathways. (Ahmed et al.
2014) Development of targeted therapies is necessary to improve survival rates.
Especially targeting fusion protein EWS-FLI1 which is only expressed in Ewing sarcoma
may be promising. Targeted therapies could also help to decrease the risk for
secondary complications due to sarcoma treatment in surviving patients, such as
cardiac and renal insufficiency or secondary malignancies. At least 1-2% of patients
develop an acute leukemia following sarcoma treatment. (Bernstein et al. 2006)
Several genes such as DKK2, STEAP1 and GPR64 were found to be highly upregulated in
Ewing sarcoma and associated with tumor growth, invasiveness and metastasis.
(Grunewald et al. 2012; Hauer et al. 2013; Richter et al. 2013) EZH2 was detected to
maintain an undifferentiated phenotype in Ewing sarcoma by blocking endothelial and
neuro-ectodermal differentiation. (Burdach et al. 2009; Richter et al. 2009)
Recently, transgenic allo-restricted CD8-positive T cells have been generated which
successfully recognize such tumor-associated target genes and thus, inhibit Ewing
sarcoma growth in vitro and in vivo. (Blaeschke et al. 2016; Schirmer et al. 2016; Thiel
et al. 2011)
It is essential for the development of targeted therapies to gain as much insight as
AIM OF THIS STUDY AND EXPERIMENTAL APPROACH
28
possible into pathogenesis of Ewing sarcoma.
1.5 Aim of this study and experimental approach
The aim of this doctoral thesis was to elucidate the role of HOX genes in pathogenesis
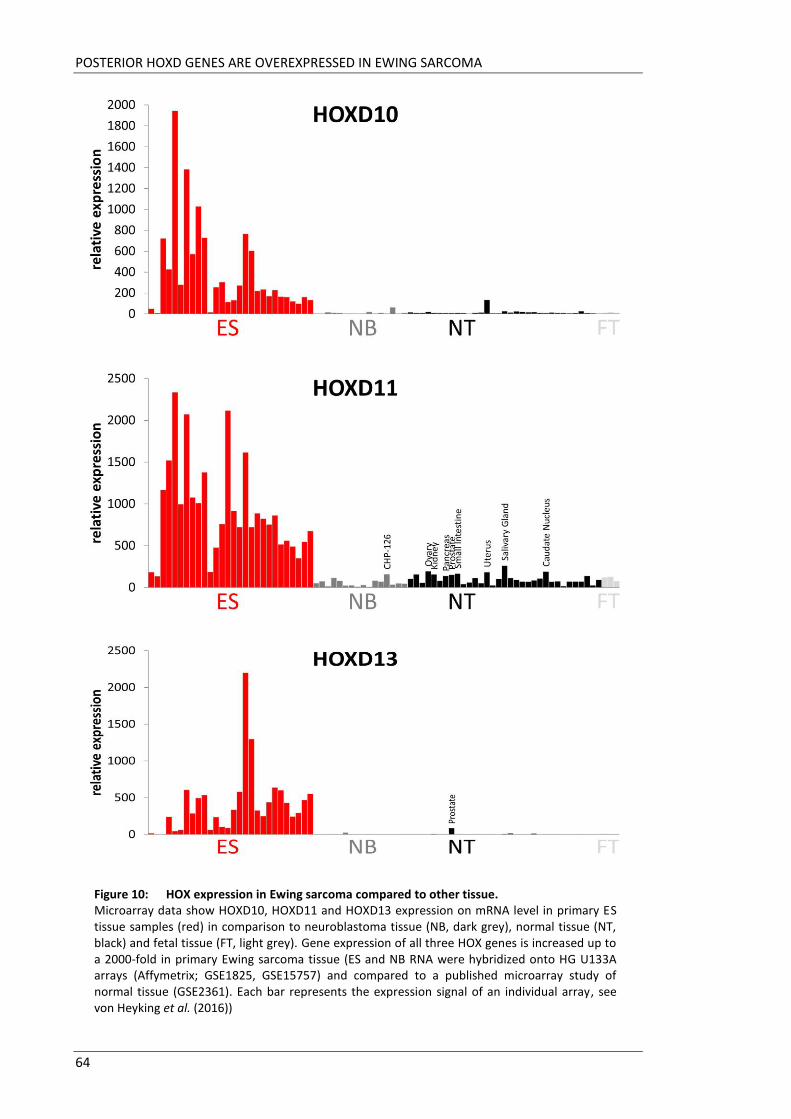
of Ewing sarcoma. Microarray data revealed HOXD10, HOXD11 and HOXD13 to be
highly upregulated in Ewing sarcoma tissues. Little is known about detailed functions
of HOX genes in malignant tumors though.
One of the first aims was to find a regulatory mechanism of HOX expression in Ewing
sarcoma. Ewing sarcomas are characterized by certain chromosome translocations
which usually result in oncogenic fusion of EWS to FLI1. Therefore, it was examined if
expression of HOXD10, HOXD11 and HOXD13 was dependent on EWS-FLI1. In
development, HOX genes are usually controlled by EZH2 which in turn is also highly
upregulated in Ewing sarcoma tissues. Thus, it was investigated if this regulation had
been conserved in this malignant tumor. For this purpose, EWS-FLI1 and EZH2 were
downregulated by siRNA interference in several Ewing sarcoma cell lines, respectively,
and expression of HOXD10, HOXD11 and HOXD13 was determined using qRT-PCR.
Next aim was to gain insight into the function of these three HOX genes in pathology of
Ewing sarcoma. For this purpose, each of these three HOX genes was downregulated
by siRNA interference in several Ewing cell lines. In two cell lines, SK-N-MC and A-673,
HOXD10, HOXD11 and HOXD13 were also constitutively suppressed by retroviral gene
transfer, respectively. Effect of HOX knockdown was examined in several in vitro assays
and extensive gene expression analysis. Among other things, proliferation, capability of
endothelial tube formation and anchorage-independent growth were assessed.
According to published literature, posterior HOXD genes are involved in cartilage and
bone formation. Since gene expression analysis identified several genes associated
with bone and cartilage formation to be downregulated after HOX knockdown,
particular attention was directed to the potential of Ewing sarcoma cells to
differentiate towards osteoblasts and chondrocytes depending on HOX expression. In
addition, microarray analysis was implemented to identify potential downstream HOX
targets.
Another doctoral student was intended for repeat experiments and confirmation of
results of in vitro experiments in an orthotopic bone xenotransplantation model.
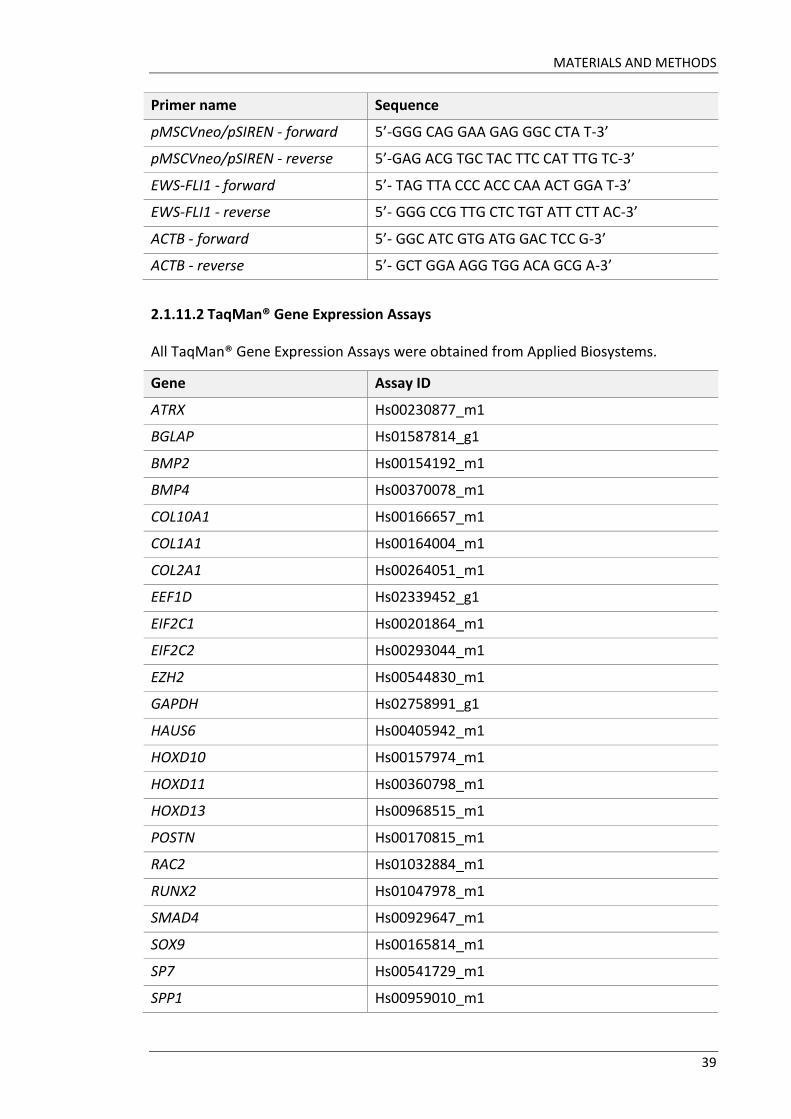
All TaqMan® Gene Expression Assays were obtained from Applied Biosystems.
Gene Assay ID
ATRX Hs00230877_m1
BGLAP Hs01587814_g1
BMP2 Hs00154192_m1
BMP4 Hs00370078_m1
COL10A1 Hs00166657_m1
COL1A1 Hs00164004_m1
COL2A1 Hs00264051_m1
EEF1D Hs02339452_g1
EIF2C1 Hs00201864_m1
EIF2C2 Hs00293044_m1
EZH2 Hs00544830_m1
GAPDH Hs02758991_g1
HAUS6 Hs00405942_m1
HOXD10 Hs00157974_m1
HOXD11 Hs00360798_m1
HOXD13 Hs00968515_m1
POSTN Hs00170815_m1
RAC2 Hs01032884_m1
RUNX2 Hs01047978_m1
SMAD4 Hs00929647_m1
SOX9 Hs00165814_m1
SP7 Hs00541729_m1
SPP1 Hs00959010_m1
40
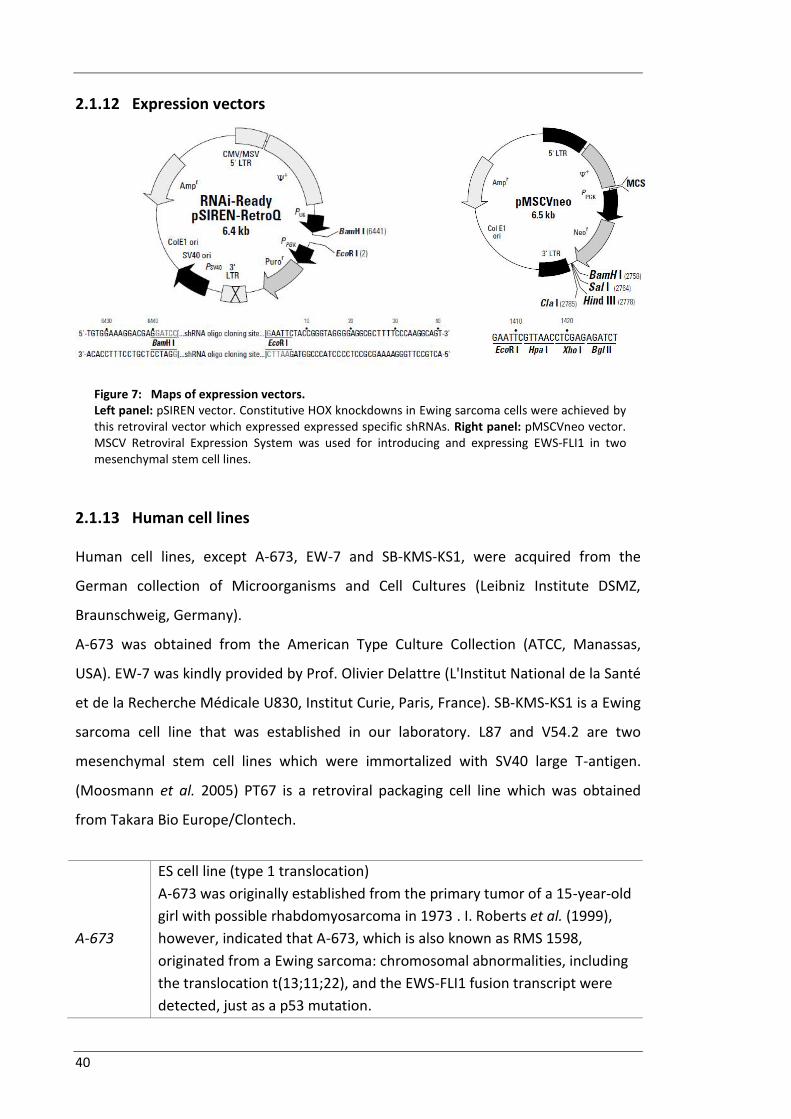
2.1.12 Expression vectors
Figure 7: Maps of expression vectors. Left panel: pSIREN vector. Constitutive HOX knockdowns in Ewing sarcoma cells were achieved by this retroviral vector which expressed expressed specific shRNAs. Right panel: pMSCVneo vector. MSCV Retroviral Expression System was used for introducing and expressing EWS-FLI1 in two mesenchymal stem cell lines.
2.1.13 Human cell lines
Human cell lines, except A-673, EW-7 and SB-KMS-KS1, were acquired from the
German collection of Microorganisms and Cell Cultures (Leibniz Institute DSMZ,
Braunschweig, Germany).
A-673 was obtained from the American Type Culture Collection (ATCC, Manassas,
USA). EW-7 was kindly provided by Prof. Olivier Delattre (L'Institut National de la Santé
et de la Recherche Médicale U830, Institut Curie, Paris, France). SB-KMS-KS1 is a Ewing
sarcoma cell line that was established in our laboratory. L87 and V54.2 are two
mesenchymal stem cell lines which were immortalized with SV40 large T-antigen.
(Moosmann et al. 2005) PT67 is a retroviral packaging cell line which was obtained
from Takara Bio Europe/Clontech.
A-673
ES cell line (type 1 translocation)
A-673 was originally established from the primary tumor of a 15-year-old
girl with possible rhabdomyosarcoma in 1973 . I. Roberts et al. (1999),
however, indicated that A-673, which is also known as RMS 1598,
originated from a Ewing sarcoma: chromosomal abnormalities, including
the translocation t(13;11;22), and the EWS-FLI1 fusion transcript were
detected, just as a p53 mutation.
MATERIALS AND METHODS
41
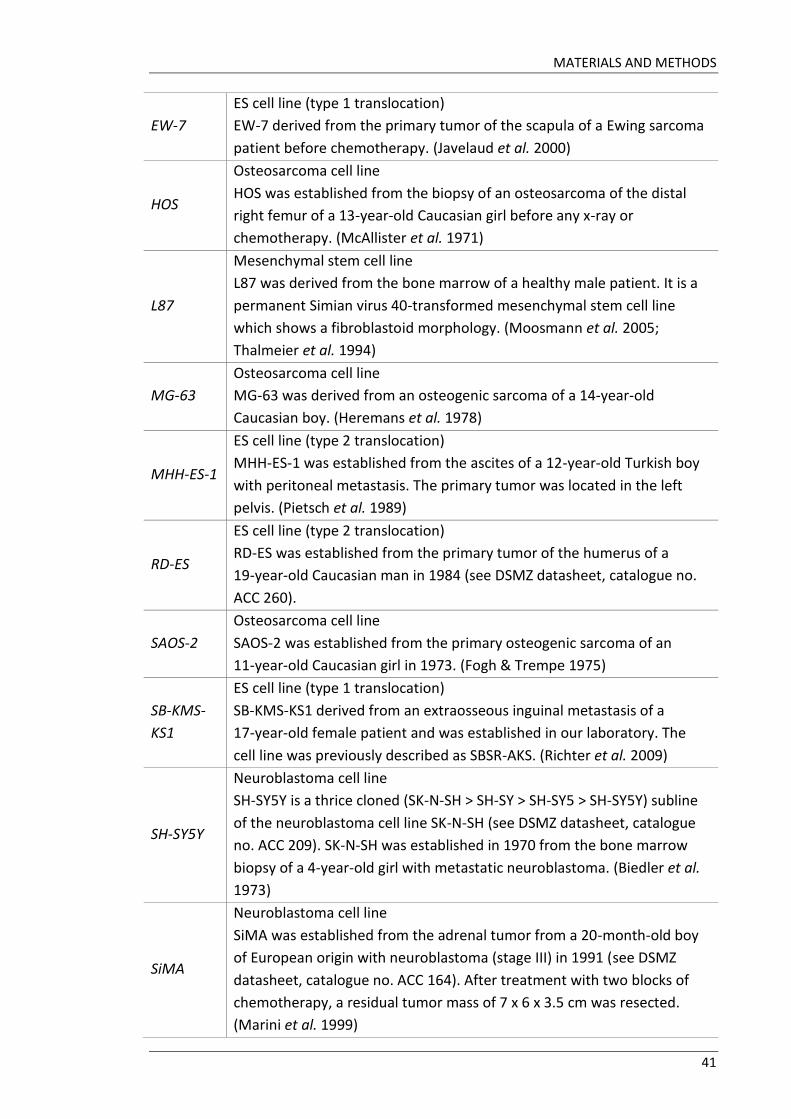
EW-7
ES cell line (type 1 translocation)
EW-7 derived from the primary tumor of the scapula of a Ewing sarcoma
patient before chemotherapy. (Javelaud et al. 2000)
HOS
Osteosarcoma cell line
HOS was established from the biopsy of an osteosarcoma of the distal
right femur of a 13-year-old Caucasian girl before any x-ray or
chemotherapy. (McAllister et al. 1971)
L87
Mesenchymal stem cell line
L87 was derived from the bone marrow of a healthy male patient. It is a
permanent Simian virus 40-transformed mesenchymal stem cell line
which shows a fibroblastoid morphology. (Moosmann et al. 2005;
Thalmeier et al. 1994)
MG-63
Osteosarcoma cell line
MG-63 was derived from an osteogenic sarcoma of a 14-year-old
Caucasian boy. (Heremans et al. 1978)
MHH-ES-1
ES cell line (type 2 translocation)
MHH-ES-1 was established from the ascites of a 12-year-old Turkish boy
with peritoneal metastasis. The primary tumor was located in the left
pelvis. (Pietsch et al. 1989)
RD-ES
ES cell line (type 2 translocation)
RD-ES was established from the primary tumor of the humerus of a
19-year-old Caucasian man in 1984 (see DSMZ datasheet, catalogue no.
ACC 260).
SAOS-2
Osteosarcoma cell line
SAOS-2 was established from the primary osteogenic sarcoma of an
11-year-old Caucasian girl in 1973. (Fogh & Trempe 1975)
SB-KMS-
KS1
ES cell line (type 1 translocation)
SB-KMS-KS1 derived from an extraosseous inguinal metastasis of a
17-year-old female patient and was established in our laboratory. The
cell line was previously described as SBSR-AKS. (Richter et al. 2009)
SH-SY5Y
Neuroblastoma cell line
SH-SY5Y is a thrice cloned (SK-N-SH > SH-SY > SH-SY5 > SH-SY5Y) subline
of the neuroblastoma cell line SK-N-SH (see DSMZ datasheet, catalogue
no. ACC 209). SK-N-SH was established in 1970 from the bone marrow
biopsy of a 4-year-old girl with metastatic neuroblastoma. (Biedler et al.
1973)
SiMA
Neuroblastoma cell line
SiMA was established from the adrenal tumor from a 20-month-old boy
of European origin with neuroblastoma (stage III) in 1991 (see DSMZ
datasheet, catalogue no. ACC 164). After treatment with two blocks of
chemotherapy, a residual tumor mass of 7 x 6 x 3.5 cm was resected.
(Marini et al. 1999)
42
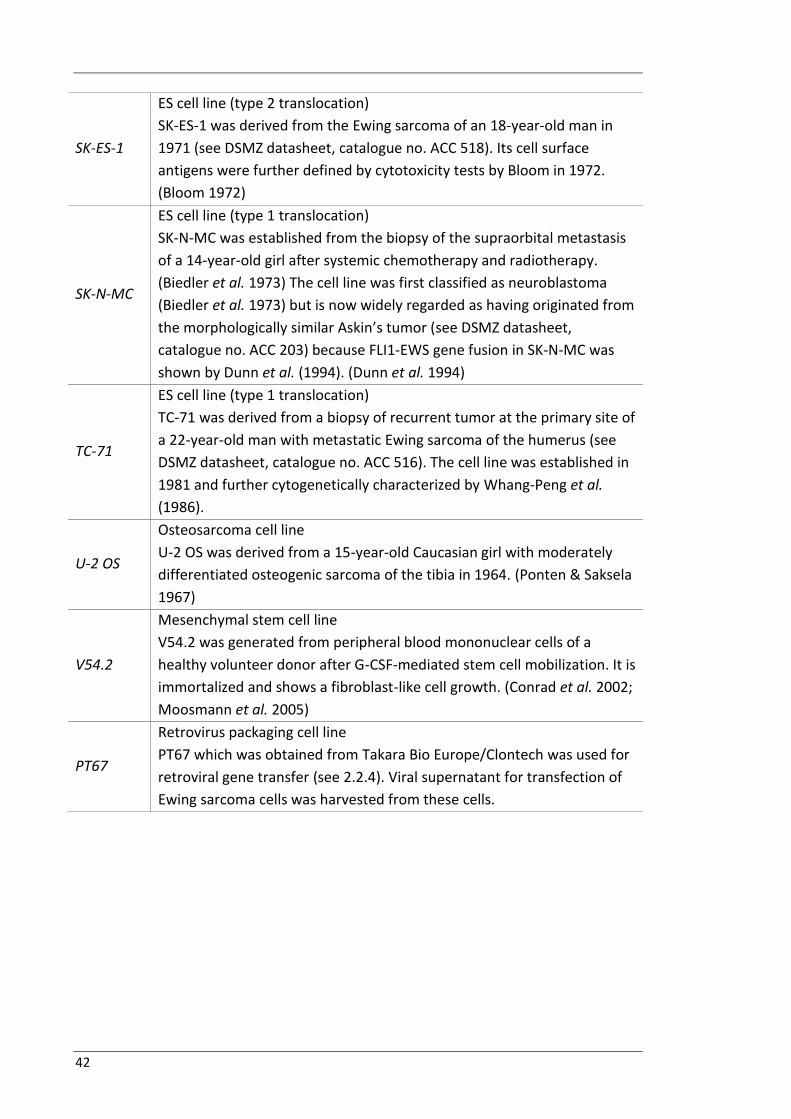
SK-ES-1
ES cell line (type 2 translocation)
SK-ES-1 was derived from the Ewing sarcoma of an 18-year-old man in
1971 (see DSMZ datasheet, catalogue no. ACC 518). Its cell surface
antigens were further defined by cytotoxicity tests by Bloom in 1972.
(Bloom 1972)
SK-N-MC
ES cell line (type 1 translocation)
SK-N-MC was established from the biopsy of the supraorbital metastasis
of a 14-year-old girl after systemic chemotherapy and radiotherapy.
(Biedler et al. 1973) The cell line was first classified as neuroblastoma
(Biedler et al. 1973) but is now widely regarded as having originated from
the morphologically similar Askin’s tumor (see DSMZ datasheet,
catalogue no. ACC 203) because FLI1-EWS gene fusion in SK-N-MC was
shown by Dunn et al. (1994). (Dunn et al. 1994)
TC-71
ES cell line (type 1 translocation)
TC-71 was derived from a biopsy of recurrent tumor at the primary site of
a 22-year-old man with metastatic Ewing sarcoma of the humerus (see
DSMZ datasheet, catalogue no. ACC 516). The cell line was established in
1981 and further cytogenetically characterized by Whang-Peng et al.
(1986).
U-2 OS
Osteosarcoma cell line
U-2 OS was derived from a 15-year-old Caucasian girl with moderately
differentiated osteogenic sarcoma of the tibia in 1964. (Ponten & Saksela
1967)
V54.2
Mesenchymal stem cell line
V54.2 was generated from peripheral blood mononuclear cells of a
healthy volunteer donor after G-CSF-mediated stem cell mobilization. It is
immortalized and shows a fibroblast-like cell growth. (Conrad et al. 2002;
Moosmann et al. 2005)
PT67
Retrovirus packaging cell line
PT67 which was obtained from Takara Bio Europe/Clontech was used for
retroviral gene transfer (see 2.2.4). Viral supernatant for transfection of
Ewing sarcoma cells was harvested from these cells.
MATERIALS AND METHODS
43
2.2 Methods
2.2.1 Cell culture
2.2.1.1 Culture of tumor cells
Ewing sarcoma cell lines were cultured in standard tumor medium, which contained
RPMI, heat-inactivated fetal bovine serum and gentamycin, at 37°C and 5% CO2 in a
humidified atmosphere. Volume of the medium was 20 ml in middle-sized culture
flasks (75 cm² adherence surface) and 30 ml in large-sized culture flasks (175 cm²
adherence surface).
When cells grew to confluence, which was about every 3-4 days, medium was
removed and cells were split 1:2 to 1:10, depending on growth rate of the individual
cell lines. A-673, for example, grows much faster than SK-N-MC due to a p53 mutation.
To split the cells, medium was removed first. Then, cells were washed once with 10 ml
pre-warmed 1x PBS. After that they were coated with 3-4 ml 1x trypsin and incubated
at 37°C and 5% CO2 for 2-5 minutes. Cells were detached by fresh standard tumor
medium. The cell suspension was decanted into a Falcon tube which was centrifuged
at 1200 rpm for 7 minutes. After that the supernatant was decanted carefully and the
cell pellet was vortexed in 10 ml prewarmed 1x PBS and centrifuged at 1200 rpm for
7 minutes again. Cells were then resuspended in fresh standard tumor medium and
spread in new culture flasks.
The retrovirus packaging cell line PT67 was grown at 37 °C in 8 % CO2 in middle-sized
culture flasks in a humidified atmosphere. They were cultivated in DMEM containing
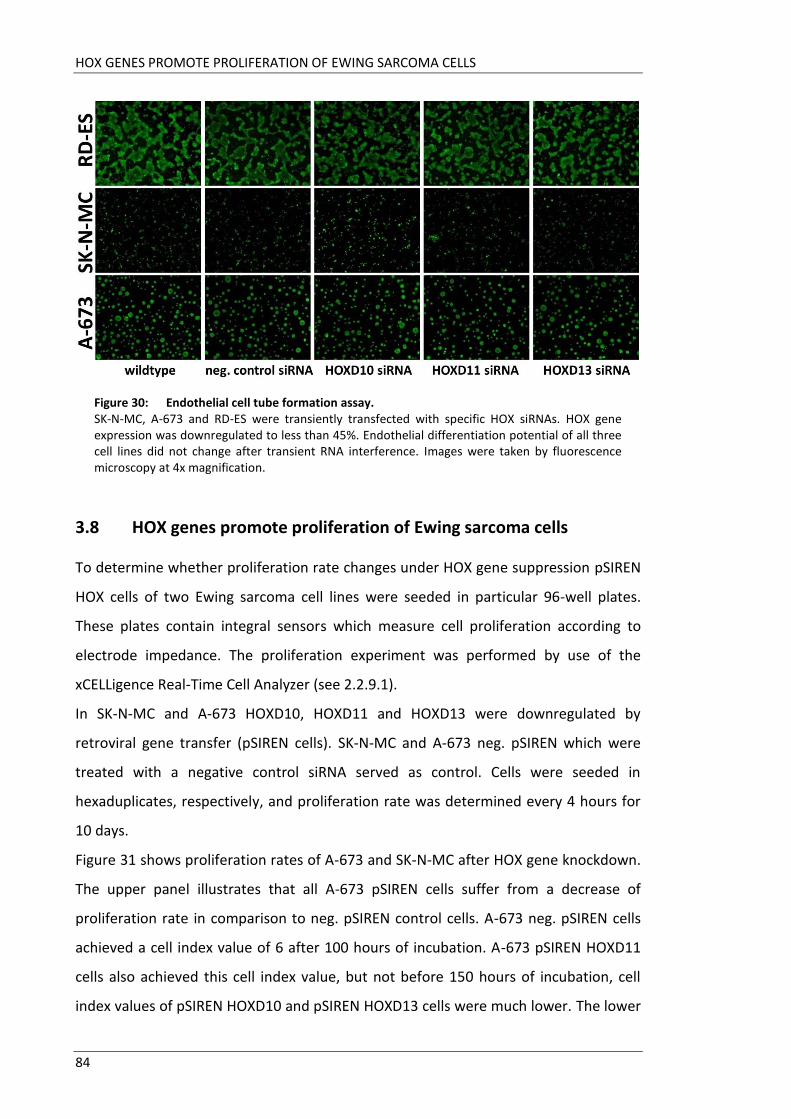
Endothelial cell tube formation was analyzed using BD Matrigel™ Basement Membrane
Matrix according to manufacturer’s protocol (Protocol: Endothelial Cell Tube
Formation Assay, Assay Methods, BD Biosciences).
BD Matrigel™ was thawed overnight on ice at 4°C. The next day 75 µl of the liquid
Matrigel™ was carefully pipetted into each well of a 96-well flat top reaction plate
avoiding air bubbles. Since Matrigel™ gels immediately at 22°-35°C, the 96-well
reaction plate was put on ice and pre-cooled pipets and tips were used. The culture
plate was then incubated at 37°C for 30-60 minutes allowing Basement Membrane
Matrix to gel.
4 - 7 x 10⁴ cells in 75 µl standard tumor medium were seeded on gelled Matrix
achieving a final volume of 150 µl per well.
After incubation at 37°C and 5% CO2 in a humidified atmosphere for 24 hours, medium
was carefully removed and cells were washed with 100 µl PBS per well. PBS was
removed and cells were labeled by Calcein Fluorescent Dye. 100 µl Calcein in a
concentration of 1 µg/ml in PBS were added per well, then culture plate was incubated
in the dark at room temperature for 30 minutes before labeling solution was removed
and 100 µl PBS was added again. Tube formation was analyzed by fluorescence
microscopy. Images were taken by use of a Nikon Eclipse TS 100 with an attached
Nikon Coolpix 5400 camera.
In this work, it was investigated if HOX knockdown influenced the angiogenesis pattern
of Ewing sarcoma cell lines.
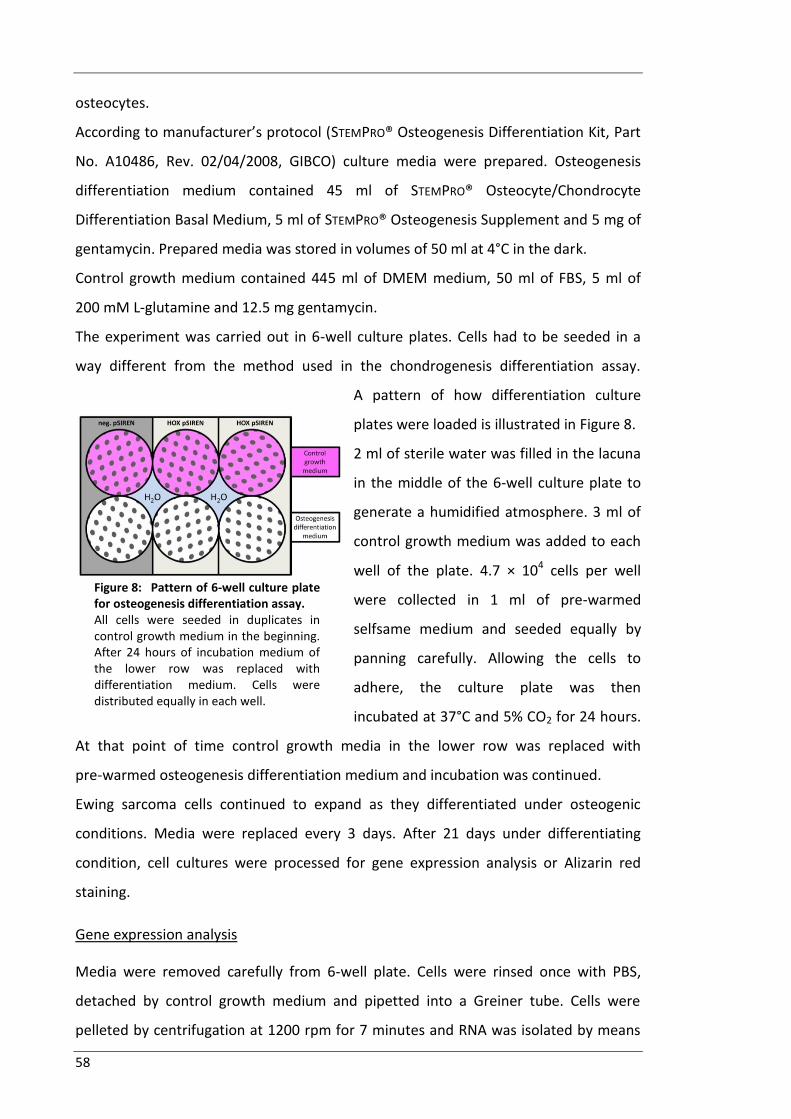
2.2.9.4 Osteogenesis differentiation assay
Potential of osteogenic differentiation of Ewing sarcoma cell lines was surveyed using
the STEMPRO® Osteogenesis Differentiation Kit. This kit has been developed for the
osteogenic differentiation of mesenchymal cells (MSC) in tissue-culture vessels.
Consisting of a basal medium and osteogenesis supplement, it contains all reagents
required for the MSCs to be committed to the osteogenesis pathway and to generate
58
osteocytes.
According to manufacturer’s protocol (STEMPRO® Osteogenesis Differentiation Kit, Part
No. A10486, Rev. 02/04/2008, GIBCO) culture media were prepared. Osteogenesis
differentiation medium contained 45 ml of STEMPRO® Osteocyte/Chondrocyte
Differentiation Basal Medium, 5 ml of STEMPRO® Osteogenesis Supplement and 5 mg of
gentamycin. Prepared media was stored in volumes of 50 ml at 4°C in the dark.
Control growth medium contained 445 ml of DMEM medium, 50 ml of FBS, 5 ml of
200 mM L-glutamine and 12.5 mg gentamycin.
The experiment was carried out in 6-well culture plates. Cells had to be seeded in a
way different from the method used in the chondrogenesis differentiation assay.
A pattern of how differentiation culture
plates were loaded is illustrated in Figure 8.
2 ml of sterile water was filled in the lacuna
in the middle of the 6-well culture plate to
generate a humidified atmosphere. 3 ml of
control growth medium was added to each
well of the plate. 4.7 × 10⁴ cells per well
were collected in 1 ml of pre-warmed
selfsame medium and seeded equally by
panning carefully. Allowing the cells to
adhere, the culture plate was then
incubated at 37°C and 5% CO2 for 24 hours.
At that point of time control growth media in the lower row was replaced with
pre-warmed osteogenesis differentiation medium and incubation was continued.
Ewing sarcoma cells continued to expand as they differentiated under osteogenic
conditions. Media were replaced every 3 days. After 21 days under differentiating
condition, cell cultures were processed for gene expression analysis or Alizarin red
staining.
Gene expression analysis
Media were removed carefully from 6-well plate. Cells were rinsed once with PBS,
detached by control growth medium and pipetted into a Greiner tube. Cells were
pelleted by centrifugation at 1200 rpm for 7 minutes and RNA was isolated by means
Figure 8: Pattern of 6-well culture plate for osteogenesis differentiation assay. All cells were seeded in duplicates in control growth medium in the beginning. After 24 hours of incubation medium of the lower row was replaced with differentiation medium. Cells were distributed equally in each well.
MATERIALS AND METHODS
59
of the Gene JET™ Purification Kit (see 2.2.3.2). cDNA was synthesized and gene
expression was analyzed using RT-PCR (see 2.2.6 and 2.2.7).
Alizarin red staining
Media were removed carefully from 6-well plate. Cells were rinsed once with PBS and
fixed with 4% formaldehyde solution for 30 minutes. After fixation, wells were rinsed
twice with sterile distilled water and stained with 2% Alizarin red solution at a pH of
4.2 for 30 minutes. After staining, wells were rinsed three times with sterile distilled
water and visualized by microscopy. Alizarin red staining indicates the presence of
calcific deposition of cells of the osteogenic lineage. Images were taken by use of a
Nikon Eclipse TS 100 with an attached Nikon Coolpix 5400 camera.
2.2.9.5 Chondrogenesis differentiation assay
Potential of chondrogenic differentiation of Ewing sarcoma cell lines was surveyed
using the STEMPRO® Chondrogenesis Differentiation Kit. Similarly to the osteogenesis
differentiation kit mentioned in 2.2.9.4, this kit has been developed for the
chondrogenic differentiation of mesenchymal cells (MSC) in tissue-culture vessels. Also
consisting of a basal medium and chondrogenesis supplement, it contains all reagents
required for the MSCs to be committed to the chondrogenesis pathway and to
generate chondrocytes.
According to manufacturer’s protocol (STEMPRO® Chondrogenesis Differentiation Kit,
Part No. A10582, Rev. 05/22/2008, GIBCO)
culture media were prepared.
Chondrogenesis differentiation medium
contained 45 ml of STEMPRO®
Osteocyte/Chondrocyte Differentiation
Basal Medium, 5 ml of STEMPRO®
Chondrogenesis Supplement and 5 mg of
gentamycin. Prepared media was stored in
volumes of 50 ml at 4°C in the dark.
Control growth medium, called
“Attachment Medium” in manufacturer’s
Figure 9: Pattern of 6-well culture plate for chondrogenesis differentiation assay. Cells were seeded in duplicates, in each case in 5 µl droplets. The upper row of wells was filled with control growth medium; the lower row was filled with differentiation medium right from the start.
60
protocol, was the same as the one in the osteogenic differentiation assay (see p. 58).
This differentiation assay was also carried out in 6-well culture plates but wells were
loaded in a method different from the one of the osteogenesis differentiation assay.
Cells were not distributed equally all over each well, but seeded in 5 µl droplets
instead. A pattern of how culture plates looked like is shown in Figure 9.
2 ml of sterile water was filled in the lacuna in the middle of the 6-well culture plate to
generate a humidified atmosphere. Using control growth medium a cell solution of
1.6 × 10⁷ cells/ml was prepared.
Micromass cultures were generated by seeding 5 µl droplets of this cell solution in the
center of each well of a 6-well plate. Cells were then cultivated at 37°C and 5% CO2 for
20 minutes. According to manufacturer’s protocol micromass cultures should have
been cultivated for two hours, this long incubation led to cell’s death though. So a
shorter period of incubation was chosen.
After incubation 4 ml of pre-warmed media was carefully added circularly from outside
to the center of the well, avoiding the micromass culture to detach from the bottom.
Control growth medium was added to the upper wells, chondrogenesis differentiation
medium was added to the lower wells (see Figure 9).
Cells were cultivated at 37°C and 5% CO2 in a humidified atmosphere. Ewing sarcoma
cells continued to expand as they differentiated under chondrogenic conditions.
According to manufacturer’s protocol, media had to be replaced every second day.
After 14 days under differentiating conditions, chondrogenic pellets were processed
for gene expression analysis or Alcian blue staining.
Gene expression analysis
Media were removed carefully from 6-well plate. Cells were rinsed once with PBS,
detached by control growth medium and pipetted into a Greiner tube. Cells were
pelleted by centrifugation at 1200 rpm for 7 minutes and RNA was isolated by means
of the Gene JET™ Purification Kit (see 2.2.3.2). cDNA was synthesized and gene
expression was analyzed using qRT-PCR (see 2.2.6 and 2.2.7).
Alcian blue staining
According to manufacturer’s protocol, media were removed carefully from 6-well
plate. Cells were rinsed once with PBS and fixed with 4% formaldehyde solution for
MATERIALS AND METHODS
61
30 minutes. After fixation, wells were rinsed twice with PBS and stained with 1% Alcian
blue solution prepared in 0.1 N HCl for 30-60 minutes. After rinsing with 0.1 N HCl
three times and adding sterile distilled water to neutralize the acidity, cells were
visualized by microscopy. Images were taken by use of a Nikon Eclipse TS 100 with an
attached Nikon Coolpix 5400 camera.
2.2.10 Microarray analysis
Staege et al. (2004) examined ES-specific gene expression patterns by means of
customized high-density DNA microarrays called EOS-Hu01 and HG-U133A. Ewing
sarcoma samples were compared to neuroblastoma tissue, fetal tissue as well as other
normal tissue of different origins. Altogether 35,356 oligonucleotide probe sets
queried a total of 25,194 gene clusters. This analysis revealed a number of genes that
are upregulated and specific to the Ewing sarcoma. (Staege et al. 2004)
Changes in gene expression signatures after HOX knockdown by RNA interference
were also determined by microarray analysis. Experiments were done as previously
described (Richter et al. 2009) in cooperation with Dr. rer.biol.hum. Olivia Prazeres da
Costa (Expression Core Facility at the Institute for Medical Microbiology, Immunology
and Hygiene of the Technical University Munich, Germany). After transient siRNA
transfection of EW-7 and SK-N-MC RNA was isolated by use of TRI Reagent RNA
Isolation Kit (see 2.2.3.3) and quantified photometrically. Total RNA (200 ng) was
amplified and labeled using Affymetrix GeneChip Whole Transcript Sense Target
Labeling Kit according to manufacturer’s protocol. cRNA was hybridized to Affymetrix
Human Gene 1.0 ST arrays and microarray data were subsequently analyzed using
different control tools to ensure representative high quality data. A detailed procedure
is available at www.affymetrix.com. The whole data set is available at the Gene
Expression Omnibus (GSE36100). (Edgar et al. 2002)
Data was kindly analyzed by PD Dr. Günther Richter who used Affimetrix software
“Microarray Suite 5.0”, independent one-sample t-test and Genesis software package
(Sturn et al. 2002; Tsai et al. 2003). Differentially expressed genes were identified by
means of significance analysis of microarrays (SAM). (Tusher et al. 2001) Transcripts
were functionally assigned using GO-annotations (http://www.cgap.nci.nih.gov).
Gene set enrichment analysis (GSEA) and pathway analyzes were done by using the
62
GSEA tool (http://www.broad.mit.edu/gsea). (Subramanian et al. 2005)
2.2.11 Statistical analysis
Data are mean values ± SEM (standard error of the mean) as indicated. Differences
were analyzed by unpaired two-tailed student’s t-test as indicated using Microsoft
Excel, p values < 0.05 were considered statistically significant. p < 0.05: *, p < 0.01: **,
p < 0.001: ***.
RESULTS
63
3 Results
3.1 Posterior HOXD genes are overexpressed in Ewing sarcoma
Microarray analysis demonstrated that HOXD10, HOXD11 and HOXD13 are
ubiquitously expressed in different tissues at a low level. In primary Ewing sarcoma
tissue, however, especially these three HOX genes are highly overexpressed in
comparison to neuroblastoma and normal tissue (see Figure 10).
The upper chart of Figure 10 illustrates that HOXD10 is also expressed at a higher level
in SiMA, a neuroblastoma cell line, and uterine tissue, but only to a minor degree in
other tissues compared to primary Ewing sarcoma tissue. In Ewing sarcoma tissue
relative expression of HOXD10 amounts to almost the 2000-fold.
Gene expression of HOXD11 in non-Ewing sarcoma tissue, however, seems to be
higher than expression of HOXD10 and HOXD13 (see middle chart of Figure 10). Many
tissues, especially genitalia such as ovary, uterus or prostate, but also kidney and
salivary glands show an increased HOXD11 gene expression up to the 200-fold.
The lower chart of Figure 10 illustrates that HOXD13 is also expressed in prostate
tissue to a higher degree (88-fold). Gene expression levels in non-Ewing sarcoma tissue
are very low though (less than 10-fold) in comparison to primary Ewing sarcoma tissue
where relative expression amounts up to a 2200-fold.
POSTERIOR HOXD GENES ARE OVEREXPRESSED IN EWING SARCOMA
64
Figure 10: HOX expression in Ewing sarcoma compared to other tissue. Microarray data show HOXD10, HOXD11 and HOXD13 expression on mRNA level in primary ES tissue samples (red) in comparison to neuroblastoma tissue (NB, dark grey), normal tissue (NT, black) and fetal tissue (FT, light grey). Gene expression of all three HOX genes is increased up to a 2000-fold in primary Ewing sarcoma tissue (ES and NB RNA were hybridized onto HG U133A arrays (Affymetrix; GSE1825, GSE15757) and compared to a published microarray study of normal tissue (GSE2361). Each bar represents the expression signal of an individual array, see von Heyking et al. (2016))
RESULTS
65
There are also HOX genes of the three other clusters (A, B, C) which are highly
expressed in the Ewing sarcoma. Just as HOXD10, HOXD11 and HOXD13, these HOX
genes are also located on the 5’-end of each cluster. More information about the HOX
cluster can be found on p. 1 onwards. HOX genes with numbers 10-13 of clusters
A, B and C show a ubiquitously high expression in healthy tissue, though. Figure 11
below displays that these HOX genes are not that specific for Ewing sarcoma.
Figure 11: Expression of posterior HOX genes of other clusters than HOXD in Ewing sarcoma compared to other tissue. Microarray data show expression of HOX genes of other clusters than HOXD on mRNA level in primary ES tissue samples (red) in comparison to neuroblastoma tissue (NB, dark grey), normal tissue (NT, black) and fetal tissue (FT, light grey).Except HOXB13, all of these genes are also highly expressed in non-Ewing sarcoma tissue and less specific than HOXD10, HOXD11 and HOXD13.
Other posterior HOX genes of the same cluster also show an expression pattern totally
different from HOXD10, HOXD11 and HOXD13. Figure 12 on p. 66 illustrates that
HOXD9 and HOXD12, both of them, are ubiquitously expressed to a modest degree but
relative expression amounts less than a 20-fold in most tissues. In contrast to HOXD10,
HOXD11 and HOXD13 they are not specific to the Ewing sarcoma.
Altogether, HOXD10, HOXD11 and HOXD13 are the three HOX genes which are most
specific to the Ewing sarcoma.
POSTERIOR HOXD GENES ARE OVEREXPRESSED IN EWING SARCOMA
66
Figure 12: Expression of other posterior HOXD genes in Ewing sarcoma compared to other tissue. Microarray data show expression of HOXD9 (left panel) and HOXD12 (right panel) on mRNA level in primary ES tissue samples (red) in comparison to neuroblastoma tissue (NB, dark grey), normal tissue (NT, black) and fetal tissue (FT, light grey).
To verify the microarray data, HOX mRNA levels of established ES lines were compared
to those of other pediatric tumor cell lines by qRT-PCR using specific gene expression
assays. cDNA of neuroblastoma cell lines was used, since this tumor is also considered
as member of the group of small round-cell tumors, just like the Ewing sarcoma.
(McManus et al. 1996) Four osteosarcoma cell lines were used for comparison to a
different bone tumor.
Figure 13 shows that ES cell lines express HOXD11 and HOXD13 on higher mRNA levels
in comparison to neuroblastoma and osteosarcoma cell lines. In detail, Ewing sarcoma
Figure 13: HOX expression in ES cell lines. Expression of HOXD10, HOXD11 and HOXD13 was analyzed on mRNA level: mRNA levels were quantified by qRT-PCR. NTC is non-template control. Error bars represent standard deviation of duplicates. Left panel: HOX expression in ES cell lines in comparison to other pediatric tumor cell lines. Four ES cell lines were compared to four osteosarcoma and two neuroblastoma cell lines. Right panel: HOX expression in different ES cell lines. Type 1 and 2 refers to type of EWS/FLI1 translocation.
RESULTS
67
cell lines show an up to 12-fold higher HOXD13 mRNA level and even up to 100-fold
higher HOXD11 mRNA level than the other two tumor entities. Osteosarcoma and
neuroblastoma cell lines express HOXD11 and HOXD13 only to a small degree. ES cell
lines also show an up to 180-fold higher HOXD10 mRNA level than osteosarcoma cell
lines. Two neuroblastoma cell lines, however, also express HOXD10 at a considerable
degree. This indicates that HOXD10 is less specific to the Ewing sarcoma but might also
be an important gene in neuroblastoma as well.
The right panel of Figure 13 illustrates that all Ewing sarcoma cell lines express
HOXD10, HOXD11 and HOXD13 similarly, independently from their type of EWS/FLI1
translocation (see p. 23). From all ES cell lines, RD-ES showed lowest HOX mRNA levels.
SK-N-MC, EW-7 and A-673 are the three cell lines which were chosen for upcoming
experiments.
3.2 HOX gene expression is not regulated by the two “main suspects”
3.2.1 HOX gene expression is not regulated by EWS-FLI1
To analyze HOX gene expression under EWS-FLI1 suppression, EWS-FLI1 was
downregulated in A-673 by retroviral gene transfer. Control cells were treated with a
negative control shRNA (see 2.2.4.1). For a detailed protocol of retroviral gene
transfer, see 2.2.3. RNA was isolated and cDNA was synthesized.
In four other Ewing sarcoma cell lines EWS-FLI1 was knocked down using two different
siRNAs (see Figure 14). Control cells were transfected with a negative control siRNA.
After an appropriate period of incubation, RNA was isolated from these cells and cDNA
was synthesized. Method of transient transfection is described in detail in 2.2.2. Target
sequences of EWS-FLI1 siRNAs are listed in 2.1.8. EWS-FLI1 and HOX gene expression
was determined on mRNA level by qRT-PCR using specific gene expression assays.
Figure 14 shows that EWS-FLI1 mRNA levels were significantly downregulated by RNA
interference and retroviral gene transfer; in detail down to 24-26% in SK-N-MC,
17-37% in EW-7, 40% in TC-71, 16% in SB-KMS-KS-1 and 20% in A-673. Cells which had
been transfected with a negative control siRNA served as control in each case.
In none of these five ES cell lines, HOXD10 mRNA level was influenced by EWS-FLI1
expression. HOXD11 showed a significantly lower mRNA level using EWS-FLI1 #2 siRNA
HOX GENE EXPRESSION IS NOT REGULATED BY THE TWO “MAIN SUSPECTS”
68
Figure 14: HOX expression after suppression of EWS-FLI1 in five ES cell lines. SK-N-MC, EW-7, TC-71 and SB-KMS-KS-1 were transfected with two specific EWS-FLI1 siRNAs. Controls were transfected with a negative control siRNA. In A-673 EWS-FLI1 was downregulated by retroviral gene transfer, control was treated with a negative control shRNA. From all cell lines RNA was isolated, cDNA was synthesized and gene expression on mRNA level was determined by qRT-PCR using specific gene expression assays. EWS-FLI1 was downregulated to less than 40% in all cell lines. In SK-N-MC and A-673, HOXD13 was significantly downregulated under EWS-FLI1 suppression. HOXD10 and HOXD11 expression was not influenced by EWS-FLI1 mRNA level. Error bars represent standard deviation of at least duplicates. NTC is non-template control. p < 0.05 (*), p < 0.01 (**), p < 0.001 (***).
in EW-7. Since this result could not be verified neither using the other siRNA in EW-7
nor in any other ES cell line, this effect was rather considered as a random event. In
SK-N-MC, however, HOXD13 mRNA level was significantly downregulated down to
53-63% under EWS-FLI1 suppression, irrespective of which siRNA had been used. An
even stronger downregulation of HOXD13 under EWS-FLI1 suppression could be
detected in A-673, in detail HOXD13 mRNA level showed a decrease down to 24%.
Altogether, EWS-FLI1 did not influence gene expression of HOXD10 and HOXD11 on
mRNA level. In the two cell lines SK-N-MC and A-673, however, EWS-FLI1 suppression
led to a significant downregulation of HOXD13 on mRNA level. To verify this result, it
was investigated if HOX gene expression could be induced by EWS-FLI1. For this, cDNA
of the fusion protein was cloned into the pMSCV Neo expression vector, another
retroviral vector which was used similarly to pSIREN expression vector. For further
information of pMSCV Neo expression vector, see 2.1.12. Method of retroviral gene
transfer is described in detail in 2.2.3.
Two different human mesenchymal stem cell (MSC) lines were transfected with
EWS-FLI1 pMSCV constructs to achieve an overexpression of the fusion protein. V54.2
is a predominantly adherent growing cell line that has been generated from peripheral
RESULTS
69
blood mononuclear cells of a healthy volunteer donor after G-CSF-mediated stem cell
mobilization. It is immortalized and shows a fibroblast-like cell growth. (Conrad et al.
2002) L87 is a permanent Simian virus 40-transformed mesenchymal stem cell line
which also shows a fibroblastoid morphology. In contrast to V54.2, this cell line was
derived from the bone marrow of a healthy male patient. (Thalmeier et al. 1994)
In both cell lines, V54.2 and L87, ectopic EWS-FLI1 expression was induced by pMSCV
constructs. By this means two stem cell clones of each cell line were generated:
V54.2 #1 and #3, L87 #3 and #5. pMSCV Neo clones of both cell lines were generated
by transfecting with an empty vector respectively, they served as control. Transfected
cell lines were generated by Diana
Löwel. Induction of ectopic EWS-FLI1
expression and HOX gene expression
were determined on mRNA level by
qRT-PCR using specific primers (see
2.2.8).
Figure 15 illustrates that all MSC clones
of both cell lines, V54.2 and L87,
express HOXD10, HOXD11 and
HOXD13. Ectopic expression of
EWS-FLI1 led to a 2-3-fold increase of
mRNA levels of HOXD10 and HOXD11
in L87. This upregulation seemed to be
dose-dependent in this cell line since
strongest EWS-FLI1 induction showed
highest upregulation of HOXD10 and
HOXD11 expression compared to
empty vector control. This induction
could not be detected in V54.2, though.
Here, HOXD10 and HOXD11 mRNA
levels of the MSC clones differed from
control in a modest way only.
All clones expressed HOXD13 on mRNA
Figure 15: HOX expression in two human MSC cell lines which ectopically express EWS-FLI1. Two human MSC cell lines, V54.2 and L87, were transfected with EWS-FLI1 pMSCV constructs, resulting in a significant ectopic EWS-FLI1 expression. Gene expression was analyzed on mRNA level by qRT-PCR. pMSCV Neo represents control which was transfected with an empty vector. NTC is non-template control. Error bars represent standard deviation of duplicates. p < 0.05 (*), p < 0.01 (**), p < 0.001 (***).
HOX GENE EXPRESSION IS NOT REGULATED BY THE TWO “MAIN SUSPECTS”
70
level but in neither of the two cell lines, EWS-FLI1 expression led to a dose-dependent
induction of this gene. Since EWS-FLI1 suppression led to a significant downregulation
of HOXD13 on mRNA in SK-N-MC and A-673 (see Figure 14, p. 68), HOXD13 mRNA level
of V54.2 #3 was expected to be higher than the one of clone #1 and HOXD13 mRNA
level of L87 #3 was expected between the ones of the empty vector control and L87
clone #5.
Altogether, ectopic EWS-FLI1 expression did not induce HOXD10, HOXD11 and
HOXD13 in mesenchymal stem cells. Potential regulation of HOXD13 under EWS-FLI1
suppression could not be verified by this experiment.
3.2.2 HOX gene expression is not influenced by EZH2
We previously reported that EZH2 was a highly upregulated gene in Ewing sarcoma
which was required to maintain stemness and metastastic spread. It blocks endothelial
and neuro-ectodermal differentiation and its suppression inhibits contact-independent
growth in vitro and tumor growth in vivo. (Richter et al. 2009) Since histone
methyltransferases usually regulate HOX gene expression (Hanson et al. 1999) we
checked whether EZH2 regulated HOX gene expression in ES cell lines. In several ES cell
lines EZH2 was downregulated by siRNA interference. Cells which had been treated
with a negative control siRNA served as control. RNA was isolated and gene expression
was analyzed on mRNA level by qRT-PCR. EZH2 was downregulated to values of
27-57% on mRNA level. HOX gene expression was analyzed on mRNA level as well.
Figure 16 shows reduced EZH2 mRNA levels in SK-N-MC, TC-71 and EW-7. In EW-7
HOXD11 was significantly downregulated under EZH2 suppression. This effect could
not be verified in any other cell line, though, suggesting this was rather a random
event. Furthermore, EZH2 mRNA levels in EW-7 were not as reduced as in other cell
lines. mRNA levels of HOXD10 and HOXD13 did not change at all under EZH2
suppression. Altogether, EZH2 did not influence gene expression of HOXD10, HOXD11
and HOXD13 on mRNA level.
Furthermore, HOX gene expression was not influenced by Argonaute proteins AGO1
and AGO2. The two Argonaute proteins AGO1 and AGO2 were both downregulated
down to less than 30% on mRNA level in comparison to control cells. Suppression of
Argonaute proteins did not lead to any change of HOX gene expression in four Ewing
RESULTS
71
sarcoma cell lines (data not shown).
Figure 16: HOX expression after suppression of EZH2 in several ES cell lines. Several ES cell lines were transfected with EZH2 validated siRNA. Controls were transfected with a negative control siRNA. RNA was isolated, cDNA was synthesized and gene expression on mRNA level was determined by qRT-PCR using specific gene expression assays. EZH2 knockdown did not influence HOX gene expression. Error bars represent standard deviation of at least duplicates. NTC is non-template control. p < 0.05 (*), p < 0.01 (**), p < 0.001 (***).
3.3 HOX gene expression is downregulated by siRNA interference
3.3.1 Transient HOX downregulation by specific siRNAs
To explore the role of HOX genes in Ewing sarcoma pathogenesis, HOXD10, HOXD11
and HOXD13 were downregulated by siRNA interference in several ES cell lines. Two
siRNAs were tested in MHH-ES-1 at the beginning to determine the siRNA with better
knockdown efficiency. Method of transient transfection is described in 2.2.2. Target
sequences of siRNAs which were used are listed in 2.1.8. After an appropriate period of
incubation, which was usually about 48 hours, RNA was isolated from culture dishes as
described in 2.2.5. Gene expression was determined on mRNA level by qRT-PCR using
gene specific gene expression assays (see 2.1.11.1).
Figure 17 shows HOX mRNA levels after transient transfection with specific siRNAs.
siRNAs HOXD13_3 and HOXD10_4 generated a downregulation of only 65-75% of the
corresponding HOX genes in MHH-ES-1 compared to those of cells that had been
transfected with a negative control siRNA. Using HOXD13_2 and HOXD10_1, however,
a suppression of 47-60% was possible. Thus, the two latter siRNAs were preferred for
further transfection experiments with other Ewing sarcoma cell lines. In SK-N-MC and
HOX GENE EXPRESSION IS DOWNREGULATED BY SIRNA INTERFERENCE
72
EW-7, the two cell lines which were used mainly, a downregulation of 31-37% of
HOXD10 and 21-33% of HOXD13 could be achieved using these two siRNAs. RNA of
these transfections was also analyzed by microarray (see 3.5).
Figure 17 illustrates that HOXD11 could be suppressed to 30-51% in MHH-ES-1 and
SK-N-MC using HOXD11_5 siRNA, but only to 65% in EW-7. Thus, two more siRNAs
were tested. Best knockdown in two cell lines at the same time was achieved by
HOXD11_3 siRNA, in detail 36% in SK-N-MC and 48% in EW-7.
Altogether, all three HOX genes, HOXD10, HOXD11 and HOXD13 were significantly
knocked down on mRNA level by RNA interference.
Oligonucleotides which were used for retrovirus-mediated stable RNA interference
(see 2.2.3 and 0) encode the target sequences of HOXD10_1, HOXD11_3 and
HOXD13_2 siRNA, respectively.
Figure 17: HOX expression after RNA interference. Several ES cell lines were transfected with specific target siRNAs as described in 2.2.2. RNA was isolated, cDNA was synthesized and gene expression was determined by qRT-PCR using specific gene expression assays. Control was transfected with a negative control siRNA. Error bars represent standard deviation of at least quadruplicates. NTC is non-template control. p < 0.05 (*), p < 0.01 (**), p < 0.001 (***); n.s. not significant
RESULTS
73
3.3.2 Triple HOX gene knockdowns
Analogically to the transfections described in 3.3.1 an attempt was made to
downregulate all three HOX genes, HOXD10, HOXD11 and HOXD13, at the same time.
As described in 2.2.2, the experiment was performed using the same number of cells
and the same amount of media and transfection reagent. The only difference was that,
instead of 3.6-5 µl of only one specific siRNA, 3.6-5 µl of each of the three HOX siRNAs
was used at the same time. RNA was harvested, cDNA was synthesized and HOX gene
expression was analyzed as usual.
In four Ewing sarcoma cell lines HOXD10, HOXD11 and HOXD13 could be
downregulated significantly at the same time by one transfection. In SK-N-MC and
A-673, for example, each of the three HOX genes was knocked down to around 34%.
Downregulation of HOXD10, HOXD11 and HOXD13 was achieved more easily by these
triple HOX knockdowns than by those single knockdowns mentioned previously (see
Figure 17). RNA of these experiments was also used for further gene expression
analysis (see chapters 3.5.3 to 3.5.5 and 3.6.2 to 3.6.3).
Figure 18: HOX mRNA levels after triple siRNA interference quantified by qRT-PCR. Four ES cell lines were transfected with HOXD10_1, HOXD11_3 and HOXD13_2 siRNA at the same time. RNA was isolated, cDNA was synthesized and gene expression was determined by qRT-PCR using specific gene expression assays. Control was transfected with triple amount of negative control siRNA. Error bars represent standard deviation of duplicates. NTC is non-template control. p < 0.05 (*), p < 0.01 (**), p < 0.001 (***).
HOX GENE EXPRESSION IS DOWNREGULATED BY RETROVIRAL GENE TRANSFER
74
3.4 HOX gene expression is downregulated by retroviral gene
transfer
Since gene downregulation by siRNA interference is only detectable in the range from
hours to few days and some in vitro assays take a couple of weeks, Ewing sarcoma cell
lines with a permanent HOX knockdown were generated. Oligonucleotides encoding
the target sequences of the three HOX siRNAs with best gene knockdown efficiency
(see 3.3.1) and the target sequence of the negative control siRNA, which had already
been used in transient transfection
experiments, were cloned into a
retroviral vector system called pSIREN
RetroQ. Two Ewing sarcoma cell lines
were transfected with the
corresponding viral supernatants.
A constitutive HOX gene
downregulation was mediated by a
permanent expression of small hairpin
RNAs. For a detailed description of
small hairpin RNAs and retroviral gene
transfer, see 2.2.3.
pSIREN HOX constructs were
transferred into SK-N-MC and A-673.
Control cells were treated with a small
hairpin RNA corresponding to the
target sequence of the negative control
siRNA. Stable HOX downregulation was determined by qRT-PCR using specific gene
expression assays. Altogether, mRNA levels showed a significant downregulation of
HOXD10 down to 29-39%, of HOXD11 down to 21-55% and of HOXD13 down to
16-41% (see Figure 19). Ewing sarcoma cell lines with stable significant downregulation
of HOXD10, HOXD11 and HOXD13 were then used for several in vitro assays (see
chapters 3.8 - 3.11).
Figure 19: HOX expression on mRNA level after constitutive knock down by retroviral gene transfer. mRNA levels of two Ewing sarcoma cell lines were determined by qRT-PCR. NTC is non-template control. Error bars represent standard deviation of at least quadruplicates. p < 0.001 (***).
RESULTS
75
3.5 Microarray analysis reveals possible downstream HOX targets
In the two Ewing sarcoma cell lines SK-N-MC and EW-7 HOXD10, HOXD11 and HOXD13
were successfully downregulated by siRNA interference (see 3.3.1). To identify possible
HOX downstream targets, cDNA of SK-N-MC and EW-7 of this experiment was sent to
microarray analysis (see 2.2.10).
Gene expression patterns after HOX knockdown were compared on human Gene ST
arrays (Affymetrix, GSE36100).
Figure 20: Microarray data of selected genes after transient HOXD10, HOXD11 and HOXD13 knockdown (GSE36100) in SK-N-MC and EW-7 cells. Each column represents one individual array. Upper left panel shows first most significant genes of SAM analysis after HOXD10 knockdown which were identified by a fold change > ± 1.5 and a t-test p < 0.05. Lower left panel and right panel show most significant genes of SAM analysis after HOXD13 and HOXD11 knockdown, respectively. These genes were identified by a fold change of > ± 2 and a t-test p < 0.05. Control cells were treated with a neg. control siRNA, mock controls correspond to wildtype cells.
MICROARRAY ANALYSIS REVEALS POSSIBLE DOWNSTREAM HOX TARGETS
76
SK-N-MC and EW-7 which had been transfected with a negative siRNA served as
control. Mock controls correspond to wild type cells; they were not transfected but
only treated with the transfection reagent without any siRNA.
Considering a minimum linear fold change > ±1.5 78 differentially regulated genes
after HOXD10 knockdown were identified, 38 of those genes were downregulated.
Considering a minimum linear fold change > ±2 108 differentially regulated genes after
HOXD11 knockdown were detected, 70 of those genes were downregulated. After
HOXD13 knockdown 67 differentially regulated genes were identified considering a
minimum linear fold change > ±2, 37 of those genes were downregulated.
Differentially regulated genes after HOXD10, HOXD11 and HOXD13 knockdown didn’t
overlap and only a handful of these genes, however, were confirmed by qRT-PCR.
3.5.1 HOXD10 knockdown also causes a downregulation of HOXD11 in
Ewing sarcoma cells
Microarray revealed a downregulation of HOXD11 after HOXD10 knockdown (detailed
data not shown). To verify microarray data and also to detect a similar effect of
Figure 21: HOXD10 knockdown also causes downregulation of HOXD11 in ES cell lines. In three ES cell lines HOXD10, HOXD11 and HOXD13 were downregulated by siRNA or shRNA interference, respectively; control cells were treated with a neg. control siRNA. Gene expression was analyzed on mRNA level by qRT-PCR. Two lower panels: In SK-N-MC and EW-7 downregulation of HOXD10 also caused a significant downregulation of HOXD11. This effect could be detected in SK-N-MC and A-673 pSIREN HOXD10 cells as well. Thus, microarray data was verified. p < 0.05 (*), p < 0.01 (**), p < 0.001 (***), NTC is non-template control.
RESULTS
77
HOXD11 and HOXD13 knockdown, in several Ewing sarcoma cell lines HOXD10,
HOXD11 and HOXD13 were downregulated to less than 30% by siRNA or shRNA
interference, respectively. HOX gene expression of these cell lines was analyzed on
mRNA level by qRT-PCR using specific primer assays.
Figure 21 illustrates HOX gene expression patterns after HOXD10, HOXD11 and
HOXD13 knockdown, respectively. In SK-N-MC and EW-7 downregulation of HOXD10
by siRNA interference also caused a significant downregulation of HOXD11 to 58-70%
(see left lower panel). This effect was also observed in SK-N-MC and A-673 pSIREN
HOXD10 cells. Here HOXD11 was even downregulated to 44-55% compared to control
cells (see right lower panel).
After HOXD11 downregulation HOXD10 and HOXD13 gene expression didn’t differ
from control cells. Results of HOXD13 downregulation were inconsistent in SK-N-MC
and EW-7.
3.5.2 HOXD10 knockdown leads to an upregulation of RAC2
Microarray data revealed that in EW-7 and SK-N-MC RAC2 was significantly
upregulated after HOXD10 knockdown. The protein encoded by RAC2 is a member of
the RAC family of small guanosine triphosphate (GTP)-metabolizing proteins. (Didsbury
et al. 1989) GTP-binding proteins are key regulators in signaling pathways. Associated
at the plasma membrane, they function as binary switches which control multiple
cellular processes. (Zohn et al. 1998) The RAS family consists of three isoforms RAC1-3,
of which RAC2 is selectively expressed in hematopoietic cells whereas RAC1 and RAC3
are ubiquitously expressed. (Didsbury et al. 1989; Haataja et al. 1997)
Figure 22: HOXD10 knockdown is associated with an upregulation of RAC2 in ES cell lines. HOXD10 was significantly downregulated to less than 30% by siRNA or shRNA interference. Control cells were treated with a neg. control siRNA. After HOXD10 knockdown RAC2 was significantly upregulated in three Ewing sarcoma cell lines. Gene expression was analyzed on mRNA level by qRT-PCR. Microarray result could be confirmed. p < 0.05 (*), not significant (n.s.), NTC is non-template control.
MICROARRAY ANALYSIS REVEALS POSSIBLE DOWNSTREAM HOX TARGETS
78
Figure 22 on p. 77 shows RAC2 expression on mRNA level after HOXD10 knockdown in
several Ewing sarcoma cell lines. In SK-N-MC and EW-7 HOXD10 was downregulated by
siRNA interference, in A-673 and also SK-N-MC HOXD10 knockdown was achieved by
retroviral gene transfer. In all cell lines RAC2 expression increased after HOXD10
knockdown.
3.5.3 HOX knockdown seems to cause a downregulation of HAUS6
Microarray data revealed that HAUS6 was downregulated after transient HOXD10
knockdown in SK-N-MC and EW-7. The protein encoded by HAUS6 is a subunit of HAUS
which is a critical 8-subunit protein complex that regulates centrosome and spindle
integrity. It localizes to interphase centrosomes and to mitotic spindle microtubules, its
disruption causes microtubule dependent fragmentation of centrosomes and
destabilization of kinetochore microtubules. Just as HOX genes, HAUS is evolutionary
conserved and shares homology to a similar protein complex in Drosophila called
Augmin. (Lawo et al. 2009).
Figure 23: HOXD10 knockdown is associated with a downregulation of HAUS6. Gene expression was analyzed on mRNA level by qRT-PCR. HAUS6 expression only changed significantly in SK-N-MC and EW-7 after triple HOX knockdown. p < 0.05 (*), not significant (n.s.), NTC is non-template control.
Interestingly, microarray results were only confirmed in cells in which all three HOX
genes were downregulated. Figure 23 shows that, in contrast to microarray results,
HOXD10 downregulation alone didn’t lead to a clear downregulation of HAUS6 in
SK-N-MC and EW-7. Triple HOX knockdown, however, caused a significant
downregulation of this gene, 27% in SK-N-MC and 73% in EW-7. Further information
about HOX gene expression of triple HOX knockdowns can be found in 3.3.2, method
of transfection is described in detail in 2.2.2.
3.5.4 HOX knockdown seems to cause a downregulation of EEF1D
Microarray data also revealed that EEF1D was downregulated in SK-N-MC after
transient HOXD11 knockdown using HOXD11_5 siRNA.
Figure 24 illustrates EEF1D expression on mRNA level after HOX knockdown in several
RESULTS
79
Ewing sarcoma cell lines. SK-N-MC and EW-7 were transfected with HOXD11_3 siRNA.
Although HOXD11 was downregulated to less than 40%, EEF1D expression didn’t differ
from control cells. In A-673 and SK-N-MC pSIREN HOXD11 cells, however, a
downregulation of EEF1D to 40% could be detected, in A-673 this downregulation was
significant (p < 0.001). Interestingly, analogically to HAUS6 expression (see Figure 23), a
significant downregulation of EEF1D was achieved by triple HOX knockdown; EEF1D
mRNA levels amounted 27% in SK-N-MC and 46% in EW-7 compared to control cells.
3.5.5 HOXD13 knockdown causes a downregulation of ATRX in Ewing
sarcoma cells
ATRX is a member of the SWI2/SNF2 family of chromatin remodelers. (Picketts et al.
1996) It is associated with ATR-X syndrome, a severe non-progressive X-linked mental
retardation with an unusal form of thalassemia. Affected boys show a typical facial
appearance, severe psychomotor retardation genital and multiple other congenital
abnormalities. Female carriers only have mild hematologic changes but are otherwise
healthy. (Gibbons et al. 1995) Comparison of human and murine ATRX nucleotide
sequence revealed 85% identity and thus, just as HOX genes, a high level of
evolutionary conservation. (De La Fuente et al. 2011; Picketts et al. 1998) Recently
ATRX also appeared more and more in the context of malignant tumors. (Berbegall et
al. 2014; Chen et al. 2014; Haberler & Wohrer 2014; Marinoni et al. 2014)
Interestingly, microarray data resulted in a downregulation of ATRX after transient
HOXD13 knockdown.
Figure 25 on the following page shows ATRX expression in three Ewing sarcoma cell
lines after HOXD13 knockdown. In SK-N-MC and EW-7 ATRX was downregulated to
Figure 24: EEF1D expression after HOXD11 knockdown. Gene expression was analyzed on mRNA level by qRT-PCR. Control cells were treated with a neg. control siRNA/shRNA. Upper panel: EEF1D expression only changed significantly in SK-N-MC and EW-7 after triple HOX knockdown. Lower panel: SK-N-MC and A-673 pSIREN HOXD11 cells show lower EEF1D mRNA levels than control cells. p < 0.01 (**), p < 0.001 (***), not significant (n.s.), NTC is non-template control.
HOX GENES SEEM TO INTERVENE IN BMP SIGNALING IN ES CELLS
80
48% and 65% after HOXD13 suppression by siRNA interference. After triple HOX
knockdown ATRX expression amounted 39% and 60% compared to control cells.
Reduced ATRX expression was also observed in pSIREN HOXD13 cells.
Figure 25: HOXD13 knockdown is associated with downregulation of ATRX. Gene expression was analyzed on mRNA level by qRT-PCR. HOXD13 knockdown resulted in reduced ATRX expression, after triple HOX knockdown an even stronger downregulation of ATRX was detectable. p < 0.05 (*), p < 0.01 (**), p < 0.001 (***), not significant (n.s.), NTC is non-template control.
3.6 HOX genes seem to intervene in BMP signaling in ES cells
BMP signaling is, among other things, crucial for bone and cartilage formation (see
1.3). Interestingly, HOX knockdown in Ewing sarcoma cells was associated with
significant downregulation of several components of the BMP pathway. Gene
expression of ligands, co-factors and common BMP targets was decreased in Ewing
sarcoma cells with low HOX expression.
3.6.1 BMP2 and BMP4 expression is reduced after HOX knockdown
HOXD10, HOXD11 and HOXD13 knockdown in Ewing sarcoma cells caused a significant
downregulation of BMP2 and BMP4, respectively. These two BMPs do not only belong
to the bone morphogenetic proteins with greatest osteogenic activity in vitro (Cheng et
al. 2003) but were also revealed to be essential for cartilage formation. (Pizette &
Niswander 2000)
Figure 26 illustrates BMP2 and BMP4 expression on mRNA level under HOX
suppression. In SK-N-MC and A-673 HOXD10, HOXD11 and HOXD13 were successfully
downregulated by retroviral gene transfer. In both cell lines, HOX knockdown was
associated with significantly decreased BMP expression. In some cases BMP4
expression was not even detectable. After triple HOX knockdown in two other Ewing
cell lines (MHH-ES-1 and EW-7), BMP expression was only determined in control cells
(data not shown).
RESULTS
81
Figure 26: Decrease of BMP expression after HOX knockdown. Gene expression was analyzed on mRNA level by qRT-PCR. Individual HOX downregulation (less than 30%) by retroviral gene transfer resulted in significantly reduced BMP2 and BMP4 expression in two ES cell lines. p < 0.05 (*), p < 0.01 (**), p < 0.001 (***), not significant (n.s.), not detectable (n.d.), NTC is non-template control.
3.6.2 HOX knockdown leads to downregulation of SMAD4
SMAD4 is an important component in BMP signaling. It forms complexes with
R-SMADs which transfer into the nucleus where they, along with cofactors, control
transcription of various target genes (see 1.3). In four Ewing sarcoma cell lines triple
HOX knockdown was associated with significant decrease of SMAD4 expression.
Figure 27: Decrease of SMAD4 expression under HOX suppression. Gene expression was analyzed on mRNA level by qRT-PCR. After triple HOX knockdown by siRNA interference downregulation of SMAD4 was detectable in several ES cell lines. p < 0.05 (*), p < 0.01 (**), p < 0.001 (***), not significant (n.s.), not detectable (n.d.), NTC is non-template control.
Figure 27 illustrates SMAD4 expression on mRNA level under HOX suppression.
HOXD10, HOXD11 and HOXD13 were successfully downregulated by siRNA
interference. In three of four cell lines SMAD4 expression was significantly decreased
after HOX knockdown. Gene expression in EW-7 was not significantly changed after
HOX knockdown. Individual HOX knockdown did not lead to a significant change of
SMAD4 expression (data not shown). Problems with downregulation of individual HOX
genes due to functional redundancy, compensation mechanisms and even due to a
sort of recruitment will be addressed in 4.4 (see p. 110).
HOX GENES SEEM TO INTERVENE IN BMP SIGNALING IN ES CELLS
82
3.6.3 HOX knockdown is associated with a decrease of RUNX2 expression
RUNX2 is not only the master regulator of osteoblast differentiation but also maintains
a major role in terminal chondrocyte differentiation. (Ducy et al. 1997; Komori 2010) It
is a common BMP target and also an important cofactor in BMP signaling since it was
identified to physically interact with R-SMADs. (Lee et al. 2000; Zhang et al. 2000)
Figure 28 illustrates RUNX2 expression on mRNA level under HOX suppression in
various ES cell lines. Triple HOX knockdown was commonly associated with a decrease
of RUNX2 expression. In SK-N-MC and A-673, HOX genes were downregulated by
retroviral gene transfer, respectively. RUNX2 expression was also reduced in cells with
Figure 28: Decrease of RUNX2 expression under HOX suppression. Gene expression was analyzed on mRNA level by qRT-PCR. In four ES cell lines, triple HOX knockdown was achieved by siRNA interference. In SK-N-MC and A-673, HOXD10, HOXD11 and HOXD13 were also downregulated by retroviral gene transfer, respectively. p < 0.05 (*), p < 0.01 (**), p < 0.001 (***), not significant (n.s.), not detectable (n.d.), NTC is non-template control.
3.6.4 Especially HOXD13 knockdown leads to reduced expression of
collagen-encoding genes
Collagens are not only common targets of BMP signaling but also downstream targets
of RUNX2. BMPs and RUNX2 were demonstrated to activate COL1A1 which encodes
type I collagen. BMP2-induced transcription of type X collagen gene is suggested to
involve cooperation of RUNX2 and SMAD proteins. (Ducy et al. 1997; Leboy et al. 2001;
Lee et al. 2000; Volk et al. 1998)
Figure 29 shows collagen gene expression on mRNA level after HOX knockdown.
COL1A1 expression was reduced after HOXD10, HOXD11 and HOXD13 knockdown,
respectively. HOXD13 knockdown was additionally associated with a significant
decrease of COL2A1 and COL10A1 expression.
RESULTS
83
Figure 29: Decrease of expression of collagen-encoding genes after HOX knockdown. Gene expression was analyzed on mRNA level by qRT-PCR. Especially HOXD13 downregulation (less than 30%) by retroviral gene transfer resulted in significantly reduced expression of collagen-encoding genes in two ES cell lines. Type I, type II and type X collagens were affected. COL1A1 expression was also reduced after HOXD10 and HOXD11 knockdown. p < 0.05 (*), p < 0.01 (**), p < 0.001 (***), not significant (n.s.), not detectable (n.d.), NTC is non-template control.
To investigate if HOX knockdown influences the angiogenesis pattern of Ewing
sarcoma cell lines, the endothelial cell tube formation assay was performed using BD
Matrigel™ as described in 2.2.9.1. The experiment was carried out in 96-well culture
plates. 40,000-70,000 transiently transfected Ewing sarcoma cells were grown on
gelled Matrix. Tube formation was analyzed by fluorescence microscopy. Images were
taken by use of a Nikon Eclipse TS 100 with an attached Nikon Coolpix 5400 camera.
RNA was isolated, cDNA was synthesized and HOX gene knockdown was determined
on mRNA level by qRT-PCR. In those cell lines which had been treated with a specific
HOX siRNA, gene expression of HOXD10, HOXD11 and HOXD13 was downregulated to
less than 45%, respectively.
Figure 30 on p. 84 shows that in three Ewing sarcoma cell lines, neither
downregulation of HOXD10 nor HOXD11 and HOXD13 led to a change of endothelial
tube formation. Wildtypes of SK-N-MC and A-673 didn’t form any endothelial tubes at
all. Neither these two cell lines did after treatment with a negative control siRNA or
any HOX siRNA. RD-ES wildtype shows only weak tube formation but this cell line still
formed tubes after treatment with a negative control siRNA or any HOX siRNA.
HOX GENES PROMOTE PROLIFERATION OF EWING SARCOMA CELLS
84
3.8 HOX genes promote proliferation of Ewing sarcoma cells
To determine whether proliferation rate changes under HOX gene suppression pSIREN
HOX cells of two Ewing sarcoma cell lines were seeded in particular 96-well plates.
These plates contain integral sensors which measure cell proliferation according to
electrode impedance. The proliferation experiment was performed by use of the
xCELLigence Real-Time Cell Analyzer (see 2.2.9.1).
In SK-N-MC and A-673 HOXD10, HOXD11 and HOXD13 were downregulated by
retroviral gene transfer (pSIREN cells). SK-N-MC and A-673 neg. pSIREN which were
treated with a negative control siRNA served as control. Cells were seeded in
hexaduplicates, respectively, and proliferation rate was determined every 4 hours for
10 days.
Figure 31 shows proliferation rates of A-673 and SK-N-MC after HOX gene knockdown.
The upper panel illustrates that all A-673 pSIREN cells suffer from a decrease of
proliferation rate in comparison to neg. pSIREN control cells. A-673 neg. pSIREN cells
achieved a cell index value of 6 after 100 hours of incubation. A-673 pSIREN HOXD11
cells also achieved this cell index value, but not before 150 hours of incubation, cell
index values of pSIREN HOXD10 and pSIREN HOXD13 cells were much lower. The lower
Figure 30: Endothelial cell tube formation assay. SK-N-MC, A-673 and RD-ES were transiently transfected with specific HOX siRNAs. HOX gene expression was downregulated to less than 45%. Endothelial differentiation potential of all three cell lines did not change after transient RNA interference. Images were taken by fluorescence microscopy at 4x magnification.
RESULTS
85
panel of Figure 31 shows proliferation rates of SK-N-MC pSIREN cells in comparison to
neg. pSIREN cells. Altogether, all SK-N-MC cells showed lower cell index values in
comparison to A-673 cells. Since A-673 possesses a p53 mutation unlike
SK-N-MC, higher cell index values for A-673 are the logical consequence. Proliferation
of SK-N-MC pSIREN HOXD13 and HOXD11 was delayed in comparison to neg. pSIREN
control cells; this effect was significant in pSIREN HOXD13 only though. SK-N-MC
pSIREN HOXD10 acted in an extraordinary and unexpected way: it achieved cell index
values of 5.3 after 150 hours and thus showed a significantly higher proliferation than
neg. pSIREN control cells and the two other pSIREN cells. This behavior seemed to be
uncommon but correlated with the results of the colony forming assay (see p. 56).
Another doctoral student was intended for the repeat experiment.
Figure 31: Decreased cell proliferation under HOX suppression. In A-673 and SK-N-MC HOXD10, HOXD11 and HOXD13 were downregulated by retroviral gene transfer, neg. pSIREN cells were treated with a control siRNA. Cell index was determined according to change of electrode impedance by use of xCELLigence Real-Time Cell Analyzer. Upper panel: In all three A-673 pSIREN HOX cells cell index values were significantly lower than in neg. pSIREN cells. Lower panel: In SK-N-MC, proliferation rate of neg. pSIREN cells was higher than the one of pSIREN HOXD11 and HOXD13 cells. pSIREN HOXD10 cells proliferated stronger than control cells. Error bars represent standard deviation of sextuplicates. p < 0.05 (*), p < 0.01 (**), p < 0.001 (***).
HOX KNOCKDOWN INHIBITS ANCHORAGE-INDEPENDENT GROWTH OF ES CELLS
86
3.9 HOX knockdown inhibits anchorage-independent growth of ES cells
A potential influence of HOX gene knockdown on anchorage-independent growth
capacity of ES cells was monitored in the colony-forming assay. As described in detail
in 2.2.9.2, Ewing sarcoma cells were resuspended in a certain cell resuspension
solution and then mixed with methylcellulose-based media before they were
distributed equally onto 35 mm culture plates. Ewing sarcoma cell clones in which HOX
gene expression was downregulated by retroviral gene transfer were used: A-673
Figure 32: HOX genes promote anchorage-independent growth capacity of Ewing sarcoma cells. Upper panel: Ewing sarcoma cell clones in which HOXD10, HOXD11 and HOXD13 were downregulated by retroviral gene transfer were seeded in methylcellulose-based media. Cells treated with a negative control siRNA served as control. After two weeks of incubation at 37°C photos were taken. Lower panels: Left chart illustrates virtual culture plates before counting colonies by use of Image J software. Right chart shows numbers of colonies counted. Colonies were counted manually and automatically three times. In both cell lines, pSIREN HOXD10, HOXD11 and HOXD13 cells formed fewer colonies than control cells.
RESULTS
87
experiments were performed for SK-N-MC. Cells which had been treated with a
negative control siRNA, neg. pSIREN, served as control.
After two weeks of incubation at 37°C images were taken by use of Canon EOS 600D
and colonies were counted manually and automatically by means of Image J software.
Colonies were counted three times, altogether leading to the same result regarding
descending order of cell clones. Left panel of Figure 32 shows culture plates of this
experiment after two weeks of incubation at 37°C. Upper chart of the right panel
using Image J. Altogether, all A-673 cell clones formed more colonies in comparison to
the particular SK-N-MC cell clones, its p53 mutation could be the reason for this. In
both cell lines neg. pSIREN control cells formed most colonies. Colonies of SK-N-MC
neg. pSIREN cells were also bigger than the ones of the pSIREN cells. After HOX
downregulation by retroviral gene transfer, all three cell clones, pSIREN HOXD10,
pSIREN HOXD11 and pSIREN HOXD13 of A-673 and SK-N-MC, formed fewer colonies
than control cells. This effect seemed to apply especially to pSIREN HOXD11 cells.
Summing up, downregulation of HOXD10, HOXD11 and HOXD13, decreased
anchorage-independent growth capacity in these two Ewing sarcoma cell lines.
3.10 HOX genes promote chondrogenic differentiation in Ewing
sarcoma cells
Since there are many publications which describe the role of HOX genes in limb
development and bone formation (see p. 6), we investigated whether HOX gene
knockdown influenced chondrogenic and osteogenic differentiation potential of Ewing
sarcoma cells.
Potential of chondrogenic differentiation of Ewing sarcoma cell lines was analyzed
using a special differentiation kit which had originally been developed for the
chondrogenic differentiation of mesenchymal stem cells. The experiment was carried
out in 6-well culture plates. SK-N-MC and A-673 were seeded out in micromass
cultures and cultivated under differentiating conditions for two weeks. Ewing sarcoma
cells in which HOX gene expression was downregulated by retroviral gene transfer
were used: SK-N-MC or A-673 with pSIREN HOXD10, pSIREN HOXD11, pSIREN HOXD13
expression. Cells treated with a negative control shRNA (neg. pSIREN) served as
HOX GENES PROMOTE CHONDROGENIC DIFFERENTIATION IN EWING SARCOMA CELLS
88
control. For a detailed description of this experiment, see 2.2.9.5.
Cells were seeded in control growth medium and in chondrogenic differentiation
medium. After 14 days, cells were processed for gene expression analysis or Alcian
blue staining. Gene expression was analyzed on mRNA level, comparing cells which
had grown under differentiation conditions with those which had grown in control
medium.
Cells in control medium grew and proliferated much better in comparison to those
under differentiating conditions. Although differentiation medium was changed almost
every day, a lot of SK-N-MC cells died under differentiating conditions. This especially
applied to pSIREN HOX cells, however. There was no problem with neg. pSIREN cells;
under differentiating conditions they formed dendritic branches (see
20x magnification, Figure 33). Figure 33 illustrates that Ewing sarcoma cells in
micromass cultures, neg. pSIREN cells as well as pSIREN HOX cells, proliferated
normally in control growth medium. A lot of SK-N-MC pSIREN HOX cells died under
Figure 33: Ewing sarcoma cells after 14 days under chondrogenic differentiation conditions. neg. pSIREN is the control cell line which was treated with a negative control siRNA. In pSIREN HOXD11 and HOXD13 the correspondent gene was downregulated by retroviral gene transfer. A lot of cells of pSIREN HOXD11 and HOXD13 cells died under differentiating conditions. Cells grew and proliferated in control medium though, neg. pSIREN cells grew under control and differentiating conditions. Under differentiating conditions, neg. pSIREN cells formed dendritic branches. Images were taken by microscopy at 10x and 20x magnification.
RESULTS
89
differentiating conditions, this even applied more to pSIREN HOXD13 than to pSIREN
HOXD11 cells (see 10x magnification). This did not apply to A-673, however; this cell
line grew under differentiating conditions as well as in control medium.
The chondrogenic differentiation experiment was repeated several times. On the one
hand RNA was isolated for gene expression analysis (see Figure 34), on the other hand
cells were processed for Alcian blue staining. Despite several attempts and
modifications of the protocol, Ewing sarcoma cells didn’t dye Alcian blue positive.
Neither cells which had grown under differentiation conditions, nor cells which had
grown in control medium could be stained. This also seemed to be independent from
HOX gene expression since neg. pSIREN as well as pSIREN HOX cells could not be
stained.
For gene expression analysis, RNA was isolated using Gene JET™ Purification Kit
(2.2.3.2), cDNA was synthesized as usual. Marker genes of chondrogenic differentiation
like SOX9, COL2A1, COL10A1 and IHH were determined on mRNA level by qRT-PCR.
Different stages of chondrogenesis with more or less typical gene signatures are
described on p. 16. Figure 34 illustrates gene expression patterns of SK-N-MC and
A-673 cells after 14 days under chondrogenic differentiation conditions in comparison
to 14 days in control growth medium.
Figure 34: Gene expression analysis after 14 days under chondrogenic differentiation conditions. After 14 days of incubation, media were removed, RNA was isolated and cDNA was synthesized. Expression of marker genes of chondrogenesis was determined on mRNA level by qRT-PCR. Control cells were incubated in control growth medium for 14 days. Chondrogenic differentiation of SK-N-MC under HOX suppression seems to have stopped at an earlier stage compared to control cells since only early markers of chondrogenesis like SOX9 and COL2A1 were upregulated. In A-673 as well, markers of late chondrogenesis were not significantly upregulated under HOX suppression. Markers of chondrogenesis: SRY (sex determining region Y)-box 9 (SOX9), collagen type II alpha I (COL2A1), collagen type X alpha I (COL10A1), indian hedgehog (IHH). NTC is non-template control. p < 0.05 (*), p < 0.01 (**), p < 0.001 (***), not significant (n.s.).
EWING SARCOMA CELLS ARE CAPABLE OF OSTEOGENIC DIFFERENTIATION
90
SK-N-MC significantly upregulated early markers of chondrogenic differentiation like
SOX9 and partially COL2A1 under differentiating conditions. Even under HOX
suppression, these early marker genes could be upregulated; COL2A1 only in neg.
pSIREN and pSIREN HOXD13 cells though. Marker genes of later chondrogenic
differentiation like COL10A1 and IHH, however, were not significantly increased in
SK-N-MC under HOX suppression. This indicates that chondrogenic differentiation
stopped in SK-N-MC pSIREN cells at an earlier stage than in control cells. Interestingly,
mRNA levels of COL2A1, COL10A1 and IHH in pSIREN HOXD11 and pSIREN HOXD13
cells which grew in control medium were also much lower than levels in control cells.
RUNX2 was revealed to regulate late chondrocyte differentiation (see 1.2).
Interestingly, RUNX2 expression significantly increased in SK-N-MC neg. pSIREN cells
which had grown under differentiation conditions (data not shown). In pSIREN HOX
cells, RUNX2 expression was lower than in neg. pSIREN cells. This indicates an
advanced stage of chondrocyte differentiation of neg. pSIREN cells.
In A-673 marker genes of early chondrocyte differentiation, SOX9 and COL2A1, were
similarly upregulated under differentiating conditions. Markers of later chondrogenic
differentiation were not significantly upregulated, only pSIREN HOXD10 cells showed
increased COL10A1 mRNA levels.
Gene expression analysis and observed increased cell death under differentiating
conditions indicate reduced potential of chondrogenic differentiation of Ewing cells
under HOX suppression.
3.11 Ewing sarcoma cells are capable of osteogenic differentiation
- irrespective of HOX expression
Potential of osteogenic differentiation of Ewing sarcoma cell lines was also
investigated using a special differentiation kit which had originally been developed for
the osteogenic differentiation of mesenchymal stem cells. The experiment was carried
out in 6-well culture plates as well but unlike the chondrogenic differentiation assay, in
this experiment SK-N-MC and A-673 were distributed equally into each well of the
culture plate and then cultivated under differentiating conditions for three weeks.
Cells were the same as the ones which had been used for the chondrogenic
differentiation experiment. For a detailed description of this experiment and
RESULTS
91
particularly how cells were seeded in comparison to the chondrogenic differentiation
assay, see 2.2.9.4.
After 21 days of incubation images were taken by microscopy (see Figure 35) and cells
were processed for gene expression analysis (see Figure 36) or Alizarin red staining
(see Figure 37). The experiment was repeated several times because osteogenic
differentiation could be evaluated by either gene expression or Alizarin red staining.
Figure 35 shows a representative experiment with SK-N-MC. pSIREN HOXD11 and
pSIREN HOXD13 cells were compared with neg. pSIREN cells. Regardless of HOX gene
expression SK-N-MC cells grew and proliferated under osteogenic differentiation
conditions, in contrast to chondrogenic differentiation conditions. Cells which had
grown under differentiation conditions seemed to be bigger than respective control
cells; this could indicate a successful differentiation. Interestingly, pSIREN HOX cells
differed from neg. pSIREN cells morphologically, see 20x magnification.
For gene expression analysis RNA was isolated using Gene JET™ Purification Kit (see
2.2.3.2), cDNA was synthesized as usual. Gene expression of several marker genes of
Figure 35: Ewing sarcoma cells after 21 days under osteogenic differentiation conditions. neg. pSIREN is the control cell line which was treated with a negative control siRNA. In pSIREN HOXD11 and HOXD13 the correspondent gene was downregulated by retroviral gene transfer. Regardless of HOX gene expression SK-N-MC cells grew and proliferated. Cells which had grown under osteogenic differentiation conditions seemed to be bigger than respective control cells, indicating a successful differentiation maybe. Furthermore pSIREN HOX cells differed from neg. pSIREN cells. Images were taken by microscopy at 10x and 20x magnification.
EWING SARCOMA CELLS ARE CAPABLE OF OSTEOGENIC DIFFERENTIATION
92
osteogenesis was analyzed on mRNA level by qRT-PCR, for example expression of
BGLAP (osteocalcin), SPP1 (osteopontin), COL1A1 (collagen type I alpha I), ALPL
(alkaline phosphatase), SP7 (osterix) and RUNX2 (runt-related transcription factor 2).
Different stages of osteogenesis with more or less typical gene signatures are
illustrated on p. 16.
In SK-N-MC and A-673 HOXD10, HOXD11 and HOXD13 had been downregulated by
retroviral gene transfer, respectively. After 21 days under differentiation conditions
gene expression of several osteogenic markers differed significantly from respective
control cells (cells which had grown in control medium for 21 days). A specific pattern
of this difference, however, was not detectable in these two cell lines (see Figure 36).
In A-673 SP7, ALPL, SPP1 and BGLAP were upregulated, mRNA levels of RUNX2 and
COL1A1 were significantly lower in differentiated cells compared to control cells. In
SK-N-MC only SP7, COL1A1 and BGLAP were upregulated, mRNA levels of other gene
markers of osteogenesis didn’t change significantly. In both cell lines gene expression
pattern of pSIREN HOX cells didn’t differ significantly from respective neg. pSIREN cells.
Ewing sarcoma cells, regardless of HOX gene expression, seemed to be able to
differentiate osteogenically. This indicates that downregulation of HOXD10, HOXD11
Figure 36: Gene expression analysis after 21 days under osteogenic differentiation conditions. After 21 days of incubation, media were removed from culture plates. RNA was isolated and cDNA was synthesized. Gene expression of markers of osteogenesis was determined on mRNA level by qRT-PCR. Control cells were incubated in control growth medium for 21 days. In SK-N-MC and A-673 pSIREN HOX cells which had grown under differentiation conditions expression of several genes differed from respective control cells, a specific pattern was not detectable though. Marker genes of osteogenesis: osteocalcin (BGLAP), osteopontin (SPP1), collagen type I alpha I (COL1A1), alkaline phosphatase (ALPL), osterix (SP7), runt-related transcription factor 2 (RUNX2). NTC is non-template control. p < 0.05 (*), p < 0.01 (**), p < 0.001 (***), not significant (n.s.).
RESULTS
93
or HOXD13 doesn’t influence osteogenic differentiation potential of Ewing sarcoma
cells. This hypothesis was verified by repeating the experiment and this time analyzing
differentiation of cells by Alizarin red staining. A detailed protocol of staining method
can be found in 2.2.9.4.
Figure 37 shows SK-N-MC and A-673 after 21 days of incubation under osteogenic
differentiation conditions. Media were removed and cells were stained with Alizarin
red which usually indicates the presence of calcific deposition of cells of the osteogenic
lineage. Images were taken by use of a Nikon Eclipse TS 100 with an attached Nikon
Coolpix 5400 camera.
Cells which had been incubated in control medium could not be stained with Alizarin
red. Figure 37 illustrates Alizarin red positivity of SK-N-MC and A-673 cells which had
grown under osteogenic differentiation conditions, indicating a successful osteogenic
Figure 37: Alizarin red staining of Ewing sarcoma cells after 21 days of incubation under osteogenic differentiation conditions. Left row of upper and lower panel shows top view of Alizarin red stained culture plates after 21 days of incubation under osteogenic differentiation conditions. Control cells had been incubated in control medium and were Alizarin red-negative. Images were taken by use of a Nikon Eclipse TS 100 with an attached Nikon Coolpix 5400 camera. All cells which had grown under differentiation conditions stained Alizarin red positive, indicating a successful osteogenic differentiation. A difference between neg. pSIREN and pSIREN HOX cells was not detectable.
EWING SARCOMA CELLS ARE CAPABLE OF OSTEOGENIC DIFFERENTIATION
94
differentiation. A grading of Alizarin red staining, however, was indistinguishable.
Regardless of HOX gene expression, cells stained Alizarin red-positive after 21 days of
osteogenic differentiation conditions. A difference between neg. pSIREN cells and
pSIREN HOX cells was not detectable. Thus, Alizarin red staining correlated with results
of gene expression analysis.
DISCUSSION
95
4 Discussion
4.1 Overexpression of HOXD10, HOXD11 and HOXD13 in Ewing
sarcoma
Here we present another malignant tumor with remarkable HOX gene expression.
Microarray data revealed HOXD10, HOXD11 and HOXD13, all three of them, to be
strongly upregulated in primary Ewing sarcoma tissue samples and Ewing sarcoma cell
lines. HOXD10, HOXD11 and HOXD13 expression varies in other tissues such as normal
healthy tissue and fetal tissue as well as neuroblastoma tissues; in general, these three
HOX genes are detectable, but only to a very small negligible extent. According to
Kessel and Gruss (1991) a certain “HOX code” defines each vertebral segment.
According to this, each structure of the body, each tissue is characterized by a
particular set of active HOX genes and a change of this HOX code will cause homeotic
transformations, analogous to homeotic mutations in drosophila fly which were
mentioned in the introduction of this doctoral thesis. (Kessel & Gruss 1991) The theory
of a certain “HOX code” for each tissue is compatible with our microarray data: each
tissue seems to have a particular HOX gene profile. Strong upregulation of HOXD10,
HOXD10 and HOXD13, however, can only be observed in Ewing sarcoma samples. This
specificity especially applies to HOXD13. Interestingly, HOXD10 expression was also
detectable in neuroblastoma samples, a tumor which is derived from neural crest cells
(Louis & Shohet 2015). This is interesting in this sense because currently a neural crest-
derived precursor cell at the transition to mesenchymal and endothelial differentiation
is assumed to be the cell of origin in Ewing sarcoma. (Staege et al. 2004) HOXD10
seems to be important in nervous system in general. It was shown to be involved in
lumbar motor neuron patterning and spinal cord development on the one hand, and
brain tumors on the other hand. (Abdel-Fattah et al. 2006; Lance-Jones et al. 2001; Lin
& Carpenter 2003). Moreover, a mutation of HOXD10 is associated with Charcot-
Marie-Tooth disease, a hereditary motor and sensory neuropathy. (Shrimpton et al.
2004)
HOX genes were initially identified to be master regulators of development, specifying
the body segments along the anterior-posterior axis. (Lewis 1978; McGinnis &
Krumlauf 1992) However, as already mentioned in the introduction, deregulated HOX
OVEREXPRESSION OF HOXD10, HOXD11 AND HOXD13 IN EWING SARCOMA
96
gene expression was observed in many different malignomas, especially in solid
tumors but also in hematological neoplasias. In AML certain translocations result in
leukemogenic fusion proteins consisting of HOXD11 and HOXD13 among other HOX
genes, and the nucleoporin gene NUP98. NUP98 is part of a certain protein complex
which controls transport from the cytoplasm into the nucleus and vice versa. It also
maintains a role in transcription, cell cycle progression and mitotic spindle formation.
Induction of HOX-NUP98 fusion in bone marrow cells lead to leukemic transformation
with increase of white blood cells, anemia, decrease of lymphoid progenitors as well as
increased proliferation of immature myeloid cells. Moleculargenetic consequences of
HOX-NUP98 fusion in hematological malignancies have been investigated broadly and
provided insight into pathogenesis of leukemia. (Gough et al. 2011) In contrast to this,
mechanisms which lead to a deregulation of HOX gene expression or direct
consequences of an upregulation of certain HOX genes in solid tumors are less
understood. HOX genes were shown to be involved in multiple cellular processes
which control cell cycle and apoptosis, adhesion and migration as well as
differentiation and invasion. They are assumed to have direct effects on receptor
signaling. (Shah & Sukumar 2010) However, little is known about specific HOX
functions in malignant tumors, as is true for HOXD10, HOXD11 and HOXD13.
Pathogenic mechanisms of HOXD10, especially in context of breast cancer, have yet
been surfaced at best. HOXD10 was shown to be a direct target of miR-10b which is
highly expressed in breast cancer cells. HOXD10 expression is inhibited by miR-10b; it is
being lost with increasing degree of malignancy and re-expression compromises
features of malignancy such as migration and progression. miR-10b, on the other hand,
positively regulates cell migration and invasion and induces distant metastasis. (Carrio
et al. 2005; Ma et al. 2007) Since then, upregulation of miR-10b with inhibition of
HOXD10 expression has been observed in several other malignant tumors, among
others in bladder cancer, brain tumors and gastrointestinal tumors. In most cases,
HOXD10 seems to have an anti-tumorigenic effect since its gene expression levels were
commonly low and stronger expression was associated with better differentiated, less
invasive, in general less malignant phenotypes associated with better prognosis.
(Carrio et al. 2005; Liu et al. 2012; Nakayama et al. 2013; Osborne et al. 1998; Sun et
al. 2011; Wang et al. 2015; Xiao et al. 2014) Furthermore, malignomas were described
DISCUSSION
97
wherein HOXD10 was inactivated by hypermethylation. (Bennett et al. 2009; Wang et
al. 2012)
Abate-Shen (2002) divided aberrant HOX gene expression in cancer into three different
categories. In the first and most frequent category particular HOX genes are
re-expressed in tumor cells. The malignant cells originate from cells which had already
expressed those particular HOX genes during development, i.e. when they “were
forced to” differentiate. In the second category particular HOX genes are newly
expressed in tumor cells, in other words the cells of which the tumor cells are derived
usually don’t express these certain HOX genes during development. Only very few
examples fall into this category. In the third category particular HOX genes are
normally expressed in highly-differentiated tissues and corresponding tumor cells
show a downregulation of these genes. (Abate-Shen 2002) Tumors with a
downregulation of HOXD10 by miR-10b as mentioned earlier fall into the third
category. In some cases tumors show very high levels of HOXD10 expression and
HOXD10 levels are associated with invasive and proliferative phenotypes. This applies
to head and neck squamous cell cancer, for example. (Sharpe et al. 2014) Those cases
correspond to Abate-Shen’s (2002) first category. Interestingly, in colorectal cancer
HOXD10 expression can be very high or lost with degree of invasiveness, both is
possible. (Bhatlekar et al. 2014; Wang et al. 2015)
Compared to HOXD10, HOXD11 and HOXD13 appear much less frequently in context of
malignancies. As already mentioned before, HOXD11 and HOXD13, both of them,
turned out to be fusion partner genes of NUP98 in hematological malignancies, such as
MDS and AML with certain translocations. (Taketani et al. 2002) Only few cases are
described, however, in which HOXD11 or HOXD13 expression is altered in solid tumors.
HOXD11 was shown to be aberrantly methylated in breast cancer, ovarian cancer and
malignant melanoma. (Cai et al. 2007; Furuta et al. 2006; Miyamoto et al. 2005) An
overexpression of HOXD11 was observed in one ovarian cancer cell line and few ENT
tumors (Morgan et al. 2010; Rodini et al. 2012) where HOXD11 knockdown partially
impaired invasion (Sharpe et al. 2014). Aberrant methylation of HOXD13 was only
described in malignant melanoma, glioblastomas and extrahepatic
cholangiocarcinoma. (Furuta et al. 2006; Shinawi et al. 2013; Y. Shu et al. 2011)
HOXD13 expression, in general, was determined in multiple tumor samples, its
OVEREXPRESSION OF HOXD10, HOXD11 AND HOXD13 IN EWING SARCOMA
98
potential functions or capacities, however, remain entirely unsolved. (Cantile et al.
2009)
It was already mentioned earlier that HOX genes are arranged in four clusters A - D on
four different chromosomes (see p. 4-4 ). Within each cluster HOX genes follow a
certain order from the 3’ to the 5’ end with genes at the 3’ end being expressed not
only in the more anterior parts of the body but also at an earlier moment of time than
5’ end genes. According to this “spatial” and “temporal collinearity” especially caudal
body parts and limbs express 5’ HOX genes of all four HOX clusters. (Duboule & Morata
1994) To detect a potential similar mechanism of collinearity in Ewing sarcoma tissue,
we also examined expression of posterior HOX genes of the other three clusters, i.e.
gene expression of the paralogs of HOXD10, HOXD11 and HOXD13. Interestingly, some
of them were also highly expressed in Ewing sarcoma samples, for example HOXB13.
Altogether, however, there was also a strong expression in tissue samples which
served as control. Paralogs were way less specific than respective HOXD genes.
Mechanism of collinearity doesn’t seem to be true here, especially since expression of
posterior HOX genes was shown to be independent from tumor site. (Svoboda et al.
2014)
Since HOXD9 to HOXD13, all of them appear in context of limb development and they
are assumed to have arisen from one ancestral HOX gene by duplication (see Figure 3,
p. 4), we further examined gene expression of HOXD9 and HOXD12 in Ewing sarcoma
tissue compared to normal tissue. Expression of these two genes, however, differed a
lot from gene expression of other posterior HOXD genes. It could be observed
ubiquitously in all tested tissues and didn’t show any specificity for Ewing sarcoma.
Gene expression of posterior HOX genes of other clusters (e.g. HOXB13) was more
alike to HOXD10, HOXD11 and HOXD13 expression than expression of posterior HOX
genes of the same cluster (i.e. HOXD9 and HOXD12). It is known, though, that HOX
genes are subdivided into those 13 paralogous groups according to sequence similarity
and position within the cluster and that these paralogs in turn show a functional
relationship. (Maconochie et al. 1996)
Especially posterior HOXA and HOXD genes are related to proper limb development.
Knowledge about detailed functions of particular HOX genes mainly originates from
gene expression analysis during normal limb development and from multiple loss- and
DISCUSSION
99
gain-of-function experiments in animals. HOXA and HOXD paralogous groups were
shown to be expressed similarly in the developing chick limb bud. (Nelson et al. 1996)
They seem to function in a redundant kind of way because targeted mutations of
single HOX genes and their paralogs cause similar phenotypes, respectively, whereas
double mutants have synergistic defects and more severe phenotypes. (Boulet &
Capecchi 2004; Fromental-Ramain et al. 1996) A combined tissue-specific deletion of
both clusters in mice causes a severe phenotype with early arrest of limb growth.
Deletion of one cluster only, i.e. HOXA or HOXD, results in way less drastic
malformations. (Kmita et al. 2005; Zakany & Duboule 2007) Different paralogs are
assumed to be responsible for different parts of the limbs; in simplified terms HOXD10
mutations especially cause malformations of the stylopod, HOXD11 mutations lead to
malformations of the zeugopod whereas HOXD13 mutations especially affect the
autopod. (Zakany & Duboule 1999, 2007) HOXB and HOXC genes rather don’t maintain
a major role in limb development. They are expressed in the developing limb bud,
deletions of HOXB and HOXC cluster, however, don’t cause characteristic limb
malformations. (Nelson et al. 1996; Zakany & Duboule 2007)
Summing up, only Ewing sarcoma samples show a specific upregulation of HOXD10,
HOXD11 and HOXD13. Other pediatric tumors such as osteosarcoma,
rhabdomyosarcoma and neuroblastoma possess different HOX gene profiles. (Svoboda
et al. 2014) These three HOX genes are especially associated with limb malformations.
In only 50% of cases, however, Ewing sarcoma affects bones of extremities. (Bernstein
et al. 2006) HOX gene expression can be detected in both bone and soft tissue Ewing
sarcoma and it was shown to be irrespective of primary site of origin since it was
equally high in all Ewing sarcomas. (Svoboda et al. 2014) Thus, a collinear HOX
expression, which was mentioned earlier, can be eliminated in context of Ewing
sarcoma. One of the categories of aberrant HOX gene expression in malignomas which
were postulated by Abate-Shen (2002) may be considered. (Abate-Shen 2002)
The question whether it is a matter of re-expression or new expression of HOX genes
in this case remains unanswered in this work but some ideas are given in our
subsequent publication, see von Heyking et al. (2016).
HOX GENE EXPRESSION IS NOT REGULATED BY EZH2 IN EWING SARCOMA
100
4.2 HOX gene expression is not regulated by EZH2 in Ewing sarcoma
In drosophila homeotic gene expression is antagonistically regulated by Trithorax-
group (trxG) and Polycomb-group (PcG) proteins. These proteins are associated with
chromatin and modify its structure to activate or suppress transcription, respectively.
(Hanson et al. 1999) Whereas Trithorax proteins function as an activator by removing a
trimethyl group of histone H3, PcG proteins keep homeotic genes in a silent state by
methylation of histone H3. (Di Croce & Helin 2013) PcG proteins were shown to
function in multi-protein complexes called polycomb repressor complexes (PRC). Two
of these PcG complexes have been discovered so far, PRC1 and PRC2. Common
structure of a polycomb repressor complex and its function as repressor of HOX gene
expression were evolutionarily conserved in flies and mammals. (Di Croce & Helin
2013; Levine et al. 2002) In mammals three components form PRC2: EZH2 (enhancer of
zeste 2) or its homolog EZH1, SUZ12 and EED. Within this complex EZH2 exerts
methyltransferase activity and maintains target genes in a silent state by methylation
of lysine 27 on histone 3. (Di Croce & Helin 2013; Richter et al. 2009) PRC1 consists of
the four core components RING1, PCGF, CBX and HPH. Several homologous proteins of
each of the four components allow a high diversity. One PCGF homolog is PCGF4, also
known as BMI1. (Di Croce & Helin 2013) Interestingly, EZH2 and BMI1 were shown to
be highly upregulated in Ewing sarcoma tissue, both of them maintaining major roles
in tumorigenesis. EZH2 was shown to maintain stemness by blocking endothelial and
neuro-ectodermal differentiation. (Burdach et al. 2009; Richter et al. 2009; Svoboda et
al. 2014) BMI1 on the other hand promotes anchorage-independent growth of Ewing
sarcoma. (Douglas et al. 2008) Since HOX gene expression is normally regulated by PcG
proteins and especially since PcG genes (EZH2, BMI1) and HOX genes, both were
identified to be upregulated in Ewing sarcoma tissue, we wondered whether HOX gene
expression was influenced by EZH2 expression. EZH2 was downregulated by siRNA
interference and HOX gene expression was determined on mRNA level. A significant
change of HOX gene expression, however, could not be observed in three Ewing
sarcoma cell lines. Abate-Shen (2002) criticized that HOX genes were mostly examined
on mRNA levels. Their gene products, the HOX proteins, which function as
transcription factors have to be further analyzed. It can’t be ruled out that aberrant
HOX gene expression causes proteins with different functions or which don’t function
DISCUSSION
101
at all. (Abate-Shen 2002) Overexpression of HOX genes in Ewing sarcoma, however,
was recently found to be associated with altered epigenetic regulation. Polycomb
proteins were identified to be highly upregulated suggesting a strong repression of
their target genes. A lot of polycomb-regulated genes were simultaneously
overexpressed though. Furthermore, polycomb target genes in Ewing sarcoma were
shown to be different from those in normal tissues. With regard to its polycomb target
genes, Ewing sarcoma was more similar to mesenchymal stem cells than to adult
tissues. Moreover, methylation of lysine 27 on histone 3 (H3K27me3), which
commonly occurs through EZH2, could not be detected across the HOXD cluster.
EWS-FLI1 was assumed to interfere with the usual control of developmental
transcriptional programs during stem cell differentiation. (Svoboda et al. 2014) These
findings are compatible with our results. EZH2 knockdown didn’t change HOX gene
expression on mRNA level because epigenetic regulation of HOX gene expression in
Ewing sarcoma is different from normal tissues. At some point of time in development
of Ewing sarcoma the common regulation of HOX gene expression might have been
lost.
EZH2, however, is only one of multiple polycomb-group proteins. Furthermore, HOX
genes are not only regulated epigenetically. Soon after detection of HOX genes it was
found out that they responded to retinoic acid, furthermore retinoic acid
responsiveness decreased from 3’ to 5’ HOX genes. Retinoic acid was revealed to be
essential during development of the central nervous system as well as limb formation.
(Maden et al. 1996; Power et al. 1999) It was shown to sequentially activate HOX
genes and induce differentiation of human embryonal carcinoma cells. (McGinnis &
Krumlauf 1992; Simeone et al. 1990) Especially neuronal differentiation was promoted
by retinoic acid. (Jones-Villeneuve et al. 1982) This phenomenon was also observed in
neuroblastoma cells. Here, retinoic acid promoted growth arrest and neuronal
differentiation by induction of HOXD genes, of which especially paralogous groups 8, 9,
10 and 12 seemed to be important. (Zha et al. 2012) Extensive research is also being
done on endocrine regulation mechanisms of HOX gene expression. Influence of
hormones and vitamins may not be neglected. (Daftary & Taylor 2006) Furthermore,
HOX genes were recently shown to be capable of a “self-regulation” mechanism.
Especially 5’ HOX genes were demonstrated to be required for proper expression of
HOX GENE EXPRESSION IS NOT REGULATED BY EWS-FLI1
102
other, more anterior HOX genes in limb development. This regulation could even be
achieved across different clusters, i.e. disruption of HOXA genes caused aberrant
expression of anterior HOXD genes and vice versa. (Sheth et al. 2014) Autoregulatory
mechanisms of HOX genes were already described decades ago. (Gould et al. 1997;
Popperl & Featherstone 1992) We could also show a sort of “self-regulation” of HOX
gene expression in Ewing sarcoma cells. HOXD10 knockdown also caused decrease of
HOXD11 expression (see Figure 21, p. 76).
A lot of research is being done on cis-regulatory elements and their effects on HOX
expression, especially in context of collinearity during development. Such regulatory
elements were identified within and outside the HOX clusters. Regulatory elements
which control expression of HOXD genes in limb development, however, were not
detected within the HOXD cluster but in flanking genomic regions which contain only
few genes. All those non-coding sequences are assumed to be capable of influencing
HOX expression. (Lee et al. 2006; Spitz et al. 2001; Tschopp & Duboule 2011)
Regulation of HOX gene expression by non-coding RNAs has been well established.
Especially long non-coding RNA “HOTAIR” (HOX Antisense Intergenic RNA) was shown
to control HOX gene expression on chromatin level. (Rinn et al. 2007) Effects of
HOTAIR on HOX gene expression could recently be observed in malignomas as well.
(Chakravadhanula et al. 2014; Heubach et al. 2015) Moreover, short non-coding RNAs,
such as miRNAs, within the HOX clusters were identified to preferably target mRNA of
more anterior, i.e. more 3’ HOX genes. (Yekta et al. 2008) In general, other “common”
regulation mechanisms such as activation by transcription factors or post-
transcriptional modifications such as alternative splicing or polyadenylation have to be
considered.
4.3 HOX gene expression is not regulated by EWS-FLI1
Chromosome translocations in Ewing sarcomas were already described in the early
1980s. (Turc-Carel et al. 1984) Soon Ewing sarcomas were discovered to be
characterized by particular translocations which lead to oncogenic gene fusions. In
more than 85% of cases reciprocal chromosomal translocation t (11; 22) causes a
fusion between EWS and FLI1, resulting in fusion protein EWS-FLI1. Two types of
translocation exist, involving two different exons of the FLI1 gene. In other, less
DISCUSSION
103
frequent translocations EWS is fused to ERG, ETV1, ETV4 or FEV. (Bernstein et al. 2006;
Delattre et al. 1992; Sankar & Lessnick 2011) EWS-FLI1 was identified as the major
driving force in pathogenesis of Ewing sarcoma because it was shown to induce genes
regulating cell cycle, proliferation and DNA damage response on the one hand whereas
genes associated with differentiation and cell communication are repressed. (Kauer et
al. 2009; Riggi et al. 2005) We wondered whether EWS-FLI1 was also responsible for
overexpression of HOXD10, HOXD11 and HOXD13 in Ewing sarcoma. In the past, at
least FLI1 was shown to control HOXA10 expression in megakaryocytic differentiation.
(Gosiengfiao et al. 2007) So we examined effects of EWS-FLI1 expression on HOX
expression. We assessed that HOXD10, HOXD11 and HOXD13 expression in Ewing
sarcoma cells was irrespective of type of EWS/FLI1 translocation (see right panel of
Figure 13, p. 66). Then we downregulated EWS-FLI1 in four Ewing sarcoma cell lines by
use of two different siRNAs. In a fifth cell line, EWS-FLI1 was knocked down by
retroviral gene transfer. In some cases we achieved a downregulation to less than 20%.
In two cell lines (SK-N-MC and A-673) HOXD13 expression decreased significantly
under EWS-FLI1 suppression. However, this phenomenon could not be observed in the
other three Ewing sarcoma cell lines. We wondered whether HOX gene expression
could be induced by EWS-FLI1. Induction of EWS/FLI1 in mesenchymal progenitor cells
is known to cause a transformation and generation of a tumor similar to Ewing
sarcoma. (Riggi et al. 2005) So we transfected two human mesenchymal stem cell lines
with EWS-FLI1 constructs and examined HOX gene expression on mRNA level. Since
HOXD13 expression decreased under EWS-FLI1 suppression in two Ewing sarcoma cell
lines, we especially expected HOXD13 to be increased after EWS-FLI1 induction.
EWS-FLI1 induction was validated on mRNA level. HOX expression was already
detected in mesenchymal stem cells which had been transfected with an empty vector.
This expression seemed to be irrespective of origin of mesenchymal stem cell because
one cell line had been generated from peripheral blood mononuclear cells after G-CSF
administration; the other cell line was derived from bone marrow. Both cell lines were
obtained from healthy patients. (Conrad et al. 2002; Thalmeier et al. 1994)
Surprisingly, HOX expression did not increase significantly after EWS-FLI1 induction, a
slight induction of HOXD10 was vaguely perceptible. HOXD13 expression, however,
didn’t change under EWS-FLI1 expression. Altogether, our findings are a little
HOX GENE EXPRESSION IS NOT REGULATED BY EWS-FLI1
104
inconsistent with published literature.
Svoboda et al. (2014) blamed EWS/FLI1 to be responsible for the aberrant HOX gene
expression in Ewing sarcoma. They described two clinically designated Ewing sarcomas
without a typical EWS/FLI1 or EWS/ERG translocation. In these two tumors, an
overexpression of posterior HOX genes could not be observed. Moreover, they
detected a discrepancy regarding histone modifications of HOX promoters between
stem cells and Ewing sarcoma cells. They generated EWS/FLI1-positive neural crest
stem cells and cultivated them in differentiation conditions. A significant induction of
HOXD10, HOXD11 and HOXD13 expression was determined after a couple of weeks in
differentiation conditions. (Svoboda et al. 2014) Maybe our transfected mesenchymal
stem cells have not been cultivated in differentiation conditions long enough. It is
conceivable that an induction of HOX genes by EWS/FLI1 might not be observed before
several weeks of incubation. Thus, this experiment was repeated. See our subsequent
publication von Heyking et al. (2016)
HOX gene expression and possible roles in different types of stem cells were recently
reviewed by Seifert et al. (2015). HOX genes are assumed to be actively repressed in
embryonic stem cells and induced pluripotent stem cells until they commit themselves
into a certain lineage. In hematopoietic stem cells and neural crest cells on the other
hand, HOX gene expression can be observed and seems to indicate a certain
commitment, respectively. HOXA genes, for example, are especially assumed to
control the differentiation program of hematopoiesis. In mesenchymal stem cells HOX
gene expression patterns vary depending on source and determine respective
differentiation potential. (Seifert et al. 2015) Especially HOXD genes, are essential for
limb development and bone formation. According to Seifert et al. (2015) expression of
posterior HOXD genes in mesenchymal stem cells indicates a sort of commitment. HOX
genes are known to dictate cell identity. (Ladam & Sagerstrom 2014) Induction of
particularly HOXD10, HOXD11 and HOXD13, those HOX genes which are associated
with limb and bone development, by EWS-FLI1 in Ewing sarcoma could be one reason
why Ewing sarcoma is a bone tumor in the first place. (Seifert et al. 2015; Svoboda et
al. 2014) This, however, raises the question why Ewing sarcoma also emerges beyond
the skeletal system and why high expression of posterior HOXD genes can be observed
in both bone and soft tissue Ewing sarcomas. Even though it has to be mentioned that
DISCUSSION
105
soft tissue tumors seem to present low expression of posterior HOXD genes a little
more often than bone tumors. (Svoboda et al. 2014)
4.4 Microarray analysis reveals few but critical downstream targets
Most knowledge about HOX gene function was acquired by means of gain- and
loss-of-function experiments in animals. Our experiments were not different from
these types of experiments; we generated a loss of function by gene knockdown by
siRNA interference. Since siRNA interference causes only a transient downregulation of
particular genes, we generated stable transfectants with low HOX expression by
retroviral gene transfer. cDNA from two cell lines in which HOX genes had been
downregulated successfully was sent away for microarray analysis. Gene expression
patterns after HOX knockdown were compared on human Gene ST arrays (Affymetrix,
GSE36100). 70-100 differentially regulated genes were identified after HOXD10,
HOXD11 and HOXD13 knockdown, respectively. A little more than half of those genes
were significantly downregulated. Only very few of these genes, however, could be
verified by qRT-PCR. Microarray analysis provided only little insight into possible
downstream targets of HOX genes in Ewing sarcoma. However, this little insight has
already given an idea how diverse HOX targets can be and especially which diverse cell
processes HOX genes can intervene in.
Microarray data revealed RAC2 to be significantly upregulated after HOXD10
knockdown. The protein encoded by RAC2 is a member of the RAC family of small
guanosine triphosphate (GTP)-metabolizing proteins. (Didsbury et al. 1989)
GTP-binding proteins are key regulators in signaling pathways; associated at the
plasma membrane, they function as binary switches which control multiple cellular
processes. (Zohn et al. 1998) The RAS family consists of three isoforms RAC1-3, of
which RAC2 is selectively expressed in hematopoetic cells whereas RAC1 and RAC3 are
ubiquitously expressed. (Didsbury et al. 1989; Haataja et al. 1997) RAC2 was shown to
be a part of the NAPDH oxidase complex of neutrophils and essential for immunity.
RAC2-deficient mice suffer from impaired hematopoiesis. RAC2-deficient neutrophils
exhibit impaired superoxide production as well as impaired inflammatory response;
this makes mice more susceptible for bacterial and fungal infections. (A. W. Roberts et
al. 1999) RAC2 is also assumed to maintain an important role in B-cell adhesion and
MICROARRAY ANALYSIS REVEALS FEW BUT CRITICAL DOWNSTREAM TARGETS
106
T-helper 1 cell differentiation. (Arana et al. 2008; Li et al. 2000) Lane et al. (2012)
demonstrated RAC signaling to be essential for normal bone development. RAC2 is also
supposed to influence osteoclastogenesis, although RAC1 seems to be the more
important player. (Y. Wang et al. 2008) Especially the two latter findings are interesting
in context of Ewing sarcoma. Furthermore, RAC2 was shown to promote tumor
growth, angiogenesis, invasion and metastasis in three tumor entities (lung cancer,
melanoma, neuroblastoma). (Joshi et al. 2014) In our case, RAC2 expression was
upregulated after HOXD10 knockdown. Thus, RAC2 expression should be further
examined in Ewing sarcoma cells. Low RAC2 expression might be a hint at impaired
immune response and bone development in Ewing sarcoma.
Another gene which was differentially regulated after HOX knockdown is ATRX.
HOXD13 downregulation caused a significant decrease of ATRX expression (see 3.5.5,
p. 79). ATRX belongs to the SWI2/SNF2 family of chromatin remodelers. (Picketts et al.
1996) ATRX, just like HOX genes, has been highly evolutionarily conserved. Nucleotide
sequence revealed 85% identity between mice and humans. (De La Fuente et al. 2011;
Picketts et al. 1998) It is associated with ATR-X syndrome, a severe non-progressive
X-linked mental retardation which is associated with an unusal form of thalassemia.
(Gibbons et al. 1995) ATR-X syndrome patients also suffer from multiple skeletal
deformities and short stature. Thus, ATRX expression was further examined in early
developing cartilage. ATRX expression could be observed in chondrocytes throughout
the cartilage growth plate. Loss of ATRX, however, did not affect viability, growth or
growth plate morphology; only minor defects of ossification were detectable.
(Solomon et al. 2009) Mice with targeted loss of ATRX in limb mesenchyme on the
other hand developed shortened and smaller digits. This suggested ATRX function to
be more important in mesenchymal precursor cells than in differentiated
chondrocytes. (Solomon et al. 2013) HOX genes are also known to be essential for
were identified to control the ossification pattern of bones. (Villavicencio-Lorini et al.
2010) Interestingly, Ewing sarcoma preferably arises from the diaphyseal portion of
long bones where endochondral ossification is commonly initiated. In that place blood
vessels invade into the cartilage and bone collar is formed from the surrounding
perichondrium. (Bernstein et al. 2006; Long & Ornitz 2013)
CLINICAL IMPLICATIONS AND FUTURE PERSPECTIVES
126
4.7 Assumed role of HOX genes in pathogenesis of Ewing sarcoma
HOX knockdown in Ewing sarcoma cells was associated with a decrease of proliferation
and capability of colony formation in vitro. We therefore suppose that HOXD10,
HOXD11 and HOXD13 positively regulate growth and metastasis of Ewing sarcoma.
Gene expression analysis after HOX knockdown revealed a significant downregulation
of genes associated with BMP signaling. Gene expression of ligands, cofactors and
transcriptional targets of this pathway such as RUNX2 and collagens were significantly
reduced. Furthermore, Ewing cells with low HOX expression failed to differentiate into
chondrocytes. However, BMP signaling is not only known to be involved in cartilage
and bone formation but also in tumorigenesis. We assume HOXD10, HOXD11 and
HOXD13 alter BMP signaling in Ewing sarcoma and thus, may substantially contribute
to its phenotype. This thesis is primarily based on gene expression analysis and in vitro
experiments. Results were substantiated in a subsequent thesis work employing a
preclinical mouse model.
4.8 Clinical implications and future perspectives
This thesis provided first indications for the role of HOXD10, HOXD11 and HOXD13 in
Ewing sarcoma. A potential positive regulation of tumor growth and metastasis by HOX
genes was verified in a mouse model by another doctoral student. Molecular
mechanisms of how HOX genes may contribute to tumor growth and metastatic
spread of Ewing sarcoma have to be further elucidated.
Ewing sarcoma cells with low HOX expression failed to differentiate into chondrocytes.
Triple HOX knockdown was associated with a significant decrease of RUNX2 expression
which commonly induces differentiation of mesenchymal stem cells into osteoblasts
and promotes late chondrogenic differentiation. (Komori 2010) Application of pSIREN
HOX cells into mice demonstrated changes of tumor phenotype changes depending on
HOX expression. It not clear at the moment, however, which role RUNX2 exactly
maintains in tumorigenesis of Ewing sarcoma. In contrast to RUNX3 which can be
detected in all Ewing sarcoma cells, RUNX2 expression is only found in 73% of
specimens. (Bledsoe et al. 2014) In osteosarcoma, for example, RUNX2 expression was
associated with increased invasion and RUNX2 overexpression correlated with poor
response to chemotherapy. (Sadikovic et al. 2010; Zeng & Xu 2015) Since tumors due
DISCUSSION
127
to application of pSIREN HOX cells into mice were less invasive (von Heyking et al.
2016), clinical studies could address the question if prognosis of patients correlates
with HOX expression in tumor tissue.
Since several components of BMP signaling were differentially expressed after HOX
knockdown, we assume that HOXD10, HOXD11 and HOXD13 alter BMP signaling in
Ewing sarcoma. This hypothesis, however, has to be confirmed by further experiments.
For example, it should be examined if HOX proteins really activate BMP promoters in
Ewing sarcoma. If they do so, it is important to obtain information about the detailed
function of BMPs in this tumor.
Finally, according to our results, expression of HOXD10, HOXD11 and HOXD13 didn’t
seem to be influenced by EWS-FLI1 and EZH2. But subsequent analysis revealed their
critical regulation via DKK2. (von Heyking et al. 2016)
SUMMARY
129
5 Summary
Ewing sarcoma is the second most frequent primary bone tumor in children and young
adults. It is characterized by certain chromosome translocations which lead to an
oncogenic gene fusion. Chromosomal translocation t (11; 22), which involves EWS and
FLI1, is the most common translocation and can be detected in more than 85% of
Ewing sarcomas. In the last 40 years survival rates have been improving, numbers are
still frustrating though. In case of metastasis, survival rates decrease severely and only
amount to 28%.
HOX genes form a subgroup of the family of homeobox genes which are characterized
by a common DNA sequence called “homeobox” encoding the “homeodomain”, a
certain 60-amino-acid long polypeptide segment. HOX genes are highly conserved
across evolution. Controlling the patterning along the anterior-posterior axis during
embryonic development of all animals, they are regarded as master regulators of
development. In humans, there are 39 HOX genes arranged in four HOX clusters A-D.
HOXD genes do not only affect chondrogenesis but also bone condensation and
growth. Posterior HOXD genes are especially involved in limb development including
limb anterior-posterior asymmetry. Downstream HOX targets include transcription
factors and members of signaling pathways such as BMPs but also genes which directly
regulate cellular processes. That way, HOX genes intervene in cell proliferation,
differentiation, apoptosis, cell adhesion and migration. Alterations of HOX expression
are associated with malformations and malignant tumors.
This thesis shows for the first time that HOX genes play an important role in
pathogenesis of Ewing sarcoma. HOXD10, HOXD11 and HOXD13 are strongly
overexpressed in primary Ewing sarcoma as well as in established Ewing sarcoma cell
lines. These genes were not only demonstrated to positively regulate growth and
metastasis but also promote chondrogenic differentiation of established Ewing
sarcoma cell lines.
RNA interference-mediated knock down of these genes led to a decrease of
proliferation and capability of colony formation in vitro. Ewing cells with low HOX
expression failed to differentiate into chondrocytes and died. Osteogenic
differentiation, however, was not affected.
Gene expression analysis after HOX knockdown revealed a significant downregulation
130
of genes associated with BMP signaling. Gene expression of ligands (BMP2, BMP4),
cofactors (SMAD4) and transcriptional targets of this pathway such as RUNX2 and
collagens were significantly reduced after HOX knockdown. BMP signaling is not only
known to be involved in cartilage and bone formation but also in tumorigenesis.
Results indicate BMP signaling might be altered in Ewing sarcoma.
Furthermore, microarray analysis showed into which diverse cell processes HOX genes
can intervene. Expression of GTP-binding protein RAC2, chromatin remodeler ATRX,
HAUS6 which is part of a protein complex which regulates centrosome and spindle
integrity, EEF1D which is a subunit of elongation factor complex 1 critical for efficient
protein synthesis was significantly changed after HOX knockdown. These genes are,
among other things, involved in controlling immune response, bone and limb
development, just as neuronal differentiation. They are assumed to intervene in
fundamental cellular processes such as mitosis, microtubule formation and translation
and all of these genes already appeared in the context of malignant tumors.
Promoting proliferation, metastasis and chondrogenesis in Ewing sarcoma HOXD10,
HOXD11 and HOXD13 substantially contribute to its malignant phenotype.
Disappointing survival rates of Ewing sarcoma patients stress the necessity of alternate
therapeutic approaches. These results provide a potential point of attack for a targeted
therapy.
ZUSAMMENFASSUNG
131
6 Zusammenfassung
Das Ewing-Sarkom ist der zweithäufigste Knochentumor bei Kindern und jungen
Erwachsenen. Es ist durch den Nachweis bestimmter Chromosomentranslokationen
charakterisiert, die zur Bildung einer onkogenen Genfusion führen. Die
Chromosomentranslokation t (11; 22) verursacht eine Fusion von EWS und FLI1 und ist
die häufigste Translokation, sie kann in mehr als 85% der Ewing-Sarkome
nachgewiesen werden. In den letzten 40 Jahren haben sich die Überlebensraten
verbessert, die Zahlen sind aber immer noch enttäuschend. Im Falle einer
Metastasierung sinkt die Überlebensrate massiv und beträgt nur noch 28%.
HOX-Gene gehören zur Familie der Homöobox-Gene, die durch eine bestimmte
DNA-Sequenz gekennzeichnet sind, die „Homöobox“ genannt wird. Diese
DNA-Sequenz codiert für ein ca. 60 Aminosäuren langes Polypeptid, das
„Homöodomäne“ genannt wird. HOX-Gene sind in der Evolution hoch konserviert.
HOX-Gene werden als Hauptregulatoren der Entwicklung angesehen, weil sie in der
Embryonalentwicklung aller Lebewesen für die Strukturierung entlang der
anteriorposterioren Achse verantwortlich sind. Im Menschen existieren 39 HOX-Gene,
die in vier Clustern A-D angeordnet sind. HOXD-Gene beeinflussen nicht nur die
Chondrogenese, sondern auch die Knochenkondensation und das Knochenwachstum.
Posteriore HOXD-Gene spielen vor allem in der Entwicklung der Gliedmaßen eine
entscheidende Rolle. Insbesondere sind sie auch verantwortlich für die Asymmetrie
entlang der anteriorposterioren Achse. Unter den Zielgenen der HOX-Proteine sind
neben Transkriptionsfaktoren, Bestandteile von Signalkaskaden wie z. B. die BMPs,
auch Gene, die zelluläre Vorgänge direkt steuern. Auf diese Weise können HOX-Gene
die Proliferation, Differenzierung, Apoptose, Adhäsion und Migration von Zellen
beeinflussen. Eine Veränderung der Genexpression von HOX-Genen kann
Fehlbildungen und malignen Tumore verursachen.
Diese Dissertation zeigt erstmals, dass HOX-Gene eine wichtige Rolle in der
Pathogenese des Ewing-Sarkoms spielen. HOXD10, HOXD11 und HOXD13 sind stark
überexprimiert in primärem Ewing-Sarkom-Gewebe und etablierten Ewing-Sarkom-
Zelllinien. Diese drei Gene hatten nicht nur einen positiven Einfluss auf das Wachstum
und die Metastasierung von Ewing-Sarkom-Zellen, sondern induzierten in vitro auch
eine chondrogene Differenzierung der Tumorzellen.
132
Das Ausschalten von HOXD10, HOXD11 und HOXD13 mittels siRNA führte einerseits zu
einer Abnahme der Proliferationsrate, andererseits verringerte sich die Fähigkeit der
Tumorzellen im Colony formation-Assay Kolonien zu bilden. Außerdem konnten
Ewing-Zellen mit niedriger HOX-Expression schlechter chondrogen differenzieren und
starben vermehrt unter Differenzierungskonditionen. Die osteogene Differenzierung
dieser Zellen war nicht eingeschränkt.
In den Genexpressionsanalysen nach HOX-Knockdown zeigte sich eine signifikante
Herunterregulation von Genen, die mit der BMP-Signalkaskade assoziiert sind. Die
Genexpression von Liganden (BMP2, BMP4), Cofaktoren (SMAD4) und Zielgene dieses
Signalwegs wie z. B. RUNX2 und Kollagene, war nach HOX-Knockdown signifikant
verringert. Der BMP-Signalweg spielt nicht nur in der Knorpel- und Knochenbildung
eine Rolle, sondern auch in der Tumorgenese. Die Ergebnisse deuten auf einen
möglicherweise veränderten BMP-Signalweg im Ewing-Sarkom hin.
Microarray-Daten lieferten einen Anhaltspunkt, wie viele verschiedene Zellvorgänge
HOX-Gene beeinflussen können. Die Genexpression vom GTP-bindenden Protein RAC2,
dem Chromatin-Remodeler ATRX, HAUS6, das ein Teil eines Proteinkomplexes ist, der
die Zentrosomen- und Spindelintegrität kontrolliert, sowie EEF1D, das eine
Untereinheit des Elongationsfaktorenkomplex 1 darstellt, der entscheidend für eine
effiziente Proteinsynthese ist, waren nach HOX-Knockdown signifikant verändert.
Diese Gene sind unter anderem in der Immunantwort, in der Knochen- und
Gliedmaßenentstehung sowie der neuronalen Differenzierung involviert. Es wird
angenommen, dass diese Gene entscheidende Zellvorgänge wie z. B. die Mitose, die
Mikrotubuli-Bildung sowie die Translation steuern. Außerdem wurden all diese Gene
bereits im Zusammenhang mit malignen Tumoren beschrieben.
Indem HOXD10, HOXD11 und HOXD13 die Proliferation, Metastasierung und
Chondrogenese des Ewing-Sarkoms positiv beeinflussen, tragen sie maßgeblich zu
dessen malignem Phänotyp bei. Aufgrund der enttäuschenden Überlebensraten sind
dringend alternative Therapieverfahren erforderlich. Die Ergebnisse dieser Dissertation
liefern einen Angriffspunkt für eine mögliche zielgerichtete Therapie.
REFERENCES
133
7 References
Abate-Shen, C. (2002). Deregulated homeobox gene expression in cancer: cause or consequence? Nat Rev Cancer, 2(10), 777-785.
Abdel-Fattah, R., Xiao, A., Bomgardner, D., Pease, C. S., Lopes, M. B., & Hussaini, I. M. (2006). Differential expression of HOX genes in neoplastic and non-neoplastic human astrocytes. J Pathol, 209(1), 15-24.
Ahmed, A. A., Zia, H., & Wagner, L. (2014). Therapy resistance mechanisms in Ewing's sarcoma family tumors. Cancer Chemother Pharmacol, 73(4), 657-663.
Akbas, G. E., & Taylor, H. S. (2004). HOXC and HOXD gene expression in human endometrium: lack of redundancy with HOXA paralogs. Biol Reprod, 70(1), 39-45.
Akiyama, H., Chaboissier, M. C., Martin, J. F., Schedl, A., & de Crombrugghe, B. (2002). The transcription factor Sox9 has essential roles in successive steps of the chondrocyte differentiation pathway and is required for expression of Sox5 and Sox6. Genes Dev, 16(21), 2813-2828.
Akiyama, H., Kim, J. E., Nakashima, K., Balmes, G., Iwai, N., Deng, J. M., Zhang, Z., Martin, J. F., Behringer, R. R., Nakamura, T., & de Crombrugghe, B. (2005). Osteo-chondroprogenitor cells are derived from Sox9 expressing precursors. Proc Natl Acad Sci U S A, 102(41), 14665-14670.
Alberts, B., Johnson, A., Lewis, J., Morgan, D., Raff, M., Roberts, K., & Walter, P. (2014). Molecular Biology of the Cell (Sixth ed.). New York, US and Milton Park, Abingdon, UK: Garland Science, Taylor & Francis Group.
Albrecht, A. N., Kornak, U., Boddrich, A., Suring, K., Robinson, P. N., Stiege, A. C., Lurz, R., Stricker, S., Wanker, E. E., & Mundlos, S. (2004). A molecular pathogenesis for transcription factor associated poly-alanine tract expansions. Hum Mol Genet, 13(20), 2351-2359.
Albrecht, A. N., Schwabe, G. C., Stricker, S., Boddrich, A., Wanker, E. E., & Mundlos, S. (2002). The synpolydactyly homolog (spdh) mutation in the mouse -- a defect in patterning and growth of limb cartilage elements. Mech Dev, 112(1-2), 53-67.
Ali, I. H., & Brazil, D. P. (2014). Bone morphogenetic proteins and their antagonists: current and emerging clinical uses. British Journal of Pharmacology, 171(15), 3620-3632.
Alonso, C. R. (2002). Hox proteins: sculpting body parts by activating localized cell death. Curr Biol, 12(22), R776-778.
Aono, A., Hazama, M., Notoya, K., Taketomi, S., Yamasaki, H., Tsukuda, R., Sasaki, S., & Fujisawa, Y. (1995). Potent ectopic bone-inducing activity of bone morphogenetic protein-4/7 heterodimer. Biochem Biophys Res Commun, 210(3), 670-677.
Apiou, F., Flagiello, D., Cillo, C., Malfoy, B., Poupon, M. F., & Dutrillaux, B. (1996). Fine mapping of human HOX gene clusters. Cytogenet Cell Genet, 73(1-2), 114-115.
134
Arana, E., Vehlow, A., Harwood, N. E., Vigorito, E., Henderson, R., Turner, M., Tybulewicz, V. L., & Batista, F. D. (2008). Activation of the small GTPase Rac2 via the B cell receptor regulates B cell adhesion and immunological-synapse formation. Immunity, 28(1), 88-99.
Arnaoutova, I., & Kleinman, H. K. (2010). In vitro angiogenesis: endothelial cell tube formation on gelled basement membrane extract. Nat Protoc, 5(4), 628-635.
Arya, R., & White, K. (2015). Cell death in development: Signaling pathways and core mechanisms. Seminars in Cell & Developmental Biology, 39(0), 12-19.
Baffa, R., Fassan, M., Volinia, S., O'Hara, B., Liu, C. G., Palazzo, J. P., Gardiman, M., Rugge, M., Gomella, L. G., Croce, C. M., & Rosenberg, A. (2009). MicroRNA expression profiling of human metastatic cancers identifies cancer gene targets. J Pathol, 219(2), 214-221.
Bai, S., Shi, X., Yang, X., & Cao, X. (2000). Smad6 as a transcriptional corepressor. J Biol Chem, 275(12), 8267-8270.
Bar-Shavit, Z. (2007). The osteoclast: a multinucleated, hematopoietic-origin, bone-resorbing osteoimmune cell. J Cell Biochem, 102(5), 1130-1139.
Bennett, L. B., Schnabel, J. L., Kelchen, J. M., Taylor, K. H., Guo, J., Arthur, G. L., Papageorgio, C. N., Shi, H., & Caldwell, C. W. (2009). DNA hypermethylation accompanied by transcriptional repression in follicular lymphoma. Genes Chromosomes Cancer, 48(9), 828-841.
Berbegall, A. P., Villamon, E., Tadeo, I., Martinsson, T., Canete, A., Castel, V., Navarro, S., & Noguera, R. (2014). Neuroblastoma after childhood: prognostic relevance of segmental chromosome aberrations, ATRX protein status, and immune cell infiltration. Neoplasia, 16(6), 471-480.
Bernstein, M., Kovar, H., Paulussen, M., Randall, R. L., Schuck, A., Teot, L. A., & Juergens, H. (2006). Ewing's sarcoma family of tumors: current management. Oncologist, 11(5), 503-519.
Berube, N. G., Jagla, M., Smeenk, C., De Repentigny, Y., Kothary, R., & Picketts, D. J. (2002). Neurodevelopmental defects resulting from ATRX overexpression in transgenic mice. Hum Mol Genet, 11(3), 253-261.
Berube, N. G., Mangelsdorf, M., Jagla, M., Vanderluit, J., Garrick, D., Gibbons, R. J., Higgs, D. R., Slack, R. S., & Picketts, D. J. (2005). The chromatin-remodeling protein ATRX is critical for neuronal survival during corticogenesis. J Clin Invest, 115(2), 258-267.
Bhatlekar, S., Addya, S., Salunek, M., Orr, C. R., Surrey, S., McKenzie, S., Fields, J. Z., & Boman, B. M. (2014). Identification of a developmental gene expression signature, including HOX genes, for the normal human colonic crypt stem cell niche: overexpression of the signature parallels stem cell overpopulation during colon tumorigenesis. Stem Cells Dev, 23(2), 167-179.
Biedler, J. L., Helson, L., & Spengler, B. A. (1973). Morphology and growth, tumorigenicity, and cytogenetics of human neuroblastoma cells in continuous culture. Cancer Res, 33(11), 2643-2652.
REFERENCES
135
Blaeschke, F., Thiel, U., Kirschner, A., Thiede, M., Rubio, R. A., Schirmer, D., Kirchner, T., Richter, G. H., Mall, S., Klar, R., Riddell, S., Busch, D. H., Krackhardt, A., Grunewald, T. G., & Burdach, S. (2016). Human HLA-A*02:01/CHM1+ allo-restricted T cell receptor transgenic CD8+ T Cells specifically inhibit Ewing sarcoma growth in vitro and in vivo. Oncotarget.
Bledsoe, K. L., McGee-Lawrence, M. E., Camilleri, E. T., Wang, X., van Wijnen, A. J., Oliveira, A. M., & Westendorf, J. J. (2014). RUNX3 Facilitates Growth of Ewing Sarcoma Cells. J Cell Physiol.
Bloom, E. T. (1972). Further definition by cytotoxicity tests of cell surface antigens of human sarcomas in culture. Cancer Res, 32(5), 960-967.
Bouba, I., Siomou, E., Stefanidis, C. J., Emmanouilidou, A., Galidi, A., Hatzi, E., Markoula, S., Mitsioni, A., Siamopoulou, A., & Georgiou, I. (2009). Absence of mutations in the HOXA11 and HOXD11 genes in children with congenital renal malformations. Pediatr Nephrol, 24(8), 1569-1572.
Boulet, A. M., & Capecchi, M. R. (2002). Duplication of the Hoxd11 gene causes alterations in the axial and appendicular skeleton of the mouse. Dev Biol, 249(1), 96-107.
Boulet, A. M., & Capecchi, M. R. (2004). Multiple roles of Hoxa11 and Hoxd11 in the formation of the mammalian forelimb zeugopod. Development, 131(2), 299-309.
Bruneau, S., Johnson, K. R., Yamamoto, M., Kuroiwa, A., & Duboule, D. (2001). The mouse Hoxd13(spdh) mutation, a polyalanine expansion similar to human type II synpolydactyly (SPD), disrupts the function but not the expression of other Hoxd genes. Dev Biol, 237(2), 345-353.
Burdach, S., & Jurgens, H. (2002). High-dose chemoradiotherapy (HDC) in the Ewing family of tumors (EFT). Critical Reviews in Oncology/Hematology, 41(2), 169-189.
Burdach, S., Jurgens, H., Peters, C., Nurnberger, W., Mauz-Korholz, C., Korholz, D., Paulussen, M., Pape, H., Dilloo, D., & Koscielniak, E. (1993). Myeloablative radiochemotherapy and hematopoietic stem-cell rescue in poor-prognosis Ewing's sarcoma. J Clin Oncol, 11(8), 1482-1488.
Burdach, S., Nurnberger, W., Laws, H. J., Engel, B. C., Dirksen, U., Krauth, K., Pape, H., Kahn, T., Korholz, D., Gadner, H., Gobel, U., & Jurgens, H. (1996). Myeloablative therapy, stem cell rescue and gene transfer in advanced Ewing tumors. Bone Marrow Transplantation, 18 Suppl 1, S67-68.
Burdach, S., Plehm, S., Unland, R., Dirksen, U., Borkhardt, A., Staege, M. S., Muller-Tidow, C., & Richter, G. H. (2009). Epigenetic maintenance of stemness and malignancy in peripheral neuroectodermal tumors by EZH2. Cell Cycle, 8(13), 1991-1996.
Burdach, S., van Kaick, B., Laws, H. J., Ahrens, S., Haase, R., Korholz, D., Pape, H., Dunst, J., Kahn, T., Willers, R., Engel, B., Dirksen, U., Kramm, C., Nurnberger, W., Heyll, A., Ladenstein, R., Gadner, H., Jurgens, H., & Go el, U. (2000). Allogeneic and autologous stem-cell transplantation in advanced Ewing tumors. An update after long-term follow-up from two centers of the European Intergroup study EICESS. Stem-Cell Transplant Programs at Dusseldorf University Medical Center, Germany and St. Anna Kinderspital, Vienna, Austria. Annals of Oncology, 11(11), 1451-1462.
136
Cai, L. Y., Abe, M., Izumi, S., Imura, M., Yasugi, T., & Ushijima, T. (2007). Identification of PRTFDC1 silencing and aberrant promoter methylation of GPR150, ITGA8 and HOXD11 in ovarian cancers. Life Sci, 80(16), 1458-1465.
Cantile, M., Franco, R., Tschan, A., Baumhoer, D., Zlobec, I., Schiavo, G., Forte, I., Bihl, M., Liguori, G., Botti, G., Tornillo, L., Karamitopoulou-Diamantis, E., Terracciano, L., & Cillo, C. (2009). HOX D13 expression across 79 tumor tissue types. Int J Cancer, 125(7), 1532-1541.
Cantile, M., Schiavo, G., Franco, R., Cindolo, L., Procino, A., D'Armiento, M., Facchini, G., Terracciano, L., Botti, G., & Cillo, C. (2011). Expression of lumbosacral HOX genes, crucial in kidney organogenesis, is systematically deregulated in clear cell kidney cancers. Anticancer Drugs, 22(5), 392-401.
Cantile, M., Scognamiglio, G., Anniciello, A., Farina, M., Gentilcore, G., Santonastaso, C., Fulciniti, F., Cillo, C., Franco, R., Ascierto, P. A., & Botti, G. (2012). Increased HOX C13 expression in metastatic melanoma progression. J Transl Med, 10, 91.
Cao, D., Jin, C., Ren, M., Lin, C., Zhang, X., & Zhao, N. (2009). The expression of Gli3, regulated by HOXD13, may play a role in idiopathic congenital talipes equinovarus. BMC Musculoskelet Disord, 10, 142.
Carpenter, E. M., Goddard, J. M., Davis, A. P., Nguyen, T. P., & Capecchi, M. R. (1997). Targeted disruption of Hoxd-10 affects mouse hindlimb development. Development, 124(22), 4505-4514.
Carreira, A. C., Alves, G. G., Zambuzzi, W. F., Sogayar, M. C., & Granjeiro, J. M. (2014). Bone Morphogenetic Proteins: Structure, biological function and therapeutic applications. Archives of Biochemistry and Biophysics, 561(0), 64-73.
Carrio, M., Arderiu, G., Myers, C., & Boudreau, N. J. (2005). Homeobox D10 induces phenotypic reversion of breast tumor cells in a three-dimensional culture model. Cancer Res, 65(16), 7177-7185.
Cavazzana, A. O., Miser, J. S., Jefferson, J., & Triche, T. J. (1987). Experimental evidence for a neural origin of Ewing's sarcoma of bone. Am J Pathol, 127(3), 507-518.
Chakravadhanula, M., Ozols, V. V., Hampton, C. N., Zhou, L., Catchpoole, D., & Bhardwaj, R. D. (2014). Expression of the HOX genes and HOTAIR in atypical teratoid rhabdoid tumors and other pediatric brain tumors. Cancer Genet, 207(9), 425-428.
Chen, G., Deng, C., & Li, Y. P. (2012). TGF-beta and BMP signaling in osteoblast differentiation and bone formation. Int J Biol Sci, 8(2), 272-288.
Chen, X., Bahrami, A., Pappo, A., Easton, J., Dalton, J., Hedlund, E., Ellison, D., Shurtleff, S., Wu, G., Wei, L., Parker, M., Rusch, M., Nagahawatte, P., Wu, J., Mao, S., Boggs, K., Mulder, H., Yergeau, D., Lu, C., Ding, L., Edmonson, M., Qu, C., Wang, J., Li, Y., Navid, F., Daw, N. C., Mardis, E. R., Wilson, R. K., Downing, J. R., Zhang, J., & Dyer, M. A. (2014). Recurrent somatic structural variations contribute to tumorigenesis in pediatric osteosarcoma. Cell Rep, 7(1), 104-112.
REFERENCES
137
Cheng, H., Jiang, W., Phillips, F. M., Haydon, R. C., Peng, Y., Zhou, L., Luu, H. H., An, N., Breyer, B., Vanichakarn, P., Szatkowski, J. P., Park, J. Y., & He, T. C. (2003). Osteogenic activity of the fourteen types of human bone morphogenetic proteins (BMPs). J Bone Joint Surg Am, 85-A(8), 1544-1552.
Choudhry, S., Deshpande, A., Qiao, L., Beckman, K., Sen, S., & Baskin, L. S. (2012). Genome-wide DNA methylation profiling of CpG islands in hypospadias. J Urol, 188(4 Suppl), 1450-1455.
Chu, M. C., Selam, F. B., & Taylor, H. S. (2004). HOXA10 regulates p53 expression and matrigel invasion in human breast cancer cells. Cancer Biol Ther, 3(6), 568-572.
Chuang, L. S., & Ito, Y. (2010). RUNX3 is multifunctional in carcinogenesis of multiple solid tumors. Oncogene, 29(18), 2605-2615.
Cifone, M. A., & Fidler, I. J. (1980). Correlation of patterns of anchorage-independent growth with in vivo behavior of cells from a murine fibrosarcoma. Proc Natl Acad Sci U S A, 77(2), 1039-1043.
Conrad, C., Gottgens, B., Kinston, S., Ellwart, J., & Huss, R. (2002). GATA transcription in a small rhodamine 123(low)CD34(+) subpopulation of a peripheral blood-derived CD34(-)CD105(+) mesenchymal cell line. Exp Hematol, 30(8), 887-895.
Cormier, P., Osborne, H. B., Morales, J., Bassez, T., Minella, O., Poulhe, R., Belle, R., & Mulner-Lorillon, O. (1993). Elongation factor 1 contains two homologous guanine-nucleotide exchange proteins as shown from the molecular cloning of beta and delta subunits. Nucleic Acids Res, 21(3), 743.
Daftary, G. S., & Taylor, H. S. (2006). Endocrine regulation of HOX genes. Endocrine Reviews, 27(4), 331-355.
Davis, A. P., & Capecchi, M. R. (1994). Axial homeosis and appendicular skeleton defects in mice with a targeted disruption of hoxd-11. Development, 120(8), 2187-2198.
Davis, A. P., Witte, D. P., Hsieh-Li, H. M., Potter, S. S., & Capecchi, M. R. (1995). Absence of radius and ulna in mice lacking hoxa-11 and hoxd-11. Nature, 375(6534), 791-795.
De Bortoli, M., Castellino, R. C., Lu, X. Y., Deyo, J., Sturla, L. M., Adesina, A. M., Perlaky, L., Pomeroy, S. L., Lau, C. C., Man, T. K., Rao, P. H., & Kim, J. Y. (2006). Medulloblastoma outcome is adversely associated with overexpression of EEF1D, RPL30, and RPS20 on the long arm of chromosome 8. BMC Cancer, 6, 223.
de la Cruz, C. C., Der-Avakian, A., Spyropoulos, D. D., Tieu, D. D., & Carpenter, E. M. (1999). Targeted disruption of Hoxd9 and Hoxd10 alters locomotor behavior, vertebral identity, and peripheral nervous system development. Dev Biol, 216(2), 595-610.
De La Fuente, R., Baumann, C., & Viveiros, M. M. (2011). Role of ATRX in chromatin structure and function: implications for chromosome instability and human disease. Reproduction, 142(2), 221-234.
De Luca, F., Barnes, K. M., Uyeda, J. A., De-Levi, S., Abad, V., Palese, T., Mericq, V., & Baron, J. (2001). Regulation of growth plate chondrogenesis by bone morphogenetic protein-2. Endocrinology, 142(1), 430-436.
138
Delattre, O., Zucman, J., Melot, T., Garau, X. S., Zucker, J. M., Lenoir, G. M., Ambros, P. F., Sheer, D., Turc-Carel, C., & Triche, T. J. (1994). The Ewing family of tumors--a subgroup of small-round-cell tumors defined by specific chimeric transcripts. New England Journal of Medicine, 331(5), 294-299.
Delattre, O., Zucman, J., Plougastel, B., Desmaze, C., Melot, T., Peter, M., Kovar, H., Joubert, I., de Jong, P., & Rouleau, G. (1992). Gene fusion with an ETS DNA-binding domain caused by chromosome translocation in human tumours. Nature, 359(6391), 162-165.
Delpretti, S., Zakany, J., & Duboule, D. (2012). A function for all posterior Hoxd genes during digit development? Dev Dyn, 241(4), 792-802.
Di Croce, L., & Helin, K. (2013). Transcriptional regulation by Polycomb group proteins. Nature Structural & Molecular Biology, 20(10), 1147-1155.
Didsbury, J., Weber, R. F., Bokoch, G. M., Evans, T., & Snyderman, R. (1989). rac, a novel ras-related family of proteins that are botulinum toxin substrates. J Biol Chem, 264(28), 16378-16382.
Dobbs, M. B., Gurnett, C. A., Pierce, B., Exner, G. U., Robarge, J., Morcuende, J. A., Cole, W. G., Templeton, P. A., Foster, B., & Bowcock, A. M. (2006). HOXD10 M319K mutation in a family with isolated congenital vertical talus. J Orthop Res, 24(3), 448-453.
Dockhorn-Dworniczak, B., Schafer, K. L., Dantcheva, R., Blasius, S., van Valen, F., Burdach, S., Winkelmann, W., Jurgens, H., & Bocker, W. (1994). [Molecular genetic detection of t(11;22)(q24;12) translocation in Ewing sarcoma and malignant peripheral neuroectodermal tumors]. Pathologe, 15(2), 103-112.
Dolle, P., & Duboule, D. (1989). Two gene members of the murine HOX-5 complex show regional and cell-type specific expression in developing limbs and gonads. EMBO J, 8(5), 1507-1515.
Douglas, D., Hsu, J. H., Hung, L., Cooper, A., Abdueva, D., van Doorninck, J., Peng, G., Shimada, H., Triche, T. J., & Lawlor, E. R. (2008). BMI-1 promotes ewing sarcoma tumorigenicity independent of CDKN2A repression. Cancer Res, 68(16), 6507-6515.
Duboule, D. (1994). Guidebook to the Homeobox Genes (1st ed.): A Sambrook and Tooze Publication at Oxford University Press.
Duboule, D., & Morata, G. (1994). Colinearity and functional hierarchy among genes of the homeotic complexes. Trends Genet, 10(10), 358-364.
Duchman, K. R., Gao, Y., & Miller, B. J. (2015). Prognostic factors for survival in patients with Ewing's sarcoma using the surveillance, epidemiology, and end results (SEER) program database. Cancer Epidemiol, 39(2), 189-195.
Ducy, P., Zhang, R., Geoffroy, V., Ridall, A. L., & Karsenty, G. (1997). Osf2/Cbfa1: a transcriptional activator of osteoblast differentiation. Cell, 89(5), 747-754.
Dunn, T., Praissman, L., Hagag, N., & Viola, M. V. (1994). ERG gene is translocated in an Ewing's sarcoma cell line. Cancer Genetics and Cytogenetics, 76(1), 19-22.
REFERENCES
139
Duprez, D., Bell, E. J., Richardson, M. K., Archer, C. W., Wolpert, L., Brickell, P. M., & Francis-West, P. H. (1996). Overexpression of BMP-2 and BMP-4 alters the size and shape of developing skeletal elements in the chick limb. Mech Dev, 57(2), 145-157.
Duprez, D. M., Kostakopoulou, K., Francis-West, P. H., Tickle, C., & Brickell, P. M. (1996). Activation of Fgf-4 and HoxD gene expression by BMP-2 expressing cells in the developing chick limb. Development, 122(6), 1821-1828.
Edgar, R., Domrachev, M., & Lash, A. E. (2002). Gene Expression Omnibus: NCBI gene expression and hybridization array data repository. Nucleic Acids Res, 30(1), 207-210.
Erselius, J. R., Goulding, M. D., & Gruss, P. (1990). Structure and expression pattern of the murine Hox-3.2 gene. Development, 110(2), 629-642.
Ewing, J. (1972). Classics in oncology. Diffuse endothelioma of bone. James Ewing. Proceedings of the New York Pathological Society, 1921. CA: A Cancer Journal for Clinicians, 22(2), 95-98.
Fogh, J., & Trempe, G. (1975). New human tumor cell lines. In J. Fogh (Ed.), Human Tumor Cells In Vitro. New York and London: Plenum Press.
Foronda, D., de Navas, L. F., Garaulet, D. L., & Sanchez-Herrero, E. (2009). Function and specificity of Hox genes. Int J Dev Biol, 53(8-10), 1404-1419.
Foster, J. W., Dominguez-Steglich, M. A., Guioli, S., Kwok, C., Weller, P. A., Stevanovic, M., Weissenbach, J., Mansour, S., Young, I. D., & Goodfellow, P. N. (1994). Campomelic dysplasia and autosomal sex reversal caused by mutations in an SRY-related gene. Nature, 372(6506), 525-530.
Francis, P. H., Richardson, M. K., Brickell, P. M., & Tickle, C. (1994). Bone morphogenetic proteins and a signalling pathway that controls patterning in the developing chick limb. Development, 120(1), 209-218.
Freyschmidt, J., Ostertag, H., & Jundt, G. (2010). Knochentumoren mit Kiefertumoren: Klinik, Radiologie, Pathologie (Vol. 3. Auflage, pp. 444-474). Dordrecht Heidelberg London New York: Springer-Verlag.
Fromental-Ramain, C., Warot, X., Messadecq, N., LeMeur, M., Dolle, P., & Chambon, P. (1996). Hoxa-13 and Hoxd-13 play a crucial role in the patterning of the limb autopod. Development, 122(10), 2997-3011.
Fu, Y., Li, F., Zhao, D. Y., Zhang, J. S., Lv, Y., & Li-Ling, J. (2014). Interaction between Tbx1 and Hoxd10 and connection with TGFbeta-BMP signal pathway during kidney development. Gene, 536(1), 197-202.
Furuta, J., Nobeyama, Y., Umebayashi, Y., Otsuka, F., Kikuchi, K., & Ushijima, T. (2006). Silencing of Peroxiredoxin 2 and aberrant methylation of 33 CpG islands in putative promoter regions in human malignant melanomas. Cancer Res, 66(12), 6080-6086.
Garcia-Barcelo, M. M., Wong, K. K., Lui, V. C., Yuan, Z. W., So, M. T., Ngan, E. S., Miao, X. P., Chung, P. H., Khong, P. L., & Tam, P. K. (2008). Identification of a HOXD13 mutation in a VACTERL patient. Am J Med Genet A, 146A(24), 3181-3185.
140
Gehring, W. J., Affolter, M., & Burglin, T. (1994). Homeodomain proteins. Annu Rev Biochem, 63, 487-526.
Gerard, M., Zakany, J., & Duboule, D. (1997). Interspecies exchange of a Hoxd enhancer in vivo induces premature transcription and anterior shift of the sacrum. Dev Biol, 190(1), 32-40.
Giard, D. J., Aaronson, S. A., Todaro, G. J., Arnstein, P., Kersey, J. H., Dosik, H., & Parks, W. P. (1973). In vitro cultivation of human tumors: establishment of cell lines derived from a series of solid tumors. J Natl Cancer Inst, 51(5), 1417-1423.
Gibbons, R. J., Picketts, D. J., Villard, L., & Higgs, D. R. (1995). Mutations in a putative global transcriptional regulator cause X-linked mental retardation with alpha-thalassemia (ATR-X syndrome). Cell, 80(6), 837-845.
Goff, D. J., & Tabin, C. J. (1997). Analysis of Hoxd-13 and Hoxd-11 misexpression in chick limb buds reveals that Hox genes affect both bone condensation and growth. Development, 124(3), 627-636.
Goodman, F. R., Mundlos, S., Muragaki, Y., Donnai, D., Giovannucci-Uzielli, M. L., Lapi, E., Majewski, F., McGaughran, J., McKeown, C., Reardon, W., Upton, J., Winter, R. M., Olsen, B. R., & Scambler, P. J. (1997). Synpolydactyly phenotypes correlate with size of expansions in HOXD13 polyalanine tract. Proc Natl Acad Sci U S A, 94(14), 7458-7463.
Gosiengfiao, Y., Horvat, R., & Thompson, A. (2007). Transcription factors GATA-1 and Fli-1 regulate human HOXA10 expression in megakaryocytic cells. DNA Cell Biol, 26(8), 577-587.
Gough, S. M., Slape, C. I., & Aplan, P. D. (2011). NUP98 gene fusions and hematopoietic malignancies: common themes and new biologic insights. Blood, 118(24), 6247-6257.
Gould, A., Morrison, A., Sproat, G., White, R. A., & Krumlauf, R. (1997). Positive cross-regulation and enhancer sharing: two mechanisms for specifying overlapping Hox expression patterns. Genes Dev, 11(7), 900-913.
Grier, D. G., Thompson, A., Kwasniewska, A., McGonigle, G. J., Halliday, H. L., & Lappin, T. R. (2005). The pathophysiology of HOX genes and their role in cancer. J Pathol, 205(2), 154-171.
Gross, S., Krause, Y., Wuelling, M., & Vortkamp, A. (2012). Hoxa11 and Hoxd11 regulate chondrocyte differentiation upstream of Runx2 and Shox2 in mice. PLoS One, 7(8), e43553.
Grunewald, T. G., Diebold, I., Esposito, I., Plehm, S., Hauer, K., Thiel, U., da Silva-Buttkus, P., Neff, F., Unland, R., Muller-Tidow, C., Zobywalski, C., Lohrig, K., Lewandrowski, U., Sickmann, A., Prazeres da Costa, O., Gorlach, A., Cossarizza, A., Butt, E., Richter, G. H., & Burdach, S. (2012). STEAP1 is associated with the invasive and oxidative stress phenotype of Ewing tumors. Mol Cancer Res, 10(1), 52-65.
Gu, Z. D., Chen, X. M., Zhang, W., Gu, J., & Chen, K. N. (2007). [Expression of 39 HOX genes in esophageal cancer cell lines]. Zhonghua Wei Chang Wai Ke Za Zhi, 10(4), 365-367.
Haataja, L., Groffen, J., & Heisterkamp, N. (1997). Characterization of RAC3, a novel member of the Rho family. J Biol Chem, 272(33), 20384-20388.
REFERENCES
141
Haberler, C., & Wohrer, A. (2014). Clinical Neuropathology practice news 2-2014: ATRX, a new candidate biomarker in gliomas. Clin Neuropathol, 33(2), 108-111.
Hakami, F., Darda, L., Stafford, P., Woll, P., Lambert, D. W., & Hunter, K. D. (2014). The roles of HOXD10 in the development and progression of head and neck squamous cell carcinoma (HNSCC). Br J Cancer, 111(4), 807-816.
Han, J. A., Kim, J. Y., & Kim, J. I. (2014). Analysis of gene expression in cyclooxygenase-2-overexpressed human osteosarcoma cell lines. Genomics Inform, 12(4), 247-253.
Hansen, S. L., Dosanjh, A., Young, D. M., Boudreau, N., & Hoffman, W. Y. (2006). Hemangiomas and homeobox gene expression. J Craniofac Surg, 17(4), 767-771.
Hanson, R. D., Hess, J. L., Yu, B. D., Ernst, P., van Lohuizen, M., Berns, A., van der Lugt, N. M., Shashikant, C. S., Ruddle, F. H., Seto, M., & Korsmeyer, S. J. (1999). Mammalian Trithorax and polycomb-group homologues are antagonistic regulators of homeotic development. Proc Natl Acad Sci U S A, 96(25), 14372-14377.
Hardwick, J. C., Kodach, L. L., Offerhaus, G. J., & van den Brink, G. R. (2008). Bone morphogenetic protein signalling in colorectal cancer. Nat Rev Cancer, 8(10), 806-812.
Hauer, K., Calzada-Wack, J., Steiger, K., Grunewald, T. G., Baumhoer, D., Plehm, S., Buch, T., Prazeres da Costa, O., Esposito, I., Burdach, S., & Richter, G. H. (2013). DKK2 mediates osteolysis, invasiveness, and metastatic spread in Ewing sarcoma. Cancer Res, 73(2), 967-977.
He, W., Dorn, D. C., Erdjument-Bromage, H., Tempst, P., Moore, M. A., & Massague, J. (2006). Hematopoiesis controlled by distinct TIF1gamma and Smad4 branches of the TGFbeta pathway. Cell, 125(5), 929-941.
Heldin, C. H., Miyazono, K., & ten Dijke, P. (1997). TGF-beta signalling from cell membrane to nucleus through SMAD proteins. Nature, 390(6659), 465-471.
Heremans, H., Billiau, A., Cassiman, J. J., Mulier, J. C., & de Somer, P. (1978). In vitro cultivation of human tumor tissues. II. Morphological and virological characterization of three cell lines. Oncology, 35(6), 246-252.
Hernanda, P. Y., Chen, K., Das, A. M., Sideras, K., Wang, W., Li, J., Cao, W., Bots, S. J., Kodach, L. L., de Man, R. A., Ijzermans, J. N., Janssen, H. L., Stubbs, A. P., Sprengers, D., Bruno, M. J., Metselaar, H. J., Ten Hagen, T. L., Kwekkeboom, J., Peppelenbosch, M. P., & Pan, Q. (2014). SMAD4 exerts a tumor-promoting role in hepatocellular carcinoma. Oncogene.
Heubach, J., Monsior, J., Deenen, R., Niegisch, G., Szarvas, T., Niedworok, C., Schulz, W. A., & Hoffmann, M. J. (2015). The long noncoding RNA HOTAIR has tissue and cell type-dependent effects on HOX gene expression and phenotype of urothelial cancer cells. Mol Cancer, 14(1), 108.
Hogan, B. L. (1996). Bone morphogenetic proteins: multifunctional regulators of vertebrate development. Genes Dev, 10(13), 1580-1594.
Holland, P. W. (2013). Evolution of homeobox genes. Wiley Interdiscip Rev Dev Biol, 2(1), 31-45.
142
Hu-Lieskovan, S., Zhang, J., Wu, L., Shimada, H., Schofield, D. E., & Triche, T. J. (2005). EWS-FLI1 fusion protein up-regulates critical genes in neural crest development and is responsible for the observed phenotype of Ewing's family of tumors. Cancer Res, 65(11), 4633-4644.
Hu, J., Gray, C. A., & Spencer, T. E. (2004). Gene expression profiling of neonatal mouse uterine development. Biol Reprod, 70(6), 1870-1876.
Hu, X., Chen, D., Cui, Y., Li, Z., & Huang, J. (2013). Targeting microRNA-23a to inhibit glioma cell invasion via HOXD10. Sci Rep, 3, 3423.
Ichikawa, M., Yoshimi, A., Nakagawa, M., Nishimoto, N., Watanabe-Okochi, N., & Kurokawa, M. (2013). A role for RUNX1 in hematopoiesis and myeloid leukemia. International Journal of Hematology, 97(6), 726-734.
Iimura, T., Oida, S., Takeda, K., Maruoka, Y., & Sasaki, S. (1994). Changes in homeobox-containing gene expression during ectopic bone formation induced by bone morphogenetic protein. Biochem Biophys Res Commun, 201(2), 980-987.
Israel, D. I., Nove, J., Kerns, K. M., Kaufman, R. J., Rosen, V., Cox, K. A., & Wozney, J. M. (1996). Heterodimeric bone morphogenetic proteins show enhanced activity in vitro and in vivo. Growth Factors, 13(3-4), 291-300.
Ito, Y., Bae, S. C., & Chuang, L. S. (2015). The RUNX family: developmental regulators in cancer. Nat Rev Cancer, 15(2), 81-95.
Izpisua-Belmonte, J. C., Falkenstein, H., Dolle, P., Renucci, A., & Duboule, D. (1991). Murine genes related to the Drosophila AbdB homeotic genes are sequentially expressed during development of the posterior part of the body. EMBO J, 10(8), 2279-2289.
Javed, A., Bae, J. S., Afzal, F., Gutierrez, S., Pratap, J., Zaidi, S. K., Lou, Y., van Wijnen, A. J., Stein, J. L., Stein, G. S., & Lian, J. B. (2008). Structural coupling of Smad and Runx2 for execution of the BMP2 osteogenic signal. J Biol Chem, 283(13), 8412-8422.
Javed, A., Chen, H., & Ghori, F. Y. (2010). Genetic and transcriptional control of bone formation. Oral Maxillofac Surg Clin North Am, 22(3), 283-293, v.
Javelaud, D., Wietzerbin, J., Delattre, O., & Besancon, F. (2000). Induction of p21Waf1/Cip1 by TNFalpha requires NF-kappaB activity and antagonizes apoptosis in Ewing tumor cells. Oncogene, 19(1), 61-68.
Je, E. M., An, C. H., Yoo, N. J., & Lee, S. H. (2012). Expressional and mutational analysis of ATRX gene in gastric, colorectal and prostate cancers. APMIS, 120(6), 519-520.
Jensen, E. D., Pham, L., Billington, C. J., Jr., Espe, K., Carlson, A. E., Westendorf, J. J., Petryk, A., Gopalakrishnan, R., & Mansky, K. (2010). Bone morphogenic protein 2 directly enhances differentiation of murine osteoclast precursors. J Cell Biochem, 109(4), 672-682.
Johnson, D., Kan, S. H., Oldridge, M., Trembath, R. C., Roche, P., Esnouf, R. M., Giele, H., & Wilkie, A. O. (2003). Missense mutations in the homeodomain of HOXD13 are associated with brachydactyly types D and E. Am J Hum Genet, 72(4), 984-997.
REFERENCES
143
Jones-Villeneuve, E. M., McBurney, M. W., Rogers, K. A., & Kalnins, V. I. (1982). Retinoic acid induces embryonal carcinoma cells to differentiate into neurons and glial cells. J Cell Biol, 94(2), 253-262.
Joseph, P., Lei, Y. X., Whong, W. Z., & Ong, T. M. (2002). Oncogenic potential of mouse translation elongation factor-1 delta, a novel cadmium-responsive proto-oncogene. J Biol Chem, 277(8), 6131-6136.
Joshi, S., Singh, A. R., Zulcic, M., Bao, L., Messer, K., Ideker, T., Dutkowski, J., & Durden, D. L. (2014). Rac2 controls tumor growth, metastasis and M1-M2 macrophage differentiation in vivo. PLoS One, 9(4), e95893.
Jung, J. C., & Tsonis, P. A. (1998). Role of 5' HoxD genes in chondrogenesis in vitro. Int J Dev Biol, 42(4), 609-615.
Kanzler, B., Viallet, J. P., Le Mouellic, H., Boncinelli, E., Duboule, D., & Dhouailly, D. (1994). Differential expression of two different homeobox gene families during mouse tegument morphogenesis. Int J Dev Biol, 38(4), 633-640.
Kappen, C., Schughart, K., & Ruddle, F. H. (1989). Organization and expression of homeobox genes in mouse and man. Ann N Y Acad Sci, 567, 243-252.
Karsenty, G., Kronenberg, H. M., & Settembre, C. (2009). Genetic control of bone formation. Annual Review of Cell and Developmental Biology, 25, 629-648.
Kauer, M., Ban, J., Kofler, R., Walker, B., Davis, S., Meltzer, P., & Kovar, H. (2009). A molecular function map of Ewing's sarcoma. PLoS One, 4(4), e5415.
Kawabata, M., Imamura, T., & Miyazono, K. (1998). Signal transduction by bone morphogenetic proteins. Cytokine Growth Factor Rev, 9(1), 49-61.
Kessel, M., & Gruss, P. (1991). Homeotic transformations of murine vertebrae and concomitant alteration of Hox codes induced by retinoic acid. Cell, 67(1), 89-104.
Kim, E. K., & Choi, E. J. (2010). Pathological roles of MAPK signaling pathways in human diseases. Biochim Biophys Acta, 1802(4), 396-405.
Kim, Y., Murao, H., Yamamoto, K., Deng, J. M., Behringer, R. R., Nakamura, T., & Akiyama, H. (2011). Generation of transgenic mice for conditional overexpression of Sox9. Journal of Bone and Mineral Metabolism, 29(1), 123-129.
Kitazawa, R., Mori, K., Yamaguchi, A., Kondo, T., & Kitazawa, S. (2008). Modulation of mouse RANKL gene expression by Runx2 and vitamin D3. J Cell Biochem, 105(5), 1289-1297.
Kjosness, K. M., Hines, J. E., Lovejoy, C. O., & Reno, P. L. (2014). The pisiform growth plate is lost in humans and supports a role for Hox in growth plate formation. J Anat, 225(5), 527-538.
Kleinman, H. K., & Martin, G. R. (2005). Matrigel: basement membrane matrix with biological activity. Semin Cancer Biol, 15(5), 378-386.
Kmita, M., Tarchini, B., Zakany, J., Logan, M., Tabin, C. J., & Duboule, D. (2005). Early developmental arrest of mammalian limbs lacking HoxA/HoxD gene function. Nature, 435(7045), 1113-1116.
144
Komori, T. (2010). Regulation of bone development and extracellular matrix protein genes by RUNX2. Cell Tissue Res, 339(1), 189-195.
Komori, T. (2011). Signaling networks in RUNX2-dependent bone development. J Cell Biochem, 112(3), 750-755.
Komori, T., Yagi, H., Nomura, S., Yamaguchi, A., Sasaki, K., Deguchi, K., Shimizu, Y., Bronson, R. T., Gao, Y. H., Inada, M., Sato, M., Okamoto, R., Kitamura, Y., Yoshiki, S., & Kishimoto, T. (1997). Targeted disruption of Cbfa1 results in a complete lack of bone formation owing to maturational arrest of osteoblasts. Cell, 89(5), 755-764.
Kondo, T., Dolle, P., Zakany, J., & Duboule, D. (1996). Function of posterior HoxD genes in the morphogenesis of the anal sphincter. Development, 122(9), 2651-2659.
Koyama, E., Yasuda, T., Minugh-Purvis, N., Kinumatsu, T., Yallowitz, A. R., Wellik, D. M., & Pacifici, M. (2010). Hox11 genes establish synovial joint organization and phylogenetic characteristics in developing mouse zeugopod skeletal elements. Development, 137(22), 3795-3800.
Krumlauf, R. (1992). Evolution of the vertebrate Hox homeobox genes. Bioessays, 14(4), 245-252.
Krumlauf, R. (1994). Hox genes in vertebrate development. Cell, 78(2), 191-201.
Kuss, P., Kraft, K., Stumm, J., Ibrahim, D., Vallecillo-Garcia, P., Mundlos, S., & Stricker, S. (2014). Regulation of cell polarity in the cartilage growth plate and perichondrium of metacarpal elements by HOXD13 and WNT5A. Dev Biol, 385(1), 83-93.
Kuss, P., Villavicencio-Lorini, P., Witte, F., Klose, J., Albrecht, A. N., Seemann, P., Hecht, J., & Mundlos, S. (2009). Mutant Hoxd13 induces extra digits in a mouse model of synpolydactyly directly and by decreasing retinoic acid synthesis. J Clin Invest, 119(1), 146-156.
Ladam, F., & Sagerstrom, C. G. (2014). Hox regulation of transcription: more complex(es). Dev Dyn, 243(1), 4-15.
Lance-Jones, C., Omelchenko, N., Bailis, A., Lynch, S., & Sharma, K. (2001). Hoxd10 induction and regionalization in the developing lumbosacral spinal cord. Development, 128(12), 2255-2268.
Lane, S. W., De Vita, S., Alexander, K. A., Karaman, R., Milsom, M. D., Dorrance, A. M., Purdon, A., Louis, L., Bouxsein, M. L., & Williams, D. A. (2012). Rac signaling in osteoblastic cells is required for normal bone development but is dispensable for hematopoietic development. Blood, 119(3), 736-744.
Lawo, S., Bashkurov, M., Mullin, M., Ferreria, M. G., Kittler, R., Habermann, B., Tagliaferro, A., Poser, I., Hutchins, J. R., Hegemann, B., Pinchev, D., Buchholz, F., Peters, J. M., Hyman, A. A., Gingras, A. C., & Pelletier, L. (2009). HAUS, the 8-subunit human Augmin complex, regulates centrosome and spindle integrity. Curr Biol, 19(10), 816-826.
Leber, B., Maier, B., Fuchs, F., Chi, J., Riffel, P., Anderhub, S., Wagner, L., Ho, A. D., Salisbury, J. L., Boutros, M., & Kramer, A. (2010). Proteins required for centrosome clustering in cancer cells. Sci Transl Med, 2(33), 33ra38.
REFERENCES
145
Leboy, P., Grasso-Knight, G., D'Angelo, M., Volk, S. W., Lian, J. V., Drissi, H., Stein, G. S., & Adams, S. L. (2001). Smad-Runx interactions during chondrocyte maturation. J Bone Joint Surg Am, 83-A Suppl 1(Pt 1), S15-22.
Lee, A. P., Koh, E. G., Tay, A., Brenner, S., & Venkatesh, B. (2006). Highly conserved syntenic blocks at the vertebrate Hox loci and conserved regulatory elements within and outside Hox gene clusters. Proc Natl Acad Sci U S A, 103(18), 6994-6999.
Lee, J. Y., Hur, H., Yun, H. J., Kim, Y., Yang, S., Kim, S. I., & Kim, M. H. (2015). HOXB5 Promotes the Proliferation and Invasion of Breast Cancer Cells. Int J Biol Sci, 11(6), 701-711.
Lee, K. S., Hong, S. H., & Bae, S. C. (2002). Both the Smad and p38 MAPK pathways play a crucial role in Runx2 expression following induction by transforming growth factor-beta and bone morphogenetic protein. Oncogene, 21(47), 7156-7163.
Lee, K. S., Kim, H. J., Li, Q. L., Chi, X. Z., Ueta, C., Komori, T., Wozney, J. M., Kim, E. G., Choi, J. Y., Ryoo, H. M., & Bae, S. C. (2000). Runx2 is a common target of transforming growth factor beta1 and bone morphogenetic protein 2, and cooperation between Runx2 and Smad5 induces osteoblast-specific gene expression in the pluripotent mesenchymal precursor cell line C2C12. Mol Cell Biol, 20(23), 8783-8792.
Lefebvre, V., Behringer, R. R., & de Crombrugghe, B. (2001). L-Sox5, Sox6 and Sox9 control essential steps of the chondrocyte differentiation pathway. Osteoarthritis and Cartilage, 9, Supplement 1(0), S69-S75.
Lefebvre, V., Li, P., & de Crombrugghe, B. (1998). A new long form of Sox5 (L-Sox5), Sox6 and Sox9 are coexpressed in chondrogenesis and cooperatively activate the type II collagen gene. EMBO J, 17(19), 5718-5733.
Lefebvre, V., & Smits, P. (2005). Transcriptional control of chondrocyte fate and differentiation. Birth Defects Research Part C: Embryo Today: Reviews, 75(3), 200-212.
Lei, Y. X., Chen, J. K., & Wu, Z. L. (2002). Blocking the translation elongation factor-1 delta with its antisense mRNA results in a significant reversal of its oncogenic potential. Teratog Carcinog Mutagen, 22(5), 377-383.
Leung, J. W., Ghosal, G., Wang, W., Shen, X., Wang, J., Li, L., & Chen, J. (2013). Alpha thalassemia/mental retardation syndrome X-linked gene product ATRX is required for proper replication restart and cellular resistance to replication stress. J Biol Chem, 288(9), 6342-6350.
Levine, M., & Hoey, T. (1988). Homeobox proteins as sequence-specific transcription factors. Cell, 55(4), 537-540.
Levine, S. S., Weiss, A., Erdjument-Bromage, H., Shao, Z., Tempst, P., & Kingston, R. E. (2002). The core of the polycomb repressive complex is compositionally and functionally conserved in flies and humans. Mol Cell Biol, 22(17), 6070-6078.
Lewis, E. B. (1978). A gene complex controlling segmentation in Drosophila. Nature, 276(5688), 565-570.
Li, B., Jin, H., Yu, Y., Gu, C., Zhou, X., Zhao, N., & Feng, Y. (2009). HOXA10 is overexpressed in human ovarian clear cell adenocarcinoma and correlates with poor survival. International Journal of Gynecological Cancer, 19(8), 1347-1352.
146
Li, B., Yu, H., Zheng, W., Voll, R., Na, S., Roberts, A. W., Williams, D. A., Davis, R. J., Ghosh, S., & Flavell, R. A. (2000). Role of the guanosine triphosphatase Rac2 in T helper 1 cell differentiation. Science, 288(5474), 2219-2222.
Li, Q., Ding, C., Chen, C., Zhang, Z., Xiao, H., Xie, F., Lei, L., Chen, Y., Mao, B., Jiang, M., Li, J., Wang, D., & Wang, G. (2014). miR-224 promotion of cell migration and invasion by targeting Homeobox D 10 gene in human hepatocellular carcinoma. J Gastroenterol Hepatol, 29(4), 835-842.
Li, X., & Cao, X. (2003). BMP signaling and HOX transcription factors in limb development. Front Biosci, 8, s805-812.
Li, X., & Cao, X. (2006). BMP signaling and skeletogenesis. Ann N Y Acad Sci, 1068, 26-40.
Li, X., McGee-Lawrence, M. E., Decker, M., & Westendorf, J. J. (2010). The Ewing's sarcoma fusion protein, EWS-FLI, binds Runx2 and blocks osteoblast differentiation. J Cell Biochem, 111(4), 933-943.
Li, Y., Yang, X. H., Fang, S. J., Qin, C. F., Sun, R. L., Liu, Z. Y., Jiang, B. Y., Wu, X., & Li, G. (2015). HOXA7 stimulates human hepatocellular carcinoma proliferation through cyclin E1/CDK2. Oncol Rep, 33(2), 990-996.
Liao, C. G., Kong, L. M., Zhou, P., Yang, X. L., Huang, J. G., Zhang, H. L., & Lu, N. (2014). miR-10b is overexpressed in hepatocellular carcinoma and promotes cell proliferation, migration and invasion through RhoC, uPAR and MMPs. J Transl Med, 12(1), 234.
Lim, J., Tu, X., Choi, K., Akiyama, H., Mishina, Y., & Long, F. (2015). BMP-Smad4 signaling is required for precartilaginous mesenchymal condensation independent of Sox9 in the mouse. Dev Biol, 400(1), 132-138.
Lin, A. W., & Carpenter, E. M. (2003). Hoxa10 and Hoxd10 coordinately regulate lumbar motor neuron patterning. J Neurobiol, 56(4), 328-337.
Lin, J., Teo, S., Lam, D. H., Jeyaseelan, K., & Wang, S. (2012). MicroRNA-10b pleiotropically regulates invasion, angiogenicity and apoptosis of tumor cells resembling mesenchymal subtype of glioblastoma multiforme. Cell Death Dis, 3, e398.
Lin, Y. W., Slape, C., Zhang, Z., & Aplan, P. D. (2005). NUP98-HOXD13 transgenic mice develop a highly penetrant, severe myelodysplastic syndrome that progresses to acute leukemia. Blood, 106(1), 287-295.
Liu, Y. J., Zhu, Y., Yuan, H. X., Zhang, J. P., Guo, J. M., & Lin, Z. M. (2015). Overexpression of HOXC11 homeobox gene in clear cell renal cell carcinoma induces cellular proliferation and is associated with poor prognosis. Tumour Biol, 36(4), 2821-2829.
Liu, Z., Shi, W., Ji, X., Sun, C., Jee, W. S., Wu, Y., Mao, Z., Nagy, T. R., Li, Q., & Cao, X. (2004). Molecules mimicking Smad1 interacting with Hox stimulate bone formation. J Biol Chem, 279(12), 11313-11319.
REFERENCES
147
Liu, Z., Zhu, J., Cao, H., Ren, H., & Fang, X. (2012). miR-10b promotes cell invasion through RhoC-AKT signaling pathway by targeting HOXD10 in gastric cancer. Int J Oncol, 40(5), 1553-1560.
Livak, K. J., Flood, S. J., Marmaro, J., Giusti, W., & Deetz, K. (1995). Oligonucleotides with fluorescent dyes at opposite ends provide a quenched probe system useful for detecting PCR product and nucleic acid hybridization. PCR Methods Appl, 4(6), 357-362.
Livak, K. J., & Schmittgen, T. D. (2001). Analysis of relative gene expression data using real-time quantitative PCR and the 2(-Delta Delta C(T)) Method. Methods, 25(4), 402-408.
Lizard-Nacol, S., Lizard, G., Justrabo, E., & Turc-Carel, C. (1989). Immunologic characterization of Ewing's sarcoma using mesenchymal and neural markers. Am J Pathol, 135(5), 847-855.
Long, F., & Ornitz, D. M. (2013). Development of the endochondral skeleton. Cold Spring Harb Perspect Biol, 5(1), a008334.
Louis, C. U., & Shohet, J. M. (2015). Neuroblastoma: molecular pathogenesis and therapy. Annual Review of Medicine, 66, 49-63.
Lovejoy, C. A., Li, W., Reisenweber, S., Thongthip, S., Bruno, J., de Lange, T., De, S., Petrini, J. H., Sung, P. A., Jasin, M., Rosenbluh, J., Zwang, Y., Weir, B. A., Hatton, C., Ivanova, E., Macconaill, L., Hanna, M., Hahn, W. C., Lue, N. F., Reddel, R. R., Jiao, Y., Kinzler, K., Vogelstein, B., Papadopoulos, N., & Meeker, A. K. (2012). Loss of ATRX, genome instability, and an altered DNA damage response are hallmarks of the alternative lengthening of telomeres pathway. PLoS Genet, 8(7), e1002772.
Ma, L., Teruya-Feldstein, J., & Weinberg, R. A. (2007). Tumour invasion and metastasis initiated by microRNA-10b in breast cancer. Nature, 449(7163), 682-688.
Maconochie, M., Nonchev, S., Morrison, A., & Krumlauf, R. (1996). Paralogous Hox genes: function and regulation. Annu Rev Genet, 30, 529-556.
Maden, M., Gale, E., Kostetskii, I., & Zile, M. (1996). Vitamin A-deficient quail embryos have half a hindbrain and other neural defects. Curr Biol, 6(4), 417-426.
Malik, S., & Grzeschik, K. H. (2008). Synpolydactyly: clinical and molecular advances. Clin Genet, 73(2), 113-120.
Marini, P., MacLeod, R. A., Treuner, C., Bruchelt, G., Bohm, W., Wolburg, H., Schweizer, P., & Girgert, R. (1999). SiMa, a new neuroblastoma cell line combining poor prognostic cytogenetic markers with high adrenergic differentiation. Cancer Genetics and Cytogenetics, 112(2), 161-164.
Marinoni, I., Kurrer, A. S., Vassella, E., Dettmer, M., Rudolph, T., Banz, V., Hunger, F., Pasquinelli, S., Speel, E. J., & Perren, A. (2014). Loss of DAXX and ATRX are associated with chromosome instability and reduced survival of patients with pancreatic neuroendocrine tumors. Gastroenterology, 146(2), 453-460 e455.
Martin, J. W., Zielenska, M., Stein, G. S., van Wijnen, A. J., & Squire, J. A. (2011). The Role of RUNX2 in Osteosarcoma Oncogenesis. Sarcoma, 2011, 282745.
McAllister, R. M., Gardner, M. B., Greene, A. E., Bradt, C., Nichols, W. W., & Landing, B. H. (1971). Cultivation in vitro of cells derived from a human osteosarcoma. Cancer, 27(2), 397-402.
McGinnis, W. (1994). A century of homeosis, a decade of homeoboxes. Genetics, 137(3), 607-611.
McGinnis, W., & Krumlauf, R. (1992). Homeobox genes and axial patterning. Cell, 68(2), 283-302.
McGinnis, W., Levine, M. S., Hafen, E., Kuroiwa, A., & Gehring, W. J. (1984). A conserved DNA sequence in homoeotic genes of the Drosophila Antennapedia and bithorax complexes. Nature, 308(5958), 428-433.
McKie, J., & Radomisli, T. (2010). Congenital vertical talus: a review. Clin Podiatr Med Surg, 27(1), 145-156.
McManus, A. P., Gusterson, B. A., Pinkerton, C. R., & Shipley, J. M. (1996). The molecular pathology of small round-cell tumours--relevance to diagnosis, prognosis, and classification. J Pathol, 178(2), 116-121.
Merrill, R. A., Ahrens, J. M., Kaiser, M. E., Federhart, K. S., Poon, V. Y., & Clagett-Dame, M. (2004). All-trans retinoic acid-responsive genes identified in the human SH-SY5Y neuroblastoma cell line and their regulated expression in the nervous system of early embryos. Biol Chem, 385(7), 605-614.
Misra, M., Shah, V., Carpenter, E., McCaffery, P., & Lance-Jones, C. (2009). Restricted patterns of Hoxd10 and Hoxd11 set segmental differences in motoneuron subtype complement in the lumbosacral spinal cord. Dev Biol, 330(1), 54-72.
Miyamoto, K., Fukutomi, T., Akashi-Tanaka, S., Hasegawa, T., Asahara, T., Sugimura, T., & Ushijima, T. (2005). Identification of 20 genes aberrantly methylated in human breast cancers. Int J Cancer, 116(3), 407-414.
Miyazono, K., Kamiya, Y., & Morikawa, M. (2010). Bone morphogenetic protein receptors and signal transduction. J Biochem, 147(1), 35-51.
Miyazono, K., Maeda, S., & Imamura, T. (2005). BMP receptor signaling: transcriptional targets, regulation of signals, and signaling cross-talk. Cytokine Growth Factor Rev, 16(3), 251-263.
Montavon, T., & Soshnikova, N. (2014). Hox gene regulation and timing in embryogenesis. Seminars in Cell & Developmental Biology, 34, 76-84.
Moosmann, S., Hutter, J., Moser, C., Krombach, F., & Huss, R. (2005). Milieu-Adopted in vitro and in vivo Differentiation of Mesenchymal Tissues Derived from Different Adult Human CD34-Negative Progenitor Cell Clones. Cells Tissues Organs, 179(3), 91-101.
Morales, J., Cormier, P., Mulner-Lorillon, O., Poulhe, R., & Belle, R. (1992). Molecular cloning of a new guanine nucleotide-exchange protein, EF1 delta. Nucleic Acids Res, 20(15), 4091.
REFERENCES
149
Morgan, R., Plowright, L., Harrington, K. J., Michael, A., & Pandha, H. S. (2010). Targeting HOX and PBX transcription factors in ovarian cancer. BMC Cancer, 10, 89.
Mori, S., Chang, J. T., Andrechek, E. R., Matsumura, N., Baba, T., Yao, G., Kim, J. W., Gatza, M., Murphy, S., & Nevins, J. R. (2009). Anchorage-independent cell growth signature identifies tumors with metastatic potential. Oncogene, 28(31), 2796-2805.
Mugford, J. W., Sipila, P., Kobayashi, A., Behringer, R. R., & McMahon, A. P. (2008). Hoxd11 specifies a program of metanephric kidney development within the intermediate mesoderm of the mouse embryo. Dev Biol, 319(2), 396-405.
Muller, M., Affolter, M., Leupin, W., Otting, G., Wuthrich, K., & Gehring, W. J. (1988). Isolation and sequence-specific DNA binding of the Antennapedia homeodomain. EMBO J, 7(13), 4299-4304.
Mundlos, S., Otto, F., Mundlos, C., Mulliken, J. B., Aylsworth, A. S., Albright, S., Lindhout, D., Cole, W. G., Henn, W., Knoll, J. H., Owen, M. J., Mertelsmann, R., Zabel, B. U., & Olsen, B. R. (1997). Mutations involving the transcription factor CBFA1 cause cleidocranial dysplasia. Cell, 89(5), 773-779.
Mundy, G. R. (2002). Metastasis to bone: causes, consequences and therapeutic opportunities. Nat Rev Cancer, 2(8), 584-593.
Muragaki, Y., Mundlos, S., Upton, J., & Olsen, B. R. (1996). Altered growth and branching patterns in synpolydactyly caused by mutations in HOXD13. Science, 272(5261), 548-551.
Myers, C., Charboneau, A., Cheung, I., Hanks, D., & Boudreau, N. (2002). Sustained expression of homeobox D10 inhibits angiogenesis. Am J Pathol, 161(6), 2099-2109.
Nagaraja, G. M., Othman, M., Fox, B. P., Alsaber, R., Pellegrino, C. M., Zeng, Y., Khanna, R., Tamburini, P., Swaroop, A., & Kandpal, R. P. (2006). Gene expression signatures and biomarkers of noninvasive and invasive breast cancer cells: comprehensive profiles by representational difference analysis, microarrays and proteomics. Oncogene, 25(16), 2328-2338.
Nakayama, I., Shibazaki, M., Yashima-Abo, A., Miura, F., Sugiyama, T., Masuda, T., & Maesawa, C. (2013). Loss of HOXD10 expression induced by upregulation of miR-10b accelerates the migration and invasion activities of ovarian cancer cells. Int J Oncol, 43(1), 63-71.
Nelson, C. E., Morgan, B. A., Burke, A. C., Laufer, E., DiMambro, E., Murtaugh, L. C., Gonzales, E., Tessarollo, L., Parada, L. F., & Tabin, C. (1996). Analysis of Hox gene expression in the chick limb bud. Development, 122(5), 1449-1466.
Niemeyer, C., & Rössler, J. (2013). Krebserkrankungen. In B. Koletzko (Ed.), Kinder- und Jugendmedizin (Vol. 14. Auflage, pp. 315-318). Berlin, Heidelberg: Springer-Verlag.
Nifuji, A., Kellermann, O., & Noda, M. (2004). Noggin inhibits chondrogenic but not osteogenic differentiation in mesodermal stem cell line C1 and skeletal cells. Endocrinology, 145(7), 3434-3442.
Ogawa, K., Utsunomiya, T., Mimori, K., Tanaka, Y., Tanaka, F., Inoue, H., Murayama, S., & Mori, M. (2004). Clinical significance of elongation factor-1 delta mRNA expression in oesophageal carcinoma. Br J Cancer, 91(2), 282-286.
150
Osborne, J., Hu, C., Hawley, C., Underwood, L. J., O'Brien, T. J., & Baker, V. V. (1998). Expression of HOXD10 gene in normal endometrium and endometrial adenocarcinoma. J Soc Gynecol Investig, 5(5), 277-280.
Otting, G., Qian, Y. Q., Muller, M., Affolter, M., Gehring, W., & Wuthrich, K. (1988). Secondary structure determination for the Antennapedia homeodomain by nuclear magnetic resonance and evidence for a helix-turn-helix motif. EMBO J, 7(13), 4305-4309.
Otto, F., Thornell, A. P., Crompton, T., Denzel, A., Gilmour, K. C., Rosewell, I. R., Stamp, G. W., Beddington, R. S., Mundlos, S., Olsen, B. R., Selby, P. B., & Owen, M. J. (1997). Cbfa1, a candidate gene for cleidocranial dysplasia syndrome, is essential for osteoblast differentiation and bone development. Cell, 89(5), 765-771.
Pareyson, D. (1999). Charcot-marie-tooth disease and related neuropathies: molecular basis for distinction and diagnosis. Muscle Nerve, 22(11), 1498-1509.
Patterson, L. T., Pembaur, M., & Potter, S. S. (2001). Hoxa11 and Hoxd11 regulate branching morphogenesis of the ureteric bud in the developing kidney. Development, 128(11), 2153-2161.
Pearson, J. C., Lemons, D., & McGinnis, W. (2005). Modulating Hox gene functions during animal body patterning. Nature Reviews Genetics, 6(12), 893-904.
Phimphilai, M., Zhao, Z., Boules, H., Roca, H., & Franceschi, R. T. (2006). BMP signaling is required for RUNX2-dependent induction of the osteoblast phenotype. J Bone Miner Res, 21(4), 637-646.
Picketts, D. J., Higgs, D. R., Bachoo, S., Blake, D. J., Quarrell, O. W., & Gibbons, R. J. (1996). ATRX encodes a novel member of the SNF2 family of proteins: mutations point to a common mechanism underlying the ATR-X syndrome. Hum Mol Genet, 5(12), 1899-1907.
Picketts, D. J., Tastan, A. O., Higgs, D. R., & Gibbons, R. J. (1998). Comparison of the human and murine ATRX gene identifies highly conserved, functionally important domains. Mamm Genome, 9(5), 400-403.
Pietsch, T., Göttert, E., Feickert, H. J., Riehm, H., Blin, N., & Kovacs, G. (1989). MHH-ES-1, A new Ewing sarcoma cell line. Cancer Genetics and Cytogenetics, 38(2), 167.
Pizette, S., & Niswander, L. (2000). BMPs are required at two steps of limb chondrogenesis: formation of prechondrogenic condensations and their differentiation into chondrocytes. Dev Biol, 219(2), 237-249.
Ponten, J., & Saksela, E. (1967). Two established in vitro cell lines from human mesenchymal tumours. Int J Cancer, 2(5), 434-447.
Popperl, H., & Featherstone, M. S. (1992). An autoregulatory element of the murine Hox-4.2 gene. EMBO J, 11(10), 3673-3680.
Post, L. C., & Innis, J. W. (1999). Altered Hox expression and increased cell death distinguish Hypodactyly from Hoxa13 null mice. Int J Dev Biol, 43(4), 287-294.
Potratz, J., Dirksen, U., Jurgens, H., & Craft, A. (2012). Ewing sarcoma: clinical state-of-the-art. Pediatric Hematology and Oncology, 29(1), 1-11.
REFERENCES
151
Power, S. C., Lancman, J., & Smith, S. M. (1999). Retinoic acid is essential for Shh/Hoxd signaling during rat limb outgrowth but not for limb initiation. Dev Dyn, 216(4-5), 469-480.
Puthiyaveetil, A. G., Reilly, C. M., Pardee, T. S., & Caudell, D. L. (2013). Non-homologous end joining mediated DNA repair is impaired in the NUP98-HOXD13 mouse model for myelodysplastic syndrome. Leuk Res, 37(1), 112-116.
Qadeer, Z. A., Harcharik, S., Valle-Garcia, D., Chen, C., Birge, M. B., Vardabasso, C., Duarte, L. F., & Bernstein, E. (2014). Decreased expression of the chromatin remodeler ATRX associates with melanoma progression. J Invest Dermatol, 134(6), 1768-1772.
Raza-Egilmez, S. Z., Jani-Sait, S. N., Grossi, M., Higgins, M. J., Shows, T. B., & Aplan, P. D. (1998). NUP98-HOXD13 gene fusion in therapy-related acute myelogenous leukemia. Cancer Res, 58(19), 4269-4273.
Reddi, A. H., & Anderson, W. A. (1976). Collagenous bone matrix-induced endochondral ossification hemopoiesis. J Cell Biol, 69(3), 557-572.
Reddy, S. D., Ohshiro, K., Rayala, S. K., & Kumar, R. (2008). MicroRNA-7, a homeobox D10 target, inhibits p21-activated kinase 1 and regulates its functions. Cancer Res, 68(20), 8195-8200.
Redline, R. W., Hudock, P., MacFee, M., & Patterson, P. (1994). Expression of AbdB-type homeobox genes in human tumors. Lab Invest, 71(5), 663-670.
Richter, G. H., Fasan, A., Hauer, K., Grunewald, T. G., Berns, C., Rossler, S., Naumann, I., Staege, M. S., Fulda, S., Esposito, I., & Burdach, S. (2013). G-Protein coupled receptor 64 promotes invasiveness and metastasis in Ewing sarcomas through PGF and MMP1. J Pathol, 230(1), 70-81.
Richter, G. H., Plehm, S., Fasan, A., Rossler, S., Unland, R., Bennani-Baiti, I. M., Hotfilder, M., Lowel, D., von Luettichau, I., Mossbrugger, I., Quintanilla-Martinez, L., Kovar, H., Staege, M. S., Muller-Tidow, C., & Burdach, S. (2009). EZH2 is a mediator of EWS/FLI1 driven tumor growth and metastasis blocking endothelial and neuro-ectodermal differentiation. Proc Natl Acad Sci U S A, 106(13), 5324-5329.
Riggi, N., Cironi, L., Provero, P., Suva, M. L., Kaloulis, K., Garcia-Echeverria, C., Hoffmann, F., Trumpp, A., & Stamenkovic, I. (2005). Development of Ewing's sarcoma from primary bone marrow-derived mesenchymal progenitor cells. Cancer Res, 65(24), 11459-11468.
Rinn, J. L., Kertesz, M., Wang, J. K., Squazzo, S. L., Xu, X., Brugmann, S. A., Goodnough, L. H., Helms, J. A., Farnham, P. J., Segal, E., & Chang, H. Y. (2007). Functional demarcation of active and silent chromatin domains in human HOX loci by noncoding RNAs. Cell, 129(7), 1311-1323.
Ritchie, K., Seah, C., Moulin, J., Isaac, C., Dick, F., & Berube, N. G. (2008). Loss of ATRX leads to chromosome cohesion and congression defects. J Cell Biol, 180(2), 315-324.
Roberts, A. W., Kim, C., Zhen, L., Lowe, J. B., Kapur, R., Petryniak, B., Spaetti, A., Pollock, J. D., Borneo, J. B., Bradford, G. B., Atkinson, S. J., Dinauer, M. C., & Williams, D. A. (1999). Deficiency of the hematopoietic cell-specific Rho family GTPase Rac2 is characterized by abnormalities in neutrophil function and host defense. Immunity, 10(2), 183-196.
152
Roberts, I., Wienberg, J., Nacheva, E., Grace, C., Griffin, D., & Coleman, N. (1999). Novel method for the production of multiple colour chromosome paints for use in karyotyping by fluorescence in situ hybridisation. Genes Chromosomes Cancer, 25(3), 241-250.
Rodini, C. O., Xavier, F. C., Paiva, K. B., De Souza Setubal Destro, M. F., Moyses, R. A., Michaluarte, P., Carvalho, M. B., Fukuyama, E. E., Tajara, E. H., Okamoto, O. K., & Nunes, F. D. (2012). Homeobox gene expression profile indicates HOXA5 as a candidate prognostic marker in oral squamous cell carcinoma. Int J Oncol, 40(4), 1180-1188.
Rorie, C. J., Thomas, V. D., Chen, P., Pierce, H. H., O'Bryan, J. P., & Weissman, B. E. (2004). The Ews/Fli-1 fusion gene switches the differentiation program of neuroblastomas to Ewing sarcoma/peripheral primitive neuroectodermal tumors. Cancer Res, 64(4), 1266-1277.
Rossi Degl'Innocenti, D., Castiglione, F., Buccoliero, A. M., Bechi, P., Taddei, G. L., Freschi, G., & Taddei, A. (2007). Quantitative expression of the homeobox and integrin genes in human gastric carcinoma. Int J Mol Med, 20(4), 621-629.
Sadikovic, B., Thorner, P., Chilton-Macneill, S., Martin, J. W., Cervigne, N. K., Squire, J., & Zielenska, M. (2010). Expression analysis of genes associated with human osteosarcoma tumors shows correlation of RUNX2 overexpression with poor response to chemotherapy. BMC Cancer, 10, 202.
Salsi, V., Ferrari, S., Gorello, P., Fantini, S., Chiavolelli, F., Mecucci, C., & Zappavigna, V. (2014). NUP98 fusion oncoproteins promote aneuploidy by attenuating the mitotic spindle checkpoint. Cancer Res, 74(4), 1079-1090.
Salsi, V., Vigano, M. A., Cocchiarella, F., Mantovani, R., & Zappavigna, V. (2008). Hoxd13 binds in vivo and regulates the expression of genes acting in key pathways for early limb and skeletal patterning. Dev Biol, 317(2), 497-507.
Sankar, S., & Lessnick, S. L. (2011). Promiscuous partnerships in Ewing's sarcoma. Cancer Genet, 204(7), 351-365.
Sarma, K., Cifuentes-Rojas, C., Ergun, A., Del Rosario, A., Jeon, Y., White, F., Sadreyev, R., & Lee, J. T. (2014). ATRX directs binding of PRC2 to Xist RNA and Polycomb targets. Cell, 159(4), 869-883.
Schirmer, D., Grunewald, T. G., Klar, R., Schmidt, O., Wohlleber, D., Rubio, R. A., Uckert, W., Thiel, U., Bohne, F., Busch, D. H., Krackhardt, A. M., Burdach, S., & Richter, G. H. (2016). Transgenic antigen-specific, HLA-A*02:01-allo-restricted cytotoxic T cells recognize tumor-associated target antigen STEAP1 with high specificity. Oncoimmunology, 5(6), e1175795.
Scott, M. P. (1992). Vertebrate homeobox gene nomenclature. Cell, 71(4), 551-553.
Seifert, A., Werheid, D. F., Knapp, S. M., & Tobiasch, E. (2015). Role of Hox genes in stem cell differentiation. World J Stem Cells, 7(3), 583-595.
Sekar, P., Bharti, J. N., Nigam, J. S., Sharma, A., & Soni, P. B. (2014). Evaluation of p53, HoxD10, and E-Cadherin Status in Breast Cancer and Correlation with Histological Grade and Other Prognostic Factors. J Oncol, 2014, 702527.
REFERENCES
153
Shah, N., Jin, K., Cruz, L. A., Park, S., Sadik, H., Cho, S., Goswami, C. P., Nakshatri, H., Gupta, R., Chang, H. Y., Zhang, Z., Cimino-Mathews, A., Cope, L., Umbricht, C., & Sukumar, S. (2013). HOXB13 mediates tamoxifen resistance and invasiveness in human breast cancer by suppressing ERalpha and inducing IL-6 expression. Cancer Res, 73(17), 5449-5458.
Shah, N., & Sukumar, S. (2010). The Hox genes and their roles in oncogenesis. Nat Rev Cancer, 10(5), 361-371.
Shah, V., Drill, E., & Lance-Jones, C. (2004). Ectopic expression of Hoxd10 in thoracic spinal segments induces motoneurons with a lumbosacral molecular profile and axon projections to the limb. Dev Dyn, 231(1), 43-56.
Sharpe, D. J., Orr, K. S., Moran, M., White, S. J., McQuaid, S., Lappin, T. R., Thompson, A., & James, J. A. (2014). POU2F1 activity regulates HOXD10 and HOXD11 promoting a proliferative and invasive phenotype in head and neck cancer. Oncotarget, 5(18), 8803-8815.
Shepherd, J. C., McGinnis, W., Carrasco, A. E., De Robertis, E. M., & Gehring, W. J. (1984). Fly and frog homoeo domains show homologies with yeast mating type regulatory proteins. Nature, 310(5972), 70-71.
Sheth, R., Bastida, M. F., Kmita, M., & Ros, M. (2014). "Self-regulation," a new facet of Hox genes' function. Dev Dyn, 243(1), 182-191.
Shi, X., Yang, X., Chen, D., Chang, Z., & Cao, X. (1999). Smad1 interacts with homeobox DNA-binding proteins in bone morphogenetic protein signaling. J Biol Chem, 274(19), 13711-13717.
Shi, Y., & Massague, J. (2003). Mechanisms of TGF-beta signaling from cell membrane to the nucleus. Cell, 113(6), 685-700.
Shinawi, T., Hill, V. K., Krex, D., Schackert, G., Gentle, D., Morris, M. R., Wei, W., Cruickshank, G., Maher, E. R., & Latif, F. (2013). DNA methylation profiles of long- and short-term glioblastoma survivors. Epigenetics, 8(2), 149-156.
Shrimpton, A. E., Levinsohn, E. M., Yozawitz, J. M., Packard, D. S., Jr., Cady, R. B., Middleton, F. A., Persico, A. M., & Hootnick, D. R. (2004). A HOX gene mutation in a family with isolated congenital vertical talus and Charcot-Marie-Tooth disease. Am J Hum Genet, 75(1), 92-96.
Shu, B., Zhang, M., Xie, R., Wang, M., Jin, H., Hou, W., Tang, D., Harris, S. E., Mishina, Y., O'Keefe, R. J., Hilton, M. J., Wang, Y., & Chen, D. (2011). BMP2, but not BMP4, is crucial for chondrocyte proliferation and maturation during endochondral bone development. J Cell Sci, 124(Pt 20), 3428-3440.
Shu, Y., Wang, B., Wang, J., Wang, J. M., & Zou, S. Q. (2011). Identification of methylation profile of HOX genes in extrahepatic cholangiocarcinoma. World J Gastroenterol, 17(29), 3407-3419.
Simeone, A., Acampora, D., Arcioni, L., Andrews, P. W., Boncinelli, E., & Mavilio, F. (1990). Sequential activation of HOX2 homeobox genes by retinoic acid in human embryonal carcinoma cells. Nature, 346(6286), 763-766.
154
Slape, C., Chung, Y. J., Soloway, P. D., Tessarollo, L., & Aplan, P. D. (2007). Mouse embryonic stem cells that express a NUP98-HOXD13 fusion protein are impaired in their ability to differentiate and can be complemented by BCR-ABL. Leukemia, 21(6), 1239-1248.
Slape, C., Lin, Y. W., Hartung, H., Zhang, Z., Wolff, L., & Aplan, P. D. (2008). NUP98-HOX translocations lead to myelodysplastic syndrome in mice and men. J Natl Cancer Inst Monogr(39), 64-68.
Smits, P., Li, P., Mandel, J., Zhang, Z., Deng, J. M., Behringer, R. R., de Crombrugghe, B., & Lefebvre, V. (2001). The transcription factors L-Sox5 and Sox6 are essential for cartilage formation. Dev Cell, 1(2), 277-290.
Solomon, L. A., Li, J. R., Berube, N. G., & Beier, F. (2009). Loss of ATRX in chondrocytes has minimal effects on skeletal development. PLoS One, 4(9), e7106.
Solomon, L. A., Russell, B. A., Watson, L. A., Beier, F., & Berube, N. G. (2013). Targeted loss of the ATR-X syndrome protein in the limb mesenchyme of mice causes brachydactyly. Hum Mol Genet, 22(24), 5015-5025.
Spilka, R., Ernst, C., Mehta, A. K., & Haybaeck, J. (2013). Eukaryotic translation initiation factors in cancer development and progression. Cancer Letters, 340(1), 9-21.
Spitz, F., Gonzalez, F., Peichel, C., Vogt, T. F., Duboule, D., & Zakany, J. (2001). Large scale transgenic and cluster deletion analysis of the HoxD complex separate an ancestral regulatory module from evolutionary innovations. Genes Dev, 15(17), 2209-2214.
Staege, M. S., Hutter, C., Neumann, I., Foja, S., Hattenhorst, U. E., Hansen, G., Afar, D., & Burdach, S. E. (2004). DNA microarrays reveal relationship of Ewing family tumors to both endothelial and fetal neural crest-derived cells and define novel targets. Cancer Res, 64(22), 8213-8221.
Sturn, A., Quackenbush, J., & Trajanoski, Z. (2002). Genesis: cluster analysis of microarray data. Bioinformatics, 18(1), 207-208.
Subramanian, A., Tamayo, P., Mootha, V. K., Mukherjee, S., Ebert, B. L., Gillette, M. A., Paulovich, A., Pomeroy, S. L., Golub, T. R., Lander, E. S., & Mesirov, J. P. (2005). Gene set enrichment analysis: a knowledge-based approach for interpreting genome-wide expression profiles. Proc Natl Acad Sci U S A, 102(43), 15545-15550.
Sun, L., Yan, W., Wang, Y., Sun, G., Luo, H., Zhang, J., Wang, X., You, Y., Yang, Z., & Liu, N. (2011). MicroRNA-10b induces glioma cell invasion by modulating MMP-14 and uPAR expression via HOXD10. Brain Res, 1389, 9-18.
Sun, S.-S., Zhang, L., Yang, J., & Zhou, X. (2015). Role of runt-related transcription factor 2 in signal network of tumors as an inter-mediator. Cancer Letters, 361(1), 1-7.
Suzuki, M., Ueno, N., & Kuroiwa, A. (2003). Hox proteins functionally cooperate with the GC box-binding protein system through distinct domains. J Biol Chem, 278(32), 30148-30156.
Svoboda, L. K., Harris, A., Bailey, N. J., Schwentner, R., Tomazou, E., von Levetzow, C., Magnuson, B., Ljungman, M., Kovar, H., & Lawlor, E. R. (2014). Overexpression of HOX genes is prevalent in Ewing sarcoma and is associated with altered epigenetic regulation of developmental transcription programs. Epigenetics, 9(12), 1613-1625.
REFERENCES
155
Taketani, T., Taki, T., Shibuya, N., Ito, E., Kitazawa, J., Terui, K., & Hayashi, Y. (2002). The HOXD11 gene is fused to the NUP98 gene in acute myeloid leukemia with t(2;11)(q31;p15). Cancer Res, 62(1), 33-37.
Tan, X., Weng, T., Zhang, J., Wang, J., Li, W., Wan, H., Lan, Y., Cheng, X., Hou, N., Liu, H., Ding, J., Lin, F., Yang, R., Gao, X., Chen, D., & Yang, X. (2007). Smad4 is required for maintaining normal murine postnatal bone homeostasis. J Cell Sci, 120(Pt 13), 2162-2170.
Tasca, A., Stemig, M., Broege, A., Huang, B., Davydova, J., Zwijsen, A., Umans, L., Jensen, E. D., Gopalakrishnan, R., & Mansky, K. C. (2015). Smad 1/5 and Smad 4 Expression Are Important for Osteoclast Differentiation. J Cell Biochem.
Tatsuka, M., Mitsui, H., Wada, M., Nagata, A., Nojima, H., & Okayama, H. (1992). Elongation factor-1 alpha gene determines susceptibility to transformation. Nature, 359(6393), 333-336.
Thalmeier, K., Meissner, P., Reisbach, G., Falk, M., Brechtel, A., & Dormer, P. (1994). Establishment of two permanent human bone marrow stromal cell lines with long-term post irradiation feeder capacity. Blood, 83(7), 1799-1807.
Thiel, U., Pirson, S., Muller-Spahn, C., Conrad, H., Busch, D. H., Bernhard, H., Burdach, S., & Richter, G. H. (2011). Specific recognition and inhibition of Ewing tumour growth by antigen-specific allo-restricted cytotoxic T cells. Br J Cancer, 104(6), 948-956.
Thornton, S., Anand, N., Purcell, D., & Lee, J. (2003). Not just for housekeeping: protein initiation and elongation factors in cell growth and tumorigenesis. J Mol Med (Berl), 81(9), 536-548.
Tirode, F., Laud-Duval, K., Prieur, A., Delorme, B., Charbord, P., & Delattre, O. (2007). Mesenchymal stem cell features of Ewing tumors. Cancer Cell, 11(5), 421-429.
Topisirovic, I., Kentsis, A., Perez, J. M., Guzman, M. L., Jordan, C. T., & Borden, K. L. (2005). Eukaryotic translation initiation factor 4E activity is modulated by HOXA9 at multiple levels. Mol Cell Biol, 25(3), 1100-1112.
Tsai, C. A., Chen, Y. J., & Chen, J. J. (2003). Testing for differentially expressed genes with microarray data. Nucleic Acids Res, 31(9), e52.
Tschopp, P., & Duboule, D. (2011). A regulatory 'landscape effect' over the HoxD cluster. Dev Biol, 351(2), 288-296.
Tsumaki, N., & Yoshikawa, H. (2005). The role of bone morphogenetic proteins in endochondral bone formation. Cytokine Growth Factor Rev, 16(3), 279-285.
Turc-Carel, C., Philip, I., Berger, M. P., Philip, T., & Lenoir, G. M. (1984). Chromosome study of Ewing's sarcoma (ES) cell lines. Consistency of a reciprocal translocation t(11;22)(q24;q12). Cancer Genetics and Cytogenetics, 12(1), 1-19.
Tusher, V. G., Tibshirani, R., & Chu, G. (2001). Significance analysis of microarrays applied to the ionizing radiation response. Proc Natl Acad Sci U S A, 98(9), 5116-5121.
156
Tuzel, E., Samli, H., Kuru, I., Turkmen, S., Demir, Y., Maralcan, G., & Guler, C. (2007). Association of hypospadias with hypoplastic synpolydactyly and role of HOXD13 gene mutations. Urology, 70(1), 161-164.
Urist, M. R., & Strates, B. S. (2009). The classic: Bone morphogenetic protein. Clin Orthop Relat Res, 467(12), 3051-3062.
van der Hoeven, F., Zakany, J., & Duboule, D. (1996). Gene transpositions in the HoxD complex reveal a hierarchy of regulatory controls. Cell, 85(7), 1025-1035.
VanGuilder, H. D., Vrana, K. E., & Freeman, W. M. (2008). Twenty-five years of quantitative PCR for gene expression analysis. Biotechniques, 44(5), 619-626.
Vardhini, N. V., Rao, P. J., Murthy, P. B., & Sudhakar, G. (2014). HOXD10 expression in human breast cancer. Tumour Biol, 35(11), 10855-10860.
Villavicencio-Lorini, P., Kuss, P., Friedrich, J., Haupt, J., Farooq, M., Turkmen, S., Duboule, D., Hecht, J., & Mundlos, S. (2010). Homeobox genes d11-d13 and a13 control mouse autopod cortical bone and joint formation. J Clin Invest, 120(6), 1994-2004.
Volk, S. W., Luvalle, P., Leask, T., & Leboy, P. S. (1998). A BMP responsive transcriptional region in the chicken type X collagen gene. J Bone Miner Res, 13(10), 1521-1529.
von Heyking, K., Roth, L., Ertl, M., Schmidt, O., Calzada-Wack, J., Neff, F., Lawlor, E. R., Burdach, S., & Richter, G. H. (2016). The posterior HOXD locus: Its contribution to phenotype and malignancy of Ewing sarcoma. Oncotarget, 7(27), 41767-41780.
Wacker, S. A., McNulty, C. L., & Durston, A. J. (2004). The initiation of Hox gene expression in Xenopus laevis is controlled by Brachyury and BMP-4. Dev Biol, 266(1), 123-137.
Wai, P. Y., & Kuo, P. C. (2008). Osteopontin: regulation in tumor metastasis. Cancer Metastasis Rev, 27(1), 103-118.
Wang, L., Chen, S., Xue, M., Zhong, J., Wang, X., Gan, L., Lam, E. K., Liu, X., Zhang, J., Zhou, T., Yu, J., Jin, H., & Si, J. (2012). Homeobox D10 gene, a candidate tumor suppressor, is downregulated through promoter hypermethylation and associated with gastric carcinogenesis. Mol Med, 18, 389-400.
Wang, L. L., Fu, W. N., Li-Ling, J., Li, Z. G., Li, L. Y., & Sun, K. L. (2008). HOXD13 may play a role in idiopathic congenital clubfoot by regulating the expression of FHL1. Cytogenet Genome Res, 121(3-4), 189-195.
Wang, Y., Lebowitz, D., Sun, C., Thang, H., Grynpas, M. D., & Glogauer, M. (2008). Identifying the relative contributions of Rac1 and Rac2 to osteoclastogenesis. J Bone Miner Res, 23(2), 260-270.
Wang, Y. F., Li, Z., Zhao, X. H., Zuo, X. M., Zhang, Y., Xiao, Y. H., Li, J., & Peng, Z. H. (2015). MicroRNA-10b is upregulated and has an invasive role in colorectal cancer through enhanced Rhoc expression. Oncol Rep, 33(3), 1275-1283.
Warot, X., Fromental-Ramain, C., Fraulob, V., Chambon, P., & Dolle, P. (1997). Gene dosage-dependent effects of the Hoxa-13 and Hoxd-13 mutations on morphogenesis of the terminal parts of the digestive and urogenital tracts. Development, 124(23), 4781-4791.
REFERENCES
157
Warren, S. T. (1997). Polyalanine expansion in synpolydactyly might result from unequal crossing-over of HOXD13. Science, 275(5298), 408-409.
Watson, L. A., Solomon, L. A., Li, J. R., Jiang, Y., Edwards, M., Shin-ya, K., Beier, F., & Berube, N. G. (2013). Atrx deficiency induces telomere dysfunction, endocrine defects, and reduced life span. J Clin Invest, 123(5), 2049-2063.
Wellik, D. M., Hawkes, P. J., & Capecchi, M. R. (2002). Hox11 paralogous genes are essential for metanephric kidney induction. Genes Dev, 16(11), 1423-1432.
Whang-Peng, J., Triche, T. J., Knutsen, T., Miser, J., Kao-Shan, S., Tsai, S., & Israel, M. A. (1986). Cytogenetic characterization of selected small round cell tumors of childhood. Cancer Genetics and Cytogenetics, 21(3), 185-208.
Williams, T. M., Williams, M. E., Heaton, J. H., Gelehrter, T. D., & Innis, J. W. (2005). Group 13 HOX proteins interact with the MH2 domain of R-Smads and modulate Smad transcriptional activation functions independent of HOX DNA-binding capability. Nucleic Acids Res, 33(14), 4475-4484.
Winnier, G., Blessing, M., Labosky, P. A., & Hogan, B. L. (1995). Bone morphogenetic protein-4 is required for mesoderm formation and patterning in the mouse. Genes Dev, 9(17), 2105-2116.
Wong, L. H., McGhie, J. D., Sim, M., Anderson, M. A., Ahn, S., Hannan, R. D., George, A. J., Morgan, K. A., Mann, J. R., & Choo, K. H. (2010). ATRX interacts with H3.3 in maintaining telomere structural integrity in pluripotent embryonic stem cells. Genome Res, 20(3), 351-360.
Worch, J., Matthay, K. K., Neuhaus, J., Goldsby, R., & DuBois, S. G. (2010). Ethnic and racial differences in patients with Ewing sarcoma. Cancer, 116(4), 983-988.
Wuelling, M., & Vortkamp, A. (2011). Chondrocyte proliferation and differentiation. Endocrine Development, 21, 1-11.
Xia, X., Wu, W., Huang, C., Cen, G., Jiang, T., Cao, J., Huang, K., & Qiu, Z. (2015). SMAD4 and its role in pancreatic cancer. Tumour Biol, 36(1), 111-119.
Xiao, H., Li, H., Yu, G., Xiao, W., Hu, J., Tang, K., Zeng, J., He, W., Zeng, G., Ye, Z., & Xu, H. (2014). MicroRNA-10b promotes migration and invasion through KLF4 and HOXD10 in human bladder cancer. Oncol Rep, 31(4), 1832-1838.
Xu, B., Geerts, D., Bu, Z., Ai, J., Jin, L., Li, Y., Zhang, H., & Zhu, G. (2014). Regulation of endometrial receptivity by the highly expressed HOXA9, HOXA11 and HOXD10 HOX-class homeobox genes. Hum Reprod, 29(4), 781-790.
Xue, M., Fang, Y., Sun, G., Zhuo, W., Zhong, J., Qian, C., Wang, L., Wang, L., Si, J., & Chen, S. (2013). IGFBP3, a transcriptional target of homeobox D10, is correlated with the prognosis of gastric cancer. PLoS One, 8(12), e81423.
Yamashita, T., Tazawa, S., Yawei, Z., Katayama, H., Kato, Y., Nishiwaki, K., Yokohama, Y., & Ishikawa, M. (2006). Suppression of invasive characteristics by antisense introduction of overexpressed HOX genes in ovarian cancer cells. Int J Oncol, 28(4), 931-938.
158
Yang, L., Tsang, K. Y., Tang, H. C., Chan, D., & Cheah, K. S. (2014). Hypertrophic chondrocytes can become osteoblasts and osteocytes in endochondral bone formation. Proc Natl Acad Sci U S A, 111(33), 12097-12102.
Ye, L., Bokobza, S. M., & Jiang, W. G. (2009). Bone morphogenetic proteins in development and progression of breast cancer and therapeutic potential (review). Int J Mol Med, 24(5), 591-597.
Ye, L., Lewis-Russell, J. M., Kyanaston, H. G., & Jiang, W. G. (2007). Bone morphogenetic proteins and their receptor signaling in prostate cancer. Histology and Histopathology, 22(10), 1129-1147.
Yekta, S., Tabin, C. J., & Bartel, D. P. (2008). MicroRNAs in the Hox network: an apparent link to posterior prevalence. Nature Reviews Genetics, 9(10), 789-796.
Yu, X., Li, Z., Shen, J., Wu, W. K., Liang, J., Weng, X., & Qiu, G. (2013). MicroRNA-10b promotes nucleus pulposus cell proliferation through RhoC-Akt pathway by targeting HOXD10 in intervetebral disc degeneration. PLoS One, 8(12), e83080.
Zakany, J., & Duboule, D. (1996). Synpolydactyly in mice with a targeted deficiency in the HoxD complex. Nature, 384(6604), 69-71.
Zakany, J., & Duboule, D. (1999). Hox genes in digit development and evolution. Cell Tissue Res, 296(1), 19-25.
Zakany, J., & Duboule, D. (2007). The role of Hox genes during vertebrate limb development. Curr Opin Genet Dev, 17(4), 359-366.
Zakany, J., Gerard, M., Favier, B., & Duboule, D. (1997). Deletion of a HoxD enhancer induces transcriptional heterochrony leading to transposition of the sacrum. EMBO J, 16(14), 4393-4402.
Zakany, J., Gerard, M., Favier, B., Potter, S. S., & Duboule, D. (1996). Functional equivalence and rescue among group 11 Hox gene products in vertebral patterning. Dev Biol, 176(2), 325-328.
Zakany, J., Kmita, M., & Duboule, D. (2004). A dual role for Hox genes in limb anterior-posterior asymmetry. Science, 304(5677), 1669-1672.
Zeltser, L., Desplan, C., & Heintz, N. (1996). Hoxb-13: a new Hox gene in a distant region of the HOXB cluster maintains colinearity. Development, 122(8), 2475-2484.
Zeng, H., & Xu, X. (2015). RUNX2 RNA interference inhibits the invasion of osteosarcoma. Oncol Lett, 9(6), 2455-2458.
Zha, Y., Ding, E., Yang, L., Mao, L., Wang, X., McCarthy, B. A., Huang, S., & Ding, H. F. (2012). Functional dissection of HOXD cluster genes in regulation of neuroblastoma cell proliferation and differentiation. PLoS One, 7(8), e40728.
Zhai, Y., Kuick, R., Nan, B., Ota, I., Weiss, S. J., Trimble, C. L., Fearon, E. R., & Cho, K. R. (2007). Gene expression analysis of preinvasive and invasive cervical squamous cell carcinomas identifies HOXC10 as a key mediator of invasion. Cancer Res, 67(21), 10163-10172.
REFERENCES
159
Zhang, H., & Bradley, A. (1996). Mice deficient for BMP2 are nonviable and have defects in amnion/chorion and cardiac development. Development, 122(10), 2977-2986.
Zhang, J., Tan, X., Li, W., Wang, Y., Wang, J., Cheng, X., & Yang, X. (2005). Smad4 is required for the normal organization of the cartilage growth plate. Dev Biol, 284(2), 311-322.
Zhang, X., Akech, J., Browne, G., Russell, S., Wixted, J. J., Stein, J. L., Stein, G. S., & Lian, J. B. (2015). Runx2-Smad signaling impacts the progression of tumor-induced bone disease. Int J Cancer, 136(6), 1321-1332.
Zhang, Y. W., Yasui, N., Ito, K., Huang, G., Fujii, M., Hanai, J., Nogami, H., Ochi, T., Miyazono, K., & Ito, Y. (2000). A RUNX2/PEBP2alpha A/CBFA1 mutation displaying impaired transactivation and Smad interaction in cleidocranial dysplasia. Proc Natl Acad Sci U S A, 97(19), 10549-10554.
Zhao, X., Sun, M., Zhao, J., Leyva, J. A., Zhu, H., Yang, W., Zeng, X., Ao, Y., Liu, Q., Liu, G., Lo, W. H., Jabs, E. W., Amzel, L. M., Shan, X., & Zhang, X. (2007). Mutations in HOXD13 underlie syndactyly type V and a novel brachydactyly-syndactyly syndrome. Am J Hum Genet, 80(2), 361-371.
Zhou, X., von der Mark, K., Henry, S., Norton, W., Adams, H., & de Crombrugghe, B. (2014). Chondrocytes Transdifferentiate into Osteoblasts in Endochondral Bone during Development, Postnatal Growth and Fracture Healing in Mice. PLoS Genetics, 10(12), e1004820.
Zohn, I. M., Campbell, S. L., Khosravi-Far, R., Rossman, K. L., & Der, C. J. (1998). Rho family proteins and Ras transformation: the RHOad less traveled gets congested. Oncogene, 17(11 Reviews), 1415-1438.
Zuscik, M. J., Hilton, M. J., Zhang, X., Chen, D., & O'Keefe, R. J. (2008). Regulation of chondrogenesis and chondrocyte differentiation by stress. J Clin Invest, 118(2), 429-438.
PUBLICATION
161
8 Publication
Parts of this doctoral thesis have already been published.
von Heyking K, Roth L, Ertl M, Schmidt O, Calzada-Wack J, Neff F, Lawlor ER,
Burdach S, Richter GH. The posterior HOXD locus: Its contribution to phenotype and
malignancy of Ewing sarcoma. Oncotarget. 2016.
APPENDICES
163
9 Appendices
9.1 List of figures
Figure 1: Structure of HOX genes and proteins. ........................................................... 1
Figure 2: Binding of homeodomain to DNA. ................................................................. 2
Figure 3: HOX complexes of an insect and a mammal in relation to body parts.......... 4
Figure 4: Functional domains of HOXD10, HOXD11 and HOXD13 in limb