WU International Taxation Research Paper Series No. 2017 - 02 International Taxation and the Organizational Form of Foreign Direct Investment Harald Amberger Saskia Kohlhase Editors: Eva Eberhartinger, Michael Lang, Rupert Sausgruber and Martin Zagler (Vienna University of Economics and Business), and Erich Kirchler (University of Vienna) Electronic copy available at: https://ssrn.com/abstract=2929347
Transcript
WU International Taxation Research Paper Series
No. 2017 - 02
International Taxation and the Organizational
Form of Foreign Direct Investment
Harald Amberger
Saskia Kohlhase
Editors:
Eva Eberhartinger, Michael Lang, Rupert Sausgruber and Martin Zagler (Vienna University of
Economics and Business), and Erich Kirchler (University of Vienna)
Electronic copy available at: https://ssrn.com/abstract=2929347
International Taxation and the Organizational Form
describes the MiDi database, our samples, and the research design. Section 4 presents results
for the determinants of organizational form choices while results for their economic
consequences are discussed in Section 5. Section 6 concludes.
2 Institutional Background, Prior Research, and Hypotheses Development
International Taxation and Organizational Forms
We examine investing entities that select an organizational form for a newly
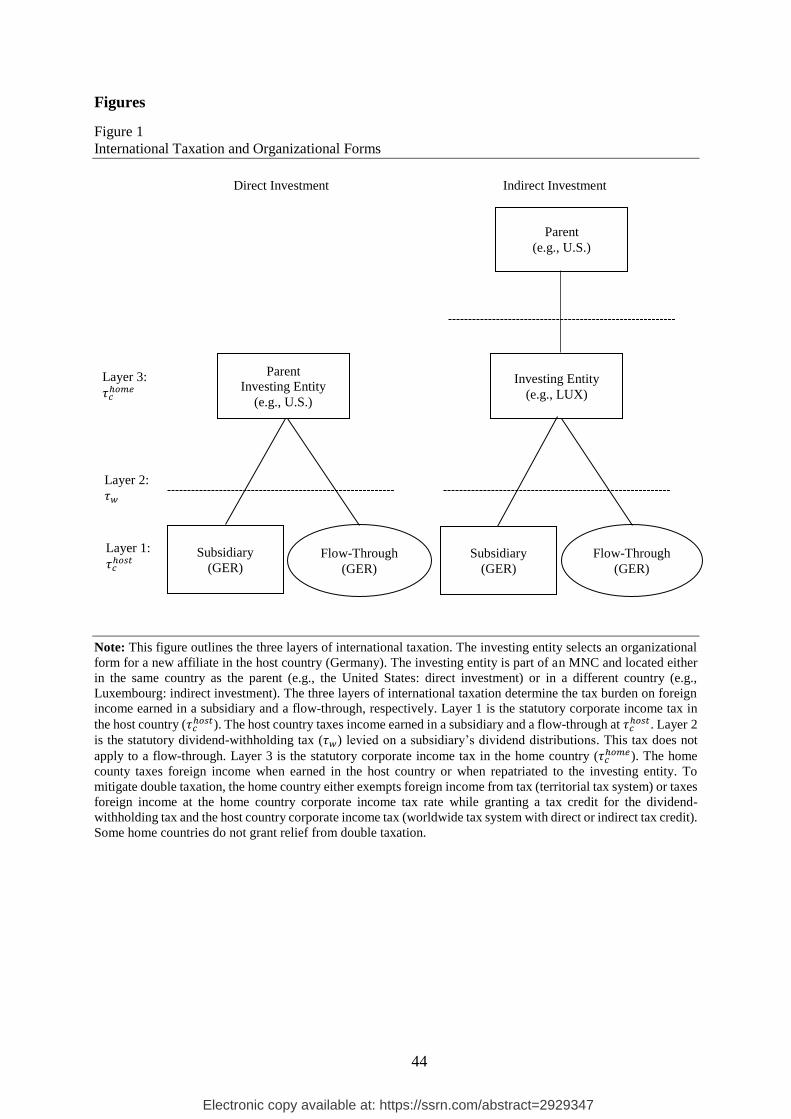
established foreign affiliate. As outlined in Figure 1, the investing entity could be located
either in the same country as the parent of the MNC, which leads to direct investment, or in a
different country, which we classify as indirect investment. We group organizational forms
available to the investing entity into two categories: (i) subsidiaries and (ii) flow-throughs.
Electronic copy available at: https://ssrn.com/abstract=2929347
7
Subsidiaries are legally independent corporate forms while flow-throughs denote non-
corporate forms, such as partnerships or branches, that legally belong to the investing entity.4
Foreign income earned in a subsidiary and in a flow-through is subject to three layers
of international taxation. These layers include (i) the host country corporate income tax, (ii)
the dividend-withholding tax levied on a subsidiary’s dividend distributions, and (iii) the
corporate income tax in the home country of the investing entity (Huizinga et al. 2008,
Huizinga and Voget 2009, Barrios et al. 2012).
If subsidiaries and flow-throughs are taxed differently along one of these dimensions,
the tax burden on foreign income differs between the two organizational forms. Specifically,
a subsidiary leads to a higher tax burden if the investing entity is located in a home country
that exempts foreign income from tax (territorial tax system) or in a home country that does
not relief foreign income from double taxation. This is due to the dividend-withholding tax,
which is not offset by a tax credit in the home country. If the investing entity is located in a
home country that taxes foreign income while granting a tax credit for foreign taxes paid
(worldwide tax system), the extent to which a subsidiary might lead to a higher tax burden
depends on host and home country corporate income tax rates and the tax credit granted. The
dividend-withholding tax is again the main driver of any tax burden difference.5
For each home-country-year, we calculate the tax burden difference between
organizational forms and derive the tax cost of a subsidiary. We take statutory corporate
income tax rates, dividend-withholding tax rates, the home country tax system, and double
tax treaties into account. We provide more details on this approach in Appendix B.
INSERT FIGURE 1 HERE
4 In Appendix C, we provide further background on the organizational forms available to an MNC in Germany. 5 The tax cost of a subsidiary could be negative if the investing entity is located in a home country that operates a
worldwide tax system for flow-throughs and a territorial system for subsidiaries. Most home countries in our
sample operate the same tax system for both organizational forms.
Electronic copy available at: https://ssrn.com/abstract=2929347
8
Prior Research
Determinants and Consequences of Organizational Form Choices
Prior research on determinants of organizational form choices has mainly examined
domestic settings and documents economically small effects of taxes on these decisions.
Gordon and MacKie-Mason (1994), for instance, use macro-level data and find that the non-
tax costs associated with non-corporate forms, such as the lack of capital-market access and
unlimited liability, facilitate incorporation in the trade, service, and manufacturing sector.
MacKie-Mason and Gordon (1997) show that differences in the taxation of organizational
forms affect the allocation of assets and taxable income between the corporate and non-
corporate sector. However, the authors conclude that non-tax determinants tend to dominate
the organizational form choices in their sample.
Firm-level analyses of small businesses provide more nuanced results. Ayers et al.
(1996) show that non-tax determinants, such as business risk and financing requirements,
dominate organizational form choices of small firms. Taxes, in contrast, affect the choice
between organizational forms with similar non-tax costs and benefits, such as S and C
corporations. In analyzing 1992 census data from the retail sector, Goolsbee (2004) finds a
relatively large tax effect, which is driven by low non-tax costs of operating through a non-
corporate form in this sector. For closely-held firms, Romanov (2006) and Edmark and
Gordon (2013) show that high personal income tax rates provide an incentive for high-income
individuals to shift income into corporate forms.
Evidence for taxes as a determinant of organizational form choices for large firms or
MNCs is rare because the non-tax costs of operating through a non-corporate form (e.g., the
lack of capital-market access) seem prohibitively high for these firms (Ayers et al. 1996). The
effect of taxes is limited to specific incentives that outweigh non-tax costs in narrow settings.
For instance, Hodder et al. (2003) show that the opportunity to avoid dividend taxes and
alternative minimum taxes increases a bank’s probability of converting from a taxable C-
Electronic copy available at: https://ssrn.com/abstract=2929347
9
corporation to a non-taxable S-corporation. Similarly, simulation results in Goolsbee and
Maydew (2002) suggest that real estate investment trusts (REITs), which avoid dividend taxes
on real estate income, offer tax savings that are concentrated in a small number of industries.
While prior research has frequently studied the determinants of organizational form
choices, evidence for the consequences of these decisions is limited. In a cross-country study,
Demirguc-Kunt et al. (2006) find similar firm-level growth for corporate and non-corporate
forms. However, in countries with high-quality financial and legal institutions, corporate
forms grow faster due to capital-market access and lower financing frictions. The tax benefits
associated with an organizational form could also influence subsequent economic decisions.
Donohoe, Lisowsky, and Mayberry (2018) study the choice of U.S. banks to convert from a
C-corporation to a tax-favored S-corporation. To improve their competitive position, banks
invest tax savings into advertising spending and higher deposit rates. Utke (2019) examines
equity carve-outs into Master Limited Partnerships (MLPs) and finds that tax-sensitive
shareholders increase their ownership stake in the more lightly taxed MLP, whereas tax-
exempt shareholders invest more heavily in the tax-disadvantaged parent firm.
Taxes and Group Structures of MNCs
Cross-border economic activities of MNCs involve group structures with affiliates in
several countries (ICIJ 2014). Prior research suggests that taxes might shape specific elements
of these structures. Dyreng et al. (2015), for instance, examine locational choices for U.S.-
owned foreign subsidiaries and find that MNCs strategically select a host country to minimize
the withholding tax on dividend distributions. Similarly, Lewellen and Robinson (2013)
examine internal ownership chains of U.S. MNCs and show that several tax factors, such as
double tax treaties, controlled-foreign corporation rules, and capital gains taxes, determine the
location of a subsidiary and the choice between direct and indirect ownership chains. In a
purely domestic setting, Petroni and Shackelford (1995) show that multi-state U.S. insurers
choose between a subsidiary and a licensing agreement for their cross-state expansion in order
Electronic copy available at: https://ssrn.com/abstract=2929347
10
to jointly optimize state taxes and regulatory costs. Buettner, Riedel, and Runkel (2011) study
the local business tax in Germany and find that income-shifting opportunities incentivize
multi-jurisdictional firms to retain separate taxation of their subsidiaries rather than opting for
tax consolidation. In a European setting, Oestreicher and Koch (2012) find that the dividend-
withholding tax reduces the likelihood of establishing vertical group structures.
Hypotheses Development
When establishing a new affiliate, the investing entity selects the organizational form
with the best cost-benefit relation (MacKie-Mason and Gordon 1997, Goolsbee 1998, 2004,
Luna and Murray 2010). In a cross-border setting, the dividend-withholding tax only applies
to dividend distributions of a subsidiary while a flow-through is not subject to this tax. Thus,
the dividend-withholding is the main tax cost (benefit) of a subsidiary (flow-through).6 In
addition, if the investing entity is located in a country with a worldwide tax system, an MNC
might offset tax losses incurred in a foreign flow-through with taxable income of the investing
entity. Such a cross-border loss offset is typically not available for foreign subsidiaries.7
Compared to a standalone or domestic firm, an MNC might weigh non-tax costs and
benefits of organizational forms differently. For a standalone firm, preventing access to the
capital market is a major non-tax cost associated with a flow-through (Ayers et al. 1996). This
factor is less relevant for an MNC because it could raise capital globally and finance foreign
affiliates through the internal capital market (Desai, Foley, and Hines 2004). In contrast,
differences in the liability exposure of the investing entity are relevant in a cross-border
context because claims from creditors, employees, and customers against the new affiliate can
expose the investing entity and the MNC to risk. A subsidiary offers the non-tax benefit of
6 The statutory dividend-withholding tax is an upper bound for the tax cost of a subsidiary as is might be reduced
by a tax credit under a worldwide tax system or by the deferral of the repatriation of foreign income (Foley,
Hartzell, Titman, and Twite 2007, Blouin and Krull 2009). 7 Only a limited number of countries (e.g., Austria, Denmark, France, Italy, etc.) offer a cross-border loss offset
for subsidiaries.
Electronic copy available at: https://ssrn.com/abstract=2929347
11
limited liability that protects the MNC against claims (Gordon and MacKie-Mason 1994),
which limits the loss potential to the equity stake in the affiliate (Ayers et al. 1996).8
Aside from limited liability, several other non-tax determinants might affect
organizational form choices in a cross-border setting. For instance, the transfer of ownership
in a subsidiary is less costly as its shares can be easily transferred. Transferring ownership in a
flow-through, in contrast, requires a transfer of assets or the re-negotiation of the partnership
agreement (Ayers et al. 1996). Conversely, a subsidiary implies higher compliance costs due
to stricter regulatory and financial reporting requirements and higher coordination costs due to
the separation of ownership and control (Goolsbee and Maydew 2002).
When establishing a new affiliate, the investing entity determines these tax and non-
tax costs and benefits and selects the organizational form with the best cost-benefit relation
(Luna and Murray 2010). As a higher tax cost of selecting a subsidiary raises the tax benefit
of a flow-through, we expect the probability of establishing a flow-through to increase
accordingly. Based on these arguments, we formulate the following baseline hypothesis:
Hypothesis 1: The tax cost of a subsidiary is positively associated with the probability of
establishing a flow-through.
The relation under H1 assumes that an MNC repatriates foreign income via dividend
distributions that are subject to international taxation. An MNC, however, might limit the
extent to which income is exposed to international taxation and therefore mitigate the tax cost
of a subsidiary by shifting income to a low-tax country (Hines and Rice 1994, Dyreng and
Markle 2016).9 Since income shifting reduces the tax cost of a subsidiary, we expect an MNC
with income-shifting opportunities to be less sensitive to tax burden differences between
organizational forms. These arguments suggest the following cross-sectional hypothesis:
8 For instance, an MNC requires EUR 25,000 to establish a GmbH in Germany. Thus, in the absence of intra-firm
comfort letters, the potential loss of the investing entity is limited to this amount. 9 Common strategies exploit discretion in setting intra-firm transfer prices (Klassen and Laplante 2012), cost-
sharing arrangements (De Simone and Sansing 2019), and tax-deductible intra-firm interest or royalty payments.
Electronic copy available at: https://ssrn.com/abstract=2929347
12
Hypothesis 2: The association between the tax cost of a subsidiary and the probability of
establishing a flow-through is weaker for MNCs with income-shifting
opportunities.
With respect to non-tax determinants, the risk profile of the industry in which the new
affiliate operates can alter the cost-benefit relation of organizational forms. Capital-intensive
industries, such as manufacturing or wholesale, involve high industry-specific risk that raises
the likelihood of losses for the investing entity and the MNC. As the non-tax benefit of
limited liability is valuable in these industries (Liu 2014), we expect the tax burden difference
to be a less important. Thus, we formulate the following cross-sectional hypothesis:
Hypothesis 3a: The association between the tax cost of a subsidiary and the probability of
establishing a flow-through is weaker for new affiliates subject to high
industry-specific risk.
An MNC that engages in FDI is subject to several sets of regulation. Low regulatory
quality in the parent home country, such the inability of the government to implement and
maintain stable regulation, could pose significant risk to cross-border investments (Dikova,
Sahib, and van Witteloostuijn 2010). While establishing a legally independent subsidiary
prevents risk associated with low regulatory quality from spilling over to the new affiliate, a
flow-through legally belongs to the investing entity and low regulatory quality could directly
impact the new affiliate and its business. As a subsidiary shields cross-border investment from
risk associated with low regulatory quality, we expect the investing entity to be less sensitive
to the tax burden difference. This leads to the following cross-sectional hypothesis:
Hypothesis 3b: The association between the tax cost of a subsidiary and the probability of
establishing a flow-through is weaker for MNCs located in countries with
low regulatory quality.
Establishing a new affiliate can coincide with a market entry in the host country. An
MNC that enters a foreign market for the first time has to collect information about tax-
Electronic copy available at: https://ssrn.com/abstract=2929347
13
efficient group structures (Feller and Schanz 2017), evaluate local market conditions, and take
strategic decisions, such as how to finance the market entry or how much to invest in the host
country. In contrast, an MNC with prior experience in the host country may be able to devote
greater effort in establishing tax-efficient group structures. Thus, we expect an investing
entity with prior host-country experience to be more sensitive to the tax burden difference.
Based on these arguments, we state the following cross-sectional hypothesis:
Hypothesis 3c: The association between the tax cost of a subsidiary and the probability of
establishing a flow-through is stronger for MNCs with prior host-country
experience.
Since a subsidiary and a flow-through differ along several dimensions, the chosen
organizational form could have economic consequences for the new affiliate (Demirguc-Kunt
et al. 2006). For instance, greater liability exposure associated with a flow-through might
reduce an MNCs propensity to take on risk (John, Litov, and Yeung 2008, Acharya, Amihud,
and Litov 2011) and alter the investment behavior of the new affiliate (Coles, Daniel, and
Naveen 2006). As the non-tax costs of unlimited liability increase with the size of the new
affiliate, the MNC has weaker incentives to undertake large and risky investments. At the
same time, a low-risk investment strategy is likely to result in lower profitability and requires
a less complex group structure in the FDI host country. Based on these arguments, we
formulate the following hypothesis:
Hypothesis 4: Establishing a foreign affiliate as a flow-through is negatively associated
with i) risk-taking, ii) investment, iii) profitability, and iv) the complexity of
the group structure in the FDI host country.
Electronic copy available at: https://ssrn.com/abstract=2929347
14
3 Data and Research Design
MiDi Database and Supplementary Data Sources
We use the MiDi database of the Deutsche Bundesbank as our primary data source.10
The MiDi database is a below firm-level dataset that provides anonymized micro-level data on
the stock of in- and outbound FDI relations in Germany starting in the year 1999.11 According
to the German Foreign Trade and Payments Regulation (Außenwirtschaftsverordnung), an
inbound FDI relation has to be reported to the Deutsche Bundesbank if an investing entity
holds at least 10 percent of the shares or voting rights of a subsidiary or a partnership located
in Germany with a balance sheet total of more than EUR 3 million. A German branch or a
permanent establishment held by an investing entity also has to be reported if the business
assets amount to EUR 3 million and more (Lipponer 2011, Schild and Walter 2017).
Data for the German affiliate includes an identifier, industry affiliation, annual balance
sheet positions, and annual turnover, after-tax profit, and the number of employees.12 The key
advantage of the MiDi database is that we can identify the organizational form of the affiliate.
This information is either limited or unavailable in conventional data sources, such as Orbis or
Compustat. Being an FDI database, the dataset also provides the percentage of shares held by
the investing entity and the share of asset and liability positions of the affiliate attributable to
the investing entity or other affiliates of the MNC. This includes information on intra-firm
debt provided to the affiliate. The main drawbacks of the MiDi database are the lack of
income statement information and that data on the investing entity and the parent is limited to
an identifier for the investing entity and the respective home countries. We are thus unable to
conduct in-depth analysis on the parent and affiliates outside of Germany.
10 DOI: 10.12757/Bbk.MiDi.9913.01.01. 11 Penalties and data appraisal techniques ensure high data quality (Lipponer 2011, Schild and Walter 2017) 12 Aside from a numeric identifier, the MiDi Database does not include any identifying information for the German
affiliate. The firm name of the affiliate is not recorded in the database.
Electronic copy available at: https://ssrn.com/abstract=2929347
15
Although the MiDi database limits our analysis to Germany, several arguments
suggest that Germany is a powerful setting to examine organizational form choices of MNCs.
First, Germany has an extensive double tax treaty network that provides variation in the tax
burden difference between organizational forms based on the home country of the investing
entity. Since all organizational form choices in our sample are subject to the identical host
country regulation, we exploit variation in tax costs and benefits while keeping non-tax
characteristics of organizational forms constant. Second, since most existing tax systems are
based on common principles, the tax effects of international taxation apply to a large number
of country combinations (Huizinga et al. 2008, Huizinga and Voget 2009, Barrios et al. 2012).
Third, Germany is a G7 country where MNCs tend to invest for economic reasons, leading to
a long-term presence in the host country. Fourth, in contrast to studies using domestic settings
(e.g., Petroni and Shackelford 1995), our cross-border approach allows us to test whether
country-level differences moderate the effect of taxes on organizational form choices.
We supplement data from the MiDi database with dividend-withholding tax rates,
home and host country corporate income tax rates, and information on the home country tax
system. We collect this data from corporate tax guides (e.g., Ernst & Young 2005-2013). Data
for control variables stems from several sources, including the World Bank’s regulatory
quality indicators database (World Bank 2005-2013) and Thomson Reuter’s Datastream.
Sample Selection
Sample I: Organizational Form Choice Sample
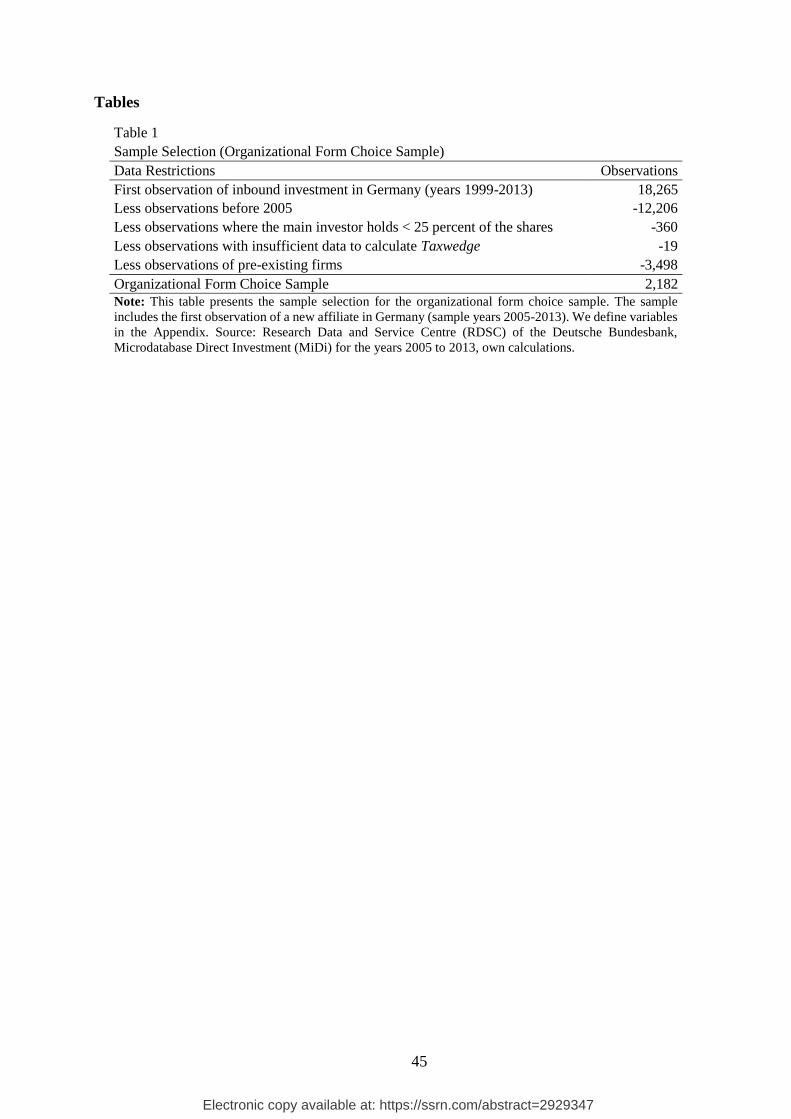
To obtain a sample of organizational form choices, we identify the first observation of
an inbound FDI relation in Germany between 1999 and 2013 (18,265 observations). First, we
drop observations prior to the year 2005 as information to differentiate newly established
from pre-existing affiliates is unavailable prior to 2005 (12,206 observations). Second, we
drop observations where the investing entity holds less than 25 percent of the shares of the
new affiliate (360 observations). Strategic decisions under German corporate law require the
Electronic copy available at: https://ssrn.com/abstract=2929347
16
(1)
consent of more than 75 percent of the shareholders. The 25 percent threshold ensures that the
investing entity may influence the organizational form choice for the new affiliate.13 Third,
we drop observations without sufficient tax information (19 observations). Lastly, we exclude
observations of pre-existing affiliates where the first observation in the database results from
overshooting the reporting threshold (3,498 observations). For the years 2005 to 2013, these
restrictions yield 2,182 organizational form choices. Table 1 summarizes the sample selection.
INSERT TABLE 1 HERE
Sample II: Economic Consequences Sample
To study the economic consequences of organizational form choices, we extend our
organizational form choice sample to any observation available for a new affiliate in the MiDi
database. Starting with the year of the organizational form choice, we obtain 6,798 affiliate-
year observations for the years 2005 to 2013. The sample size varies across our empirical tests
because some of the regression variables require several years of prior data.
Research Design
Determinants of Organizational Form Choices
To model organizational form choices and to test H1, we estimate the following
Depvar is a set of dependent variables, which includes RiskTaking, Investment, Roa,
and Complexity, all measured in year t. We follow Langenmayr and Lester (2018) and
compute RiskTaking as the industry-year adjusted standard deviation of affiliate i’s return on
assets (Roa) over the three-year period t to t+2. Investment, our proxy for annual investment
of affiliate i, is calculated as the change in fixed and intangible assets from year t-1 to t and
divided by lagged total assets. Roa is net profit over total assets and captures the profitability
of affiliate i. Complexity, our proxy for the complexity of the group structure in the FDI host
country, is the natural logarithm of the number of affiliates held by affiliate i in Germany.
In line with Equation (1), Flow-Through, our main variable of interest, is an indicator
variable with the value of one (zero) if affiliate i was established a flow-through (subsidiary).
We expect negative coefficients for Flow-Through in all tests, consistent with establishing
affiliate i as a flow-through being negatively associated with risk-taking, investment,
profitability, and the complexity of the group structure.
We follow prior research on risk-taking and investment (Cummins, Hassett, and
Hubbard 1996, Baker, Stein, and Wurgler 2003, Langenmayr and Lester 2018) and include a
set of control variables (Vector X). To control for differences in size, the presence of losses,
and the availability of internal funds, we add LN(Employ), LN(Assets), LossYear, Leverage,
and Roa from Equation (1). To control for investment opportunities, we include PE-Ratio as
Electronic copy available at: https://ssrn.com/abstract=2929347
20
the mean price-to-earnings (PE) ratio of publicly listed firms operating in the same industry as
affiliate i.16 In addition, we add LN(Sales) as the natural logarithm of sales, Investment as the
annual change in fixed and intangible assets over lagged total assets, Cash as cash over total
assets, and Age as year t less the year affiliate i was established. We lag LN(Employ),
LN(Assets), Leverage, Roa, LN(Sales), Investment, and Cash by one year as the value of these
variables in year t-1 is likely to be associated with Depvar in year t. We include year and
industry-fixed effects and again cluster standard errors at the investing-entity level.
4 Results for Determinants of Organizational Form Choices
Descriptive Statistics
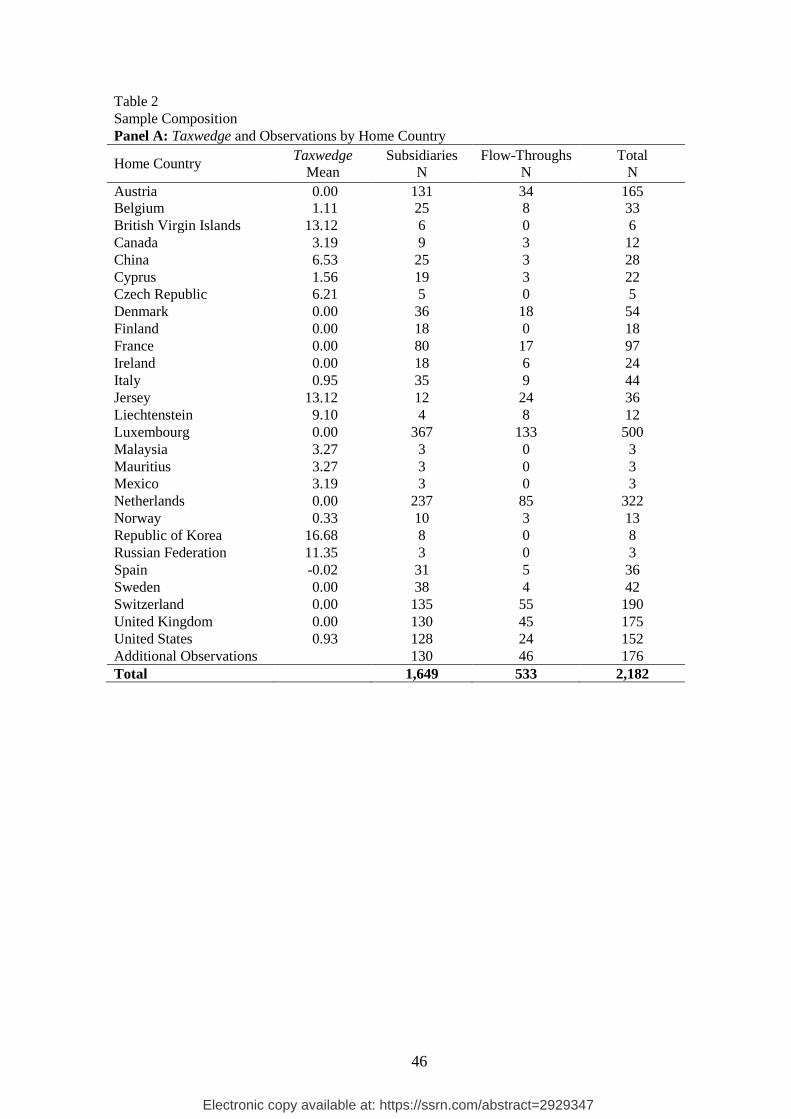
Investing entities in our sample are located in 59 home countries, which account for
more than 99 percent of all inbound FDI relations recorded in the MiDi database. For each
home-country-year, we compute the tax cost of a subsidiary (see Appendix B). Table 2, Panel
A suggests that Taxwedge varies across home countries.17 Taxwedge is zero for most EU
countries because the Parent-Subsidiary-Directive abolished the withholding tax on dividend
distributions within the EU. In contrast, Taxwedge is high for tax havens, such as the British
Virgin Islands or Jersey, because Germany has not signed double tax treaties with these
countries. Thus, the dividend-withholding becomes a final burden on a subsidiary’s dividend
distributions. Taxwedge also varies over time. In total, we record 83 changes in Taxwedge (45
increases and 38 decreases). 62 changes occur around a 2008 tax reform in Germany, which
reduced the corporate income tax rate and the dividend-withholding tax rate. The remaining
changes spread across our sample period and stem from changes in home country corporate
income tax rates, home country tax systems, or dividend-withholding tax rates.
16 We obtain monthly PE-ratios for publicly listed firms in Germany from Datastream. We calculate annual
industry-level PE-ratios based on one digit ICB-codes by taking the median. For further details and recent two
applications of this measure, see Shroff, Verdi, and Yu (2014) and Amberger, Markle, and Samuel (2019). 17 In line with Deutsche Bundesbank’s confidentiality rules, we present home countries with a minimum of three
observations per organizational form that result from three distinct investing entities. Our sample includes another
32 home countries that do not fulfill this confidentiality requirement.
Electronic copy available at: https://ssrn.com/abstract=2929347
21
Organizational form choices in our sample include 1,649 subsidiaries and 533 flow-
throughs. The unconditional probability of establishing a flow-through is 24.43 percent
(533/2,182). We observe the highest number of new affiliates for investing entities from
neighboring countries (e.g., Luxembourg, the Netherlands, Switzerland, and Austria) and
from major economies (e.g., the United States and the United Kingdom). Consistent with
variation in Taxwedge, we observe differences in the relative importance of organizational
forms. Despite a Taxwedge of zero, investing entities from neighboring countries establish
flow-throughs. This is the result of low geographical distance diminishing coordination costs
and similarities in legal systems reducing risk associated with unlimited liability. Both aspects
reduce the non-tax costs of a flow-through and increase its relative attractiveness.
Panel B presents organizational form choices by sample year. The number of new
affiliates increases in sample years 2005-2007 and again after the year 2010. The number of
new affiliates decreases between 2008 and 2010, which is likely the result of the global
financial crisis. The relative importance of flow-throughs varies over time and increases in
sample years 2007-2009 and again in the years 2011-2013. Panel C presents organizational
form choices by industry.18 We observe the highest number of new affiliates in the financial
services industry, and the lowest in the transportation industry. The relative importance of
flow-throughs is highest in the energy supply and construction industries, and lowest in the
wholesale, information and communication, and manufacturing industries. These differences
suggest that industry characteristics affect organizational form choices.
INSERT TABLE 2 HERE
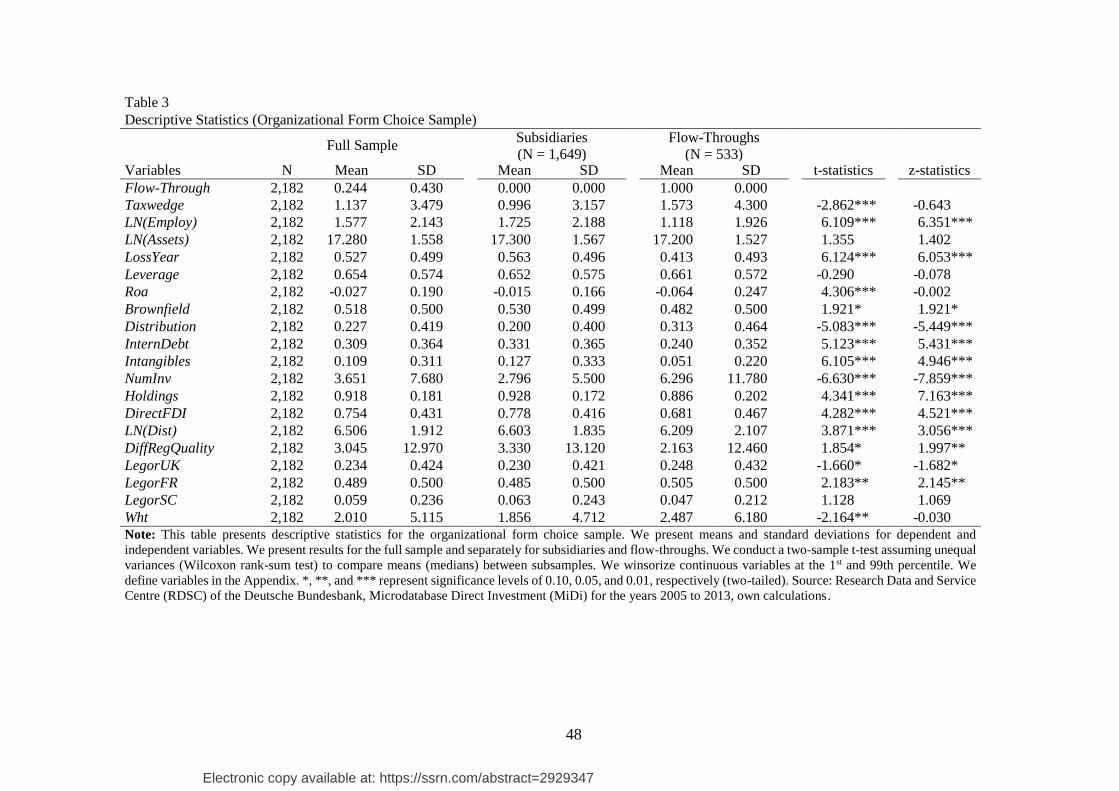
Table 3 shows descriptive statistics for the full sample and separately for subsidiaries
and flow-throughs. We conduct t-tests (Wilcoxon rank-sum tests) to assess differences in
means (medians) between subsamples. The mean of Taxwedge is significantly larger for flow-
18 We aggregate observations based on one-digit NACE Rev. 2 codes to ensure a meaningful analysis.
Electronic copy available at: https://ssrn.com/abstract=2929347
22
throughs (t-statistic -2.86), consistent with investing entities being sensitive to tax burden
differences in organizational form choices. The difference in medians is insignificant (z-
statistic -0.64) because 80.9 percent of the new affiliates report a Taxwedge of zero.19 The
differences in means and medians for remaining variables are in line with our expectations.
INSERT TABLE 3 HERE
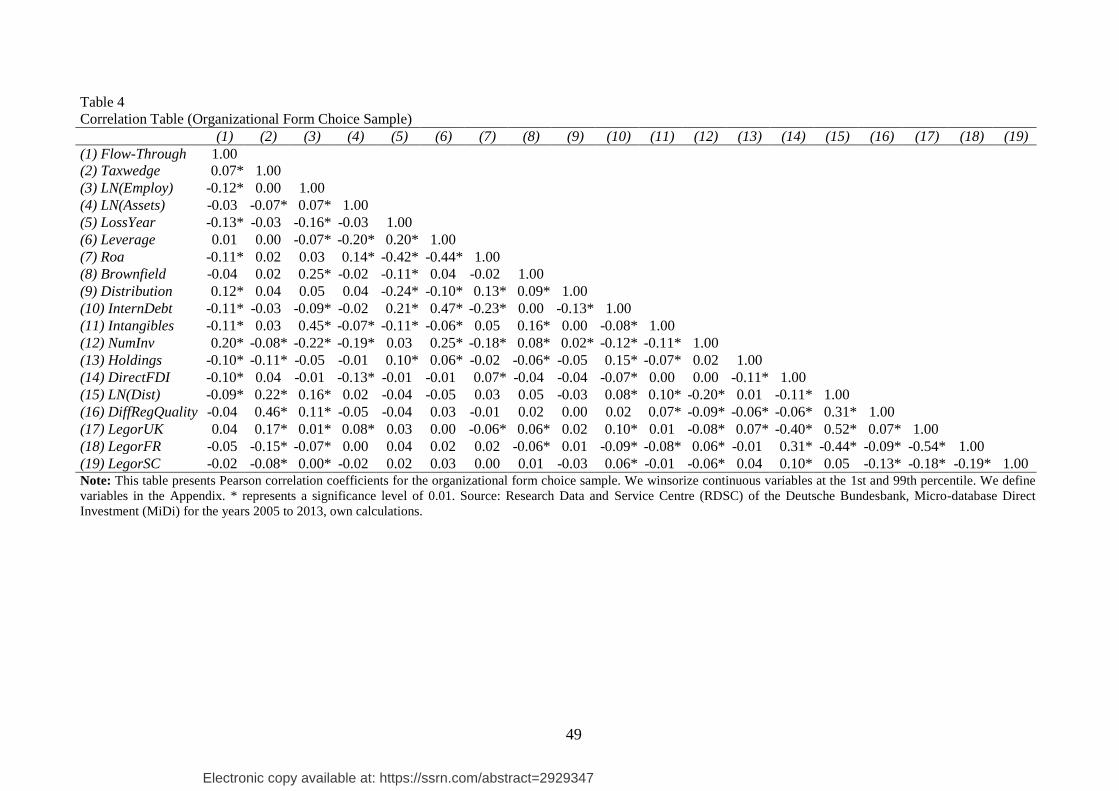
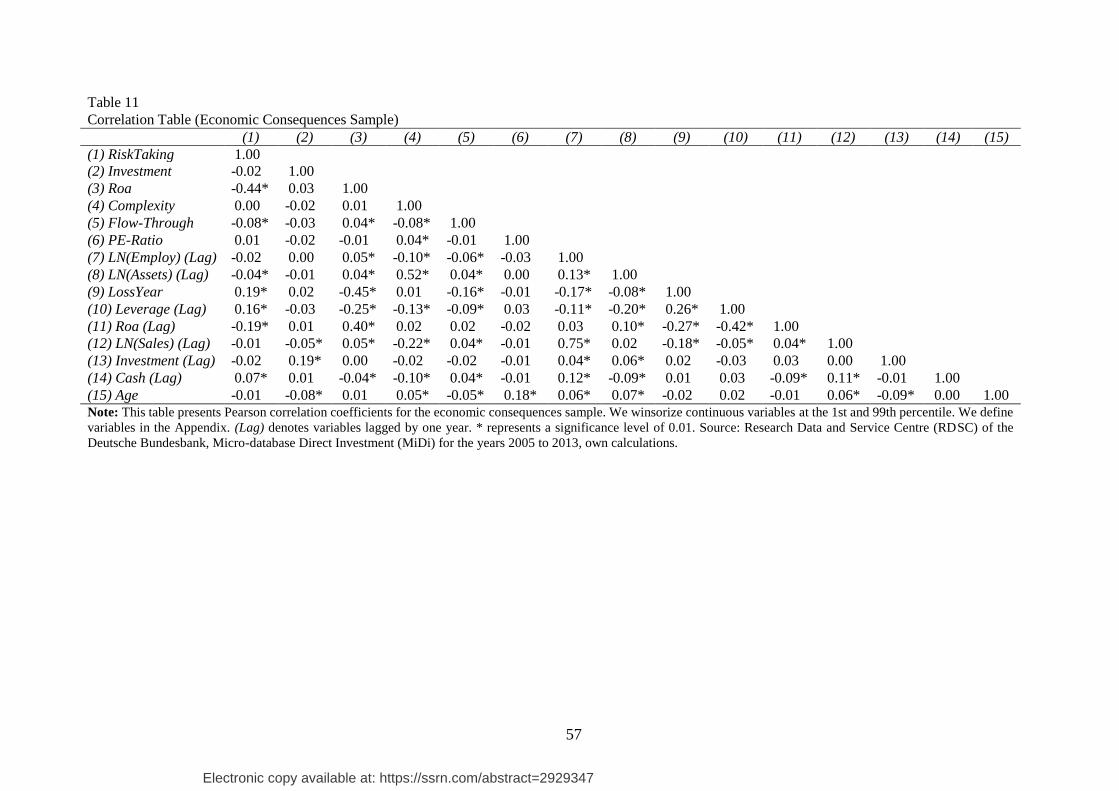
Table 4 presents Pearson coefficients for univariate correlations between our
dependent and independent variables. In line with the descriptive statistics, the correlation
between Taxwedge and Flow-Through is positive and significant (p < 0.01). Thus, the tax cost
of a subsidiary is positively associated with the probability of establishing a flow-through,
which is consistent with H1. Correlations between the remaining variables are generally
consistent with the descriptive statistics.
INSERT TABLE 4 HERE
Tests of H1: Tax Burden Difference and Organizational Form Choices
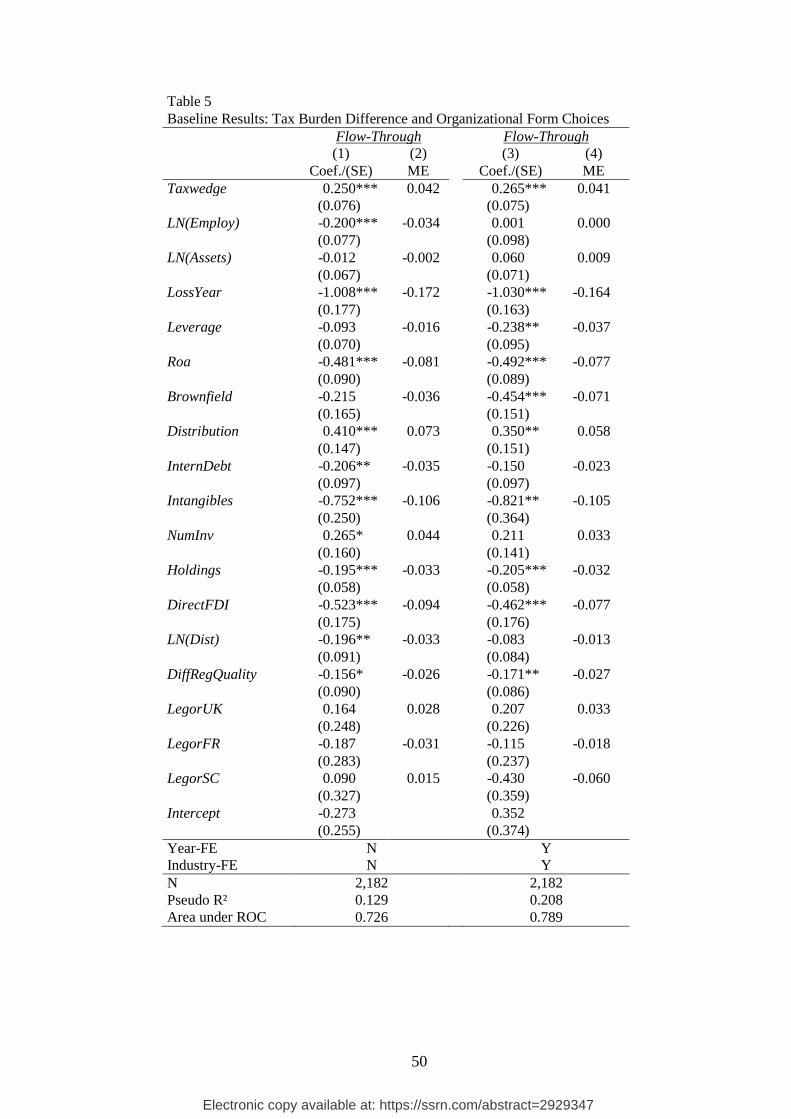
To test H1, we estimate Equation (1) on the organizational form choice sample and
present results in Table 5.20 In column 1, we exclude year and industry-fixed effects while we
estimate the full model in column 3. As predicted, coefficients on Taxwedge are positive and
significant in both columns (p < 0.01). This result suggests that the probability of establishing
a flow-through is positively associated with the tax cost of a subsidiary. Results for control
variables are generally as expected.21 For instance, the probability of establishing a flow-
through is negatively associated with affiliate size (LN(Employ) and losses (LossYear) and
19 The share of observations with a Taxwedge of zero implies a similar central tendency of Taxwedge in both
subsamples, which renders the difference in medians insignificant. In Table 9, we drop observations with a
Taxwedge of zero and obtain results consistent with our baseline findings. We keep these observations in our
primary sample because they provide information on non-tax determinants of organizational form choices. 20 To facilitate a meaningful interpretation, we standardize independent variables to have a mean of zero and a
standard deviation of one prior to estimating regressions. 21 Given the extensive set of control variables, we calculate variance inflation factor scores (VIFs). For the model
in column 3, the maximum VIF for our independent variables is 2.61 (Intangibles). Among year and industry-
fixed effects, the maximum VIF is 3.62 (“Manufacturing” industry), which alleviates multicollinearity concerns.
Electronic copy available at: https://ssrn.com/abstract=2929347
23
positively associated with profit distributions (Distribution) and the number of FDI relations
held by the investing entity (NumInv).
The area under the receiver operating characteristic (ROC) curve suggests that our
regression models exhibit reasonable predictive power (Hosmer, Lemeshow, and Sturdivant
2013). For instance, the regression in column 3 predicts the correct organizational form for
78.9 percent of the observations our sample. Comparing the area under the ROC curve for the
regressions in columns 1 and 3, we note that year and industry-fixed effects significantly
increase the predictive power of the regression model (χ² = 42.82, p < 0.01). This indicates
that the tax and non-tax determinants captured in our regression model as well as year and
industry characteristics explain organizational form choices in our sample.
To gauge the economic significance of our results, we report marginal effects for the
independent variables. In column 4, a one standard deviation increase in Taxwedge (i.e. by
3.48 percentage points) is associated with a 4.1 percentage point higher probability of
establishing a flow-through. In comparison, a one standard deviation increase in Leverage
(Roa) is associated with a 3.7 (7.7) percentage point lower probability of establishing a flow-
through.22 In addition, a likelihood ratio test suggests that adding Taxwedge as an independent
variable significantly improves the fit of our regression model (χ² = 18.20, p < 0.01).
Taken together, these results support H1: The probability of establishing a flow-
through is positively associated with the tax cost of a subsidiary. The tax burden difference
between organizational forms is an economically important determinant of the organizational
form an MNC selects for a new affiliate. In fact, the marginal effect of Taxwedge is similar to
continuous non-tax determinants.
INSERT TABLE 5 HERE
22 When calculating marginal effects for year and industry-fixed effects (untabulated), we find that the marginal
effect of a specific industry (except for the industry “Energy Supply”) or a specific year is similar to the marginal
effect of categorical non-tax determinants (e.g., LossYear, Brownfield, DirectFDI). Thus, the variables in our
regression model capture economically important determinants of organizational form choices.
Electronic copy available at: https://ssrn.com/abstract=2929347
24
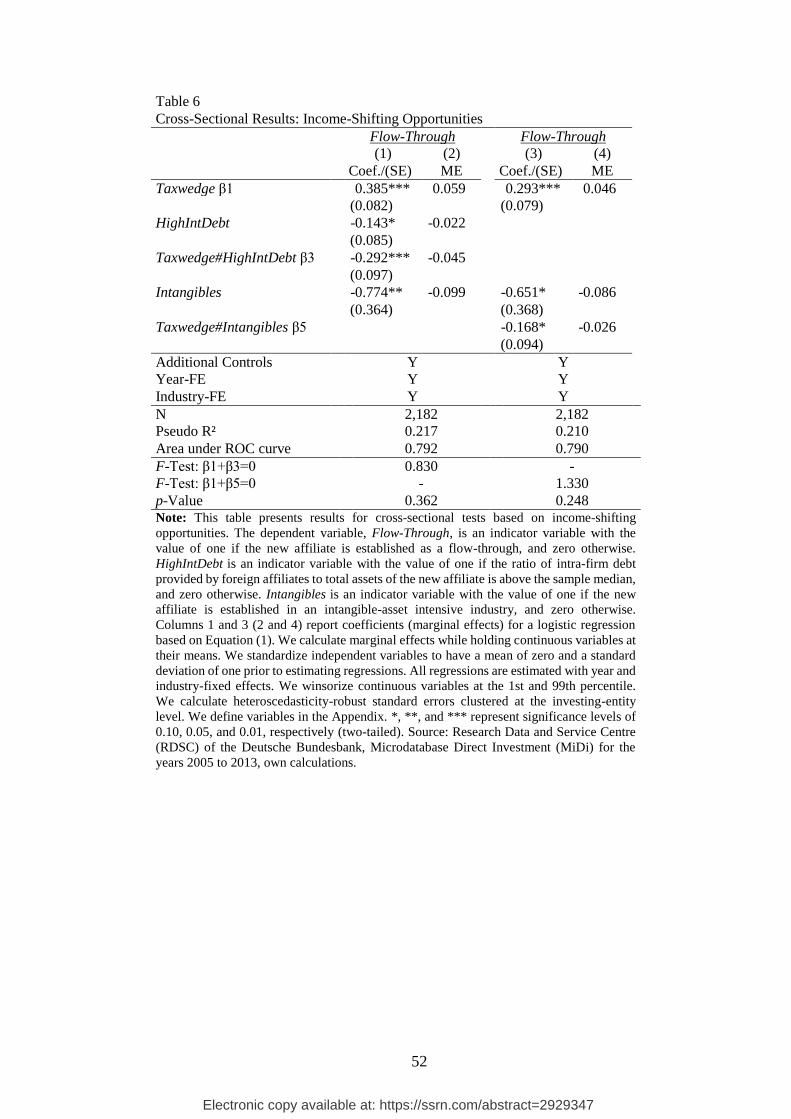
Tests of H2: Income-Shifting Opportunities
H2 predicts that the tax burden difference is less relevant for organizational form
choices of MNCs with income-shifting opportunities. To test this, we modify Equation (1)
and present results in Table 6. In column 1, we interact Taxwedge with HighIntDebt, which is
an indicator variable with the value of one if intra-firm debt provided to the new affiliate by
foreign affiliates is above the sample median. Intra-firm interest payments allow an MNC to
repatriate foreign income without triggering the dividend-withholding tax and we expect a
lower tax sensitivity for a new affiliate with high intra-firm debt. Consistent with this
expectation, the coefficient on Taxwedge#HighIntDebt is negative and significant (p < 0.01).
An F-test suggests that the joint effect of Taxwedge and HighIntDebt on Flow-Through
(β1+β3) is indistinguishable from zero (p = 0.36). In column 2, we interact Taxwedge with
Intangibles to proxy for income shifting via intra-firm royalty payments on intangible assets.
In line with the previous test, we expect and find a negative and significant coefficient on
Taxwedge#Intangibles (column 3, p = 0.07). An F-test suggests that the joint effect of
Taxwedge and Intangibles (β1+β5) is again indistinguishable from zero (p = 0.25).
Taken together, these results support H2: The tax cost of a subsidiary is less important
for organizational form choices of MNCs with income-shifting opportunities. Repatriation
strategies that reduce the extent to which income is e
xposed to international taxation moderate the tax sensitivity of investing entities and
dampen the effect tax burden differences between subsidiaries and flow-throughs on
organizational form choices.
INSERT TABLE 6 HERE
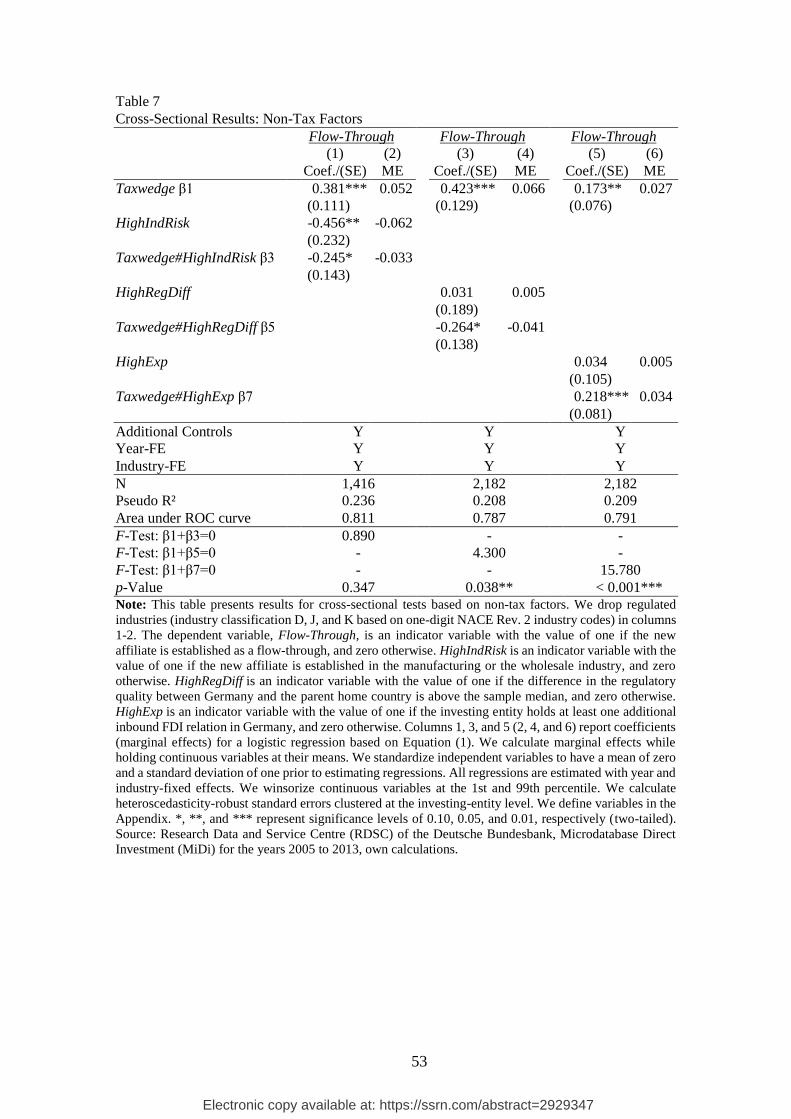
Tests of H3a, H3b, and H3c: Non-Tax Factors
H3a-c predict that non-tax factors moderate the tax sensitivity of investing entities. To
test this, we modify Equation (1) and present results in Table 7. In column 1, we test H3a and
Electronic copy available at: https://ssrn.com/abstract=2929347
25
interact Taxwedge with HighIndRisk, which is an indicator variable with the value of one if
the new affiliate is established in the manufacturing or wholesale industry. As a subsidiary’s
non-tax benefit of limited liability is valuable in these capital-intensive industries, we expect
Taxwedge to be less relevant. Supporting this prediction, the coefficient on
Taxwedge#HighIndRisk is negative and significant (p = 0.09).23 An F-test indicates that the
joint effect of Taxwedge and HighIndRisk (β1+β3) is indistinguishable from zero (p = 0.35).
These results suggest that the tax burden difference is less relevant for organizational form
choices in industries with high industry-specific risk.
In column 3, we test H3b and interact Taxwedge with HighRegDiff, which is an
indicator variable with the value of one if the difference in regulatory quality between
Germany and the parent home country is above the sample median. A legally independent
subsidiary shields cross-border investment from risk associated with low regulatory quality in
the parent home country and we expect the tax cost of a subsidiary to becomes less relevant in
an organizational form choice. Consistent with this prediction, we find a negative and
significant coefficient on Taxwedge#HighRegDiff (p = 0.06). An F-test suggests that the joint
effect of Taxwedge and HighRegDiff (β1+β5) is different from zero (p = 0.04). This suggests
that low regulatory quality in the parent home county reduces the relevance of Taxwedge.
In column 5, we test H3c and interact Taxwedge with HighExp, which is an indicator
variable with the value of one if the investing entity reports at least one additional inbound
FDI relation in Germany at the time it establishes the new affiliate. An MNC with prior host-
country experience has greater knowledge of tax-efficient group structures and is more
familiar with local market conditions, increasing the importance of tax costs and benefits of
23 Depreciation is an alternative explanation for this result. The investing entity might be less sensitive to Taxwedge
if depreciation diminishes the taxable income of the new affiliate. To examine this, we interact Taxwedge with an
indicator variable taking the value of one if the ratio of fixed and intangible assets to total assets of the new affiliate
is above the sample median. Supporting an explanation based on industry-specific risk, we find a positive and
significant coefficient on the interaction (p < 0.01). This result is also in line with fewer income-shifting
opportunities and mirrors our findings for intangible-asset intensive industries in Table 6.
Electronic copy available at: https://ssrn.com/abstract=2929347
26
organizational forms. In line with this expectation, the coefficient on Taxwedge#HighExp is
positive and significant (p < 0.01).24 These results suggest that host-country experience
increases the relevance of Taxwedge as a determinant of organizational form choices.
Taken together, these results support H3a to H3c: Non-tax factors moderate the
relation between the tax burden difference and organizational form choices. Results for
industry-specific risk and differences in regulatory quality suggest that MNCs highly value
non-tax benefits of limited liability and legal independence associated. Thus, in settings where
these non-tax benefits are important, MNCs might weakly respond to tax-law changes in their
organizational form choices.
INSERT TABLE 7 HERE
Difference-in-Differences Analysis: 2008 Tax Reform in Germany
To rule out that correlated omitted variables might drive our results, we examine a
2008 tax reform in Germany that provided a plausibly exogenous shock to the tax cost of a
subsidiary. The reform was enacted in August 2007 and implemented in two steps. First and
effective from January 1, 2008, the corporate income tax rate, including the local business tax,
was reduced by 9 percentage points (OECD 2019). In a second step, the dividend-withholding
tax was reduced by 10.6 percentage points, effective from January 1, 2009. While the lower
corporate income tax rate led to an increase in Taxwedge, this effect was more than offset by
the reduction in the dividend-withholding tax. For investing entities from countries affected
by the reform, these changes led to a net decrease in Taxwedge. In contrast, the reform did not
change the tax cost of a subsidiary for countries with a Taxwedge of zero prior to the reform.
We exploit these features in a difference-in-differences (DiD) research design. To this
end, we add Reform and Post to Equation (1). Reform is an indicator variable with the value
of one if the investing entity is located in a country for which Taxwedge changed through the
24 An F-test suggests that the joint effect of Taxwedge and HighExp (β1+β7) is larger than zero (p < 0.01).
Electronic copy available at: https://ssrn.com/abstract=2929347
27
reform (treatment observations), and zero if Taxwedge equals zero in the entire sample period
(control observations). Post is an indicator variable with the value of one for organizational
form choices after the reform (i.e. 2008 or later). We interact Reform with Post to assess
whether the reform altered the probability of establishing a flow-through for treatment
observations relative to investing entities located in countries that were not affected by the
reform. Since the reform lead to a decrease in Taxwedge, we expect a negative coefficient on
Reform#Post, consistent with a lower probability of establishing a flow-through after the
reform. We present this analysis as supplementary because every new affiliate contributes
only one observation to our sample. Thus, rather than tracking affiliates over time, we test
whether the reform altered the probability of establishing a new affiliate as a flow-through.
We present results in Table 8. In column 1, coefficients on Reform and Post are
positive and significant (all p < 0.01). These results suggest that the probability of establishing
a flow-through is generally higher for investing entities located in countries affected by the
reform and for observations in the post-reform period. Importantly, we find a negative and
significant coefficient on Reform#Post (p = 0.06). This result indicates that, relative to the
control observations, the probability of establishing a flow-through in the post-reform period
is lower for investing entities located in a country affected by the reform.
In column 2, we replace Post with year indicators to assess whether treatment and
control observations exhibit similar pre-reform trends in the probability of establishing a
flow-through. Using 2007 as a reference year, we find insignificant coefficients on
Reform#Year2005 and Reform#Year2006 (all p < 0.26). These results indicate that the
probability of establishing a flow-through does not differ between treatment and control
observations prior to the reform, providing support for parallel pre-reform trends. Coefficients
on the remaining interactions are negative and significant starting in 2010. Thus, the tax
reform affected organizational form choices from 2010 onwards, which seems reasonable
given the staggered implementation of the reform.
Electronic copy available at: https://ssrn.com/abstract=2929347
28
Overall, the results in this section suggest that a reduction in Taxwedge lowered the
probability of establishing a new affiliate as a flow-through. We therefore conclude that the
tax cost of a subsidiary has a likely causal effect on organizational form choices of MNCs.
INSERT TABLE 8 HERE
Robustness Tests
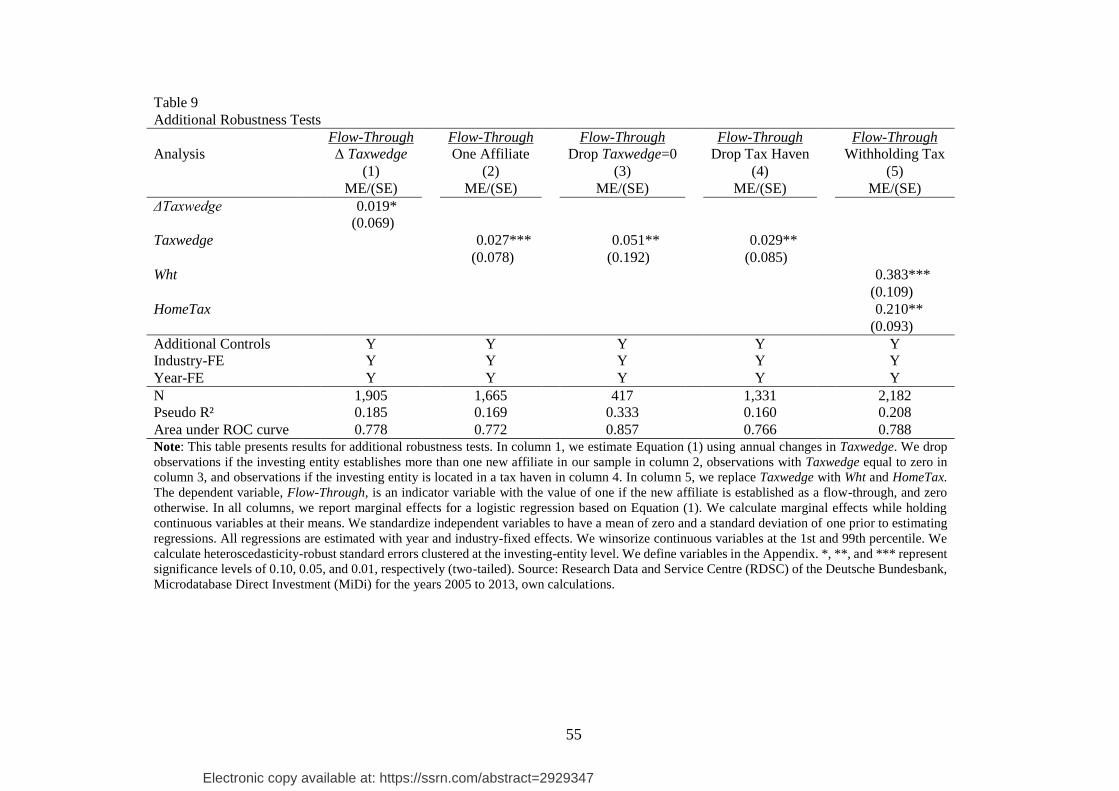
To provide additional evidence for the robustness of our findings, we conduct a battery
of sensitivity tests and report results in Table 9. First, we re-estimate Equation (1) with annual
changes in Taxwedge. Specifically, we apply ΔTaxwedge, which is Taxwedge in year t+1 less
Taxwedge in year t. In column 1, the coefficient on ΔTaxwedge is positive and significant
(p = 0.07). In line with the results in the previous section, this test further alleviates concerns
that omitted variables might drive our baseline findings.
To assess whether large MNCs and their investing entities drive our results, we drop
observations of investing entities that establish more than one affiliate in our sample.
Although reducing the sample to 1,655 observations, the coefficient on Taxwedge in column 2
remains positive and significant (p = 0.01). The marginal effect of Taxwedge is similar to the
baseline estimate in column 4 of Table 5. Thus, large MNCs and investing entities with one
affiliate exhibit a similar sensitivity to tax burden differences in organizational form choices.
Next, we drop observations with a Taxwedge of zero (column 3) and observations of
investing entities located in a tax haven (column 4).25 Corroborating our baseline results,
coefficients on Taxwedge are positive and significant in both columns (p = 0.05). The
marginal effect in column 3 is slightly larger than our baseline estimate. These results
alleviate concerns that observations with a Taxwedge of zero might affect our results and that
our findings might not generalize beyond investing entities located in tax havens.
25 From the home countries in Panel A of Table 2, we drop observations of investing entities located in the British
Virgin Islands, Cyprus, Jersey, Liechtenstein, Luxembourg, Mauritius, and Switzerland (see Gravelle 2009).
Electronic copy available at: https://ssrn.com/abstract=2929347
29
In column 5, we separately include the two components of Taxwedge: (i) the dividend-
withholding tax (Wht) and (ii) the corporate income tax levied or the tax credit granted in the
home country of the investing entity (HomeTax). We find positive and significant coefficients
for components (p = 0.02). These results suggest that the tax sensitivity of an MNC is not
limited to the dividend-withholding tax. Investing entity consider the tax treatment of foreign
income in the home country when selecting an organizational form for a new affiliate.26
INSERT TABLE 9 HERE
5 Results for Economic Consequences of Organizational Form Choices
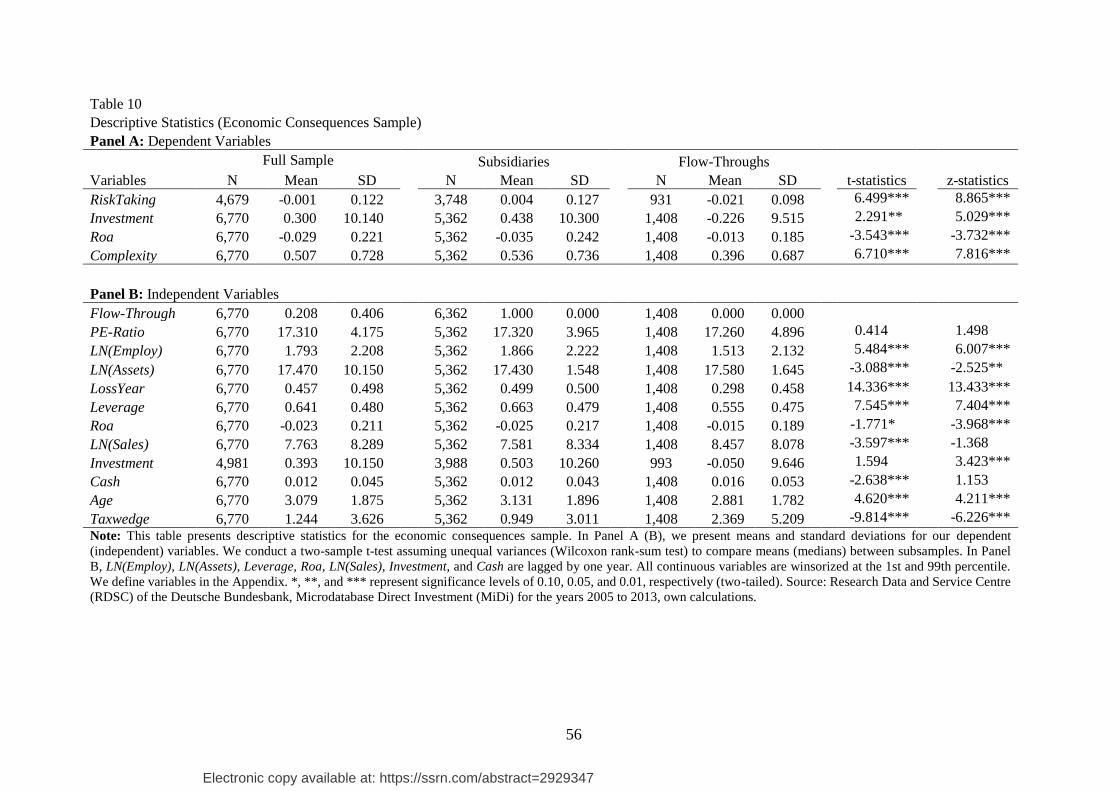
Descriptive Statistics
In Table 10, we report descriptive statistics for the economic consequences sample and
present results for tests of differences in means and medians between subsidiaries and flow-
throughs. Recall that this sample includes any observation available for a new affiliate in the
MiDi database for the sample period 2005 to 2013. As expected and in line with H4, a new
affiliate established as a flow-through exhibits lower risk raking (RiskTaking, p < 0.01), lower
investment (Investment, p = 0.01), and a lower profitability (Roa, p < 0.01) than a new
affiliate established as a subsidiary. In addition, a flow-through holds fewer affiliates in
Germany (Complexity, p <0.01), which is consistent with a less complex group structure.
INSERT TABLE 10 HERE
In Table 11, we report Pearson coefficients for univariate correlations between our
dependent and independent variables. Flow-Through exhibits a negative correlation with three
out of four dependent variables (RiskTaking, Roa, and Complexity), which is significant at the
one-percent level. The correlation between Flow-Through and Investment is negative but
26 In additional tests (untabulated), we drop observations if the new affiliate is established in a regulated industry
and observations if the parent is located in a tax haven (Gravelle 2009). We continue to find positive and significant
coefficients on Taxwedge in both tests, which further supports the robustness of our results.
Electronic copy available at: https://ssrn.com/abstract=2929347
30
insignificant (p = 0.03). These correlations are in line with the descriptive statistics in
Table 10 and generally consistent with our expectations.
INSERT TABLE 11 HERE
Tests of H4: Economic Consequences of Organizational Form Choices
Testing H4 and examining the economic consequences of organizational form choices
raises endogeneity concerns, because self-selection into a subsidiary or a flow-through based
on tax and non-tax costs and benefits of organizational forms could bias inferences from
Equation (2). To address this concern, we follow Leuz and Verrecchia (2000) and re-estimate
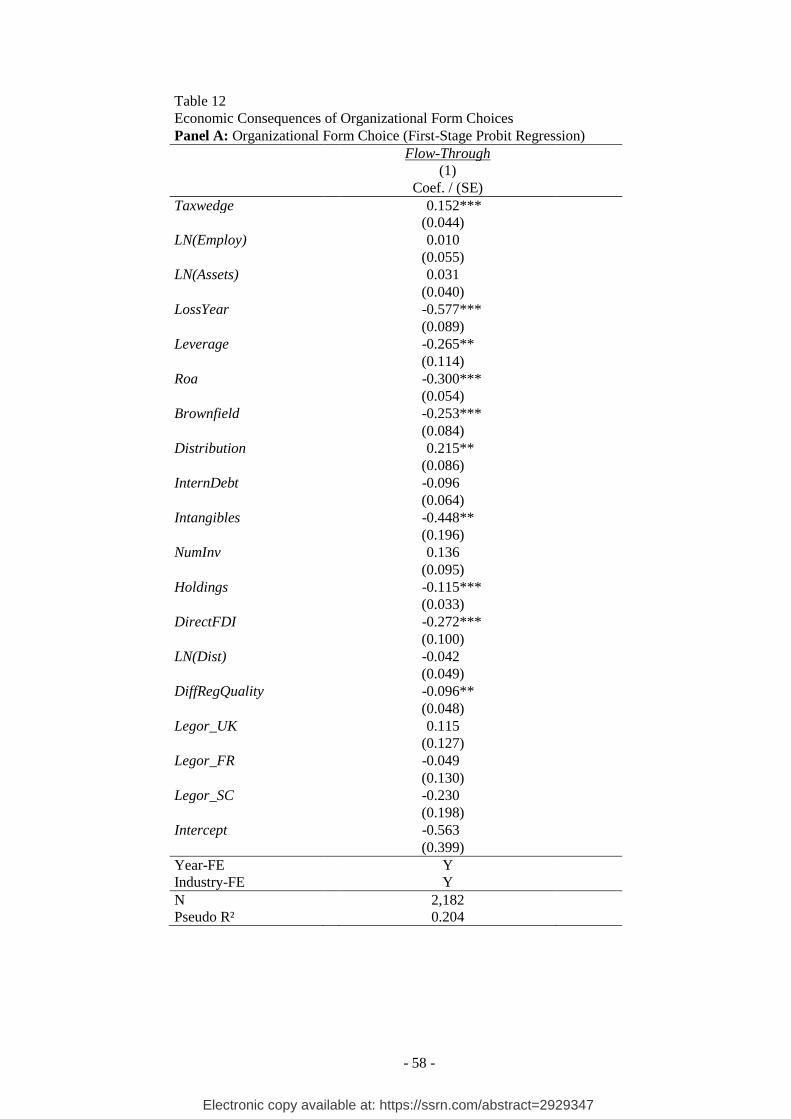
Equation (1) on the organizational form choice sample using a probit regression. Results in
Table 12, Panel A are very similar to our baseline findings. From this first-stage regression,
we calculate the inverse mills ratio and include this measure as an additional control variable
in second-stage regressions based on Equation (2).27
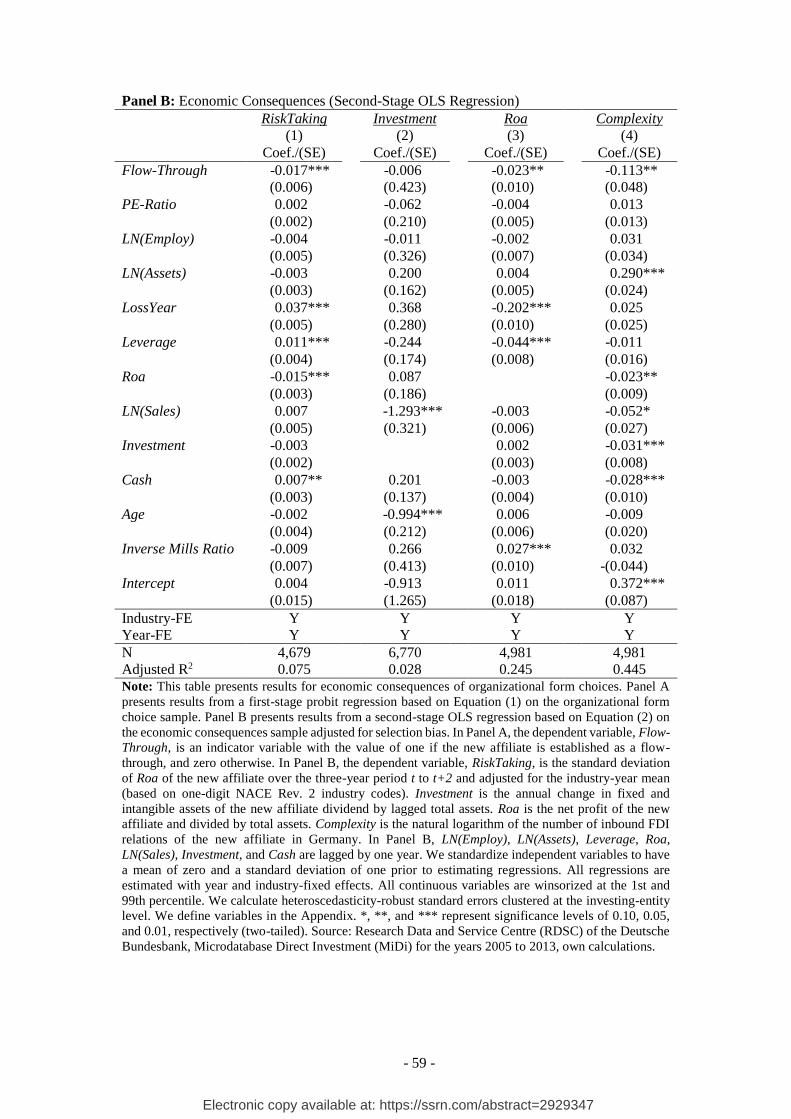
Panel B presents results from estimating Equation (2) for all dependent variables. As
predicted, Flow-Through is negatively associated with RiskTaking (p < 0.01), Roa (p = 0.01),
and Complexity (p = 0.02). For Investment, the coefficient on Flow-Through is negative but
insignificant (p = 0.81).28 These results support H4: Compared to a subsidiary, a new affiliate
established as a flow-through takes on less risk, is less profitable, and is associated with a less
complex group structure. Thus, the organizational form selected for cross-border investment
could have economic consequences for the MNC and the new affiliate.
INSERT TABLE 12 HERE
27 To obtain reliable estimates, this approach requires a variable that fulfills the exclusion restriction, i.e. a variable
that affects the dependent variable in the second-stage regression only through the organizational form choice
modelled in the first stage. We believe that Taxwedge fulfills this requirement in our setting because this variable
captures the tax burden difference between organizational forms. This tax burden difference should not be directly
associated with risk-taking, investment, profitability, or group-structure complexity. In fact, we find insignificant
coefficients when including Taxwedge in Equation (2) (untabulated). 28 The inverse mills ratio is insignificant in three out of four regressions, which suggests that our results do not
seriously suffer from endogeneity concerns.
Electronic copy available at: https://ssrn.com/abstract=2929347
31
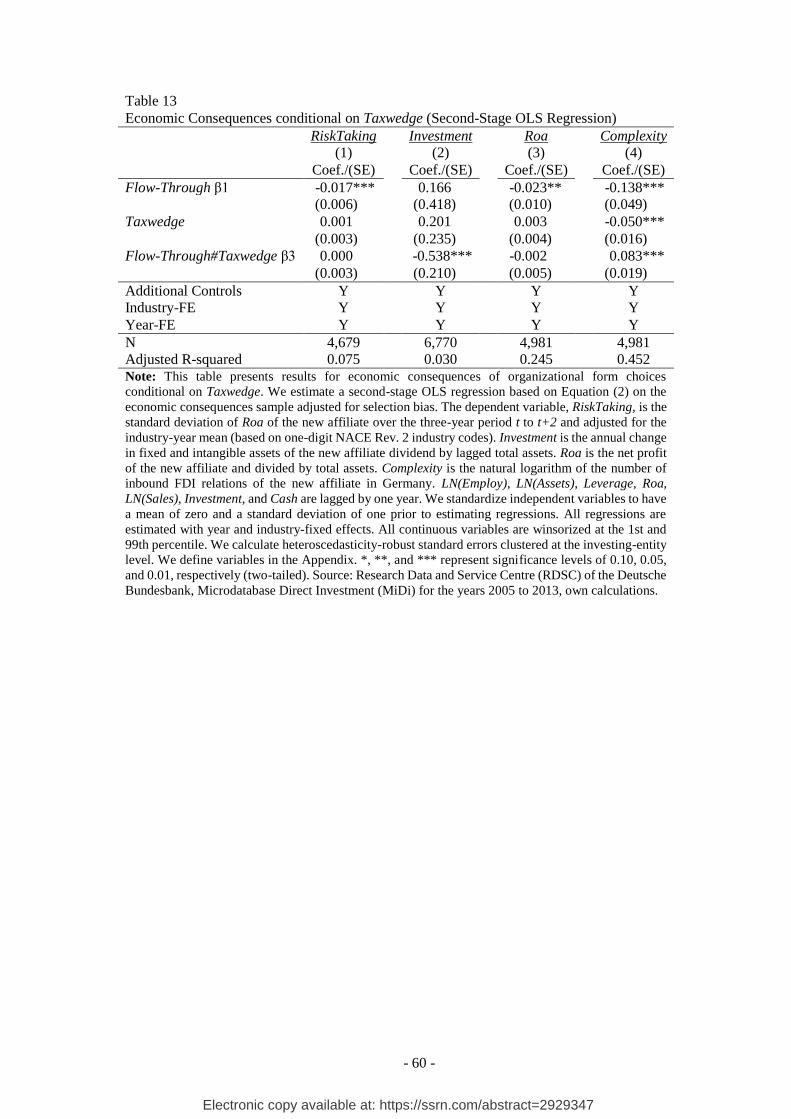
In Table 13, we test whether choosing an organizational form to exploit a tax benefit
has distinct consequences for the new affiliate. To this end, we interact Flow-Through with
Taxwedge in the year the new affiliate was established. Results for the main effect of Flow-
Through are similar to Table 12. However, the coefficient on Flow-Through#Taxwedge is
negative and significant for Investment (p = 0.02) and positive and significant for Complexity
(p < 0.01). These results suggest that selecting a flow-through because of a tax benefit is
associated with lower investment and a more complex group structure. MNCs tend to
establish a flow-through at the first layer of their group structure to reap a tax benefit while
spreading risk associated with unlimited liability across affiliates held by the flow-through.
INSERT TABLE 13 HERE
6 Conclusion
We examine the association between international taxation and organizational form
choices of MNCs. Analyzing micro-level data on inbound FDI relations in Germany, we
document that the tax burden difference between subsidiaries and flow-throughs is an
economically important determinant of these decisions. This effect, which is comparable in
magnitude to non-tax determinants, is weaker for MNCs with income-shifting opportunities
and for organizational form choices subject to high industry-specific risk and large country-
level differences in regulatory quality. Investing entities with prior host-country experience
are more sensitive to the tax burden difference. We also exploit a 2008 tax reform in Germany
and find that a reduction in the tax cost of a subsidiary lowered the probability of establishing
a new affiliate as a flow-through, providing support for a causal interpretation of our findings.
We also shed light on the economic consequences of organizational form choices. Our
results suggest that, compared to a subsidiary, a new affiliate established as a flow-through
takes on less risk, is less profitable, and is associated with a less complex group structure. In
Electronic copy available at: https://ssrn.com/abstract=2929347
32
addition, we find that selecting a flow-through because of a tax benefit is associated with
lower investment and a more complex group structure.
Our findings offer several insights for researchers and policy makers interested in
group structures of MNCs and the design of targeted tax rules for organizational forms. First,
we add to studies on the determinants of organizational form choices. While prior research
shows that non-tax factors tend to dominate organizational form choices in domestic settings,
our findings suggest that taxes are an important determinant for MNCs. Thus, MNCs might
respond more strongly to tax-law changes in their organizational form choices than domestic
or standalone firms. Second, we extend research on group structures of MNCs by showing
that international taxation is associated with the organizational form of foreign affiliates.
Host-country tax rules might not only attract cross-border investment but also shape its
organizational form. Third, we show that organizational form choices and differences in the
taxation of organizational forms could have economic consequences and that the legal form
selected for FDI might indicate differences in risk-taking or investment within MNCs.
Electronic copy available at: https://ssrn.com/abstract=2929347
33
References
Acharya, V. V., Y. Amihud, and L. Libov. (2011). Creditor rights and corporate risk-taking.
Journal of Financial Economics, 102(1), 150–166.
Amberger, H. J., K. S. Markle, and D. M. P. Samuel. (2019). Repatriation Taxes, Internal
Agency Conflicts, and Subsidiary-level Investment Efficiency. Working Paper,
Dartmouth College, University of Iowa, and University of Wisconsin.
Armstrong, C. S., W. R. Guay, and J. P. Weber. (2010). The role of information and financial
reporting in corporate governance and debt contracting. Journal of Accounting and
Economics, 50(2–3), 179–234.
Ayers, B. C., C. B. Cloyd, and J. R. Robinson. (1996). Organizational Form and Taxes: An
Empirical Analysis of Small Businesses. The Journal of the American Taxation
Association, 18(1), 49–67.
Baker, M., J. C. Stein, and J. Wurgler. (2003). When Does the Market Matter? Stock Prices
and the Investment of Equity-Dependent Firms. The Quarterly Journal of
Economics, 118(3), 969–1005.
Barrios, S., H. P. Huizinga, L. Laeven, and G. Nicodème. (2012). International taxation and
multinational firm location decisions. Journal of Public Economics, 96(11), 946–
958.
Blouin, J., and L. Krull. (2009). Bringing It Home: A Study of the Incentives Surrounding the
Repatriation of Foreign Earnings Under the American Jobs Creation Act of 2004.
Journal of Accounting Research, 47(4), 1027–1059.
Buettner, T., N. Riedel, and M. Runkel. (2011). Strategic consolidation under formula
apportionment. National Tax Journal, 64(2), 225–254.
Cerutti, E., G. Dell’Ariccia, and M. S. Martinez Peria. (2007). How banks go abroad:
Branches or subsidiaries? Journal of Banking and Finance, 31(6), 1169–1192.
Coles, D., N. D. Daniel, and L. Naveen. (2006). Managerial incentives and risk-taking.
Journal of Financial Economics, 79(2), 431–468.
Cummins, J. G., K. A. Hassett, and R. G. Hubbard. (1996). Tax reforms and investment: A
cross-country comparison. Journal of Public Economics, 62(1–2), 237–273.
Demirguc-Kunt, A., I. Love, and V. Maksimovic. (2006). Business environment and the
incorporation decision. Journal of Banking and Finance, 30(11), 2967–2993.
Desai, M. A., C. F. Foley, and J. H. Hines Jr. (2001). Repatriation Taxes and Dividend
Distortions. National Tax Journal, 54(4), 829–851.
Desai, M. A., C. F. Foley, and J. H. Hines Jr. (2004). A Multinational Perspective on Capital
Structure Choice and Internal Capital Markets. The Journal of Finance, 59(6), 2451–
2487.
De Simone, L., and R. Sansing. (2019). Income Shifting Using a Cost Sharing Arrangement.
Journal of the American Taxation Association, 41(1), 123-136.
Dikova, D., P. R. Sahib, and A. van Witteloostuijn. (2010). Cross-border acquisition
abandonment and completion: The effect of institutional differences and
organizational learning in the international business service industry, 1981-2001.
Journal of International Business Studies, 41(2), 223–245.
Electronic copy available at: https://ssrn.com/abstract=2929347
34
Donohoe, M. P., P. Lisowsky, and M. A. Mayberry. (2019). The Effects of Competition from
S Corporations on the Organizational Form Choice of Rival C Corporations.
Contemporary Accounting Research, forthcoming.
Dyreng, S. D., B. P. Lindsey, K. S. Markle, and D. A. Shackelford. (2015). The effect of tax
and non tax country characteristics on the global equity supply chains of US
multinationals. Journal of Accounting and Economics, 59(2), 182–202.
Dyreng, S. D., and K. S. Markle. (2016). The Effect of Financial Constraints on Tax-
Motivated Income Shifting by U.S. Multinationals. The Accounting Review, 91(6),
1601–1627.
Dyreng, S. D., M. Jacob, X. Jiang, and M. A. Mueller. (2019). Tax Incidence and Tax
Avoidance. Working Paper, Duke University and WHU.
Edmark, K., and R. H. Gordon. (2013). The choice of organizational form by closely-held
firms in Sweden: tax versus non-tax determinants. Industrial and Corporate Change,
22(1), 219–243.
Ernst & Young. (2005-2013). Worldwide Corporate Tax Guide 2005-2013. Ernst & Young.
Feller, A., and D. Schanz. (2017). The Three Hurdles of Tax Planning: How Business
Context, Aims of Tax Planning, and Tax Manager Power Affect Tax Expense.
Contemporary Accounting Research, 34(1), 494–524.
Foley, C. F., J. Hartzell, S. Titman, and G. Twite. (2007). Why do firms hold so much cash?
A tax-based explanation. Journal of Financial Economics, 86(3), 579–607.
Gleditsch, K. S. (2013). Distance between Capital Cities. Essex: Gleditsch.
Goolsbee, A. (1998). Taxes, organizational form, and the deadweight loss of the corporate
income tax. Journal of Public Economics, 69(1), 143–152.
Goolsbee, A., and E. L. Maydew. (2002). Taxes and organizational form: The case of REIT
spin-offs. National Tax Journal, 55(3), 441–456.
Goolsbee, A. (2004). The impact of the corporate income tax: evidence from state
organizational form data. Journal of Public Economics, 88(11), 2283–2299.
Gordon, R. H., and J. K. MacKie-Mason. (1994). Tax distortions to the choice of
organizational form. Journal of Public Economics, 55(2), 279–306.
Gravelle, J. T. (2009). Tax Havens: International Tax Avoidance and Evasion. National Tax
Journal, 62(4), 727–753.
Hall, B., C. Helmers, M. Rogers, and V. Sena. (2014). The Choice between Formal and
Informal Intellectual Property: A Review. Journal of Economic Literature, 52(2),
375–423.
Hanlon, M., and S. Heitzman. (2010). A review of tax research. Journal of Accounting and
Economics, 50(2–3), 127–178.
Hines Jr, J. H., and E. Rice. (1994). Fiscal Paradise: Foreign Tax Havens and American
Business. Quarterly Journal of Economics, 109(1), 149–182.
Hodder, L., M. L. McAnally, and C. D. Weaver. (2003). The influence of tax and nontax
factors on banks’ choice of organizational form. The Accounting Review, 78(1), 297–
325.
Electronic copy available at: https://ssrn.com/abstract=2929347
35
Hosmer, D. W., S. Lemeshow, and R. X. Sturdivant. (2013). Applied Logistic Regression, 3rd
Edition. Hoboken, NJ: John Wiley & Sons, Inc.
Huizinga, H. P., L. Laeven, and G. Nicodème. (2008). Capital structure and international debt
shifting. Journal of Financial Economics, 88(1), 80–118.
Huizinga, H. P., and J. Voget. (2009). International taxation and the direction and volume of
cross-border M&As. The Journal of Finance, 64(3), 1217–1249.
ICIJ. (2014). Leaked Documents Expose Global Companies’ Secret Tax Deals in
World Bank. (2005-2013). The Worldwide Governance Indicators (WGI) Project.
Washington: The World Bank Group.
World Bank. (2018). Foreign Direct Investment, Net Inflows (BoP, current US$).
Washington: The World Bank Group.
Electronic copy available at: https://ssrn.com/abstract=2929347
37
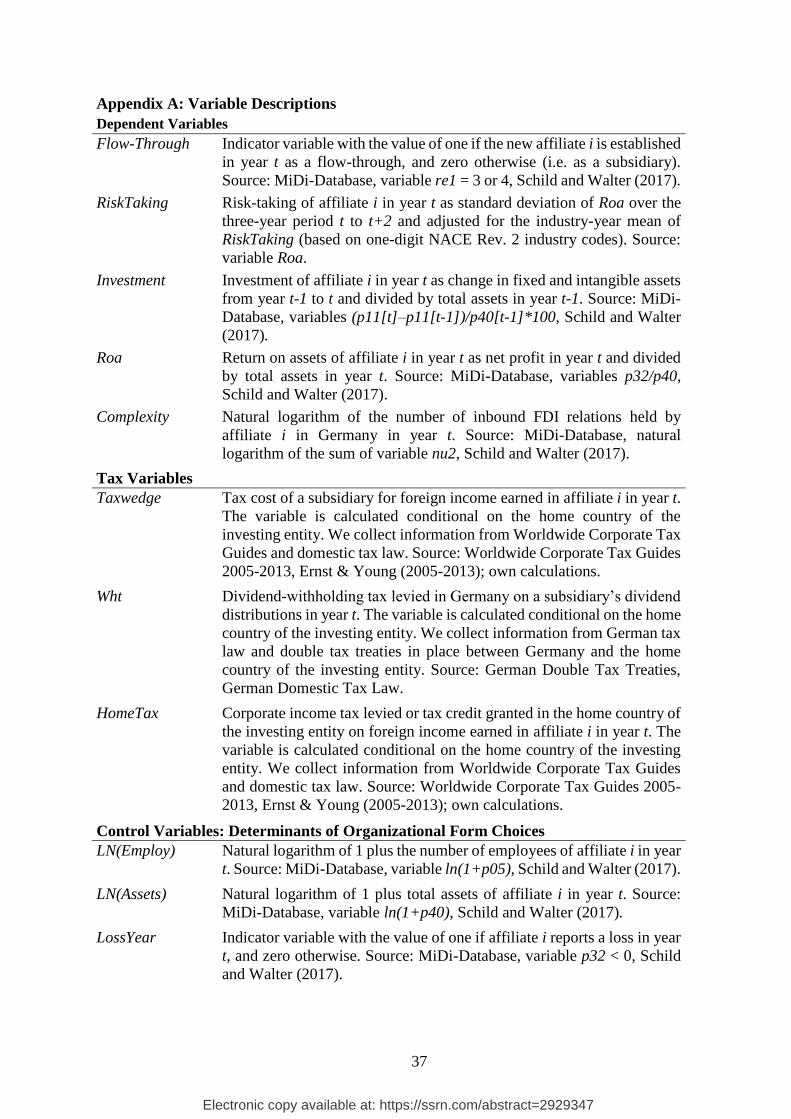
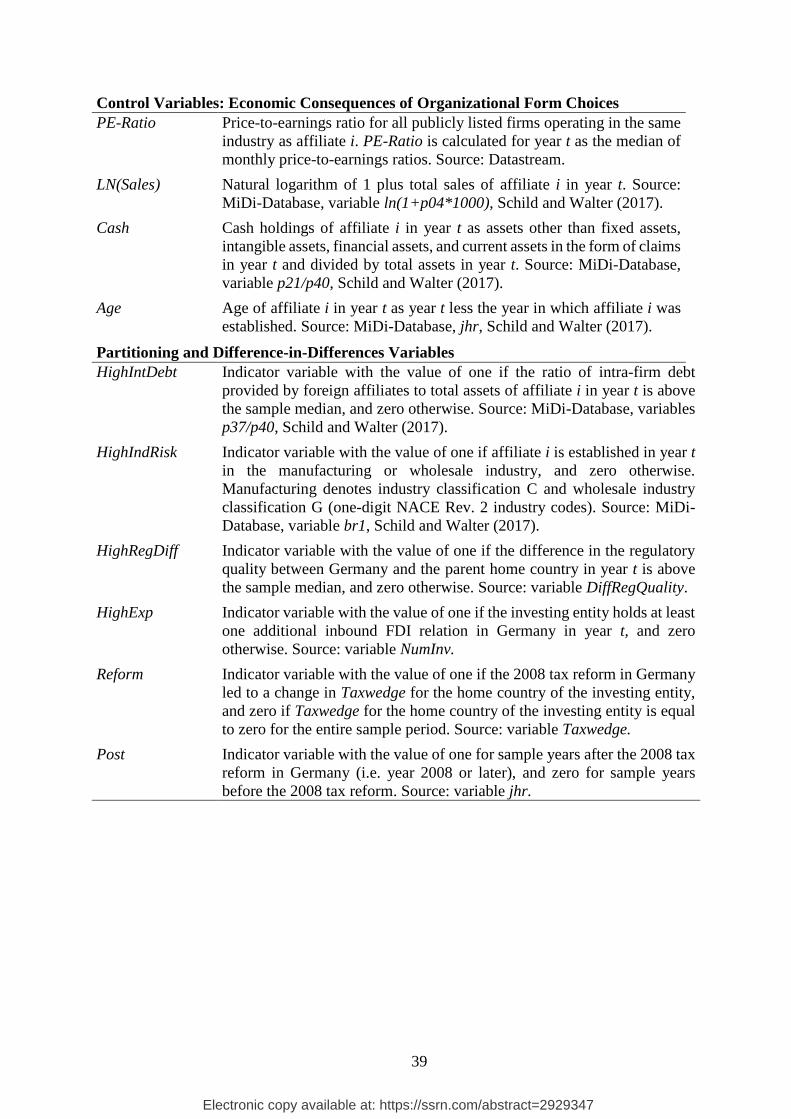
Appendix A: Variable Descriptions
Dependent Variables
Flow-Through Indicator variable with the value of one if the new affiliate i is established
in year t as a flow-through, and zero otherwise (i.e. as a subsidiary).
Source: MiDi-Database, variable re1 = 3 or 4, Schild and Walter (2017).
RiskTaking Risk-taking of affiliate i in year t as standard deviation of Roa over the
three-year period t to t+2 and adjusted for the industry-year mean of
RiskTaking (based on one-digit NACE Rev. 2 industry codes). Source:
variable Roa.
Investment Investment of affiliate i in year t as change in fixed and intangible assets
from year t-1 to t and divided by total assets in year t-1. Source: MiDi-
Database, variables (p11[t]–p11[t-1])/p40[t-1]*100, Schild and Walter
(2017).
Roa Return on assets of affiliate i in year t as net profit in year t and divided
by total assets in year t. Source: MiDi-Database, variables p32/p40,
Schild and Walter (2017).
Complexity Natural logarithm of the number of inbound FDI relations held by
affiliate i in Germany in year t. Source: MiDi-Database, natural
logarithm of the sum of variable nu2, Schild and Walter (2017).
Tax Variables
Taxwedge Tax cost of a subsidiary for foreign income earned in affiliate i in year t.
The variable is calculated conditional on the home country of the
investing entity. We collect information from Worldwide Corporate Tax
Guides and domestic tax law. Source: Worldwide Corporate Tax Guides
2005-2013, Ernst & Young (2005-2013); own calculations. Wht Dividend-withholding tax levied in Germany on a subsidiary’s dividend
distributions in year t. The variable is calculated conditional on the home
country of the investing entity. We collect information from German tax
law and double tax treaties in place between Germany and the home
country of the investing entity. Source: German Double Tax Treaties,
German Domestic Tax Law.
HomeTax Corporate income tax levied or tax credit granted in the home country of
the investing entity on foreign income earned in affiliate i in year t. The
variable is calculated conditional on the home country of the investing
entity. We collect information from Worldwide Corporate Tax Guides
and domestic tax law. Source: Worldwide Corporate Tax Guides 2005-
2013, Ernst & Young (2005-2013); own calculations.
Control Variables: Determinants of Organizational Form Choices
LN(Employ) Natural logarithm of 1 plus the number of employees of affiliate i in year
t. Source: MiDi-Database, variable ln(1+p05), Schild and Walter (2017).
LN(Assets) Natural logarithm of 1 plus total assets of affiliate i in year t. Source:
MiDi-Database, variable ln(1+p40), Schild and Walter (2017).
LossYear Indicator variable with the value of one if affiliate i reports a loss in year
t, and zero otherwise. Source: MiDi-Database, variable p32 < 0, Schild
and Walter (2017).
Electronic copy available at: https://ssrn.com/abstract=2929347
38
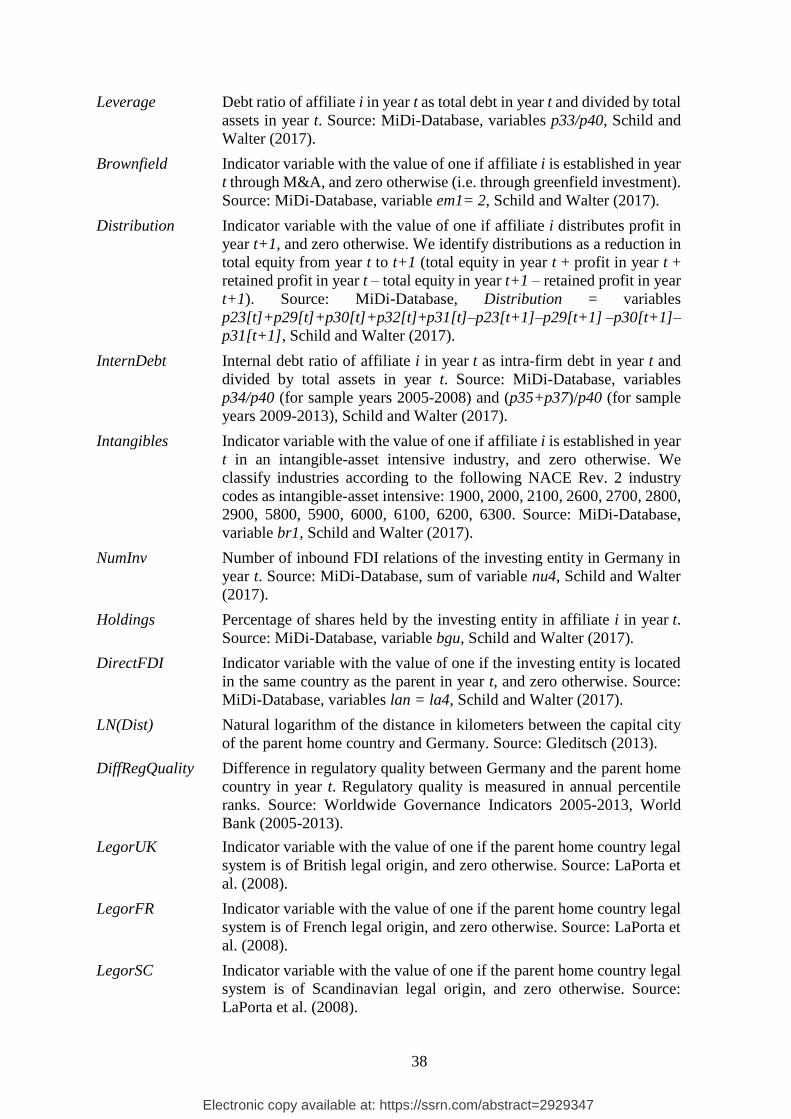
Leverage Debt ratio of affiliate i in year t as total debt in year t and divided by total
assets in year t. Source: MiDi-Database, variables p33/p40, Schild and
Walter (2017).
Brownfield Indicator variable with the value of one if affiliate i is established in year
t through M&A, and zero otherwise (i.e. through greenfield investment).
Source: MiDi-Database, variable em1= 2, Schild and Walter (2017). Distribution Indicator variable with the value of one if affiliate i distributes profit in
year t+1, and zero otherwise. We identify distributions as a reduction in
total equity from year t to t+1 (total equity in year t + profit in year t +
retained profit in year t – total equity in year t+1 – retained profit in year
t+1). Source: MiDi-Database, Distribution = variables
LN(Sales) Natural logarithm of 1 plus total sales of affiliate i in year t. Source:
MiDi-Database, variable ln(1+p04*1000), Schild and Walter (2017).
Cash Cash holdings of affiliate i in year t as assets other than fixed assets,
intangible assets, financial assets, and current assets in the form of claims
in year t and divided by total assets in year t. Source: MiDi-Database,
variable p21/p40, Schild and Walter (2017).
Age Age of affiliate i in year t as year t less the year in which affiliate i was
established. Source: MiDi-Database, jhr, Schild and Walter (2017).
Partitioning and Difference-in-Differences Variables
HighIntDebt Indicator variable with the value of one if the ratio of intra-firm debt
provided by foreign affiliates to total assets of affiliate i in year t is above
the sample median, and zero otherwise. Source: MiDi-Database, variables
p37/p40, Schild and Walter (2017).
HighIndRisk Indicator variable with the value of one if affiliate i is established in year t
in the manufacturing or wholesale industry, and zero otherwise.
Manufacturing denotes industry classification C and wholesale industry
classification G (one-digit NACE Rev. 2 industry codes). Source: MiDi-
Database, variable br1, Schild and Walter (2017).
HighRegDiff Indicator variable with the value of one if the difference in the regulatory
quality between Germany and the parent home country in year t is above
the sample median, and zero otherwise. Source: variable DiffRegQuality.
HighExp Indicator variable with the value of one if the investing entity holds at least
one additional inbound FDI relation in Germany in year t, and zero
otherwise. Source: variable NumInv.
Reform Indicator variable with the value of one if the 2008 tax reform in Germany
led to a change in Taxwedge for the home country of the investing entity,
and zero if Taxwedge for the home country of the investing entity is equal
to zero for the entire sample period. Source: variable Taxwedge.
Post Indicator variable with the value of one for sample years after the 2008 tax
reform in Germany (i.e. year 2008 or later), and zero for sample years
before the 2008 tax reform. Source: variable jhr.
Electronic copy available at: https://ssrn.com/abstract=2929347
40
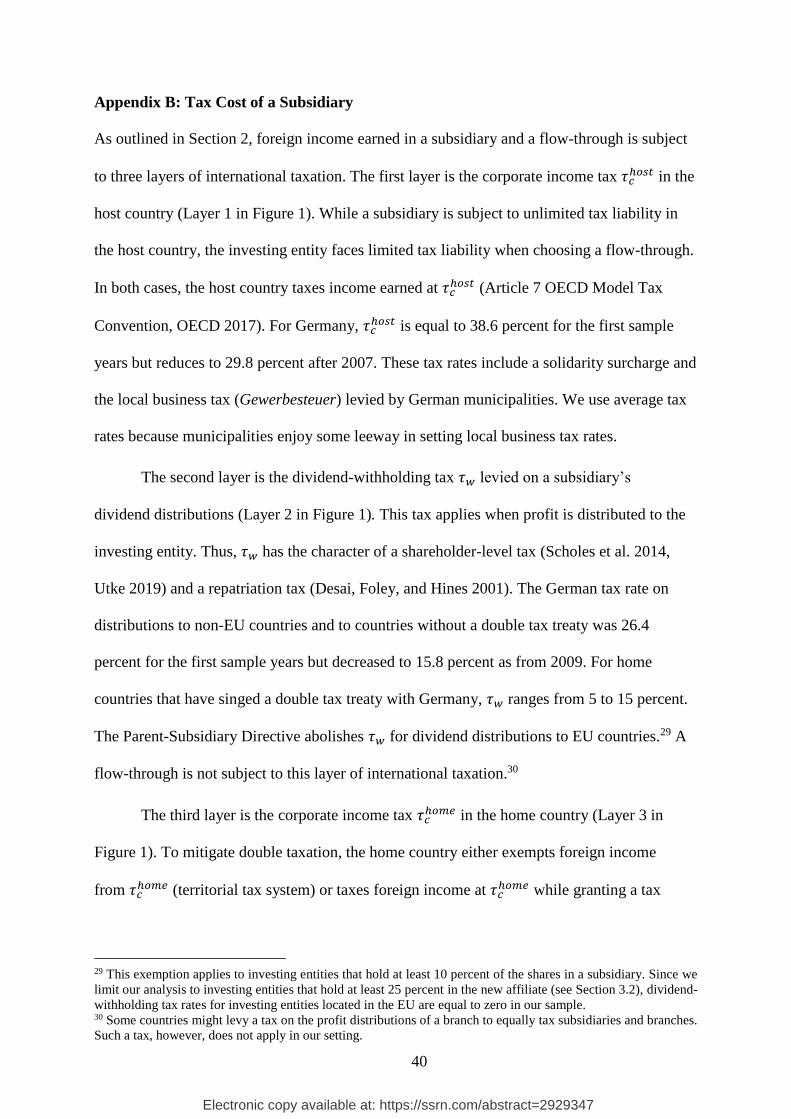
Appendix B: Tax Cost of a Subsidiary
As outlined in Section 2, foreign income earned in a subsidiary and a flow-through is subject
to three layers of international taxation. The first layer is the corporate income tax 𝜏𝑐ℎ𝑜𝑠𝑡 in the
host country (Layer 1 in Figure 1). While a subsidiary is subject to unlimited tax liability in
the host country, the investing entity faces limited tax liability when choosing a flow-through.
In both cases, the host country taxes income earned at 𝜏𝑐ℎ𝑜𝑠𝑡 (Article 7 OECD Model Tax
Convention, OECD 2017). For Germany, 𝜏𝑐ℎ𝑜𝑠𝑡 is equal to 38.6 percent for the first sample
years but reduces to 29.8 percent after 2007. These tax rates include a solidarity surcharge and
the local business tax (Gewerbesteuer) levied by German municipalities. We use average tax
rates because municipalities enjoy some leeway in setting local business tax rates.
The second layer is the dividend-withholding tax 𝜏𝑤 levied on a subsidiary’s
dividend distributions (Layer 2 in Figure 1). This tax applies when profit is distributed to the
investing entity. Thus, 𝜏𝑤 has the character of a shareholder-level tax (Scholes et al. 2014,
Utke 2019) and a repatriation tax (Desai, Foley, and Hines 2001). The German tax rate on
distributions to non-EU countries and to countries without a double tax treaty was 26.4
percent for the first sample years but decreased to 15.8 percent as from 2009. For home
countries that have singed a double tax treaty with Germany, 𝜏𝑤 ranges from 5 to 15 percent.
The Parent-Subsidiary Directive abolishes 𝜏𝑤 for dividend distributions to EU countries.29 A
flow-through is not subject to this layer of international taxation.30
The third layer is the corporate income tax 𝜏𝑐ℎ𝑜𝑚𝑒 in the home country (Layer 3 in
Figure 1). To mitigate double taxation, the home country either exempts foreign income
from 𝜏𝑐ℎ𝑜𝑚𝑒 (territorial tax system) or taxes foreign income at 𝜏𝑐
ℎ𝑜𝑚𝑒 while granting a tax
29 This exemption applies to investing entities that hold at least 10 percent of the shares in a subsidiary. Since we
limit our analysis to investing entities that hold at least 25 percent in the new affiliate (see Section 3.2), dividend-
withholding tax rates for investing entities located in the EU are equal to zero in our sample. 30 Some countries might levy a tax on the profit distributions of a branch to equally tax subsidiaries and branches.
Such a tax, however, does not apply in our setting.
Electronic copy available at: https://ssrn.com/abstract=2929347
41
credit for 𝜏𝑤 and 𝜏𝑐ℎ𝑜𝑠𝑡 (worldwide tax system). In rare cases, the home country taxes foreign
income at 𝜏𝑐ℎ𝑜𝑚𝑒 without granting relief from double taxation.
Territorial tax systems differ in the extent to which foreign income is exempt from
𝜏𝑐ℎ𝑜𝑚𝑒. Home countries may fully exempt foreign income or tax a fraction 𝑤 at 𝜏𝑐
ℎ𝑜𝑚𝑒. Thus,
for an investing entity from a home country with a territorial tax system, the effective tax
burden on foreign income earned in a subsidiary 𝑇𝑆 or in a flow-through 𝑇𝐹 is given by
𝑇𝑆 =𝜏𝑐ℎ𝑜𝑠𝑡 + (1 − 𝜏𝑐
ℎ𝑜𝑠𝑡) ∗ 𝜏𝑤 +(1 − 𝜏𝑐ℎ𝑜𝑠𝑡) ∗ 𝑤 ∗ 𝜏𝑐
ℎ𝑜𝑚𝑒,
𝑇𝐹 =𝜏𝑐ℎ𝑜𝑠𝑡 +(1 − 𝜏𝑐
ℎ𝑜𝑠𝑡) ∗ 𝑤 ∗ 𝜏𝑐ℎ𝑜𝑚𝑒.
Under a worldwide tax system, the home country taxes foreign income earned in a
subsidiary when distributed to the investing entity. To mitigate double taxation, the home
country grants a tax credit, which is limited to 𝜏𝑐ℎ𝑜𝑚𝑒. In case of a direct tax credit, 𝜏𝑤 is
credited and the investing entity is subject to home county corporate income tax in excess of
(1 − 𝜏𝑐ℎ𝑜𝑠𝑡) ∗ 𝜏𝑤. An indirect tax credit also includes 𝜏𝑐
ℎ𝑜𝑠𝑡, and the investing entity is subject
to home country corporate income tax in excess of 𝜏𝑐ℎ𝑜𝑠𝑡 + (1 − 𝜏𝑐
ℎ𝑜𝑠𝑡) ∗ 𝜏𝑤. In case of a
flow-through, the home country taxes foreign income when earned and grants a tax credit for
𝜏𝑐ℎ𝑜𝑠𝑡. The investing entity is subject to home country corporate income tax in excess of 𝜏𝑐
ℎ𝑜𝑠𝑡.
For an investing entity from a home country with a worldwide tax system, the effective tax
burden on foreign income earned in a subsidiary 𝑇𝑆 or in a flow-through 𝑇𝐹 is given by
𝑇𝑆 = max{𝜏𝑐ℎ𝑜𝑠𝑡 + (1 − 𝜏𝑐
ℎ𝑜𝑠𝑡) ∗ 𝜏𝑤; 𝜏𝑐ℎ𝑜𝑠𝑡 + (1 − 𝜏𝑐
ℎ𝑜𝑠𝑡) ∗ 𝜏𝑐ℎ𝑜𝑚𝑒}, (direct tax credit)
𝑇𝑆 = max{𝜏𝑐ℎ𝑜𝑠𝑡 + (1 − 𝜏𝑐
ℎ𝑜𝑠𝑡) ∗ 𝜏𝑤; 𝜏𝑐ℎ𝑜𝑚𝑒}, (indirect tax credit)
𝑇𝐹 = max{𝜏𝑐ℎ𝑜𝑠𝑡; 𝜏𝑐
ℎ𝑜𝑚𝑒}.
Some home countries neither exempt foreign income from 𝜏𝑐ℎ𝑜𝑚𝑒 nor grant a tax credit
for 𝜏𝑤 and 𝜏𝑐ℎ𝑜𝑠𝑡, which results in double taxation of foreign income. For an investing entity
Electronic copy available at: https://ssrn.com/abstract=2929347
42
from a home country that does not grant any relief from double taxation, the effective tax
burden on foreign income earned in a subsidiary 𝑇𝑆 or in a flow-through 𝑇𝐹 is given by
𝑇𝑆 =𝜏𝑐ℎ𝑜𝑠𝑡 + (1 − 𝜏𝑐
ℎ𝑜𝑠𝑡) ∗ 𝜏𝑤 +𝜏𝑐ℎ𝑜𝑚𝑒,
𝑇𝐹 =𝜏𝑐ℎ𝑜𝑠𝑡 +𝜏𝑐
ℎ𝑜𝑚𝑒.
In the table below, we derive the tax burden difference between organizational forms
and determine the tax cost of a subsidiary for each home country tax system. As discussed in
Section 2, a subsidiary induces a higher tax burden equal to the dividend-withholding tax if
the investing entity is located in a home country with a territorial tax system or in a home
country that does not grant any relief from double taxation. If the investing entity is located
in a home country with a worldwide tax system, tax cost of a subsidiary depends on the
corporate income tax rates in the host and the home country and the tax credit granted.
Home Country Tax System Tax Cost of a Subsidiary (TS – TF)
Territorial tax system (1 – 𝜏𝑐ℎ𝑜𝑠𝑡) * τw
Worldwide tax system (direct tax credit)
if 𝜏𝑐ℎ𝑜𝑠𝑡 > 𝜏𝑐
ℎ𝑜𝑚𝑒 > τw (1 – 𝜏𝑐ℎ𝑜𝑠𝑡) * τw
if 𝜏𝑐ℎ𝑜𝑠𝑡 > 𝜏𝑐
ℎ𝑜𝑚𝑒 ˄ τw > 𝜏𝑐ℎ𝑜𝑚𝑒 (1 – 𝜏𝑐
ℎ𝑜𝑠𝑡) * τw if 𝜏𝑐
ℎ𝑜𝑚𝑒 > 𝜏𝑐ℎ𝑜𝑠𝑡 ˄ 𝜏𝑐
ℎ𝑜𝑚𝑒 > τw 𝜏𝑐ℎ𝑜𝑠𝑡
– 𝜏𝑐ℎ𝑜𝑚𝑒
* τw if τw > 𝜏𝑐
ℎ𝑜𝑠𝑡 > 𝜏𝑐ℎ𝑜𝑚𝑒 𝜏𝑐
ℎ𝑜𝑠𝑡 + (1 – 𝜏𝑐ℎ𝑜𝑠𝑡) * τw – 𝜏𝑐
ℎ𝑜𝑚𝑒 Worldwide tax system (indirect tax credit)
if 𝜏𝑐
ℎ𝑜𝑠𝑡 > 𝜏𝑐
ℎ𝑜𝑚𝑒 (1 – 𝜏𝑐ℎ𝑜𝑠𝑡) * τw
if 𝜏𝑐ℎ𝑜𝑚𝑒 > 𝜏𝑐
ℎ𝑜𝑠𝑡 + (1 – 𝜏𝑐
ℎ𝑜𝑠𝑡) * τw > 𝜏𝑐ℎ𝑜𝑠𝑡 0
if 𝜏𝑐ℎ𝑜𝑠𝑡
+ (1 – 𝜏𝑐ℎ𝑜𝑠𝑡) * τw > 𝜏𝑐
ℎ𝑜𝑚𝑒 > 𝜏𝑐ℎ𝑜𝑠𝑡 𝜏𝑐
ℎ𝑜𝑠𝑡 + (1 – 𝜏𝑐
ℎ𝑜𝑠𝑡) * τw – 𝜏𝑐ℎ𝑜𝑚𝑒
No relief from double taxation
(1 – 𝜏𝑐ℎ𝑜𝑠𝑡) * τw
Note: This table presents the tax burden difference between a subsidiary and a flow-through. We derive the
tax cost of a subsidiary for each home country tax system. TS is the tax burden on foreign income earned in
a subsidiary and TF on foreign income earned in a flow-through, respectively. 𝜏𝑐ℎ𝑜𝑠𝑡 is the statutory corporate
income tax rate in the host country. The host country taxes income earned in a subsidiary and a flow-through
at 𝜏𝑐ℎ𝑜𝑠𝑡. τw is the statutory dividend-withholding tax rate on a subsidiary’s dividend distributions. This tax
does not apply on a flow-through. 𝜏𝑐ℎ𝑜𝑚𝑒 is the statutory corporate income tax rate in the home country. To
mitigate double taxation, the home country either exempts foreign income from tax (territorial tax system)
or taxes foreign income at the home country corporate income tax rate while granting a tax credit for the
dividend-withholding tax and the host country corporate income tax (worldwide tax system with direct or
indirect tax credit). Some countries do not grant relief from double taxation.
Electronic copy available at: https://ssrn.com/abstract=2929347
43
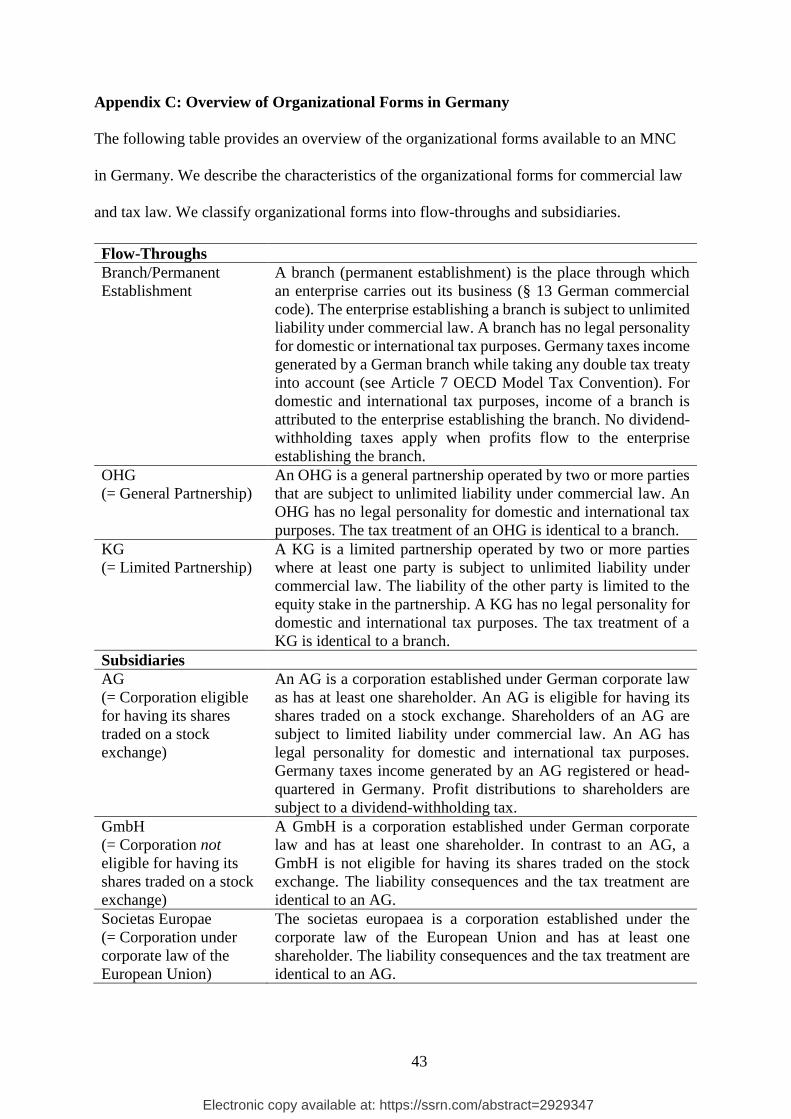
Appendix C: Overview of Organizational Forms in Germany
The following table provides an overview of the organizational forms available to an MNC
in Germany. We describe the characteristics of the organizational forms for commercial law
and tax law. We classify organizational forms into flow-throughs and subsidiaries.
Flow-Throughs
Branch/Permanent
Establishment
A branch (permanent establishment) is the place through which
an enterprise carries out its business (§ 13 German commercial
code). The enterprise establishing a branch is subject to unlimited
liability under commercial law. A branch has no legal personality
for domestic or international tax purposes. Germany taxes income
generated by a German branch while taking any double tax treaty
into account (see Article 7 OECD Model Tax Convention). For
domestic and international tax purposes, income of a branch is
attributed to the enterprise establishing the branch. No dividend-
withholding taxes apply when profits flow to the enterprise
establishing the branch.
OHG
(= General Partnership)
An OHG is a general partnership operated by two or more parties
that are subject to unlimited liability under commercial law. An
OHG has no legal personality for domestic and international tax
purposes. The tax treatment of an OHG is identical to a branch.
KG
(= Limited Partnership)
A KG is a limited partnership operated by two or more parties
where at least one party is subject to unlimited liability under
commercial law. The liability of the other party is limited to the
equity stake in the partnership. A KG has no legal personality for
domestic and international tax purposes. The tax treatment of a
KG is identical to a branch.
Subsidiaries
AG
(= Corporation eligible
for having its shares
traded on a stock
exchange)
An AG is a corporation established under German corporate law
as has at least one shareholder. An AG is eligible for having its
shares traded on a stock exchange. Shareholders of an AG are
subject to limited liability under commercial law. An AG has
legal personality for domestic and international tax purposes.
Germany taxes income generated by an AG registered or head-
quartered in Germany. Profit distributions to shareholders are
subject to a dividend-withholding tax.
GmbH
(= Corporation not
eligible for having its
shares traded on a stock
exchange)
A GmbH is a corporation established under German corporate
law and has at least one shareholder. In contrast to an AG, a
GmbH is not eligible for having its shares traded on the stock
exchange. The liability consequences and the tax treatment are
identical to an AG.
Societas Europae
(= Corporation under
corporate law of the
European Union)
The societas europaea is a corporation established under the
corporate law of the European Union and has at least one
shareholder. The liability consequences and the tax treatment are
identical to an AG.
Electronic copy available at: https://ssrn.com/abstract=2929347
44
Figures
Figure 1
International Taxation and Organizational Forms
Note: This figure outlines the three layers of international taxation. The investing entity selects an organizational
form for a new affiliate in the host country (Germany). The investing entity is part of an MNC and located either
in the same country as the parent (e.g., the United States: direct investment) or in a different country (e.g.,
Luxembourg: indirect investment). The three layers of international taxation determine the tax burden on foreign
income earned in a subsidiary and a flow-through, respectively. Layer 1 is the statutory corporate income tax in
the host country (𝜏𝑐ℎ𝑜𝑠𝑡). The host country taxes income earned in a subsidiary and a flow-through at 𝜏𝑐
ℎ𝑜𝑠𝑡. Layer 2
is the statutory dividend-withholding tax (𝜏𝑤) levied on a subsidiary’s dividend distributions. This tax does not
apply to a flow-through. Layer 3 is the statutory corporate income tax in the home country (𝜏𝑐ℎ𝑜𝑚𝑒). The home
county taxes foreign income when earned in the host country or when repatriated to the investing entity. To
mitigate double taxation, the home country either exempts foreign income from tax (territorial tax system) or taxes
foreign income at the home country corporate income tax rate while granting a tax credit for the dividend-
withholding tax and the host country corporate income tax (worldwide tax system with direct or indirect tax credit).
Some home countries do not grant relief from double taxation.
Parent
Investing Entity
(e.g., U.S.)
Subsidiary
(GER) Flow-Through
(GER)
Direct Investment
Investing Entity
(e.g., LUX)
Subsidiary
(GER)
Flow-Through
(GER)
Indirect Investment
Parent
(e.g., U.S.)
Layer 1:
𝜏𝑐ℎ𝑜𝑠𝑡
Layer 2:
𝜏𝑤
Layer 3:
𝜏𝑐ℎ𝑜𝑚𝑒
Electronic copy available at: https://ssrn.com/abstract=2929347
45
Tables
Table 1
Sample Selection (Organizational Form Choice Sample)
Data Restrictions Observations
First observation of inbound investment in Germany (years 1999-2013) 18,265
Less observations before 2005 -12,206
Less observations where the main investor holds < 25 percent of the shares -360
Less observations with insufficient data to calculate Taxwedge -19
Less observations of pre-existing firms -3,498
Organizational Form Choice Sample 2,182
Note: This table presents the sample selection for the organizational form choice sample. The sample
includes the first observation of a new affiliate in Germany (sample years 2005-2013). We define variables
in the Appendix. Source: Research Data and Service Centre (RDSC) of the Deutsche Bundesbank,
Microdatabase Direct Investment (MiDi) for the years 2005 to 2013, own calculations.
Electronic copy available at: https://ssrn.com/abstract=2929347
46
Table 2
Sample Composition
Panel A: Taxwedge and Observations by Home Country
Home Country Taxwedge
Mean
Subsidiaries
N
Flow-Throughs
N
Total
N
Austria 0.00 131 34 165
Belgium 1.11 25 8 33
British Virgin Islands 13.12 6 0 6
Canada 3.19 9 3 12
China 6.53 25 3 28
Cyprus 1.56 19 3 22
Czech Republic 6.21 5 0 5
Denmark 0.00 36 18 54
Finland 0.00 18 0 18
France 0.00 80 17 97
Ireland 0.00 18 6 24
Italy 0.95 35 9 44
Jersey 13.12 12 24 36
Liechtenstein 9.10 4 8 12
Luxembourg 0.00 367 133 500
Malaysia 3.27 3 0 3
Mauritius 3.27 3 0 3
Mexico 3.19 3 0 3
Netherlands 0.00 237 85 322
Norway 0.33 10 3 13
Republic of Korea 16.68 8 0 8
Russian Federation 11.35 3 0 3
Spain -0.02 31 5 36
Sweden 0.00 38 4 42
Switzerland 0.00 135 55 190
United Kingdom 0.00 130 45 175
United States 0.93 128 24 152
Additional Observations 130 46 176
Total 1,649 533 2,182
Electronic copy available at: https://ssrn.com/abstract=2929347
47
Panel B: Observations by Sample Year
Years Subsidiaries Flow-Throughs Total
2005 136 25 161
2006 274 37 311
2007 240 66 306
2008 187 70 257
2009 141 56 197
2010 126 30 156
2011 192 51 243
2012 174 100 274
2013 179 98 277
Total 1,649 533 2,182
Panel C: Observations by Industry
Industries Subsidiaries Flow-Throughs Total
Manufacturing 287 46 333
Energy Supply 25 58 83
Construction 237 147 384
Wholesale 137 11 148
Transportation 36 11 47
Information and Communication 41 7 48
Financial Services 481 154 635
Professional Services 325 78 403
Other Services 80 21 101
Total 1,649 533 2,182 Note: This table presents information on the sample composition. Panel A presents the mean tax cost
of a subsidiary (Taxwedge) and the number of observations by home country of the investing entity.
In line with Deutsche Bundesbank’s confidentiality rules, we present home countries with a
minimum of three observations per organizational form that result from three distinct investing
entities. Our sample includes another 32 home countries that do not fulfill this confidentiality
requirement. These observations are summarized under Additional Observations. Panel B presents
observations by sample year. Panel C presents observations by industry. Industry classification is
based on one-digit NACE Rev. 2 industry codes. We define variables in the Appendix. Source:
Research Data and Service Centre (RDSC) of the Deutsche Bundesbank, Microdatabase Direct
Investment (MiDi) for the years 2005 to 2013, own calculations.
Electronic copy available at: https://ssrn.com/abstract=2929347
48
Table 3
Descriptive Statistics (Organizational Form Choice Sample)
Full Sample Subsidiaries
(N = 1,649) Flow-Throughs
(N = 533)
Variables N Mean SD Mean SD Mean SD t-statistics z-statistics
Wht 2,182 2.010 5.115 1.856 4.712 2.487 6.180 -2.164** -0.030 Note: This table presents descriptive statistics for the organizational form choice sample. We present means and standard deviations for dependent and
independent variables. We present results for the full sample and separately for subsidiaries and flow-throughs. We conduct a two-sample t-test assuming unequal
variances (Wilcoxon rank-sum test) to compare means (medians) between subsamples. We winsorize continuous variables at the 1st and 99th percentile. We
define variables in the Appendix. *, **, and *** represent significance levels of 0.10, 0.05, and 0.01, respectively (two-tailed). Source: Research Data and Service
Centre (RDSC) of the Deutsche Bundesbank, Microdatabase Direct Investment (MiDi) for the years 2005 to 2013, own calculations.
Electronic copy available at: https://ssrn.com/abstract=2929347
(19) LegorSC -0.02 -0.08* 0.00* -0.02 0.02 0.03 0.00 0.01 -0.03 0.06* -0.01 -0.06* 0.04 0.10* 0.05 -0.13* -0.18* -0.19* 1.00 Note: This table presents Pearson correlation coefficients for the organizational form choice sample. We winsorize continuous variables at the 1st and 99th percentile. We define
variables in the Appendix. * represents a significance level of 0.01. Source: Research Data and Service Centre (RDSC) of the Deutsche Bundesbank, Micro-database Direct
Investment (MiDi) for the years 2005 to 2013, own calculations.
Electronic copy available at: https://ssrn.com/abstract=2929347
50
Table 5
Baseline Results: Tax Burden Difference and Organizational Form Choices Flow-Through Flow-Through (1) (2) (3) (4)
Analysis Δ Taxwedge One Affiliate Drop Taxwedge=0 Drop Tax Haven Withholding Tax (1) (2) (3) (4) (5)
ME/(SE) ME/(SE) ME/(SE) ME/(SE) ME/(SE)
ΔTaxwedge 0.019*
(0.069)
Taxwedge 0.027*** 0.051** 0.029**
(0.078) (0.192) (0.085)
Wht 0.383*** (0.109)
HomeTax 0.210**
(0.093)
Additional Controls Y Y Y Y Y
Industry-FE Y Y Y Y Y
Year-FE Y Y Y Y Y
N 1,905 1,665 417 1,331 2,182
Pseudo R² 0.185 0.169 0.333 0.160 0.208
Area under ROC curve 0.778 0.772 0.857 0.766 0.788 Note: This table presents results for additional robustness tests. In column 1, we estimate Equation (1) using annual changes in Taxwedge. We drop
observations if the investing entity establishes more than one new affiliate in our sample in column 2, observations with Taxwedge equal to zero in
column 3, and observations if the investing entity is located in a tax haven in column 4. In column 5, we replace Taxwedge with Wht and HomeTax.
The dependent variable, Flow-Through, is an indicator variable with the value of one if the new affiliate is established as a flow-through, and zero
otherwise. In all columns, we report marginal effects for a logistic regression based on Equation (1). We calculate marginal effects while holding
continuous variables at their means. We standardize independent variables to have a mean of zero and a standard deviation of one prior to estimating
regressions. All regressions are estimated with year and industry-fixed effects. We winsorize continuous variables at the 1st and 99th percentile. We
calculate heteroscedasticity-robust standard errors clustered at the investing-entity level. We define variables in the Appendix. *, **, and *** represent
significance levels of 0.10, 0.05, and 0.01, respectively (two-tailed). Source: Research Data and Service Centre (RDSC) of the Deutsche Bundesbank,
Microdatabase Direct Investment (MiDi) for the years 2005 to 2013, own calculations.
Electronic copy available at: https://ssrn.com/abstract=2929347
Note: This table presents descriptive statistics for the economic consequences sample. In Panel A (B), we present means and standard deviations for our dependent
(independent) variables. We conduct a two-sample t-test assuming unequal variances (Wilcoxon rank-sum test) to compare means (medians) between subsamples. In Panel
B, LN(Employ), LN(Assets), Leverage, Roa, LN(Sales), Investment, and Cash are lagged by one year. All continuous variables are winsorized at the 1st and 99th percentile.
We define variables in the Appendix. *, **, and *** represent significance levels of 0.10, 0.05, and 0.01, respectively (two-tailed). Source: Research Data and Service Centre
(RDSC) of the Deutsche Bundesbank, Microdatabase Direct Investment (MiDi) for the years 2005 to 2013, own calculations.
Electronic copy available at: https://ssrn.com/abstract=2929347
(15) Age -0.01 -0.08* 0.01 0.05* -0.05* 0.18* 0.06* 0.07* -0.02 0.02 -0.01 0.06* -0.09* 0.00 1.00 Note: This table presents Pearson correlation coefficients for the economic consequences sample. We winsorize continuous variables at the 1st and 99th percentile. We define
variables in the Appendix. (Lag) denotes variables lagged by one year. * represents a significance level of 0.01. Source: Research Data and Service Centre (RDSC) of the
Deutsche Bundesbank, Micro-database Direct Investment (MiDi) for the years 2005 to 2013, own calculations.
Electronic copy available at: https://ssrn.com/abstract=2929347
- 58 -
Table 12
Economic Consequences of Organizational Form Choices
Panel A: Organizational Form Choice (First-Stage Probit Regression) Flow-Through (1)
Coef. / (SE)
Taxwedge 0.152*** (0.044)
LN(Employ) 0.010 (0.055)
LN(Assets) 0.031 (0.040)
LossYear -0.577*** (0.089)
Leverage -0.265** (0.114)
Roa -0.300*** (0.054)
Brownfield -0.253*** (0.084)
Distribution 0.215** (0.086)
InternDebt -0.096 (0.064)
Intangibles -0.448** (0.196)
NumInv 0.136 (0.095)
Holdings -0.115*** (0.033)
DirectFDI -0.272*** (0.100)
LN(Dist) -0.042 (0.049)
DiffRegQuality -0.096** (0.048)
Legor_UK 0.115 (0.127)
Legor_FR -0.049 (0.130)
Legor_SC -0.230 (0.198)
Intercept -0.563 (0.399)
Year-FE Y
Industry-FE Y
N 2,182
Pseudo R² 0.204
Electronic copy available at: https://ssrn.com/abstract=2929347