ABTEILUNG MIKROBIOLOGIE ZENTRALINSTITUT FÜR ERNÄHRUNGS – UND LEBENSMITTELFORSCHUNG WEIHENSTEPHAN TECHNISCHE UNIVERSITÄT MÜNCHEN Growth and acid stress response of Corynebacterium glutamicum and other ripening bacterial species belonging to soft smear-ripened cheese KINGA JAKOB Vollständiger Abdruck der von der Fakultät Wissenschaftszentrum Weihenstephan für Ernährung, Landnutzung und Umwelt der Technischen Universität München zur Erlangung des akademisches Grades eines Doktors der Naturwissenschaften (Dr. rer. nat.) genehmigten Dissertation. Vorsitzender: Univ.-Prof. Dr. Ulrich Kulozik Prüfer der Dissertation 1. Univ.-Prof. Dr. Siegfried Scherer 2. Priv.-Doz. Dr. Matthias A. Ehrmann Die Dissertation wurde am 09.03.2005 bei der Technischen Universität München eingereicht und durch die Fakultät Wissenschaftzentrum Weihenstephan für Ernährung, Landnutzung und Umwelt am 13.05.2005 angenommen.
Transcript
ABTEILUNG MIKROBIOLOGIE ZENTRALINSTITUT FÜR ERNÄHRUNGS – UND LEBENSMITTELFORSCHUNG WEIHENSTEPHAN
TECHNISCHE UNIVERSITÄT MÜNCHEN
Growth and acid stress response of Corynebacterium glutamicum and other ripening bacterial species belonging to soft smear-ripened cheese
KINGA JAKOB
Vollständiger Abdruck der von der Fakultät Wissenschaftszentrum Weihenstephan für
Ernährung, Landnutzung und Umwelt der Technischen Universität München zur Erlangung des
akademisches Grades eines
Doktors der Naturwissenschaften
(Dr. rer. nat.)
genehmigten Dissertation. Vorsitzender: Univ.-Prof. Dr. Ulrich Kulozik
Prüfer der Dissertation 1. Univ.-Prof. Dr. Siegfried Scherer
2. Priv.-Doz. Dr. Matthias A. Ehrmann
Die Dissertation wurde am 09.03.2005 bei der Technischen Universität München eingereicht und
durch die Fakultät Wissenschaftzentrum Weihenstephan für Ernährung, Landnutzung und
Umwelt am 13.05.2005 angenommen.
Table of Contents
Table of Contents
TABLE OF CONTENTS.................................................................................I
LIST OF FIGURES........................................................................................ IV
LIST OF TABLES........................................................................................... V
1.1 MICROBIAL COMPOSITION OF SURFACE SMEAR-RIPENED CHEESE .....................................2 1.1.1 Yeast ........................................................................................................................................................2 1.1.2 Coryneforms ..............................................................................................................................................3 1.1.3 Staphylococci and micrococci.......................................................................................................................3
1.2 NATURAL ADAPTATION OF CHEESE RIPENING BACTERIAL STRAINS TO LOW PH.............3 1.2.1 Acceleration of cheese ripening....................................................................................................................4 1.2.2 Classical strain improvement .....................................................................................................................5 1.2.3 Real Time PCR........................................................................................................................................6
1.4 MICROARRAY ............................................................................................................................13 1.5 AIMS OF THIS WORK.................................................................................................................15
2 MATERIALS AND METHODS .............................................................16
2.1 BACTERIAL STRAINS AND PLASMIDS ......................................................................................16 2.2 MEDIA AND GROWTH CONDITIONS ......................................................................................20 2.3 NATURAL ADAPTATION OF THE BACTERIAL SPECIES..........................................................20
2.3.1 Determination of phenotypic characteristics of the adapted cheese ripening mutants ....................................21 2.4 MONITORING OF CHEESE RIPENING CONSORTIUM ON MODEL CHEESE BY REAL TIME PCR ....................................................................................................................................................21
2.4.1 Sequencing of cheese ripening strains.........................................................................................................21 2.4.2 Separation of DNA fragments by agarose gel electrophoresis (AGE).......................................................22 2.4.3 Inoculation of model cheese with the ripening strains. ................................................................................23 2.4.4 Isolation of genomic DNA from cheese ripening consortium......................................................................23 2.4.5 Generation of a cell count standard curve .................................................................................................24 2.4.6 Real-time PCR monitoring of the microbial consortium............................................................................24 2.4.7 Inoculation of model cheese with the acid adapted species...........................................................................24
2.5 MICROARRAY ANALYSIS OF ACID ADAPTED CORYNEBACTERIUM GLUTAMICUM............24 2.5.1 Isolation of genomic DNA from C. glutamicum ......................................................................................24 2.5.2 Measurement of cytoplasmic pH ..............................................................................................................25
I
Table of Contents
2.5.3 Fermentation...........................................................................................................................................25 2.5.4 Generation of C. glutamicum DNA microarray......................................................................................26 2.5.5 Total RNA preparation and cDNA synthesis .......................................................................................26 2.5.6 DNA microarray hybridization and washing..........................................................................................27 2.5.7 Data normalization and gene expression analysis.....................................................................................27 2.5.8 Construction of gene disruption mutants...................................................................................................27 2.5.9 Preparation of C. glutamicum competent cells ...........................................................................................28 2.5.10 Electroporation........................................................................................................................................29 2.5.11 Polymerase Chain Reaction (PCR) .........................................................................................................29 2.5.12 RNA isolation .......................................................................................................................................30 2.5.13 Reverse transcriptase PCR ......................................................................................................................30 2.5.14 Real-time PCR.......................................................................................................................................30 2.5.15 Iron availability assay .............................................................................................................................31 2.5.16 Determination of growth characteristics of the deletion mutants .................................................................31 2.5.17 Acid shock assays ...................................................................................................................................31
3.2 MONITORING OF RIPENING CONSORTIUM USING QUANTITATIVE REAL TIME PCR ON MODEL CHEESE ......................................................................................................................................40
3.2.1 Primer design for the ripening microbial consortium ..................................................................................40 3.2.2 Construction of a cell count standard curve ...............................................................................................42 3.2.3 Analysis of microbial succession on model cheese.......................................................................................45 3.2.4 Comparison of quantitative real time PCR to cell culture method .............................................................46 3.2.5 Comparison of microbial succession of non-adapted and adapted species ....................................................48
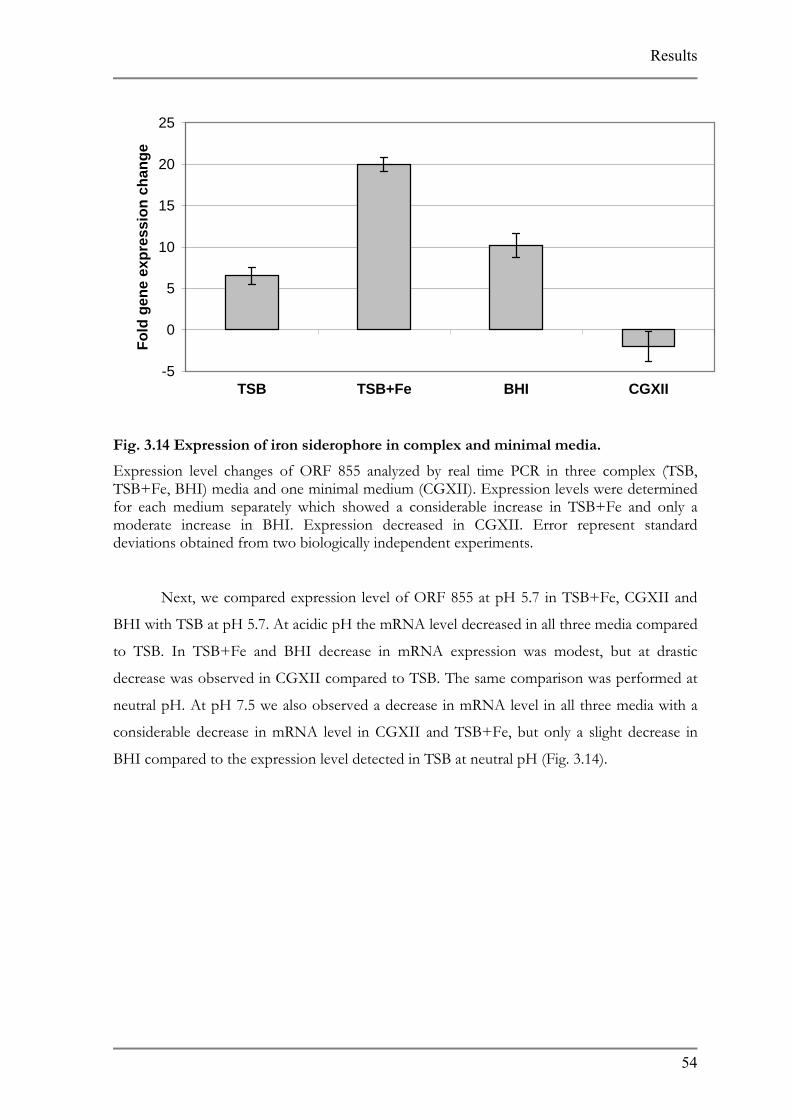
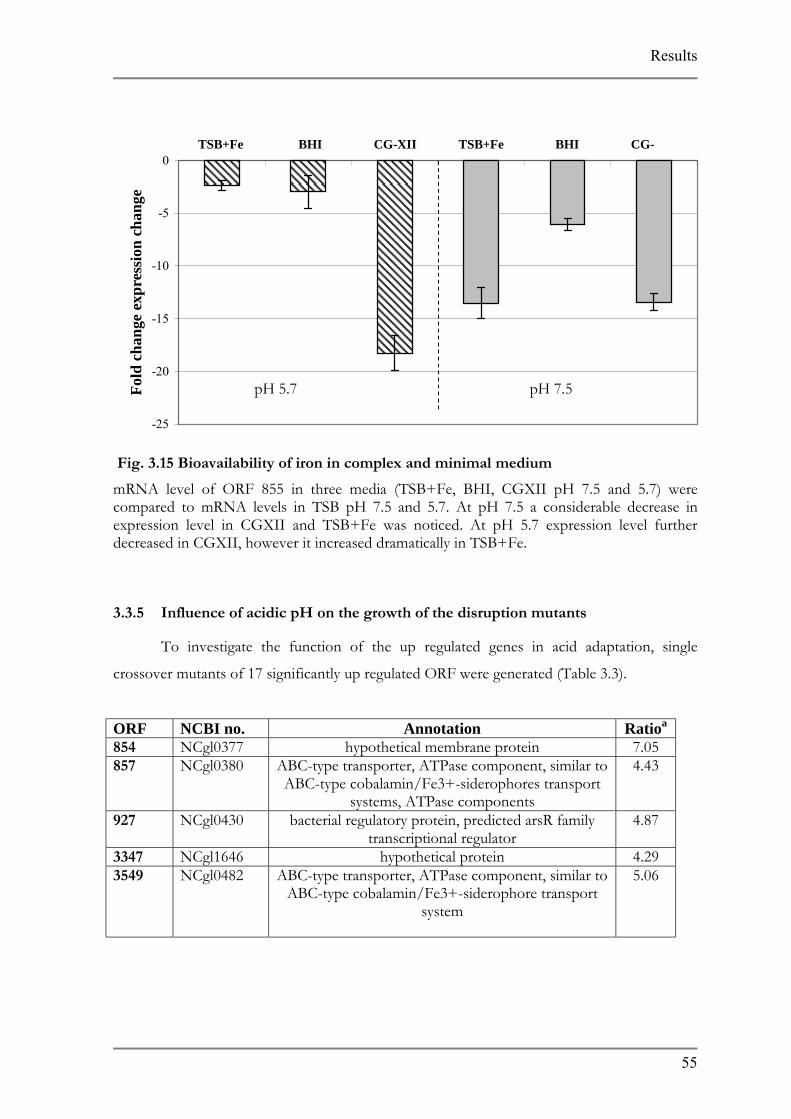
3.3 ATR OF C. GLUTAMICUM ........................................................................................................50 3.3.1 Measurement of cytoplasmic pH ..............................................................................................................50 3.3.2 Comparison of gene expression at acidic and neutral pH conditions ..........................................................51 3.3.3 Validation of expression profile of fermentation via real time RT-PCR ...................................................52 3.3.4 Iron bioavailability in undefined complex and defined minimal medium....................................................53 3.3.5 Influence of acidic pH on the growth of the disruption mutants .................................................................55
4.1 ADAPTATION OF CHEESE RIPENING BACTERIAL SPECIES TO LOW PH .............................60 4.1.1 Mutation frequencies ...............................................................................................................................62 4.1.2 Disadvantages of natural selection............................................................................................................63
4.2 REAL TIME ANALYSIS OF RIPENING CONSORTIUM...............................................................65 4.2.1 Identification based on 16S and 18S sequencing ......................................................................................65 4.2.2 Detection limits using real time PCR.......................................................................................................65 4.2.3 Monitoring of ripening consortium by quantitative real time PCR ............................................................66 4.2.4 Comparison of alternative methods to real time PCR used to study microbial succession ............................67 4.2.5 Implementation in the dairy industry........................................................................................................68 4.2.6 Comparison of pH adapted and control ripening species on model cheese ...................................................69
4.3 ACID ADAPTATION IN CORYNEBACTERIUM GLUTAMICUM ................................................70 4.3.1 Induction of cation and multidrug transport systems .................................................................................70 4.3.2 Iron transport is induced at low pH.........................................................................................................71 4.3.3 DNA repair in acid adaptation..............................................................................................................72 4.3.4 Role of regulatory proteins in acid adaptation ...........................................................................................73 4.3.5 Redundancy of the pH adaptation response of C. glutamicum...................................................................74
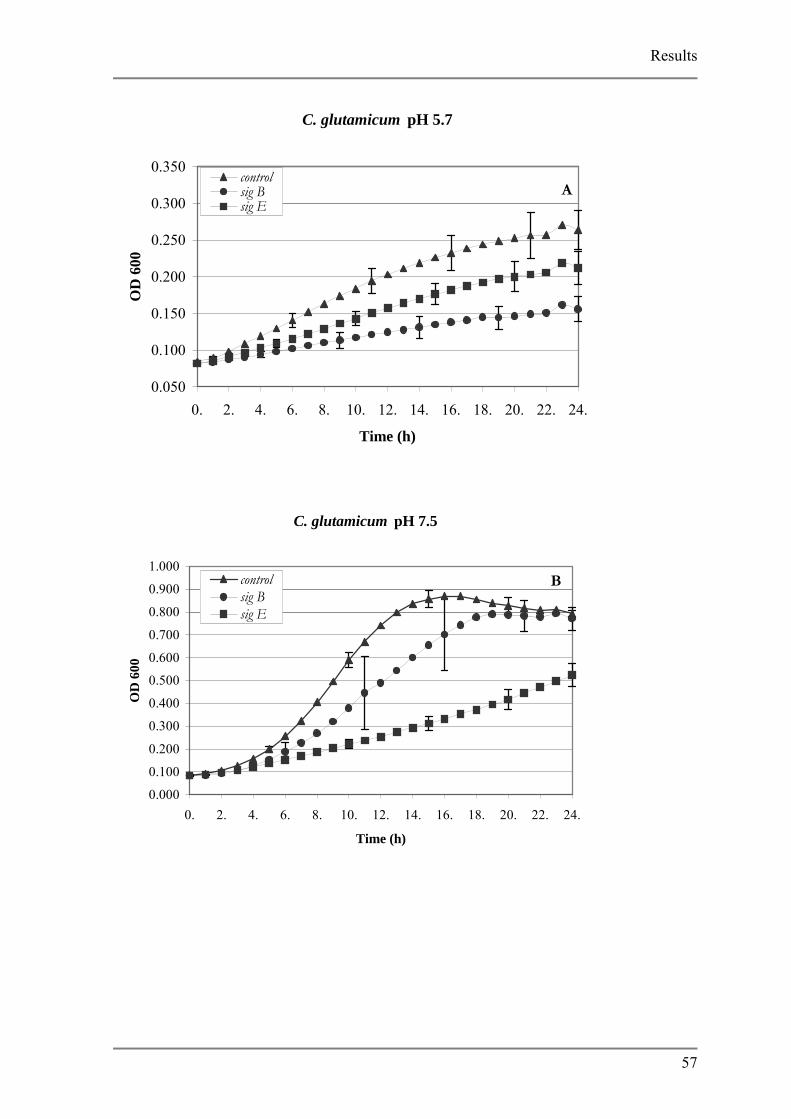
List of Figures FIG. 1.1: CHEMISTRY BEHIND SYBR GREEN I DETECTION...................................................................7 FIG. 2.1 CONSTRUCTION OF GENE DISRUPTION MUTANTS ..................................................................28 FIG. 3.1 C. AMMONIAGENES ACID ADAPTED MUTANTS........................................................................34 FIG. 3.2 S. EQUORUM ACID ADAPTED MUTANTS.....................................................................................36 FIG. 3.3 K. PALUSTRIS PH ADAPTED MUTANTS.......................................................................................37 FIG. 3.4 C. VARIABILE PH ADAPTED MUTANTS .....................................................................................38 FIG. 3.5 BACTERIA FORWARD AND REVERSE PRIMERS. .........................................................................40 FIG. 3.6 PRIMER SPECIFICITY. ...................................................................................................................41 FIG. 3.7 CELL STANDARD CURVES............................................................................................................45 FIG. 3.8 CELL COUNT VS. RIPENING.........................................................................................................46 FIG. 3.9 DEVELOPMENT OF THE MUTANT CONSORTIUM ON CHEESE AGAR .....................................48 FIG. 3.10 COMPARISON OF PH MUTANT K. PALUSTRIS WITH WILD TYPE ...........................................49 FIG. 3.11 ACID TOLERANCE RESPONSE OF C. GLUTAMICUM................................................................50 FIG. 3.12 CHANGES IN CYTOPLASMIC PH COMPARED TO OUTER PH ALTERATIONS........................51 FIG. 3.13 COMPARISON BETWEEN MICROARRAY ANALYSIS AND REAL TIME PCR RESULTS............53 FIG. 3.14 EXPRESSION OF IRON SIDEROPHORE IN COMPLEX AND MINIMAL MEDIA. .......................54 FIG. 3.16 GROWTH CURVES AND DOUBLING TIMES OF C. GLUTAMICUM, SIGB AND SIGE MUTANTS
..............................................................................................................................................................58FIG. 3.17 ACID SHOCK OF C. GLUTAMICUM, SIGB AND SIGE MUTANTS..............................................59
IV
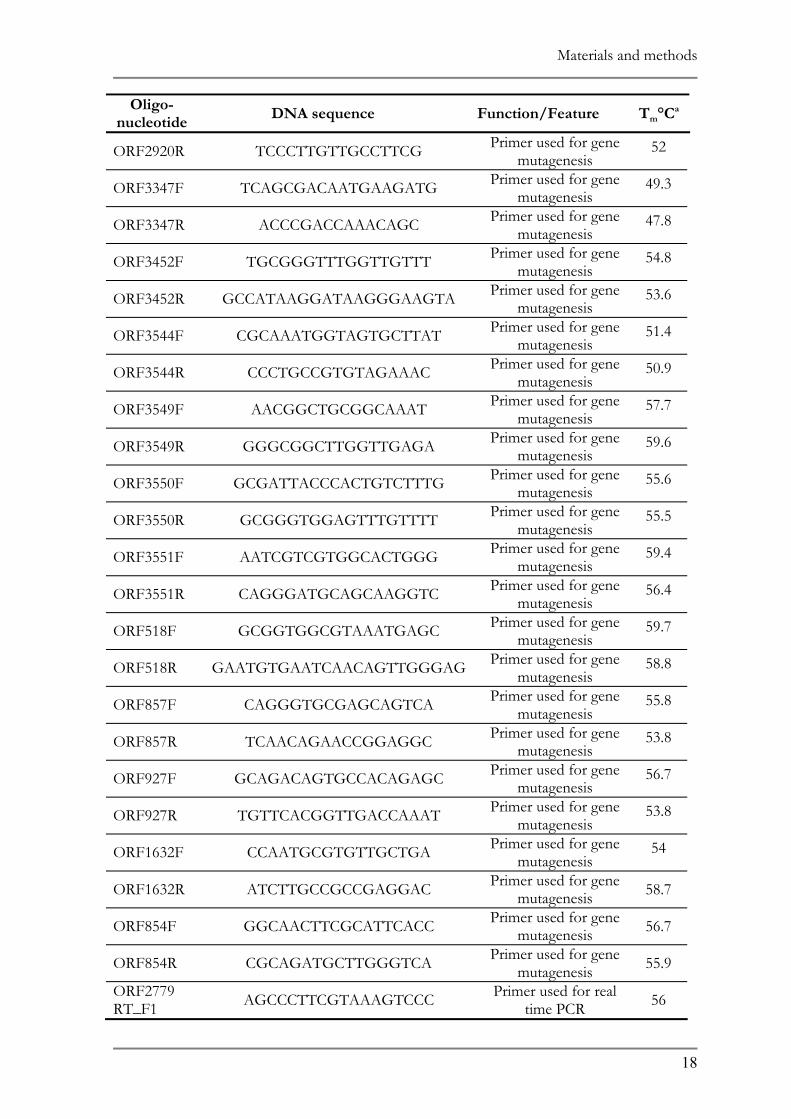
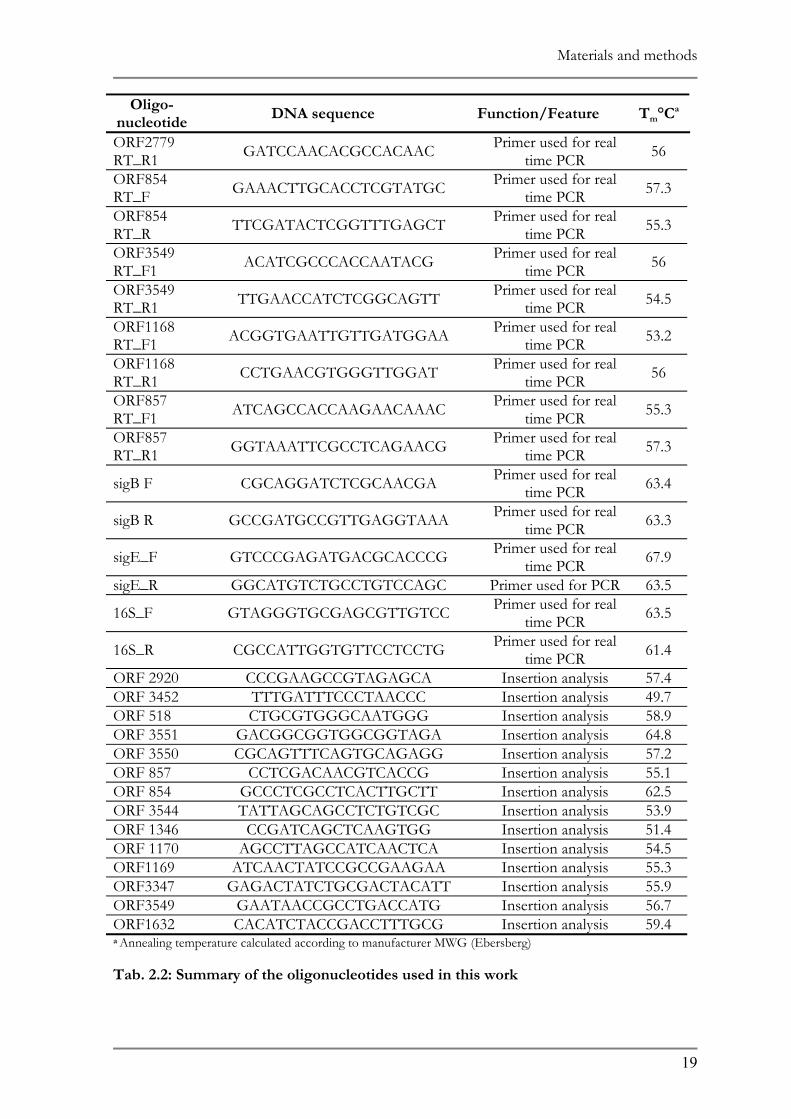
List of Tables
List of Tables TAB. 2.1: SUMMARY OF STRAINS AND THE PLASMIDS USED IN THIS WORK ........................................16 TAB. 2.2: SUMMARY OF THE OLIGONUCLEOTIDES USED IN THIS WORK.............................................19 TAB. 3.1 SUMMARY OF MUTATION FREQUENCIES AND MUTANTS OBTAINED. ..................................39 TAB. 3.2 COMPARISON OF AVERAGE PLATE COUNT WITH QUANTITATIVE REAL TIME PCR...........47 TAB. 3.3 COMPARISON OF AVERAGE YEAST PLATE COUNTS WITH QUANTITATIVE REAL TIME PCR
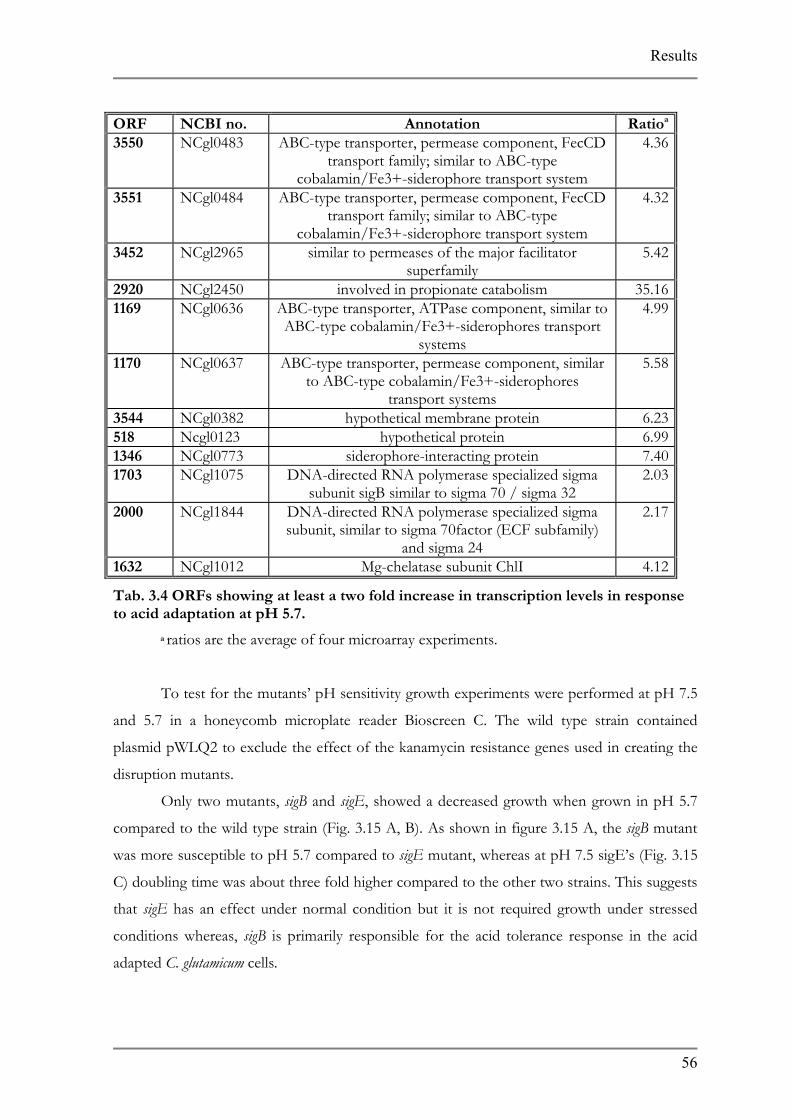
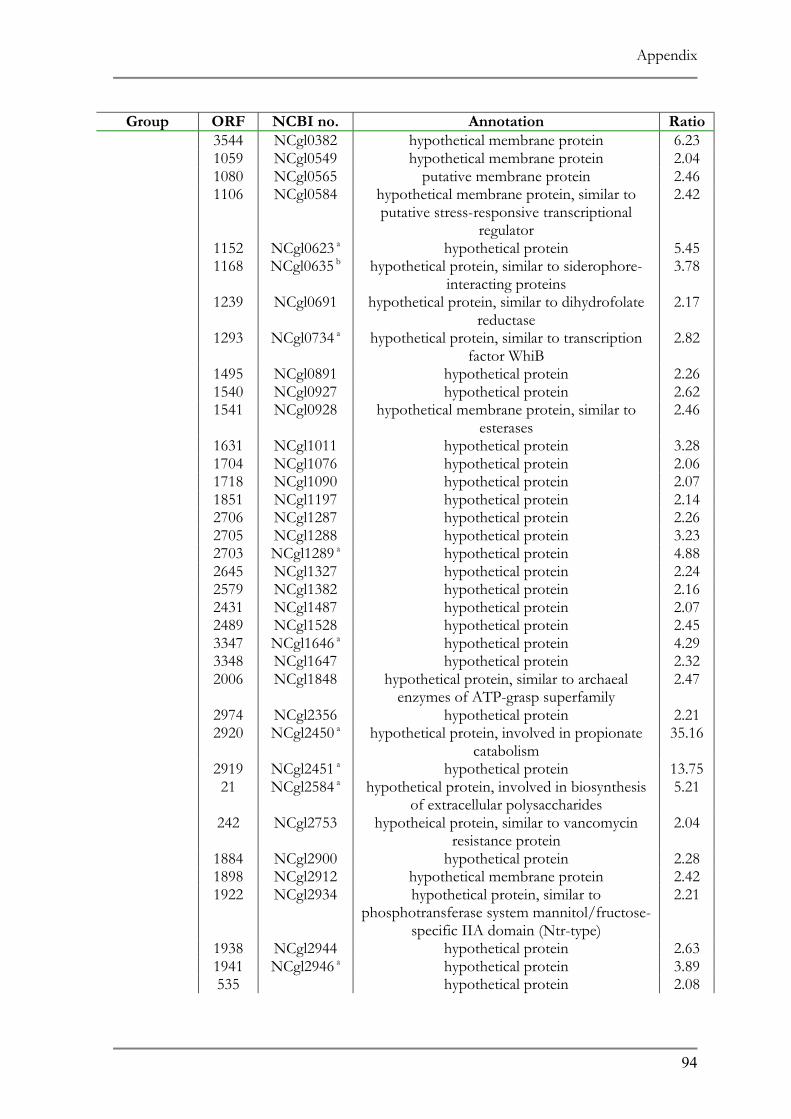
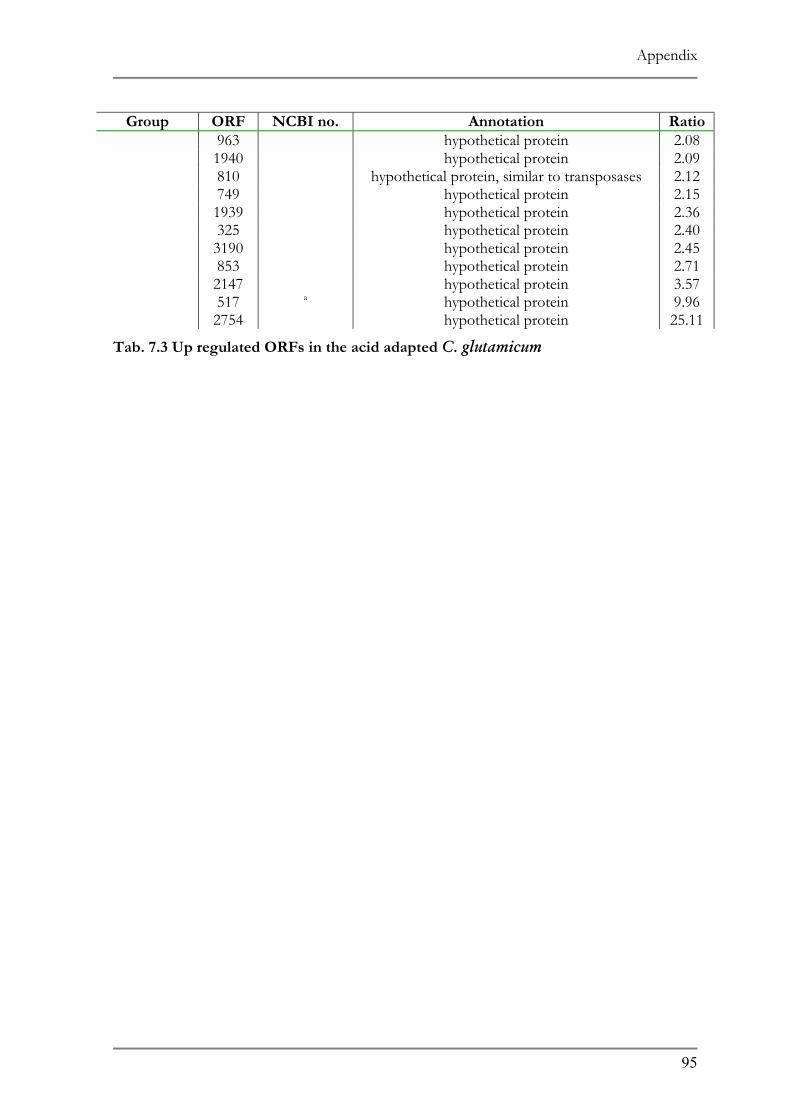
..............................................................................................................................................................48TAB. 3.4 ORFS SHOWING AT LEAST A TWO FOLD INCREASE IN TRANSCRIPTION LEVELS IN
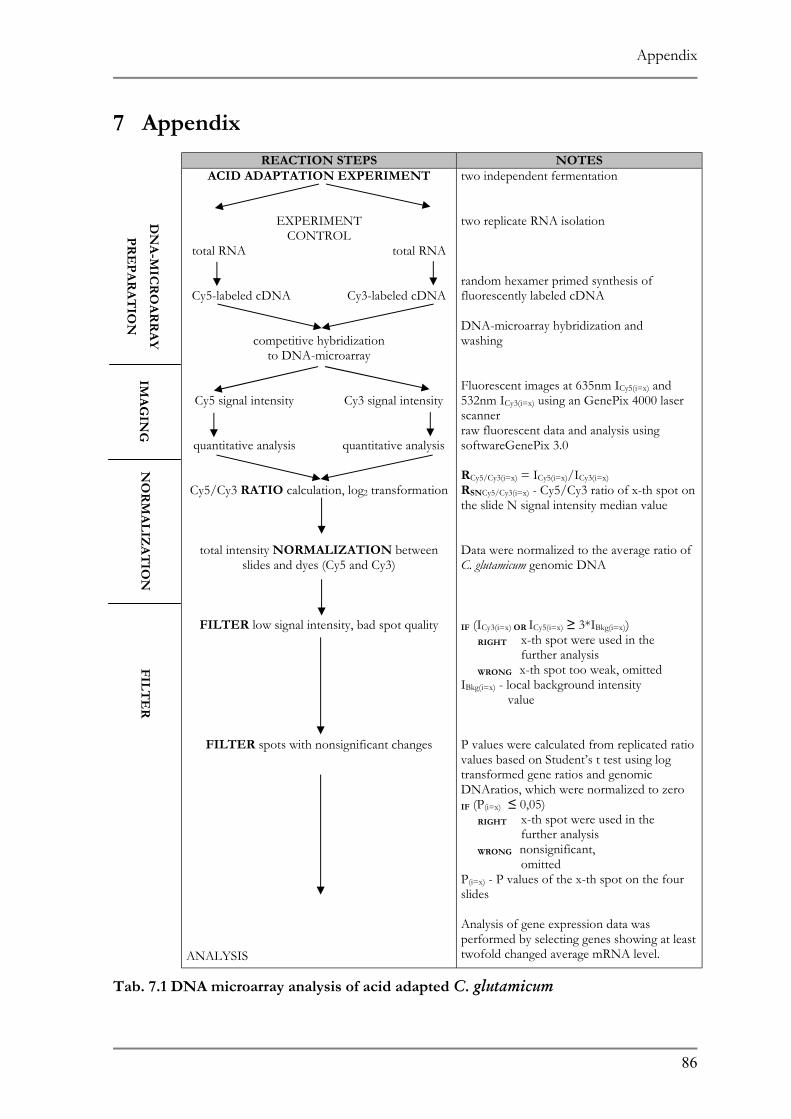
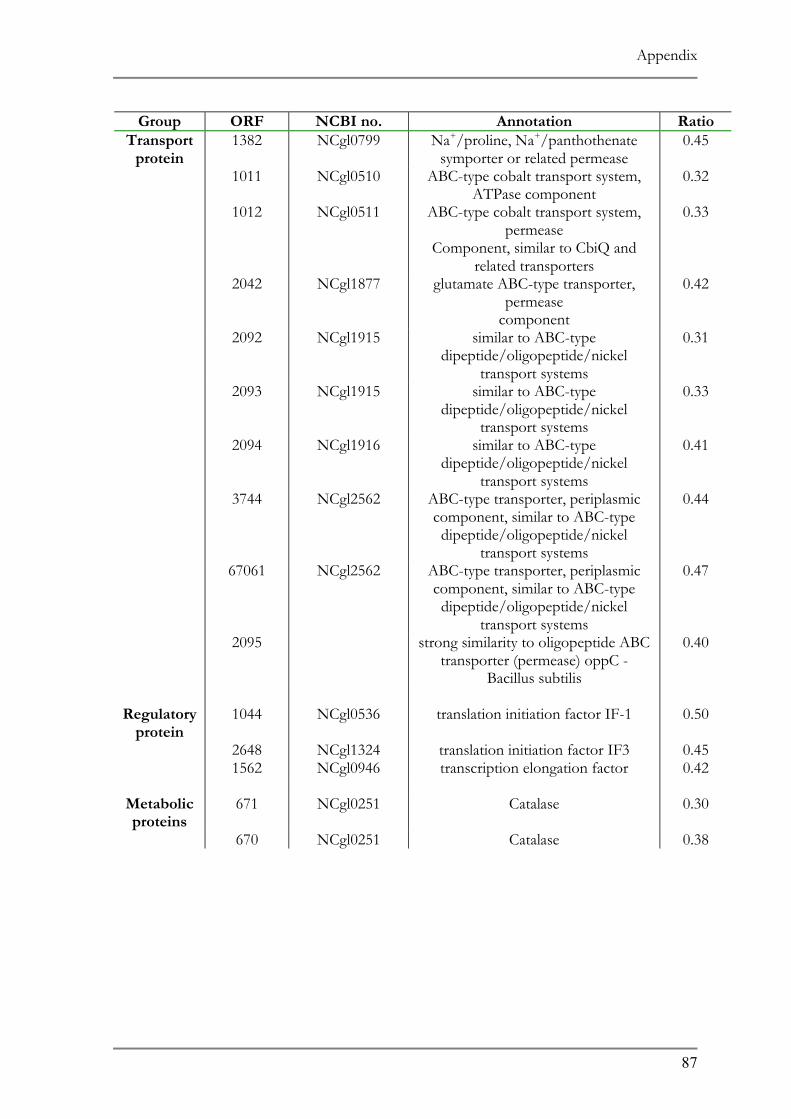
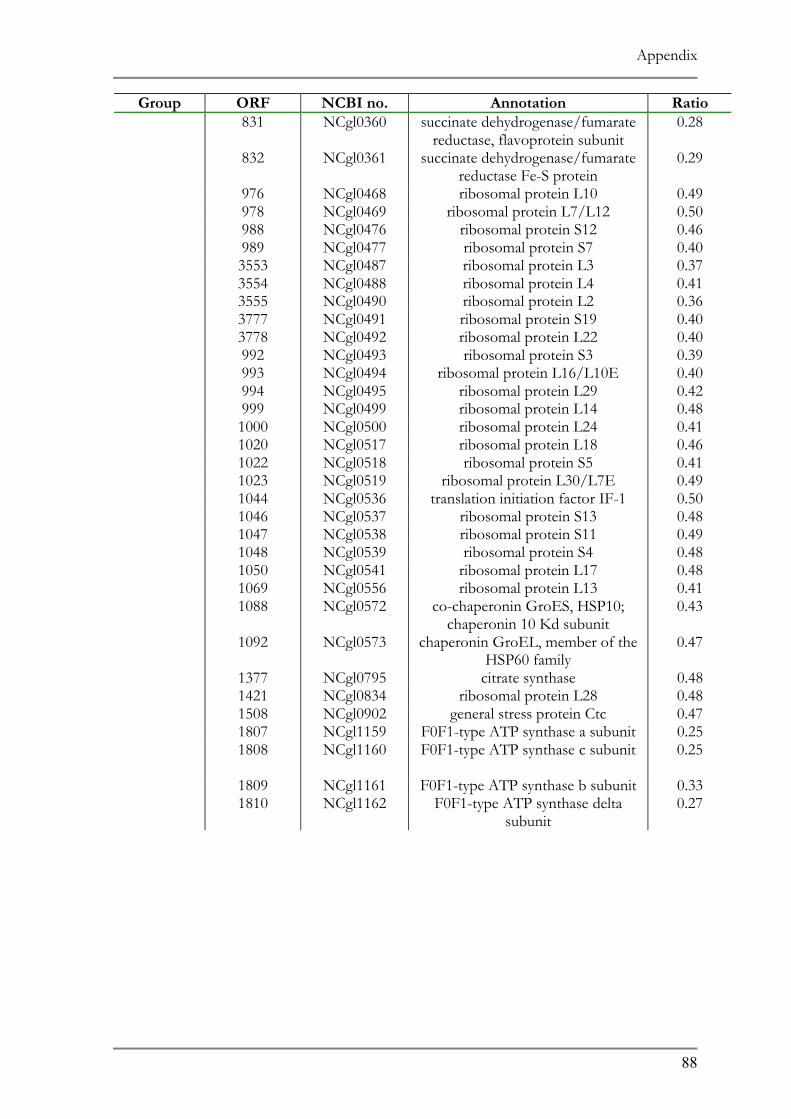
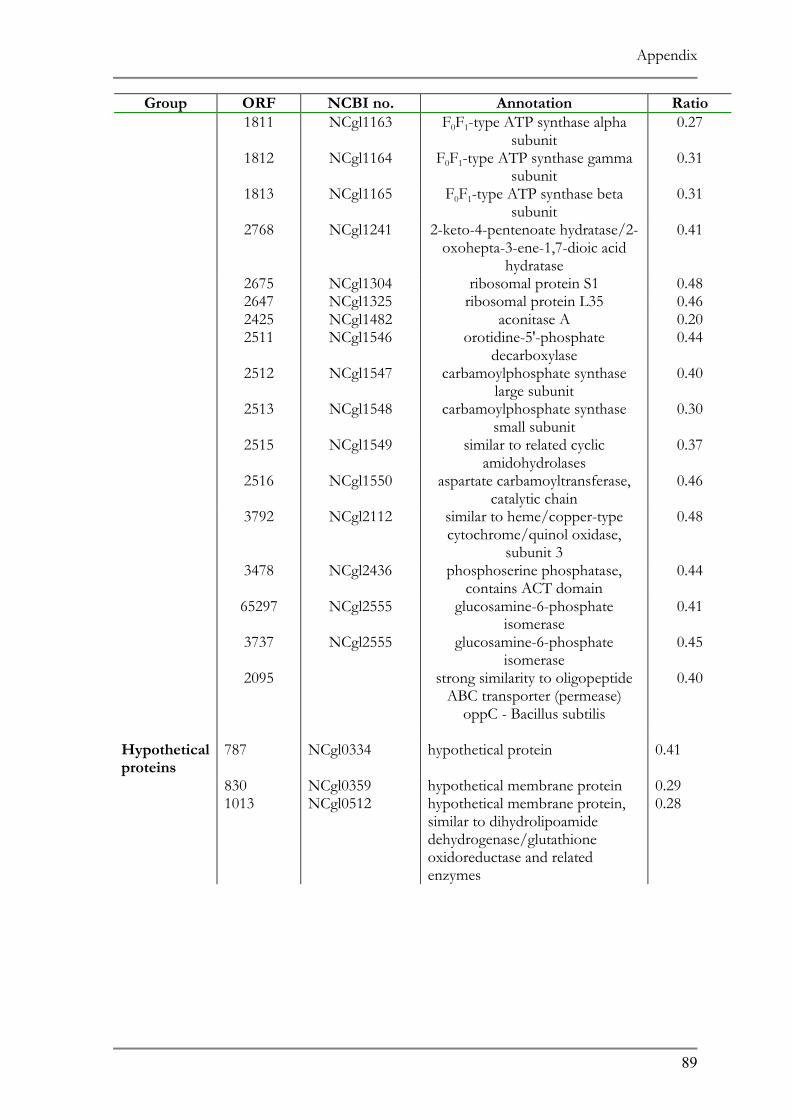
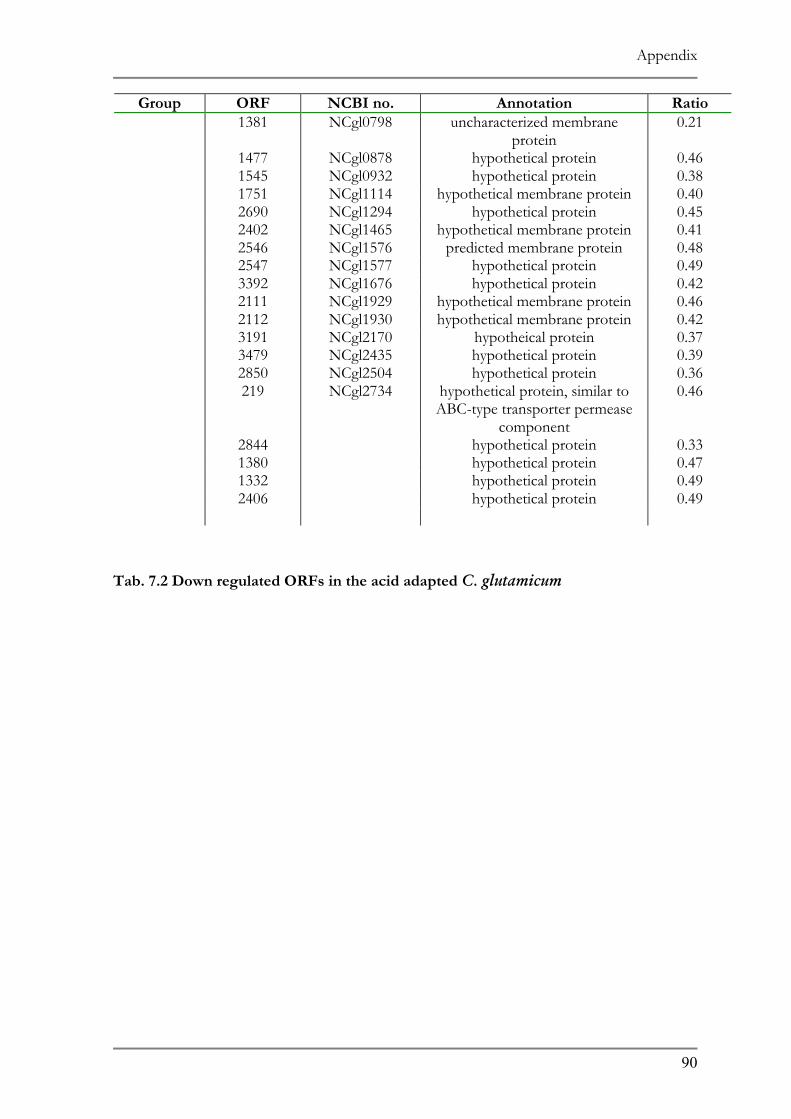
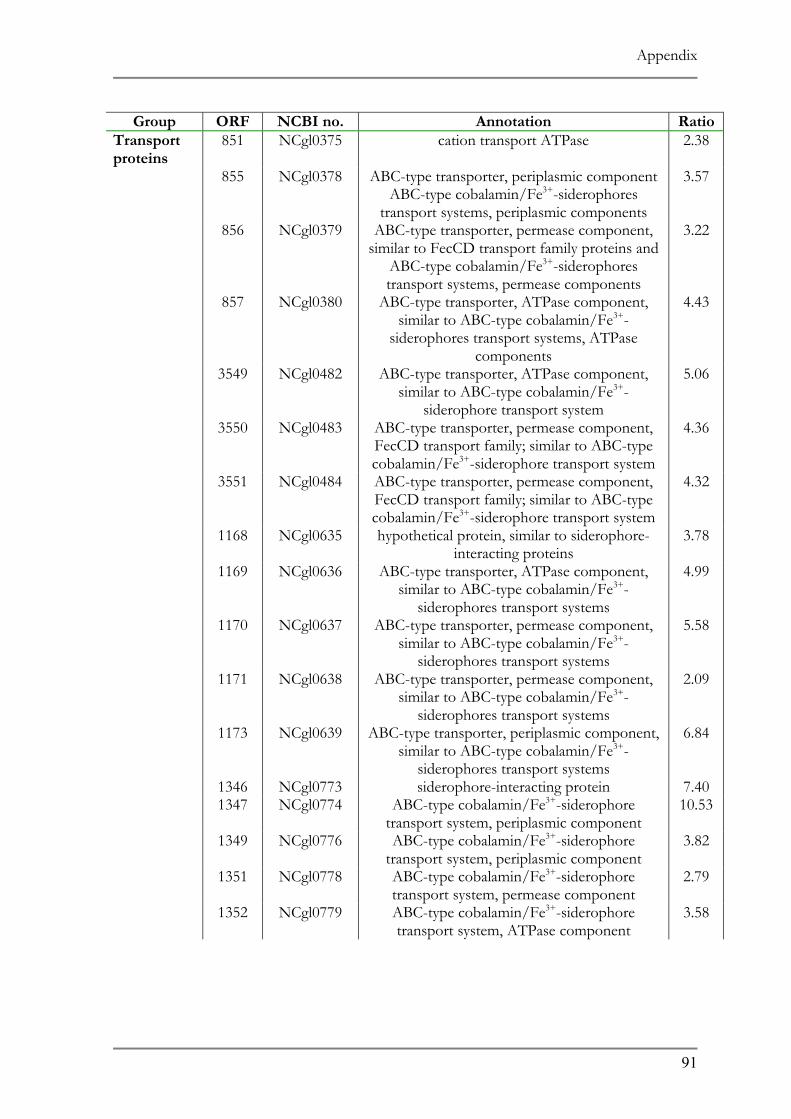
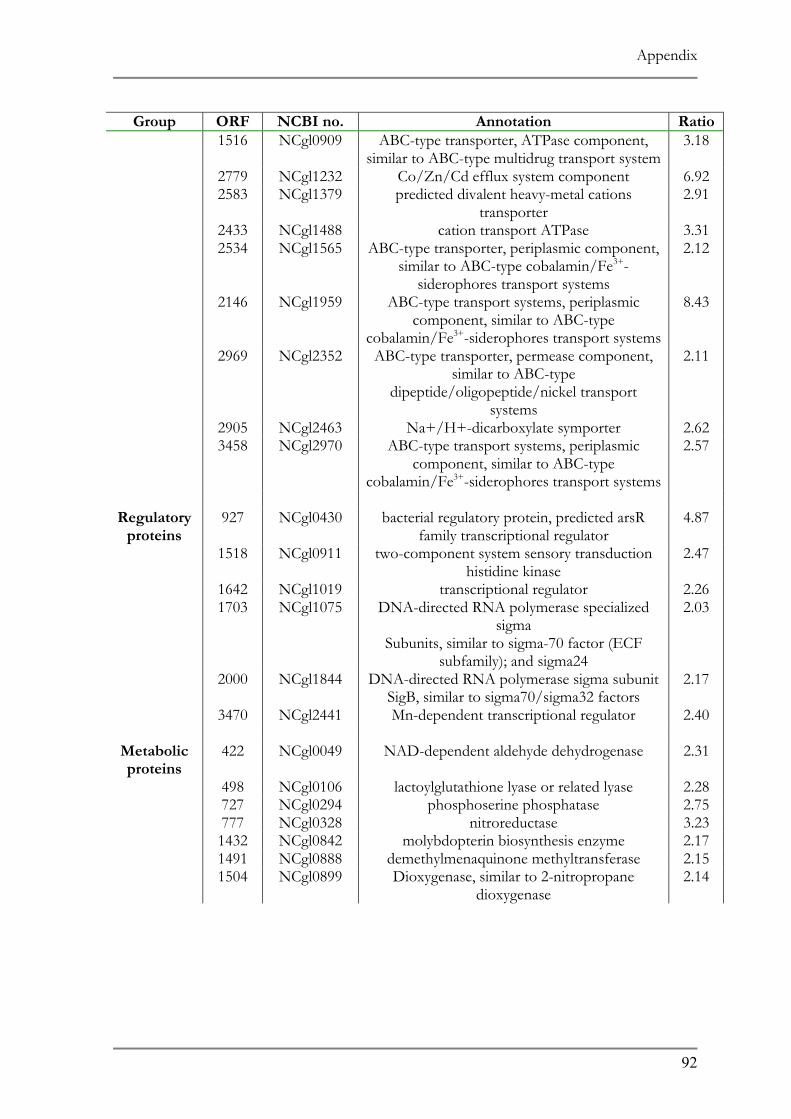
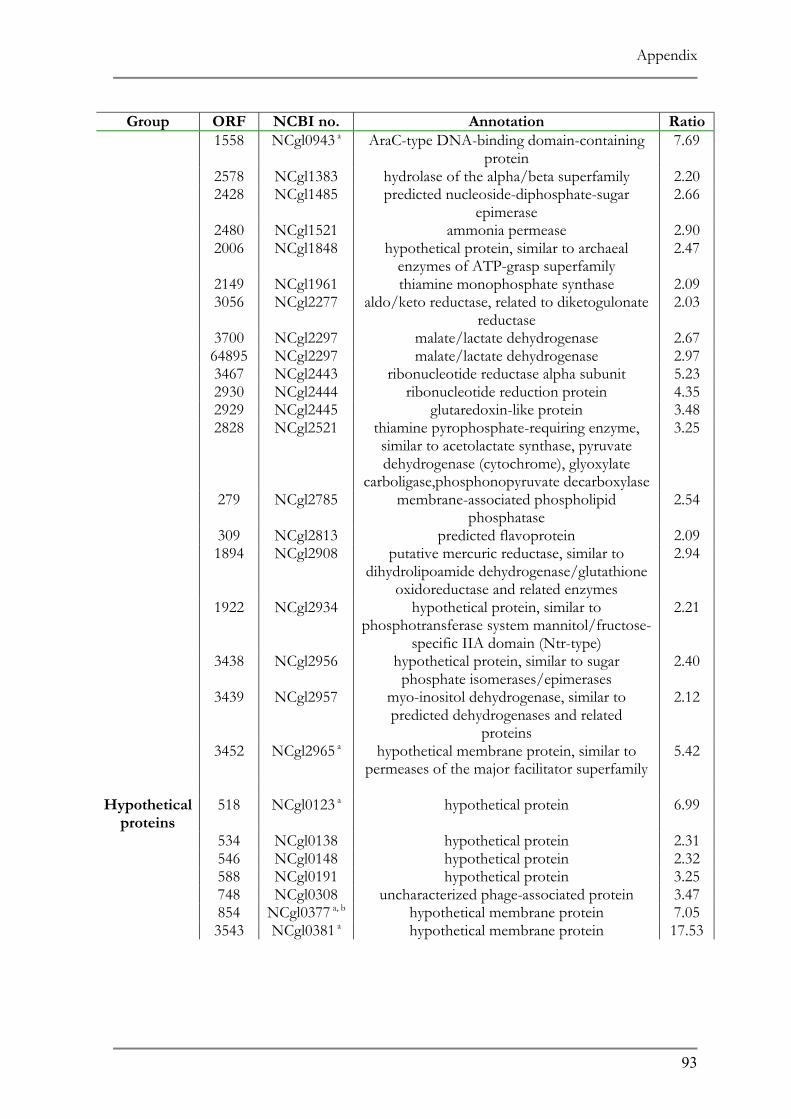
RESPONSE TO ACID ADAPTATION AT PH 5.7..................................................................................56 TAB. 4.1 SUMMARY OF PH ADAPTATION RESULTS .................................................................................61 TAB. 6.1 DNA MICROARRAY ANALYSIS OF ACID ADAPTED C. GLUTAMICUM ....................................86 TAB. 6.2 DOWN REGULATED ORFS IN THE ACID ADAPTED C. GLUTAMICUM ..................................90 TAB. 6.3 UP REGULATED ORFS IN THE ACID ADAPTED C. GLUTAMICUM .........................................95
V
Abbreviations
Abbreviations
ATCC American Type Culture Collection
DNA deoxyribonucleic acid
RNA ribonucleic acid
ds double stranded
nt nucleotides
bp base pairs
ORF open reading frame
× g relative centrifugal force
PCR polymerase chain reaction
CFU colony forming unit
pH negative decadic logarithm of the molar concentration of hydrogen
The research work and resulting Ph.D. thesis has been accomplished at the Institute of
Microbiology, Department für Grundlagen der Biowissenschaften, Wissenschaftszentrum
Weihenstephan (WZW), Technische Universität München under supervision of Prof. Dr.
Siegfried Scherer.
I am very grateful to my supervisor Siegfried Scherer for offering me the opportunity
to work at his Institute and for his support and constant encouragement for resolving
problems during the time of my work at the Institute.
My special thanks go to Dr Wendisch Volker from the Forschungszentrum Jülich for
kindly performing the DNA microarray experiments of Corynebacterium glutamicum. I would
especially like to thank Peter Satorhelyi for the fermentation experiments of Corynebacterium
glutamicum which provided the foundations of our team work in analyzing the stress response
of Corynebacterium glutamicum. I would also like to thank him for his support and for providing a
team atmosphere in the lab.
I would like to thank the “Vereinigung der Förderer und Freunde des FML
Weihenstephan” for their financial support throughout my work and ARLA for funding this
project.
I am very grateful to Dr Felix von Stetten for introducing me to real time PCR and for
being my mentor at the beginning of my PhD work.
I would also like to thank my colleagues at the Institute for contributing one way or
another to this thesis and for providing a pleasant work atmosphere in the past four years.
I also want to say many thanks to my good friend Dr. Natasa Anastasov for lending
me support when I needed it.
Last, but not least I would like to thank my family for their constant support. My
infinite thanks go to my husband Günther for his never ending support and encouragement
throughout my work.
VII
Summary
Summary
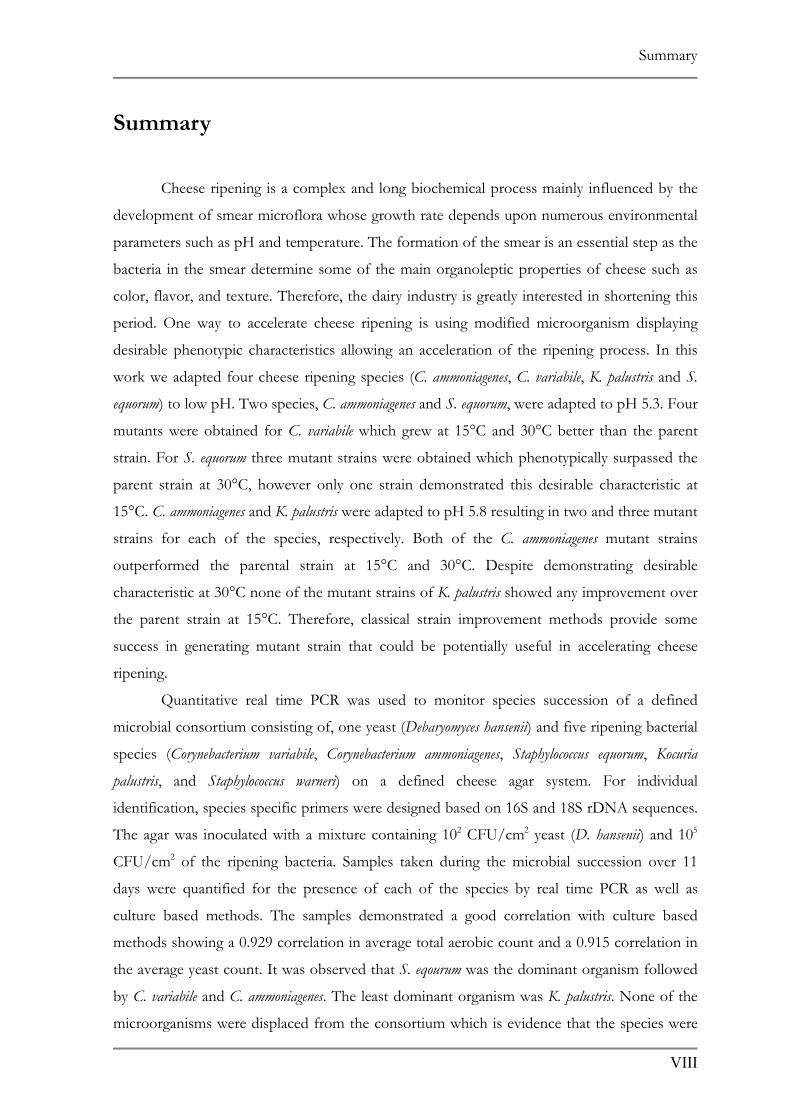
Cheese ripening is a complex and long biochemical process mainly influenced by the
development of smear microflora whose growth rate depends upon numerous environmental
parameters such as pH and temperature. The formation of the smear is an essential step as the
bacteria in the smear determine some of the main organoleptic properties of cheese such as
color, flavor, and texture. Therefore, the dairy industry is greatly interested in shortening this
period. One way to accelerate cheese ripening is using modified microorganism displaying
desirable phenotypic characteristics allowing an acceleration of the ripening process. In this
work we adapted four cheese ripening species (C. ammoniagenes, C. variabile, K. palustris and S.
equorum) to low pH. Two species, C. ammoniagenes and S. equorum, were adapted to pH 5.3. Four
mutants were obtained for C. variabile which grew at 15°C and 30°C better than the parent
strain. For S. equorum three mutant strains were obtained which phenotypically surpassed the
parent strain at 30°C, however only one strain demonstrated this desirable characteristic at
15°C. C. ammoniagenes and K. palustris were adapted to pH 5.8 resulting in two and three mutant
strains for each of the species, respectively. Both of the C. ammoniagenes mutant strains
outperformed the parental strain at 15°C and 30°C. Despite demonstrating desirable
characteristic at 30°C none of the mutant strains of K. palustris showed any improvement over
the parent strain at 15°C. Therefore, classical strain improvement methods provide some
success in generating mutant strain that could be potentially useful in accelerating cheese
ripening.
Quantitative real time PCR was used to monitor species succession of a defined
microbial consortium consisting of, one yeast (Debaryomyces hansenii) and five ripening bacterial
species (Corynebacterium variabile, Corynebacterium ammoniagenes, Staphylococcus equorum, Kocuria
palustris, and Staphylococcus warneri) on a defined cheese agar system. For individual
identification, species specific primers were designed based on 16S and 18S rDNA sequences.
The agar was inoculated with a mixture containing 102 CFU/cm2 yeast (D. hansenii) and 105
CFU/cm2 of the ripening bacteria. Samples taken during the microbial succession over 11
days were quantified for the presence of each of the species by real time PCR as well as
culture based methods. The samples demonstrated a good correlation with culture based
methods showing a 0.929 correlation in average total aerobic count and a 0.915 correlation in
the average yeast count. It was observed that S. eqourum was the dominant organism followed
by C. variabile and C. ammoniagenes. The least dominant organism was K. palustris. None of the
microorganisms were displaced from the consortium which is evidence that the species were
VIII
Summary
well adapted to their environment. It is concluded that real time PCR is a suitable method to
monitor species succession in a microbial consortium of limited complexity.
Microorganisms are constantly exposed to fluctuating environments. In order to
survive changing conditions due to temperature, nutrient limitation and other, microorganisms
adapt by switching on the synthesis of special proteins which in turn regulate gene expression.
Challenges due to an acidic environment are experienced by both, pathogenic and
fermentative organisms. In this study, microarray technology was applied to examine the
global gene expression profile of acid adapted Corynebacterium glutamicum, a biotechnologically
important microorganism. A total of 116 up regulated and 90 down regulated genes were
identified, representing 10% of the genes in the genome. Most of these genes can be classified
in the three categories transcriptional regulators, transport, and metabolism. Four operons
belonging to an ABC type cobalamin/Fe3+ siderophore transport system were observed
among the ORFs showing an upregulation. To characterize the gene expression of the
siderophore transport system at low pH iron availability was assessed in minimal and complex
medium. These studies resulted in lower gene expression in minimal medium compared to
complex medium suggesting an iron limiting conditions present at low pH in complex
medium.
To further characterize the function of the up regulated genes 17 disruption mutants
were generated which were phenotypically analyzed in respect to low pH. sigB and sigE
mutants showed a significant negative effect to low pH suggesting a function in acid
adaptation. No significant effects were observed for the other disruption mutants hinting to a
redundancy in the pH adaptation response of C. glutamicum.
IX
Zusammenfassung
Zusammenfassung
Die Käsereifung ist ein komplexer und langwieriger biochemischer Prozeß, der
hauptsächlich von der Entwicklung der Mikroflora der Käseschmiere beeinflußt wird und von
zahlreichen Umgebungsparametern, wie pH und Temperatur abhängig ist. Die
Zusammensetzung der Schmiere ist insofern bedeutsam, als sie für die meisten sensorischen
und optischen Eigenschaften des Käses, wie Geschmack, Farbe und Textur verantwortlich ist.
Aus diesem Grund zeigt die milchwirtschaftliche Industrie ein besonderes Interesse an der
Verkürzung der Reifungszeit. Eine mögliche Methode den Reifungsprozess zu beschleunigen
ist die Verwendung speziell modifizierter Mikroorganismen, die dennoch die gewünschten
phänotypischen Eigenschaften aufweisen. Im Verlauf dieser Arbeit wurden vier an der
Käsereifung beteiligten Spezies, C. variabile, C. ammoniagenes, S. equorum und K. palustris, an
niedrige pH-Werte adaptiert. Die Arten C. ammoniagenes und S. equorum wurden an pH 5,3
adaptiert. Für C. variabile ergaben sich vier Mutanten, die bei 15°C und 30°C ein besseres
Wachstum aufwiesen als die Ausgangsstämme. Im Fall von S. equorum wurden drei Mutanten
gefunden, die phänotypisch den Ursprungsstamm bei 30°C übertrafen. Allerdings zeigte nur
ein Stamm die gewünschte Eigenschaft bei 15°C. C. ammoniagenes und K. palustris wurden an
pH 5,8 adaptiert, woraus zwei bzw. drei mutierte Stämme resultierten. Beide Stämme von C.
ammoniagenes übertrafen den Ursprungsstamm bei 15 bzw. 30°C. Die wünschenswerten
Eigenschaften der K. palustris zeigten sich jedoch nur bei 30°C und ergaben keine
nennenswerte Verbesserung gegenüber dem Ausgangsstamm bei 15°C. Aus diesen
Ergebnissen folgt, dass die klassische Methode zur Verbesserung der Stämme mit gewissen
Einschränkungen für die Entwicklung von Stämmen zur Beschleunigung der Käsereifung
nützlich sein kann.
Im zweiten Teil der Arbeit wurde mittels quantitativer Real-Time-PCR die Sukzession
eines definierten mikrobiellen Konsortiums in einem definierten Käse-Agar-System bestimmt.
Das Konsortium bestand aus der Hefe Debaryomyces hensenii und fünf verschiedenen Arten von
Reifungsbakterien (Corynebacterium variabile, C. ammoniagenes, Staphylococcus equorum, S. warneri und
Kocuria palustris). Zur individuellen Identifizierung wurden spezies-spezifische Primer auf Basis
der 16S und 18S ribosomalen DNA-Sequenzen entwickelt. Der Agar wurde mit einer
Mischung aus 102 CFU/ml Hefe D. hansenii und 105 CFU/ml Reifungsbakterien beimpft. Über
einen Zeitraum von elf Tagen wurden Proben entnommen. Die Identifizierung und
Quantifizierung der Spezies erfolgte sowohl über Real-Time-PCR als auch über
Kultivierungsmethoden. Dabei zeigte sich eine gute Übereinstimmung der Ergebnisse aus
beiden Methoden, mit einer Korrelation von 0,929 bzw. 0.915 bei der Bestimmung der
X
Zusammenfassung
Gesamtkeimzahl bzw. Zellzahl der Hefen. S. equorum zeigte sich dabei als dominanter
Organismus, gefolgt von C. variabile, C. ammoniagenes und K. palustris. Keines der
Mikroorganismen wurde aus dem Konsortium verdrängt, was ein Hinweis auf ihre gute
Anpassung an die Umgebung ist. Die Ergebnisse lassen darauf schließen, dass Real-Time-PCR
eine geeignete Methode für das Monitoring von Spezies in einem Konsortium begrenzter
Komplexität ist.
Mikroorganismen sind ständig veränderlichen Umweltbedingungen ausgesetzt. Um
z.B. Temperaturschwankungen und Nährstoffmangel zu überdauern, adaptieren sie sich über
die Veränderung ihrer Genexpression. Saure Umgebungsbedingungen betreffen sowohl
pathogene als auch fermentative Mikroorganismen. In dieser Arbeit wurde mittels Microarray
Technologie das Expressionprofil eines säure-adaptierten Stammes von C. glutamicum als
einem biotechnologisch bedeutsamen Mikroorganismus untersucht. Insgesamt wurden 116
hoch regulierte und 90 herunter regulierte Gene nachgewiesen, die zusammen etwa 10% der
Gene im Genom ausmachen. Die meisten Gene konnten in folgende drei Gruppen eingeteilt
werden: Transkriptionsregulatoren, Stofftransport und Metabolismus. Unter den hoch
regulierten ORFs befanden sich vier Operons Fe3+-abhängiger ABC-Transporter. Um die
Expression der Siderophore unter niedrigen pH-Bedingungen zu testen, wurde die
Verfügbarkeit von Eisen in Minimal- und Vollmedium bewertet. Die Untersuchungen ergaben
eine niedrigere Expressionsrate im Minimalmedium vermutlich aufgrund Eisen-limitierender
Bedingungen in Vollmedium mit niedrigem pH.
Für eine weitere Charakterisierung der hoch regulierten Gene wurden 17 Deletions-Mutanten
hergestellt und phänotypisch im Bezug auf niedrige pH untersucht. Die sigB und sigE
Mutanten zeigten einen signifikanten negativen Effekt bei niedrigem pH-Wert. Deshalb wird
eine Bedeutung dieser Gene bei der Anpassung an sauere Umgebungsbedingungen vermutet.
Für alle anderen Deletions-Mutanten ergaben sich keine signifikanten Effekte, was ein
Hinweis auf die Redundanz des pH-Homöostase-Systems ist.
XI
Introduction
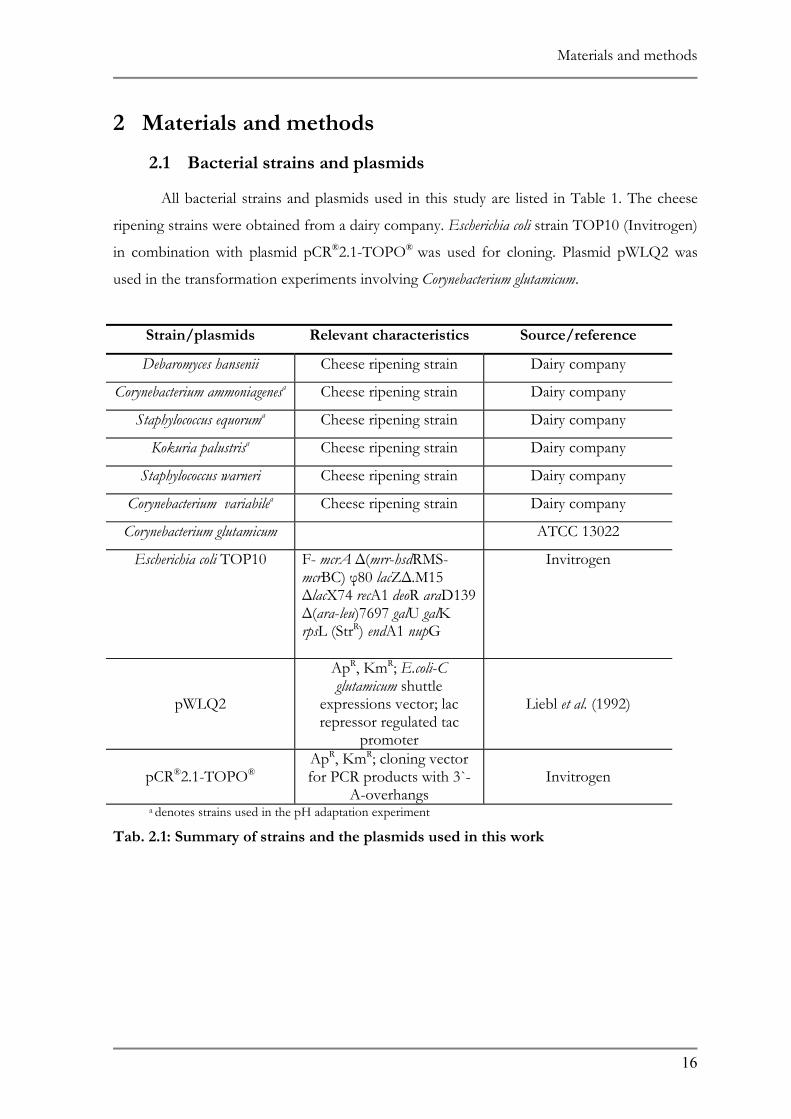
1 Introduction
Microorganisms are essential components of all cheese varieties and play an important
role in both cheese manufacture and ripening. During cheese ripening complex interactions
occur between individual components of the cheese flora. Environmental factors such as pH,
temperature and water activity within the cheese also contribute to these interactions.
Elucidations in the time dependent changes in the microorganism community provide a better
understanding in the ripening process (10). Most of the population analysis methods in
studying microbial interactions describe the isolation and identification of the “most
predominant” species (48) and provide semiquantitative information by reporting the
frequency of isolation of specific organism (58). In this work we describe a novel molecular
technique, quantitative real time PCR, which addresses these limitations in analyzing
population dynamics.
Cheese manufacture involves the transfer of the developed microflora from mature
ripened cheeses to young cheeses by a method of old young smearing. By this process not
only the desired microflora but, undesired microorganisms such as Listeria monocytogenes are
transferred capable of growth at low pH and temperature. Initial acidity of the cheese
influences the development of the bacterial flora which contributes to cheese ripening through
the production of metabolites that are responsible for the characteristic flavor, color and
texture of cheese (101). Therefore, the dairy industry is greatly interested in accelerating the
development of cheese flavor characteristics and at the same time producing a biologically safe
product. Until recently, most of the efforts concentrated on improving the performance of
starter culture. However, there have not been any studies described in accelerating cheese
ripening through the adaptation of cheese ripening species.
Bacteria are constantly exposed to changing environmental conditions. Challenges due
to an acidic environment are experienced both by fermentative and pathogenic organism.
Food fermentative organisms encounter acidic condition during industrial processes. In order
to achieve their effect probiotic microorganisms also have to survive the transit through the
digestive tract. Bacteria survive acid stress by turning on specific stress regulators which in
turn coordinate the expression of genes altering different cell processes (145). In order to
identify regulators and regulatory network in acid stress we analyzed the acid adaptation
response of Corynebacterium glutamicum a biotechnologically important organism using DNA
microarray technology.
1
Introduction
1.1 Microbial composition of surface smear-ripened cheese
Smear ripened cheeses are produced in large quantities in various European countries
(10) and are characterized by the formation of a viscous red-orange colored smear comprised
of a complex mixture of yeast and bacteria producing a rich aromatic piquant flavor (48, 124).
The traditional method of cheese inoculation is the old-young smearing, where the surface
flora of mature ripened cheeses is washed off with a brine solution that is later used to
inoculate the surface of young cheeses. In general, smear ripened cheeses are soft or semi-soft
in texture as in Limburger, Tilsit and Romadour (13, 124) but, some hard cheeses such as
Gruyère, Beaufort and Comté also belong to the family of smear ripened cheeses.
The microbiology of the smear is complex and poorly understood. There have been
numerous attempts to determine the composition of the microbial consortium growing on the
cheese (21, 45, 46). Yeasts, such as Debaryomyces hansenii and Geotrichum candidum are the
predominant organism identified at the early ripening stages due to their tolerance to low pH.
Yeasts are also strong utilizers of lactic acid causing a decrease in acidity and promoting the
growth of bacteria whose proteolytic and lipolytic activities are essential for cheese ripening
(49). Several studies have shown coryneforms comprised of Arthrobacter, Corynebacterium,
Microbacterium, Rhodococcus, and Brevibacterium as the dominant bacteria found on smear ripened
cheeses (21). There is evidence that other genera such as Staphylococcus and Micrococcus also play
a role in ripening (28) and Staphylococcus being the major organism found in the early ripening
stages being replaced by coryneform bacteria only at later stages (10, 11)
1.1.1 Yeast
The low pH, relative low moisture, high salt content and low temperature promote the
growth of yeast on the surface of smear ripened cheeses. Yeast grow early in the ripening
stages metabolizing lactate, deaminating amino acids thereby, contributing to the de-
acidification of cheese. D. hansenii is the dominant yeast isolated from virtually all cheeses such
as Tilsit, Romadour Limburger (51). The other important species are Yarrowia lipolytica,
Kluyveromyces lactis, and G. candidum. Yeast contribute positively to flavor and texture
development through enhanced enzyme activity resulted from an increase in surface pH. The
increase in pH modifies the rheological properties of the cheese resulting in a soft body which
is a typical characteristic of most type of this cheese (20). Yeast also produce stimulatory
growth substances which appear to promote the growth of certain bacterial species (147).
According to studies performed on Limburger cheese, yeast produce a substantial amount of
panthotenic acid, niacin, and riboflavin which were shown to promote the growth of B. linens
(20).
2
Introduction
1.1.2 Coryneforms
Coryneforms are Gram and catalase positive, non-spore forming and generally
nonmotile rods. Exponentially growing cells are pleomorphic, showing the presence of
irregularly shaped rods including wedged, club and curve shaped. Coryneform bacteria
(Arthrobacter, Brevibacterium; Corynebacterium, Brachybacterium, and Microbacterium) are comprised of
various taxa belonging to the Actinomycete branch of Gram-positive bacteria. Coryneforms
are ubiquitous in nature tolerating high salt concentration therefore, numerous species have
been isolated from cheese samples particularly from Tilsit (20). As seen by Brevibacterium linens,
coryneforms cannot grow under pH values of 6 (15, 41). B. linens is thought to be one of the
most important ripening bacteria found on cheeses due to its proteolytic and lypolytic
activities and biochemical characteristics that influence ripening and final characteristics of
smear ripened cheeses (123). Other coryneform species have been isolated aside from B. linens
such as Corynebacterium ammoniagenes, Corynebacterium variabile, Corynebacterium casei, Microbacterium
gubbeenense, Arthrobacter nicotianae, and Brachybacterium alimentarium (13, 21, 136, 144).
Corynebacterium spp. are the major components on bacterial smear ripened cheeses (13, 21, 100,
112). They are important in cheese ripening due to their production of sulphur containing
compounds such as methanethiol which is an important flavoring compound found on Tilsit,
Limburger and Appenzeller (19).
1.1.3 Staphylococci and micrococci
There is evidence that beside the coryneforms other genera such as Staphylococcus and
Micrococcus play an important role in ripening (11, 28, 72, 144). Micrococcus is a high-GC content
organism and is included in the actinomycetes branch of the eubacteria, while staphylococci
have a low GC content and are included in the clostridial branch.
Staphylococci are more important than micrococci, with S. equorum, S. xylosus S.
saprophyticus, and S. caseolyticus being the dominant species isolated from cheese (20). Among
different French and German cheeses, S. equorum was the dominant bacterium isolated from
the Staphyloccoccus spp. (13, 28). Due to their tolerance to high salinity staphylococci are the
major organism found early in ripening and are replaced by coryneforms some days later (21).
The most dominant micrococci appear to be Kocuria varians and Micrococcus luteus.
1.2 Natural adaptation of cheese ripening bacterial strains to low pH
Traditionally, cheese production involves the transfer of ripening flora from mature
ripened cheeses to young cheeses. This process enables the transfer of desirable
3
Introduction
microorganisms but it can also transfer undesirable pathogens such as L. monocytogenes which
can develop on the cheese surface despite low temperature and pH. Initial acidity of the
cheese slow the development of the ripening microbial flora Therefore, there is great interest
from dairy industries to accelerate the ripening process and producing a biologically safe
product. In the next sections techniques developed to accelerate cheese ripening and classical
strain improvement will be presented.
1.2.1 Acceleration of cheese ripening
Cheese ripening involves a complex series of microbiological and biochemical events
which result in the development of flavor and texture characteristics of each variety (143). For
these reasons cheese ripening is slow and consequently an expensive process.
There have been numerous attempts to accelerate cheese ripening using non
recombinant techniques. One of them was elevating ripening temperature. Although ripening
temperature is the most important single factor determining flavor intensity, relatively few
studies have been conducted on the effect of elevated temperature on cheese ripening.
Ripening temperature influences the rate of proteolysis, lypolysis, cheese microflora, texture
and quality of cheese. Ripening at elevated temperatures up to 15°C has been recommended
for some cheeses like Cheddar. The drawback of this approach is an increasing risk of spoilage
and non specific ripening reactions leading to the production of off flavors (157).
Another method is the addition of exogeneous proteolytic enzymes to cheese,
increasing the enzyme pool which eventually helps in accelerating the rate of certain reactions
in cheese. However, there are certain limits to enzyme addition as a method for accelerating
enzyme ripening due to legal restrictions in the use of such enzymes in cheese making. Adding
these enzymes to cheesemilk directly is the best stage for their incorporation due to
homogeneous mixing of the enzyme with milk. The downside of this method is that most of
the enzymes degrade casein to peptides thereby decreasing the casein matrix leading to
difficulty in curd handling (89). Addition of micro-encapsulated enzyme in a phospholipids
liposome capsule is a better alternative, however there are high cost associated in liposomes
production making its application on large scale not feasible (143). The use of commercially
available enzyme preparations like Accelase, or Neutrase showed that cheese ripening time is
decreased in half. However, in using Neutrase flavor defects were reported due to excessive
proteolysis (89).
The use of attenuated starters together with primary starters provides an alternative
means of increasing enzyme pool in cheese curd without the drawback of exogenous enzyme
4
Introduction
addition. In addition to accelerating ripening, recent work has shown the potential of
attenuated starters in modifying flavor (84).
Starter lactococci contain proteinases and peptidases which degrade large peptides
derived from casein into small amino acids (52). During ripening this microorganism die and
lyse releasing these enzymes. Given to this fact another possible mechanism for acceleration
of cheese ripening is the autolysis of starter bacteria owing to the fact that lysis of starter cells
releases enzymes into the cheese matrix resulting in high levels of free amino acids and
reduction in bitterness due to the breakdown of hydrophobic peptides by peptidases.
Autolysis is strain dependent and can be accelerated by environmental factors such as
temperature, salt concentration and lactose depletion (40) .
The use of bacteriocins or bacteriocin producing starters in cheesemaking is a novel
approach for accelerating lysis (101). This involves the use of adjunct starter cultures
containing a plasmid encoding gene for bacteriocins.
In recent years attention has been focused on genetic engineering as a means of
producing starters expressing intracellular enzymes such as PepC, PepN, PepO, which play a
role in secondary proteolysis in cheese during ripening. Up to now several genetically
engineered strains have been created containing different enzymatic genes such as Lc. lactis,
Lb. delbruechi with reported increases in amino acid production during ripening as compared to
the wild type strain (30, 31). In the reported studies genetically modified organism seems to be
a very promising method for acceleration of ripening through the increase in the uniform
distribution of the enzyme pool throughout the cheese matrix. However, legal barriers,
consumer concern, and lack of knowledge of the importance of key or limiting lactococcal
enzymes in cheese ripening are the stumbling block to the successful adoption of genetically
modified starters in industrial settings.
1.2.2 Classical strain improvement
Genetically modified organisms present a reliable approach in cheese production due
to technologically high performing bacterial strains, possessing excellent organoleptic
characteristics and facilitating product innovation not possible to achieve with classical
techniques. However, classical methods can be applied readily in food industry whereas,
bioengineered organisms cannot.
Classical strain improvement involves genetic modification through natural adaptation
without direct human intervention. There are three ways that genetic modification through
natural adaptation can occur; (1) small local changes in the nucleotide sequence of the
genome, (2) intragenomic reshuffling of genomic segments of genomic sequences, (3) and the
5
Introduction
acquisition of DNA sequences from another organism (3). Most of the strain improvement
studies have dealt with the first method of spontaneous mutation due to its ease in selection.
Spontaneous mutation has been extensively performed in lactic acid bacteria such as
Lb. bulgaris. L. bulgaris is important in yogurt production by contributing to the typical yogurt
flavor and lowering pH values below 4.2. This acidification leads to the gradual increase in
acid and bitter taste of yogurt. In order to control this post acidification step it is necessary to
regulate the growth and development of L. bulgaris by controlling its energy metabolism. For
this reason L. bulgaris starter strains were screened for the presence of spontaneous Lac minus
mutants exhibiting little or no β-galactosidase activity. Such mutants were unable to grow in
milk as single strain without the addition of glucose and peptones. However, when grown in
mixed culture with S. thermophilus, L. bulgaris was able to grow without the addition of glucose.
This resulted in a mild and non post acidified yogurt product (57, 104).
Lactic acid bacteria are often used in a concentrated frozen or freeze dried form, but
freezing causes a decrease in cell viability. A study has shown that their resistance to freezing
can be increased by performing successive cycles of subcultivation of freezing and thawing
through natural adaptation (105).
1.2.3 Real Time PCR
Conventional culture based methods are time consuming, offer a poor sensitivity, are
open to interpretation errors and mostly depend upon the growth of the organism. Therefore,
in the last ten years numerous technologies have been developed to ease and accelerate the
enumeration and identification of microbial organisms. Polymerase chain reaction (PCR) has
been increasingly used in diagnostic and microbiology laboratories as a standard in detection
and identification of microorganisms (97) offering the advantage of being a fast, reliable and
reproducible method that is easy to handle. Real time PCR is a kinetic based identification
technique with the added advantage of online monitoring of amplicon generation thereby
eliminating post-amplification manipulations (26). Real time monitoring is achieved by labeling
either, primers, or oligonucleotide probes or the amplicon with fluorescent dye molecules.
These labels produce a signal change followed by hybridization to the amplicon. The
transmitted signal is correlated to the amount of amplicon present at each cycle and will
increase as the amount of amplicon increases.
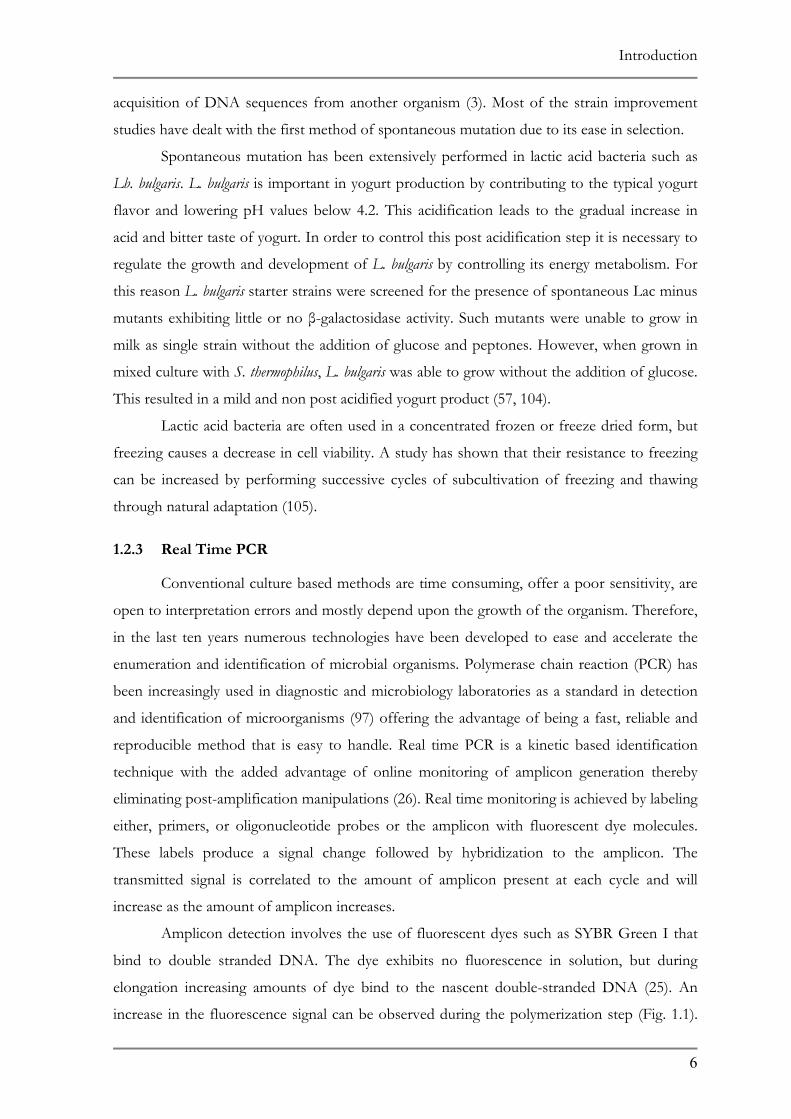
Amplicon detection involves the use of fluorescent dyes such as SYBR Green I that
bind to double stranded DNA. The dye exhibits no fluorescence in solution, but during
elongation increasing amounts of dye bind to the nascent double-stranded DNA (25). An
increase in the fluorescence signal can be observed during the polymerization step (Fig. 1.1).
6
Introduction
Fluorescence is measured at the end of the elongation step of every PCR cycle to monitor the
increase of DNA. The specificity of the reaction is determined solely by the primers.
Fig. 1.1: Chemistry behind SYBR Green I detection.
In solution SYBR Green I exhibit no fluorescence. During elongation increasing amount of dye molecules bind to the minor grooves of the double stranded DNA. The increase in signal is observed during polymerization.
The production of unspecific products is analyzed through the creation of an
amplicon melting curve. In this case the temperature is slowly increased above the melting of
the amplicon and fluorescence is measured. As the melting depends upon the nucleotide
composition of the amplicon, it is possible to identify the signal obtained from the correct
product which will distinguish it from amplification artifacts that melt at other temperatures.
In the last ten years there has been a tremendous increase in the usage of real time
PCR as identification tool in molecular diagnostics fields. The detection and enumeration of
pathogenic bacterial species in diagnostic samples is performed routinely in clinical fields
allowing a rapid report of patient infection status thereby induced a rapid response in
treatment. Detection of pathogenic bacteria is also important in the qualitative assessment of
food products. There have been numerous studies performed in quantifying and detecting
various food pathogens such as L. monocytogenes (69, 111), Staphylococcus aureus (70), and
Salmonella species (47, 54), oral pathogens such as Streptococcus mutans (160), Porphyromonas
gingivalis (96), and fermentative organism such as Bifidobacterium (27).
1.3 pH adaptation of Corynebacterium glutamicum
Bacteria periodically encounter life threatening stresses in a variety of hostile and
natural situations. For example in food processing bacteria encounter stresses such as heat
treatment during pasteurization, freezing, dehydration, salt treatment and production or
addition of acid (23).
One of the most widely encountered environmental factors by microorganism is acid
stress. Challenges due to an acidic environment are experienced by both pathogenic and
fermentative microorganisms. Pathogenic organisms encounter a low pH environment while
passing through the gastrointestinal tract, in the oral cavity as well as in macrophage
7
Introduction
phagosomes (32). Fermentative organisms are potentially exposed to low pH, e.g., during food
processing or in anoxic environments. Therefore, mechanisms allowing successful adaptation
of microorganisms to low pH are essential for survival and proliferation. Acid adaptation is
also an important factor in the virulence of pathogenic microorganisms and has significant
implication in food safety.
To increase survival chances due to sudden changes in pH, bacteria turn on a
programmed mechanism that includes the synthesis of stress inducible proteins which lead to
the regulation of gene expression (50). An adaptive acid response generated by moderately low
pH also enables bacterial cells to survive extreme acidity. This adaptive process, termed acid
tolerance response (ATR), has been extensively studied in a number of pathogenic and
Germany) 0.5 µM of each primer and 2 µl of cDNA were used. The cycling conditions were
40 cycles of 95°C for 15 s, 55°C 15 s and 72°C for 20 s preceded with a 15 min enzyme
activation at 95°C. For each amplification run, the calculated threshold cycle (Ct) of the 16S
30
Materials and methods
rRNA was used for normalization. The formation of secondary products was analyzed using
the melting curve function of the iCycler software version 3.0.
2.5.15 Iron availability assay
An iron availability assay was performed to assess the solubility of iron at low pH in
undefined complex growth media such as TSB and BHI compared to the defined minimal
medium CGXII. Four growth media were prepared; TSB, TSB +Fe containing 10 mg/L of
FeSO4·7H2O and protocatechuic acid to final concentration of 0.1mM, BHI, and CGXII.
CGXII was prepared according to Keilhauer et al. (82) except, protocatechuic acid was added
to a final concentration of 0.1mM. Protocatechuic acid acts as a chelator, facilitating the
bioavailability of iron in the growth medium. For all of the media pH was adjusted to 7.5 or
5.7. Hundred ml of medium at pH 7.5 and 5.7 were inoculated with 1 ml of overnight culture.
At mid-exponential growth phase (OD600 of 0.5), 10 ml cells were harvested by centrifugation
at 5000 x g for 5 min and pellets were immediately frozen in liquid nitrogen. The RNA
isolated from the cells was subjected to real time PCR analysis as described above.
2.5.16 Determination of growth characteristics of the deletion mutants
The growth characteristics of the mutants compared to the wild type strains were
determined using the honeycomb well plate reader Bioscreen C (Thermo Labsystems,
Dreieich, Germany). A 5 ml overnight culture was 50 fold diluted in TSB (pH 7.2) and 10 µl
were inoculated in honeycomb plates containing 240 µl of TSB at pH 7.5 or pH 5.7. The
plates were incubated (continuous shaking, 30°C) and OD600 measurements were obtained
every 15 minutes for a period of 24 h. The growth rates of the cultures were determined by
plotting and analyzing the change in OD600 over time using the Bioscreen C Growth Curve
software.
2.5.17 Acid shock assays
Acid shock was performed to determine the role of the disrupted gene on the survival
capabilities under acidic conditions. Hundred ml TSB pH 7.5 or 5.7 were inoculated with 1 ml
and 1.5 ml of overnight culture, respectively. At an OD600 of 0.5, 50 ml cells were harvested by
centrifugation at 5000 x g for 5 min. The cells were suspended in 50 ml TSB pH 4 and
incubated at 30°C for 30 min. 100 µl samples were removed before and after acid shock,
serially diluted in TSB pH 7.5 and plated on TSA plates. The percent survival was calculated
31
Materials and methods
by comparing the cell counts obtained following acid shock to those in the original pH 7.5 cell
suspension prior to acid shock.
2.6 Bioinformatics
The Blast algorithms (1) were used for similarity searches in the database available
through the National Center for Biotechnology Information
(http://www.ncbi.nlm.nih.gov/BLAST). Sequence alignments were performed using
ClustalW from the European bioinformatics institute (http://www.ebi.ac.uk/clustalw).
32
Results
3 Results
3.1 pH adaptation of smear cheese ripening species
Adaptation of the four ripening strains to low acid condition was performed using
agar pH gradient plates. The method used to adapt the strains to low pH is described in
section 2.4 (see material and methods). To provide a better overview of the results each of the
ripening strains are going to be discussed individually.
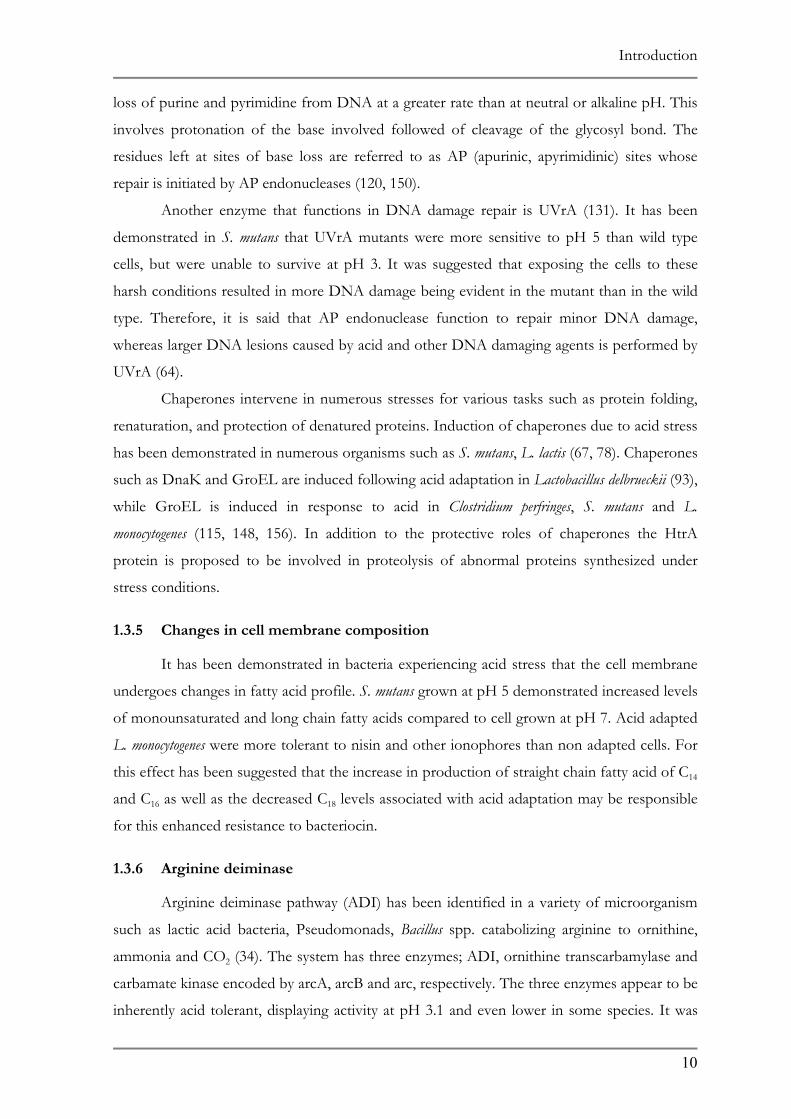
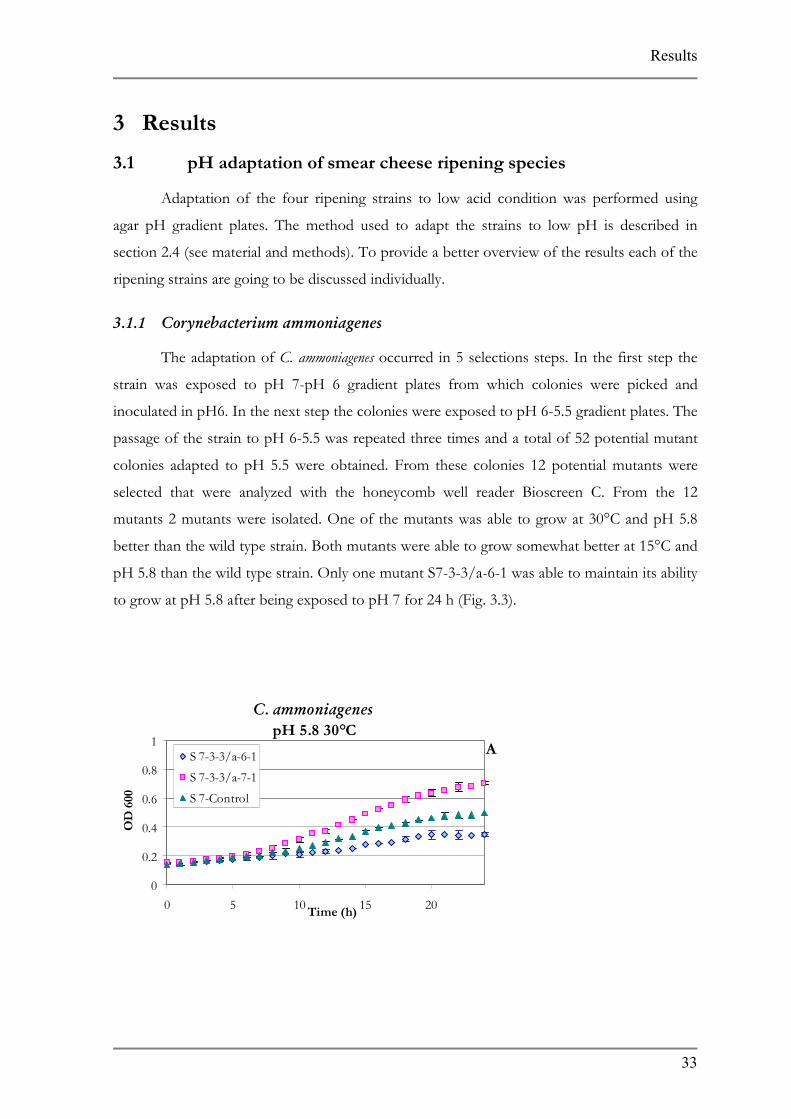
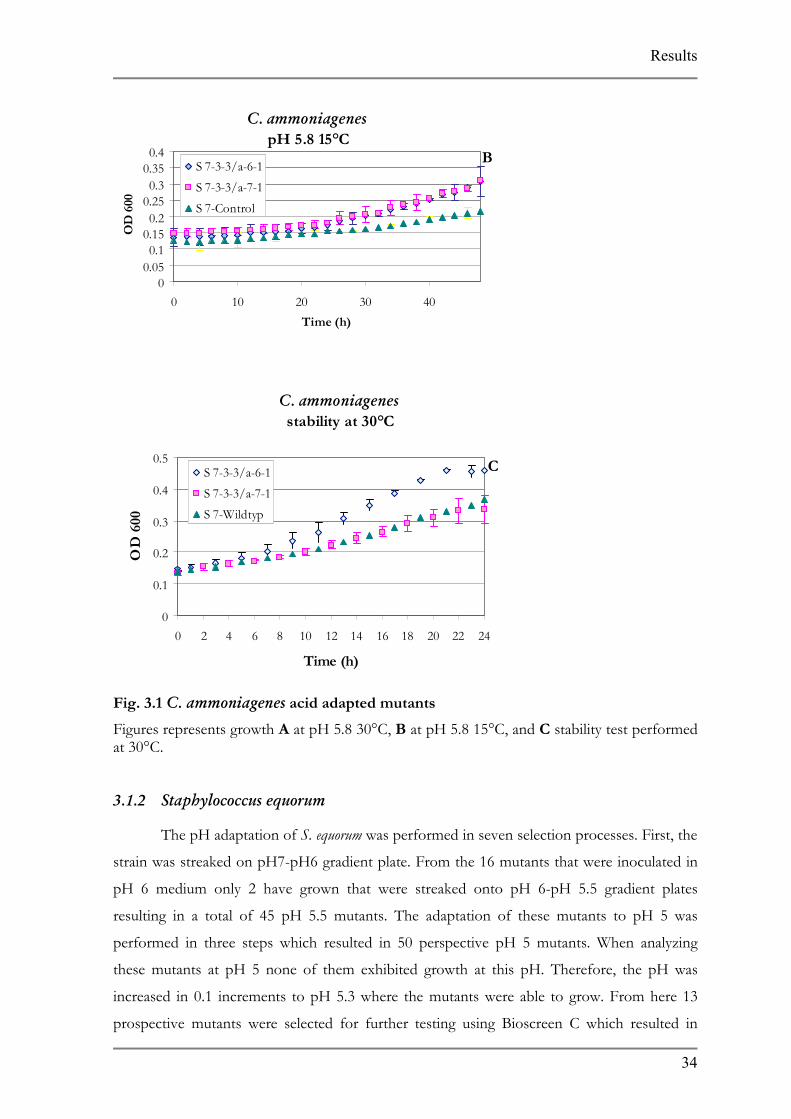
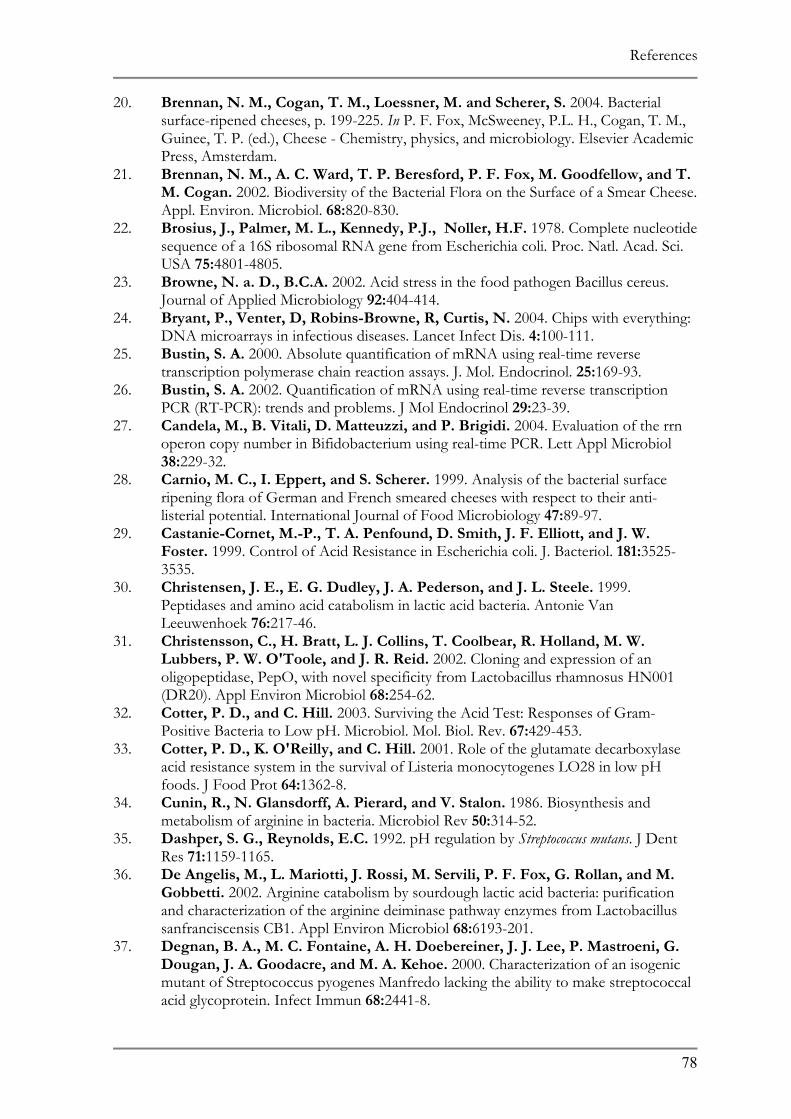
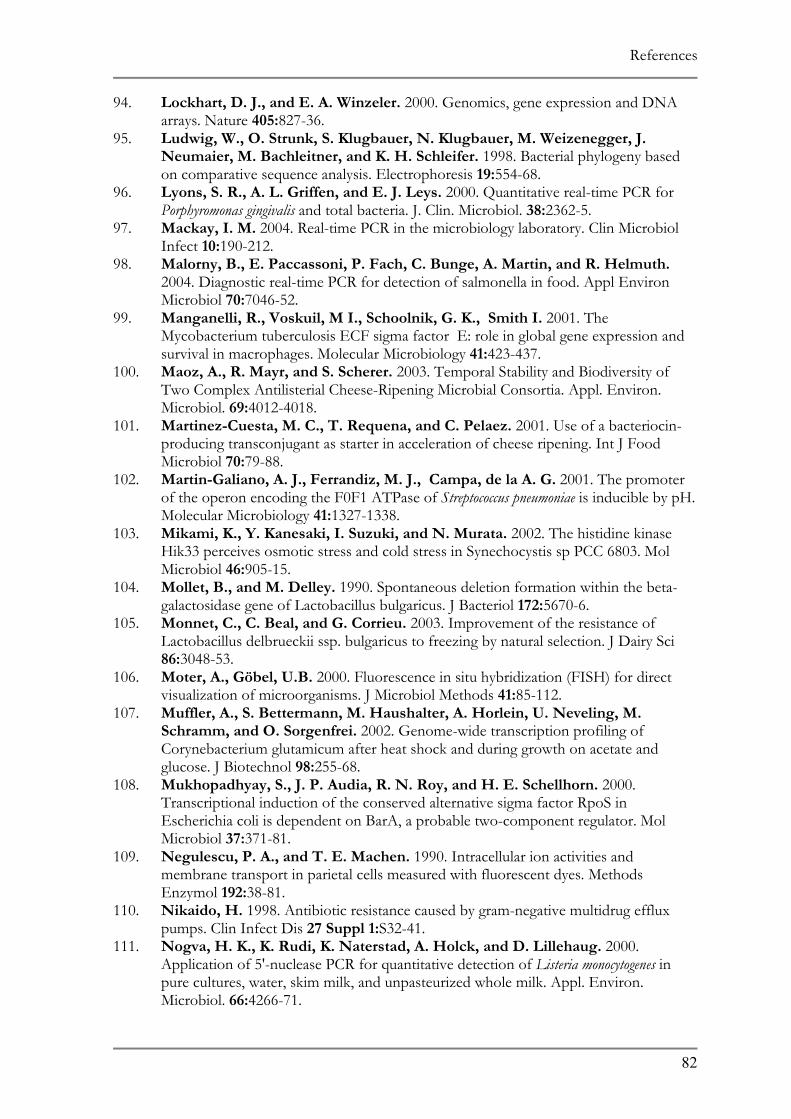
3.1.1 Corynebacterium ammoniagenes
The adaptation of C. ammoniagenes occurred in 5 selections steps. In the first step the
strain was exposed to pH 7-pH 6 gradient plates from which colonies were picked and
inoculated in pH6. In the next step the colonies were exposed to pH 6-5.5 gradient plates. The
passage of the strain to pH 6-5.5 was repeated three times and a total of 52 potential mutant
colonies adapted to pH 5.5 were obtained. From these colonies 12 potential mutants were
selected that were analyzed with the honeycomb well reader Bioscreen C. From the 12
mutants 2 mutants were isolated. One of the mutants was able to grow at 30°C and pH 5.8
better than the wild type strain. Both mutants were able to grow somewhat better at 15°C and
pH 5.8 than the wild type strain. Only one mutant S7-3-3/a-6-1 was able to maintain its ability
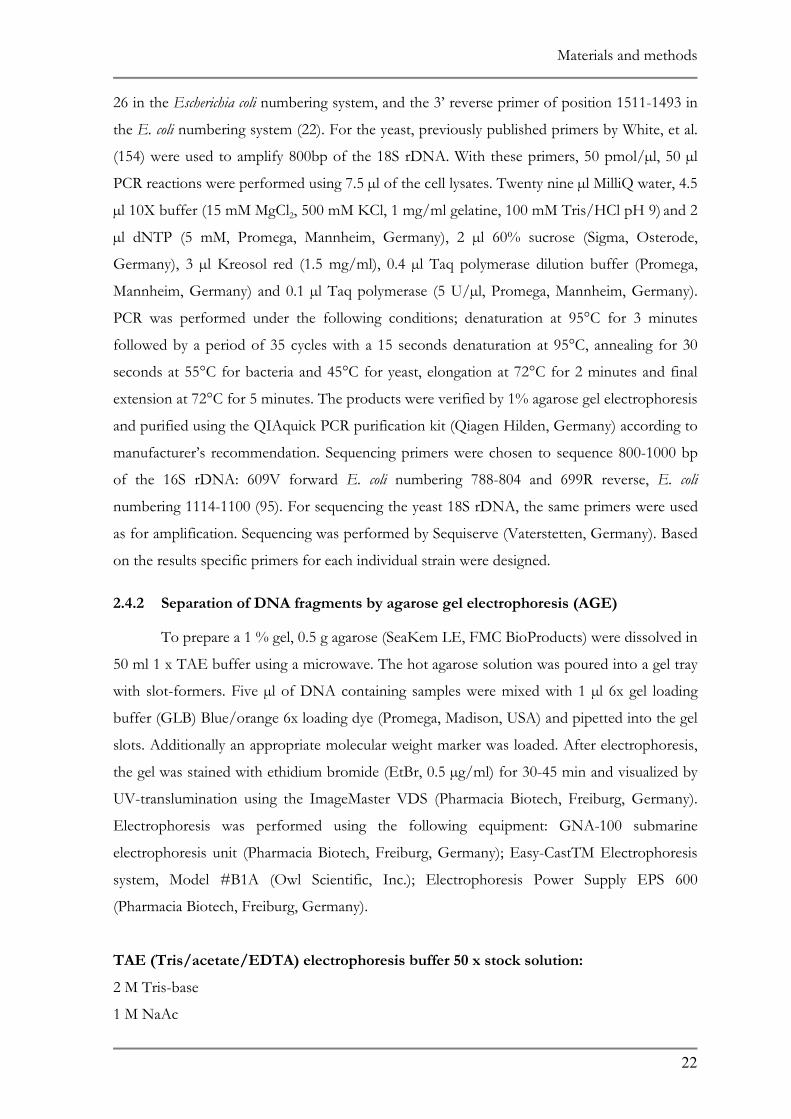
to grow at pH 5.8 after being exposed to pH 7 for 24 h (Fig. 3.3).
C. ammoniagenes pH 5.8 30°C
0
0.2
0.4
0.6
0.8
1
0 5 10 15 20Time (h)
OD
600
S 7-3-3/a-6-1
S 7-3-3/a-7-1
S 7-Control
A
33
Results
34
C. ammoniagenes pH 5.8 15°C
00.050.1
0.150.2
0.250.3
0.350.4
0 10 20 30 40Time (h)
OD
600
S 7-3-3/a-6-1
S 7-3-3/a-7-1
S 7-Control
B
C. ammoniagenes stability at 30°C
0
0.1
0.2
0.3
0.4
0.5
0 2 4 6 8 10 12 14 16 18 20 22 24
Time (h)
OD
600
S 7-3-3/a-6-1
S 7-3-3/a-7-1
S 7-Wildtyp
C
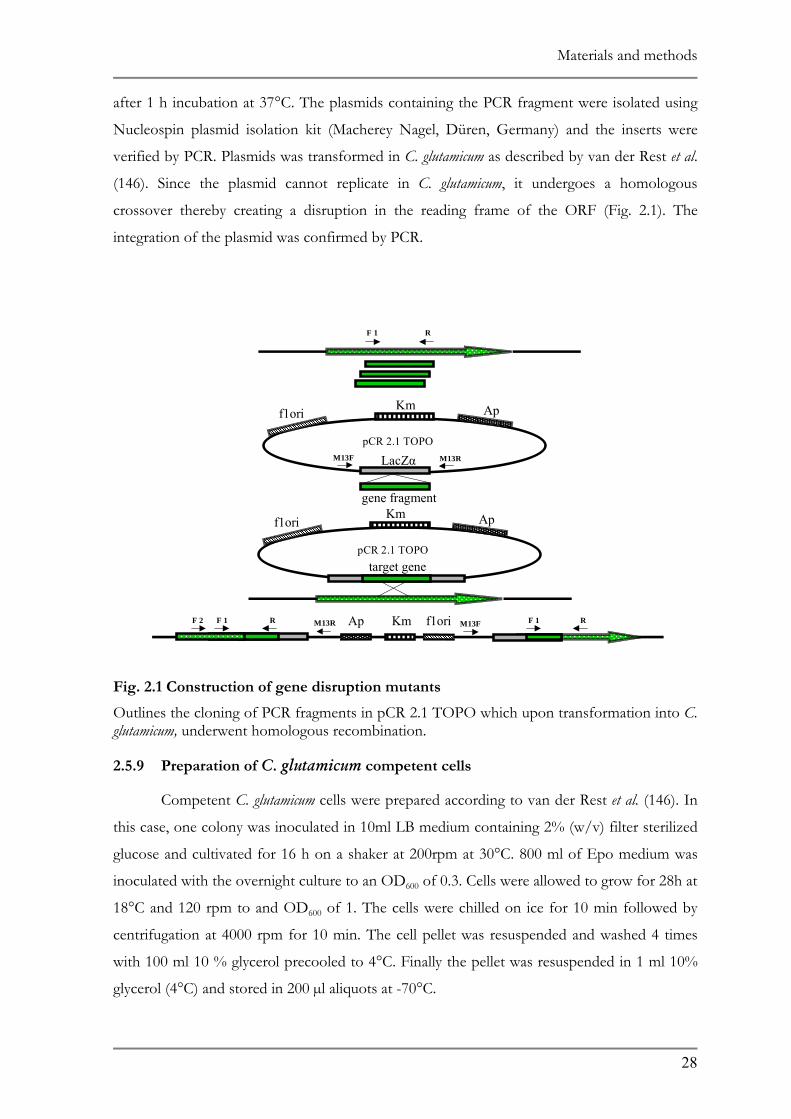
Fig. 3.1 C. ammoniagenes acid adapted mutants
Figures represents growth A at pH 5.8 30°C, B at pH 5.8 15°C, and C stability test performed at 30°C.
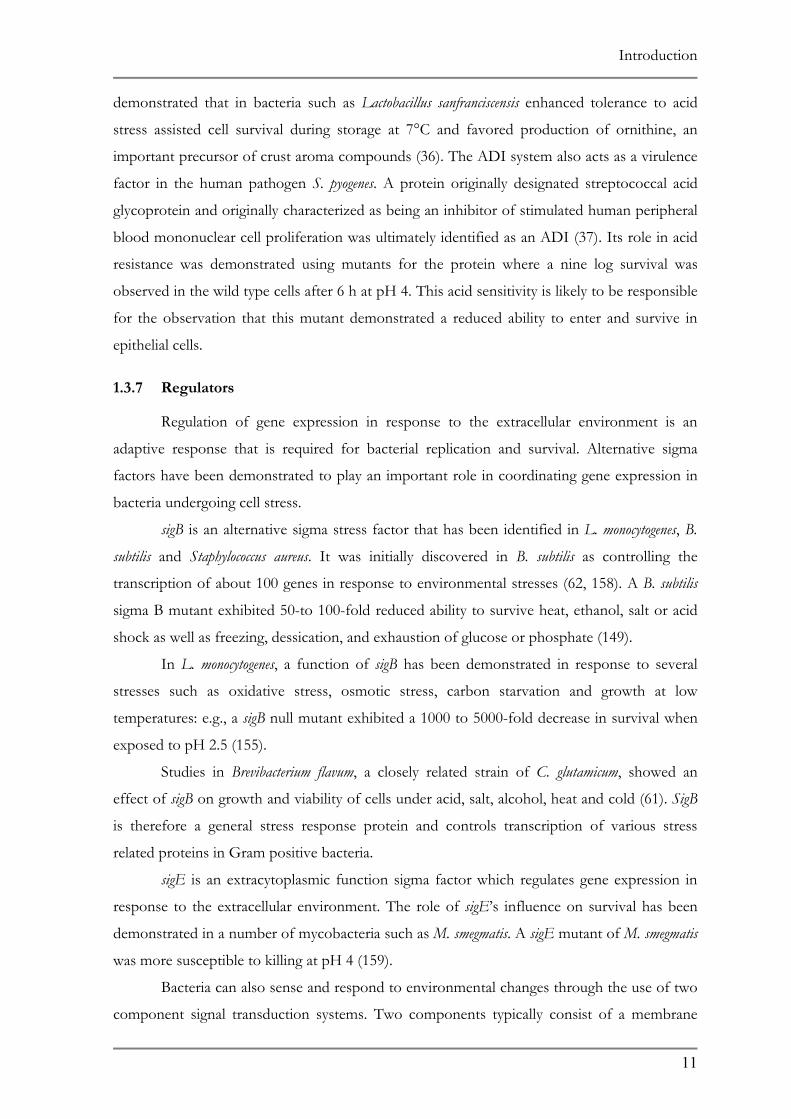
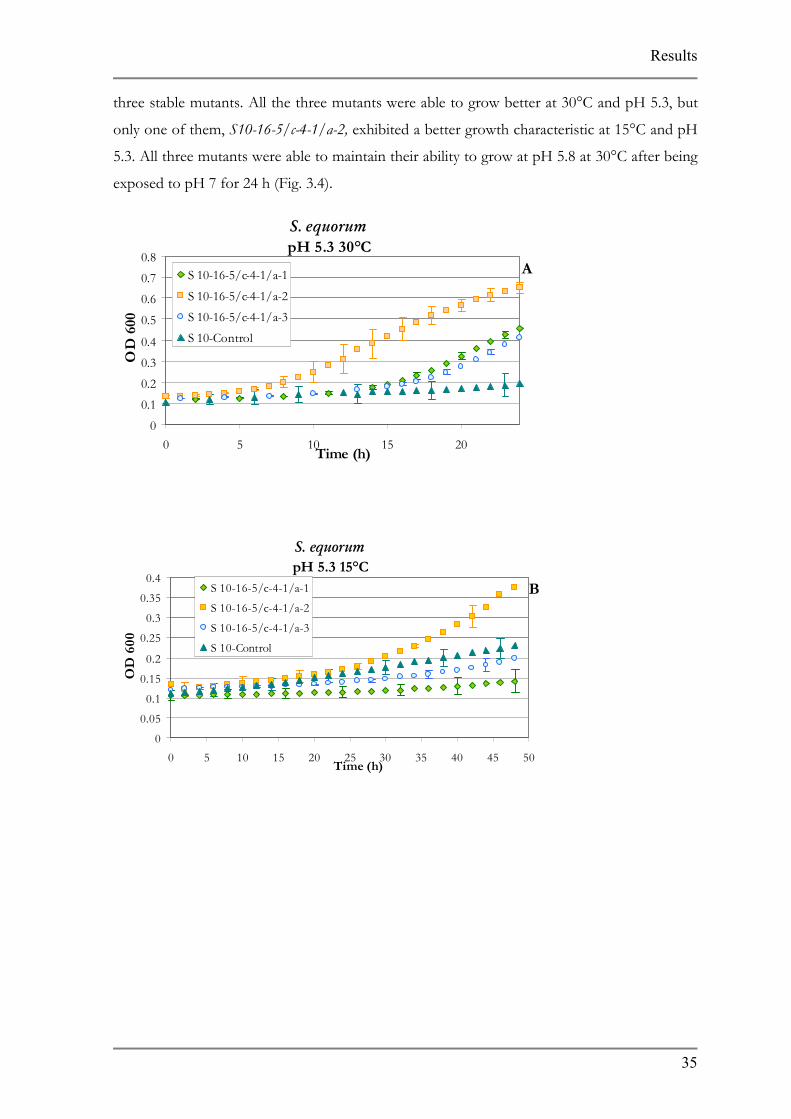
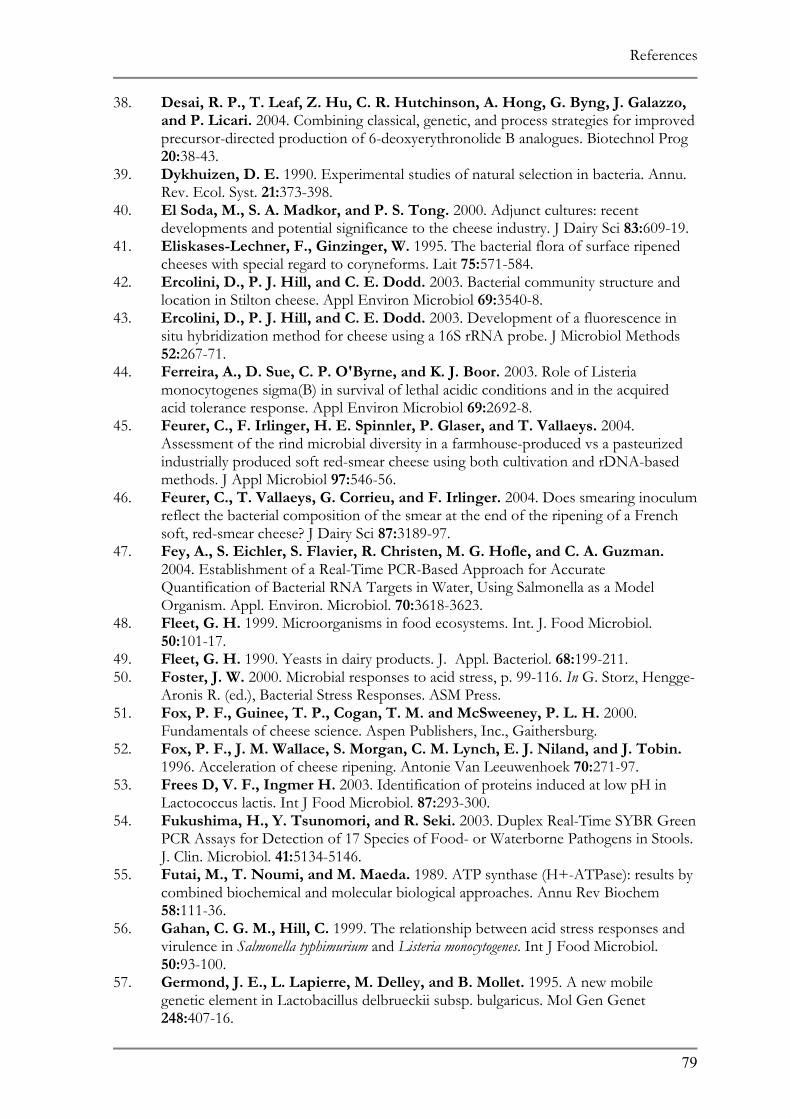
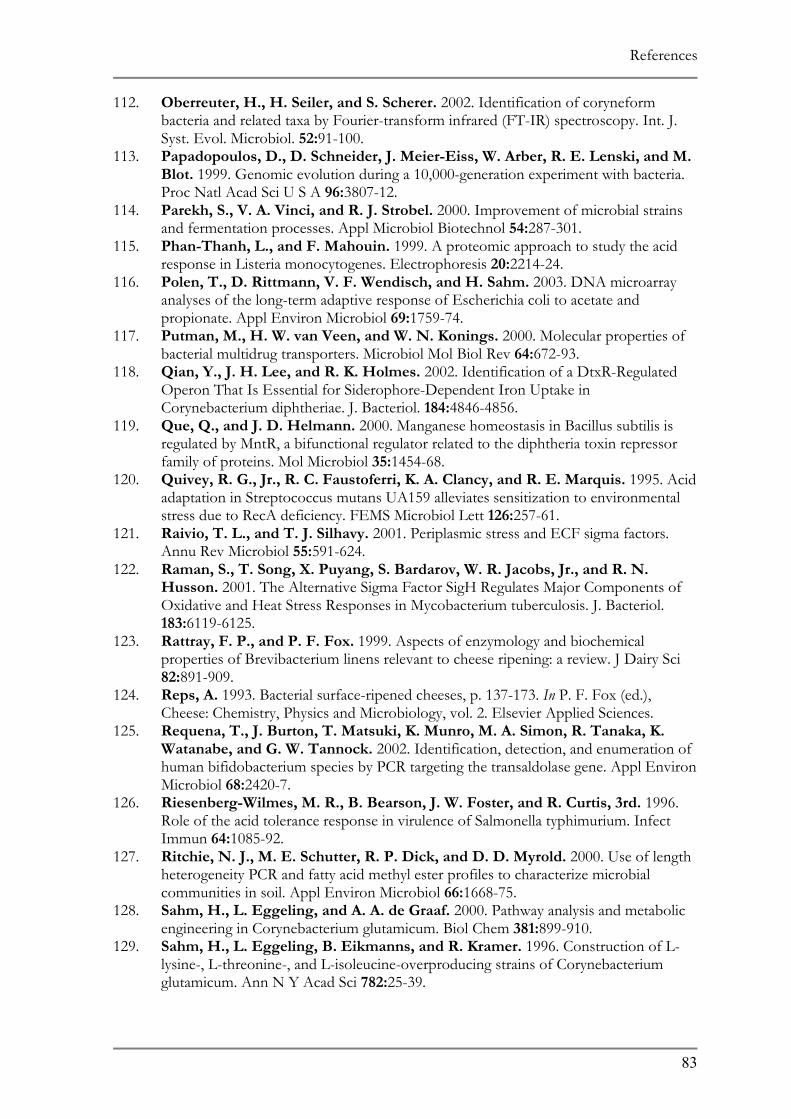
3.1.2 Staphylococcus equorum
The pH adaptation of S. equorum was performed in seven selection processes. First, the
strain was streaked on pH7-pH6 gradient plate. From the 16 mutants that were inoculated in
pH 6 medium only 2 have grown that were streaked onto pH 6-pH 5.5 gradient plates
resulting in a total of 45 pH 5.5 mutants. The adaptation of these mutants to pH 5 was
performed in three steps which resulted in 50 perspective pH 5 mutants. When analyzing
these mutants at pH 5 none of them exhibited growth at this pH. Therefore, the pH was
increased in 0.1 increments to pH 5.3 where the mutants were able to grow. From here 13
prospective mutants were selected for further testing using Bioscreen C which resulted in
Results
three stable mutants. All the three mutants were able to grow better at 30°C and pH 5.3, but
only one of them, S10-16-5/c-4-1/a-2, exhibited a better growth characteristic at 15°C and pH
5.3. All three mutants were able to maintain their ability to grow at pH 5.8 at 30°C after being
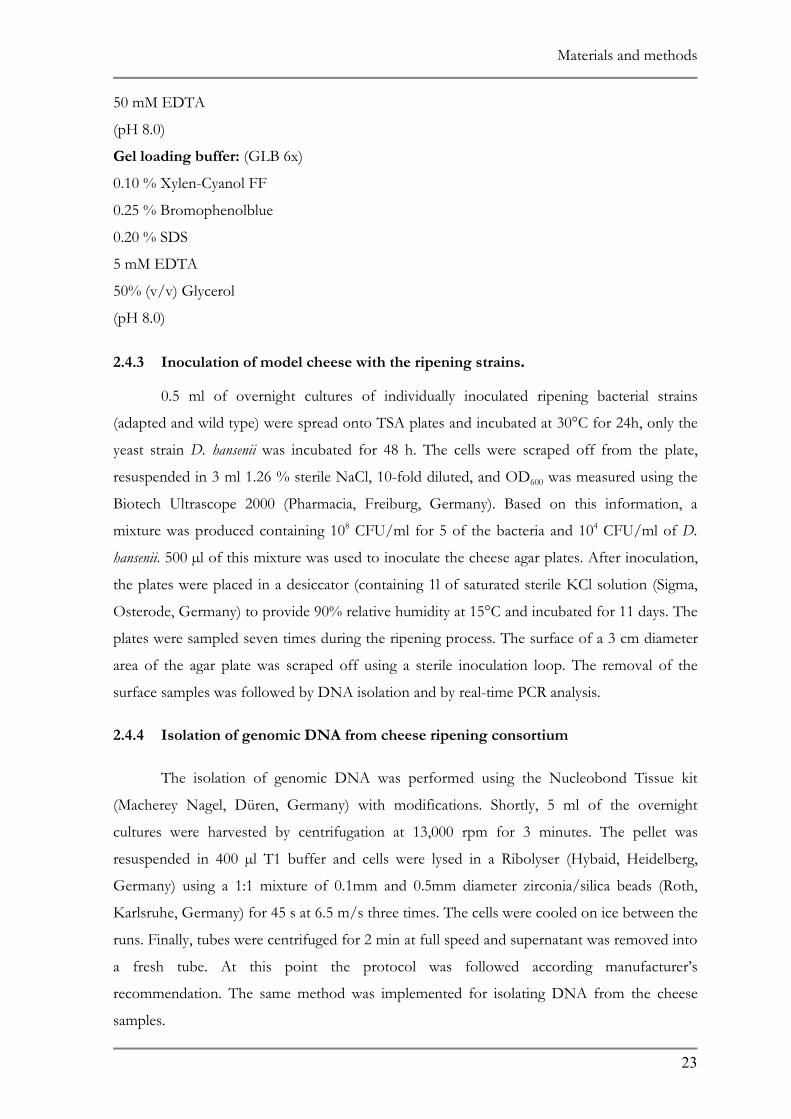
exposed to pH 7 for 24 h (Fig. 3.4).
S. equorum pH 5.3 30°C
0
0.1
0.2
0.3
0.4
0.5
0.6
0.7
0.8
0 5 10 15 20Time (h)
OD
600
S 10-16-5/c-4-1/a-1
S 10-16-5/c-4-1/a-2
S 10-16-5/c-4-1/a-3
S 10-Control
A
S. equorum pH 5.3 15°C
0
0.05
0.1
0.15
0.2
0.25
0.3
0.35
0.4
0 5 10 15 20 25 30 35 40 45Time (h)
OD
600
S 10-16-5/c-4-1/a-1
S 10-16-5/c-4-1/a-2
S 10-16-5/c-4-1/a-3
S 10-Control
B
35
50
Results
S. equorum stability at 30°C
00.10.20.30.40.50.60.70.8
0 5 10 15 20Time (h)
OD
600
S 10-16-5/c-4-1/a-1
S 10-16-5/c-4-1/a-2
S 10-16-5/c-4-1/a-3
S 10-Control
Fig. 3.2 S. equorum acid adapted mutants
Figures represent growth A at pH 5.3 30°C B at pH 5.3 15°C 30°C
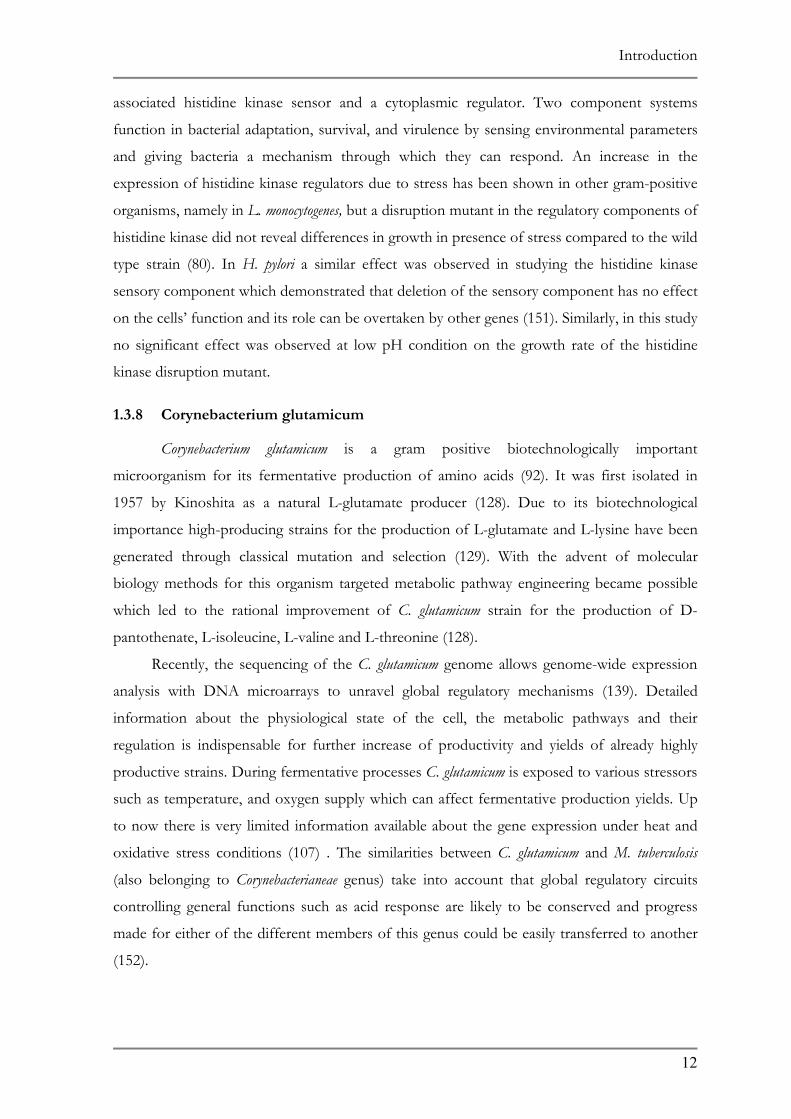
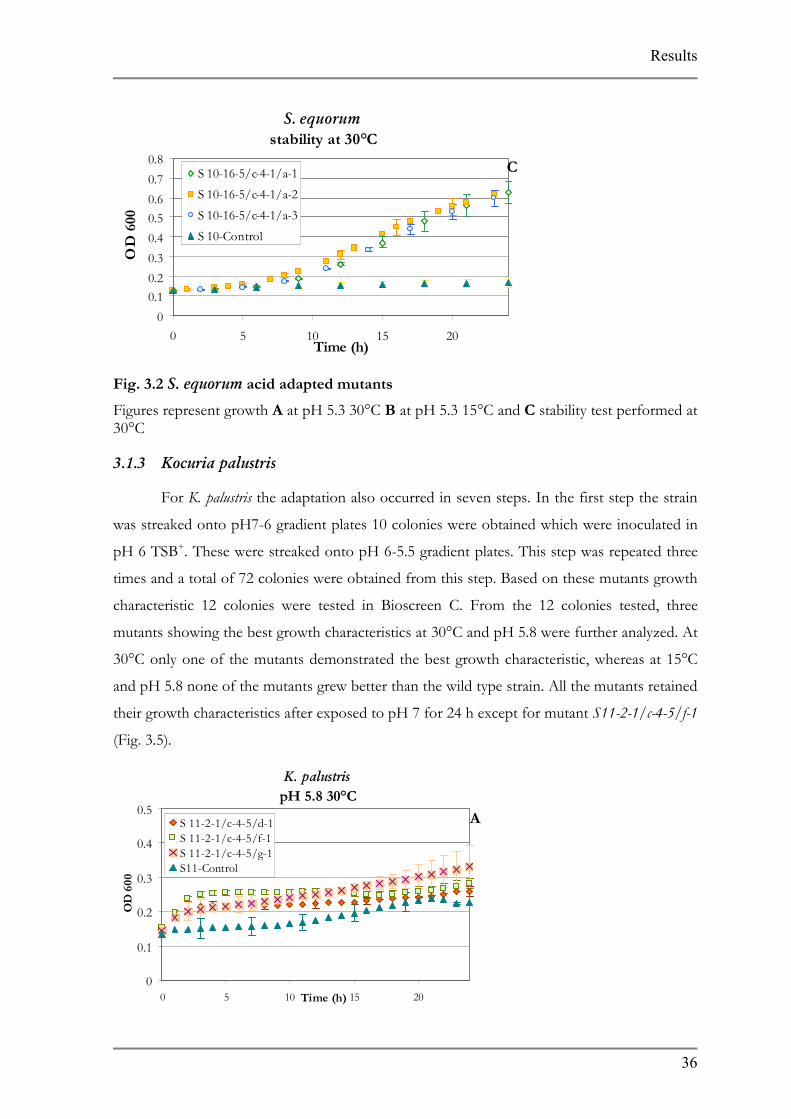
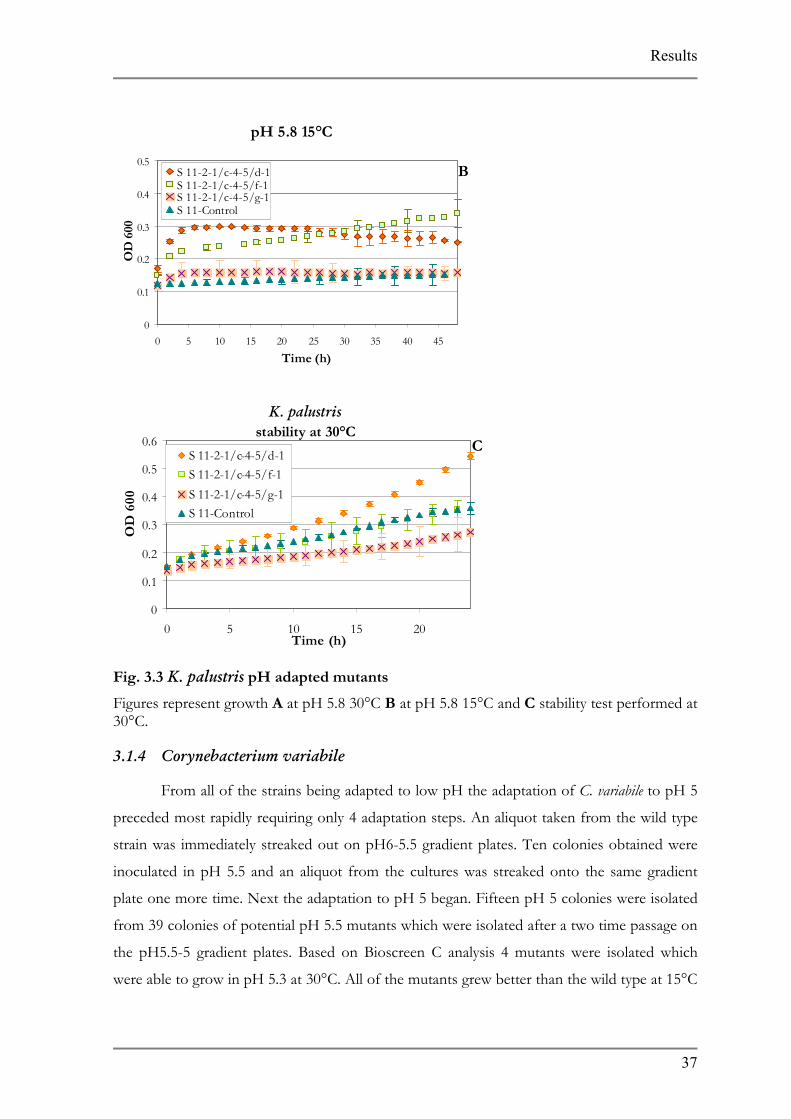
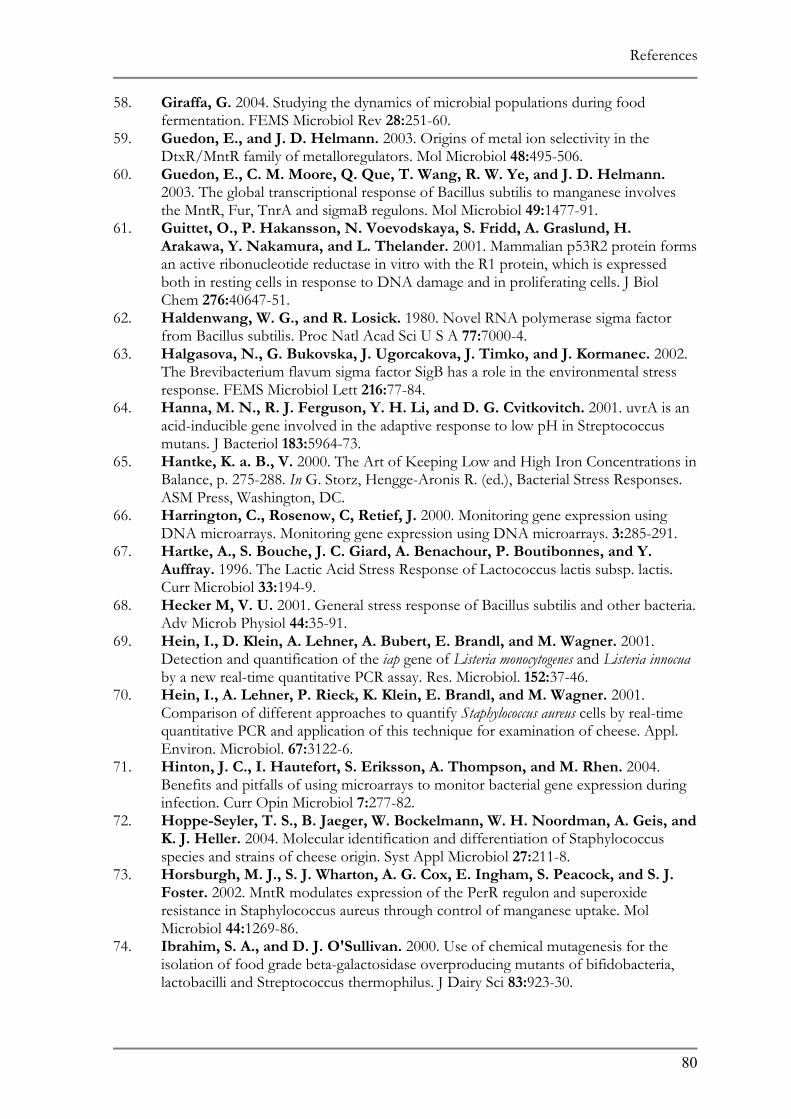
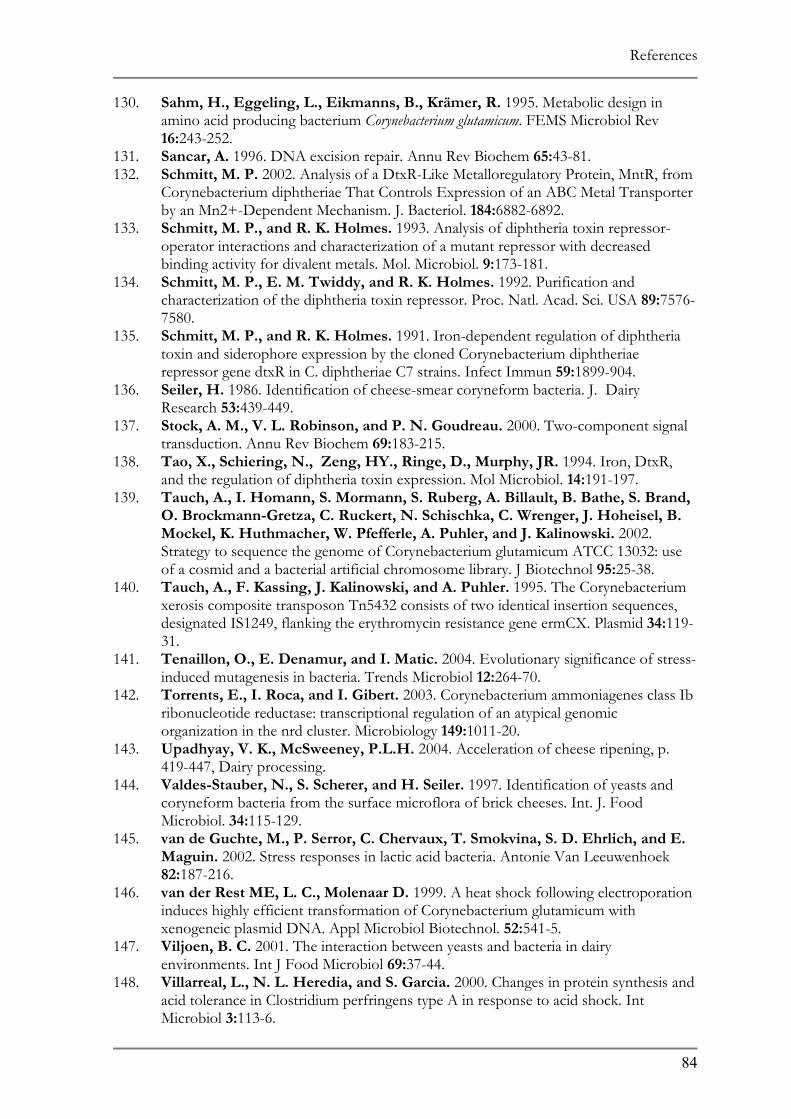
3.1.3 Kocuria palustris
For K. palustris the adaptation also occurred in seven s
was streaked onto pH7-6 gradient plates 10 colonies were ob
pH 6 TSB+. These were streaked onto pH 6-5.5 gradient plat
times and a total of 72 colonies were obtained from this step.
characteristic 12 colonies were tested in Bioscreen C. From
mutants showing the best growth characteristics at 30°C and p
30°C only one of the mutants demonstrated the best growth
and pH 5.8 none of the mutants grew better than the wild type
their growth characteristics after exposed to pH 7 for 24 h exc
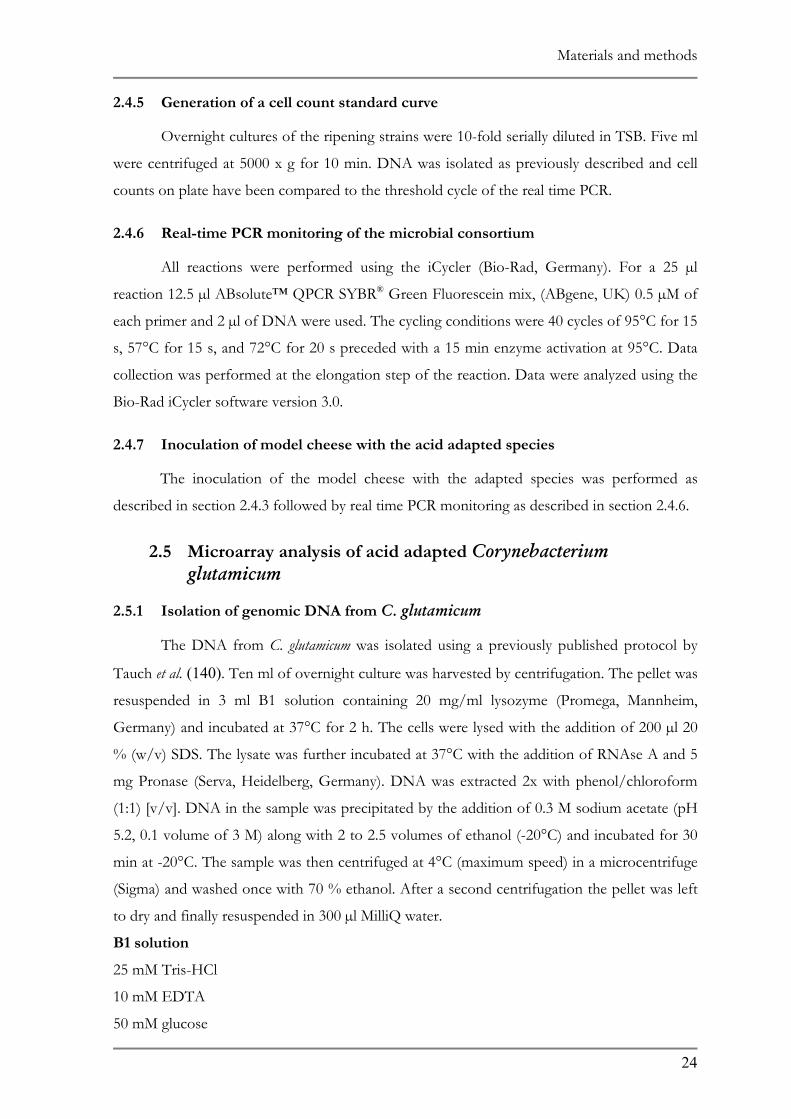
(Fig. 3.5).
K. palustris pH 5.8 30°C
0
0.1
0.2
0.3
0.4
0.5
0 5 10 15 20Time (h)
OD
600
S 11-2-1/c-4-5/d-1S 11-2-1/c-4-5/f-1S 11-2-1/c-4-5/g-1S11-Control
A
C
and C stability test performed at
teps. In the first step the strain
tained which were inoculated in
es. This step was repeated three
Based on these mutants growth
the 12 colonies tested, three
H 5.8 were further analyzed. At
characteristic, whereas at 15°C
strain. All the mutants retained
ept for mutant S11-2-1/c-4-5/f-1
36
Results
pH 5.8 15°C
0
0.1
0.2
0.3
0.4
0.5
0 5 10 15 20 25 30 35 40 45Time (h)
OD
600
S 11-2-1/c-4-5/d-1S 11-2-1/c-4-5/f-1S 11-2-1/c-4-5/g-1S 11-Control
B
K. palustris stability at 30°C
0
0.1
0.2
0.3
0.4
0.5
0.6
0 5 10 15 20Time (h)
OD
600
S 11-2-1/c-4-5/d-1S 11-2-1/c-4-5/f-1S 11-2-1/c-4-5/g-1S 11-Control
Fig. 3.3 K. palustris pH adapted mutants
Figures represent growth A at pH 5.8 30°C B at pH 5.30°C.
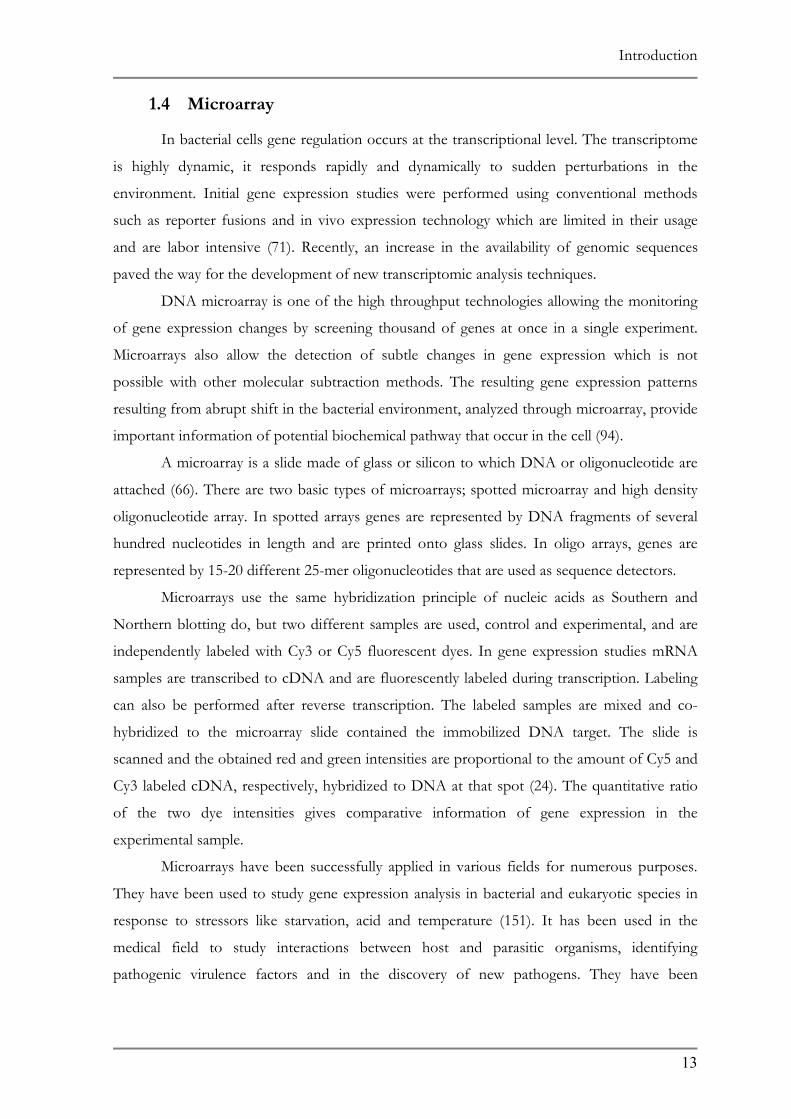
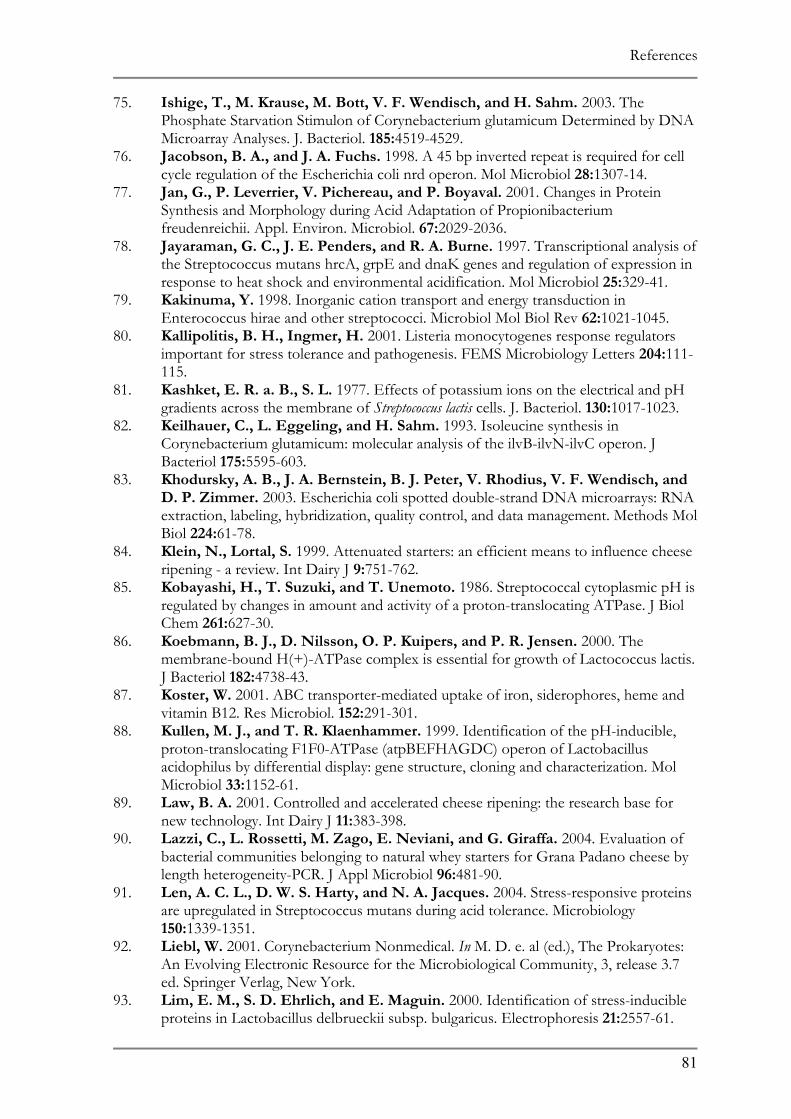
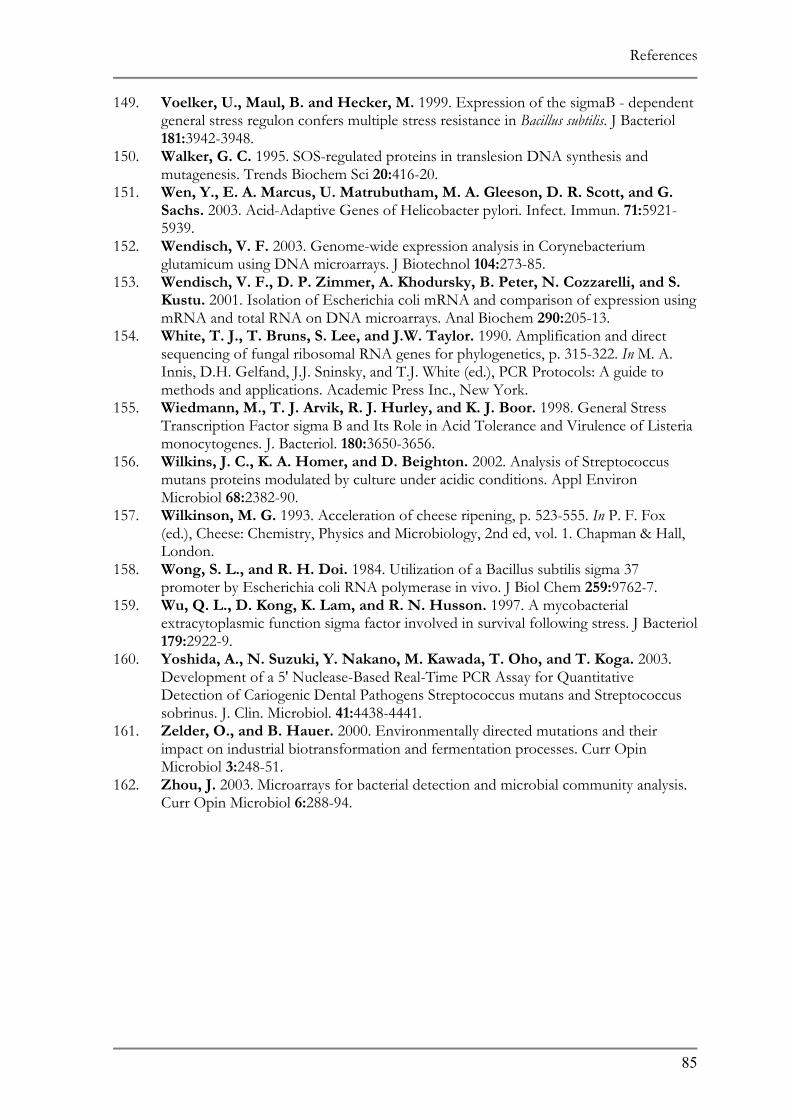
3.1.4 Corynebacterium variabile
From all of the strains being adapted to low p
preceded most rapidly requiring only 4 adaptation ste
strain was immediately streaked out on pH6-5.5 grad
inoculated in pH 5.5 and an aliquot from the culture
plate one more time. Next the adaptation to pH 5 beg
from 39 colonies of potential pH 5.5 mutants which w
the pH5.5-5 gradient plates. Based on Bioscreen C a
were able to grow in pH 5.3 at 30°C. All of the mutant
8 1
H
ps.
ien
s
an
er
na
s g
C
37
5°C and C stability test performed at
the adaptation of C. variabile to pH 5
An aliquot taken from the wild type
t plates. Ten colonies obtained were
was streaked onto the same gradient
. Fifteen pH 5 colonies were isolated
e isolated after a two time passage on
lysis 4 mutants were isolated which
rew better than the wild type at 15°C
Results
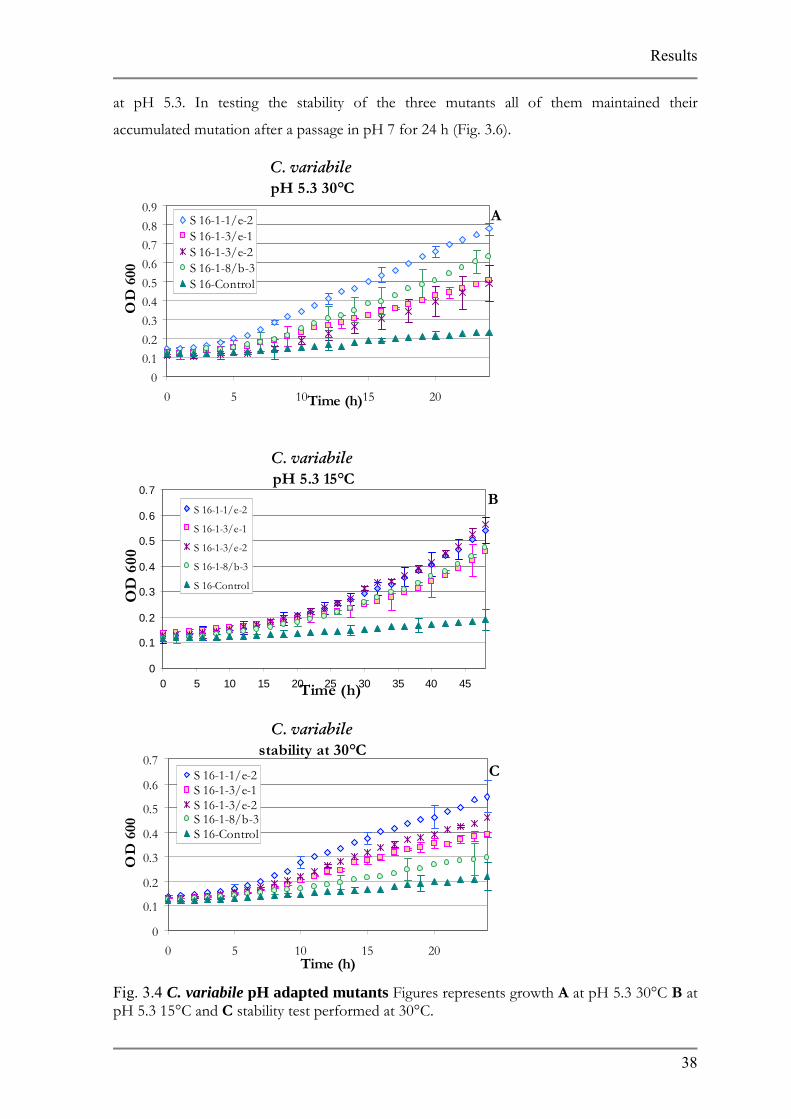
38
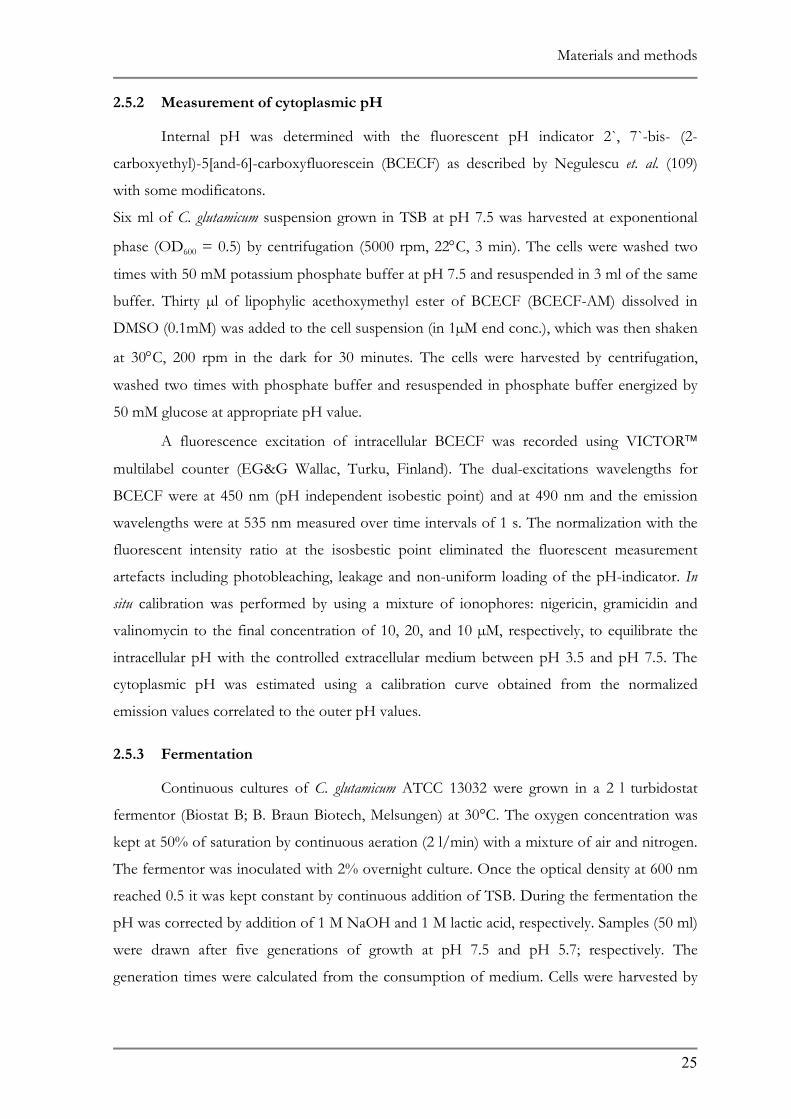
at pH 5.3. In testing the stability of the three mutants all of them maintained their
accumulated mutation after a passage in pH 7 for 24 h (Fig. 3.6).
C. variabile pH 5.3 30°C
00.10.20.30.40.50.60.70.80.9
0 5 10 15 20Time (h)
OD
600
S 16-1-1/e-2S 16-1-3/e-1S 16-1-3/e-2S 16-1-8/b-3S 16-Control
A
C. variabile pH 5.3 15°C
0
0.1
0.2
0.3
0.4
0.5
0.6
0.7
0 5 10 15 20 25 30 35 40 45Time (h)
OD
600
S 16-1-1/e-2
S 16-1-3/e-1
S 16-1-3/e-2
S 16-1-8/b-3
S 16-Control
B
C. variabile stability at 30°C
0
0.1
0.2
0.3
0.4
0.5
0.6
0.7
0 5 10 15 20Time (h)
OD
600
S 16-1-1/e-2S 16-1-3/e-1S 16-1-3/e-2S 16-1-8/b-3S 16-Control
C
Fig. 3.4 C. variabile pH adapted mutants Figures represents growth A at pH 5.3 30°C B at pH 5.3 15°C and C stability test performed at 30°C.
Results
39
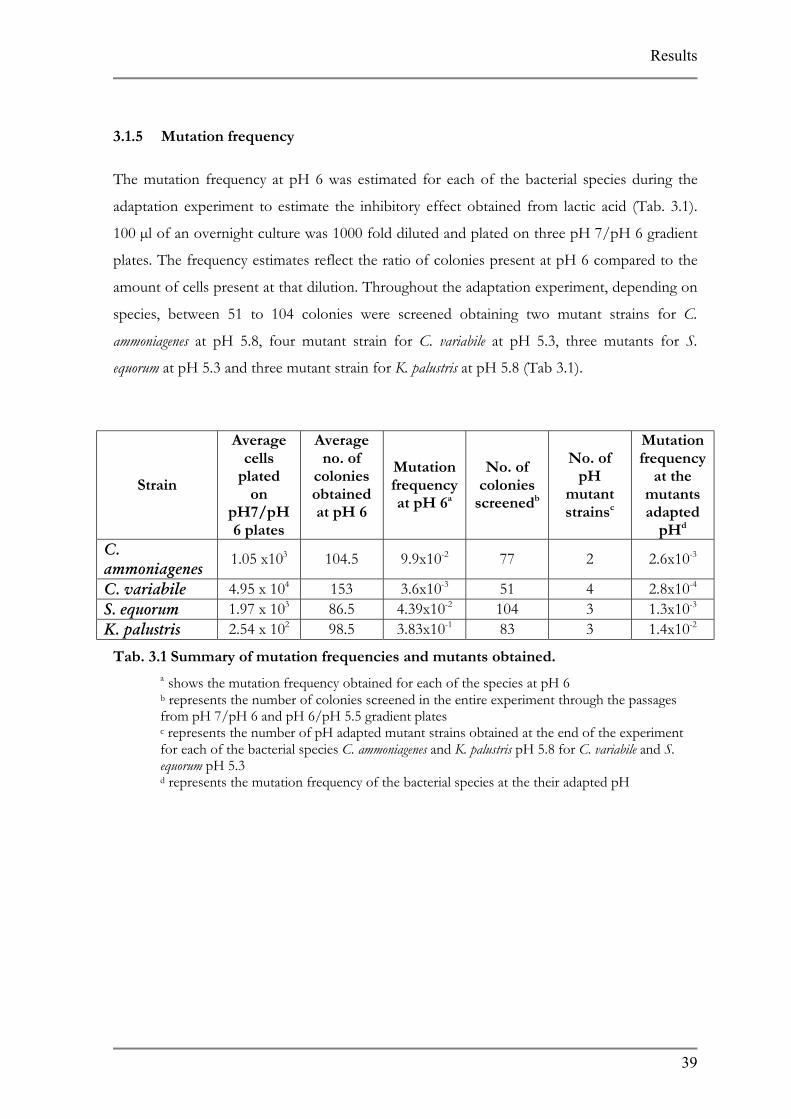
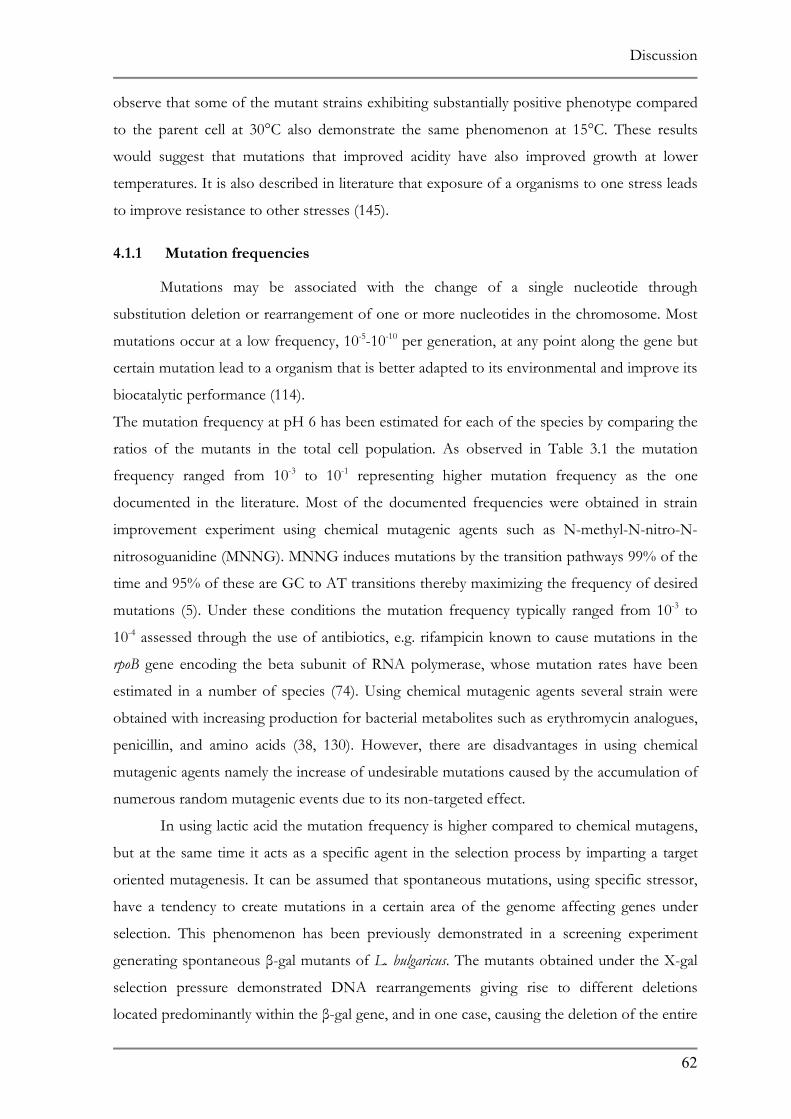
3.1.5 Mutation frequency
The mutation frequency at pH 6 was estimated for each of the bacterial species during the
adaptation experiment to estimate the inhibitory effect obtained from lactic acid (Tab. 3.1).
100 µl of an overnight culture was 1000 fold diluted and plated on three pH 7/pH 6 gradient
plates. The frequency estimates reflect the ratio of colonies present at pH 6 compared to the
amount of cells present at that dilution. Throughout the adaptation experiment, depending on
species, between 51 to 104 colonies were screened obtaining two mutant strains for C.
ammoniagenes at pH 5.8, four mutant strain for C. variabile at pH 5.3, three mutants for S.
equorum at pH 5.3 and three mutant strain for K. palustris at pH 5.8 (Tab 3.1).
Strain
Average cells
plated on
pH7/pH6 plates
Average no. of
colonies obtained at pH 6
Mutation frequency at pH 6a
No. of colonies
screenedb
No. of pH
mutant strainsc
Mutation frequency
at the mutants adapted
pHd
C. ammoniagenes
1.05 x10³ 104.5 9.9x10⁻² 77 2 2.6x10⁻³
C. variabile 4.95 x 10⁴ 153 3.6x10⁻³ 51 4 2.8x10⁻⁴
S. equorum 1.97 x 10³ 86.5 4.39x10⁻² 104 3 1.3x10⁻³
K. palustris 2.54 x 10² 98.5 3.83x10⁻¹ 83 3 1.4x10⁻²
Tab. 3.1 Summary of mutation frequencies and mutants obtained.
a shows the mutation frequency obtained for each of the species at pH 6 b represents the number of colonies screened in the entire experiment through the passages from pH 7/pH 6 and pH 6/pH 5.5 gradient plates c represents the number of pH adapted mutant strains obtained at the end of the experiment for each of the bacterial species C. ammoniagenes and K. palustris pH 5.8 for C. variabile and S. equorum pH 5.3 d represents the mutation frequency of the bacterial species at the their adapted pH
Results
40
3.2 Monitoring of ripening consortium using quantitative real time PCR on model cheese
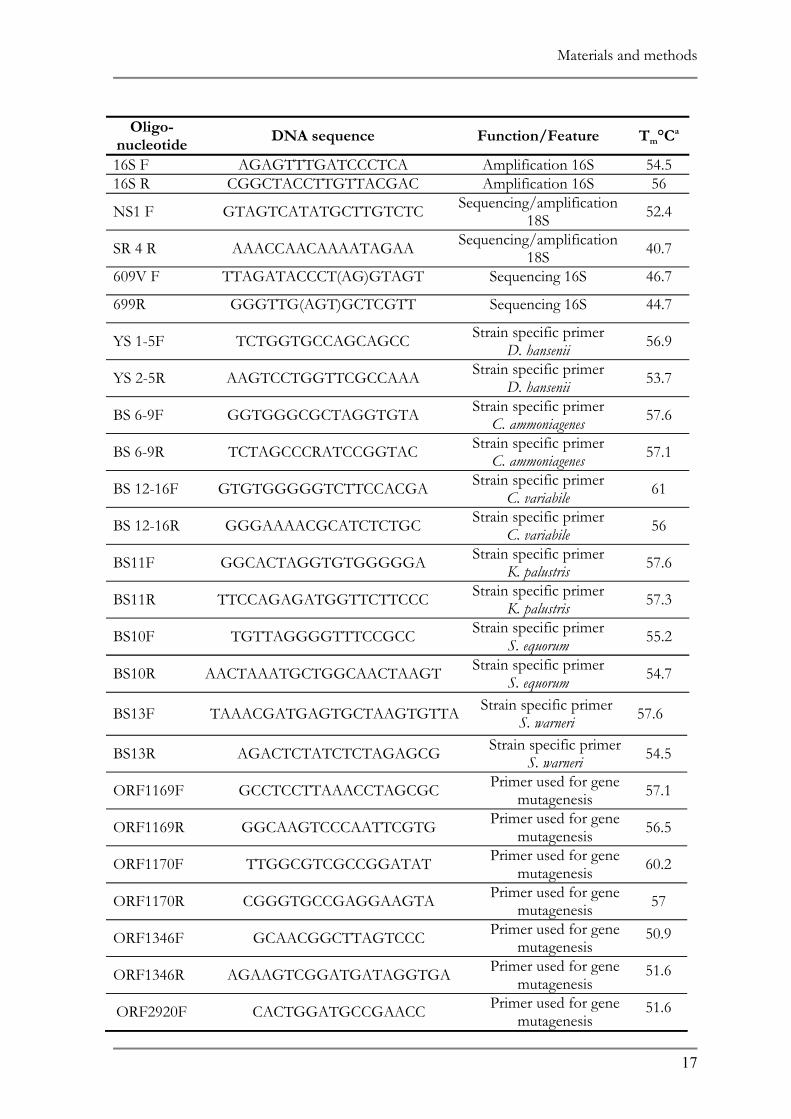
3.2.1 Primer design for the ripening microbial consortium
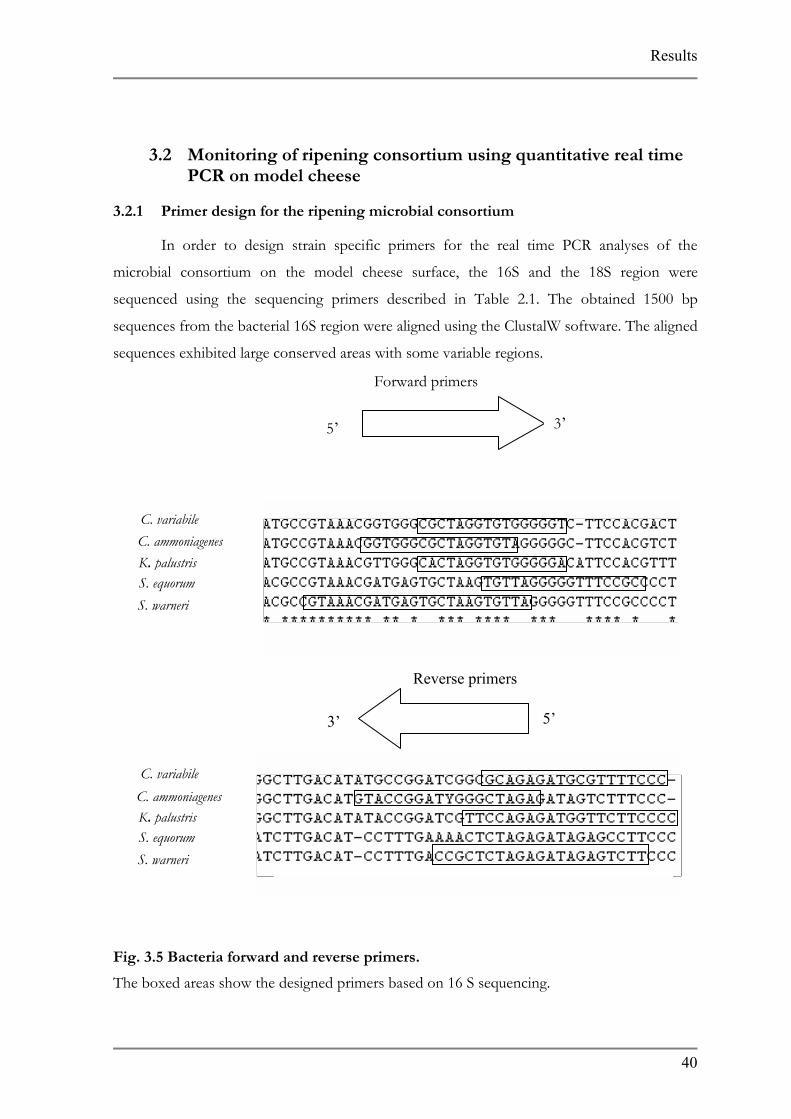
In order to design strain specific primers for the real time PCR analyses of the
microbial consortium on the model cheese surface, the 16S and the 18S region were
sequenced using the sequencing primers described in Table 2.1. The obtained 1500 bp
sequences from the bacterial 16S region were aligned using the ClustalW software. The aligned
sequences exhibited large conserved areas with some variable regions.
3’
Forward primers
5’
C. variabile
K. palustris C. ammoniagenes
S. equorum S. warneri
5’
Reverse primers
3’
C. variabile
K. palustris C. ammoniagenes
S. equorum S. warneri
Fig. 3.5 Bacteria forward and reverse primers.
The boxed areas show the designed primers based on 16 S sequencing.
Results
41
The primers for the bacterial strains used for real time PCR were designed in such a way that
the 3’ ends of the primers were positioned in the non-conserved region, providing strain
specificity. The amplicon size was kept constant at 200 bp for each of the strains except in the
Staphylococcus species. Due to difficulties in differentiation among the Staphylococcus species
separate reverse primers were designed which resulted in an increase in the amplicon size of
the S. equorum to 300 bp. The same principle was used in designing the 18S yeast strain specific
primers.
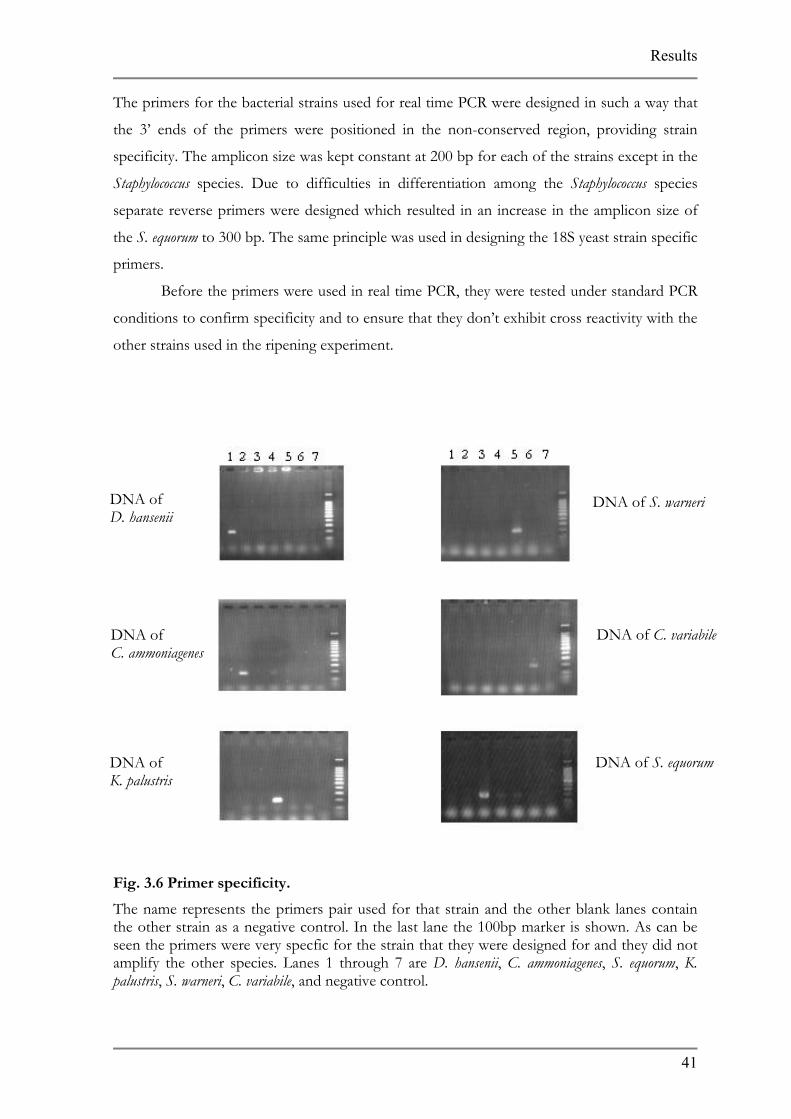
Before the primers were used in real time PCR, they were tested under standard PCR
conditions to confirm specificity and to ensure that they don’t exhibit cross reactivity with the
other strains used in the ripening experiment.
DNA of S. warneri DNA of D. hansenii
DNA of C. variabile DNA of C. ammoniagenes
DNA of S. equorum DNA of K. palustris
Fig. 3.6 Primer specificity.
The name represents the primers pair used for that strain and the other blank lanes contain the other strain as a negative control. In the last lane the 100bp marker is shown. As can be seen the primers were very specfic for the strain that they were designed for and they did not amplify the other species. Lanes 1 through 7 are D. hansenii, C. ammoniagenes, S. equorum, K. palustris, S. warneri, C. variabile, and negative control.
Results
As can be seen in Fig. 3.2, the primers are specific and do not amplify DNA of the
other strains. Another experiment was performed using a DNA mixture imitating conditions
existing on the surface of the model cheese to observe any inhibition in the reaction due to
the presence of large amounts of DNA in the reaction as a result of some dominant species
during ripening. No inhibition was observed (data not shown).
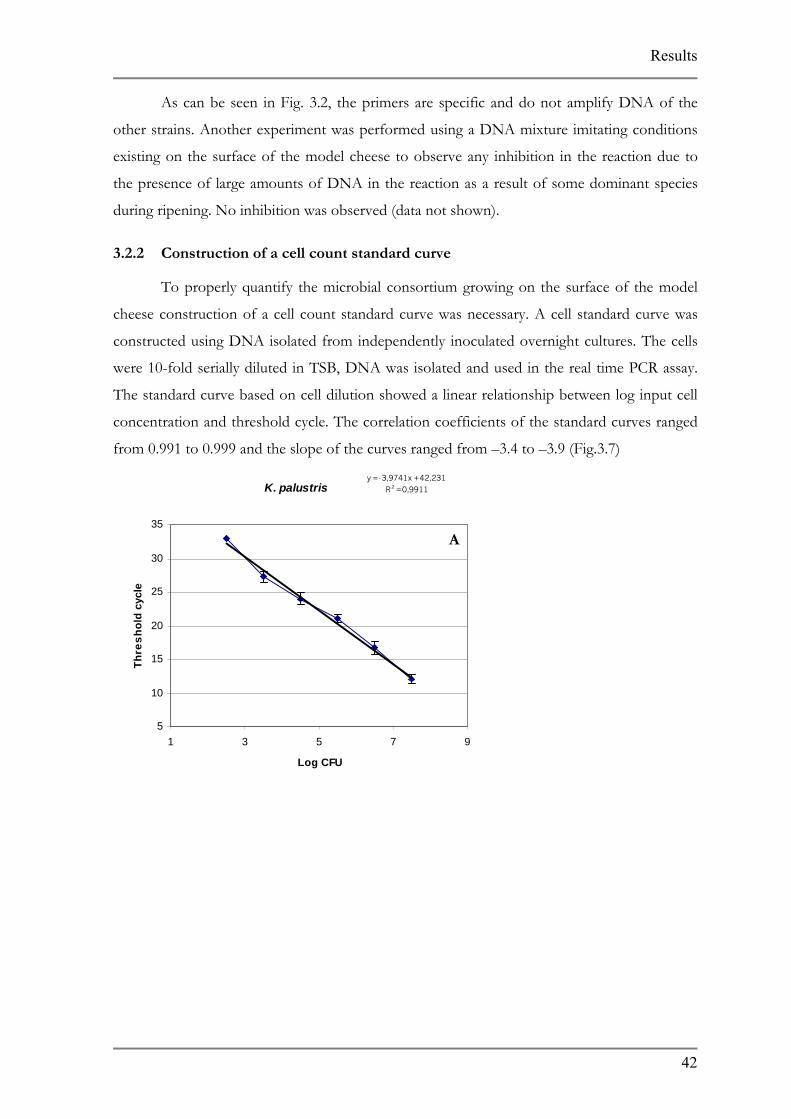
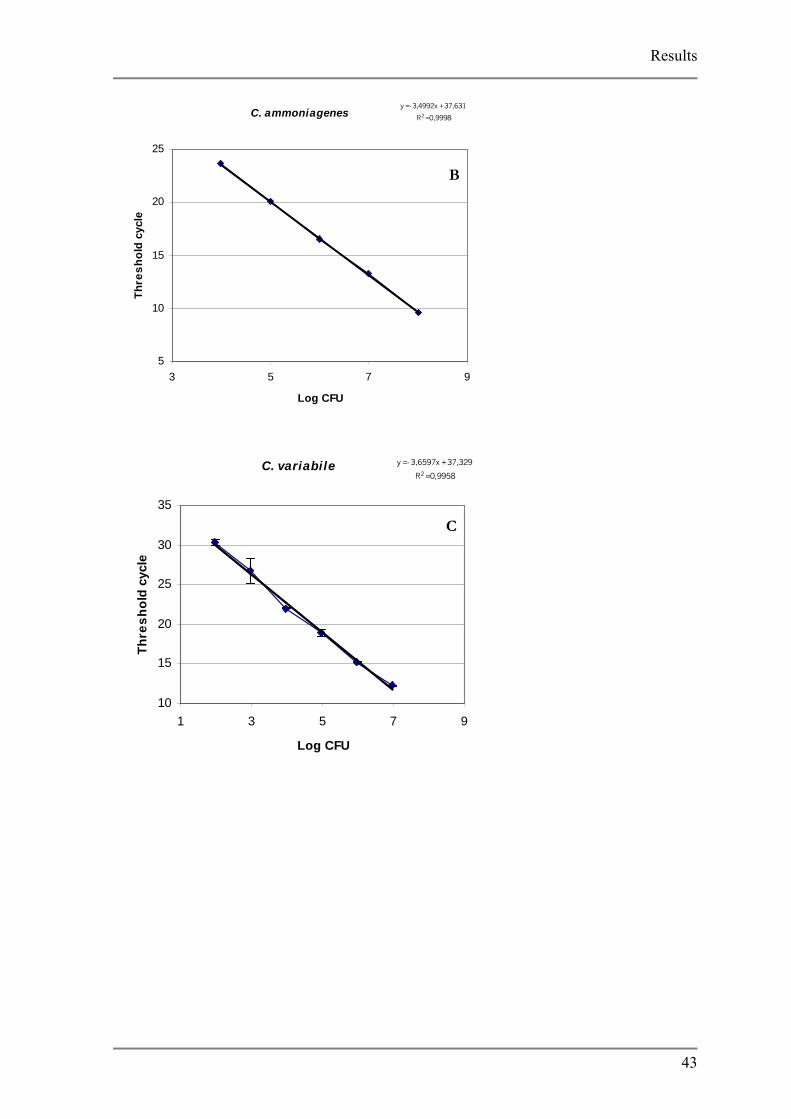
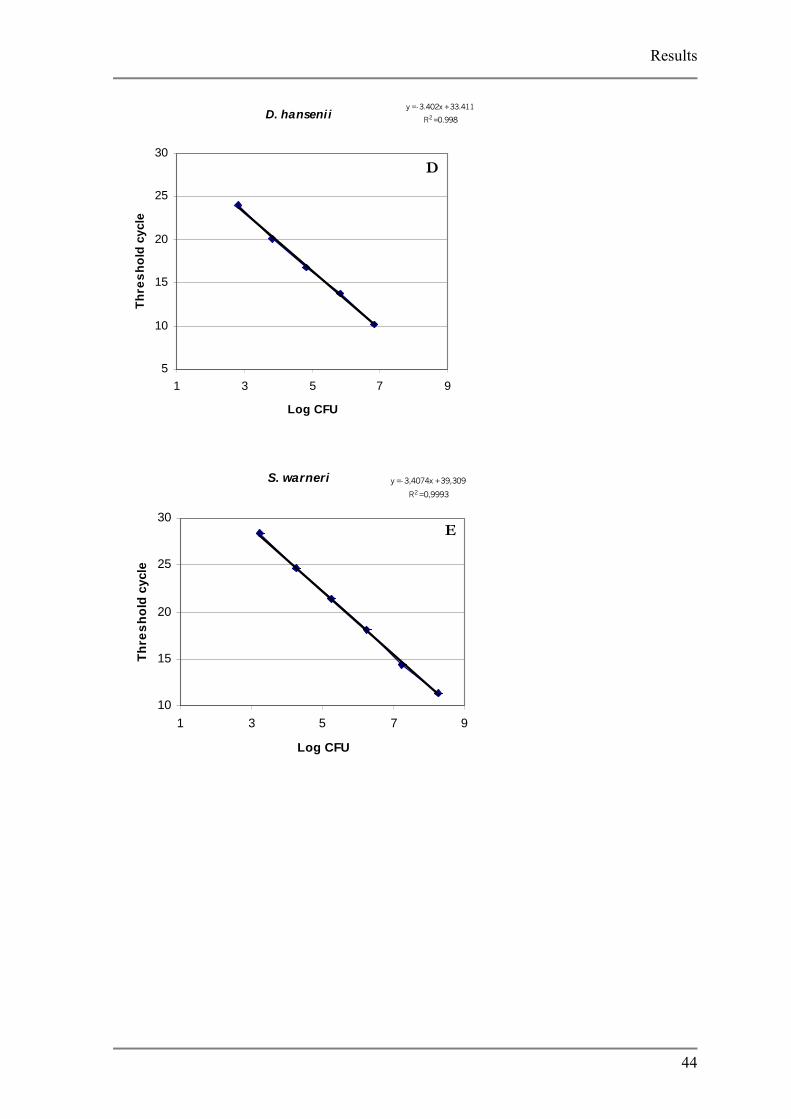
3.2.2 Construction of a cell count standard curve
To properly quantify the microbial consortium growing on the surface of the model
cheese construction of a cell count standard curve was necessary. A cell standard curve was
constructed using DNA isolated from independently inoculated overnight cultures. The cells
were 10-fold serially diluted in TSB, DNA was isolated and used in the real time PCR assay.
The standard curve based on cell dilution showed a linear relationship between log input cell
concentration and threshold cycle. The correlation coefficients of the standard curves ranged
from 0.991 to 0.999 and the slope of the curves ranged from –3.4 to –3.9 (Fig.3.7)
K. palustrisy = -3,9741x + 42,231
R2 = 0,9911
5
10
15
20
25
30
35
1 3 5 7
Log CFU
Thre
shol
d cy
cle
A
42
9
Results
C. ammoniagenesy = -3,4992x + 37,631
R2 = 0,9998
5
10
15
20
25
3 5 7 9
Log CFU
Thre
shol
d cy
cle
B
C. variabile y = -3,6597x + 37,329
R2 = 0,9958
10
15
20
25
30
35
1 3 5 7
Log CFU
Thre
shol
d cy
cle
C
43
9
Results
44
D. hanseniiy = -3.402x + 33.411
R2 = 0.998
5
10
15
20
25
30
1 3 5 7 9
Log CFU
Thre
shol
d cy
cle
D
S. warneri y = -3,4074x + 39,309
R2 = 0,9993
10
15
20
25
30
1 3 5 7 9
Log CFU
Thre
shol
d cy
cle
E
Results
45
S. equorum y = -3,6263x + 37,804
R2 = 0,9961
5
10
15
20
25
30
35
1 3 5 7 9
Log CFU
Thre
shol
d cy
cle
F
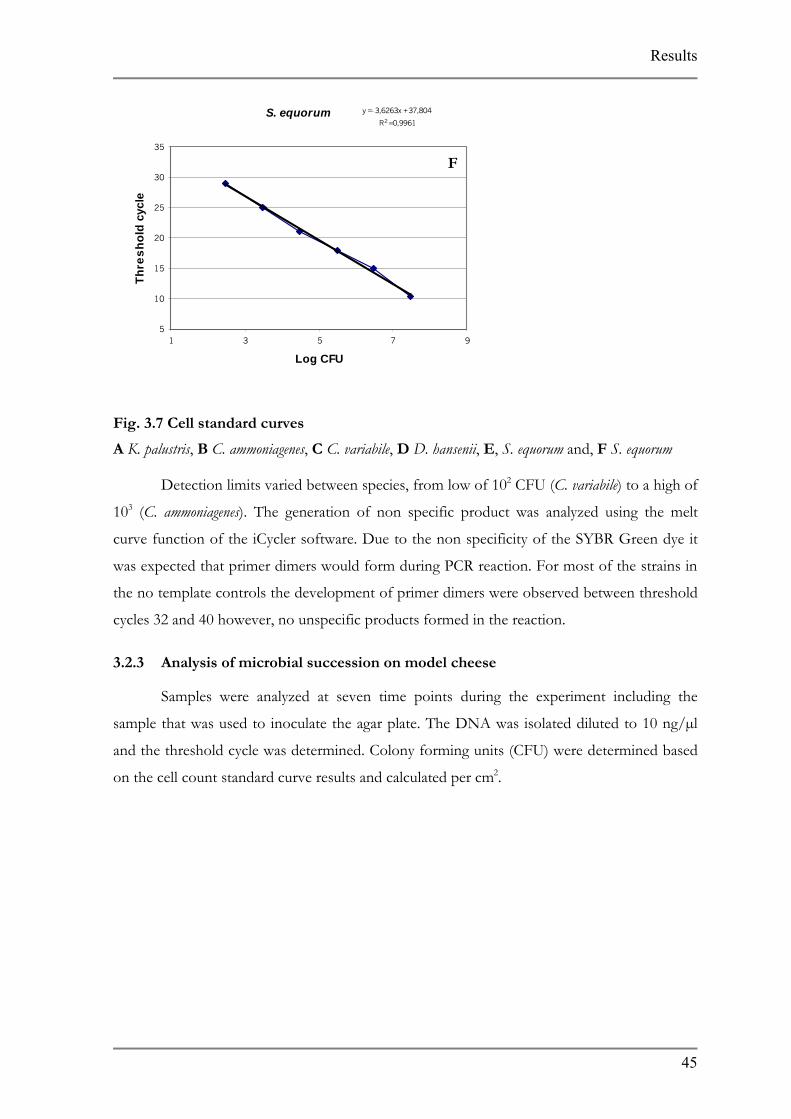
Fig. 3.7 Cell standard curves
A K. palustris, B C. ammoniagenes, C C. variabile, D D. hansenii, E, S. equorum and, F S. equorum
Detection limits varied between species, from low of 102 CFU (C. variabile) to a high of
103 (C. ammoniagenes). The generation of non specific product was analyzed using the melt
curve function of the iCycler software. Due to the non specificity of the SYBR Green dye it
was expected that primer dimers would form during PCR reaction. For most of the strains in
the no template controls the development of primer dimers were observed between threshold
cycles 32 and 40 however, no unspecific products formed in the reaction.
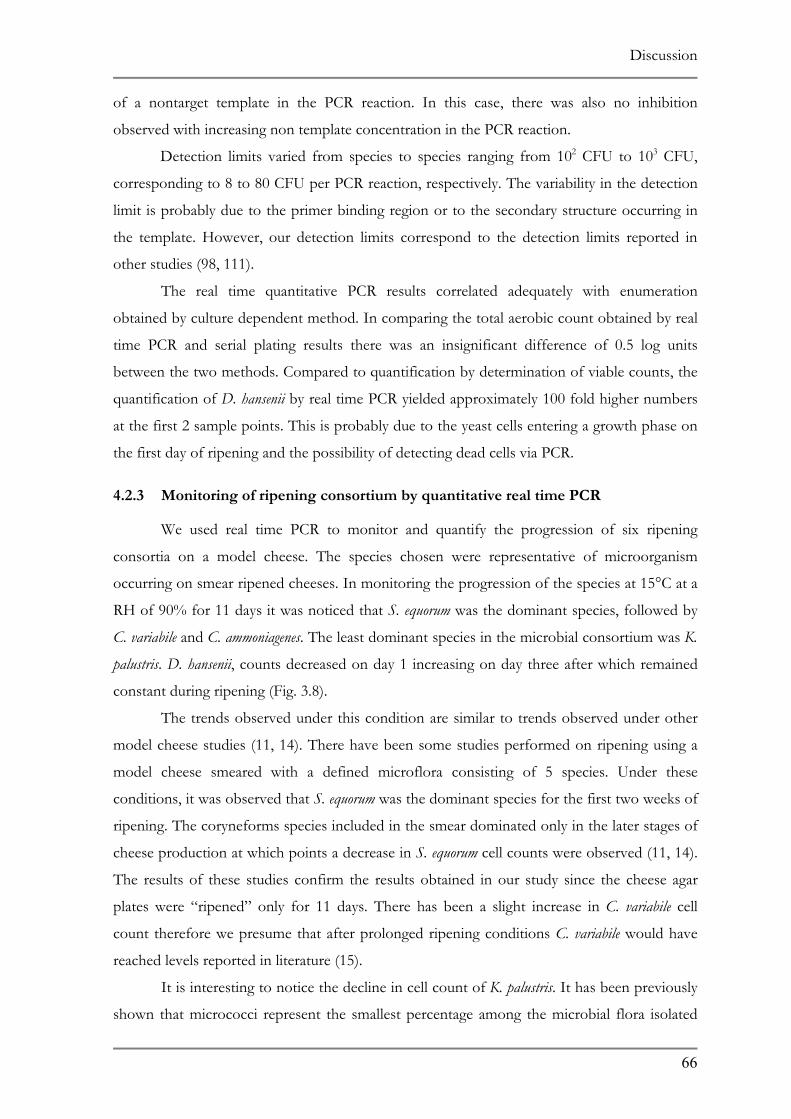
3.2.3 Analysis of microbial succession on model cheese
Samples were analyzed at seven time points during the experiment including the
sample that was used to inoculate the agar plate. The DNA was isolated diluted to 10 ng/µl
and the threshold cycle was determined. Colony forming units (CFU) were determined based
on the cell count standard curve results and calculated per cm2.
Results
46
2
3
4
5
6
7
8
9
10
0 3 6 9 12
Ripening (days)
Log
CFU
/cm
2
C. variabileS. warneriK. palustrisS. equorumC. ammoniagesD. hansenii
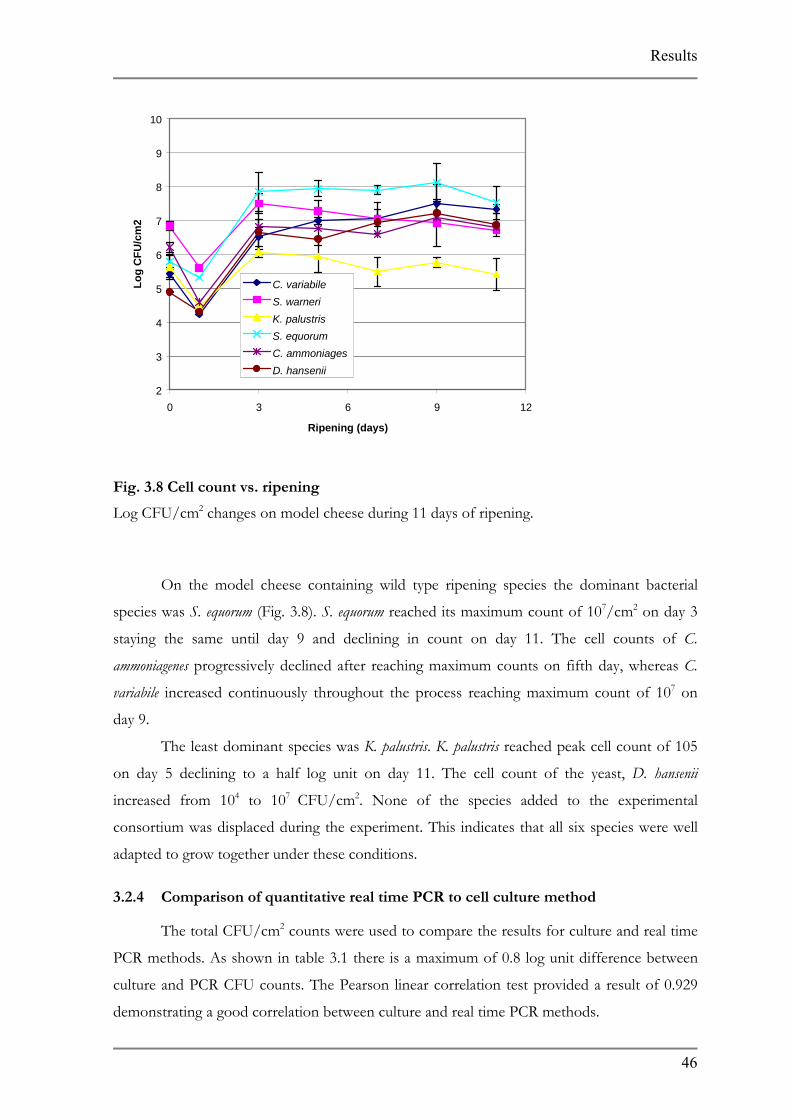
Fig. 3.8 Cell count vs. ripening
Log CFU/cm2 changes on model cheese during 11 days of ripening.
On the model cheese containing wild type ripening species the dominant bacterial
species was S. equorum (Fig. 3.8). S. equorum reached its maximum count of 107/cm2 on day 3
staying the same until day 9 and declining in count on day 11. The cell counts of C.
ammoniagenes progressively declined after reaching maximum counts on fifth day, whereas C.
variabile increased continuously throughout the process reaching maximum count of 107 on
day 9.
The least dominant species was K. palustris. K. palustris reached peak cell count of 105
on day 5 declining to a half log unit on day 11. The cell count of the yeast, D. hansenii
increased from 104 to 107 CFU/cm2. None of the species added to the experimental
consortium was displaced during the experiment. This indicates that all six species were well
adapted to grow together under these conditions.
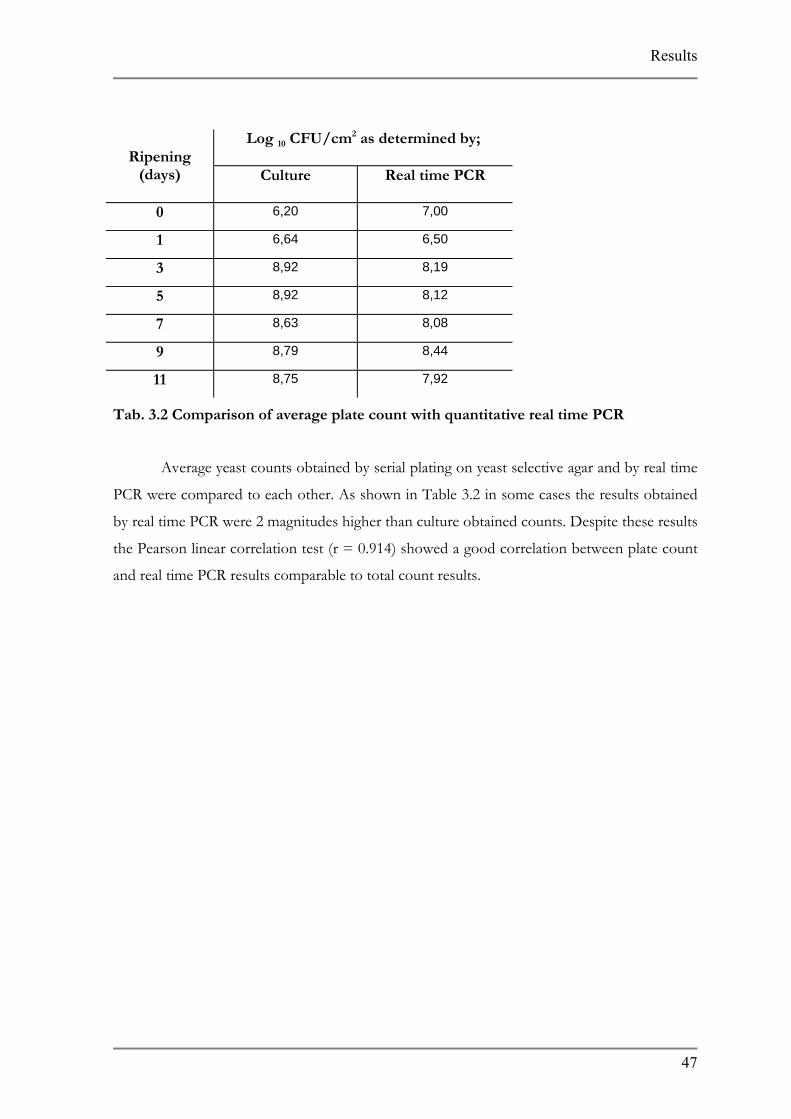
3.2.4 Comparison of quantitative real time PCR to cell culture method
The total CFU/cm2 counts were used to compare the results for culture and real time
PCR methods. As shown in table 3.1 there is a maximum of 0.8 log unit difference between
culture and PCR CFU counts. The Pearson linear correlation test provided a result of 0.929
demonstrating a good correlation between culture and real time PCR methods.
Results
47
Log 10 CFU/cm2 as determined by; Ripening
(days) Culture Real time PCR
0 6,20 7,00
1 6,64 6,50
3 8,92 8,19
5 8,92 8,12
7 8,63 8,08
9 8,79 8,44
11 8,75 7,92
Tab. 3.2 Comparison of average plate count with quantitative real time PCR
Average yeast counts obtained by serial plating on yeast selective agar and by real time
PCR were compared to each other. As shown in Table 3.2 in some cases the results obtained
by real time PCR were 2 magnitudes higher than culture obtained counts. Despite these results
the Pearson linear correlation test (r = 0.914) showed a good correlation between plate count
and real time PCR results comparable to total count results.
Results
48
Log 10 CFU/cm2 of D. hansenii as determined by; Ripening
(days) Culture Real time PCR
0 2,71 4,88
1 3,10 4,30
3 6,78 6,64
5 7,10 6,45
7 6,98 6,94
9 6,23 7,22
11 6,32 6,86
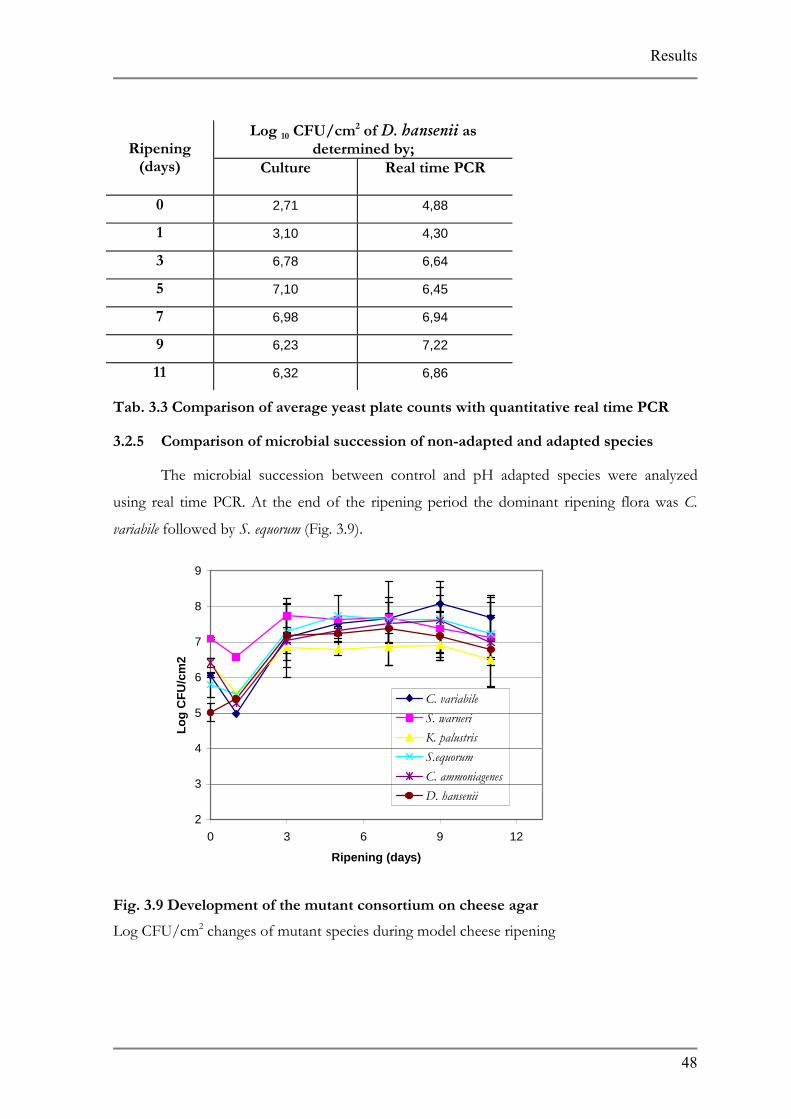
Tab. 3.3 Comparison of average yeast plate counts with quantitative real time PCR
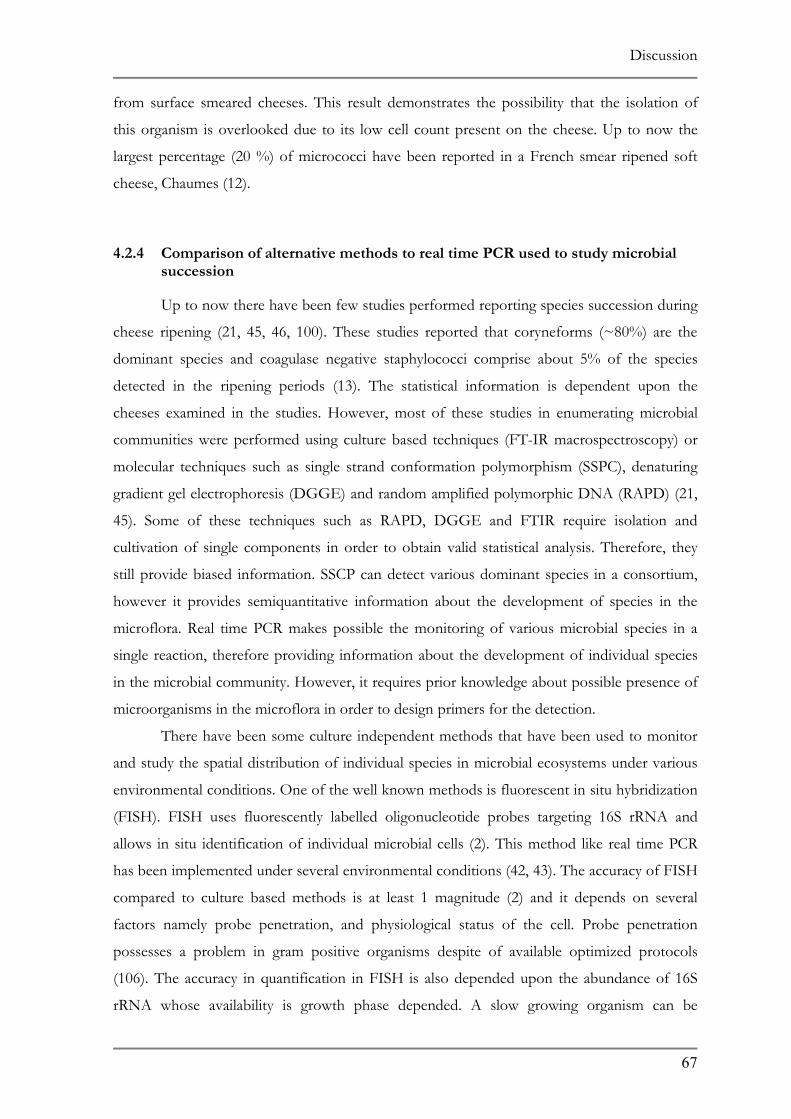
3.2.5 Comparison of microbial succession of non-adapted and adapted species
The microbial succession between control and pH adapted species were analyzed
using real time PCR. At the end of the ripening period the dominant ripening flora was C.
variabile followed by S. equorum (Fig. 3.9).
2
3
4
5
6
7
8
9
0 3 6 9 12
Ripening (days)
Log
CFU
/cm
2
C. variabileS. warneriK. palustrisS.equorumC. ammoniagenesD. hansenii
Fig. 3.9 Development of the mutant consortium on cheese agar
Log CFU/cm2 changes of mutant species during model cheese ripening
Results
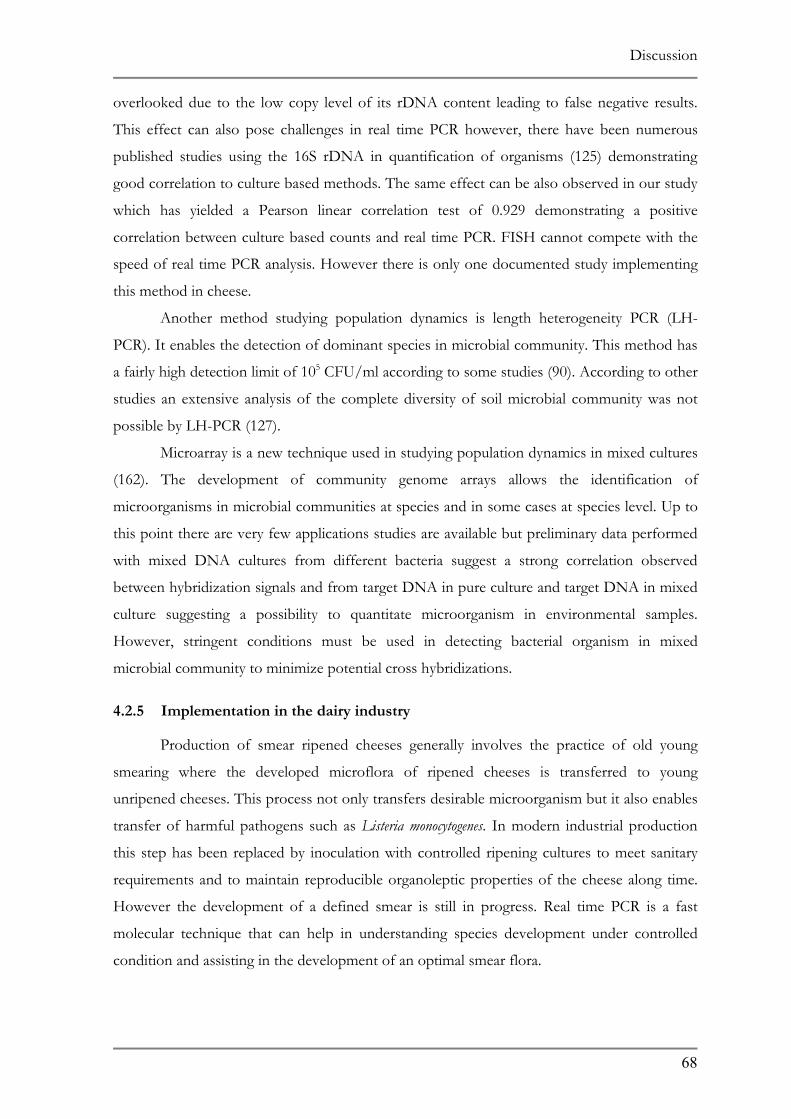
49
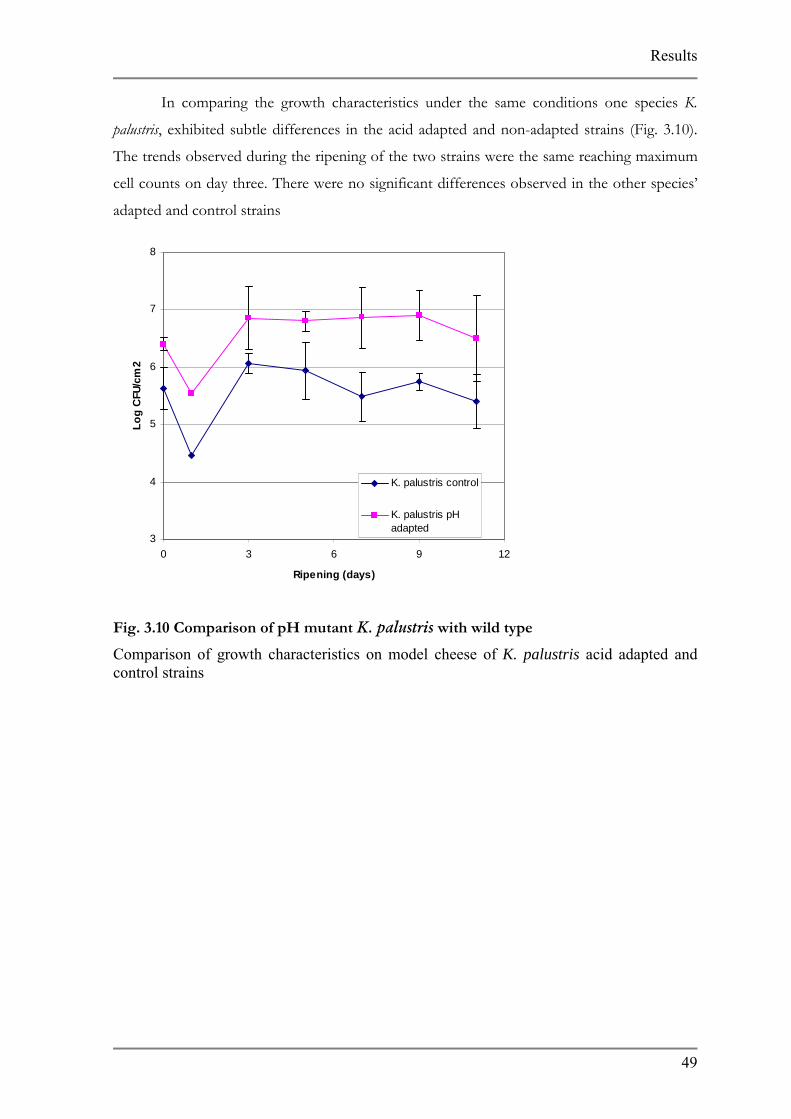
In comparing the growth characteristics under the same conditions one species K.
palustris, exhibited subtle differences in the acid adapted and non-adapted strains (Fig. 3.10).
The trends observed during the ripening of the two strains were the same reaching maximum
cell counts on day three. There were no significant differences observed in the other species’
adapted and control strains
3
4
5
6
7
8
0 3 6 9 12
Ripening (days)
Log
CFU
/cm
2
K. palustris control
K. palustris pHadapted
Fig. 3.10 Comparison of pH mutant K. palustris with wild type
Comparison of growth characteristics on model cheese of K. palustris acid adapted and control strains
Results
50
3.3 ATR of C. glutamicum
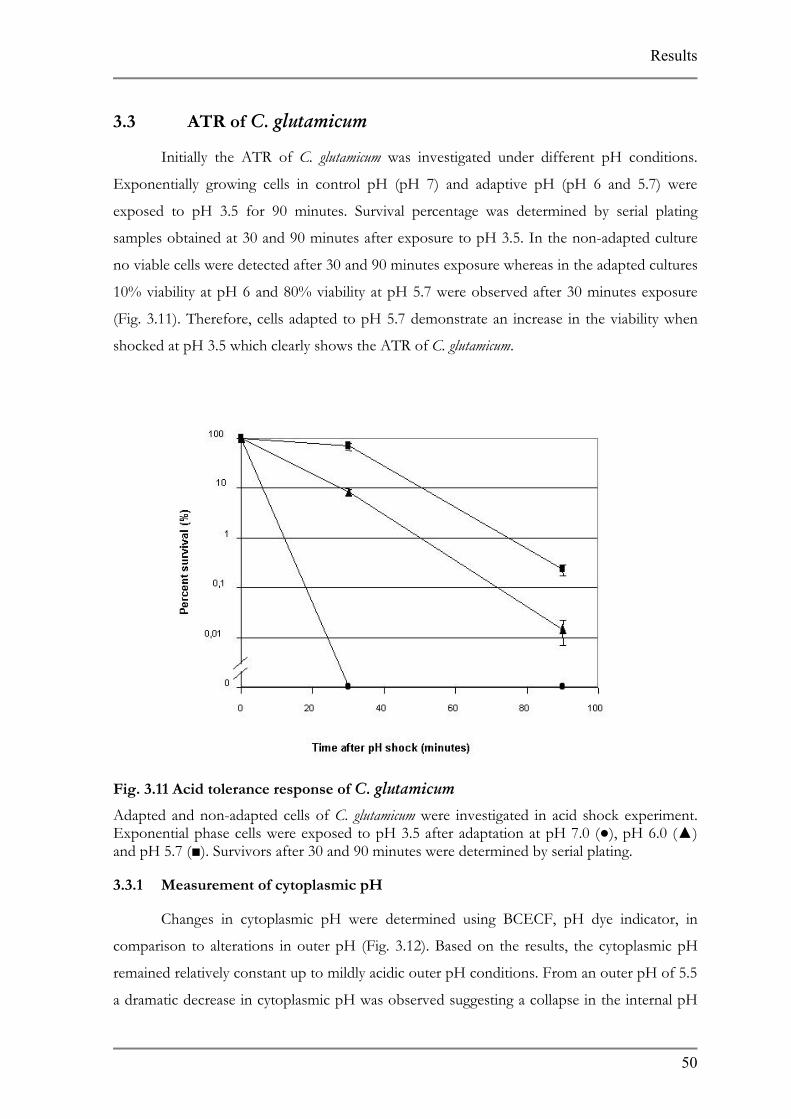
Initially the ATR of C. glutamicum was investigated under different pH conditions.
Exponentially growing cells in control pH (pH 7) and adaptive pH (pH 6 and 5.7) were
exposed to pH 3.5 for 90 minutes. Survival percentage was determined by serial plating
samples obtained at 30 and 90 minutes after exposure to pH 3.5. In the non-adapted culture
no viable cells were detected after 30 and 90 minutes exposure whereas in the adapted cultures
10% viability at pH 6 and 80% viability at pH 5.7 were observed after 30 minutes exposure
(Fig. 3.11). Therefore, cells adapted to pH 5.7 demonstrate an increase in the viability when
shocked at pH 3.5 which clearly shows the ATR of C. glutamicum.
Fig. 3.11 Acid tolerance response of C. glutamicum
Adapted and non-adapted cells of C. glutamicum were investigated in acid shock experiment. Exponential phase cells were exposed to pH 3.5 after adaptation at pH 7.0 (), pH 6.0 () and pH 5.7 (). Survivors after 30 and 90 minutes were determined by serial plating.
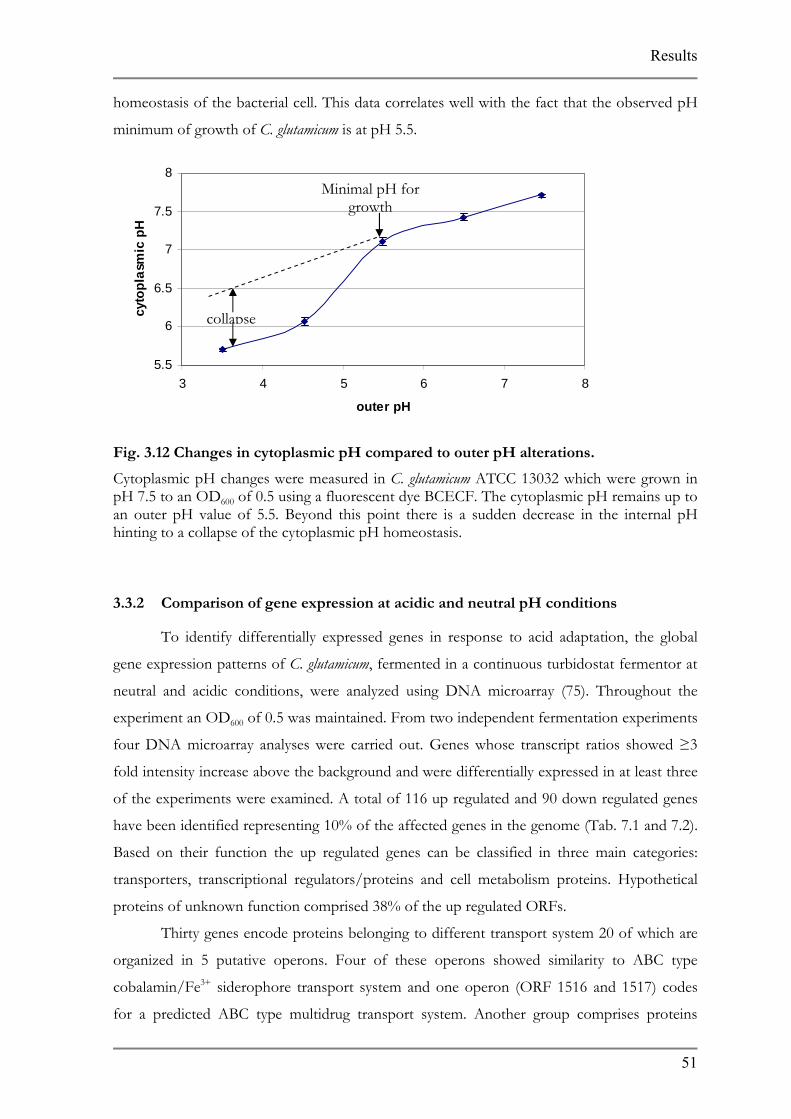
3.3.1 Measurement of cytoplasmic pH
Changes in cytoplasmic pH were determined using BCECF, pH dye indicator, in
comparison to alterations in outer pH (Fig. 3.12). Based on the results, the cytoplasmic pH
remained relatively constant up to mildly acidic outer pH conditions. From an outer pH of 5.5
a dramatic decrease in cytoplasmic pH was observed suggesting a collapse in the internal pH
Results
homeostasis of the bacterial cell. This data correlates well with the fact that the observed pH
minimum of growth of C. glutamicum is at pH 5.5.
5.5
6
6.5
7
7.5
8
3
cyto
plas
mic
pH
Minimal pH for growth
Fig. 3.12 Cha
Cytoplasmic ppH 7.5 to an Oan outer pH hinting to a co
3.3.2 Comp
To id
gene expressio
neutral and a
experiment an
four DNA m
fold intensity
of the experim
have been ide
Based on the
transporters,
proteins of un
Thirty
organized in
cobalamin/Fe
for a predicte
collapse
51
4 5 6 7 8
outer pH
nges in cytoplasmic pH compared to outer pH alterations.
H changes were measured in C. glutamicum ATCC 13032 which were grown in D600 of 0.5 using a fluorescent dye BCECF. The cytoplasmic pH remains up to
value of 5.5. Beyond this point there is a sudden decrease in the internal pH llapse of the cytoplasmic pH homeostasis.
arison of gene expression at acidic and neutral pH conditions
entify differentially expressed genes in response to acid adaptation, the global
n patterns of C. glutamicum, fermented in a continuous turbidostat fermentor at
cidic conditions, were analyzed using DNA microarray (75). Throughout the
OD600 of 0.5 was maintained. From two independent fermentation experiments
increase above the background and were differentially expressed in at least three
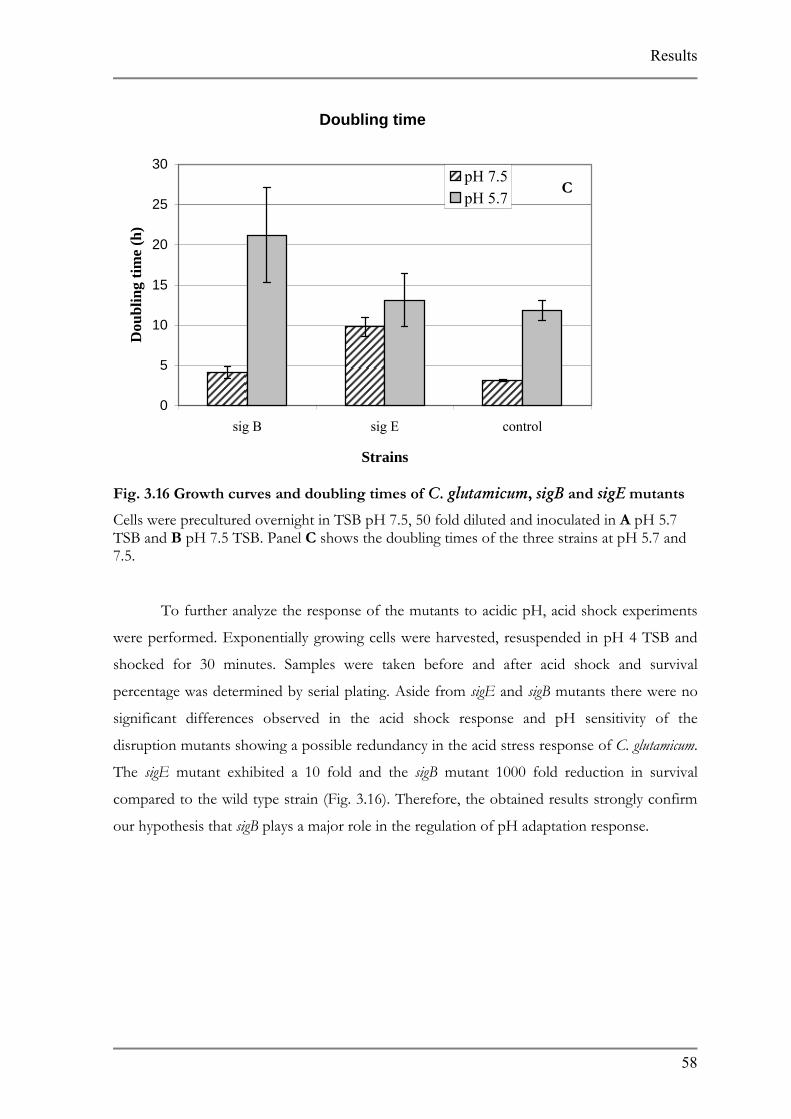
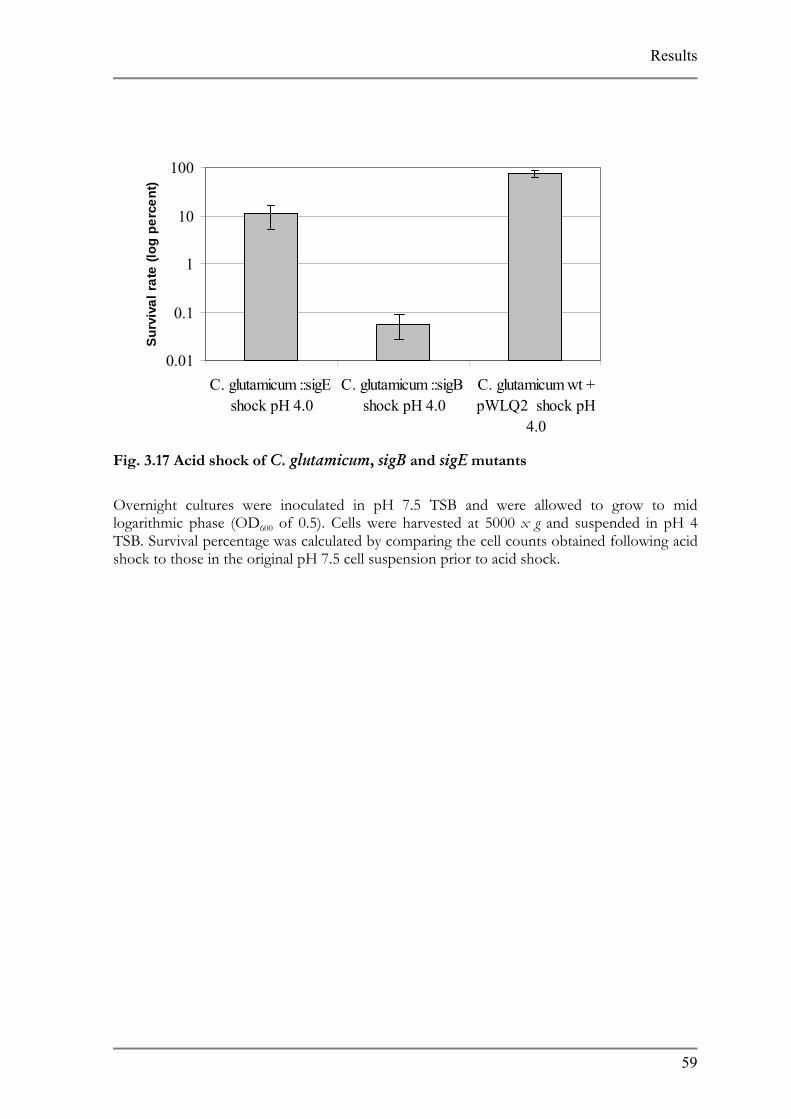
ents were examined. A total of 116 up regulated and 90 down regulated genes
ntified representing 10% of the affected genes in the genome (Tab. 7.1 and 7.2).
ir function the up regulated genes can be classified in three main categories:
transcriptional regulators/proteins and cell metabolism proteins. Hypothetical
known function comprised 38% of the up regulated ORFs.
genes encode proteins belonging to different transport system 20 of which are
5 putative operons. Four of these operons showed similarity to ABC type 3+ siderophore transport system and one operon (ORF 1516 and 1517) codes
d ABC type multidrug transport system. Another group comprises proteins
Results
52
involved in the transport of ionic compounds as in cation transport ATPase, Co/Zn/Cd
efflux component and divalent heavy metal cation transporter.
Six putative transcript regulators were recognized among the up regulated ORFs. Two
transcriptional sigma factors, sigB and sigE, were previously identified in other microorganisms
to be involved in general stress responses (68, 121). The sensory component of histidine
kinase (ORF 1518), Mn dependent transcriptional regulator (ORF 3470) as well as two
putative transcriptional regulators (ORF 927, 1642) completes the list.
The remainder of the up regulated ORFs represents proteins involved in numerous
cell metabolic pathways as in carbohydrate metabolism as well as components for oxidative
fermentation.
Subunits of F0F1 ATP synthase, (ORF 1807-1813) which play a role in the proton
motive force, and the heat shock proteins GroES and GroEL (ORF 1088 and 1092,
respectively), whose role in temperature stress is well documented showed a 2-fold down
regulation. Other proteins showing a down regulation were 25 subunits of ribosomal proteins
and several transport system involved in amino acid and cation transport.
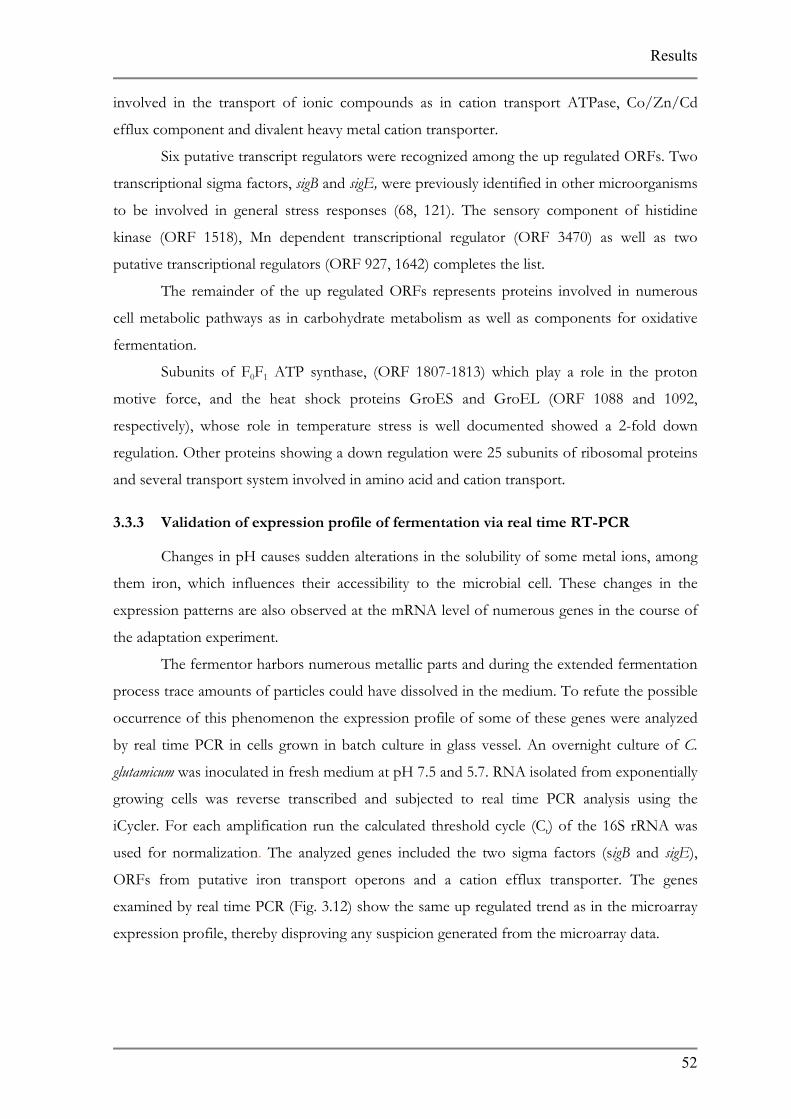
3.3.3 Validation of expression profile of fermentation via real time RT-PCR
Changes in pH causes sudden alterations in the solubility of some metal ions, among
them iron, which influences their accessibility to the microbial cell. These changes in the
expression patterns are also observed at the mRNA level of numerous genes in the course of
the adaptation experiment.
The fermentor harbors numerous metallic parts and during the extended fermentation
process trace amounts of particles could have dissolved in the medium. To refute the possible
occurrence of this phenomenon the expression profile of some of these genes were analyzed
by real time PCR in cells grown in batch culture in glass vessel. An overnight culture of C.
glutamicum was inoculated in fresh medium at pH 7.5 and 5.7. RNA isolated from exponentially
growing cells was reverse transcribed and subjected to real time PCR analysis using the
iCycler. For each amplification run the calculated threshold cycle (Ct) of the 16S rRNA was
used for normalization. The analyzed genes included the two sigma factors (sigB and sigE),
ORFs from putative iron transport operons and a cation efflux transporter. The genes
examined by real time PCR (Fig. 3.12) show the same up regulated trend as in the microarray
expression profile, thereby disproving any suspicion generated from the microarray data.
Results
53
0
2
4
6
8
10
12
14
ORF 2779 sig E sig B ORF 854 ORF 857 ORF 1168 ORF 3549
Fold
cha
nge
in g
ene
expr
essi
on
MicroarrayReal time RT-PCR
Fig. 3.13 Comparison between microarray analysis and real time PCR results
Fold changes of genes expressed in cells adapted to pH 5.7 in a fermentor as analysed by microarray were compared to real time RT PCR of C. glutamicum cells grown in batch culture
3.3.4 Iron bioavailability in undefined complex and defined minimal medium
To further investigate the up regulation of ABC type cobalamin/Fe3+ siderophore
tranport operons an experiment was performed using three different complex media (TSB,
BHI, and TSB+Fe) and one defined minimal medium (CGXII). ORF 855, one of the genes in
the iron siderophore operons, was analyzed by real time PCR for expression level changes in
cells grown at neutral and acidic pH in all of the media. First, we calculated expression level
changes of ORF 855 in each media separately by comparing mRNA level at pH 5.7 to pH 7.5.
The mRNA level increased in TSB, TSB+Fe and BHI whereas it decreased in CGXII (Fig.
3.13).
Results
54
-5
0
5
10
15
20
25
TSB TSB+Fe BHI CGXII
Fold
gen
e ex
pres
sion
cha
nge
Fig. 3.14 Expression of iron siderophore in complex and minimal media.
Expression level changes of ORF 855 analyzed by real time PCR in three complex (TSB, TSB+Fe, BHI) media and one minimal medium (CGXII). Expression levels were determined for each medium separately which showed a considerable increase in TSB+Fe and only a moderate increase in BHI. Expression decreased in CGXII. Error represent standard deviations obtained from two biologically independent experiments.
Next, we compared expression level of ORF 855 at pH 5.7 in TSB+Fe, CGXII and
BHI with TSB at pH 5.7. At acidic pH the mRNA level decreased in all three media compared
to TSB. In TSB+Fe and BHI decrease in mRNA expression was modest, but at drastic
decrease was observed in CGXII compared to TSB. The same comparison was performed at
neutral pH. At pH 7.5 we also observed a decrease in mRNA level in all three media with a
considerable decrease in mRNA level in CGXII and TSB+Fe, but only a slight decrease in
BHI compared to the expression level detected in TSB at neutral pH (Fig. 3.14).
Results
55
-25
-20
-15
-10
-5
0
Fold
cha
nge
expr
essi
on c
hang
eTSB+Fe BHI CG-XII TSB+Fe BHI CG-
Fig. 3.15 Bioavailability of iron in complex and minimal medium
pH 5.7 pH 7.5
mRNA level of ORF 855 in three media (TSB+Fe, BHI, CGXII pH 7.5 and 5.7) were compared to mRNA levels in TSB pH 7.5 and 5.7. At pH 7.5 a considerable decrease in expression level in CGXII and TSB+Fe was noticed. At pH 5.7 expression level further decreased in CGXII, however it increased dramatically in TSB+Fe.
3.3.5 Influence of acidic pH on the growth of the disruption mutants
To investigate the function of the up regulated genes in acid adaptation, single
crossover mutants of 17 significantly up regulated ORF were generated (Table 3.3).
ORF NCBI no. Annotation Ratioa
854 NCgl0377 hypothetical membrane protein 7.05 857 NCgl0380 ABC-type transporter, ATPase component, similar to
ABC-type cobalamin/Fe3+-siderophores transport systems, ATPase components
4.43
927 NCgl0430 bacterial regulatory protein, predicted arsR family transcriptional regulator
4.87
3347 NCgl1646 hypothetical protein 4.29 3549 NCgl0482 ABC-type transporter, ATPase component, similar to
ABC-type cobalamin/Fe3+-siderophore transport system
5.06
Results
56
ORF NCBI no. Annotation Ratioa
3550 NCgl0483 ABC-type transporter, permease component, FecCD transport family; similar to ABC-type
cobalamin/Fe3+-siderophore transport system
4.36
3551 NCgl0484 ABC-type transporter, permease component, FecCD transport family; similar to ABC-type
cobalamin/Fe3+-siderophore transport system
4.32
3452 NCgl2965 similar to permeases of the major facilitator superfamily
5.42
2920 NCgl2450 involved in propionate catabolism 35.16 1169 NCgl0636 ABC-type transporter, ATPase component, similar to
ABC-type cobalamin/Fe3+-siderophores transport systems
4.99
1170 NCgl0637 ABC-type transporter, permease component, similar to ABC-type cobalamin/Fe3+-siderophores
transport systems
5.58
3544 NCgl0382 hypothetical membrane protein 6.23 518 Ncgl0123 hypothetical protein 6.99 1346 NCgl0773 siderophore-interacting protein 7.40 1703 NCgl1075 DNA-directed RNA polymerase specialized sigma
subunit sigB similar to sigma 70 / sigma 32 2.03
2000 NCgl1844 DNA-directed RNA polymerase specialized sigma subunit, similar to sigma 70factor (ECF subfamily)
and sigma 24
2.17
1632 NCgl1012 Mg-chelatase subunit ChlI 4.12
Tab. 3.4 ORFs showing at least a two fold increase in transcription levels in response to acid adaptation at pH 5.7.
a ratios are the average of four microarray experiments.
To test for the mutants’ pH sensitivity growth experiments were performed at pH 7.5
and 5.7 in a honeycomb microplate reader Bioscreen C. The wild type strain contained
plasmid pWLQ2 to exclude the effect of the kanamycin resistance genes used in creating the
disruption mutants.
Only two mutants, sigB and sigE, showed a decreased growth when grown in pH 5.7
compared to the wild type strain (Fig. 3.15 A, B). As shown in figure 3.15 A, the sigB mutant
was more susceptible to pH 5.7 compared to sigE mutant, whereas at pH 7.5 sigE’s (Fig. 3.15
C) doubling time was about three fold higher compared to the other two strains. This suggests
that sigE has an effect under normal condition but it is not required growth under stressed
conditions whereas, sigB is primarily responsible for the acid tolerance response in the acid
adapted C. glutamicum cells.
Results
57
C. glutamicum pH 5.7
0.050
0.100
0.150
0.200
0.250
0.300
0.350
0. 2. 4. 6. 8. 10. 12. 14. 16. 18. 20. 22. 24.
Time (h)
OD
600
controlsig Bsig E
A
C. glutamicum pH 7.5
0.000
0.100
0.200
0.300
0.400
0.500
0.600
0.700
0.800
0.900
1.000
0. 2. 4. 6. 8. 10. 12. 14. 16. 18. 20. 22. 24.
Time (h)
OD
600
controlsig Bsig E
B
Results
58
Doubling time
0
5
10
15
20
25
30
sig B sig E control
Strains
Dou
blin
g tim
e (h
)
pH 7.5pH 5.7
C
Fig. 3.16 Growth curves and doubling times of C. glutamicum, sigB and sigE mutants
Cells were precultured overnight in TSB pH 7.5, 50 fold diluted and inoculated in A pH 5.7 TSB and B pH 7.5 TSB. Panel C shows the doubling times of the three strains at pH 5.7 and 7.5.
To further analyze the response of the mutants to acidic pH, acid shock experiments
were performed. Exponentially growing cells were harvested, resuspended in pH 4 TSB and
shocked for 30 minutes. Samples were taken before and after acid shock and survival
percentage was determined by serial plating. Aside from sigE and sigB mutants there were no
significant differences observed in the acid shock response and pH sensitivity of the
disruption mutants showing a possible redundancy in the acid stress response of C. glutamicum.
The sigE mutant exhibited a 10 fold and the sigB mutant 1000 fold reduction in survival
compared to the wild type strain (Fig. 3.16). Therefore, the obtained results strongly confirm
our hypothesis that sigB plays a major role in the regulation of pH adaptation response.
Results
59
0.01
0.1
1
10
100
C. glutamicum ::sigE shock pH 4.0
C. glutamicum ::sigB shock pH 4.0
C. glutamicum wt +pWLQ2 shock pH
4.0
Surv
ival
rate
(log
per
cent
)
Fig. 3.17 Acid shock of C. glutamicum, sigB and sigE mutants
Overnight cultures were inoculated in pH 7.5 TSB and were allowed to grow to mid logarithmic phase (OD600 of 0.5). Cells were harvested at 5000 x g and suspended in pH 4 TSB. Survival percentage was calculated by comparing the cell counts obtained following acid shock to those in the original pH 7.5 cell suspension prior to acid shock.
Discussion
4 Discussion
Given that cheese ripening is a complex, long biochemical and at the same time an
expensive process, acceleration of cheese ripening has received considerable attention in the
scientific community. One way of accelerating this process is through the selection of better
adapted species to the cheese environment. Strain improvement through the use of natural
selection is one of the most effective ways in obtaining microorganism adapted to specific
environmental conditions. This method is also plausible for the food industry since the
mutant strains obtained by this method are widely accepted as less significant process changes
and are allowed for consume. Up to now, studies performed in accelerating cheese ripening
concentrated on modifying the starter culture added during cheese production. To our
knowledge modification of ripening bacterial species existing in the smear flora were not
performed.
4.1 Adaptation of cheese ripening bacterial species to low pH
Before application of the secondary flora, depending on cheese variety, acidity of the
cheese ranges between pH 4.5 and 5.3 (10). This low pH has an effect on the growth of acid
sensitive bacterial species found in the secondary flora. The acidity of the cheese is due to the
accumulation of organic acids such as lactic, acetic and propionic acid where lactic acid is the
least and propionic acid is the most effective inhibitor. However, it has been shown that
lactate in cheese curds is present at much higher concentration than either of the two other
acids (10). Therefore in this work, we used lactic acid to adapt four ripening bacterial species
(C. ammoniagenes, C. variabile, S. equorum and K. palustris) to low pH.
We used natural selection in adapting the species to low pH by gradually exposing the
species to low acidity. It has been shown that constant exposure of microorganisms to acid
with time will lead to acid resistant strains through the induction of gene synthesis. This effect
has been demonstrated in numerous organisms such as S. mutans and E. hirae (8) where the
adaptation of the above named organisms in a continuous culture had given rise to strains that
were acid adapted after being exposed to acidic conditions for only one generation (18). It has
been also shown that prolonged exposure to stress leads to changes in genome structure
ranging from simple alteration in DNA sequences, such as point mutation, to dynamic events
in the genome structure (161). This is demonstrated by a study performed in E. coli using a
semi-continuous culture propagated for 10,000 generations. In examining the genetic structure
of the obtained mutants genomic rearrangements including transpositions, rather than point
mutations were detected (113).
60
Discussion
In adapting the species, we cycled the mutants between solid and liquid culture
imitating conditions present during cheese production. The species were adapted to acidic
condition at 30°C.
Strain/pH
No of pH adapted mutant strains
obtained
No. of mutant strains
growing at 30°C
No. of mutant strains
growing at 15°C
No. of mutant strains
showing stability at
30°C C. ammoniagenes/pH 5.8 2 1 2 0
K. palustris/pH 5.8 3 3 0 1
S. equorum/pH 5.3 3 3 1 3
C. variabile/ pH 5.3 4 4 4 3
Tab. 4.1 Summary of pH adaptation results describing the effective number of mutant strains obtained for each bacterial species growing at their adapted pH and at different temperatures (30°C and 15°C) at the end of the adaptation experiment.
C. ammoniagenes and K. palustris were adapted to pH 5.8 whereas, S. equorum and C.
variabile were adapted to pH 5.3. Repeated attempts to adapt the obtained mutant strains to
lower pH were not successful.
Based on the growth characteristics of the mutant species it is noticeable that there are
phenotypic differences between the mutant strains obtained from the same species. For C.
ammoniagenes we obtained two mutant strains of which one mutant strain S7-3-3/a-6-1 was able
to grow better at 30°C as the parent cell whereas the second mutant was not. However, both
mutant strains were able to grow at 15°C better than the parent strain.
For S. equorum three mutant strains were obtained. Two of the mutant strains grew
moderately better than the parent strain at 30°C and pH 5.3 however, at 15°C they grew worse
at pH 5.3 than the parent strain. There were also differences observed in three C. variabile
mutant strains which exhibited minor differences compared to mutant strain 16-1-1/e-2.
Based on these results we can assume that the mutations accumulated in the strains imparted
different phenotypic characteristics to them. Differences in phenotypic characteristics among
three parallel culture of one species were also made in a study improving the cryotolerance of
L. delbrueckii by natural selection (105).
Although the selection process took place at 30°C it is observed for some species that
acid adaptation has also improved their growth characteristic at 15°C. It is also interesting to
61
Discussion
observe that some of the mutant strains exhibiting substantially positive phenotype compared
to the parent cell at 30°C also demonstrate the same phenomenon at 15°C. These results
would suggest that mutations that improved acidity have also improved growth at lower
temperatures. It is also described in literature that exposure of a organisms to one stress leads
to improve resistance to other stresses (145).
4.1.1 Mutation frequencies
Mutations may be associated with the change of a single nucleotide through
substitution deletion or rearrangement of one or more nucleotides in the chromosome. Most
mutations occur at a low frequency, 10-5-10-10 per generation, at any point along the gene but
certain mutation lead to a organism that is better adapted to its environmental and improve its
biocatalytic performance (114).
The mutation frequency at pH 6 has been estimated for each of the species by comparing the
ratios of the mutants in the total cell population. As observed in Table 3.1 the mutation
frequency ranged from 10-3 to 10-1 representing higher mutation frequency as the one
documented in the literature. Most of the documented frequencies were obtained in strain
improvement experiment using chemical mutagenic agents such as N-methyl-N-nitro-N-
nitrosoguanidine (MNNG). MNNG induces mutations by the transition pathways 99% of the
time and 95% of these are GC to AT transitions thereby maximizing the frequency of desired
mutations (5). Under these conditions the mutation frequency typically ranged from 10-3 to
10-4 assessed through the use of antibiotics, e.g. rifampicin known to cause mutations in the
rpoB gene encoding the beta subunit of RNA polymerase, whose mutation rates have been
estimated in a number of species (74). Using chemical mutagenic agents several strain were
obtained with increasing production for bacterial metabolites such as erythromycin analogues,
penicillin, and amino acids (38, 130). However, there are disadvantages in using chemical
mutagenic agents namely the increase of undesirable mutations caused by the accumulation of
numerous random mutagenic events due to its non-targeted effect.
In using lactic acid the mutation frequency is higher compared to chemical mutagens,
but at the same time it acts as a specific agent in the selection process by imparting a target
oriented mutagenesis. It can be assumed that spontaneous mutations, using specific stressor,
have a tendency to create mutations in a certain area of the genome affecting genes under
selection. This phenomenon has been previously demonstrated in a screening experiment
generating spontaneous β-gal mutants of L. bulgaricus. The mutants obtained under the X-gal
selection pressure demonstrated DNA rearrangements giving rise to different deletions
located predominantly within the β-gal gene, and in one case, causing the deletion of the entire
62
Discussion
gene (104). Therefore, the higher mutation frequency is probably due to the extreme
redundancy resulting from numerous changing producing a pH resistant phenotype.
4.1.2 Disadvantages of natural selection
There are numerous disadvantages associated with natural selection which lies not only
on the process but also on the selection method. It is documented that during natural
selection numerous uncharacterized spontaneous mutations occur in the organisms’ genome.
It has been estimated by Chao & Cox that the rate of advantageous mutation is 5x10⁻⁹ or five
advantageous mutation equivalents per generation (39). It has also been demonstrated in E.
coli cells that 0.1% of mutations taking place during generations are advantageous and the rest
have a neutral effect on the organism (39). Repeated exposure can also result in the
accumulation of deleterious mutation off-setting the effect of desired mutation. This can be
observed in our study where some of the mutant strains exhibited worse phenotypic
characteristics compared to the parent cell. The appearance of the deleterious mutations can
be explained the following way. Due to prolonged stress conditions a new mutator allele arises
termed a stress induced mutagenic allele. These stress induced mutator allele produces more
mutation than a constitutive allele therefore, the beneficial mutations accumulated in the
constitutive allele have a greater chance of being lost in genomes loaded by deleterious
mutations (141). For this reason a large number of strains need to be screened in order to find
a mutant strain with the desired phenotype which requires a vast amount of time and
resources. In generating our mutants we faced the same difficulties as generation of mutants
was species depended. The easiest to adapt was C. variabile and the most difficult was K.
palustris. This effect is also demonstrated by the number of mutant that we needed to screen
for each of the bacterial species.
The next challenge of natural selection is the stability of the mutations. Most genetic
changes are relatively stable and are detected as a mutation through mutant phenotype.
However, it has been estimated that one in 103 cells in a population may carry a duplication of
a chromosome segment. The amplification of this region is not a stable genetic change and
reversion of mutation occurs within one generation when cells are grown under non-selective
conditions (18). As shown in Table 4.1 some of the mutants have lost their beneficial
characteristics at growing at low pH after cultivated at neutral pH for 24 h which could be due
to the above mentioned reversion. Therefore, in order to sustain the desired phenotype the
organisms must be always under the selection pressure that was used to generate the mutant
species. It was also noticed that reinoculation of the mutant species from one plate to another
has also caused the loss of the phenotype although the mutant species was always under
63
Discussion
selection pressure. This phenomenon has been described in literature and to counteract this
phenomenon the mutant species once generated need to be frequently reisolated. This has
been described for a number of industrial production organisms such as Ashbya gossypii that
overproduces riboflavin and Penicillium chrysogenum a penicillin hyperproducer (161). In case of
Ashbya after prolonged reculturing the fungus has reduced its riboflavin production although it
has improved its growth rate. When the selection pressure on penicillin production was
decreased or interrupted, Penicillium chrysogenum reduced the copy number of its plasmid and as
a consequence lost its high penicillin productivity.
Since classical strain selection creates unspecified mutations it would be interesting to
analyze the mutants obtained from each of the strains to determine which genes have been
affected by this process. It would be also interesting to establish if there are variations among
the mutants in the affected genes. This information could provide a better overview as to what
genes are affected under acid adaptive conditions thereby, paving the way for further studies
in genetic manipulation of these organisms.
64
Discussion
4.2 Real time analysis of ripening consortium
The microbial evolution of the species in the smear of soft ripened cheeses has not
been fully investigated due to the inadequateness of methods that have been applied. In order
to provide a better overview of species succession on the cheese surface new techniques
needed to be developed. One of these techniques is quantitative real time PCR. In using real
time PCR to monitor species succession proper primer design is one of its crucial steps. The
primers not only have to meet the required guidelines described for real time PCR but they
also have to distinguish between closely related species. Furthermore, the method also needs
to be correlated to other conventional methods in order to be acceptable.
4.2.1 Identification based on 16S and 18S sequencing
Enumeration of dairy microorganism was previously based on bacterial cultivation
followed by identification of the dominant microorganism through phenotypical methods.
These methods are tedious, restricted to the cultivation of viable population and thereby
providing erroneous information about population dynamics (58). Furthermore, nucleotide
base sequences provide tangible evidence of the identity of a bacterial isolate compared to
sometime subjective interpretation of phenotypic observations (125). For these reasons
molecular approaches based on 16S and 18S rRNA genes have facilitated a culture
independent approach for analysis of complex ecosystems. In sequencing the 16S and 18S
rRNA genes of the ripening consortium there was a high degree of similarity observed in the
sequences of the ripening bacterial species e.g. between C. ammoniagenes and C. variabile and
between S. equorum and S. warneri. There were nucleotide base differences observed in the
sequences, therefore the primers were positioned in these areas. The primers were designed in
such a manner so that the non conservative sites were located at the 3’ end of the primers. As
shown in Fig. 3.1 the primers designed were specific and amplified only the desired ripening
species. Therefore, we successfully designed primers that were able to distinguish between
closely related species.
4.2.2 Detection limits using real time PCR
Specificity, a key factor for accurate quantification of the bacteria of interest, was
determined in performing the reaction with a mixture of genomic DNA obtained from the six
species used in the study and analyzed for unspecific products. Nonspecific signals were not
detected in the reaction. The reaction was also tested for inhibition due to competitive binding
65
Discussion
of a nontarget template in the PCR reaction. In this case, there was also no inhibition
observed with increasing non template concentration in the PCR reaction.
Detection limits varied from species to species ranging from 102 CFU to 103 CFU,
corresponding to 8 to 80 CFU per PCR reaction, respectively. The variability in the detection
limit is probably due to the primer binding region or to the secondary structure occurring in
the template. However, our detection limits correspond to the detection limits reported in
other studies (98, 111).
The real time quantitative PCR results correlated adequately with enumeration
obtained by culture dependent method. In comparing the total aerobic count obtained by real
time PCR and serial plating results there was an insignificant difference of 0.5 log units
between the two methods. Compared to quantification by determination of viable counts, the
quantification of D. hansenii by real time PCR yielded approximately 100 fold higher numbers
at the first 2 sample points. This is probably due to the yeast cells entering a growth phase on
the first day of ripening and the possibility of detecting dead cells via PCR.
4.2.3 Monitoring of ripening consortium by quantitative real time PCR
We used real time PCR to monitor and quantify the progression of six ripening
consortia on a model cheese. The species chosen were representative of microorganism
occurring on smear ripened cheeses. In monitoring the progression of the species at 15°C at a
RH of 90% for 11 days it was noticed that S. equorum was the dominant species, followed by
C. variabile and C. ammoniagenes. The least dominant species in the microbial consortium was K.
palustris. D. hansenii, counts decreased on day 1 increasing on day three after which remained
constant during ripening (Fig. 3.8).
The trends observed under this condition are similar to trends observed under other
model cheese studies (11, 14). There have been some studies performed on ripening using a
model cheese smeared with a defined microflora consisting of 5 species. Under these
conditions, it was observed that S. equorum was the dominant species for the first two weeks of
ripening. The coryneforms species included in the smear dominated only in the later stages of
cheese production at which points a decrease in S. equorum cell counts were observed (11, 14).
The results of these studies confirm the results obtained in our study since the cheese agar
plates were “ripened” only for 11 days. There has been a slight increase in C. variabile cell
count therefore we presume that after prolonged ripening conditions C. variabile would have
reached levels reported in literature (15).
It is interesting to notice the decline in cell count of K. palustris. It has been previously
shown that micrococci represent the smallest percentage among the microbial flora isolated
66
Discussion
from surface smeared cheeses. This result demonstrates the possibility that the isolation of
this organism is overlooked due to its low cell count present on the cheese. Up to now the
largest percentage (20 %) of micrococci have been reported in a French smear ripened soft
cheese, Chaumes (12).
4.2.4 Comparison of alternative methods to real time PCR used to study microbial succession
Up to now there have been few studies performed reporting species succession during
cheese ripening (21, 45, 46, 100). These studies reported that coryneforms (~80%) are the
dominant species and coagulase negative staphylococci comprise about 5% of the species
detected in the ripening periods (13). The statistical information is dependent upon the
cheeses examined in the studies. However, most of these studies in enumerating microbial
communities were performed using culture based techniques (FT-IR macrospectroscopy) or
molecular techniques such as single strand conformation polymorphism (SSPC), denaturing
gradient gel electrophoresis (DGGE) and random amplified polymorphic DNA (RAPD) (21,
45). Some of these techniques such as RAPD, DGGE and FTIR require isolation and
cultivation of single components in order to obtain valid statistical analysis. Therefore, they
still provide biased information. SSCP can detect various dominant species in a consortium,
however it provides semiquantitative information about the development of species in the
microflora. Real time PCR makes possible the monitoring of various microbial species in a
single reaction, therefore providing information about the development of individual species
in the microbial community. However, it requires prior knowledge about possible presence of
microorganisms in the microflora in order to design primers for the detection.
There have been some culture independent methods that have been used to monitor
and study the spatial distribution of individual species in microbial ecosystems under various
environmental conditions. One of the well known methods is fluorescent in situ hybridization
(FISH). FISH uses fluorescently labelled oligonucleotide probes targeting 16S rRNA and
allows in situ identification of individual microbial cells (2). This method like real time PCR
has been implemented under several environmental conditions (42, 43). The accuracy of FISH
compared to culture based methods is at least 1 magnitude (2) and it depends on several
factors namely probe penetration, and physiological status of the cell. Probe penetration
possesses a problem in gram positive organisms despite of available optimized protocols
(106). The accuracy in quantification in FISH is also depended upon the abundance of 16S
rRNA whose availability is growth phase depended. A slow growing organism can be
67
Discussion
overlooked due to the low copy level of its rDNA content leading to false negative results.
This effect can also pose challenges in real time PCR however, there have been numerous
published studies using the 16S rDNA in quantification of organisms (125) demonstrating
good correlation to culture based methods. The same effect can be also observed in our study
which has yielded a Pearson linear correlation test of 0.929 demonstrating a positive
correlation between culture based counts and real time PCR. FISH cannot compete with the
speed of real time PCR analysis. However there is only one documented study implementing
this method in cheese.
Another method studying population dynamics is length heterogeneity PCR (LH-
PCR). It enables the detection of dominant species in microbial community. This method has
a fairly high detection limit of 105 CFU/ml according to some studies (90). According to other
studies an extensive analysis of the complete diversity of soil microbial community was not
possible by LH-PCR (127).
Microarray is a new technique used in studying population dynamics in mixed cultures
(162). The development of community genome arrays allows the identification of
microorganisms in microbial communities at species and in some cases at species level. Up to
this point there are very few applications studies are available but preliminary data performed
with mixed DNA cultures from different bacteria suggest a strong correlation observed
between hybridization signals and from target DNA in pure culture and target DNA in mixed
culture suggesting a possibility to quantitate microorganism in environmental samples.
However, stringent conditions must be used in detecting bacterial organism in mixed
microbial community to minimize potential cross hybridizations.
4.2.5 Implementation in the dairy industry
Production of smear ripened cheeses generally involves the practice of old young
smearing where the developed microflora of ripened cheeses is transferred to young
unripened cheeses. This process not only transfers desirable microorganism but it also enables
transfer of harmful pathogens such as Listeria monocytogenes. In modern industrial production
this step has been replaced by inoculation with controlled ripening cultures to meet sanitary
requirements and to maintain reproducible organoleptic properties of the cheese along time.
However the development of a defined smear is still in progress. Real time PCR is a fast
molecular technique that can help in understanding species development under controlled
condition and assisting in the development of an optimal smear flora.
68
Discussion
4.2.6 Comparison of pH adapted and control ripening species on model cheese
Wild and mutant strains were inoculated onto the model cheese and monitored for
their development during the ripening process using real time PCR. For this study mutant
species were selected based on the growth characteristics observed under 15°C and 30°C. In
comparing the ripening process of the control to the mutant species the trends observed
between the two ripening processes were different. The dominant species at the end of the
ripening period was C. variabile followed by S. equorum. Based on this result one can assume
that the accumulated mutations improving the acid tolerance in S. equrom have decreased its
capabilities under biofilm condition.
One of the mutant species K. palustris exhibited significant differences compared to
parent cell (Fig3.10). There were no significant differences observed by the other ripening
species is could be the result of a number of factors. One of them is that the studies were
performed on a model cheese where the behavior of the species can deviate from normal
behavior observed on cheese. These differences can also be attributed to the components of
the model cheese. Another reason lies in the usage of the selected mutants. We only selected
the mutants showing a robust phenotypic characteristic for this experiment. However, this
cannot exclude that the other mutants behavior would be worse in cheese production. Up to
this point the mutant species were not tested under industry settings therefore, it is unknown
whether the mutations have a selective advantage/disadvantage concerning important
technological properties such as aroma production.
69
Discussion
4.3 Acid adaptation in Corynebacterium glutamicum
Acid stress is the combined effect of low pH caused by inorganic acids and organic
acids present in the environment (7). C. glutamicum encounters a wide range of external pHs in
its natural habitat and during industrial processes. Growth at a pH substantially lower than the
cytoplasmic pH induces protective responses with two fundamentals aims: to maintain
internal pH homeostasis and to initiate the expression of regulatory proteins preventing and
repairing damages caused by acid stress. C. glutamicum is a neutrophile and the effects of acid
stress on its cell physiology have not been studied in detail. In this study we used DNA
microarray to study the genome-wide expression of pH adapted C. glutamicum. We found a
total of 116 up and 90 down regulated ORFs. In some cases, it is possible to deduce or
suggest the functions of the up regulated genes, and in other cases, the rationale for change of
expression is at present obscure. In this study we have shown that C. glutamicum can maintain
its cytoplasmic pH in a relatively broad range of external pH. We have also found the
expression of a number of genes relevant to prevention and repair mechanism under acid
stress. In the following sections their relevance in acid adaptation is discussed.
4.3.1 Induction of cation and multidrug transport systems
Bacteria utilize various mechanisms to maintain pH homeostasis within the cell. One
of the well-described mechanisms is the F1F0 ATPase which either produces ATP using the
transmembrane proton gradient through proton influx (acidification of the cytoplasms) or
expels protons from the cell using the energy provided by ATP hydrolysis (32). In aerobic
organisms such as in E. coli and B. subtilis, the F1F0 ATPase mainly functions in ATP synthesis
(102). In organisms without a respiratory chain such as L. lactis (86), E. hirae (85), S. mutans, S.
sanquis (9) and L. acidophilus (88) the F1F0 ATPase system plays an important role in
maintaining cytoplasmic pH homeostasis in acid adaptation via proton extrusion (55, 79).
However, there are disadvantages in using this system for internal pH homeostasis due to its
high energy cost and there is evidence suggesting the presence of other systems in bacterial
species lacking a respiratory chain (16). While the down regulation of the F1F0 ATPase system
in C. glutamicum may result in a decrease of acidification of the cytoplasm, it will also decrease
ATP synthesis. We therefore believe that its down regulation does not play a major role in
cytoplasmic pH homeostasis and may rather be due to a decreased need in ATP synthesis in
acid adapted cells which slows down their growth rate.
70
Discussion
Among the transport proteins induced through acid adaptation, several cation
transport ATPase genes (ORF 851, 2433 and 2905) were observed in our study. While it is
unknown which cations are transported by the proteins encoded, cation transport ATPases
such as K+ -or Na+ - ATPases have been described in various organisms such as in L. lactis
(81) and S. mutans (35) as constituting one of the systems responsible for pH homeostasis by
acidifying or alkalinizing cytoplasmic pH through a cation – proton antiport mechanism (17).
Increased expression of a putative multidrug transport system was also observed.
Being a soil bacterium C. glutamicum encounters a wide variety of cytotoxic compounds in its
natural habitat which lead to the development of various protective mechanisms that can
export a wide range of toxic components before these molecules have a chance to damage
cellular processes. It is suggested that multidrug efflux system (MDR) are part of the natural
defense mechanism of bacteria against toxic compounds, e.g. lipophilic inhibitors, existing in
the natural environment (110). The broad substrate specificity of these efflux pumps makes
them suitable for this defensive role as the bacteria cannot predict the nature of inhibitors it
will be confronted with (117). Due to this broad substrate specificity of the MDR efflux
pumps we suggest that this system could also play a role in pH resistance of C. glutamicum by
expelling the accumulated anionic form of the dissociated organic acid from the cytoplasm.
4.3.2 Iron transport is induced at low pH
Numerous iron transport genes were induced by acidic pH. These ORFs are organized
in 4 putative operons encoding components for the iron Fe3+ ABC siderophore transporters.
Iron siderophores are extracellular iron chelators secreted by bacteria under iron limiting
conditions to help solubilize iron prior to transport (87). According to literature, at aerobic
conditions and neutral pH, iron is present in the insoluble form of Fe3+, whereas low pH
increases solubility of iron by reducing it to Fe2+ thereby, boosting bioavailability of iron in the
medium (65). Our study in complex media (tryptic soy broth, TSB) assessing the iron
availability at low pH proved contradictory to the expected theoretical effect. Expression level
of ORF 855 encoding a periplasmic component of an ABC-type cobalamin/Fe3+-siderophores
transporter, at pH 5.7 substantially increased in different complex media (BHI, TSB, TSB+Fe)
compared to expression levels at neutral pH (Figure 4). On the other hand, in defined minimal
medium (CGXII) at acidic pH, ORF 855 showed decreased expression level, verifying the
theory on pH-dependence of iron bioavailability in the biological experiment. These results
suggest an iron arrestive effect of the complex media at acidic pH.
In the second experiment we compared the mRNA level of ORF 855 measured in
BHI, CGXII and TSB+Fe to the mRNA level in TSB. In this experiment we observed a
71
Discussion
decrease in expression level at neutral pH in three media (BHI, CGXII, TSB+Fe) compared
to TSB. The low mRNA level of ORF 855 in CGXII and TSB+Fe compared to TSB was
considerable due to the relatively high amount of added iron. In BHI the expression level was
also moderately lower compared to TSB, presumably due to the higher iron content of BHI
resulting from the ingredients present in this medium. In summary, at neutral pH the iron
supplement in TSB media (TSB+Fe) repressed the expression of the iron siderophore
transporter gene (ORF 855).
At acidic pH in CGXII the expression level of ORF 855 was substantially lower
compared to that in TSB. This result is in accord to the iron excess in CGXII medium at
acidic pH. In TSB+Fe medium, despite iron supplement, we observed only a slightly lower
mRNA level of ORF 855 compared to TSB medium. In BHI medium we found the same
effect as in the iron supplemented TSB medium (TSB+Fe), indicating the possibility, that this
effect is presumably coupled generally to the complex components of the rich media. This led
us to suggest that the theoretical facts about the pH effect on the bioavailability of iron are
demonstrated in a defined minimal media, but not in complex media. Therefore, the up
regulations of the iron Fe3+ ABC siderophore transporters observed in our microarray
experiment are presumably the result of the complex medium which effects iron availability at
low pH, and renders inadequate level of available iron for uptake at acidic pH.
4.3.3 DNA repair in acid adaptation
It is documented that acid stress causes damage to DNA (7). In our array experiment
we observed an elevated expression of an ATPase involved in DNA repair (ORF 2607). At
the same time, we also observed the upregulation of ribonucleotide reductase genes nrdE, nrdI,
and nrdH (ORF 3467, 2930, 2929 respectively). In C. ammoniagenes Nrd’s are arranged in an
operon following the pattern of nrdH-nrdI-nrdE and they function in dNTP synthesis in DNA
replication and repair, however their concrete function are unclear (142). Attempts to create
disruption mutants for nrdI and nrdE were not successful, suggesting an essential role in
cellular function proving previously published attempts (142). Previous studies demonstrated
that expression of the nrd genes is cell cycle dependent reaching highest expression at
exponential phase (61, 76). In acid adaptation experiment exponentially growing control cells
at neutral pH grew faster than adapted cells at acidic condition however, there was a clear
difference in expression levels observed in acid adapted and non-adapted cell. Therefore, the
enhanced expressions of the genes in the nrd operon additionally to the DNA repair protein,
suggest a cellular response in combating DNA damage.
72
Discussion
4.3.4 Role of regulatory proteins in acid adaptation
Regulatory proteins play an important role in stress response by directing protein
expression in response to environmental fluctuations. We observed induction of six regulatory
proteins (ORF 927, 1518, 1642, 1703, 2000 and 3470) during acid adaptation.
SigB (ORF 2000) is strongly induced in C. glutamicum. Its role as a general stress
protein has been extensively studied in gram positive organisms under different stress
conditions. Null mutations in B. subtilis’ sigB lead to an increased sensitivity towards low pH,
heat and oxidative stress (68). In Listeria monocytogenes, a function of sigB has been demonstrated
in response to several stresses such as oxidative stress, osmotic stress, carbon starvation and
growth at low temperatures: e.g., a sigB null mutant exhibited a 1000 to 5000-fold decrease in
survival when exposed to pH 2.5 (155). Studies in Brevibacterium flavum, a closely related strain
of C. glutamicum, showed an effect of sigB on growth and viability of cells under acid, salt,
alcohol, heat and cold (63). SigB is therefore a general stress response protein and controls
transcription of various stress related proteins in Gram positive bacteria.
ORF 1703 encodes a protein belonging to the extracytoplasmic function family (ECF),
showing homology to SigE. SigE’s role as an alternative sigma factor regulator was
demonstrated, e.g., in M. tuberculosis, B. subtilis and P. aeruginosa under heat shock and oxidative
stress conditions (121). In M. tuberculosis a sigE disruption mutant exhibited higher sensitivity
to various environmental stresses compared to the wild type, but not to acidic pH (99, 122).
Our phenotypic studies using the sigE disruption mutant also did not support its role in acid
stress. We speculate that it is upregulated by stress factors originating as a consequence of pH
stress.
ORF 3470 codes for a protein homologous to a magnesium dependent transcriptional
regulator (MntR). MntR, first characterized in B. subtilis, is a member of the DtxR family of
metalloregulatory proteins regulating the expression of metal ion transport systems in
response to manganese (119). In vitro studies have shown that DtxR and its relatives respond
to various divalent metals such as Fe2+, Co2+, Zn2+, Cd2+, and Mn2+ which activate the DNA
binding function of DtxR and MntR (133-135, 138). DtxR characterized in C. diphtheriae is a
global iron regulator which regulates the expression of iron uptake genes as well as toxin
production under iron limited conditions (118). The function of MntR has been studied in
various microorganisms demonstrating a wide variety of effects on gene expression. In B.
subtilis it has been shown that elevated Mn2+ levels disturb iron homeostasis leading to an
increase in iron availability in the cell. This causes the activation of sigB stress response which
is depended on the environmental stress sensor RsuB requiring Mn2+ as a cofactor (60). In S.
aureus it has been shown that MntR has an effect on oxidative stress by controlling Mn2+
73
Discussion
uptake (73). DtxR and MntR differ in their metal ion selectivity as shown by protein sequence
comparisons (59). Recently, an MntR homologue has been identified in C. diphtheriae (132).
The role of DtxR like proteins in pH stress is unknown but may relate to the regulation of ion
transporters of C. glutamicum, which are also induced under acid stress
Another regulatory gene that was up regulated is ORF 1518 encoding the sensory
component of the two component histidine kinase system. Two component systems are
relatively widespread in bacteria and are reported to assist bacterial cells in the adaptation to
various environmental alterations (137). Two component systems are often involved in stress
response by directing the synthesis of alternative sigma factors which are required for the
synthesis of proteins involved in stress response (103, 108). An increase in the expression of
histidine kinase regulators due to stress has been shown in other gram-positive organisms
namely in L. monocytogenes, but a disruption mutant in the regulatory components of histidine
kinase did not reveal differences in growth in presence of stress compared to the wild type
strain (80). In H. pylori a similar effect was observed in studying the histidine kinase sensory
component which demonstrated that deletion of the sensory component has no effect on the
cells’ function and its role can be overtaken by other genes (151). Similarly, in this study no
significant effect was observed at low pH condition on the growth rate of the histidine kinase
disruption mutant.
4.3.5 Redundancy of the pH adaptation response of C. glutamicum
In all of the 15 disruption mutants, no significant phenotypical effect at low pH
conditions was observed except of the knock-outs of two regulatory proteins sigB and sigE
(ORF 2000 and ORF 1703, respectively). This data suggest a considerable redundancy in
stress response and, at the same time, demonstrates the complexity of the acid stress response
in C. glutamicum where the function of the disrupted gene obviously can be overtaken by
another gene product. Similar data have been reported for other bacteria, where effects of
single insertion mutagenesis on acid stress have been studied. In studying the acid tolerance
response of S. typhimurium inactivation of single genes known to contribute to acid stress
exhibited only a marginal affect on acid tolerance (126). Other studies of S. typhimurium
showed that inactivation of two or more genes was needed to eliminate acid resistance (56).
Similar observations were also reported for B. cereus where one acid sensitive single knockout
mutant was obtained despite screening 1.7 x 10⁸ cells (23). This leads us to conclude that the
genes responsible for acid adaptation have widely overlapping functions. Therefore, to obtain
acid sensitive mutants, either the disruption of the regulatory protein controlling the
74
Discussion
expression of multiple genes in the ATR is needed or more than one gene must be deleted in
the genome.
75
Concluding Remarks
5 Concluding remarks
Due to the long process of cheese production acceleration of cheese ripening is a very
important issue for the dairy industry. In this study four ripening species were adapted to low
pH. Different phenotypic characteristics were observed among the various mutants obtained
from the same parent cell suggesting that mutation effected different genes. Except for one
species (K. palustris), all other mutants obtained from the other species (C. ammoniagenes, C.
variabile, and S. equorum) were able to grow at 15°C even though selection process occurred at
30°C. Identification of the affected genes contributing to the enhanced phenotypic
characteristic of the mutants will provide beneficial information that could be later used as a
target in genetic manipulation of the organisms. Presently, natural strain selection provides an
acceptable alternative method of mutant generation that can be used by the dairy industry in
food processing due to the tight regulation in use of genetically modified organisms.
In order to meet sanitary requirements cheese manufacturers are replacing traditional
smearing practices with the inoculation of standard and controlled ripening cultures. In order
to produce the desired organoleptic properties this defined smear cultures need to be
individually designed for each cheese type. Therefore there is a requirement for a fast and
accurate method providing information regarding microbial succession. In this study we have
shown that under controlled condition the monitoring of microbial population is possible and
it correlated well with conventional techniques. Under this condition real time PCR provides
an ideal tool for the dairy industry to monitor microbial succession of individual species and
help in the development of a defined smear ripening flora adjusted to the technological
properties of a particular cheese.
Microarrays provide a global overview of transcriptomic changes in the acid adaptation of
C. glutamicum. The data obtained in this study suggest a complex and redundant response of C.
glutamicum since we identified 116 up and 90 down regulated genes. Only a minority of these
genes have been described to play a role in other Gram positive bacteria which makes it
difficult to delineate a general acid stress response for C. glutamicum. Apparently a variety of
strategies can exist which gram positive bacteria use to cope with pH stress.
76
References
6 References
1. Altschul, S. F., T. L. Madden, A. A. Schaffer, J. Zhang, Z. Zhang, W. Miller,
and D. J. Lipman. 1997. Gapped BLAST and PSI-BLAST: a new generation of protein database search programs. Nucleic Acids Res 25:3389-402.
2. Amann, R., Ludwig, W. 2000. Ribososmal RNA-targeted nucleic acid probes for studies in microbial ecology. FEMS Microbiol. Reviews 24:555-565.
3. Arber, W. 2000. Genetic variation: molecular mechanisms and impact on microbial evolution. FEMS Microbiol Rev 24:1-7.
4. Bakker, E. P., and F. M. Harold. 1980. Energy coupling to potassium transport in Streptococcus faecalis. Interplay of ATP and the protonmotive force. J Biol Chem 255:433-40.
5. Baltz, R. H. 2001. Genetic methods and strategies for secondary metabolite yield improvement in actinomycetes. Antonie Van Leeuwenhoek 79:251-9.
6. Bearson, B. L., L. Wilson, and J. W. Foster. 1998. A Low pH-Inducible, PhoPQ-Dependent Acid Tolerance Response Protects Salmonella typhimurium against Inorganic Acid Stress. J. Bacteriol. 180:2409-2417.
7. Bearson, S., Bearson, B, Foster, JW. 1997. Acid stress responses in enterobacteria. FEMS Microbiol Lett. 147:173-180.
8. Belli, W. A., and R. E. Marquis. 1991. Adaptation of Streptococcus mutans and Enterococcus hirae to acid stress in continuous culture. Appl Environ Microbiol 57:1134-8.
9. Bender, G. R., S. V. Sutton, and R. E. Marquis. 1986. Acid tolerance, proton permeabilities, and membrane ATPases of oral streptococci. Infect Immun 53:331-8.
10. Beresford, T. P., Fitzimons, N.A., Brennan, N.L., Cogan, T.M. 2001. Recent advances in cheese microbiology. Int. Dairy. Journal 11:259-274.
11. Bockelmann, W. 2002. Development of defined surface starter cultures for the ripening of smear cheeses. Int Dairy Journal 12:123-131.
12. Bockelmann, W. 2003. The production of smear cheeses, p. 470-489. In G. Smit (ed.), Dairy processing. Woodhead publishing limited, Cambridge.
13. Bockelmann, W., Hoppe-Seyler, T.,. 2001. The surface flora of bacterial smear-ripened cheeses from cow's and goat's milk. Int Dairy Journal 11:307-314.
14. Bockelmann, W., Hoppe-Seyler, T., Krusch, U., Hoffman, W., Heller, K.J. 1997. The microflora of Tilsit cheese. Part 2. Development of a surface smear starter culture. Nahrung 41:213-218.
15. Bockelmann, W., Krusch, U., Engel, G., Klijn, N., Smit, G., Heller, K.J. 1997. The microflora of Tilsit cheese. Part I. Variability of the smear flora. Nahrung 41:208-212.
16. Bond, D. R. a. R., J. B. 1996. A role for fructose 1,6-diphosphate in the ATPase-mediated energy spilling reaction of Streptococcus bovis. Appl. Environ. Microbiol. 62:2095-2099.
17. Booth, I. R. 1985. Regulation of cytoplasmic pH in bacteria. Microbiol Rev. 49:359-378.
18. Booth, I. R. 2002. Stress and the single cell: intrapopulation diversity is a mechanism to ensure survival upon exposure to stress. Int J Food Microbiol 78:19-30.
19. Brennan, N. M., R. Brown, M. Goodfellow, A. C. Ward, T. P. Beresford, P. J. Simpson, P. F. Fox, and T. M. Cogan. 2001. Corynebacterium mooreparkense sp. nov. and Corynebacterium casei sp. nov., isolated from the surface of a smear-ripened cheese. Int J Syst Evol Microbiol 51:843-52.
77
References
20. Brennan, N. M., Cogan, T. M., Loessner, M. and Scherer, S. 2004. Bacterial surface-ripened cheeses, p. 199-225. In P. F. Fox, McSweeney, P.L. H., Cogan, T. M., Guinee, T. P. (ed.), Cheese - Chemistry, physics, and microbiology. Elsevier Academic Press, Amsterdam.
21. Brennan, N. M., A. C. Ward, T. P. Beresford, P. F. Fox, M. Goodfellow, and T. M. Cogan. 2002. Biodiversity of the Bacterial Flora on the Surface of a Smear Cheese. Appl. Environ. Microbiol. 68:820-830.
22. Brosius, J., Palmer, M. L., Kennedy, P.J., Noller, H.F. 1978. Complete nucleotide sequence of a 16S ribosomal RNA gene from Escherichia coli. Proc. Natl. Acad. Sci. USA 75:4801-4805.
23. Browne, N. a. D., B.C.A. 2002. Acid stress in the food pathogen Bacillus cereus. Journal of Applied Microbiology 92:404-414.
24. Bryant, P., Venter, D, Robins-Browne, R, Curtis, N. 2004. Chips with everything: DNA microarrays in infectious diseases. Lancet Infect Dis. 4:100-111.
25. Bustin, S. A. 2000. Absolute quantification of mRNA using real-time reverse transcription polymerase chain reaction assays. J. Mol. Endocrinol. 25:169-93.
26. Bustin, S. A. 2002. Quantification of mRNA using real-time reverse transcription PCR (RT-PCR): trends and problems. J Mol Endocrinol 29:23-39.
27. Candela, M., B. Vitali, D. Matteuzzi, and P. Brigidi. 2004. Evaluation of the rrn operon copy number in Bifidobacterium using real-time PCR. Lett Appl Microbiol 38:229-32.
28. Carnio, M. C., I. Eppert, and S. Scherer. 1999. Analysis of the bacterial surface ripening flora of German and French smeared cheeses with respect to their anti-listerial potential. International Journal of Food Microbiology 47:89-97.
29. Castanie-Cornet, M.-P., T. A. Penfound, D. Smith, J. F. Elliott, and J. W. Foster. 1999. Control of Acid Resistance in Escherichia coli. J. Bacteriol. 181:3525-3535.
30. Christensen, J. E., E. G. Dudley, J. A. Pederson, and J. L. Steele. 1999. Peptidases and amino acid catabolism in lactic acid bacteria. Antonie Van Leeuwenhoek 76:217-46.
31. Christensson, C., H. Bratt, L. J. Collins, T. Coolbear, R. Holland, M. W. Lubbers, P. W. O'Toole, and J. R. Reid. 2002. Cloning and expression of an oligopeptidase, PepO, with novel specificity from Lactobacillus rhamnosus HN001 (DR20). Appl Environ Microbiol 68:254-62.
32. Cotter, P. D., and C. Hill. 2003. Surviving the Acid Test: Responses of Gram-Positive Bacteria to Low pH. Microbiol. Mol. Biol. Rev. 67:429-453.
33. Cotter, P. D., K. O'Reilly, and C. Hill. 2001. Role of the glutamate decarboxylase acid resistance system in the survival of Listeria monocytogenes LO28 in low pH foods. J Food Prot 64:1362-8.
34. Cunin, R., N. Glansdorff, A. Pierard, and V. Stalon. 1986. Biosynthesis and metabolism of arginine in bacteria. Microbiol Rev 50:314-52.
35. Dashper, S. G., Reynolds, E.C. 1992. pH regulation by Streptococcus mutans. J Dent Res 71:1159-1165.
36. De Angelis, M., L. Mariotti, J. Rossi, M. Servili, P. F. Fox, G. Rollan, and M. Gobbetti. 2002. Arginine catabolism by sourdough lactic acid bacteria: purification and characterization of the arginine deiminase pathway enzymes from Lactobacillus sanfranciscensis CB1. Appl Environ Microbiol 68:6193-201.
37. Degnan, B. A., M. C. Fontaine, A. H. Doebereiner, J. J. Lee, P. Mastroeni, G. Dougan, J. A. Goodacre, and M. A. Kehoe. 2000. Characterization of an isogenic mutant of Streptococcus pyogenes Manfredo lacking the ability to make streptococcal acid glycoprotein. Infect Immun 68:2441-8.
78
References
38. Desai, R. P., T. Leaf, Z. Hu, C. R. Hutchinson, A. Hong, G. Byng, J. Galazzo, and P. Licari. 2004. Combining classical, genetic, and process strategies for improved precursor-directed production of 6-deoxyerythronolide B analogues. Biotechnol Prog 20:38-43.
39. Dykhuizen, D. E. 1990. Experimental studies of natural selection in bacteria. Annu. Rev. Ecol. Syst. 21:373-398.
40. El Soda, M., S. A. Madkor, and P. S. Tong. 2000. Adjunct cultures: recent developments and potential significance to the cheese industry. J Dairy Sci 83:609-19.
41. Eliskases-Lechner, F., Ginzinger, W. 1995. The bacterial flora of surface ripened cheeses with special regard to coryneforms. Lait 75:571-584.
42. Ercolini, D., P. J. Hill, and C. E. Dodd. 2003. Bacterial community structure and location in Stilton cheese. Appl Environ Microbiol 69:3540-8.
43. Ercolini, D., P. J. Hill, and C. E. Dodd. 2003. Development of a fluorescence in situ hybridization method for cheese using a 16S rRNA probe. J Microbiol Methods 52:267-71.
44. Ferreira, A., D. Sue, C. P. O'Byrne, and K. J. Boor. 2003. Role of Listeria monocytogenes sigma(B) in survival of lethal acidic conditions and in the acquired acid tolerance response. Appl Environ Microbiol 69:2692-8.
45. Feurer, C., F. Irlinger, H. E. Spinnler, P. Glaser, and T. Vallaeys. 2004. Assessment of the rind microbial diversity in a farmhouse-produced vs a pasteurized industrially produced soft red-smear cheese using both cultivation and rDNA-based methods. J Appl Microbiol 97:546-56.
46. Feurer, C., T. Vallaeys, G. Corrieu, and F. Irlinger. 2004. Does smearing inoculum reflect the bacterial composition of the smear at the end of the ripening of a French soft, red-smear cheese? J Dairy Sci 87:3189-97.
47. Fey, A., S. Eichler, S. Flavier, R. Christen, M. G. Hofle, and C. A. Guzman. 2004. Establishment of a Real-Time PCR-Based Approach for Accurate Quantification of Bacterial RNA Targets in Water, Using Salmonella as a Model Organism. Appl. Environ. Microbiol. 70:3618-3623.
48. Fleet, G. H. 1999. Microorganisms in food ecosystems. Int. J. Food Microbiol. 50:101-17.
49. Fleet, G. H. 1990. Yeasts in dairy products. J. Appl. Bacteriol. 68:199-211. 50. Foster, J. W. 2000. Microbial responses to acid stress, p. 99-116. In G. Storz, Hengge-
Aronis R. (ed.), Bacterial Stress Responses. ASM Press. 51. Fox, P. F., Guinee, T. P., Cogan, T. M. and McSweeney, P. L. H. 2000.
Fundamentals of cheese science. Aspen Publishers, Inc., Gaithersburg. 52. Fox, P. F., J. M. Wallace, S. Morgan, C. M. Lynch, E. J. Niland, and J. Tobin.
1996. Acceleration of cheese ripening. Antonie Van Leeuwenhoek 70:271-97. 53. Frees D, V. F., Ingmer H. 2003. Identification of proteins induced at low pH in
Lactococcus lactis. Int J Food Microbiol. 87:293-300. 54. Fukushima, H., Y. Tsunomori, and R. Seki. 2003. Duplex Real-Time SYBR Green
PCR Assays for Detection of 17 Species of Food- or Waterborne Pathogens in Stools. J. Clin. Microbiol. 41:5134-5146.
55. Futai, M., T. Noumi, and M. Maeda. 1989. ATP synthase (H+-ATPase): results by combined biochemical and molecular biological approaches. Annu Rev Biochem 58:111-36.
56. Gahan, C. G. M., Hill, C. 1999. The relationship between acid stress responses and virulence in Salmonella typhimurium and Listeria monocytogenes. Int J Food Microbiol. 50:93-100.
57. Germond, J. E., L. Lapierre, M. Delley, and B. Mollet. 1995. A new mobile genetic element in Lactobacillus delbrueckii subsp. bulgaricus. Mol Gen Genet 248:407-16.
79
References
58. Giraffa, G. 2004. Studying the dynamics of microbial populations during food fermentation. FEMS Microbiol Rev 28:251-60.
59. Guedon, E., and J. D. Helmann. 2003. Origins of metal ion selectivity in the DtxR/MntR family of metalloregulators. Mol Microbiol 48:495-506.
60. Guedon, E., C. M. Moore, Q. Que, T. Wang, R. W. Ye, and J. D. Helmann. 2003. The global transcriptional response of Bacillus subtilis to manganese involves the MntR, Fur, TnrA and sigmaB regulons. Mol Microbiol 49:1477-91.
61. Guittet, O., P. Hakansson, N. Voevodskaya, S. Fridd, A. Graslund, H. Arakawa, Y. Nakamura, and L. Thelander. 2001. Mammalian p53R2 protein forms an active ribonucleotide reductase in vitro with the R1 protein, which is expressed both in resting cells in response to DNA damage and in proliferating cells. J Biol Chem 276:40647-51.
62. Haldenwang, W. G., and R. Losick. 1980. Novel RNA polymerase sigma factor from Bacillus subtilis. Proc Natl Acad Sci U S A 77:7000-4.
63. Halgasova, N., G. Bukovska, J. Ugorcakova, J. Timko, and J. Kormanec. 2002. The Brevibacterium flavum sigma factor SigB has a role in the environmental stress response. FEMS Microbiol Lett 216:77-84.
64. Hanna, M. N., R. J. Ferguson, Y. H. Li, and D. G. Cvitkovitch. 2001. uvrA is an acid-inducible gene involved in the adaptive response to low pH in Streptococcus mutans. J Bacteriol 183:5964-73.
65. Hantke, K. a. B., V. 2000. The Art of Keeping Low and High Iron Concentrations in Balance, p. 275-288. In G. Storz, Hengge-Aronis R. (ed.), Bacterial Stress Responses. ASM Press, Washington, DC.
66. Harrington, C., Rosenow, C, Retief, J. 2000. Monitoring gene expression using DNA microarrays. Monitoring gene expression using DNA microarrays. 3:285-291.
67. Hartke, A., S. Bouche, J. C. Giard, A. Benachour, P. Boutibonnes, and Y. Auffray. 1996. The Lactic Acid Stress Response of Lactococcus lactis subsp. lactis. Curr Microbiol 33:194-9.
68. Hecker M, V. U. 2001. General stress response of Bacillus subtilis and other bacteria. Adv Microb Physiol 44:35-91.
69. Hein, I., D. Klein, A. Lehner, A. Bubert, E. Brandl, and M. Wagner. 2001. Detection and quantification of the iap gene of Listeria monocytogenes and Listeria innocua by a new real-time quantitative PCR assay. Res. Microbiol. 152:37-46.
70. Hein, I., A. Lehner, P. Rieck, K. Klein, E. Brandl, and M. Wagner. 2001. Comparison of different approaches to quantify Staphylococcus aureus cells by real-time quantitative PCR and application of this technique for examination of cheese. Appl. Environ. Microbiol. 67:3122-6.
71. Hinton, J. C., I. Hautefort, S. Eriksson, A. Thompson, and M. Rhen. 2004. Benefits and pitfalls of using microarrays to monitor bacterial gene expression during infection. Curr Opin Microbiol 7:277-82.
72. Hoppe-Seyler, T. S., B. Jaeger, W. Bockelmann, W. H. Noordman, A. Geis, and K. J. Heller. 2004. Molecular identification and differentiation of Staphylococcus species and strains of cheese origin. Syst Appl Microbiol 27:211-8.
73. Horsburgh, M. J., S. J. Wharton, A. G. Cox, E. Ingham, S. Peacock, and S. J. Foster. 2002. MntR modulates expression of the PerR regulon and superoxide resistance in Staphylococcus aureus through control of manganese uptake. Mol Microbiol 44:1269-86.
74. Ibrahim, S. A., and D. J. O'Sullivan. 2000. Use of chemical mutagenesis for the isolation of food grade beta-galactosidase overproducing mutants of bifidobacteria, lactobacilli and Streptococcus thermophilus. J Dairy Sci 83:923-30.
80
References
75. Ishige, T., M. Krause, M. Bott, V. F. Wendisch, and H. Sahm. 2003. The Phosphate Starvation Stimulon of Corynebacterium glutamicum Determined by DNA Microarray Analyses. J. Bacteriol. 185:4519-4529.
76. Jacobson, B. A., and J. A. Fuchs. 1998. A 45 bp inverted repeat is required for cell cycle regulation of the Escherichia coli nrd operon. Mol Microbiol 28:1307-14.
77. Jan, G., P. Leverrier, V. Pichereau, and P. Boyaval. 2001. Changes in Protein Synthesis and Morphology during Acid Adaptation of Propionibacterium freudenreichii. Appl. Environ. Microbiol. 67:2029-2036.
78. Jayaraman, G. C., J. E. Penders, and R. A. Burne. 1997. Transcriptional analysis of the Streptococcus mutans hrcA, grpE and dnaK genes and regulation of expression in response to heat shock and environmental acidification. Mol Microbiol 25:329-41.
79. Kakinuma, Y. 1998. Inorganic cation transport and energy transduction in Enterococcus hirae and other streptococci. Microbiol Mol Biol Rev 62:1021-1045.
80. Kallipolitis, B. H., Ingmer, H. 2001. Listeria monocytogenes response regulators important for stress tolerance and pathogenesis. FEMS Microbiology Letters 204:111-115.
81. Kashket, E. R. a. B., S. L. 1977. Effects of potassium ions on the electrical and pH gradients across the membrane of Streptococcus lactis cells. J. Bacteriol. 130:1017-1023.
82. Keilhauer, C., L. Eggeling, and H. Sahm. 1993. Isoleucine synthesis in Corynebacterium glutamicum: molecular analysis of the ilvB-ilvN-ilvC operon. J Bacteriol 175:5595-603.
83. Khodursky, A. B., J. A. Bernstein, B. J. Peter, V. Rhodius, V. F. Wendisch, and D. P. Zimmer. 2003. Escherichia coli spotted double-strand DNA microarrays: RNA extraction, labeling, hybridization, quality control, and data management. Methods Mol Biol 224:61-78.
84. Klein, N., Lortal, S. 1999. Attenuated starters: an efficient means to influence cheese ripening - a review. Int Dairy J 9:751-762.
85. Kobayashi, H., T. Suzuki, and T. Unemoto. 1986. Streptococcal cytoplasmic pH is regulated by changes in amount and activity of a proton-translocating ATPase. J Biol Chem 261:627-30.
86. Koebmann, B. J., D. Nilsson, O. P. Kuipers, and P. R. Jensen. 2000. The membrane-bound H(+)-ATPase complex is essential for growth of Lactococcus lactis. J Bacteriol 182:4738-43.
87. Koster, W. 2001. ABC transporter-mediated uptake of iron, siderophores, heme and vitamin B12. Res Microbiol. 152:291-301.
88. Kullen, M. J., and T. R. Klaenhammer. 1999. Identification of the pH-inducible, proton-translocating F1F0-ATPase (atpBEFHAGDC) operon of Lactobacillus acidophilus by differential display: gene structure, cloning and characterization. Mol Microbiol 33:1152-61.
89. Law, B. A. 2001. Controlled and accelerated cheese ripening: the research base for new technology. Int Dairy J 11:383-398.
90. Lazzi, C., L. Rossetti, M. Zago, E. Neviani, and G. Giraffa. 2004. Evaluation of bacterial communities belonging to natural whey starters for Grana Padano cheese by length heterogeneity-PCR. J Appl Microbiol 96:481-90.
91. Len, A. C. L., D. W. S. Harty, and N. A. Jacques. 2004. Stress-responsive proteins are upregulated in Streptococcus mutans during acid tolerance. Microbiology 150:1339-1351.
92. Liebl, W. 2001. Corynebacterium Nonmedical. In M. D. e. al (ed.), The Prokaryotes: An Evolving Electronic Resource for the Microbiological Community, 3, release 3.7 ed. Springer Verlag, New York.
93. Lim, E. M., S. D. Ehrlich, and E. Maguin. 2000. Identification of stress-inducible proteins in Lactobacillus delbrueckii subsp. bulgaricus. Electrophoresis 21:2557-61.
81
References
94. Lockhart, D. J., and E. A. Winzeler. 2000. Genomics, gene expression and DNA arrays. Nature 405:827-36.
95. Ludwig, W., O. Strunk, S. Klugbauer, N. Klugbauer, M. Weizenegger, J. Neumaier, M. Bachleitner, and K. H. Schleifer. 1998. Bacterial phylogeny based on comparative sequence analysis. Electrophoresis 19:554-68.
96. Lyons, S. R., A. L. Griffen, and E. J. Leys. 2000. Quantitative real-time PCR for Porphyromonas gingivalis and total bacteria. J. Clin. Microbiol. 38:2362-5.
97. Mackay, I. M. 2004. Real-time PCR in the microbiology laboratory. Clin Microbiol Infect 10:190-212.
98. Malorny, B., E. Paccassoni, P. Fach, C. Bunge, A. Martin, and R. Helmuth. 2004. Diagnostic real-time PCR for detection of salmonella in food. Appl Environ Microbiol 70:7046-52.
99. Manganelli, R., Voskuil, M I., Schoolnik, G. K., Smith I. 2001. The Mycobacterium tuberculosis ECF sigma factor E: role in global gene expression and survival in macrophages. Molecular Microbiology 41:423-437.
100. Maoz, A., R. Mayr, and S. Scherer. 2003. Temporal Stability and Biodiversity of Two Complex Antilisterial Cheese-Ripening Microbial Consortia. Appl. Environ. Microbiol. 69:4012-4018.
101. Martinez-Cuesta, M. C., T. Requena, and C. Pelaez. 2001. Use of a bacteriocin-producing transconjugant as starter in acceleration of cheese ripening. Int J Food Microbiol 70:79-88.
102. Martin-Galiano, A. J., Ferrandiz, M. J., Campa, de la A. G. 2001. The promoter of the operon encoding the F0F1 ATPase of Streptococcus pneumoniae is inducible by pH. Molecular Microbiology 41:1327-1338.
103. Mikami, K., Y. Kanesaki, I. Suzuki, and N. Murata. 2002. The histidine kinase Hik33 perceives osmotic stress and cold stress in Synechocystis sp PCC 6803. Mol Microbiol 46:905-15.
104. Mollet, B., and M. Delley. 1990. Spontaneous deletion formation within the beta-galactosidase gene of Lactobacillus bulgaricus. J Bacteriol 172:5670-6.
105. Monnet, C., C. Beal, and G. Corrieu. 2003. Improvement of the resistance of Lactobacillus delbrueckii ssp. bulgaricus to freezing by natural selection. J Dairy Sci 86:3048-53.
106. Moter, A., Göbel, U.B. 2000. Fluorescence in situ hybridization (FISH) for direct visualization of microorganisms. J Microbiol Methods 41:85-112.
107. Muffler, A., S. Bettermann, M. Haushalter, A. Horlein, U. Neveling, M. Schramm, and O. Sorgenfrei. 2002. Genome-wide transcription profiling of Corynebacterium glutamicum after heat shock and during growth on acetate and glucose. J Biotechnol 98:255-68.
108. Mukhopadhyay, S., J. P. Audia, R. N. Roy, and H. E. Schellhorn. 2000. Transcriptional induction of the conserved alternative sigma factor RpoS in Escherichia coli is dependent on BarA, a probable two-component regulator. Mol Microbiol 37:371-81.
109. Negulescu, P. A., and T. E. Machen. 1990. Intracellular ion activities and membrane transport in parietal cells measured with fluorescent dyes. Methods Enzymol 192:38-81.
110. Nikaido, H. 1998. Antibiotic resistance caused by gram-negative multidrug efflux pumps. Clin Infect Dis 27 Suppl 1:S32-41.
111. Nogva, H. K., K. Rudi, K. Naterstad, A. Holck, and D. Lillehaug. 2000. Application of 5'-nuclease PCR for quantitative detection of Listeria monocytogenes in pure cultures, water, skim milk, and unpasteurized whole milk. Appl. Environ. Microbiol. 66:4266-71.
82
References
112. Oberreuter, H., H. Seiler, and S. Scherer. 2002. Identification of coryneform bacteria and related taxa by Fourier-transform infrared (FT-IR) spectroscopy. Int. J. Syst. Evol. Microbiol. 52:91-100.
113. Papadopoulos, D., D. Schneider, J. Meier-Eiss, W. Arber, R. E. Lenski, and M. Blot. 1999. Genomic evolution during a 10,000-generation experiment with bacteria. Proc Natl Acad Sci U S A 96:3807-12.
114. Parekh, S., V. A. Vinci, and R. J. Strobel. 2000. Improvement of microbial strains and fermentation processes. Appl Microbiol Biotechnol 54:287-301.
115. Phan-Thanh, L., and F. Mahouin. 1999. A proteomic approach to study the acid response in Listeria monocytogenes. Electrophoresis 20:2214-24.
116. Polen, T., D. Rittmann, V. F. Wendisch, and H. Sahm. 2003. DNA microarray analyses of the long-term adaptive response of Escherichia coli to acetate and propionate. Appl Environ Microbiol 69:1759-74.
117. Putman, M., H. W. van Veen, and W. N. Konings. 2000. Molecular properties of bacterial multidrug transporters. Microbiol Mol Biol Rev 64:672-93.
118. Qian, Y., J. H. Lee, and R. K. Holmes. 2002. Identification of a DtxR-Regulated Operon That Is Essential for Siderophore-Dependent Iron Uptake in Corynebacterium diphtheriae. J. Bacteriol. 184:4846-4856.
119. Que, Q., and J. D. Helmann. 2000. Manganese homeostasis in Bacillus subtilis is regulated by MntR, a bifunctional regulator related to the diphtheria toxin repressor family of proteins. Mol Microbiol 35:1454-68.
120. Quivey, R. G., Jr., R. C. Faustoferri, K. A. Clancy, and R. E. Marquis. 1995. Acid adaptation in Streptococcus mutans UA159 alleviates sensitization to environmental stress due to RecA deficiency. FEMS Microbiol Lett 126:257-61.
121. Raivio, T. L., and T. J. Silhavy. 2001. Periplasmic stress and ECF sigma factors. Annu Rev Microbiol 55:591-624.
122. Raman, S., T. Song, X. Puyang, S. Bardarov, W. R. Jacobs, Jr., and R. N. Husson. 2001. The Alternative Sigma Factor SigH Regulates Major Components of Oxidative and Heat Stress Responses in Mycobacterium tuberculosis. J. Bacteriol. 183:6119-6125.
123. Rattray, F. P., and P. F. Fox. 1999. Aspects of enzymology and biochemical properties of Brevibacterium linens relevant to cheese ripening: a review. J Dairy Sci 82:891-909.
124. Reps, A. 1993. Bacterial surface-ripened cheeses, p. 137-173. In P. F. Fox (ed.), Cheese: Chemistry, Physics and Microbiology, vol. 2. Elsevier Applied Sciences.
125. Requena, T., J. Burton, T. Matsuki, K. Munro, M. A. Simon, R. Tanaka, K. Watanabe, and G. W. Tannock. 2002. Identification, detection, and enumeration of human bifidobacterium species by PCR targeting the transaldolase gene. Appl Environ Microbiol 68:2420-7.
126. Riesenberg-Wilmes, M. R., B. Bearson, J. W. Foster, and R. Curtis, 3rd. 1996. Role of the acid tolerance response in virulence of Salmonella typhimurium. Infect Immun 64:1085-92.
127. Ritchie, N. J., M. E. Schutter, R. P. Dick, and D. D. Myrold. 2000. Use of length heterogeneity PCR and fatty acid methyl ester profiles to characterize microbial communities in soil. Appl Environ Microbiol 66:1668-75.
128. Sahm, H., L. Eggeling, and A. A. de Graaf. 2000. Pathway analysis and metabolic engineering in Corynebacterium glutamicum. Biol Chem 381:899-910.
129. Sahm, H., L. Eggeling, B. Eikmanns, and R. Kramer. 1996. Construction of L-lysine-, L-threonine-, and L-isoleucine-overproducing strains of Corynebacterium glutamicum. Ann N Y Acad Sci 782:25-39.
131. Sancar, A. 1996. DNA excision repair. Annu Rev Biochem 65:43-81. 132. Schmitt, M. P. 2002. Analysis of a DtxR-Like Metalloregulatory Protein, MntR, from
Corynebacterium diphtheriae That Controls Expression of an ABC Metal Transporter by an Mn2+-Dependent Mechanism. J. Bacteriol. 184:6882-6892.
133. Schmitt, M. P., and R. K. Holmes. 1993. Analysis of diphtheria toxin repressor-operator interactions and characterization of a mutant repressor with decreased binding activity for divalent metals. Mol. Microbiol. 9:173-181.
134. Schmitt, M. P., E. M. Twiddy, and R. K. Holmes. 1992. Purification and characterization of the diphtheria toxin repressor. Proc. Natl. Acad. Sci. USA 89:7576-7580.
135. Schmitt, M. P., and R. K. Holmes. 1991. Iron-dependent regulation of diphtheria toxin and siderophore expression by the cloned Corynebacterium diphtheriae repressor gene dtxR in C. diphtheriae C7 strains. Infect Immun 59:1899-904.
136. Seiler, H. 1986. Identification of cheese-smear coryneform bacteria. J. Dairy Research 53:439-449.
137. Stock, A. M., V. L. Robinson, and P. N. Goudreau. 2000. Two-component signal transduction. Annu Rev Biochem 69:183-215.
138. Tao, X., Schiering, N., Zeng, HY., Ringe, D., Murphy, JR. 1994. Iron, DtxR, and the regulation of diphtheria toxin expression. Mol Microbiol. 14:191-197.
139. Tauch, A., I. Homann, S. Mormann, S. Ruberg, A. Billault, B. Bathe, S. Brand, O. Brockmann-Gretza, C. Ruckert, N. Schischka, C. Wrenger, J. Hoheisel, B. Mockel, K. Huthmacher, W. Pfefferle, A. Puhler, and J. Kalinowski. 2002. Strategy to sequence the genome of Corynebacterium glutamicum ATCC 13032: use of a cosmid and a bacterial artificial chromosome library. J Biotechnol 95:25-38.
140. Tauch, A., F. Kassing, J. Kalinowski, and A. Puhler. 1995. The Corynebacterium xerosis composite transposon Tn5432 consists of two identical insertion sequences, designated IS1249, flanking the erythromycin resistance gene ermCX. Plasmid 34:119-31.
141. Tenaillon, O., E. Denamur, and I. Matic. 2004. Evolutionary significance of stress-induced mutagenesis in bacteria. Trends Microbiol 12:264-70.
142. Torrents, E., I. Roca, and I. Gibert. 2003. Corynebacterium ammoniagenes class Ib ribonucleotide reductase: transcriptional regulation of an atypical genomic organization in the nrd cluster. Microbiology 149:1011-20.
143. Upadhyay, V. K., McSweeney, P.L.H. 2004. Acceleration of cheese ripening, p. 419-447, Dairy processing.
144. Valdes-Stauber, N., S. Scherer, and H. Seiler. 1997. Identification of yeasts and coryneform bacteria from the surface microflora of brick cheeses. Int. J. Food Microbiol. 34:115-129.
145. van de Guchte, M., P. Serror, C. Chervaux, T. Smokvina, S. D. Ehrlich, and E. Maguin. 2002. Stress responses in lactic acid bacteria. Antonie Van Leeuwenhoek 82:187-216.
146. van der Rest ME, L. C., Molenaar D. 1999. A heat shock following electroporation induces highly efficient transformation of Corynebacterium glutamicum with xenogeneic plasmid DNA. Appl Microbiol Biotechnol. 52:541-5.
147. Viljoen, B. C. 2001. The interaction between yeasts and bacteria in dairy environments. Int J Food Microbiol 69:37-44.
148. Villarreal, L., N. L. Heredia, and S. Garcia. 2000. Changes in protein synthesis and acid tolerance in Clostridium perfringens type A in response to acid shock. Int Microbiol 3:113-6.
84
References
149. Voelker, U., Maul, B. and Hecker, M. 1999. Expression of the sigmaB - dependent general stress regulon confers multiple stress resistance in Bacillus subtilis. J Bacteriol 181:3942-3948.
150. Walker, G. C. 1995. SOS-regulated proteins in translesion DNA synthesis and mutagenesis. Trends Biochem Sci 20:416-20.
151. Wen, Y., E. A. Marcus, U. Matrubutham, M. A. Gleeson, D. R. Scott, and G. Sachs. 2003. Acid-Adaptive Genes of Helicobacter pylori. Infect. Immun. 71:5921-5939.
152. Wendisch, V. F. 2003. Genome-wide expression analysis in Corynebacterium glutamicum using DNA microarrays. J Biotechnol 104:273-85.
153. Wendisch, V. F., D. P. Zimmer, A. Khodursky, B. Peter, N. Cozzarelli, and S. Kustu. 2001. Isolation of Escherichia coli mRNA and comparison of expression using mRNA and total RNA on DNA microarrays. Anal Biochem 290:205-13.
154. White, T. J., T. Bruns, S. Lee, and J.W. Taylor. 1990. Amplification and direct sequencing of fungal ribosomal RNA genes for phylogenetics, p. 315-322. In M. A. Innis, D.H. Gelfand, J.J. Sninsky, and T.J. White (ed.), PCR Protocols: A guide to methods and applications. Academic Press Inc., New York.
155. Wiedmann, M., T. J. Arvik, R. J. Hurley, and K. J. Boor. 1998. General Stress Transcription Factor sigma B and Its Role in Acid Tolerance and Virulence of Listeria monocytogenes. J. Bacteriol. 180:3650-3656.
156. Wilkins, J. C., K. A. Homer, and D. Beighton. 2002. Analysis of Streptococcus mutans proteins modulated by culture under acidic conditions. Appl Environ Microbiol 68:2382-90.
157. Wilkinson, M. G. 1993. Acceleration of cheese ripening, p. 523-555. In P. F. Fox (ed.), Cheese: Chemistry, Physics and Microbiology, 2nd ed, vol. 1. Chapman & Hall, London.
158. Wong, S. L., and R. H. Doi. 1984. Utilization of a Bacillus subtilis sigma 37 promoter by Escherichia coli RNA polymerase in vivo. J Biol Chem 259:9762-7.
159. Wu, Q. L., D. Kong, K. Lam, and R. N. Husson. 1997. A mycobacterial extracytoplasmic function sigma factor involved in survival following stress. J Bacteriol 179:2922-9.
160. Yoshida, A., N. Suzuki, Y. Nakano, M. Kawada, T. Oho, and T. Koga. 2003. Development of a 5' Nuclease-Based Real-Time PCR Assay for Quantitative Detection of Cariogenic Dental Pathogens Streptococcus mutans and Streptococcus sobrinus. J. Clin. Microbiol. 41:4438-4441.
161. Zelder, O., and B. Hauer. 2000. Environmentally directed mutations and their impact on industrial biotransformation and fermentation processes. Curr Opin Microbiol 3:248-51.
162. Zhou, J. 2003. Microarrays for bacterial detection and microbial community analysis. Curr Opin Microbiol 6:288-94.
85
Appendix
7 Appendix
REACTION STEPS NOTES ACID ADAPTATION EXPERIMENT
EXPERIMENT CONTROL
total RNA total RNA
Cy5-labeled cDNA Cy3-labeled cDNA
competitive hybridization to DNA-microarray
Cy5 signal intensity Cy3 signal intensity
quantitative analysis quantitative analysis
Cy5/Cy3 RATIO calculation, log2 transformation
total intensity NORMALIZATION between slides and dyes (Cy5 and Cy3)
FILTER low signal intensity, bad spot quality
FILTER spots with nonsignificant changes
ANALYSIS
two independent fermentation two replicate RNA isolation random hexamer primed synthesis of fluorescently labeled cDNA DNA-microarray hybridization and washing Fluorescent images at 635nm ICy5(i=x) and 532nm ICy3(i=x) using an GenePix 4000 laser scanner raw fluorescent data and analysis using softwareGenePix 3.0 RCy5/Cy3(i=x) = ICy5(i=x)/ICy3(i=x)RSNCy5/Cy3(i=x) - Cy5/Cy3 ratio of x-th spot on the slide N signal intensity median value Data were normalized to the average ratio of C. glutamicum genomic DNA IF (ICy3(i=x) OR ICy5(i=x) ≥ 3*IBkg(i=x)) RIGHT x-th spot were used in the further analysis WRONG x-th spot too weak, omitted IBkg(i=x) - local background intensity value P values were calculated from replicated ratio values based on Student’s t test using log transformed gene ratios and genomic DNAratios, which were normalized to zero IF (P(i=x) ≤ 0,05) RIGHT x-th spot were used in the further analysis WRONG nonsignificant, omitted P(i=x) - P values of the x-th spot on the four slides Analysis of gene expression data was performed by selecting genes showing at least twofold changed average mRNA level.
DN
A-M
ICR
OA
RR
AY
PR
EP
AR
AT
ION
IM
AG
ING
N
OR
MA
LIZ
AT
ION
F
IL
TE
R
Tab. 7.1 DNA microarray analysis of acid adapted C. glutamicum
86
Appendix
Group ORF NCBI no. Annotation Ratio
Transport protein
1382 NCgl0799 Na+/proline, Na+/panthothenate symporter or related permease
0.45
1011 NCgl0510 ABC-type cobalt transport system, ATPase component
0.32
1012 NCgl0511 ABC-type cobalt transport system, permease
Component, similar to CbiQ and related transporters
Group ORF NCBI no. Annotation Ratio 831 NCgl0360 succinate dehydrogenase/fumarate
reductase, flavoprotein subunit 0.28
832 NCgl0361 succinate dehydrogenase/fumarate reductase Fe-S protein
0.29
976 NCgl0468 ribosomal protein L10 0.49 978 NCgl0469 ribosomal protein L7/L12 0.50 988 NCgl0476 ribosomal protein S12 0.46 989 NCgl0477 ribosomal protein S7 0.40 3553 NCgl0487 ribosomal protein L3 0.37 3554 NCgl0488 ribosomal protein L4 0.41 3555 NCgl0490 ribosomal protein L2 0.36 3777 NCgl0491 ribosomal protein S19 0.40 3778 NCgl0492 ribosomal protein L22 0.40 992 NCgl0493 ribosomal protein S3 0.39 993 NCgl0494 ribosomal protein L16/L10E 0.40 994 NCgl0495 ribosomal protein L29 0.42 999 NCgl0499 ribosomal protein L14 0.48 1000 NCgl0500 ribosomal protein L24 0.41 1020 NCgl0517 ribosomal protein L18 0.46 1022 NCgl0518 ribosomal protein S5 0.41 1023 NCgl0519 ribosomal protein L30/L7E 0.49 1044 NCgl0536 translation initiation factor IF-1 0.50 1046 NCgl0537 ribosomal protein S13 0.48 1047 NCgl0538 ribosomal protein S11 0.49 1048 NCgl0539 ribosomal protein S4 0.48 1050 NCgl0541 ribosomal protein L17 0.48 1069 NCgl0556 ribosomal protein L13 0.41 1088 NCgl0572 co-chaperonin GroES, HSP10;
chaperonin 10 Kd subunit 0.43
1092 NCgl0573 chaperonin GroEL, member of the HSP60 family
0.47
1377 NCgl0795 citrate synthase 0.48 1421 NCgl0834 ribosomal protein L28 0.48 1508 NCgl0902 general stress protein Ctc 0.47 1807 NCgl1159 F0F1-type ATP synthase a subunit 0.25 1808 NCgl1160 F0F1-type ATP synthase c subunit
0.25
1809 NCgl1161 F0F1-type ATP synthase b subunit 0.33 1810 NCgl1162 F0F1-type ATP synthase delta
subunit 0.27
88
Appendix
Group ORF NCBI no. Annotation Ratio 1811 NCgl1163 F0F1-type ATP synthase alpha
subunit 0.27
1812 NCgl1164 F0F1-type ATP synthase gamma subunit
309 NCgl2813 predicted flavoprotein 2.09 1894 NCgl2908 putative mercuric reductase, similar to
dihydrolipoamide dehydrogenase/glutathione oxidoreductase and related enzymes
2.94
1922 NCgl2934 hypothetical protein, similar to phosphotransferase system mannitol/fructose-
specific IIA domain (Ntr-type)
2.21
3438 NCgl2956 hypothetical protein, similar to sugar phosphate isomerases/epimerases
2.40
3439 NCgl2957 myo-inositol dehydrogenase, similar to predicted dehydrogenases and related
proteins
2.12
3452 NCgl2965 a hypothetical membrane protein, similar to permeases of the major facilitator superfamily
5.42
Hypothetical
proteins 518 NCgl0123 a hypothetical protein 6.99
534 NCgl0138 hypothetical protein 2.31 546 NCgl0148 hypothetical protein 2.32 588 NCgl0191 hypothetical protein 3.25 748 NCgl0308 uncharacterized phage-associated protein 3.47 854 NCgl0377 a, b hypothetical membrane protein 7.05 3543 NCgl0381 a hypothetical membrane protein 17.53
93
Appendix
Group ORF NCBI no. Annotation Ratio
3544 NCgl0382 hypothetical membrane protein 6.23 1059 NCgl0549 hypothetical membrane protein 2.04 1080 NCgl0565 putative membrane protein 2.46 1106 NCgl0584 hypothetical membrane protein, similar to
1152 NCgl0623 a hypothetical protein 5.45 1168 NCgl0635 b hypothetical protein, similar to siderophore-
interacting proteins 3.78
1239 NCgl0691 hypothetical protein, similar to dihydrofolate reductase
2.17
1293 NCgl0734 a hypothetical protein, similar to transcription factor WhiB
2.82
1495 NCgl0891 hypothetical protein 2.26 1540 NCgl0927 hypothetical protein 2.62 1541 NCgl0928 hypothetical membrane protein, similar to
esterases 2.46
1631 NCgl1011 hypothetical protein 3.28 1704 NCgl1076 hypothetical protein 2.06 1718 NCgl1090 hypothetical protein 2.07 1851 NCgl1197 hypothetical protein 2.14 2706 NCgl1287 hypothetical protein 2.26 2705 NCgl1288 hypothetical protein 3.23 2703 NCgl1289 a hypothetical protein 4.88 2645 NCgl1327 hypothetical protein 2.24
2579 NCgl1382 hypothetical protein 2.16 2431 NCgl1487 hypothetical protein 2.07 2489 NCgl1528 hypothetical protein 2.45 3347 NCgl1646 a hypothetical protein 4.29 3348 NCgl1647 hypothetical protein 2.32 2006 NCgl1848 hypothetical protein, similar to archaeal
enzymes of ATP-grasp superfamily 2.47
2974 NCgl2356 hypothetical protein 2.21 2920 NCgl2450 a hypothetical protein, involved in propionate
catabolism 35.16
2919 NCgl2451 a hypothetical protein 13.75 21 NCgl2584 a hypothetical protein, involved in biosynthesis
of extracellular polysaccharides 5.21
242 NCgl2753 hypotheical protein, similar to vancomycin resistance protein
2.04
1884 NCgl2900 hypothetical protein 2.28 1898 NCgl2912 hypothetical membrane protein 2.42 1922 NCgl2934 hypothetical protein, similar to
phosphotransferase system mannitol/fructose-specific IIA domain (Ntr-type)
2.21
1938 NCgl2944 hypothetical protein 2.63 1941 NCgl2946 a hypothetical protein 3.89 535 hypothetical protein 2.08
94
Appendix
Group ORF NCBI no. Annotation Ratio
963 hypothetical protein 2.08 1940 hypothetical protein 2.09 810 hypothetical protein, similar to transposases 2.12 749 hypothetical protein 2.15 1939 hypothetical protein 2.36 325 hypothetical protein 2.40 3190 hypothetical protein 2.45 853 hypothetical protein 2.71 2147 hypothetical protein 3.57 517 a hypothetical protein 9.96 2754 hypothetical protein 25.11
Tab. 7.3 Up regulated ORFs in the acid adapted C. glutamicum
95
Appendix
Curriculum vitae
Personal data:
Name: Kinga Jakob
Date of Birth: Nov. 5 1972
Place of Birth: Cluj-Napoca, Romania
Nationality: American
Marital status: Married
Education:
9/1979-3/1987 Brassai Samuel Liceum in Cluj-Napoca, Romania
4/1987-6/1988 Junior High School 189, Flushing, New York, USA
9/1988-6/1991 Flushing High School, Regents diploma, Flushing, New York, USA
9/1991-5/1995 Bachelor of Science, in Biology, at St. John’s University, New York,
USA
9/1995-5/1997 Master of Science, in Genetics, at St. John’s University, New York,
USA
12/2000-present PhD student at the Department of Microbiologie, Zentral Institut für
Ernährungs und Lebensmittelforschung Weihenstephan
Experience:
9/1999-11/2000 Teaching assistant – Rutgers University
8/1998-8/1999 Food quality control test assistant – Rutgers University
1/1997-8/1998 Tutor at Biology Learning Center – Nassau Community College