Wir schaffen Wissen – heute für morgen Wir schaffen Wissen – heute für morgen Evaluation of fossil power plants with CCS: Evaluation of fossil power plants with CCS: Methodology & Results Paul Scherrer Institut, Laboratory for Energy Systems Analysis Christian Bauer 2nd ICEPE 2011, Frankfurt, June 20-22, 2011
Transcript
Wir schaffen Wissen – heute für morgenWir schaffen Wissen – heute für morgen
Evaluation of fossil power plants with CCS: Evaluation of fossil power plants with CCS: Methodology & Results
Paul Scherrer Institut, Laboratory for Energy Systems AnalysisChristian Bauer
, y gy y y
2nd ICEPE 2011, Frankfurt, June 20-22, 2011
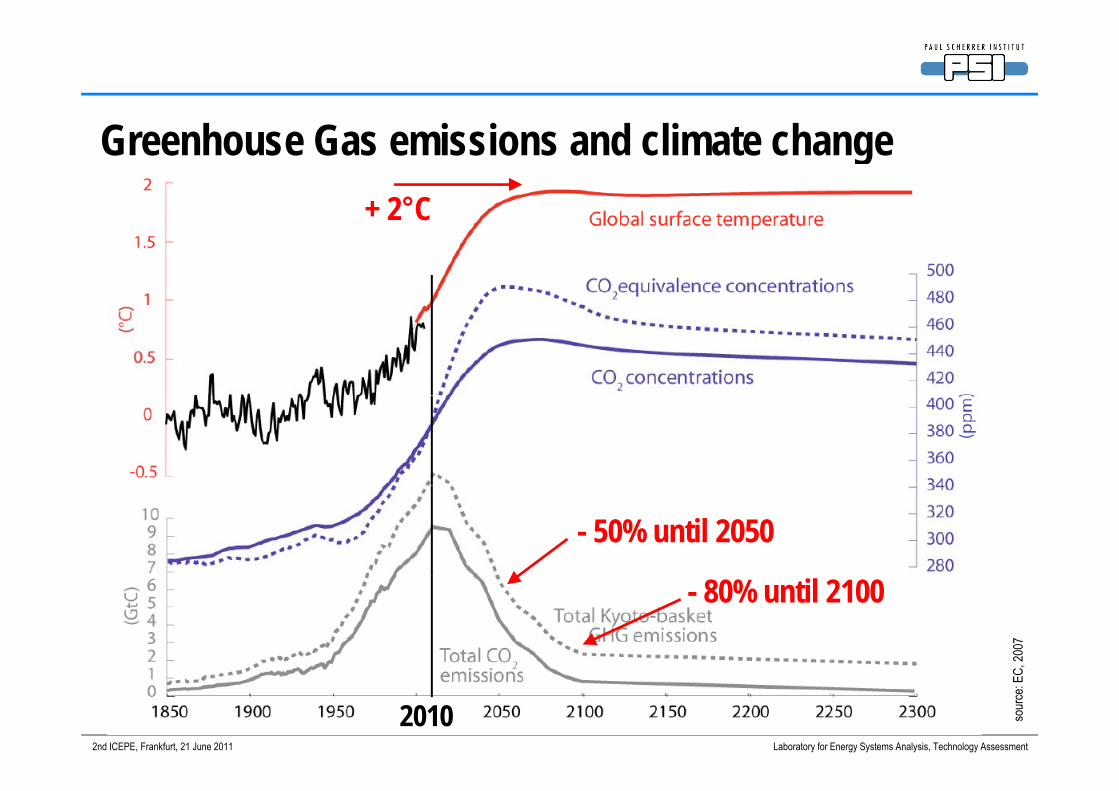
G h G i i d li t hGreenhouse Gas emissions and climate change+ 2°C+ 2 C
- 50% until 2050
2007
- 80% until 2100
2nd ICEPE, Frankfurt, 21 June 2011 Laboratory for Energy Systems Analysis, Technology Assessment
sour
ce: E
C,
2010
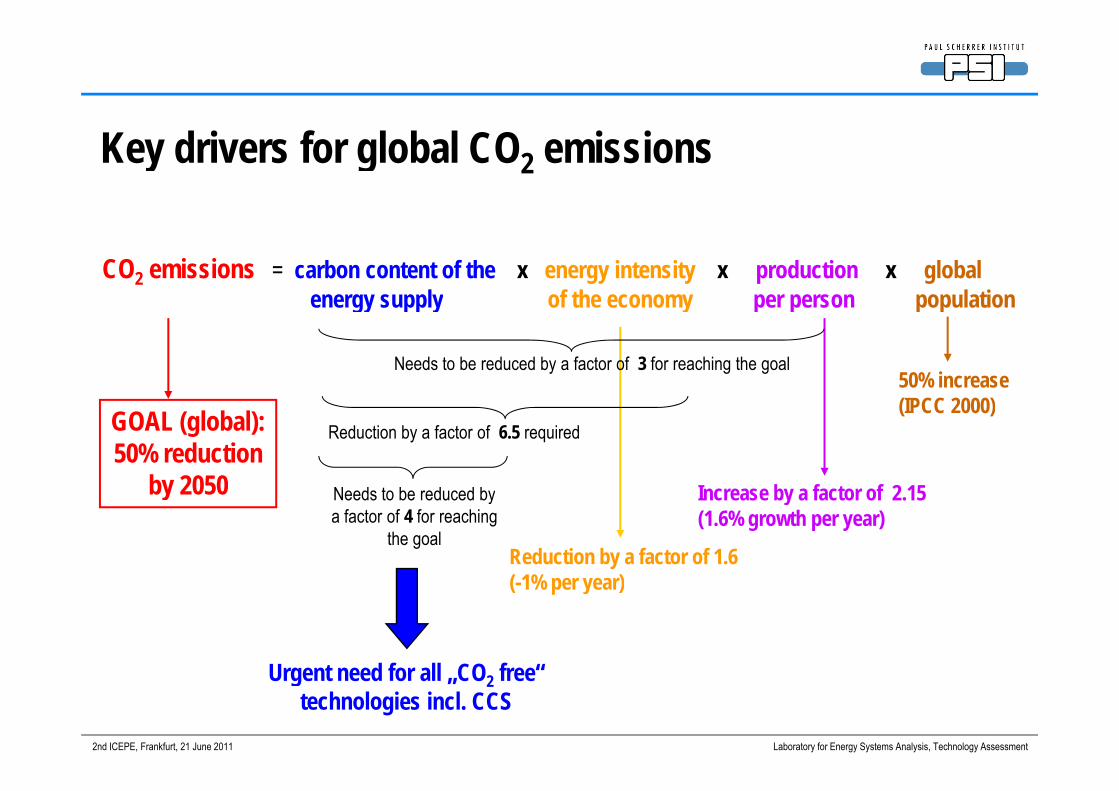
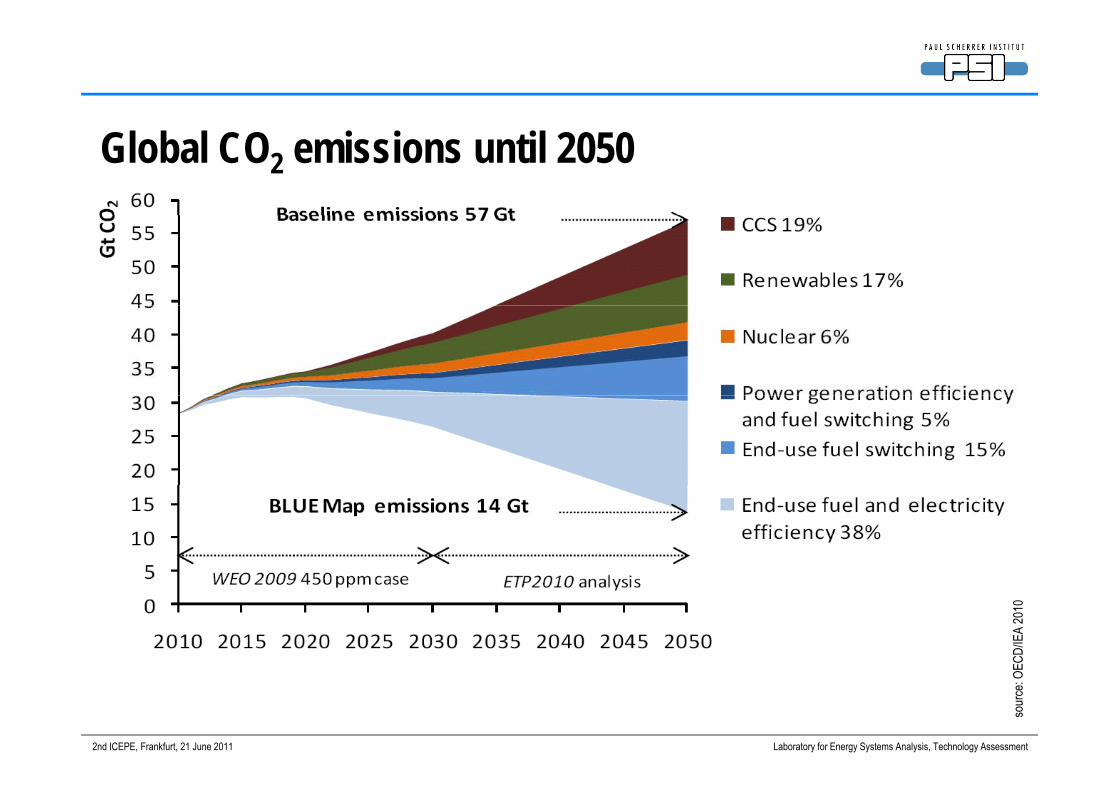
Key drivers for global CO2 emissions
CO2 emissions = carbon content of the x energy intensity x production x global energy supply of the economy per person populationenergy supply of the economy per person population
50% increaseNeeds to be reduced by a factor of 3 for reaching the goal
GOAL (global):50% reduction
by 2050
(IPCC 2000)
I b f t f 2 15
Reduction by a factor of 6.5 required
by 2050 Increase by a factor of 2.15(1.6% growth per year)
Reduction by a factor of 1.6( 1% )
Needs to be reduced bya factor of 4 for reaching
the goal
(-1% per year)
U t d f ll CO f “
2nd ICEPE, Frankfurt, 21 June 2011 Laboratory for Energy Systems Analysis, Technology Assessment
Urgent need for all „CO2 free“technologies incl. CCS
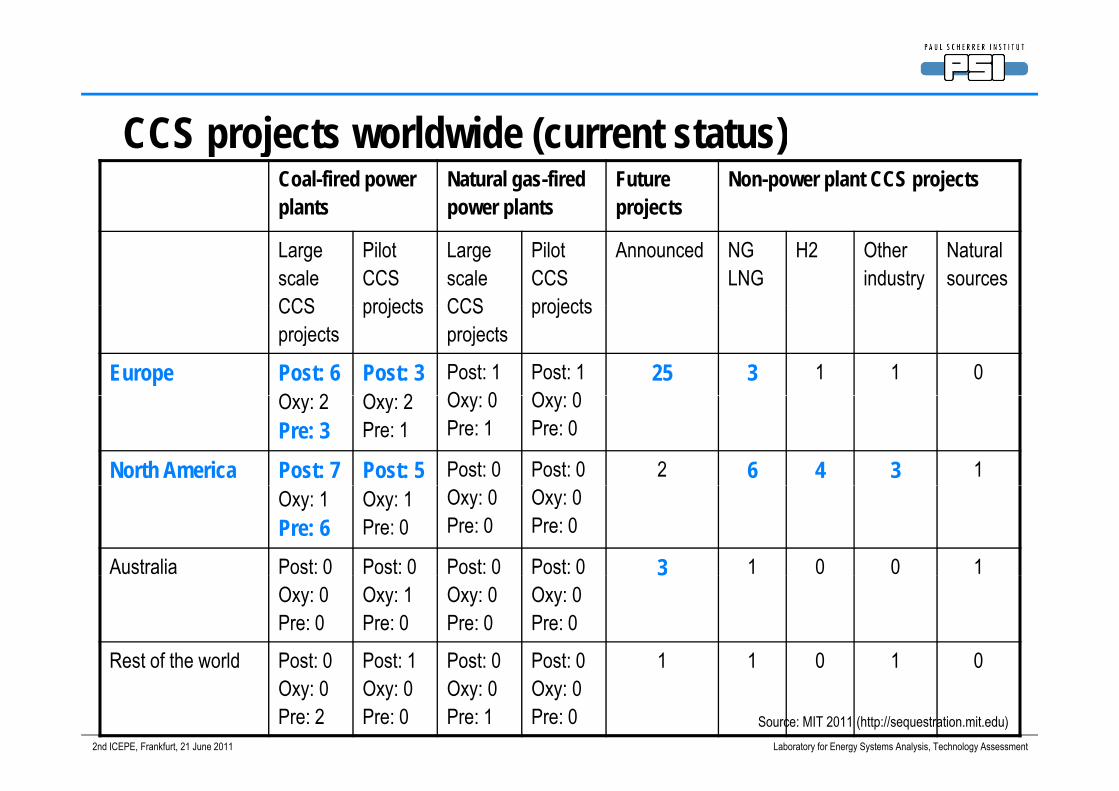
Rest of the world Post: 0 Post: 1 Post: 0 Post: 0 1 1 0 1 0
2nd ICEPE, Frankfurt, 21 June 2011 Laboratory for Energy Systems Analysis, Technology Assessment
Rest of the world Post: 0Oxy: 0Pre: 2
Post: 1 Oxy: 0Pre: 0
Post: 0Oxy: 0Pre: 1
Post: 0 Oxy: 0Pre: 0
1 1 0 1 0
Source: MIT 2011 (http://sequestration.mit.edu)
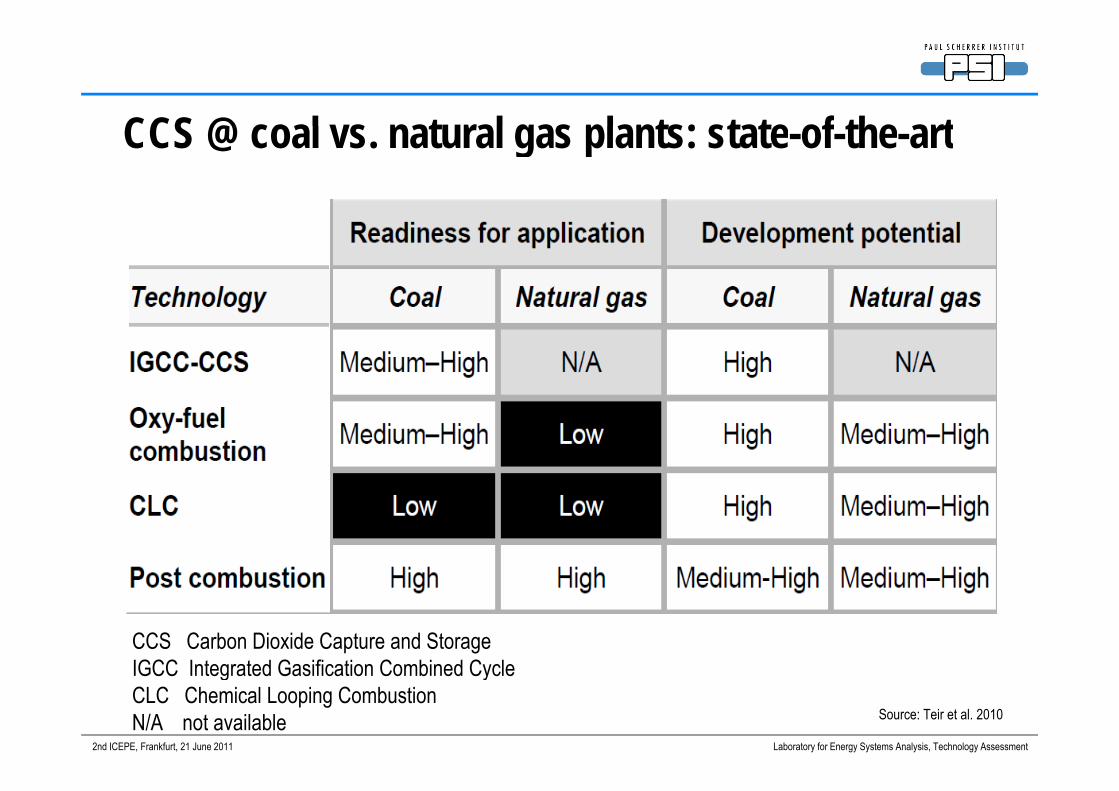
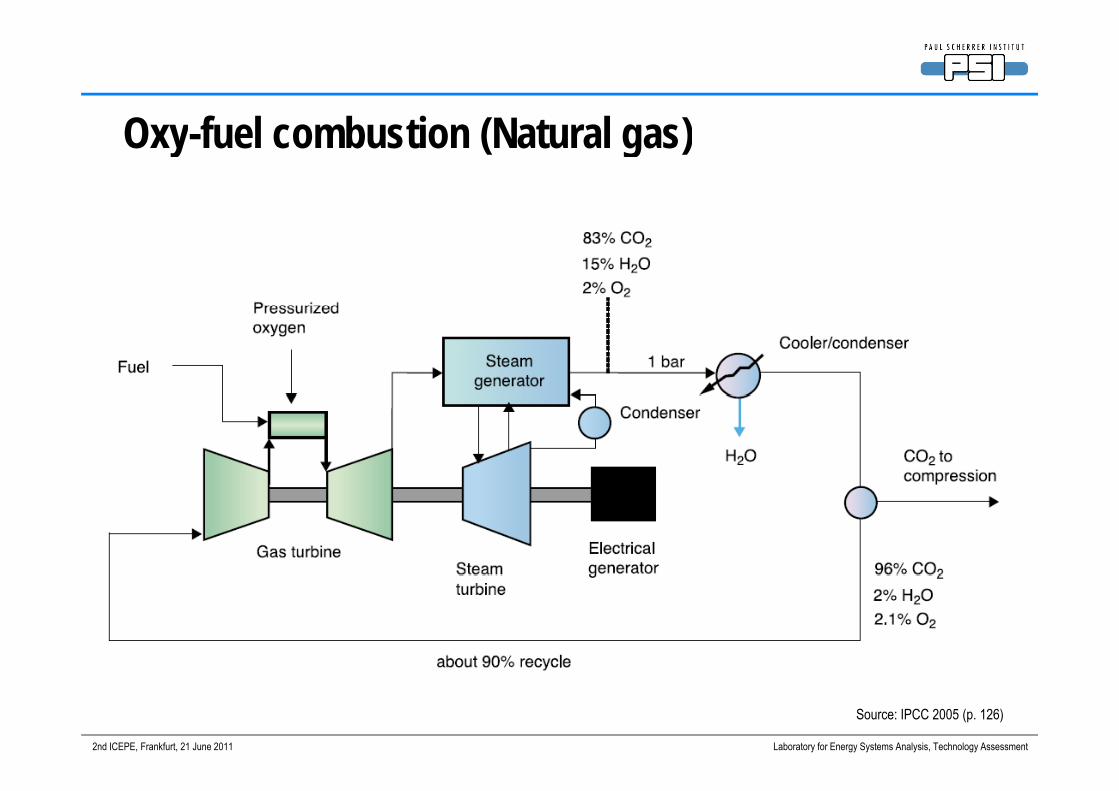
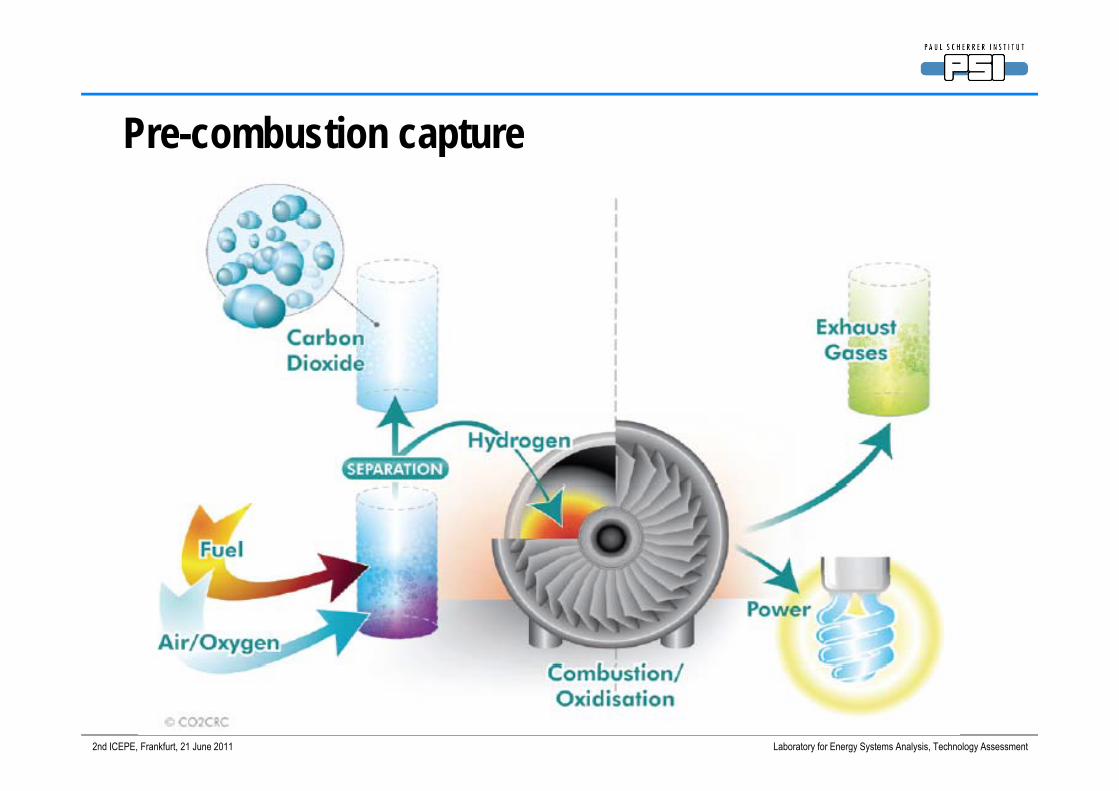
CCS @ coal vs natural gas plants: state of the artCCS @ coal vs. natural gas plants: state-of-the-art
CCS Carbon Dioxide Capture and StorageIGCC Integrated Gasification Combined Cycle
2nd ICEPE, Frankfurt, 21 June 2011 Laboratory for Energy Systems Analysis, Technology Assessment
IGCC Integrated Gasification Combined CycleCLC Chemical Looping CombustionN/A not available Source: Teir et al. 2010
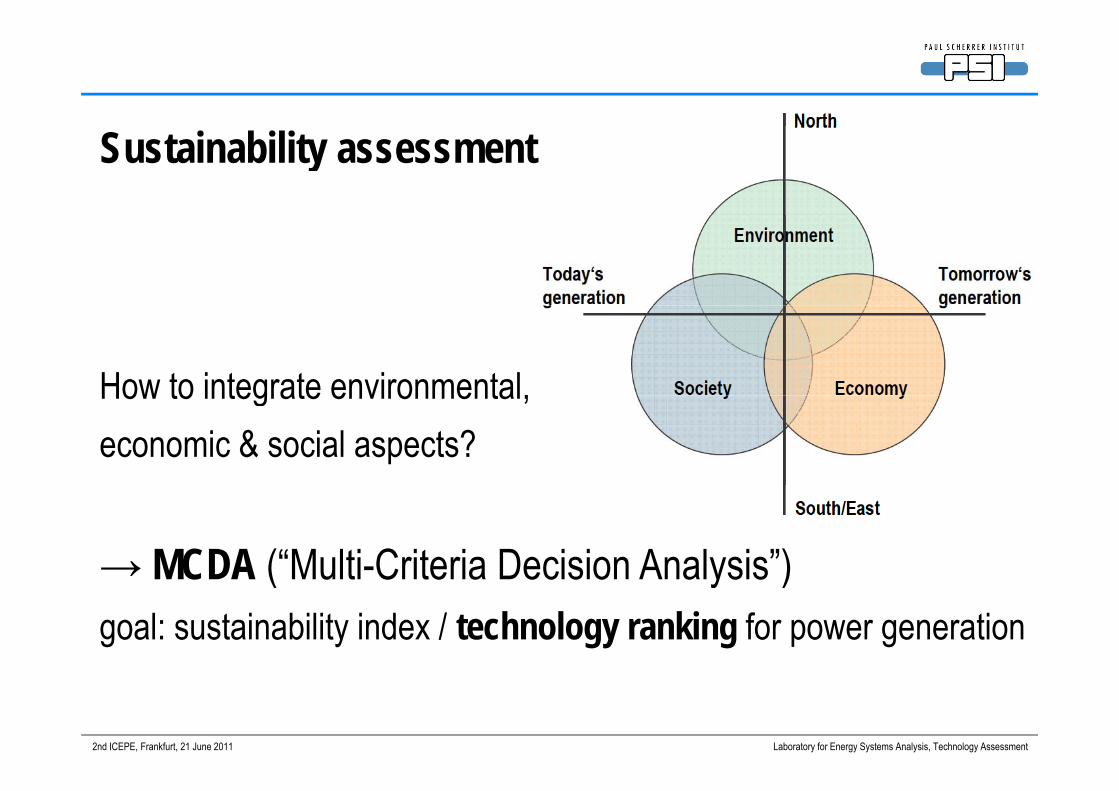
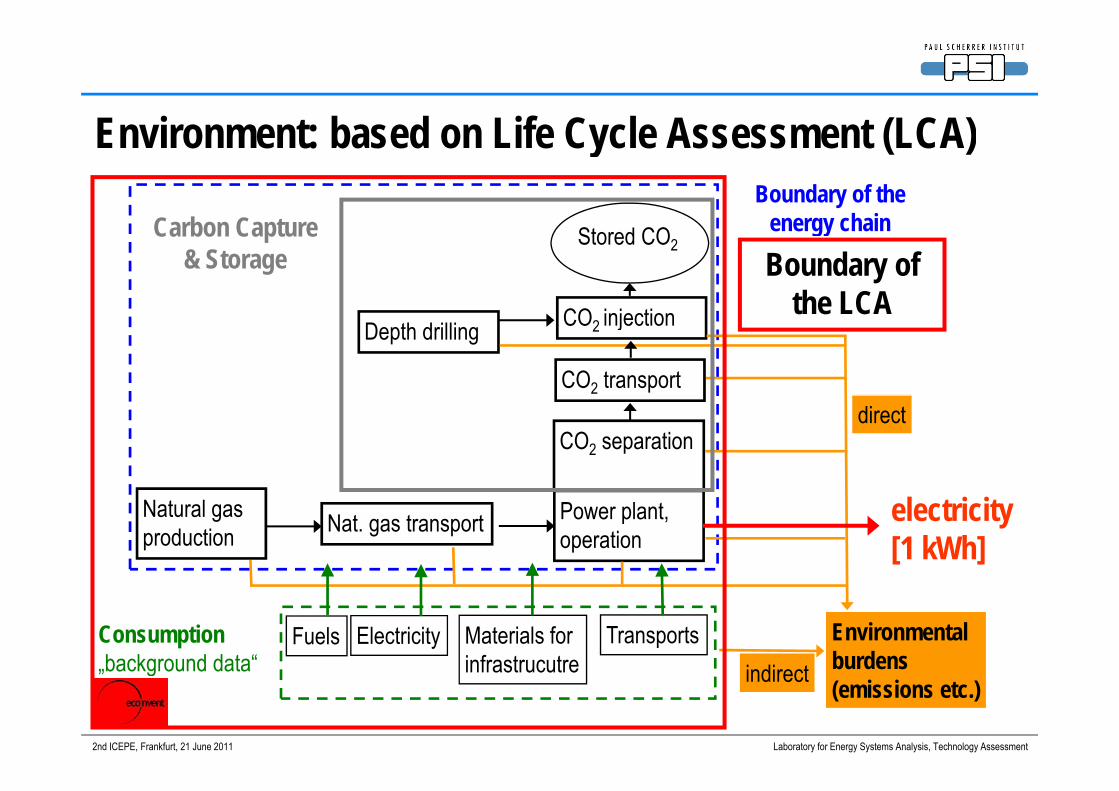
Sustainability assessment
How to integrate environmental,How to integrate environmental,economic & social aspects?
→ MCDA (“Multi-Criteria Decision Analysis”)→ MCDA ( Multi Criteria Decision Analysis )goal: sustainability index / technology ranking for power generation
2nd ICEPE, Frankfurt, 21 June 2011 Laboratory for Energy Systems Analysis, Technology Assessment
S l ti f t h l i
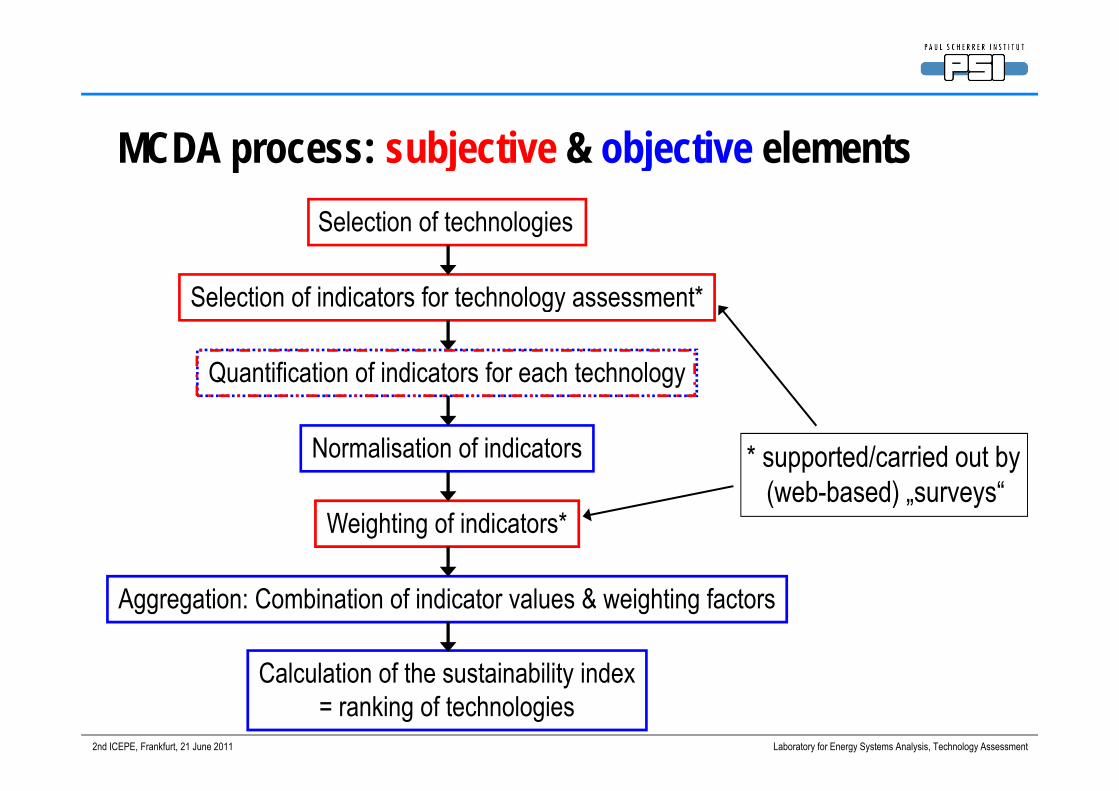
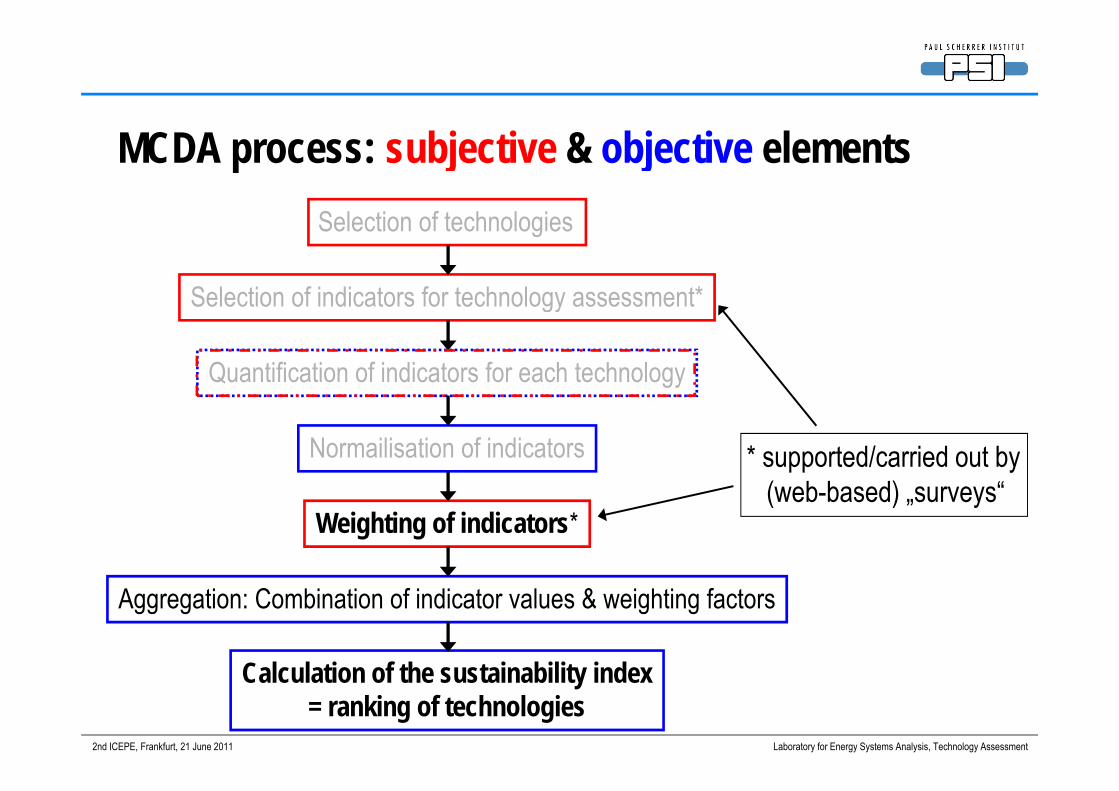
MCDA process: subjective & objective elementsSelection of technologies
Selection of indicators for technology assessment*Selection of indicators for technology assessment
Quantification of indicators for each technology
Normalisation of indicators * supported/carried out by( b b d) “
Weighting of indicators*(web-based) „surveys“
Aggregation: Combination of indicator values & weighting factors
C l l ti f th t i bilit i d
2nd ICEPE, Frankfurt, 21 June 2011 Laboratory for Energy Systems Analysis, Technology Assessment
Calculation of the sustainability index= ranking of technologies
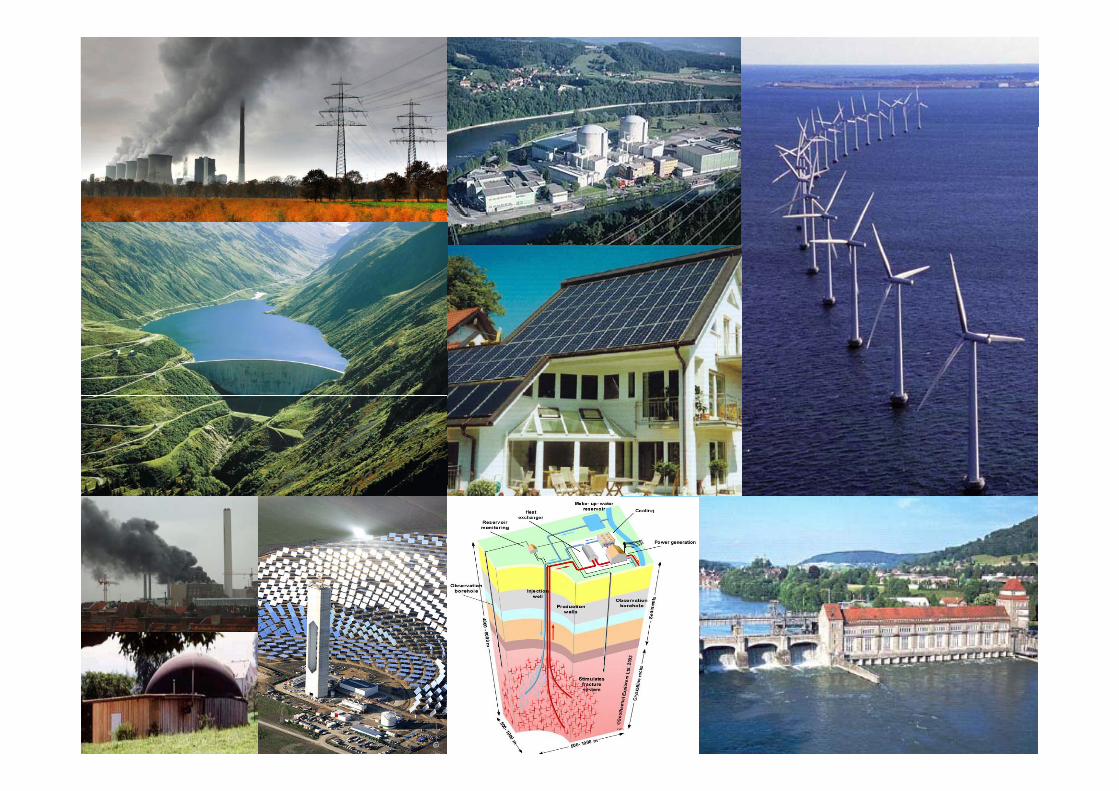
Indicators for measuring sustainability (examples)
greenhouse gas emissionsconsumption of resources society economy
society:
pimpacts on ecosystems
acceptance fairness
society economy
society: acceptance, fairnesswastesfatalities due to pollutants and accidentsl d li
2nd ICEPE, Frankfurt, 21 June 2011 Laboratory for Energy Systems Analysis, Technology Assessment
landscape quality
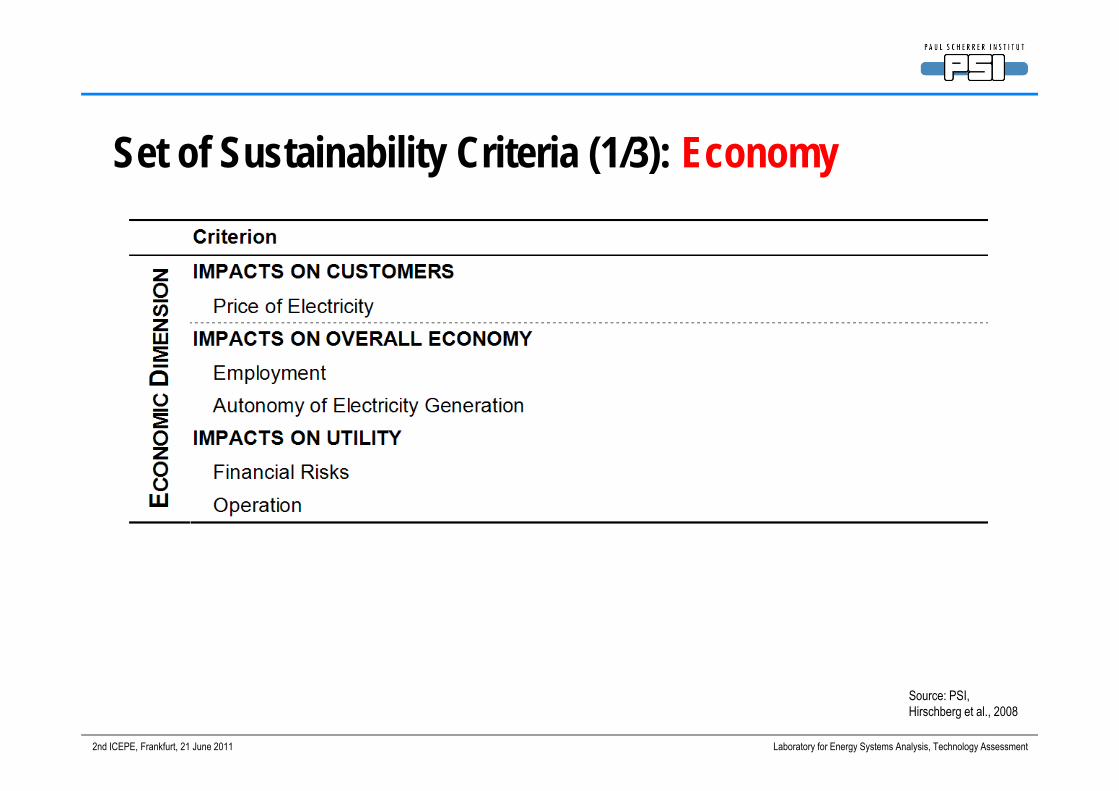
Set of Sustainability Criteria (1/3): Economy
2nd ICEPE, Frankfurt, 21 June 2011 Laboratory for Energy Systems Analysis, Technology Assessment
Source: PSI,Hirschberg et al., 2008
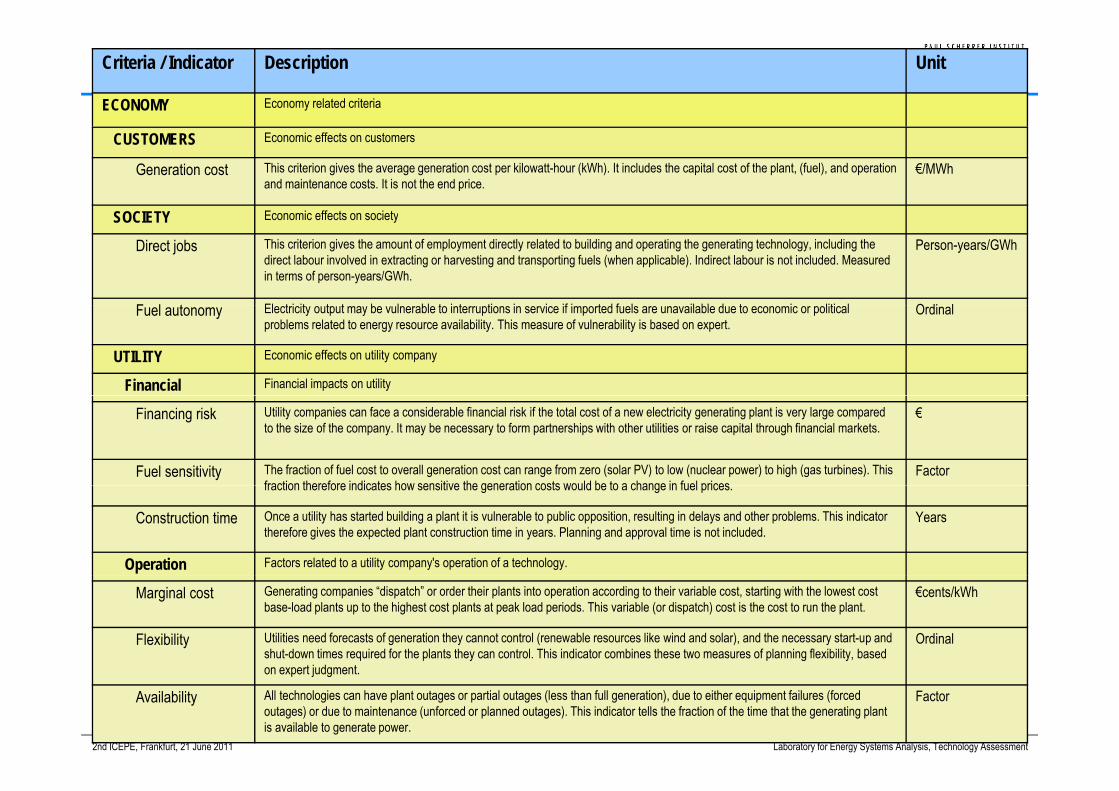
Criteria / Indicator Description Unit
ECONOMY Economy related criteria
CUSTOMERS Economic effects on customers
Generation cost This criterion gives the average generation cost per kilowatt-hour (kWh). It includes the capital cost of the plant, (fuel), and operation and maintenance costs. It is not the end price.
€/MWh
SOCIETY Economic effects on societySOCIETY Economic effects on society
Direct jobs This criterion gives the amount of employment directly related to building and operating the generating technology, including the direct labour involved in extracting or harvesting and transporting fuels (when applicable). Indirect labour is not included. Measured in terms of person-years/GWh.
Person-years/GWh
F l t El t i it t t b l bl t i t ti i i if i t d f l il bl d t i liti l O di lFuel autonomy Electricity output may be vulnerable to interruptions in service if imported fuels are unavailable due to economic or political problems related to energy resource availability. This measure of vulnerability is based on expert.
Ordinal
UTILITY Economic effects on utility company
Financial Financial impacts on utility
Financing risk Utility companies can face a considerable financial risk if the total cost of a new electricity generating plant is very large compared to the size of the company. It may be necessary to form partnerships with other utilities or raise capital through financial markets.
€
Fuel sensitivity The fraction of fuel cost to overall generation cost can range from zero (solar PV) to low (nuclear power) to high (gas turbines). This fraction therefore indicates how sensitive the generation costs would be to a change in fuel prices
Factorfraction therefore indicates how sensitive the generation costs would be to a change in fuel prices.
Construction time Once a utility has started building a plant it is vulnerable to public opposition, resulting in delays and other problems. This indicator therefore gives the expected plant construction time in years. Planning and approval time is not included.
Years
Operation Factors related to a utility company's operation of a technology.
Marginal cost Generating companies “dispatch” or order their plants into operation according to their variable cost, starting with the lowest cost base-load plants up to the highest cost plants at peak load periods. This variable (or dispatch) cost is the cost to run the plant.
€cents/kWh
Flexibility Utilities need forecasts of generation they cannot control (renewable resources like wind and solar), and the necessary start-up and shut-down times required for the plants they can control. This indicator combines these two measures of planning flexibility, based
t j d t
Ordinal
2nd ICEPE, Frankfurt, 21 June 2011 Laboratory for Energy Systems Analysis, Technology Assessment
on expert judgment.
Availability All technologies can have plant outages or partial outages (less than full generation), due to either equipment failures (forcedoutages) or due to maintenance (unforced or planned outages). This indicator tells the fraction of the time that the generating plant is available to generate power.
Factor
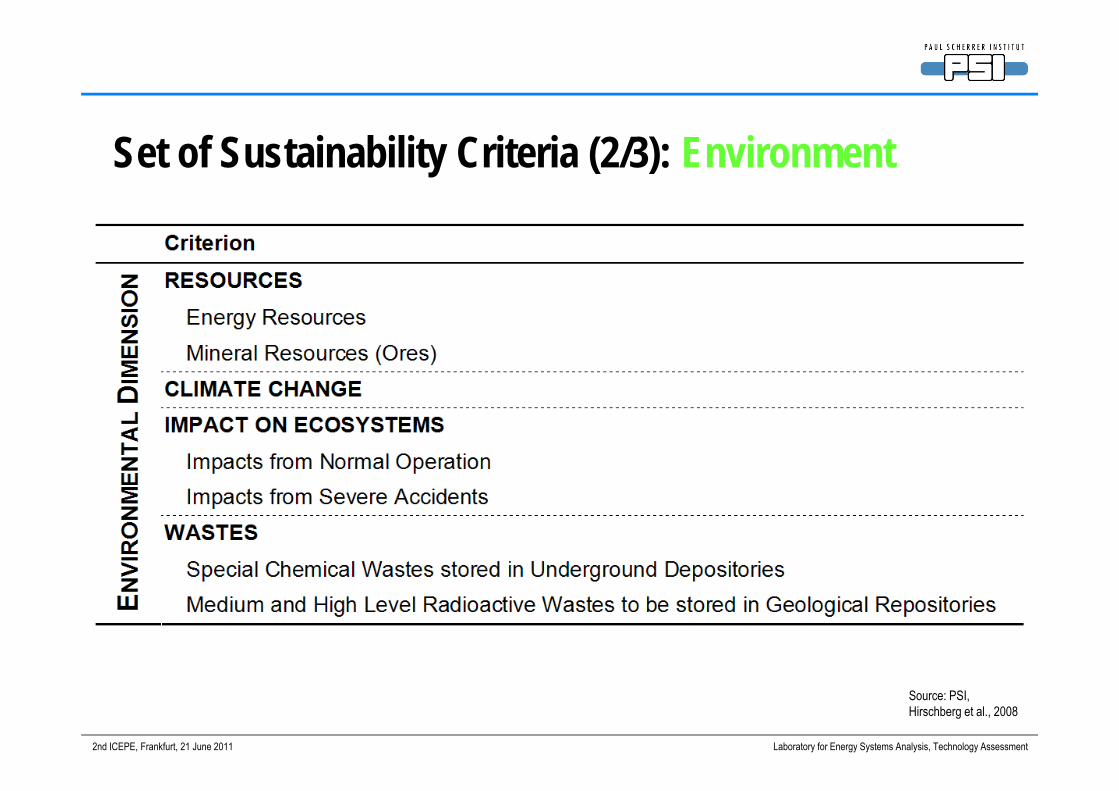
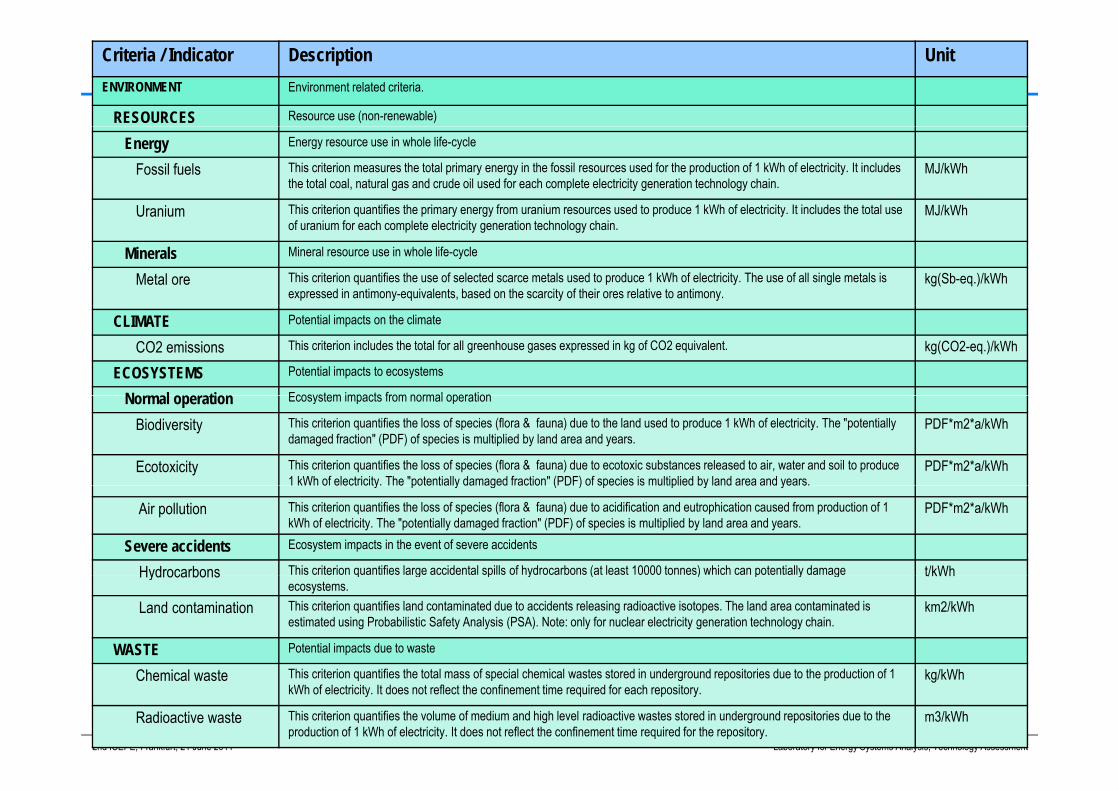
Set of Sustainability Criteria (2/3): Environment
2nd ICEPE, Frankfurt, 21 June 2011 Laboratory for Energy Systems Analysis, Technology Assessment
Source: PSI,Hirschberg et al., 2008
Criteria / Indicator Description UnitENVIRONMENT Environment related criteria.
RESOURCES Resource use (non-renewable)
Energy Energy resource use in whole life-cycle
Fossil fuels This criterion measures the total primary energy in the fossil resources used for the production of 1 kWh of electricity. It includes the total coal, natural gas and crude oil used for each complete electricity generation technology chain.
MJ/kWh
Uranium This criterion quantifies the primary energy from uranium resources used to produce 1 kWh of electricity. It includes the total use MJ/kWhUranium q p y gy p yof uranium for each complete electricity generation technology chain.
Minerals Mineral resource use in whole life-cycle
Metal ore This criterion quantifies the use of selected scarce metals used to produce 1 kWh of electricity. The use of all single metals is expressed in antimony-equivalents, based on the scarcity of their ores relative to antimony.
kg(Sb-eq.)/kWh
CLIMATE Potential impacts on the climate
CO2 emissions This criterion includes the total for all greenhouse gases expressed in kg of CO2 equivalent. kg(CO2-eq.)/kWh
ECOSYSTEMS Potential impacts to ecosystems
N l ti Ecosystem impacts from normal operationNormal operation Ecosystem impacts from normal operation
Biodiversity This criterion quantifies the loss of species (flora & fauna) due to the land used to produce 1 kWh of electricity. The "potentially damaged fraction" (PDF) of species is multiplied by land area and years.
PDF*m2*a/kWh
Ecotoxicity This criterion quantifies the loss of species (flora & fauna) due to ecotoxic substances released to air, water and soil to produce 1 kWh of electricity. The "potentially damaged fraction" (PDF) of species is multiplied by land area and years.
PDF*m2*a/kWh1 kWh of electricity. The potentially damaged fraction (PDF) of species is multiplied by land area and years.
Air pollution This criterion quantifies the loss of species (flora & fauna) due to acidification and eutrophication caused from production of 1 kWh of electricity. The "potentially damaged fraction" (PDF) of species is multiplied by land area and years.
PDF*m2*a/kWh
Severe accidents Ecosystem impacts in the event of severe accidents
Hydrocarbons This criterion quantifies large accidental spills of hydrocarbons (at least 10000 tonnes) which can potentially damage t/kWhHydrocarbons q g p y ( ) p y gecosystems.
t/kWh
Land contamination This criterion quantifies land contaminated due to accidents releasing radioactive isotopes. The land area contaminated is estimated using Probabilistic Safety Analysis (PSA). Note: only for nuclear electricity generation technology chain.
km2/kWh
WASTE Potential impacts due to waste
2nd ICEPE, Frankfurt, 21 June 2011 Laboratory for Energy Systems Analysis, Technology Assessment
Chemical waste This criterion quantifies the total mass of special chemical wastes stored in underground repositories due to the production of 1 kWh of electricity. It does not reflect the confinement time required for each repository.
kg/kWh
Radioactive waste This criterion quantifies the volume of medium and high level radioactive wastes stored in underground repositories due to the production of 1 kWh of electricity. It does not reflect the confinement time required for the repository.
m3/kWh
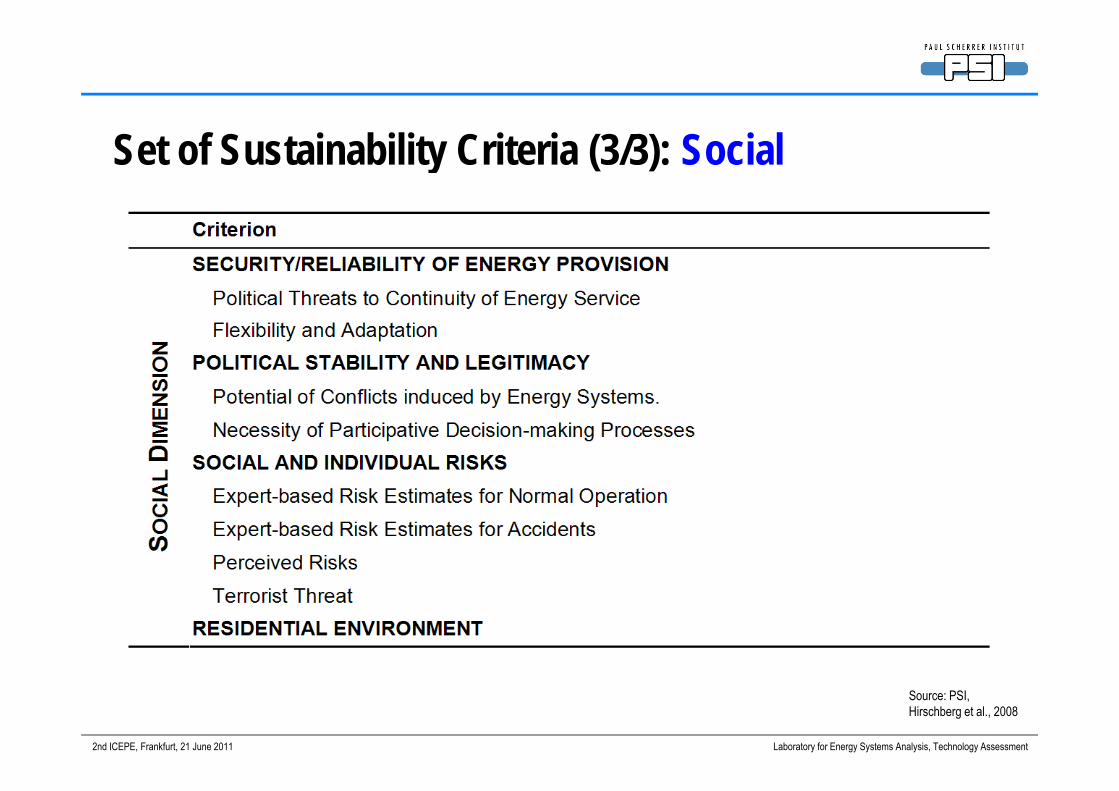
Set of Sustainability Criteria (3/3): Social
2nd ICEPE, Frankfurt, 21 June 2011 Laboratory for Energy Systems Analysis, Technology Assessment
Source: PSI,Hirschberg et al., 2008
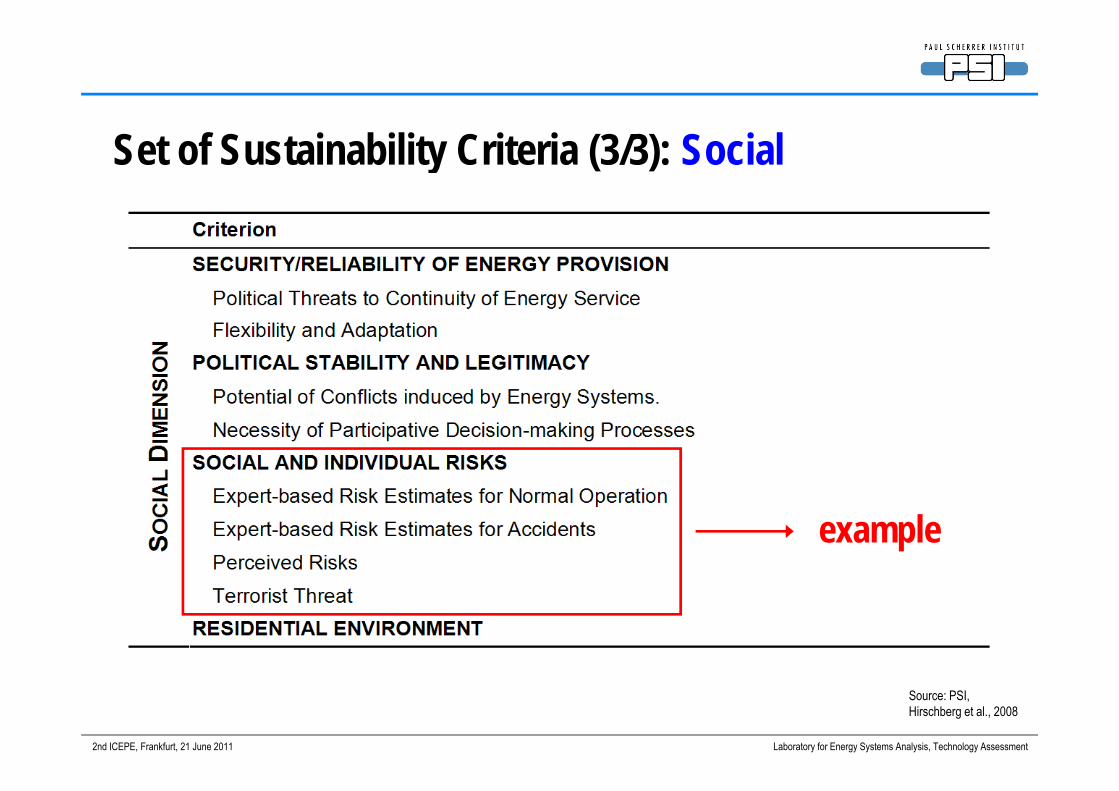
Set of Sustainability Criteria (3/3): Social
example
2nd ICEPE, Frankfurt, 21 June 2011 Laboratory for Energy Systems Analysis, Technology Assessment
Source: PSI,Hirschberg et al., 2008
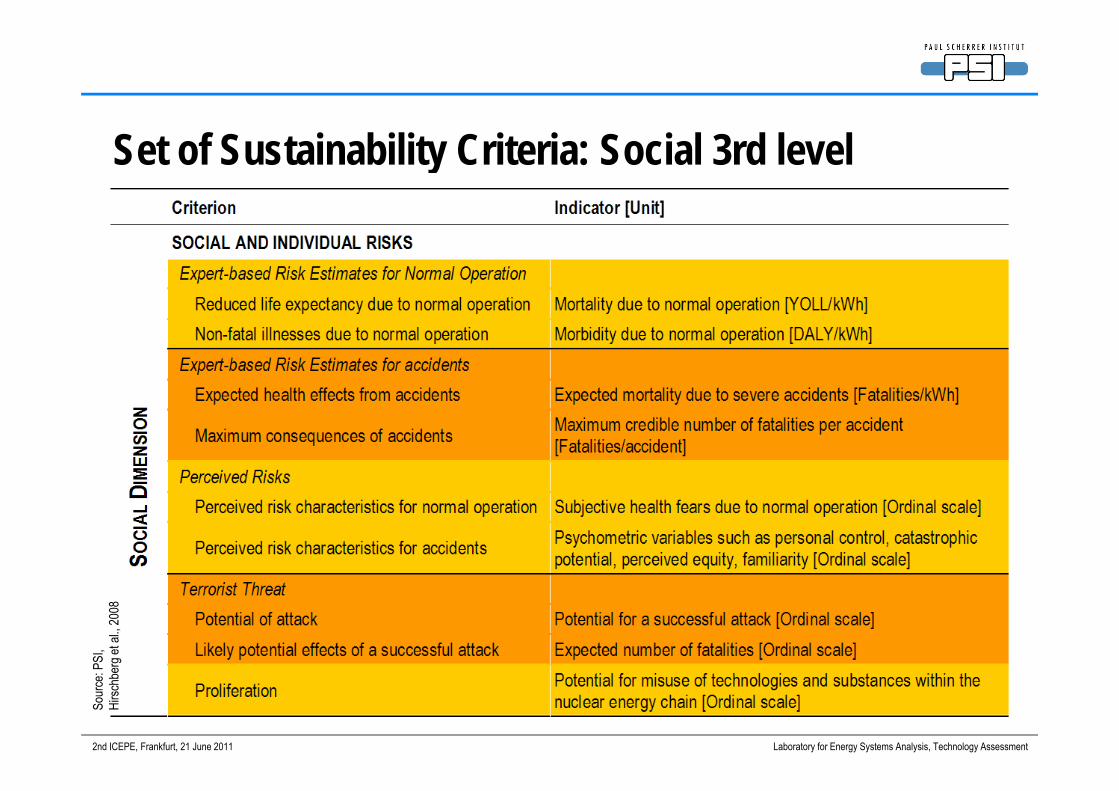
Set of Sustainability Criteria: Social 3rd levelPS
I,rg
et al
., 200
8
2nd ICEPE, Frankfurt, 21 June 2011 Laboratory for Energy Systems Analysis, Technology Assessment
Sour
ce: P
Hirsc
hber
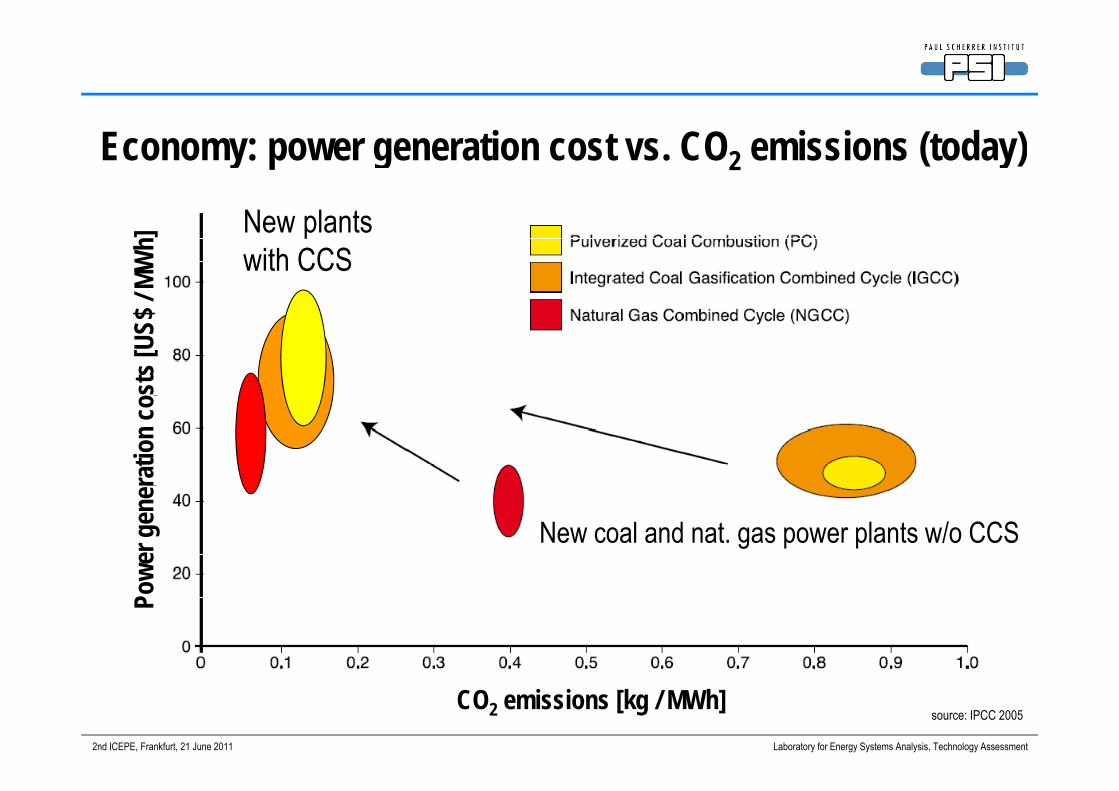
New plants
Economy: power generation cost vs. CO2 emissions (today) / M
Wh] New plants
with CCS
sts [
US$
ratio
n co
wer g
ener
New coal and nat. gas power plants w/o CCS
Pow
2nd ICEPE, Frankfurt, 21 June 2011 Laboratory for Energy Systems Analysis, Technology Assessment
CO2 emissions [kg / MWh]source: IPCC 2005
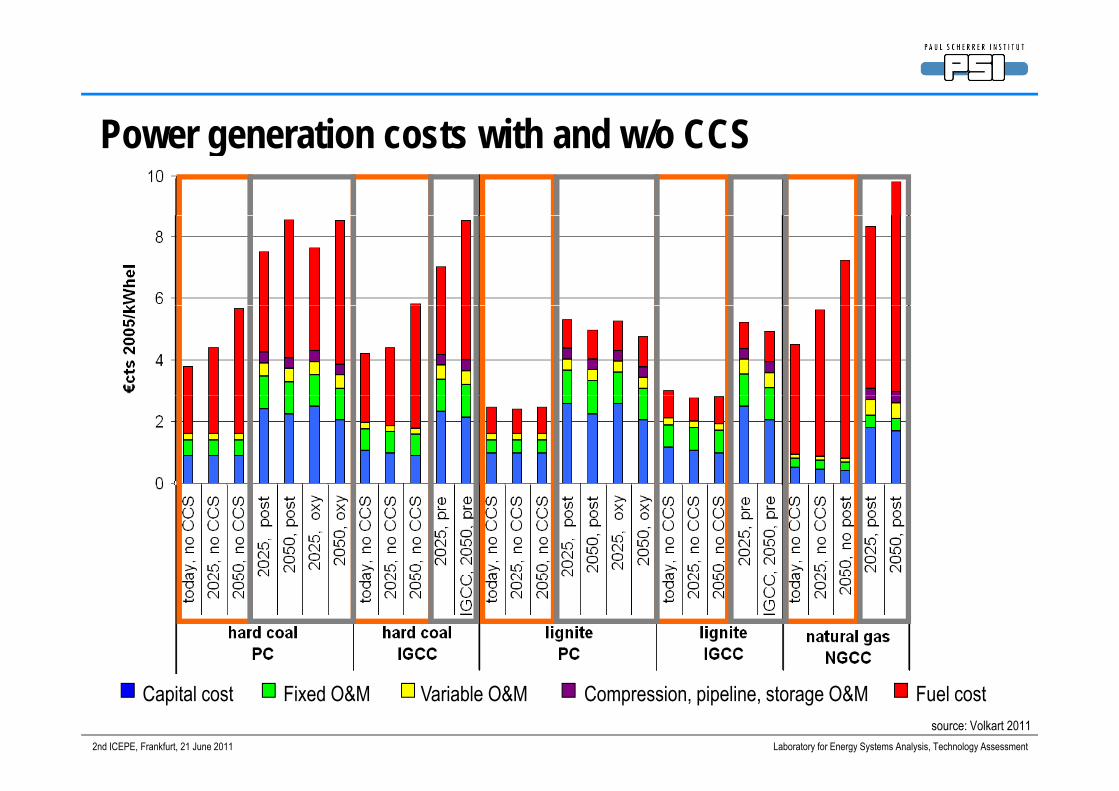
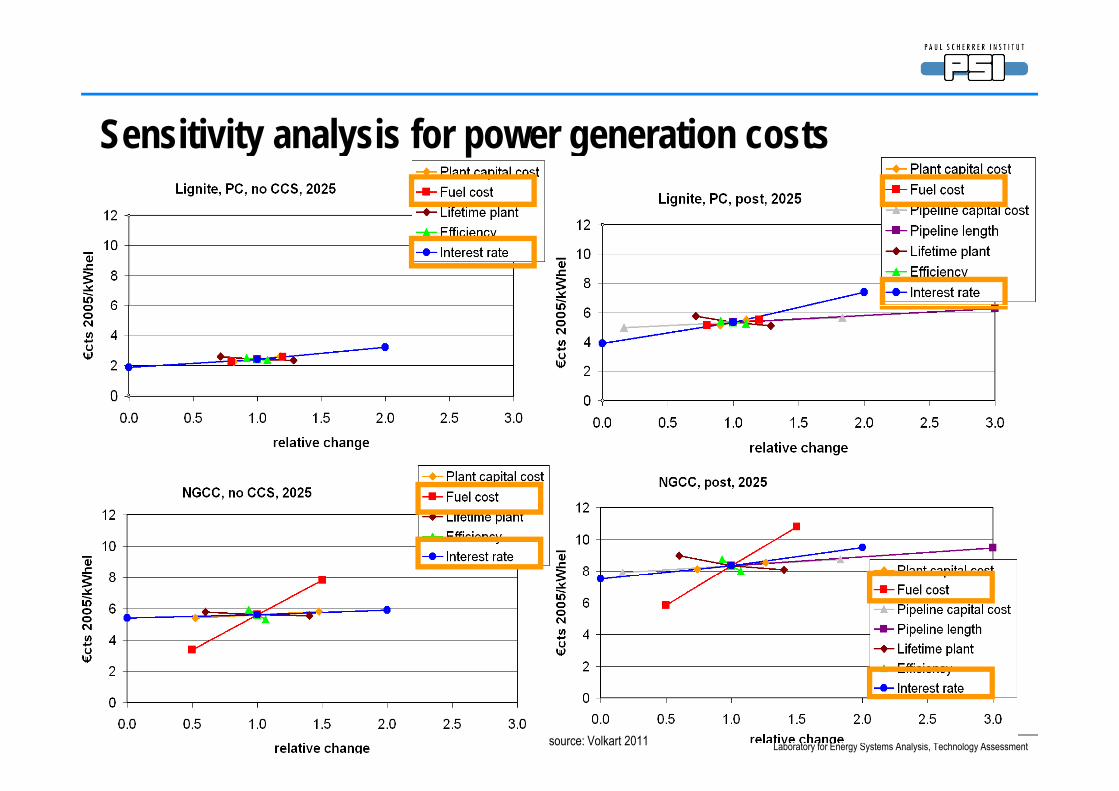
P ti t ith d / CCSPower generation costs with and w/o CCS
2nd ICEPE, Frankfurt, 21 June 2011 Laboratory for Energy Systems Analysis, Technology Assessment
2nd ICEPE, Frankfurt, 21 June 2011 Laboratory for Energy Systems Analysis, Technology Assessment
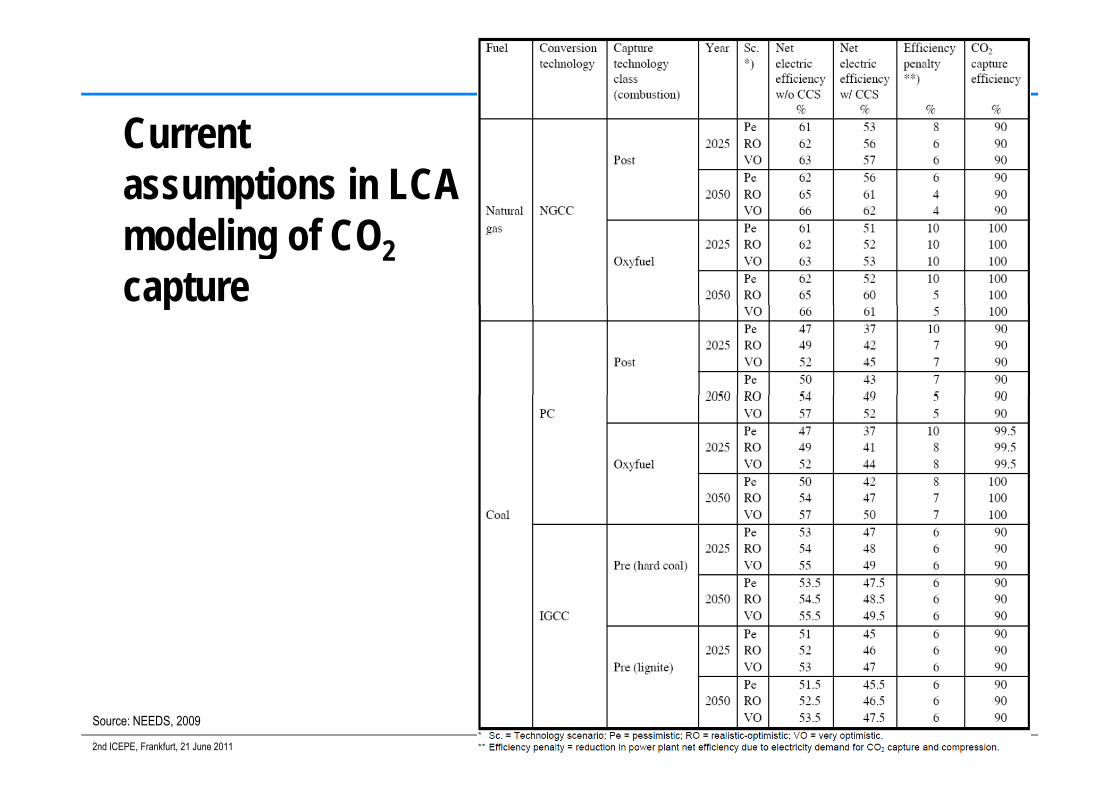
Source: NEEDS, 2009
PC oxy
PC p
PC oxy
PC p
CC p
S l ti f t h l i
MCDA process: subjective & objective elementsSelection of technologies
Selection of indicators for technology assessment*Selection of indicators for technology assessment
Quantification of indicators for each technology
Normailisation of indicators * supported/carried out by( b b d) “
Weighting of indicators*(web-based) „surveys“
Aggregation: Combination of indicator values & weighting factors
C l l ti f th t i bilit i d
2nd ICEPE, Frankfurt, 21 June 2011 Laboratory for Energy Systems Analysis, Technology Assessment
Calculation of the sustainability index= ranking of technologies
2nd ICEPE, Frankfurt, 21 June 2011 Laboratory for Energy Systems Analysis, Technology Assessment
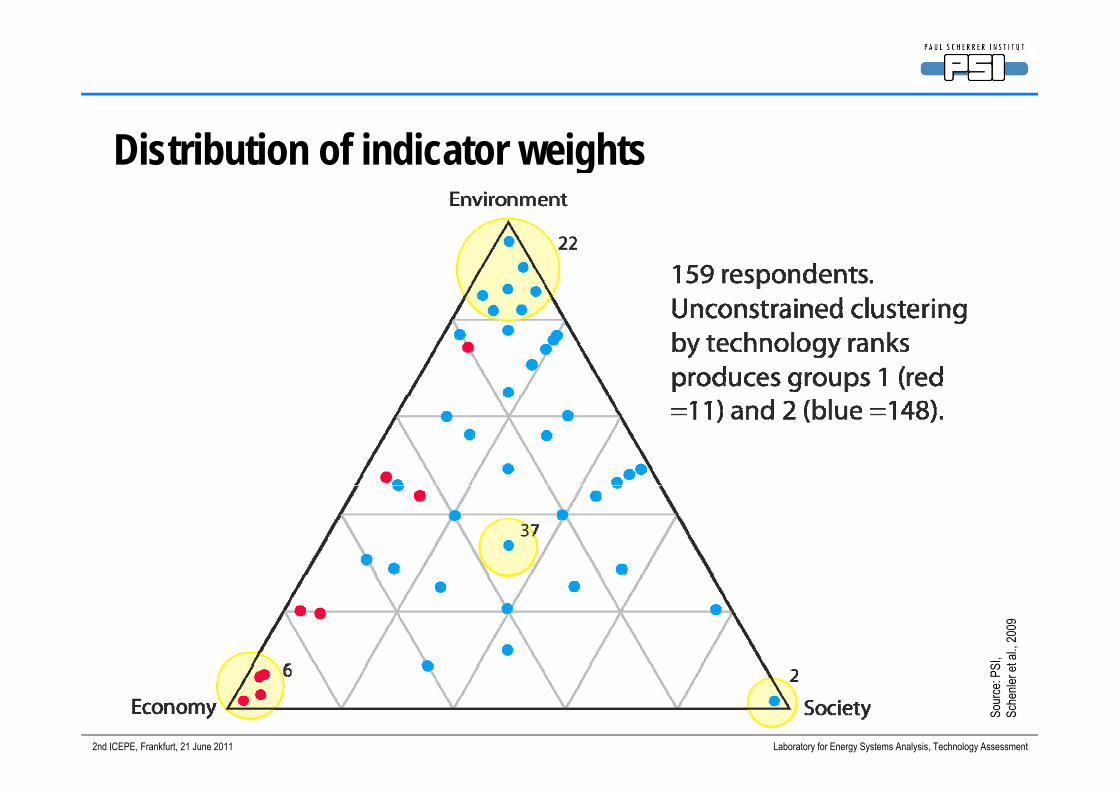
Distribution of indicator weights
SI, t al.,
2009
2nd ICEPE, Frankfurt, 21 June 2011 Laboratory for Energy Systems Analysis, Technology Assessment
Sour
ce: P
SSc
henle
r et
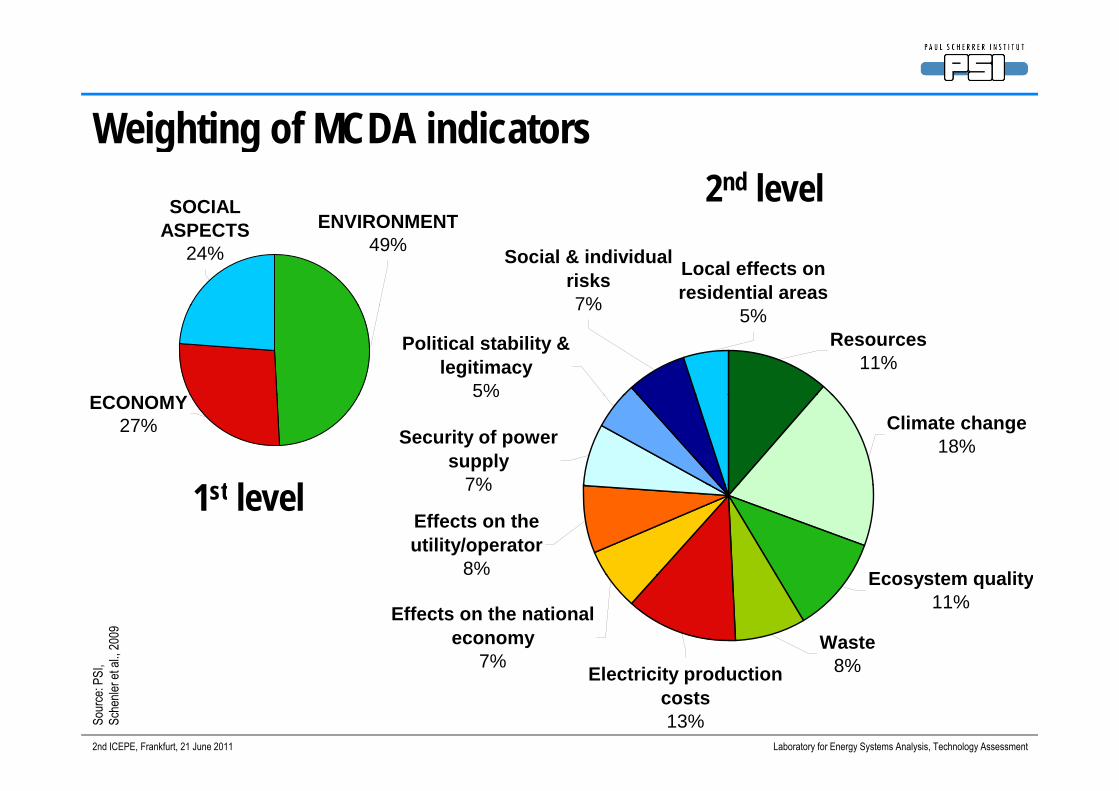
Weighting of MCDA indicators
ENVIRONMENTSOCIAL
Weighting of MCDA indicators2nd level
Social & individual risks7%
Local effects on residential areas
ENVIRONMENT49%
ASPECTS24%
Political stability & legitimacy
5%
7% 5%Resources
11%
ECONOMY
Security of power supply
7%
5%
Climate change18%
ECONOMY27%
1 t l lEffects on the utility/operator
8% Ecosystem quality
7%1st level%
Effects on the national economy
7%Waste
8%
Ecosystem quality11%
al., 2
009
2nd ICEPE, Frankfurt, 21 June 2011 Laboratory for Energy Systems Analysis, Technology Assessment
7% Electricity production costs13%
8%
Sour
ce: P
SI,
Sche
nler e
t a
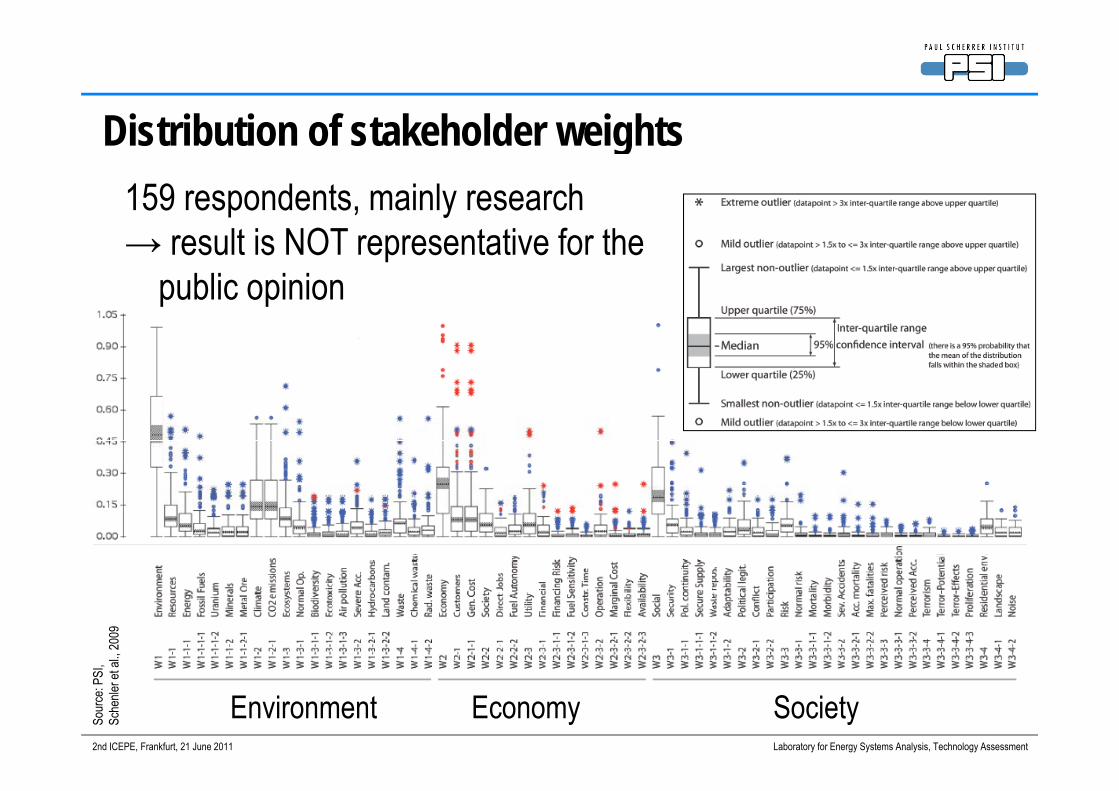
Distribution of stakeholder weightsDistribution of stakeholder weights159 respondents, mainly researchp y→ result is NOT representative for the
public opinionp p
al., 2
009
2nd ICEPE, Frankfurt, 21 June 2011 Laboratory for Energy Systems Analysis, Technology Assessment
Environment Economy SocietySour
ce: P
SI,
Sche
nler e
t a
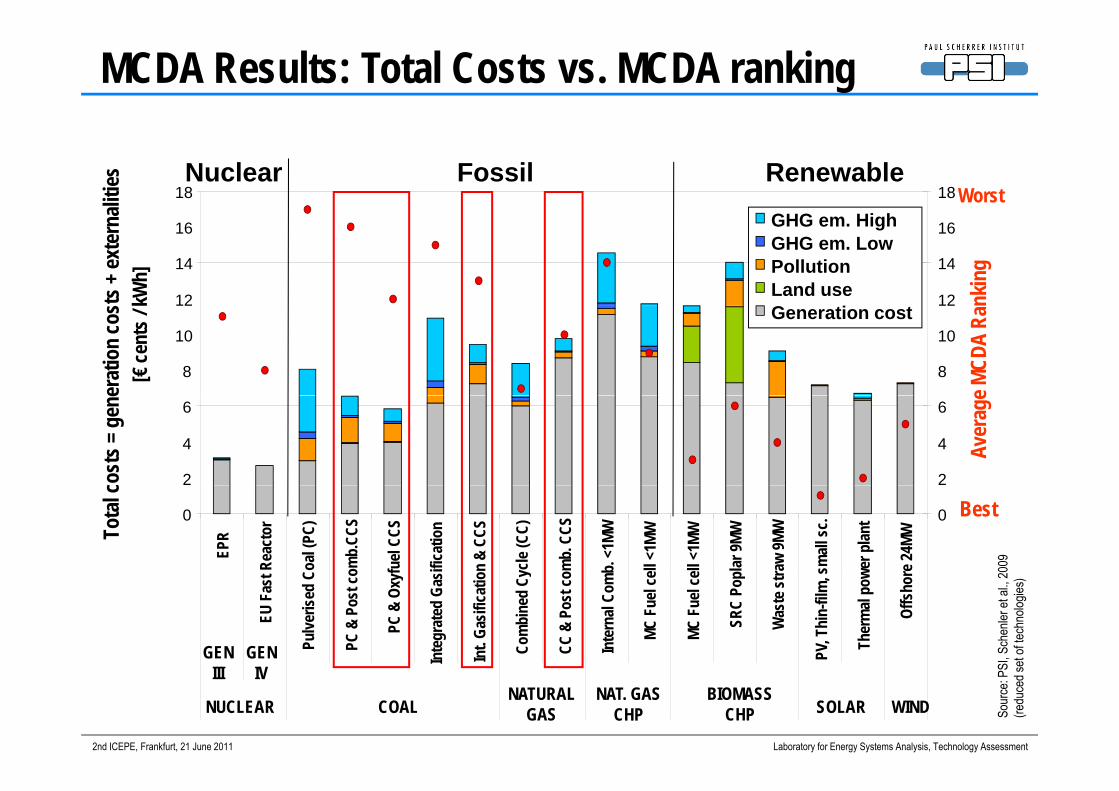
MCDA Results: Total Costs vs. MCDA rankingali
ties Nuclear Fossil Renewable
Worst18 18
GHG Hi h
sts +
exte
rna
nkin
g
kWh]
12
14
16
12
14
16GHG em. HighGHG em. LowPollutionLand useG i
erat
ion
cos
e MCD
A Ra
[€ce
nts /
k
8
10
8
10Generation cost
cost
s = g
ene
Aver
age
2
4
6
2
4
6
Tota
l c Best0
EPR
t Rea
ctor
Coal
(PC)
omb.
CCS
yfue
l CCS
sifica
tion
on &
CCS
ycle
(CC)
omb.
CCS
mb.
<1M
W
ell <
1MW
ell <
1MW
plar
9MW
raw
9MW
small
sc.
wer p
lant
re 24
MW
0
2009
EU F
ast
Pulve
rised
C
PC &
Pos
t co
PC &
Oxy
Inte
grat
ed G
as
Int.
Gasif
icatio
Com
bine
d Cy
CC &
Pos
t co
Inte
rnal
Com
MC F
uel c
e
MC F
uel c
e
SRC
Pop
Was
te st
r
PV, T
hin-
film
,
Ther
mal
pow
Offs
hor
GEN GEN
SI, S
chen
ler et
al., 2
et of
techn
ologie
s)
2nd ICEPE, Frankfurt, 21 June 2011 Laboratory for Energy Systems Analysis, Technology Assessment
III IV
COALNATURAL
GASNAT. GAS
CHPBIOMASS
CHP SOLAR WIND Sour
ce: P
S(re
duce
d se
NUCLEAR
Conclusions• Any option for GHG reduction needs to be evaluated concerning
Conclusions
sustainability before large-scale implementation considering environmental, economic & social aspects
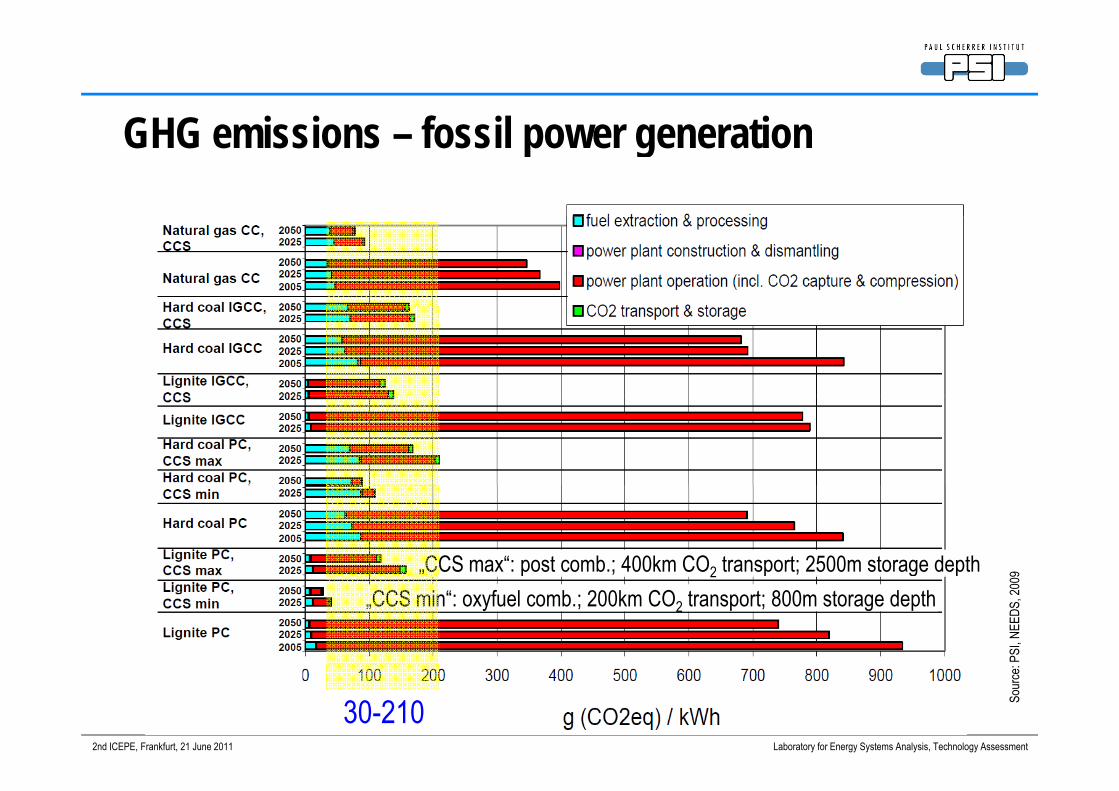
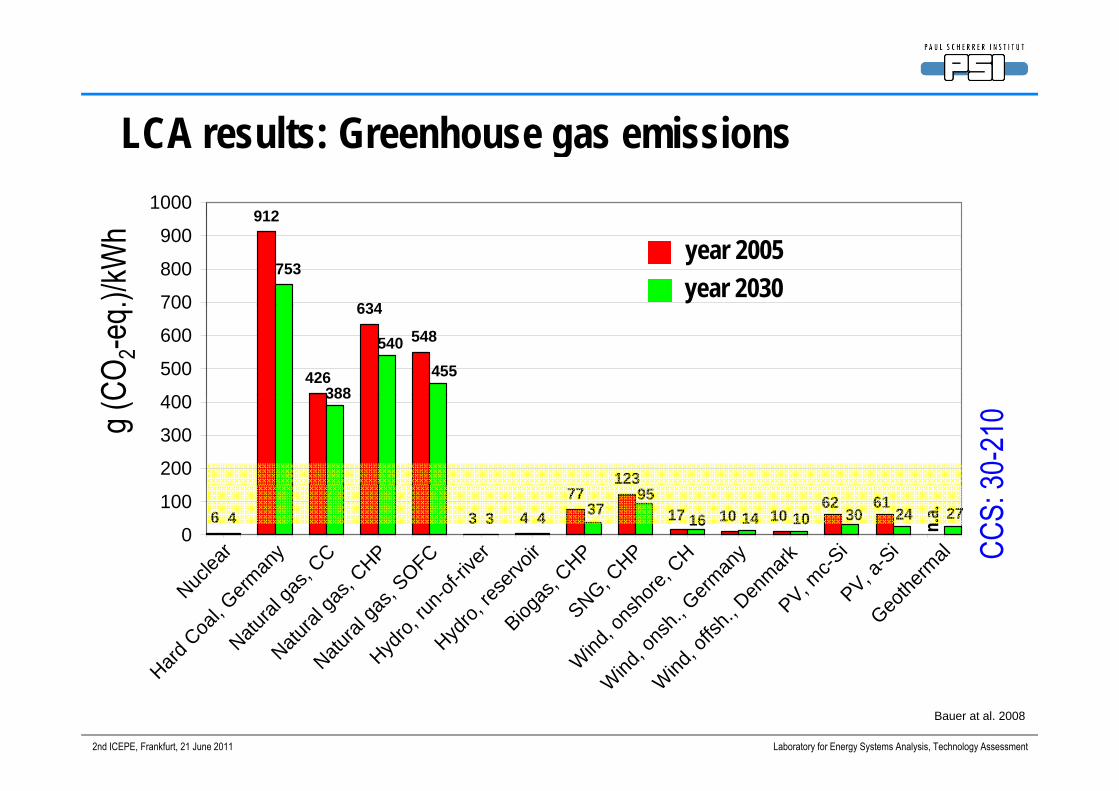
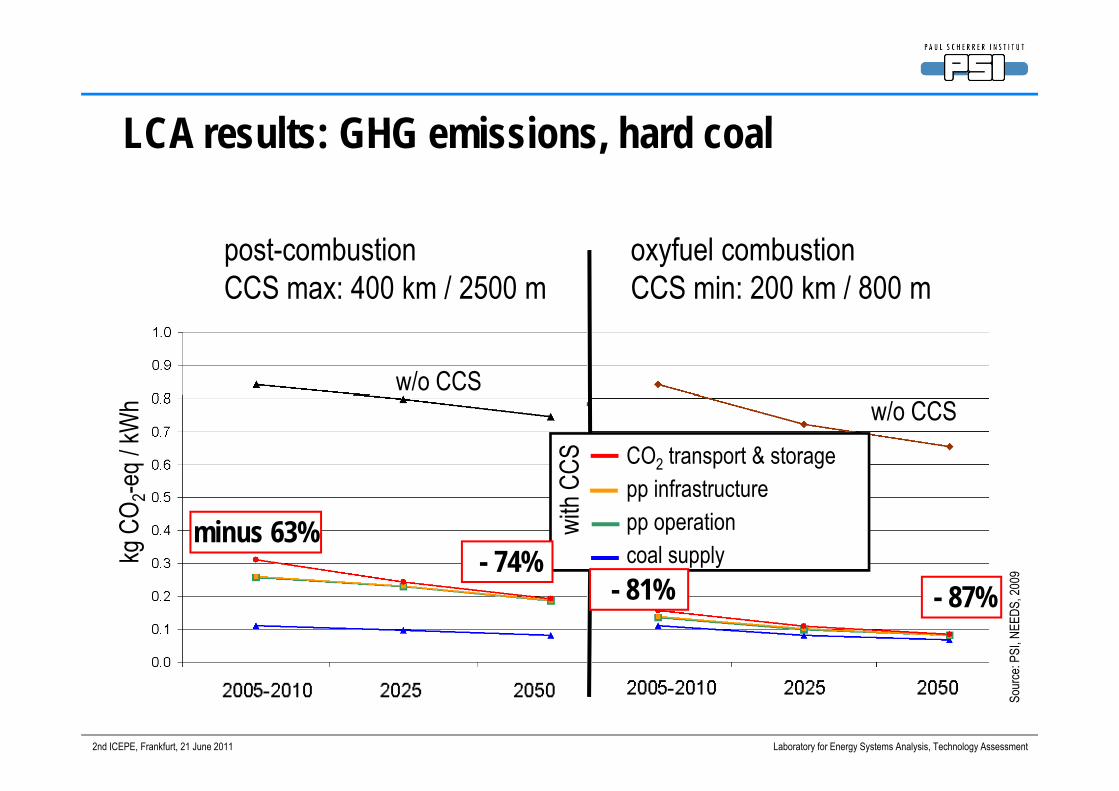
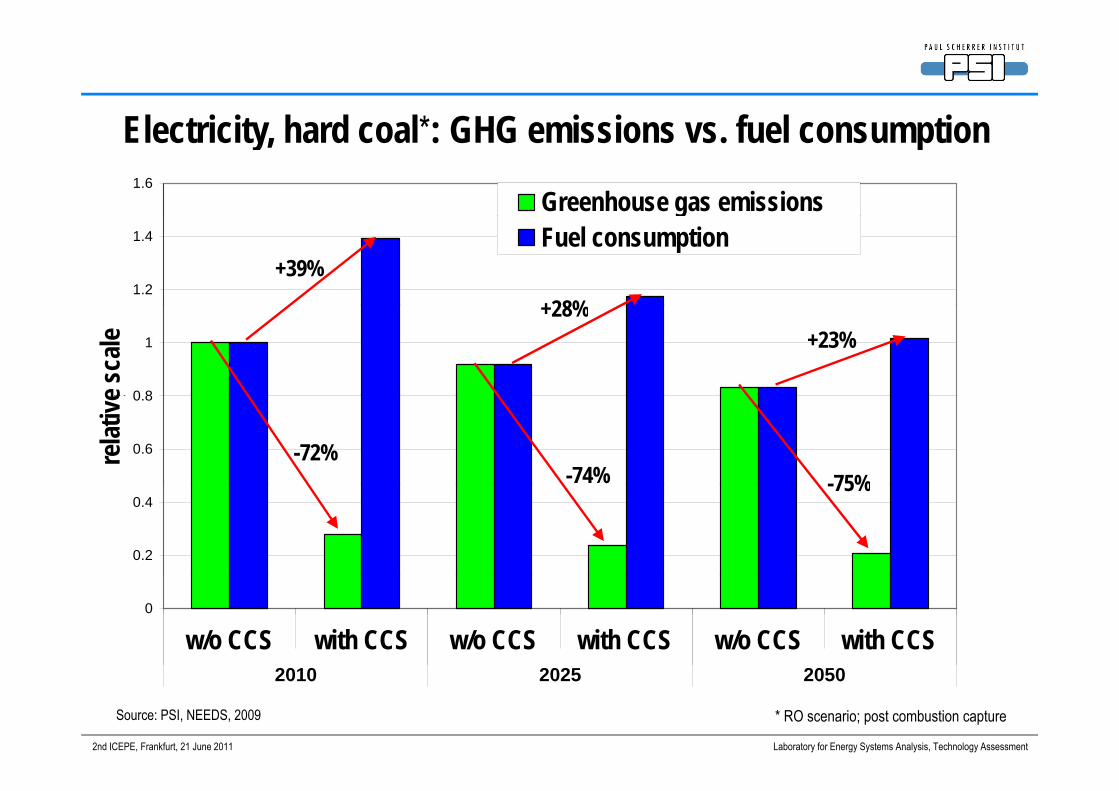
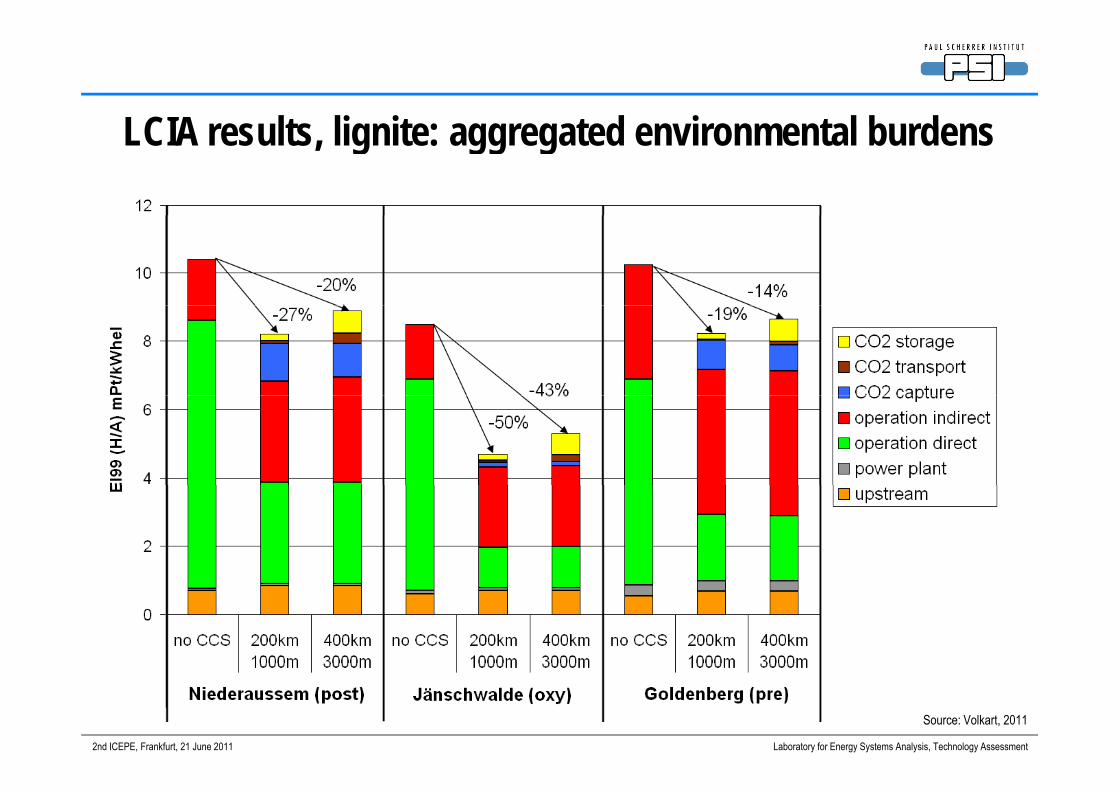
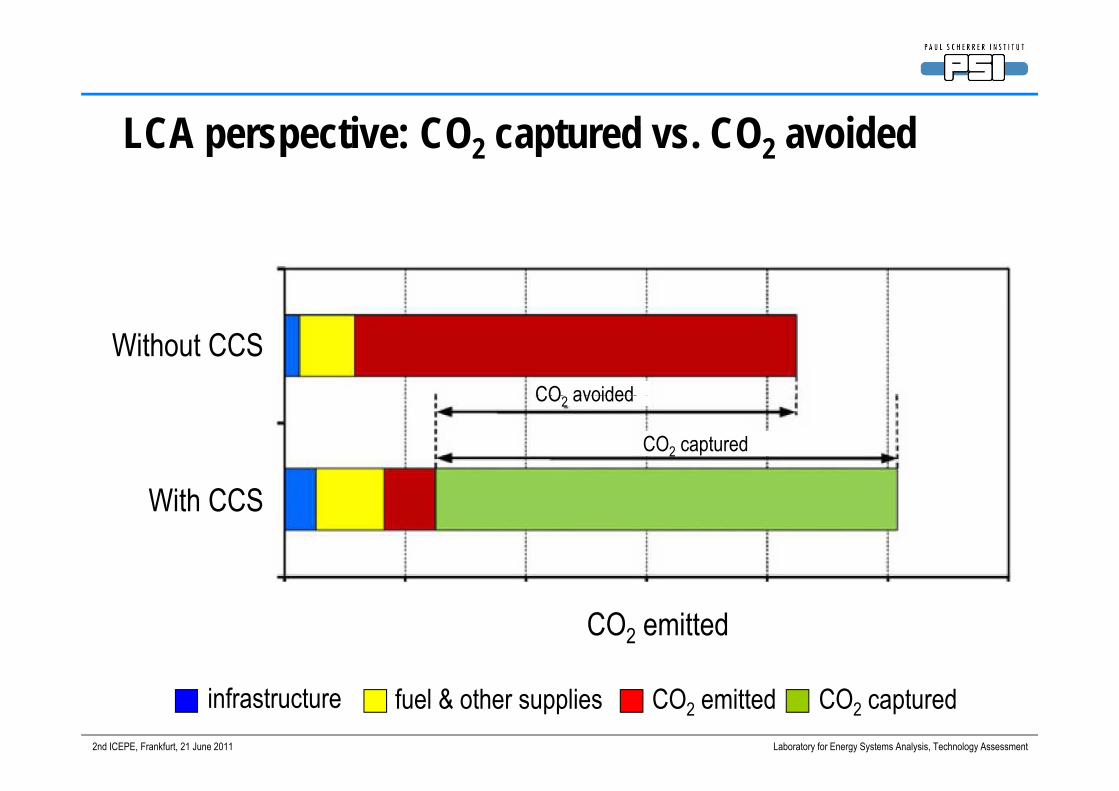
• CCS in fossil power generation significantly reduces GHG emissions• BUT: high energy demand for CO2 capture & storage→ additional CO2 emissions from the energy chain→ additional fossil fuel demand and associated environmental burdens→ additional fossil fuel demand and associated environmental burdens
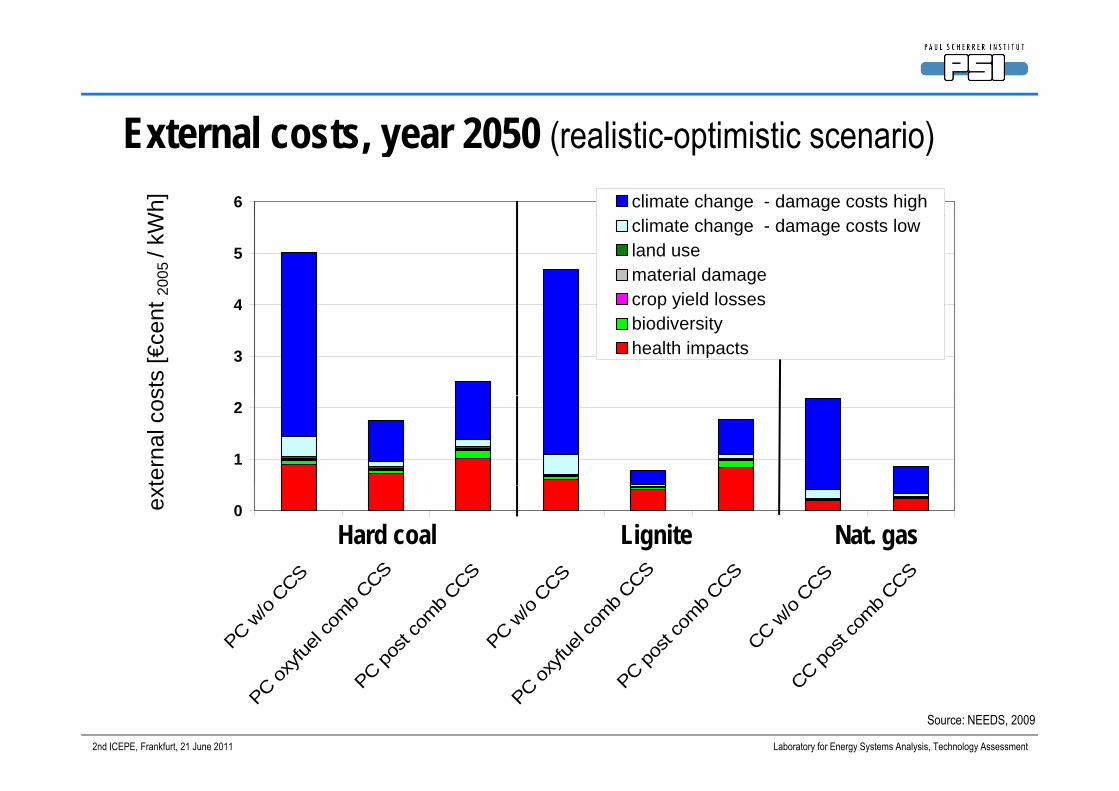
• Significant increase in costs of fossil power generation with CCSN th l CCS t b i t t t i tf li f GHG • Nevertheless: CCS must be an important part in a portfolio of GHG reduction measures; for both coal & natural gasCCS h ld b id d b id i t h l “ t d
2nd ICEPE, Frankfurt, 21 June 2011 Laboratory for Energy Systems Analysis, Technology Assessment
• CCS should be considered as „bridging technology“ towards a sustainable energy supply worldwide