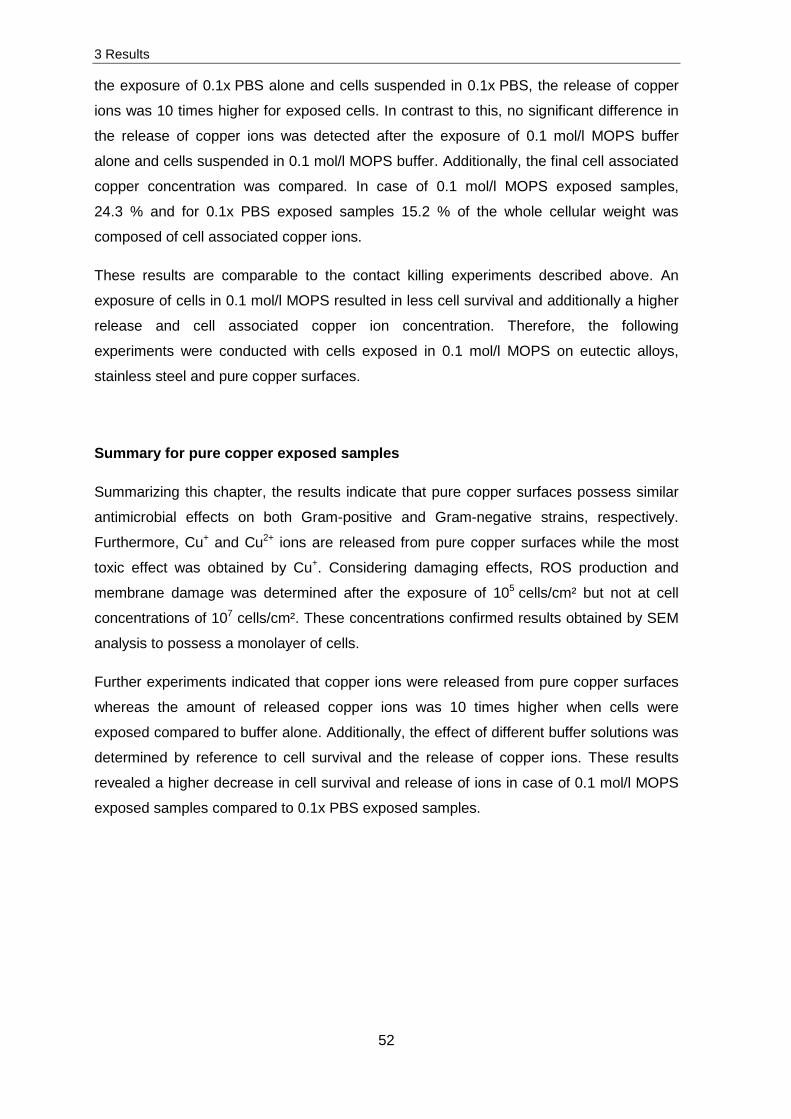
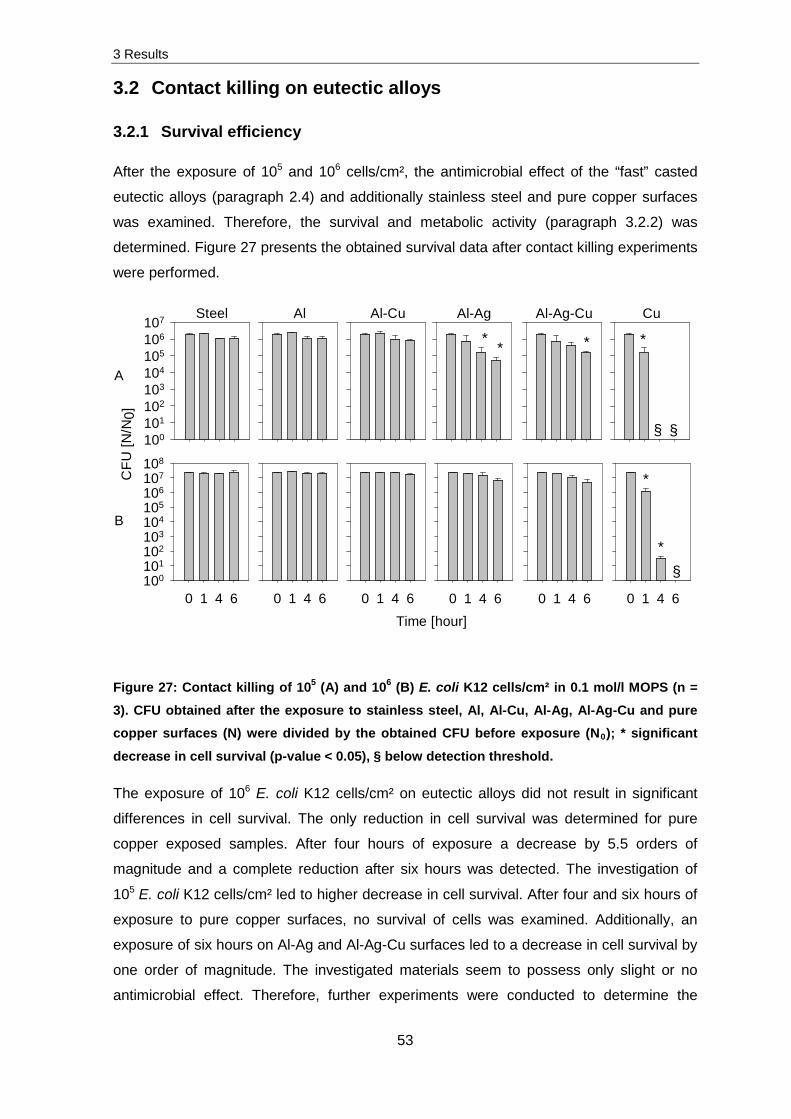
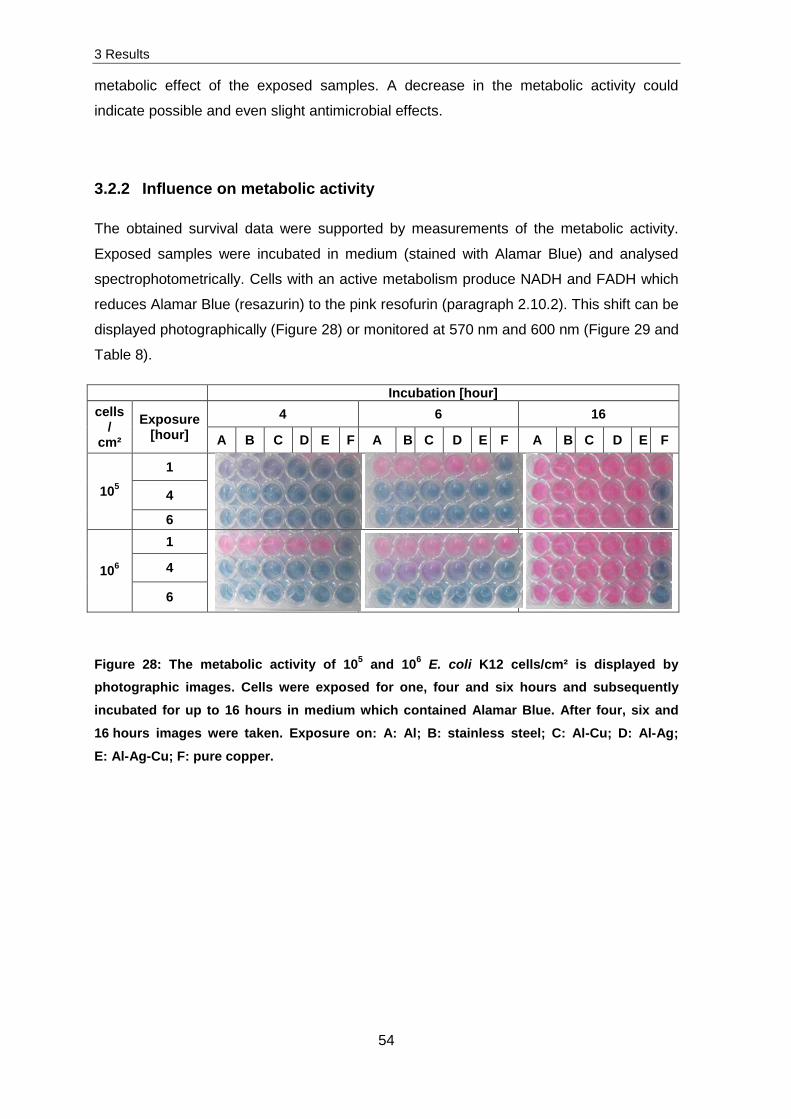
Contact killing of Escherichia coli K12 and Staphylococcus cohnii on copper containing and alloyed materials DISSERTATION ZUR ERLANGUNG DES DOKTORGRADES DER NATURWISSENSCHAFTEN (DR. RER. NAT.) DER NATURWISSENSCHAFTLICHEN FAKULTÄT III - BIOLOGIE UND VORKLINISCHE MEDIZIN - DER UNIVERSITÄT REGENSBURG vorgelegt von Claudia Hahn aus Köln im Juni 2016
Transcript
Contact killing of Escherichia coli K12 and Staphylococcus cohnii on copper containing and alloyed materials
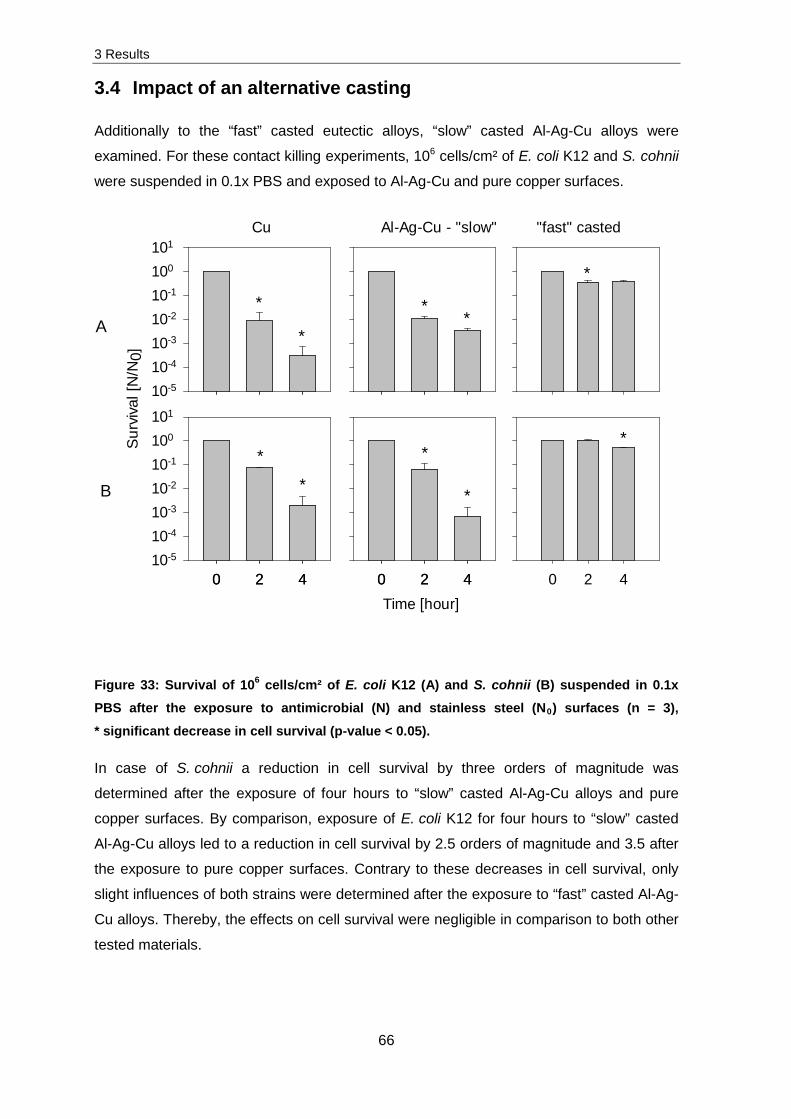
DISSERTATION ZUR ERLANGUNG DES DOKTORGRADES DER NATURWISSENSCHAFTEN (DR. RER. NAT.)
DER NATURWISSENSCHAFTLICHEN FAKULTÄT III - BIOLOGIE UND VORKLINISCHE MEDIZIN -
DER UNIVERSITÄT REGENSBURG
vorgelegt von Claudia Hahn
aus Köln im Juni 2016
Promotionsgesuch eingereicht am: 29.06.2016 Die Arbeit wurde angeleitet von: Prof. Dr. Reinhard Wirth (Universität Regensburg) in Zusammenarbeit mit Dr. Petra Rettberg (Deutsches Zentrum für Luft- und Raumfahrt e.V.) Prüfungsausschuss: Vorsitzender: Prof. Dr. Christoph Oberprieler 1. Gutachter: Prof. Dr. Reinhard Wirth 2. Gutachter: PD Dr. Christine Elisabeth Hellweg 3. Prüfer: Prof. Dr. Reinhard Rachel
Everyone is trying to accomplish something big, not realizing that life is made up of little things.
Frank Clark (1860 - 1936)
Table of contents
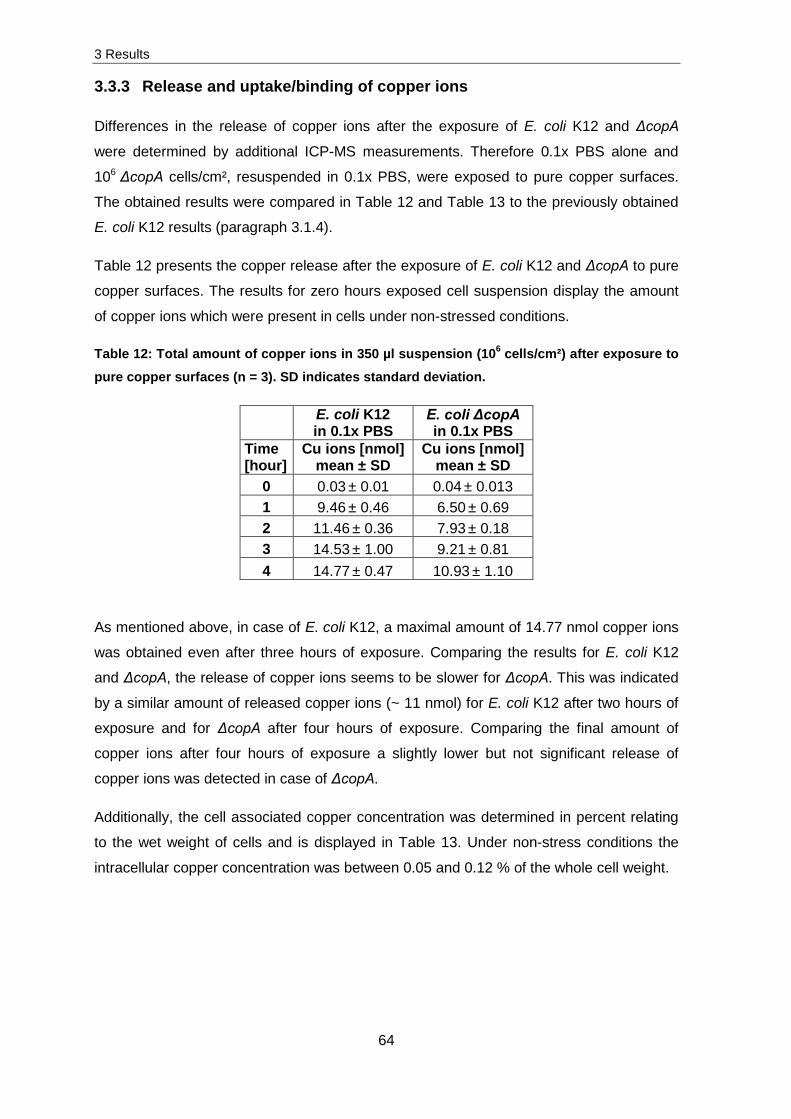
I
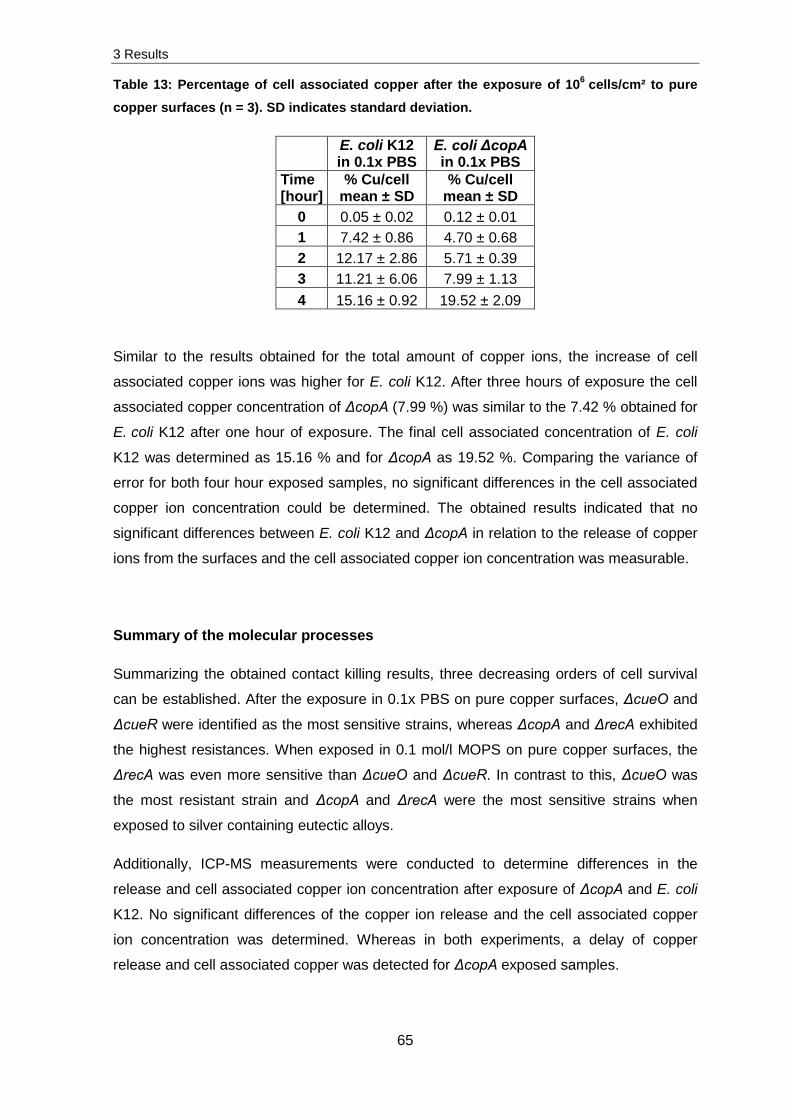
Table of contents
Table of contents ..................................................................................................... I
Abbreviations ......................................................................................................... III
Abstract .................................................................................................................. V
Zusammenfassung .............................................................................................. VII
Chemical elements and compounds were named after the International Union of Pure and
Applied Chemistry (IUPAC).
AC alternating current
Al aluminium
Al-Ag aluminium-silver
Al-Ag-Cu aluminium-silver-copper
Al-Cu aluminium-copper
ATP adenosine triphosphate
BCC body centered cubic
Bp base pairs
CFU colony forming unit
Cu pure copper
CUB cubic
DC direct current
ddH2O double distilled water
DLR German Aerospace Center
DNA deoxyribonucleic acid
ds double-stranded
DSB double-strand breaks
DSMZ German collection of microorganisms and cell cultures GmbH
Ecal calculated eutectic point
EDTA ethylenediaminetetraacetic acid
Eexp experimental eutectic composition
EHT extra high tension
EPA United States Environmental Protection Agency
FCC face centered cubic
HCP hexagonal close packed
HS heat-shock
Abbreviations
IV
KDPG 2-keto-3-deoxy-6-phosphogluconate
LB Luria Bertani
MOPS 3-(N-morpholino)propanesulfonic acid
NB nutrient broth
NCBI National Center for Biotechnology Information
ND not determined
Nt nucleotides
PBS phosphate-buffered saline
pH potency of hydrogen
ppt parts per trillion
RNA ribonucleic acid
RND resistance-nodulation-cell division
rpm rounds per minute
SD standard deviation
SEM scanning electron microscopy
SIM stress-induced mutagenesis
sp species (singular)
spp species (plural)
ss single-stranded
St stainless steel
TAE tris-acetate-EDTA
TCA tricarboxylic acid cycle
TE tris-EDTA
TGY tryptone glucose yeast extract agar
Tris trishydroxymethylaminomethane
TSB tryptic soy broth
TSY trypticase soy yeast
w/w weight/weight
Abstract
V
Abstract
Maintaining human health during long-term space missions is of major concern at any
time. It is well known that space missions influence the immune system of the explorers
and that they become more susceptible to bacterial infections. At the same time, bacteria
exposed to the space environment have been shown to get more aggressive and more
resistant to antibiotics. This particular combination can lead to severe infections and may
jeopardise the mission; therefore a strong and uncompromising strategy inhibiting the
propagation of bacteria is urgently needed. To achieve this, antimicrobial surfaces may
just offer the answer. They provide a promising alternative to conventional cleaning
procedures with e.g. disinfectants and contain organic/inorganic substituents or
antimicrobial metals such as copper or silver. Copper is an essential metal but toxic at
higher concentrations. On the contrary, silver is not essential and therefore toxic even at
low concentrations. Due to their antimicrobial properties, both metals were used for
medical issues and the storage of drinking water since thousands of years. While the
toxicity is well known, the exact mechanisms of the toxicity are still unclear. In this study
the antimicrobial effect of pure copper and new, potentially antimicrobial eutectic alloys
composed of aluminium, silver and/or copper was investigated under wet contact killing
conditions.
First, the survival of Gram-positive and Gram-negative cells after contact with
antimicrobial materials was examined. Additionally, intracellular reactive oxygen species
(ROS) production and damages of the membrane, DNA and RNA were determined for
copper exposed samples. ROS production and membrane damages increased rapidly
within one hour while the effect on cell survival was negligible even after two hours of
exposure. Only longer exposure of up to four hours led to a rapid decrease in cell survival
depending on the concentration of exposed cells/cm².
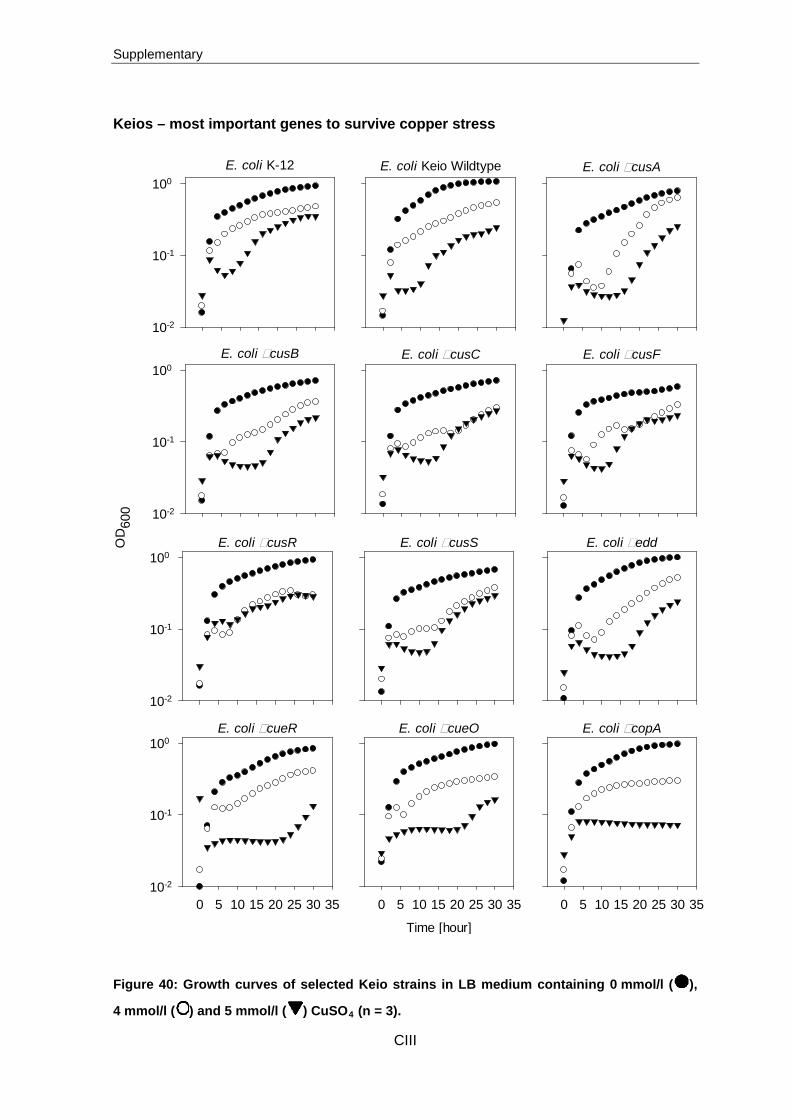
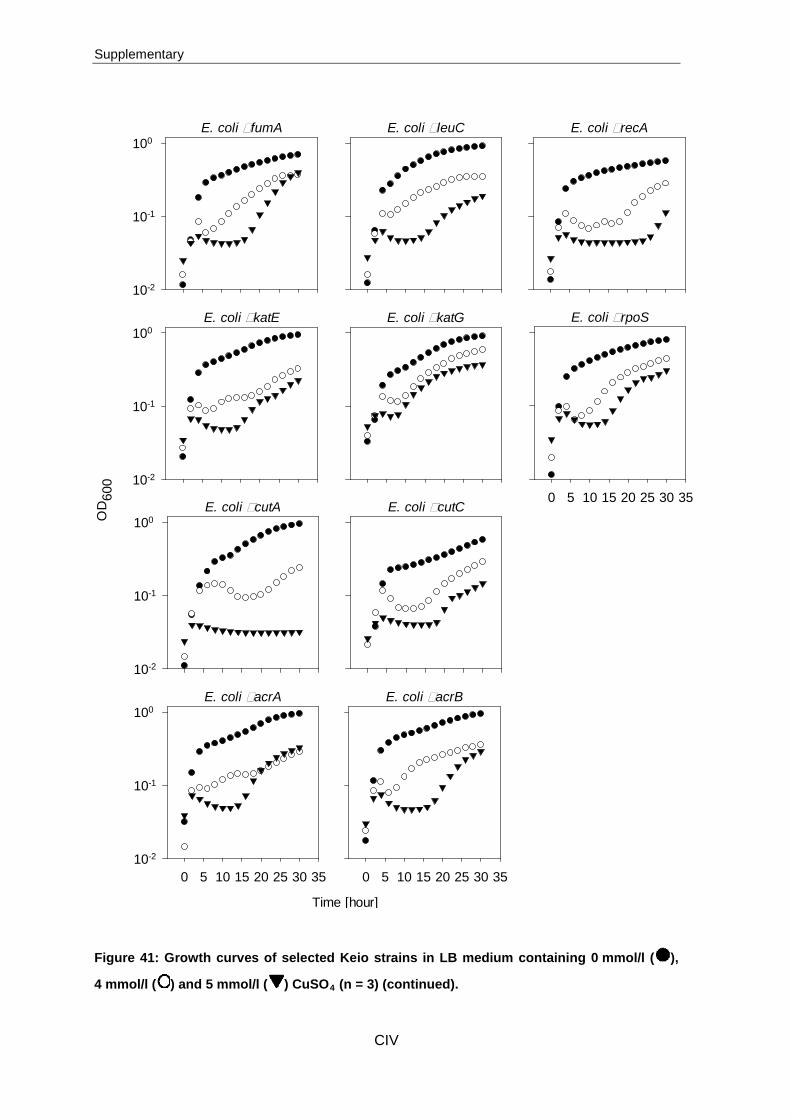
Further investigations were conducted with selected strains of the Keio collection. This
collection is composed of E. coli strains which exhibit knockouts in one gene whereby
each deleted gene was exchanged by a kanamycin cassette. To determine metabolic
influences of pure copper and eutectic alloy exposed samples, 21 strains which had either
a direct link to copper and/or silver transport mechanisms or a general function in the
microorganism were selected. After pre-testing, different survivability’s of E. coli ΔcopA,
ΔrecA, ΔcutA, ΔcueR and ΔcueO were obtained. The survival was decreased in absence
of CueO compared to ΔcopA strains when exposed to pure copper surfaces. In contrast to
this, the survivability was vice versa when exposed to silver containing alloys whereas
CueO had no function in silver oxidization.
Abstract
VI
Finally, the release of metal ions and the cell associated metal concentration was
determined by taking the example of Staphylococcus cohnii, Escherichia coli K12 and
ΔcopA to identify possible connections between cell associated ions and the survival of
cells. These measurements indicated that the higher release of ions after exposure of
cells in buffer is caused by an indirect dissolution. Despite a relatively high cell associated
ion concentration, the experiments in the current study (with ex vivo and in vivo DNA/RNA
and the above mentioned Keio strains) pointed out that these ions were possibly primarily
present in the periplasm. Additionally, investigations on ternary, eutectic alloys were
conducted. They showed that special casting protocols need to be in progress to obtain
antimicrobial effects. Due to the antimicrobial effect and light weight, these materials could
be a great opportunity to be applied in hospitals or in spacecraft facilities.
Zusammenfassung
VII
Zusammenfassung
Während Langzeitmissionen im All ist die Aufrechterhaltung der menschlichen Gesundheit
von großer Bedeutung. Es ist bekannt, dass Weltraummissionen das Immunsystem von
Astronauten beeinflussen und diese anfälliger für bakterielle Infektionen werden.
Gleichzeitig verändern sich Bakterien, die den Umweltbedingungen des Weltalls
ausgesetzt werden; sie werden aggressiver und resistenter gegen Antibiotika. Diese
Kombination kann zu schwerwiegenden Infektionen führen und die Mission gefährden.
Aus diesem Grund werden Strategien zur Inhibierung und Verbreitung von Bakterien
benötigt, wobei der Einsatz von antimikrobiellen Oberflächen eine gute Alternative zu
konventionellen Reinigungsverfahren mit Desinfektionsmitteln bietet. Sie können
entweder aus organischen/anorganischen Substituenten oder antimikrobiellen Metallen
wie Kupfer oder Silber bestehen. Kupfer ist ein essentielles Metall, das allerdings bei
höheren Konzentrationen toxisch wirken kann. Im Gegensatz dazu ist Silber nicht
essentiell und wirkt schon bei geringen Konzentrationen toxisch. Beide Metalle besitzen
antimikrobielle Eigenschaften und wurden schon vor tausenden von Jahren in der Medizin
und zur Lagerung von Trinkwasser eingesetzt. Während die Toxizität der Metalle bekannt
ist, sind die genauen Wirkmechanismen noch unklar. In dieser Studie wurde daher neben
der antimikrobiellen Wirkung von reinem Kupfer die potentielle antimikrobielle Wirkung
von neuen Verbundmaterialien, die aus Aluminium, Kupfer und/oder Silber bestehen, in
feuchten Kontakt-Tötungsversuchen untersucht.
Zunächst wurde das Überleben von Gram-positiven und Gram-negativen Stämmen auf
antimikrobiellen Materialien ermittelt. Im Anschluss daran wurden die intrazelluläre
reaktive Sauerstoffspezies (ROS) Produktion und Schäden an der Membran sowie der
DNA und RNA nach der Exposition von Escherichia coli K12 auf Kupferoberflächen
bestimmt. Bereits nach einer Stunde konnte eine erhöhte ROS Produktion sowie Schäden
an der Membran festgestellt werden. Im Gegensatz dazu konnten, auch nach
zweistündiger Exposition, keine Auswirkungen auf das Überleben der Zellen gemessen
werden. Erst eine längere Exposition von vier Stunden führte zu einer raschen Abnahme
des Überlebens in Abhängigkeit von der eingesetzten Zellkonzentration/cm².
Weitere Untersuchungen wurden mit ausgewählten Stämmen der Keio Kollektion
durchgeführt. Diese Kollektion umfasst E. coli Stämme, die einen Knockout in einzelnen
Genen aufweisen, wobei jedes Gen durch eine Kanamycin Kassette ausgetauscht wurde.
Für diese Studie wurden 21 Stämme ausgewählt, die entweder einen direkten Einfluss auf
den Kupfer- und/oder Silbertransport haben oder eine generelle Funktion im
Mikroorganismus, um die Rolle dieser Gene beim Überleben von E. coli auf reinen
Zusammenfassung
VIII
Kupferoberflächen und eutektischen Gemischen zu untersuchen. Detaillierte Experimente
mit den Stämmen E. coli ΔcopA, ΔrecA, ΔcutA, ΔcueR und ΔcueO zeigten
unterschiedliche Überlebensfähigkeiten. Nach der Exposition auf reinem Kupfer war das
Überleben in Abwesenheit von CueO reduziert, wobei Stämme ohne CopA sehr resistent
waren. Nach der Exposition auf silberhaltigen Legierungen überlebte der ΔcueO Stamm
am besten, da er Silber nicht oxidieren kann.
Im Anschluss daran wurde die Freisetzung und zellassoziierte Kupferionen-Konzentration
am Beispiel von Staphylococcus cohnii, E. coli K12 und ΔcopA bestimmt, um mögliche
Verbindungen zwischen zellassoziierten Ionen und dem Überleben der Zellen zu
ermitteln. Die Ergebnisse zeigten, dass die Freisetzung bei einer Exposition von Zellen
sehr viel größer im Vergleich zu reinem Puffer war, was auf eine indirekte Freisetzung von
Ionen hinwies. Neben der relativ hohen Konzentration an zellassoziierten Ionen, konnte
durch Versuche mit ex vivo und in vivo DNA/RNA und den ausgewählten Stämmen der
Keio Sammlung gezeigt werden, dass die Ionen möglicherweise eher im Periplasma, statt
im Zytoplasma, vorliegen. Zusätzlich wiesen die Untersuchungen auf ternären,
eutektischen Gemischen darauf hin, dass spezielle Gießverfahren eingehalten werden
müssen, um einen antimikrobiellen Effekt hervorzurufen. Diese Materialien könnten, auf
Grund des antimikrobiellen Effektes und ihres Gewichtes in Krankenhäusern oder der
Raumfahrttechnik Anwendung finden.
1 Introduction
1
1. Introduction
Since ancient times humans are fascinated by space. Astronomic research improved daily
life e.g. by calculating the time of the Nile flooding; or in general the time for a day and
night cycle or the duration of one year [1, 2]. From thereon, mankind and their technology
developed but the natural curiosity to investigate new areas of life or discover new things
is still there. One interesting and relatively new research field is named astrobiology. It
addresses questions of the history of life on Earth back to its roots and the deciphering of
planetary environments in our solar system including their satellites. These questions
could give hints for the understanding of the origin, evolution, and distribution of life and its
interaction with the environment, here on Earth and in the universe [3]. To pursue the
aspects of astrobiology different spaceflight programs at NASA, ESA and Roscosmos
were initiated [4]. Today, we are able to visit space and conduct long-term experiments in
low Earth orbit on-board the International Space Station (ISS) to address these questions.
Since 2000 an alternating crew ranging from three to ten members is working there. Due
to the great distance to Earth and the external space (vacuum) conditions, working is
subjected to certain restrictions. The ISS is a closed habitat and has limitations related to
fresh air, water and food supply. These limitations and the fact that each crew member
(~70 kg) consists of around 1013 human cells and 1014 microorganisms led to the
development of a unique microbial diversity in the man-made environment of the ISS [5].
This diversity is mainly originated from the crew but did also include airborne germs [6].
To minimize a spread and contamination of microorganisms in air and on surfaces and to
maintain astronauts’ health, guidelines like the ISS Medical Operations Requirements
Document (ISS MORD 2009) were drafted. They allow a maximal bacterial concentration
in air of 1000 CFU/m³ and on internal surfaces of 10000 CFU/m³ [7]. These limits were
observed by applying e.g. disinfectant wipes and air filtration systems [6, 8, 9].
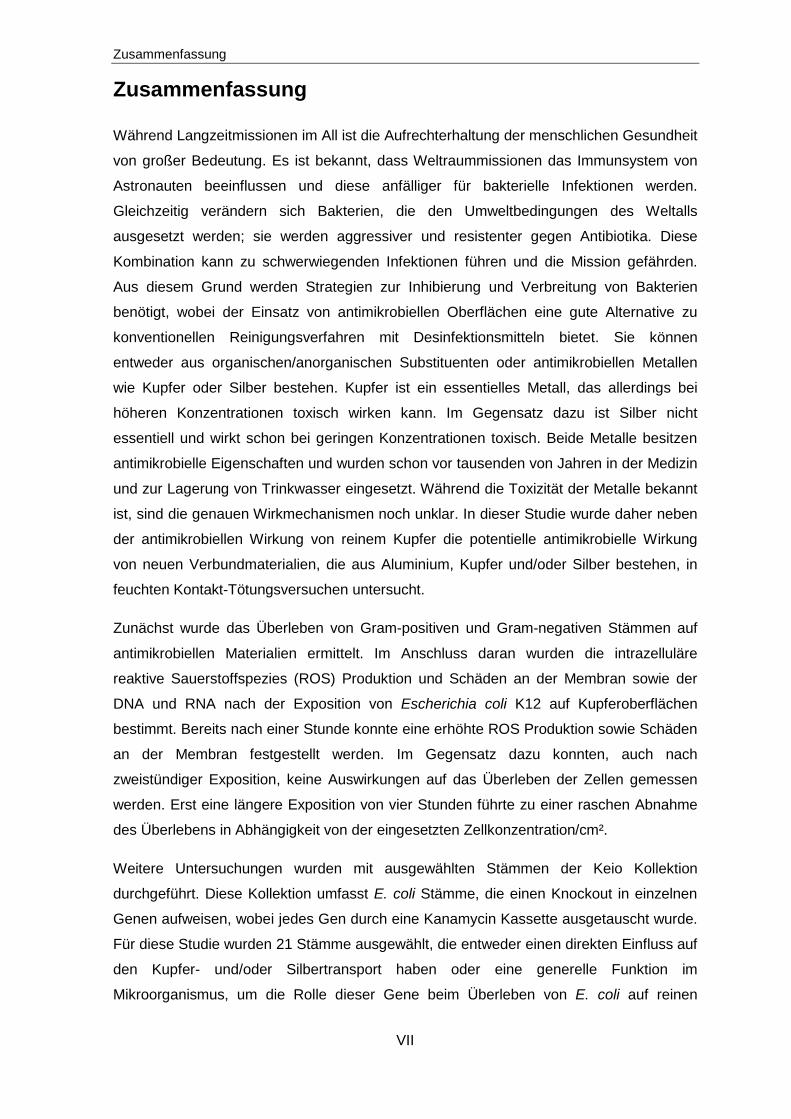
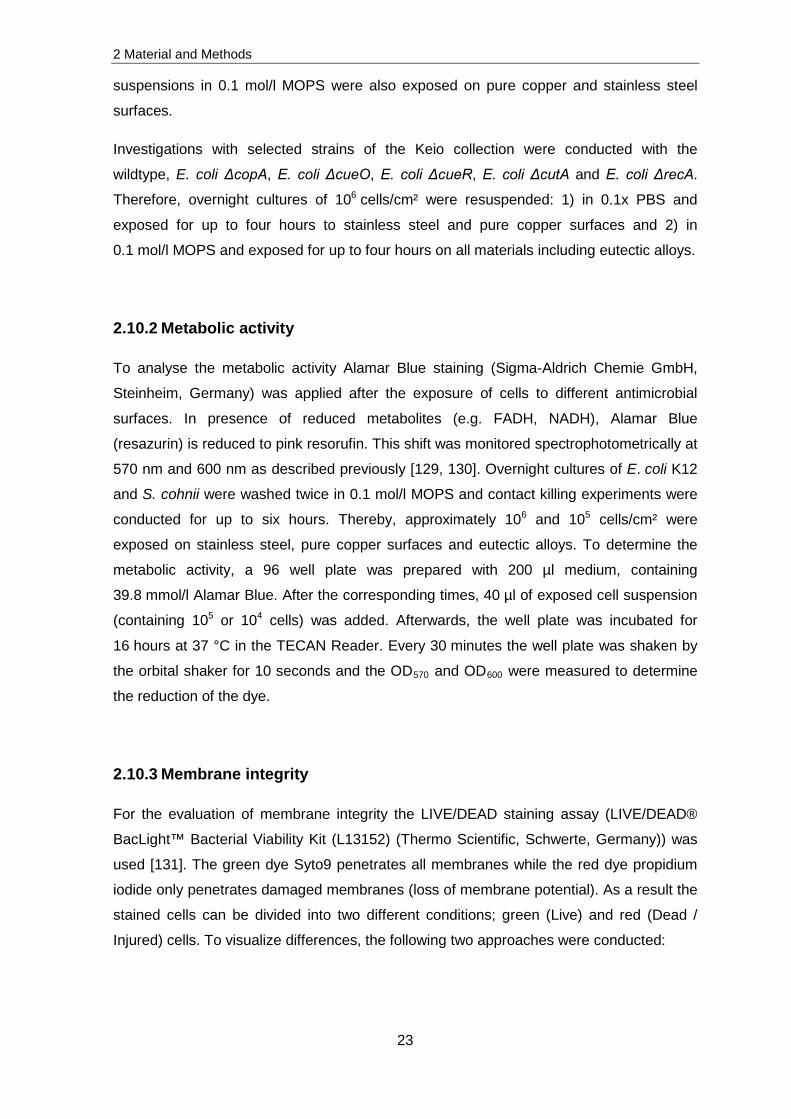
The characteristics of human associated microorganisms differ depending on their
occurrence. Escherichia coli for example is a Gram-negative, facultative anaerobic and
rod-shaped microorganism (Figure 1). Most of them are harmless and live in the gut of
endotherms (humans) where they support the digestion of food by producing e.g. vitamin
K which cannot be synthesised by humans [10-12]. Staphylococcus cohnii is a Gram-
positive, facultative anaerobic coccus (Figure 1) which forms grape-like clusters and lives
on human skin in its protective acid mantle [13]. Both microorganisms prevent colonization
of harmful fungi and pathogenic bacteria [14-16].
1 Introduction
2
Figure 1: Representative Scanning Electron Microscopic (SEM) image of E. coli K12 (left
panel) and S. cohnii (right panel).
Living in such a relationship can alter when microorganisms occupy other regions of the
human body. E. coli and the common skin and mucous membrane associated
microorganism, Staphylococcus aureus for example live in a commensal relationship with
humans but once spread to wounds, they can cause nosocomial bloodstream infections
[17, 18]. This problem is intensified when immune compromised persons are exposed to
infections and diseases. Many patients are treated with antibiotics which decrease their
natural bacterial flora. New and potentially harmful bacteria transferred to these patients
do not have to compete with existing bacteria and can therefore increase their number on
the new habitat.
The propagation of potentially pathogenic microorganisms occurs due to several ways.
One way is evoked by contaminated transplants. As mentioned before, this leads to
nosocomial bloodstream infections caused by e.g. staphylococci or enterococci [18].
Another way of propagation emerges through droplet infection or a skin to skin contact
between the patient and other people. Thereby, people transferring harmful bacteria are
not necessarily the host of these bacteria. They probably touched a light switch or door
handle which was previously contaminated. Even if healthy people are not influenced by
these microorganisms, a transfer of bacteria to an immune compromised person can lead
to severe healthcare-associated infections. In Europe approximately 4,100,000 patients
acquire such an infection every year, whereas 147,000 of them die [19]. To counteract
these infections, patients are treated with antibiotics.
Antibiotics are produced by bacteria or fungi to develop benefits towards other
microorganisms. They were discovered in 1928 by Alexander Fleming and from thereon
used to fight bacteria [20]. However, the long exposure of antibiotics led to an unforeseen
problem which is presented in Figure 2. Until 2010 many bacteria e.g. E. coli and
1 Introduction
3
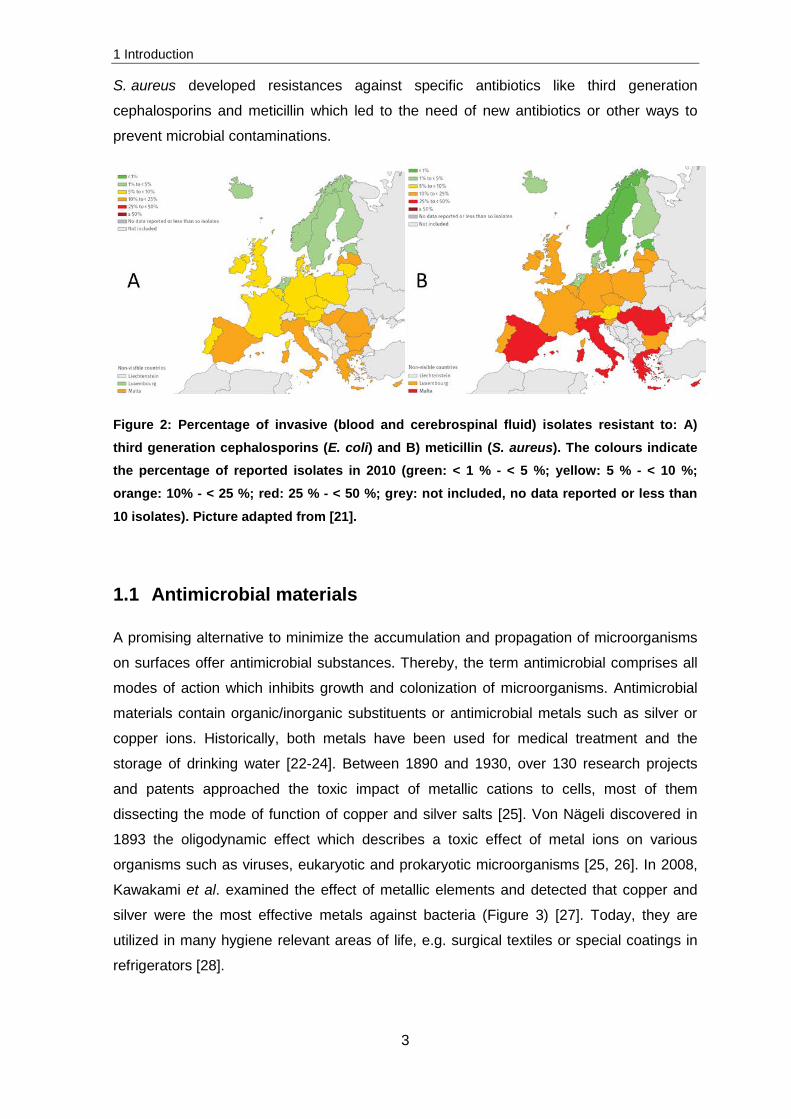
S. aureus developed resistances against specific antibiotics like third generation
cephalosporins and meticillin which led to the need of new antibiotics or other ways to
prevent microbial contaminations.
Figure 2: Percentage of invasive (blood and cerebrospinal fluid) isolates resistant to: A) third generation cephalosporins (E. coli) and B) meticillin (S. aureus). The colours indicate the percentage of reported isolates in 2010 (green: < 1 % - < 5 %; yellow: 5 % - < 10 %; orange: 10% - < 25 %; red: 25 % - < 50 %; grey: not included, no data reported or less than
10 isolates). Picture adapted from [21].
1.1 Antimicrobial materials
A promising alternative to minimize the accumulation and propagation of microorganisms
on surfaces offer antimicrobial substances. Thereby, the term antimicrobial comprises all
modes of action which inhibits growth and colonization of microorganisms. Antimicrobial
materials contain organic/inorganic substituents or antimicrobial metals such as silver or
copper ions. Historically, both metals have been used for medical treatment and the
storage of drinking water [22-24]. Between 1890 and 1930, over 130 research projects
and patents approached the toxic impact of metallic cations to cells, most of them
dissecting the mode of function of copper and silver salts [25]. Von Nägeli discovered in
1893 the oligodynamic effect which describes a toxic effect of metal ions on various
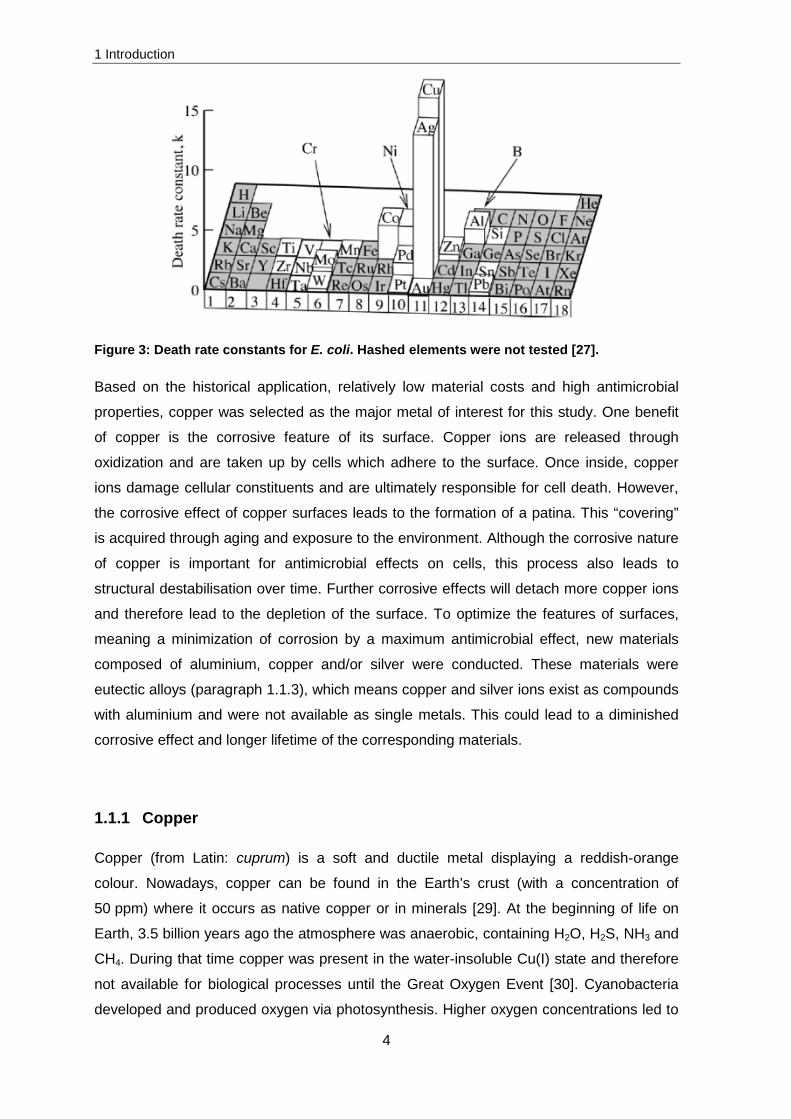
organisms such as viruses, eukaryotic and prokaryotic microorganisms [25, 26]. In 2008,
Kawakami et al. examined the effect of metallic elements and detected that copper and
silver were the most effective metals against bacteria (Figure 3) [27]. Today, they are
utilized in many hygiene relevant areas of life, e.g. surgical textiles or special coatings in
refrigerators [28].
1 Introduction
4
Figure 3: Death rate constants for E. coli. Hashed elements were not tested [27].
Based on the historical application, relatively low material costs and high antimicrobial
properties, copper was selected as the major metal of interest for this study. One benefit
of copper is the corrosive feature of its surface. Copper ions are released through
oxidization and are taken up by cells which adhere to the surface. Once inside, copper
ions damage cellular constituents and are ultimately responsible for cell death. However,
the corrosive effect of copper surfaces leads to the formation of a patina. This “covering”
is acquired through aging and exposure to the environment. Although the corrosive nature
of copper is important for antimicrobial effects on cells, this process also leads to
structural destabilisation over time. Further corrosive effects will detach more copper ions
and therefore lead to the depletion of the surface. To optimize the features of surfaces,
meaning a minimization of corrosion by a maximum antimicrobial effect, new materials
composed of aluminium, copper and/or silver were conducted. These materials were
eutectic alloys (paragraph 1.1.3), which means copper and silver ions exist as compounds
with aluminium and were not available as single metals. This could lead to a diminished
corrosive effect and longer lifetime of the corresponding materials.
1.1.1 Copper
Copper (from Latin: cuprum) is a soft and ductile metal displaying a reddish-orange
colour. Nowadays, copper can be found in the Earth’s crust (with a concentration of
50 ppm) where it occurs as native copper or in minerals [29]. At the beginning of life on
Earth, 3.5 billion years ago the atmosphere was anaerobic, containing H2O, H2S, NH3 and
CH4. During that time copper was present in the water-insoluble Cu(I) state and therefore
not available for biological processes until the Great Oxygen Event [30]. Cyanobacteria
developed and produced oxygen via photosynthesis. Higher oxygen concentrations led to
1 Introduction
5
an increased oxidization of copper to soluble Cu(II) [31]. Following this event, new copper-
binding proteins, using copper as a cofactor, evolved. They are involved in processes of
e.g. respiration and oxidative stress protection [32-34]. Today, copper is a trace element
which is, in low concentrations, essential for many cellular processes.
Due to the reversible transition of Cu(I) and Cu(II) and the formation of radicals in a
Fenton-like reaction, concentrations of copper ions need to be guarded by cells. The
adjustment of the optimum intracellular copper concentration is called homeostasis and is
achieved through specific or unspecific transporters. The unspecific transport is fast and
driven by the chemiosmotic gradient across the cytoplasmic membrane while the specific
transport of copper is very expensive for cells in terms of energy costs (ATP) and time.
Therefore, specific transporters are only synthesized when they are needed whereas
unspecific transporters are always available in the cell membrane. Based on this, a
transport of heavy-metals into cells is always present [35, 36].
Elevated copper concentrations are cytotoxic and should be held at extremely low levels
[37]. Increasing copper availability induces the necessary adaptation of cells in developing
resistance and regulation of intracellular copper concentration via copper homeostasis
[30, 37-39]. Mechanisms to balance the intracellular copper concentration are
compartmentalization, sequestration and efflux [40].
Copper alloys
The well-established killing of bacteria by copper surfaces is also called contact killing
[41]. As mentioned in paragraph 1.1, pure copper can act as an effective antimicrobial
agent; however, due to its corrosive nature and therefore loss of stability over time,
studies with copper alloys were performed. First antimicrobial efficiency tests with copper
alloys were conducted by Phyllis Kuhn in 1982. Kuhn demonstrated that doorknobs made
of brass exhibited a reduced microbial diversity in comparison to stainless steel doorknobs
[42]. Thenceforward many copper alloy surfaces were produced and tested in laboratory
studies conducted by the United States Environmental Protection Agency (EPA).
Requirements of these alloys are that the killing of Methicillin-resistant S. aureus (MRSA),
Vancomycin-resistant Enterococcus faecalis (VRE), S. aureus, Enterobacter aerogenes,
Pseudomonas aeruginosa, and E. coli O157:H7 should be higher than 99.9 % within two
hours [43]. Nowadays more than 500 antibacterial copper alloys are registered, that are
applied in various industrial branches.
1 Introduction
6
Beside the application in the field of medicine [44] antimicrobial copper alloys are used in
the field of e.g. water conditioning [45-47], food proceeding [48-50], textiles [28, 51, 52]
and maritime industry [53, 54]. In food industry, the best known application of copper
vessels is for brewery processes. Thereby copper is mainly used for its good heat
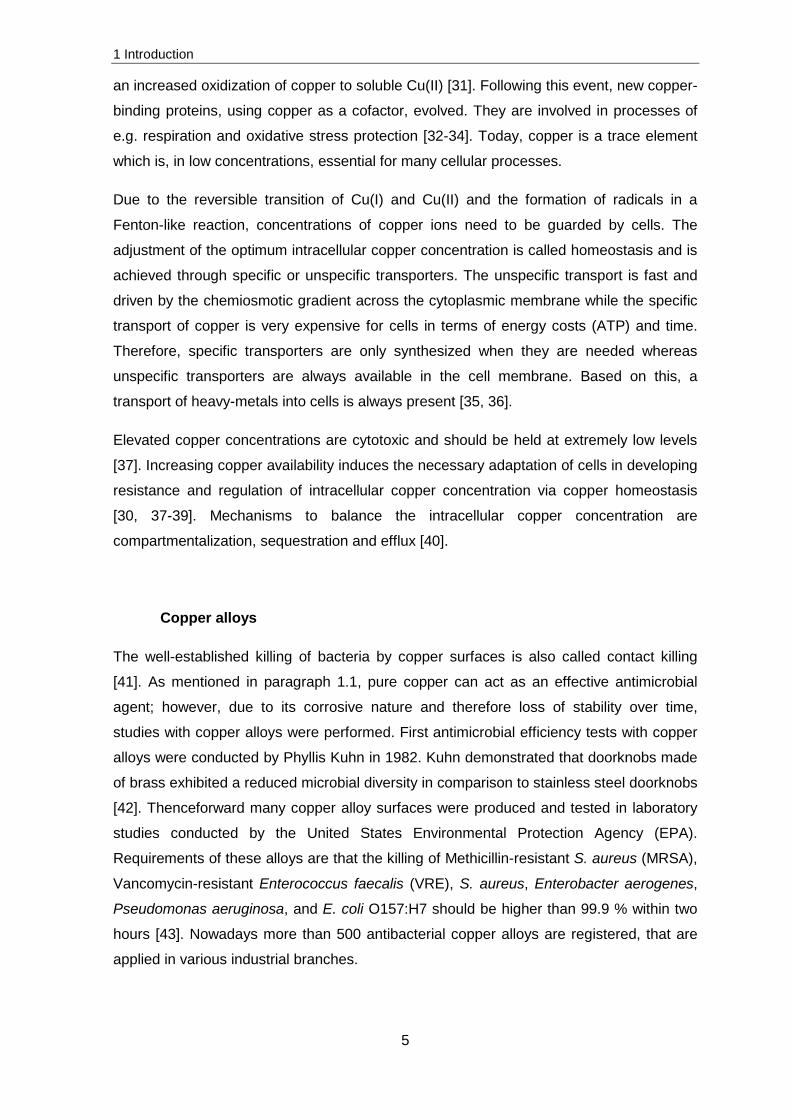
conductor properties [55]. In hospital trials all over the world commonly touched surfaces
were exchanged by copper alloys to determine whether and to what extend a reduction of
microbial contamination occurred (Figure 4). These field studies were undertaken in South
Africa (2010) [56], Germany (2010) [57], Finland (2010) [58], England (2010, 2012) [44,
59] and the USA (2012, 2013) [60-62]. Due to varying parameters, the obtained data from
each study fluctuate greatly which made a comparison of the results difficult [63].
Figure 4: In hospital trials, typical touch surfaces which consisted of plastic were
exchanged by copper surfaces [60].
Another application of copper is in nanoparticles. It was postulated that nanoparticles
penetrate cells and lead to an acceleration of the bactericidal effect in comparison to
metallic coatings [64]. Under aerobic and moist conditions copper surfaces oxidize and
lead to the formation of CuO and Cu2O whereby both exhibit antimicrobial effects [28, 51,
65-69]. Differences in the bactericidal effect of CuO and Cu2O nanoparticles were
analysed by Vargas-Reus et al. (2012) [67]. They determined that the antimicrobial effect
of Cu2O nanoparticles is more pronounced compared to CuO nanoparticles [70].
Summarizing, it is assumed that the antimicrobial effect of copper alloys is inferior
compared to pure copper surfaces. Additionally, the antimicrobial effect of Cu+ is
determined to be higher compared to Cu2+. To examine the most effective surface, related
1 Introduction
7
to corrosion and stability, under frequent environmental conditions, ensuring the maximum
effectiveness of the antimicrobial copper material, more studies need to be performed
[70].
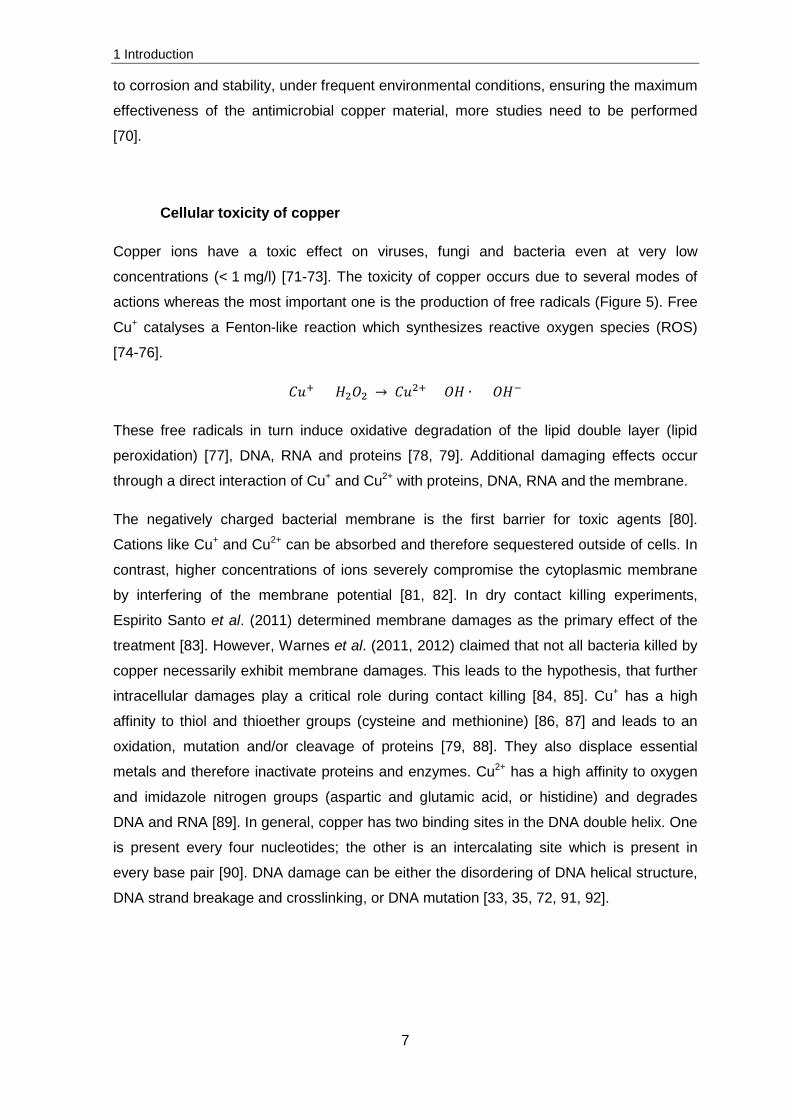
Cellular toxicity of copper
Copper ions have a toxic effect on viruses, fungi and bacteria even at very low
concentrations (< 1 mg/l) [71-73]. The toxicity of copper occurs due to several modes of
actions whereas the most important one is the production of free radicals (Figure 5). Free
Cu+ catalyses a Fenton-like reaction which synthesizes reactive oxygen species (ROS)
[74-76].
𝐶𝐶𝐶𝐶+ + 𝐻𝐻2𝑂𝑂2 → 𝐶𝐶𝐶𝐶2+ + 𝑂𝑂𝐻𝐻 ∙ + 𝑂𝑂𝐻𝐻−
These free radicals in turn induce oxidative degradation of the lipid double layer (lipid
through a direct interaction of Cu+ and Cu2+ with proteins, DNA, RNA and the membrane.
The negatively charged bacterial membrane is the first barrier for toxic agents [80].
Cations like Cu+ and Cu2+ can be absorbed and therefore sequestered outside of cells. In
contrast, higher concentrations of ions severely compromise the cytoplasmic membrane
by interfering of the membrane potential [81, 82]. In dry contact killing experiments,
Espirito Santo et al. (2011) determined membrane damages as the primary effect of the
treatment [83]. However, Warnes et al. (2011, 2012) claimed that not all bacteria killed by
copper necessarily exhibit membrane damages. This leads to the hypothesis, that further
intracellular damages play a critical role during contact killing [84, 85]. Cu+ has a high
affinity to thiol and thioether groups (cysteine and methionine) [86, 87] and leads to an
oxidation, mutation and/or cleavage of proteins [79, 88]. They also displace essential
metals and therefore inactivate proteins and enzymes. Cu2+ has a high affinity to oxygen
and imidazole nitrogen groups (aspartic and glutamic acid, or histidine) and degrades
DNA and RNA [89]. In general, copper has two binding sites in the DNA double helix. One
is present every four nucleotides; the other is an intercalating site which is present in
every base pair [90]. DNA damage can be either the disordering of DNA helical structure,
DNA strand breakage and crosslinking, or DNA mutation [33, 35, 72, 91, 92].
1 Introduction
8
Figure 5: Toxicity mechanisms of copper on microorganisms [71].
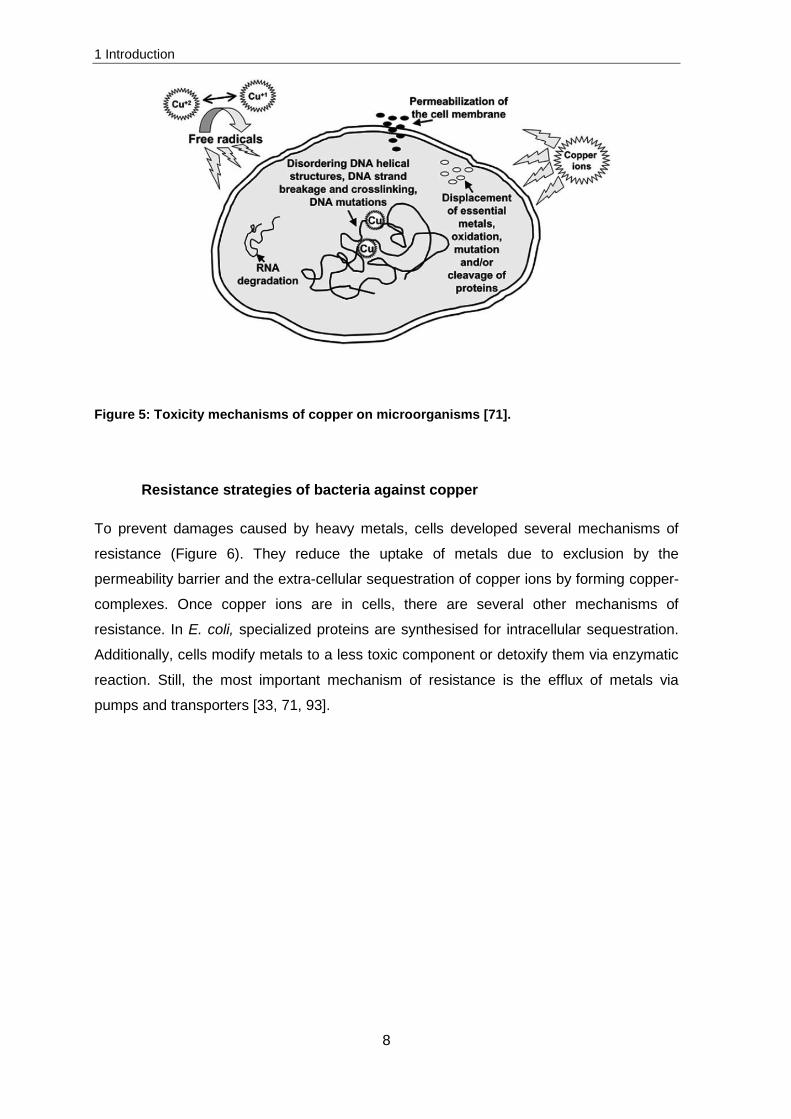
Resistance strategies of bacteria against copper
To prevent damages caused by heavy metals, cells developed several mechanisms of
resistance (Figure 6). They reduce the uptake of metals due to exclusion by the
permeability barrier and the extra-cellular sequestration of copper ions by forming copper-
complexes. Once copper ions are in cells, there are several other mechanisms of
resistance. In E. coli, specialized proteins are synthesised for intracellular sequestration.
Additionally, cells modify metals to a less toxic component or detoxify them via enzymatic
reaction. Still, the most important mechanism of resistance is the efflux of metals via
pumps and transporters [33, 71, 93].
1 Introduction
9
Figure 6: Resistance strategies of bacteria to heavy metals [71].
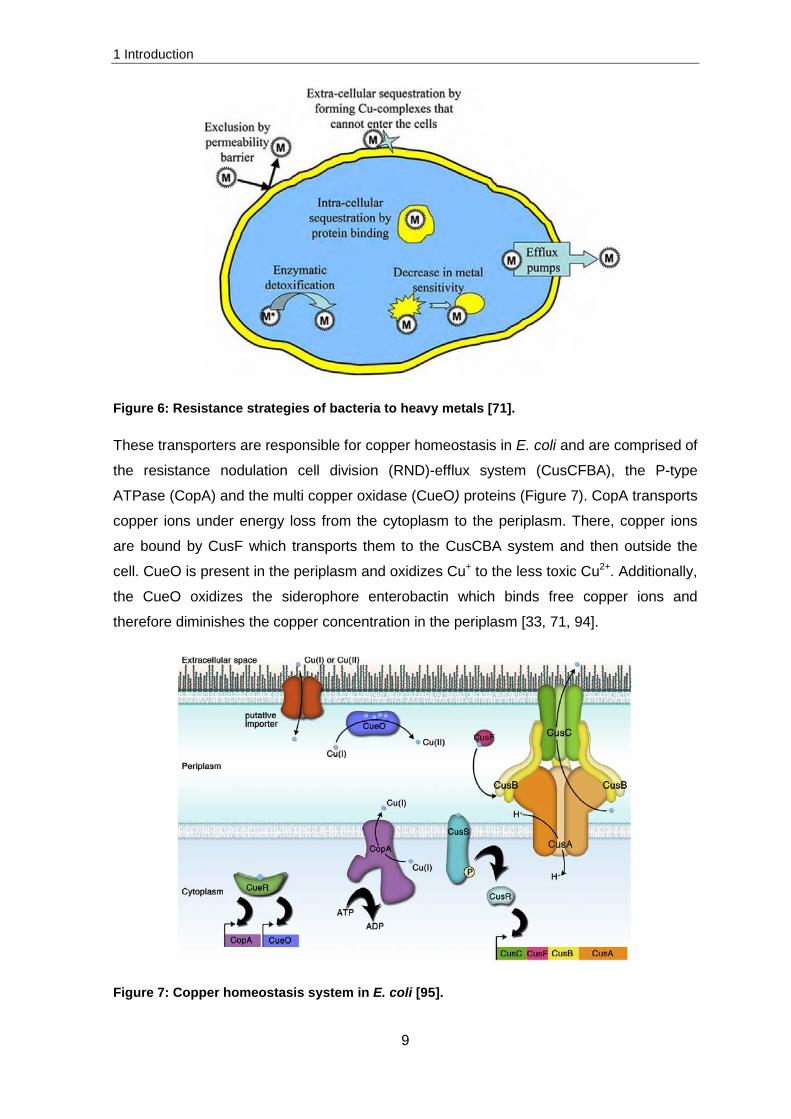
These transporters are responsible for copper homeostasis in E. coli and are comprised of
the resistance nodulation cell division (RND)-efflux system (CusCFBA), the P-type
ATPase (CopA) and the multi copper oxidase (CueO) proteins (Figure 7). CopA transports
copper ions under energy loss from the cytoplasm to the periplasm. There, copper ions
are bound by CusF which transports them to the CusCBA system and then outside the
cell. CueO is present in the periplasm and oxidizes Cu+ to the less toxic Cu2+. Additionally,
the CueO oxidizes the siderophore enterobactin which binds free copper ions and
therefore diminishes the copper concentration in the periplasm [33, 71, 94].
Figure 7: Copper homeostasis system in E. coli [95].
1 Introduction
10
1.1.2 Silver
Silver (from Latin: argentum) is a soft metal with a characteristic silver sheen. It occurs
naturally in the Earth’s crust (with a concentration of 70 ppb) in a free form or embedded
in minerals [29]. In contrast to copper, silver is not an essential metal and poisonous even
at extremely low concentrations [36]. Beside the mentioned research and applications in
paragraph 1.1, Gibbard showed in 1932 that the oxidization of silver is of high importance
to obtain antimicrobial effects [96]. Already in 1932, silver was used for water treatment
and as a preservative in the food industry. Today, it is applied for water purification (e.g.
on-board the ISS) [97] and in clinical fields e.g. in implants or catheters [98, 99] to prevent
the adhesion and proliferation of microorganisms [100-102].
Silver and copper possess similar chemical properties. Therefore it is assumed that they
also exhibit related mechanisms of action [103-105] and damaging effects to the DNA,
RNA, proteins and membrane [81, 82]. However, in contrast to copper ions which exist as
Cu+ and Cu2+, silver is only available as Ag+. Therefore silver does not perform the
Fenton-like reaction and as a consequence no ROS were produced by silver ions [105].
Both metals possess antimicrobial properties with similar mechanisms of action but the
application of an equal concentration of single ions resulted in different response of
bacteria [27, 73, 106]. This observation was the beginning of several studies which
combined both ions to determine possible synergistic effects [46, 73, 107].
1.1.3 Eutectic alloys composed of aluminium, copper and/or silver
Synergistic and single effects were evaluated here with eutectic alloys which have never
been tested before for their antimicrobial properties. The promising advantages of these
alloys are relative low material costs, lightweight and lower corrosion compared to pure
copper surfaces. Significant antimicrobial effects may lead to the evidence of an
application for future space stations like the ISS, where the weight of materials is always
of major importance and can be an exclusion criterion.
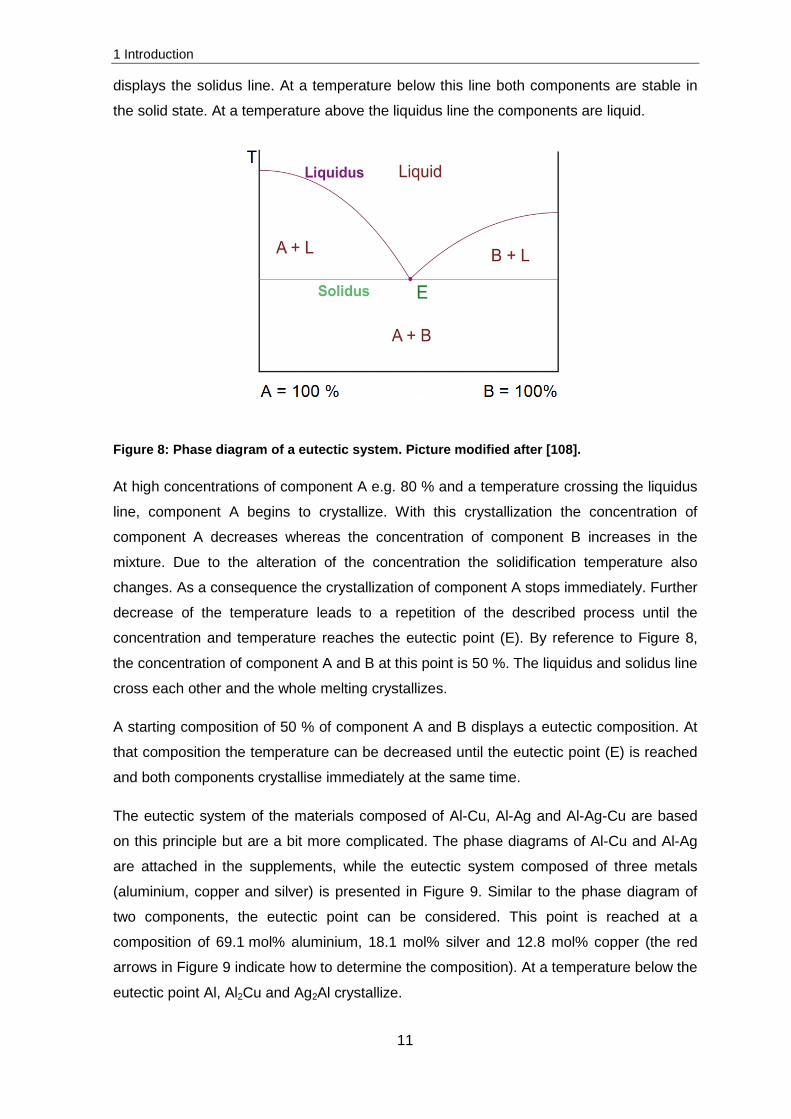
All prepared surfaces were implemented as eutectic compositions. A eutectic system
consists of minimum two components and is plotted in a phase diagram with two degrees
of freedom; the temperature (Y-axis) and concentration (X-axis) (Figure 8). On the left
side of the X-axis 100 % of component A is available. From the left to the right the
concentration of component A decreases and the concentration of component B increases
until 100 % of component B is available on the right side of the X-axis. The straight line
1 Introduction
11
displays the solidus line. At a temperature below this line both components are stable in
the solid state. At a temperature above the liquidus line the components are liquid.
Figure 8: Phase diagram of a eutectic system. Picture modified after [108].
At high concentrations of component A e.g. 80 % and a temperature crossing the liquidus
line, component A begins to crystallize. With this crystallization the concentration of
component A decreases whereas the concentration of component B increases in the
mixture. Due to the alteration of the concentration the solidification temperature also
changes. As a consequence the crystallization of component A stops immediately. Further
decrease of the temperature leads to a repetition of the described process until the
concentration and temperature reaches the eutectic point (E). By reference to Figure 8,
the concentration of component A and B at this point is 50 %. The liquidus and solidus line
cross each other and the whole melting crystallizes.
A starting composition of 50 % of component A and B displays a eutectic composition. At
that composition the temperature can be decreased until the eutectic point (E) is reached
and both components crystallise immediately at the same time.
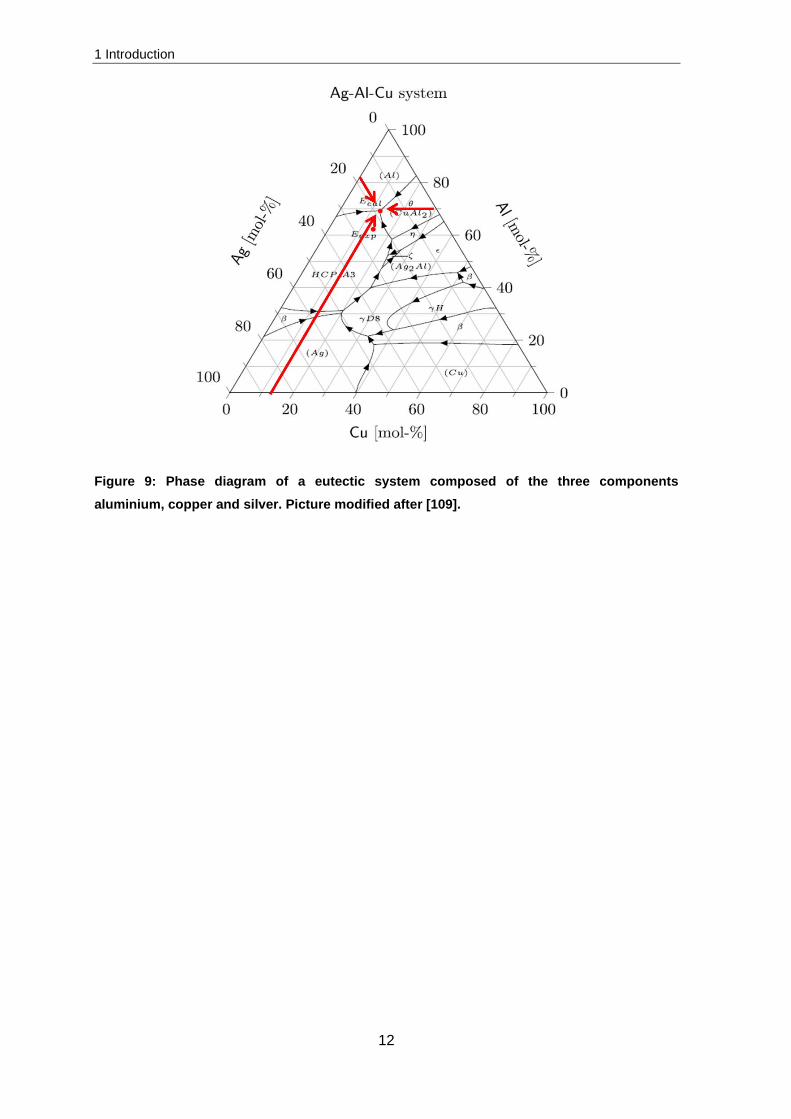
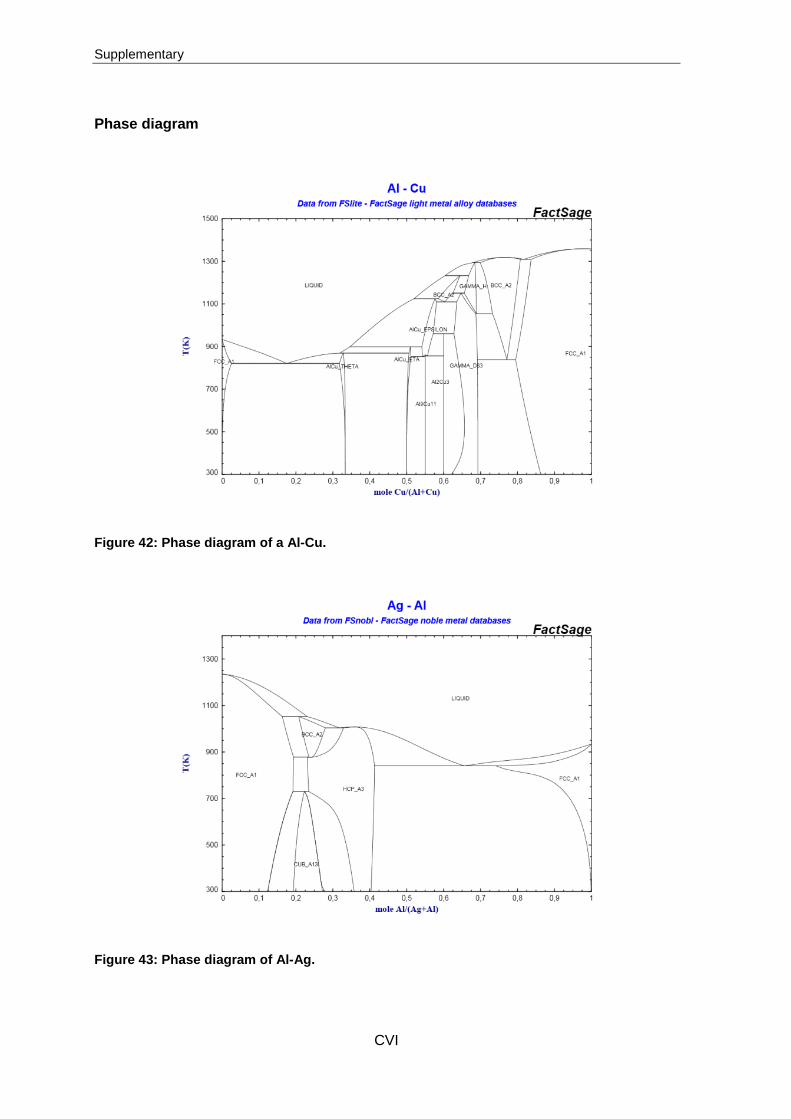
The eutectic system of the materials composed of Al-Cu, Al-Ag and Al-Ag-Cu are based
on this principle but are a bit more complicated. The phase diagrams of Al-Cu and Al-Ag
are attached in the supplements, while the eutectic system composed of three metals
(aluminium, copper and silver) is presented in Figure 9. Similar to the phase diagram of
two components, the eutectic point can be considered. This point is reached at a
composition of 69.1 mol% aluminium, 18.1 mol% silver and 12.8 mol% copper (the red
arrows in Figure 9 indicate how to determine the composition). At a temperature below the
eutectic point Al, Al2Cu and Ag2Al crystallize.
1 Introduction
12
Figure 9: Phase diagram of a eutectic system composed of the three components aluminium, copper and silver. Picture modified after [109].
1 Introduction
13
1.2 Aim of this work
Antimicrobial studies were implemented with copper and silver salts, since von Nägeli
discovered the oligodynamic effect of metal ions on organisms in 1893 [26]. Nearly 100
years later, first experiments with antimicrobial surfaces were implemented by Kuhn in
1982 [42].
Based on the historical application, the relative low material costs and high antimicrobial
properties, experiments on pure copper surfaces were conducted to analyse the toxic
effects on DNA, RNA and the cell membrane under wet conditions. To ascertain new
antimicrobial surfaces and detect their toxic effects on microorganisms, eutectic alloys
composed of aluminium, silver and copper were examined. Thereby, single effects of
copper and silver in correspondence with aluminium were determined, in addition to
synergistic effects of alloys composed of all three metals.
Furthermore, analyses on selected strains of the Keio collections were implemented to
clarify which cellular pathway or transport system is of highest importance when getting
into contact to different potentially antimicrobial surfaces.
Previous studies pointed out that the corrosion and release of ions are very important for
the antimicrobial effect of surfaces [83, 110]. To verify this effect and to determine
differences in the ion release, ICP-MS measurements were conducted after the exposure
to potentially antimicrobial surfaces. Thereby, the total release of metal ions and the cell
associated concentration was determined.
These investigations should identify effective, new antimicrobial surfaces which could then
be applied in spacecraft facilities or exchange plastic surfaces, e.g. doorknobs or light
switches in hospitals to reduce microbial contaminations.
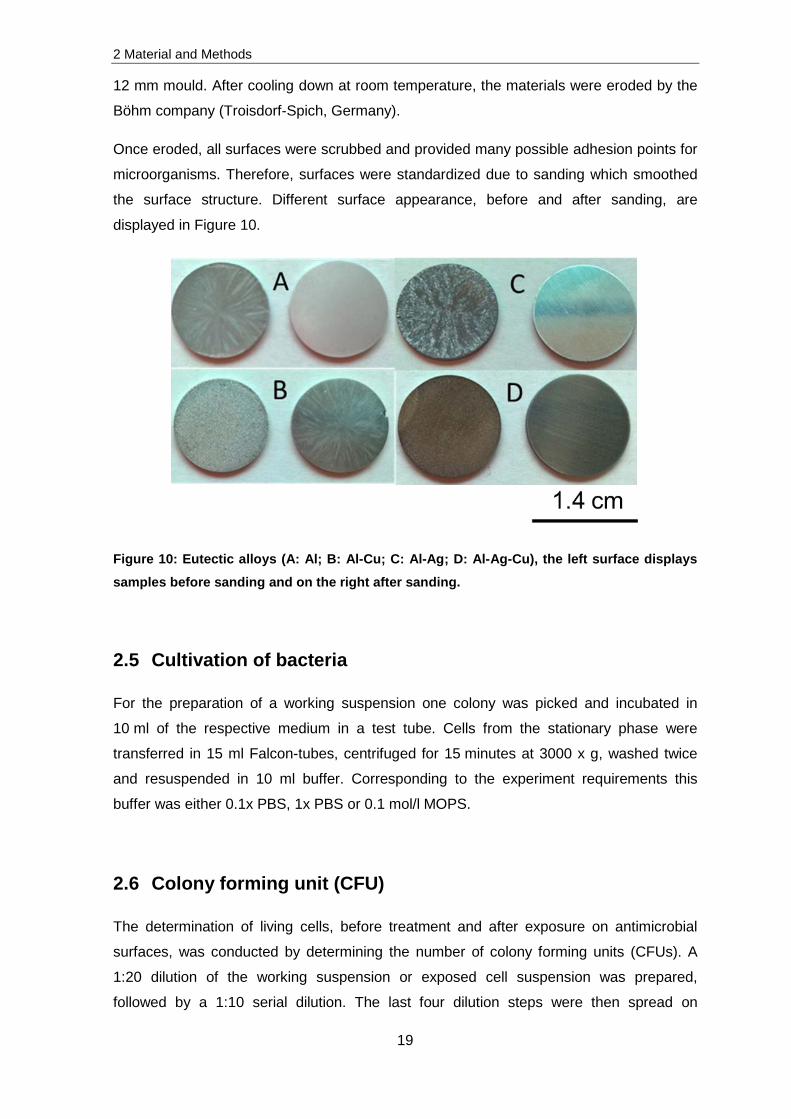
2 Material and Methods
14
2. Material and Methods
2.1 Bacterial strains
The bacterial strains used in this work are human associated microorganisms or isolates
from the environment and were either obtained from the DSMZ – German Collection of
Microorganisms and Cell Cultures GmbH, Braunschweig, Germany or Prof. Dr. Lars
Leichert, Bochum University, Germany (Table 1). More strains were investigated however
not considered further. The selected strains from the Keio collection exhibit single
knockouts whereby the deleted genes were exchanged by a kanamycin cassette.
Therefore 30 µg/ml kanamycin was added to LB growth medium [111].
Strains obtained from the DSMZ were reactivated as followed by recommendations of the
DSMZ. Except Deinococcus radiodurans R1 which was grown at 30 °C to the stationary
phase in 40 hours, all other strains were grown at 37 °C overnight (16 hours) to stationary
phase. An optimal oxygen concentration in liquid cultures was ensured through a shaken
incubation at 200 rpm (HT Multitron, Infors GmbH, Sulzemoos, Germany).
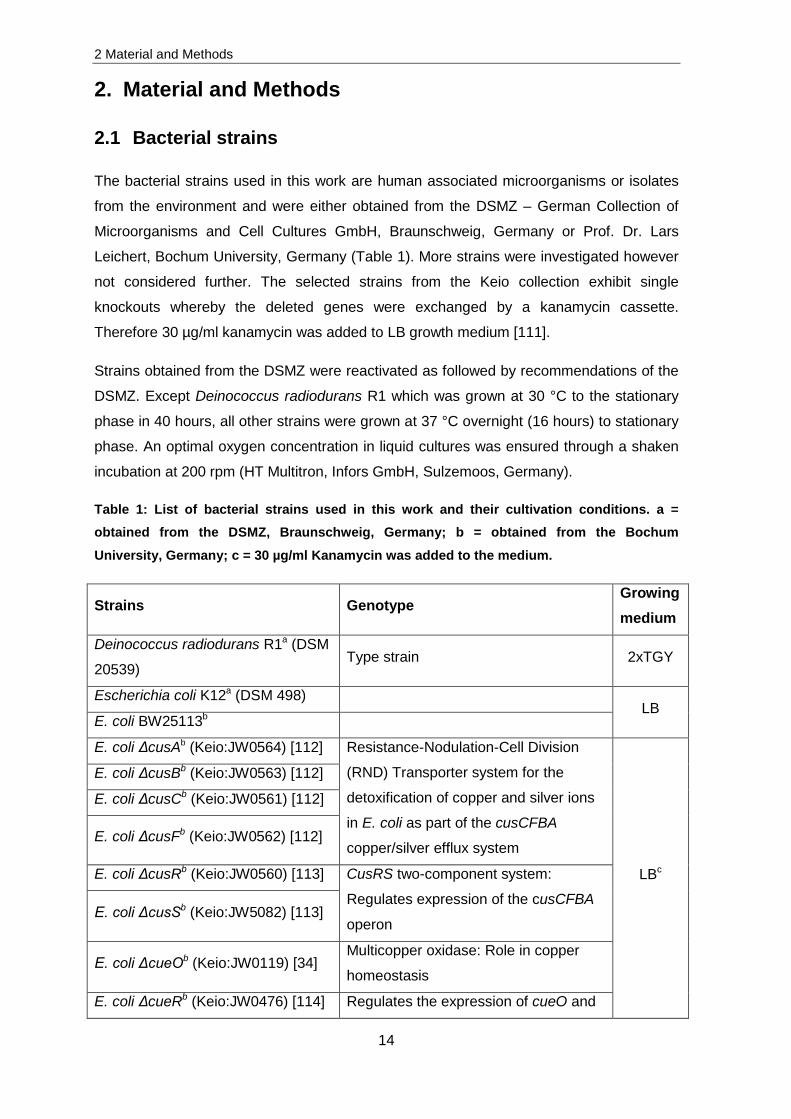
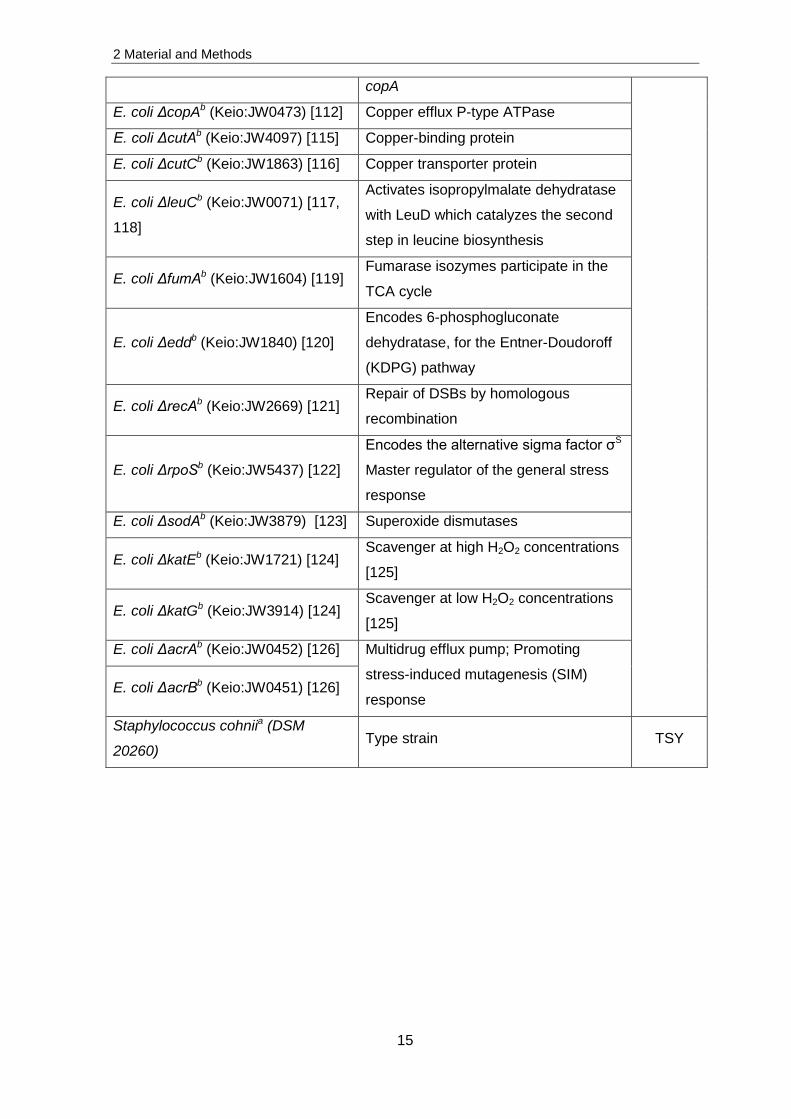
Table 1: List of bacterial strains used in this work and their cultivation conditions. a = obtained from the DSMZ, Braunschweig, Germany; b = obtained from the Bochum
University, Germany; c = 30 µg/ml Kanamycin was added to the medium.
Strains Genotype Growing medium
Deinococcus radiodurans R1a (DSM
20539) Type strain 2xTGY
Escherichia coli K12a (DSM 498) LB
E. coli BW25113b
E. coli ΔcusAb (Keio:JW0564) [112] Resistance-Nodulation-Cell Division
(RND) Transporter system for the
detoxification of copper and silver ions
in E. coli as part of the cusCFBA
copper/silver efflux system
LBc
E. coli ΔcusBb (Keio:JW0563) [112]
E. coli ΔcusCb (Keio:JW0561) [112]
E. coli ΔcusFb (Keio:JW0562) [112]
E. coli ΔcusRb (Keio:JW0560) [113] CusRS two-component system:
Regulates expression of the cusCFBA
operon E. coli ΔcusSb (Keio:JW5082) [113]
E. coli ΔcueOb (Keio:JW0119) [34] Multicopper oxidase: Role in copper
homeostasis
E. coli ΔcueRb (Keio:JW0476) [114] Regulates the expression of cueO and
2 Material and Methods
15
copA
E. coli ΔcopAb (Keio:JW0473) [112] Copper efflux P-type ATPase
E. coli ΔcutAb (Keio:JW4097) [115] Copper-binding protein
E. coli ΔcutCb (Keio:JW1863) [116] Copper transporter protein
E. coli ΔleuCb (Keio:JW0071) [117,
118]
Activates isopropylmalate dehydratase
with LeuD which catalyzes the second
step in leucine biosynthesis
E. coli ΔfumAb (Keio:JW1604) [119] Fumarase isozymes participate in the
TCA cycle
E. coli Δeddb (Keio:JW1840) [120]
Encodes 6-phosphogluconate
dehydratase, for the Entner-Doudoroff
(KDPG) pathway
E. coli ΔrecAb (Keio:JW2669) [121] Repair of DSBs by homologous
recombination
E. coli ΔrpoSb (Keio:JW5437) [122]
Encodes the alternative sigma factor σS
Master regulator of the general stress
response
E. coli ΔsodAb (Keio:JW3879) [123] Superoxide dismutases
E. coli ΔkatEb (Keio:JW1721) [124] Scavenger at high H2O2 concentrations
[125]
E. coli ΔkatGb (Keio:JW3914) [124] Scavenger at low H2O2 concentrations
[125]
E. coli ΔacrAb (Keio:JW0452) [126] Multidrug efflux pump; Promoting
stress-induced mutagenesis (SIM)
response E. coli ΔacrBb (Keio:JW0451) [126]
Staphylococcus cohniia (DSM
20260) Type strain TSY
2 Material and Methods
16
2.2 Media
All buffers, media and solutions were adjusted to the corresponding pH with either NaOH
or HCl and autoclaved at 121 °C for 20 minutes.
The manufacturer's information for chemicals used in this work is listed below:
a AppliChem GmbH, Darmstadt, Germany b Difco Laboratories, Sparks, USA c Fluka, Sigma-Aldrich Chemie GmbH, Steinheim, Germany d Sigma-Aldrich Chemie GmbH, Steinheim, Germany e VWR International GmbH, Darmstadt, Germany
2x TGY medium
Bacto-Trypton b 10 g Bacto Yeast-Extract b 6 g D-Glucose-Monohydrat e 2 g ddH2O ad 1000 ml
TSY medium
Trypticase Soy Broth c 30 g Yeast extract b 3 g ddH2O ad 1000 ml
LB medium
Luria Broth d 20 g ddH2O ad 1000 ml
NB medium
Nutrient Broth e 8 g ddH2O ad 1000 ml
Solid medium:
For the preparation of solid media 15 g/l agar b was added to the medium described
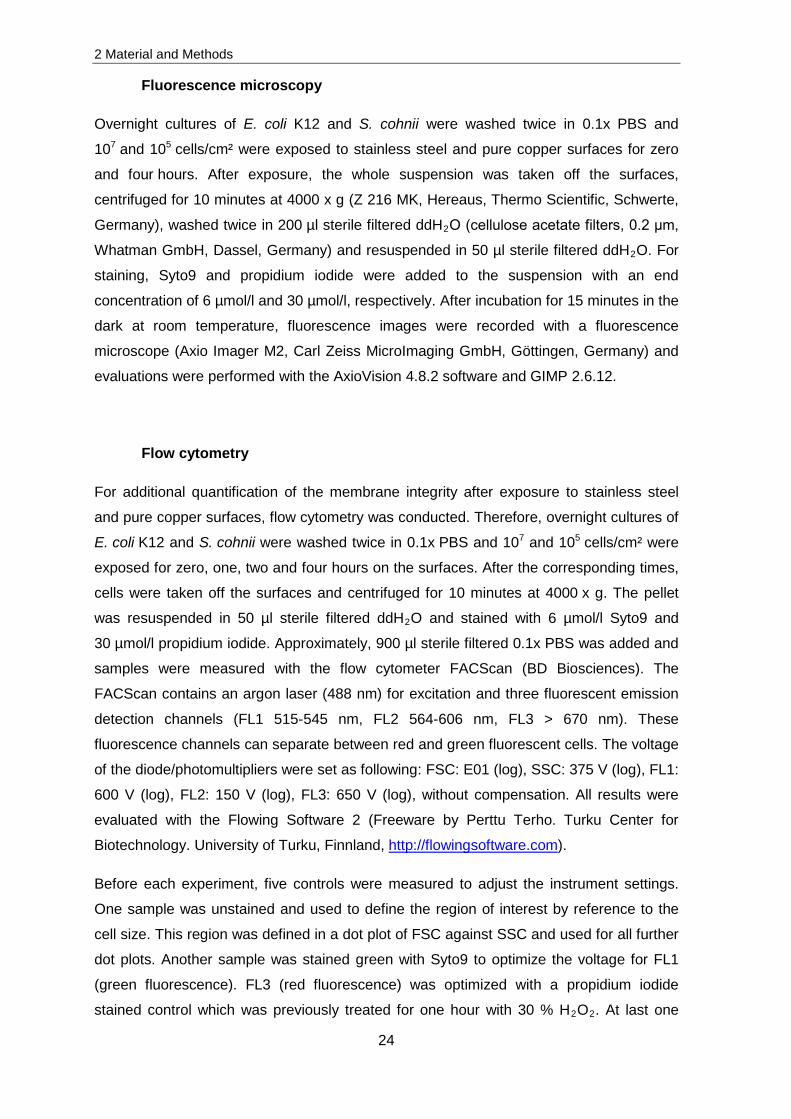
untreated and one stressed sample (one hour with 30 % H2O2) were stained with Syto9
and propidium iodide to determine the appearance of double stained cells. All obtained
results are presented in dot plots, with the green fluorescence on the X-axis against the
red fluorescence on the Y-axis (Figure 11).
Figure 11: Dot plots for the control measurements of 105 E. coli K12 cells/cm² in 0.1x PBS. A: unstained control, B: green (Syto9) stained control, C: maximal (one hour treated with 30 % H2O2) stressed, red (propidium iodide) stained control, D: double stained, non-stressed control and E: double stained, maximal (one hour treated with 30 % H2O2) stressed control.
2.10.4 Detection of reactive oxygen species (ROS)
Exposure on antimicrobial surfaces could lead to production of reactive oxygen species
which results in severe damaging effects. ROS were visualized by staining with CellROX
Green (Thermo Scientific, Schwerte, Germany). The dye is non fluorescent in the reduced
state and cell-permeable. After oxidization by ROS and binding to DNA, a green photo
stable fluorescence is exhibited which has an excitation/emission maximum of ~ 485/520
nm [132]. Overnight cultures of E. coli K12 were washed twice in 0.1x PBS and 107 and
105 cells/cm² were exposed to stainless steel and pure copper surfaces for zero, one, two
2 Material and Methods
26
and four hours. After the corresponding times, cells were taken off the surfaces and one µl
CellROX Green was added. The samples were incubated for 30 minutes in dark at room
temperature and directly measured with the FACScan. The instrument settings were:
FSC: E01 (log), SSC: 375 V (log), FL1: 800 V (log), FL2: 150 V (log), FL3: 150 V (log),
without compensation. All results were evaluated with the Flowing Software 2 (Freeware).
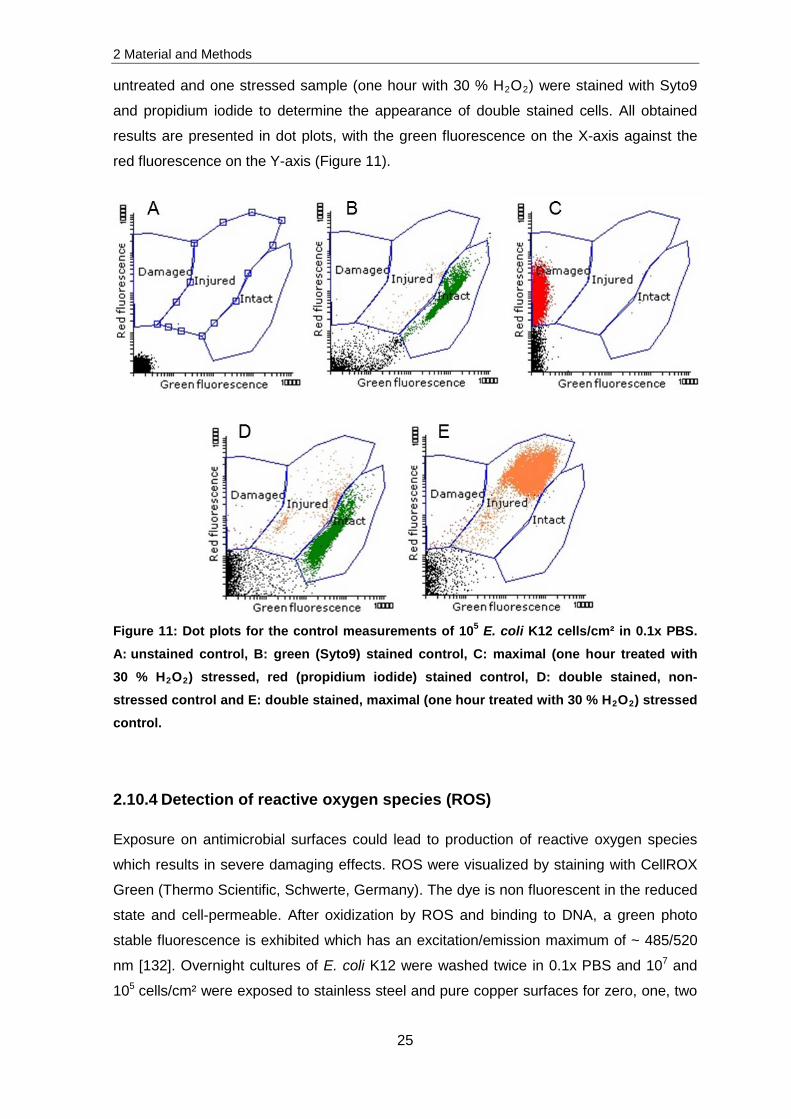
For each experiment, three controls were prepared to determine the instrument settings.
Thereby, one sample was unstained to define the region of interest by reference to the
cell size. This region was defined in a dot plot of FSC against SSC and used for all further
dot plots. Another sample was treated for one hour with 30 % H2O2 and stained with
CellROX green to optimize the voltage for FL1 (green fluorescence). Additionally, one
untreated sample was stained to determine ROS production of non-stressed cells. Figure
12 displays the results for the control measurements. Counts were plotted on the Y-axis
against the green fluorescence (relative ROS production) on the X-axis.
Figure 12: Control measurement to determine ROS production in E. coli K12 with CellROX green. Events of the unstained, non-treated control (black peak), non-treated stained control (blue peak) and maximal (one hour treated with 30 % H2O2) stressed and stained control (red peak) were plotted against the measured green fluorescence.
2.10.5 Nucleic acid integrity
To detect whether DNA or RNA damage occurs after the exposure to pure copper and
stainless steel surfaces, experiments with DNA and RNA were conducted with 107 E. coli
K12 cells/cm². For ex vivo experiments the isolation of DNA and RNA was achieved
before the exposure and in case of in vivo experiments the isolation was performed after
the exposure.
2 Material and Methods
27
For in vivo analysis 107 cells/cm² were exposed on stainless steel and pure copper
surfaces at a temperature of 30 °C and a relative humidity of 83 % (paragraph 2.10). After
the corresponding times of zero, one, two and four hours 108 cells were used for RNA and
DNA isolation.
Additionally, RNA and DNA were isolated from 108 cells for ex vivo experiments. For the
measurement, 15 µl RNA and DNA solution was exposed on 0.12 cm² of the surfaces.
The purity was measured in a spectrophotometer (NanoDrop™ 2000c
Spectrophotometer, Thermo Scientific, Schwerte, Germany). Further analysis was
conducted with gel electrophoresis (gel electrophoresis apparatus, Biostep,
Burkhardtsdorf, Germany; power supply: major science mini - 300, Saratoga, USA) and
Bioanalyzer (Bioanalyzer 2100r, Agilent Technologies, Karlsbrunn, Germany) as
described in the following paragraphs.
DNA and RNA isolation
DNA was isolated with the peqGOLD Bacterial DNA Kit and RNA with the peqGOLD
Bacterial RNA Kit. All buffers except Lysostaphin were available in the Kit. An overnight
culture of E. coli K12 or S. cohnii was washed twice with 0.1x PBS. Approximately,
108 cells were lysed with either 10 µl Lysozyme (10 mg/ml) in case of E. coli K12 or 10 µl
Lysostaphin (5 mg/ml; Sigma-Aldrich Chemie GmbH, Steinheim, Germany) for S. cohnii
[133]. Followed by the instructions of the Kits, DNA and RNA were isolated. Before
continuing, the quantity and purity was determined with Nanodrop. For experiments, DNA
was either used directly or after storage in Elution buffer at -20 °C. In case of RNA
experiments, RNA was either used directly or after the storage in RNAse free water at a
temperature of -80 °C.
Absorption measurement
The ratio of absorbance at 260 nm and 280 nm was used to assess the purity of DNA and
RNA. Approximately, one µl DNA or RNA sample was applied to the spectrophotometer
Nanodrop which then conducted a wavelength scan of absorbance. A ratio of pure DNA is
around 1.8 and for RNA 2.0 [134]. The scan also provides first hints of possible molecule
fragmentations. These fragmentations were visualized with gel electrophoresis.
Additionally, fragmentation of RNA was visualized by capillary gel electrophoresis using
the Bioanalyzer.
2 Material and Methods
28
Gel electrophoresis
Gel electrophoresis was used to detect possible fragmentations of DNA and RNA.
Genomic DNA was separated in a 0.8 % agarose gel (Serva Electrophoresis GmbH,
Heidelberg, Germany) and RNA in a 2 % agarose gel. Exactly, 100 ml 1x TAE buffer
containing 0.8 % or 2 % agarose was boiled until the agarose was completely dissolved.
After cooling down to 40 °C, two µl ethidium bromide (10 mg/ml, Sigma-Aldrich Chemie
GmbH, Steinheim, Germany) was added and well mixed. The solution was then poured
into the gel equipment with a well forming comb and completely cooled down until the gel
was cured. After the removal of the comb the gel was placed in the electrophoresis unit
and completely covered with 1x TAE buffer. Then 300 ng of each sample, mixed with
two µl loading dye was loaded to the chambers. For DNA a High Range DNA Ladder
(Fermentas, Thermo Scientific, Schwerte, Germany) and for RNA the RiboRuler High
Range RNA Ladder (Thermo Scientific, Schwerte, Germany) was loaded on the gel. After
30 minutes of separation by applying an electric field of 7 V/cm the different bands were
visualized by using the ImageQuant LAS4000 (GE Healthcare Life Sciences, Freiburg,
Germany) and labelled in Microsoft PowerPoint 2010.
Capillary gel electrophoresis
For detailed analysis of RNA fragmentation, samples were measured by using the
Bioanalyzer and the Agilent RNA 6000 Nano Kit. The principle of the Bioanalyzer is based
on capillary electrophoresis which leads to the separation of fragments. At the beginning
of this experiment the gel-dye mix was prepared according to the manufacturer’s
instructions and loaded on the RNA Nano chip. Then the Marker was added in each well
followed by the application of the samples and the RNA ladder. Finally, the chip was
transferred to the Bioanalyzer and measured with the program “Prokaryote total RNA
Nano Series II.xsy” of the 2100 expert software. The obtained results were labelled in
Microsoft PowerPoint 2010.
2.10.6 Measurement of ion release
The concentration of released ions was measured with the inductively coupled plasma
mass spectrometry (ICP-MS). The nebulized sample was ionized in plasma, which was
obtained by a high frequency field of alternating current of 10000 K argon gas [135]. The
ionized particles were separated towards their mass and charge through a quadrupole-
MS. The ion current proceeds through four parallel conductive bars. By suitable
2 Material and Methods
29
superposition of opposite DC voltage and phase shifted, high-frequency AC voltages, ions
are accelerated and forced on a spiral path. The frequency and amplitude of the applied
high frequency voltage can be used as filters. These filters are adapted with the result that
ions with a certain mass-to-charge ratio can pass the analyser exclusively with an
approximate detection limit for Al, Ag and Cu of 10 ppt (personal communication with Dr.
Christine Hein, Saarland University, Germany).
In three different experimental setups, the release rate of copper ions after contact killing
was determined. First of all, E. coli K12, E. coli ΔcopA and S. cohnii were washed twice in
0.1x PBS and applied to stainless steel and pure copper surfaces. The second experiment
was conducted with E. coli K12 washed twice in 0.1 mol/l MOPS and exposed to stainless
steel, pure copper surfaces and eutectic alloys. Additionally to contact killing experiments,
E. coli K12 was exposed in 0.1x PBS containing different concentrations of CuSO4.
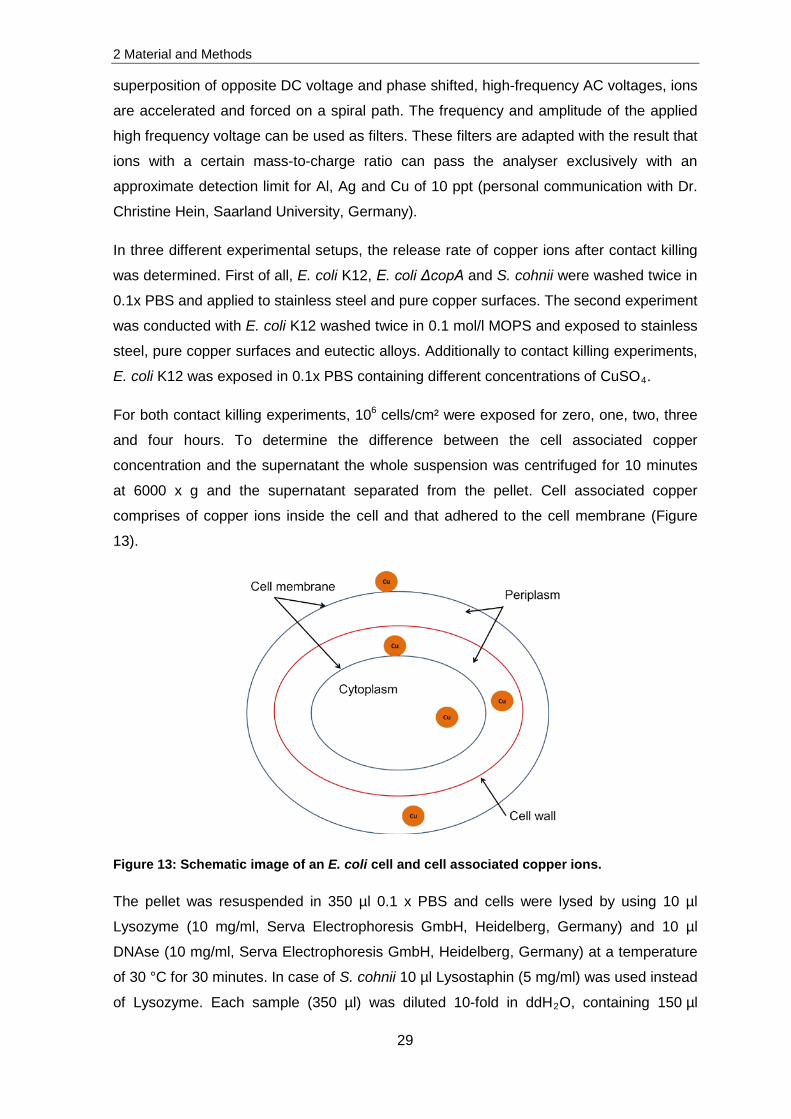
For both contact killing experiments, 106 cells/cm² were exposed for zero, one, two, three
and four hours. To determine the difference between the cell associated copper
concentration and the supernatant the whole suspension was centrifuged for 10 minutes
at 6000 x g and the supernatant separated from the pellet. Cell associated copper
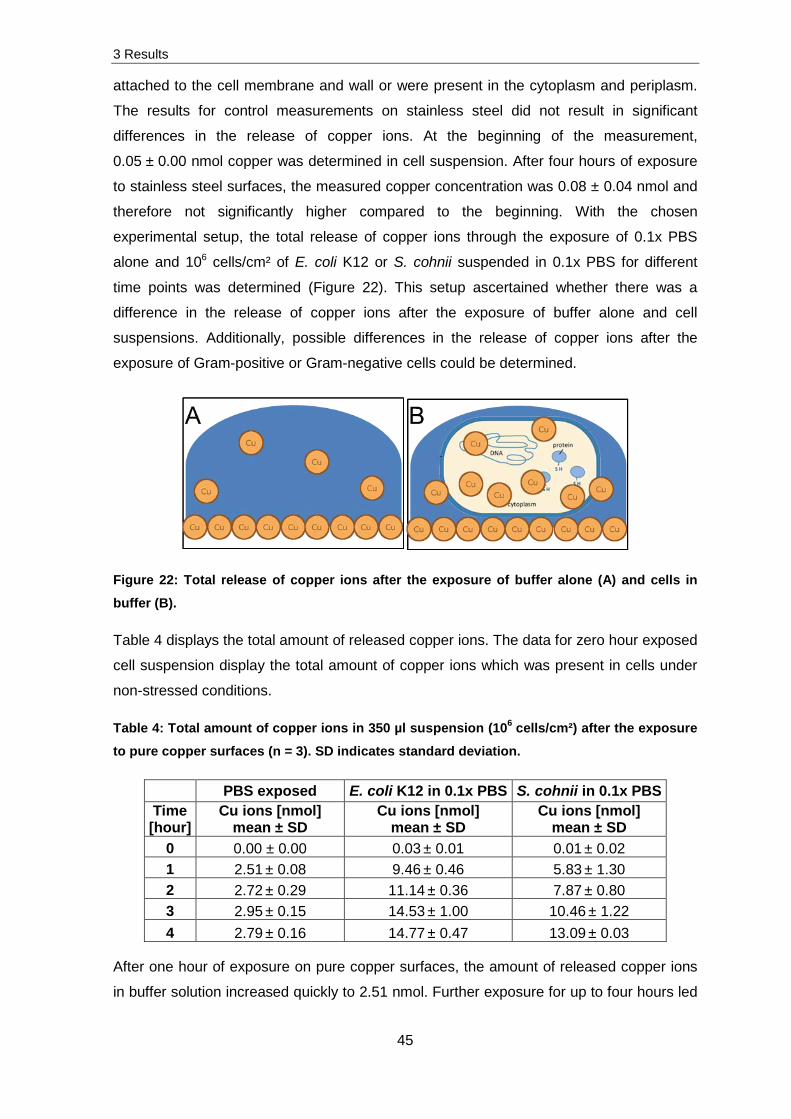
comprises of copper ions inside the cell and that adhered to the cell membrane (Figure
13).
Figure 13: Schematic image of an E. coli cell and cell associated copper ions.
The pellet was resuspended in 350 µl 0.1 x PBS and cells were lysed by using 10 µl
Lysozyme (10 mg/ml, Serva Electrophoresis GmbH, Heidelberg, Germany) and 10 µl
DNAse (10 mg/ml, Serva Electrophoresis GmbH, Heidelberg, Germany) at a temperature
of 30 °C for 30 minutes. In case of S. cohnii 10 µl Lysostaphin (5 mg/ml) was used instead
of Lysozyme. Each sample (350 µl) was diluted 10-fold in ddH2O, containing 150 µl
2 Material and Methods
30
0.065 % nitric acid (VWR International GmbH, Darmstadt, Germany) and 3.5 µl of an
internal standard (10 ppm Ho, 10 ppm Sc). The copper concentration was quantified by
using the ICP-MS 7500 Series, Agilent Technologies (Inorganic solid state chemistry,
Saarland University, Saarbrücken, Germany) which runs with the power of 1550 W in the
Spectrum Multi Tune mode. The flow rate of the carrier gas was 1.05 l/min and of the
plasma cooling gas 15 l/min. As internal standard 165Ho and 45Sc were applied to each
sample and measured additionally to 63Cu, 107Ag and 27Al. The sample was pumped with a
velocity of 0.3 rps (rounds per seconds) until equilibrium was reached. Thereafter, during
measurement of the sample the pumping velocity was 0.1 rps. Previously to each
measurement a copper, silver and aluminium calibration curve was recorded. All data
were accumulated in triplicates for 100 msec and listed as cps (counts per second). The
results, given in ppb or ng/ml, were analysed by using the calibration curve.
Calculation of released aluminium, silver and/or copper ions and cell associated copper
ions was conducted as followed. The obtained concentration (x) in ppb or ng/ml was
multiplied by 3.5 ml to determine the total amount of copper in ng in the whole sample
volume.
𝐴𝐴 = 𝑥𝑥 ∗ 3.5 𝑚𝑚𝑚𝑚 ∗ 10−9
A = total amount of copper [g]
After that, these values were corrected by subtracting the blank value of PBS or MOPS.
𝐵𝐵 = 𝐴𝐴 − 𝑃𝑃𝐵𝐵𝑃𝑃0 𝑜𝑜𝑜𝑜 𝑀𝑀𝑂𝑂𝑃𝑃𝑃𝑃0
B = corrected data [g]
PBS0 or MOPS0 = blank PBS or MOPS value [g]
Two different calculations were conducted afterwards. One calculation was related to the
amount of released aluminium, silver and copper ions in solution. The other measurement
determined the cell associated ion concentration in E. coli K12, E. coli ∆copA and
S. cohnii after the exposure to antimicrobial surfaces.
2 Material and Methods
31
The total amount of released ions after exposure was achieved through addition of the
obtained data for the cell pellet and the supernatant. For the calculation it was assumed
that 63.55 g copper (107.87 g silver and 26.98 g aluminium) in solution corresponds to a
one molar solution. The following equations were conducted for copper ions.
𝐶𝐶 = 𝐵𝐵 ∗ 1000
63,55
C = copper ions [mmol]
To determine the cell associated ion concentration the following calculations were
conducted. Approximately 3.5x10⁶ cells were exposed (y) and the wet weight (z) of E. coli
K12 and S. cohnii was assumed as 9.5x10⁻¹³ g/cell [136].
𝐷𝐷 = 𝐵𝐵𝑦𝑦
y = number of exposed cells [cells]
D = amount of copper [g/cell]
𝐸𝐸 = 𝐷𝐷 ∗ 100 %
𝑧𝑧
z = wet weight of one cells [g/cell]
E = cell associated copper concentration [%]
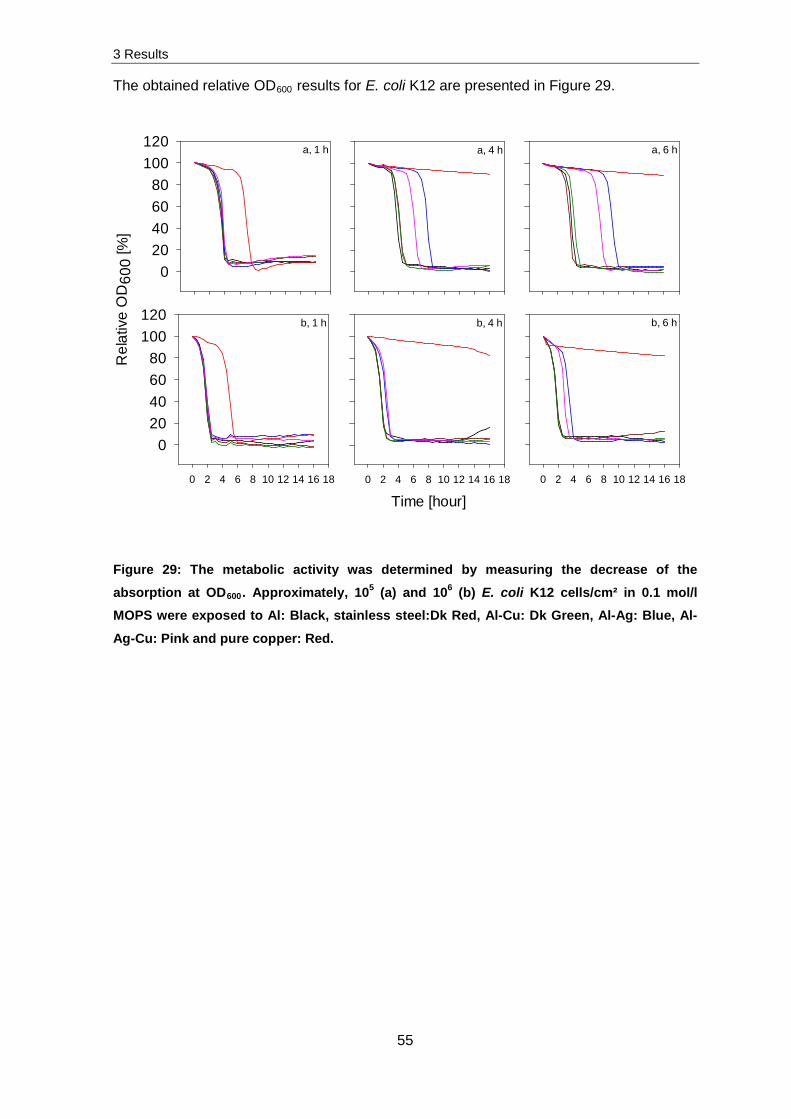
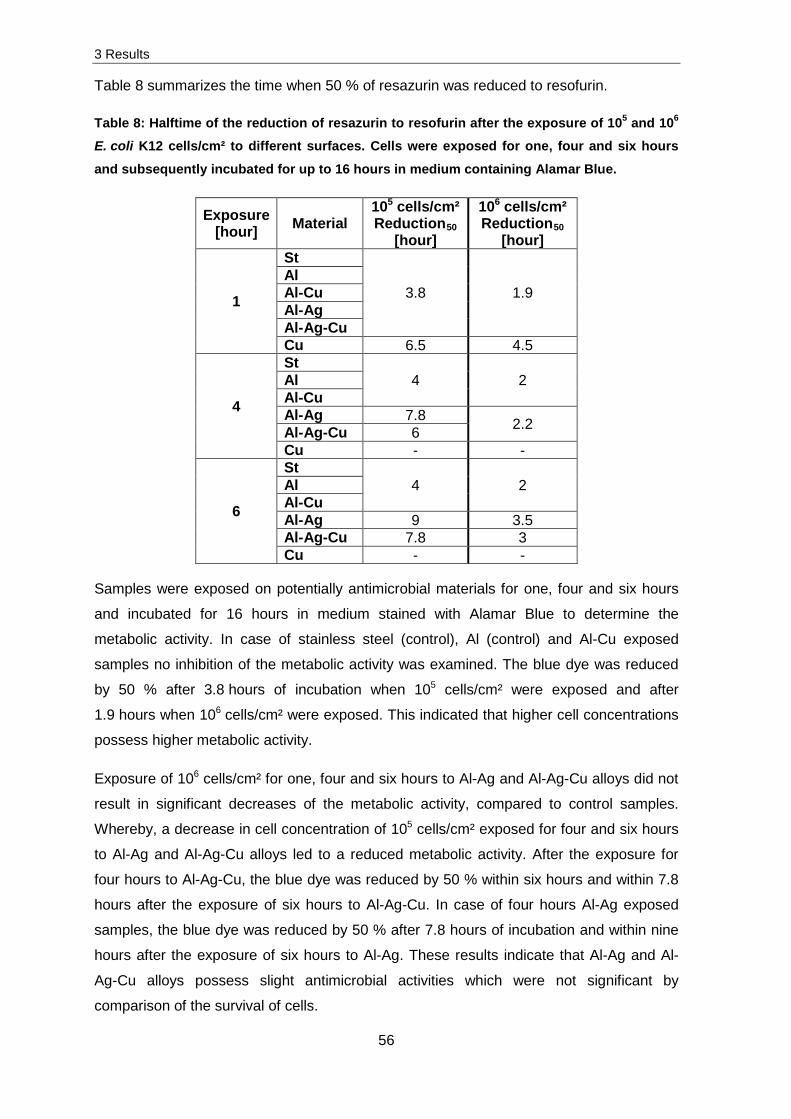
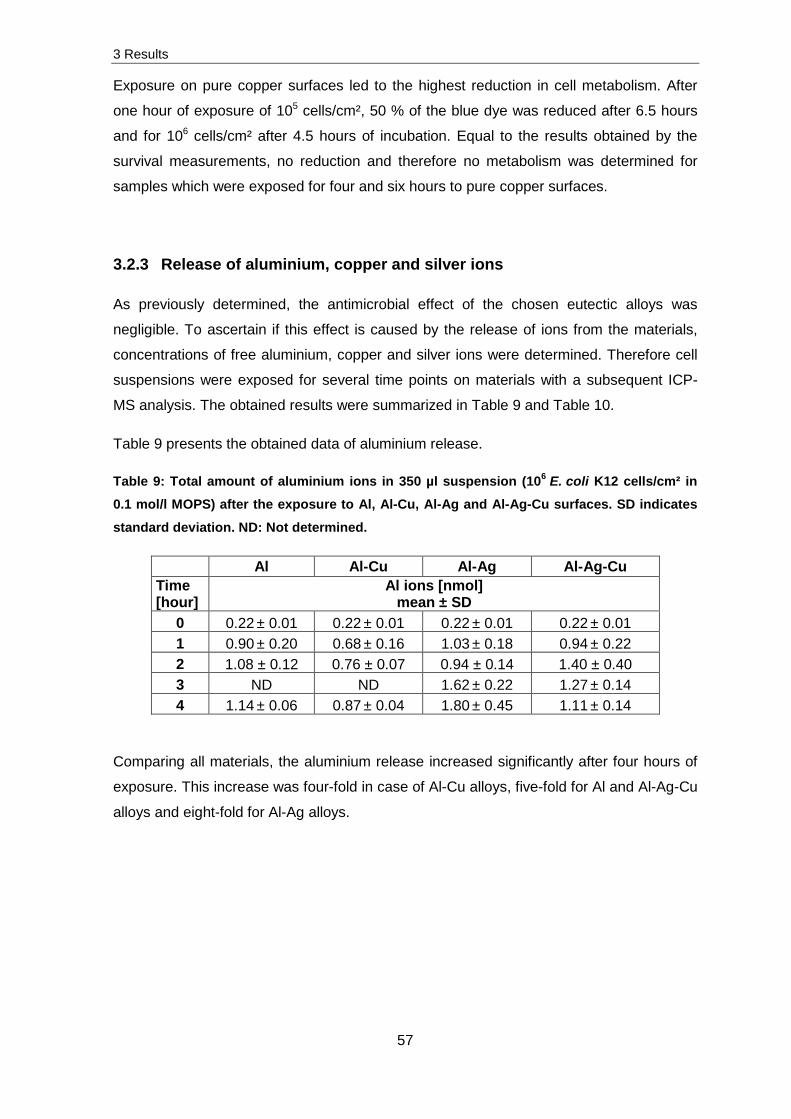
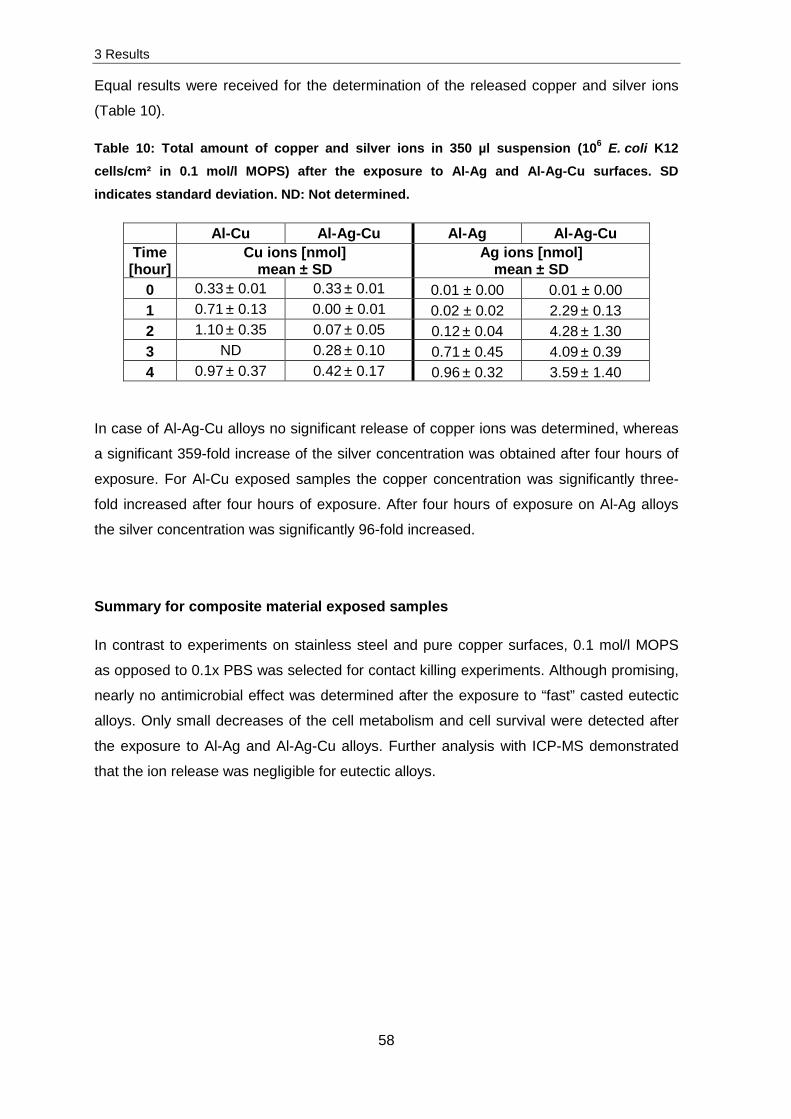
3 Results
32
3. Results
Desiccation tolerance
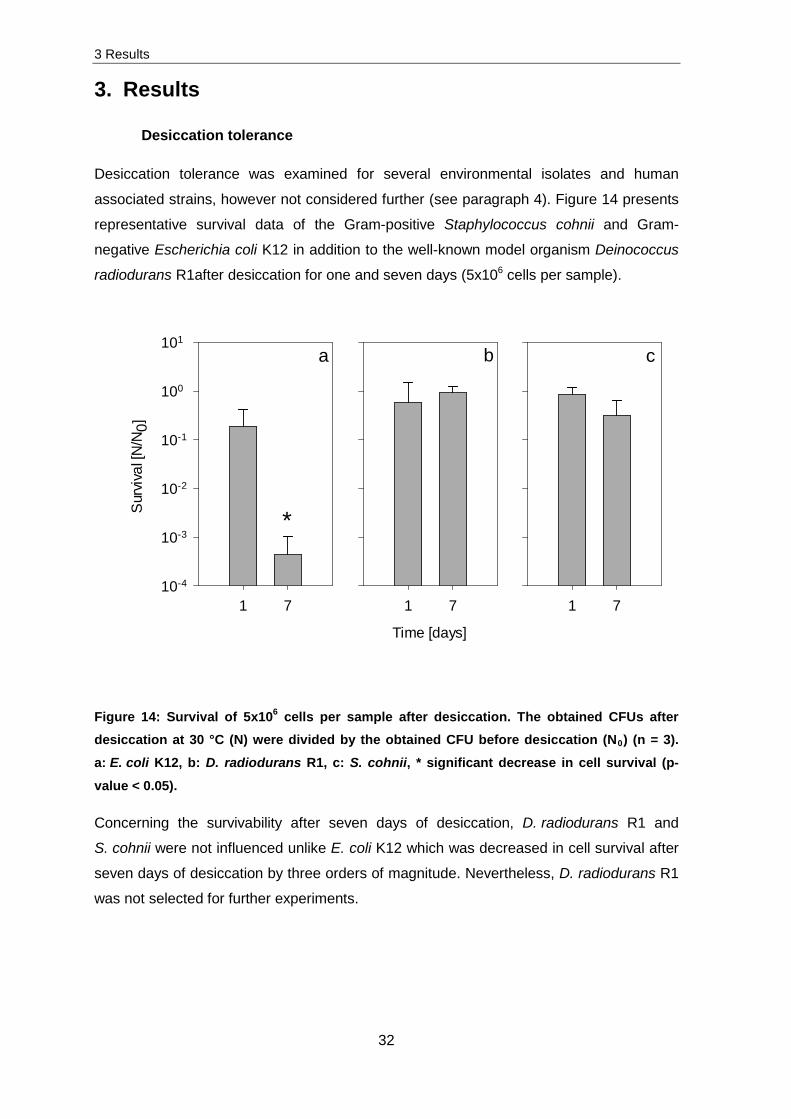
Desiccation tolerance was examined for several environmental isolates and human
associated strains, however not considered further (see paragraph 4). Figure 14 presents
representative survival data of the Gram-positive Staphylococcus cohnii and Gram-
negative Escherichia coli K12 in addition to the well-known model organism Deinococcus
radiodurans R1after desiccation for one and seven days (5x10⁶ cells per sample).
1 7
Sur
viva
l [N
/N0]
10-4
10-3
10-2
10-1
100
101
Time [days]
1 7 1 7
a b c
*
Figure 14: Survival of 5x10⁶ cells per sample after desiccation. The obtained CFUs after desiccation at 30 °C (N) were divided by the obtained CFU before desiccation (N0) (n = 3). a: E. coli K12, b: D. radiodurans R1, c: S. cohnii, * significant decrease in cell survival (p-
value < 0.05).
Concerning the survivability after seven days of desiccation, D. radiodurans R1 and
S. cohnii were not influenced unlike E. coli K12 which was decreased in cell survival after
seven days of desiccation by three orders of magnitude. Nevertheless, D. radiodurans R1
was not selected for further experiments.
3 Results
33
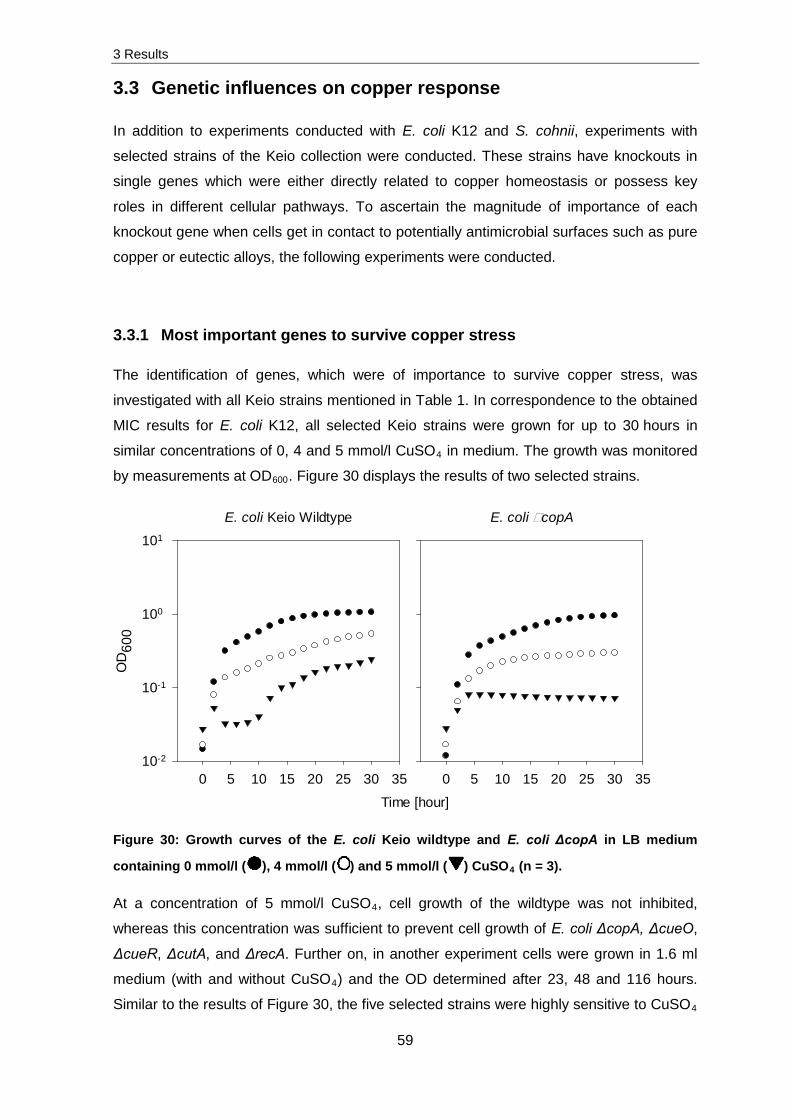
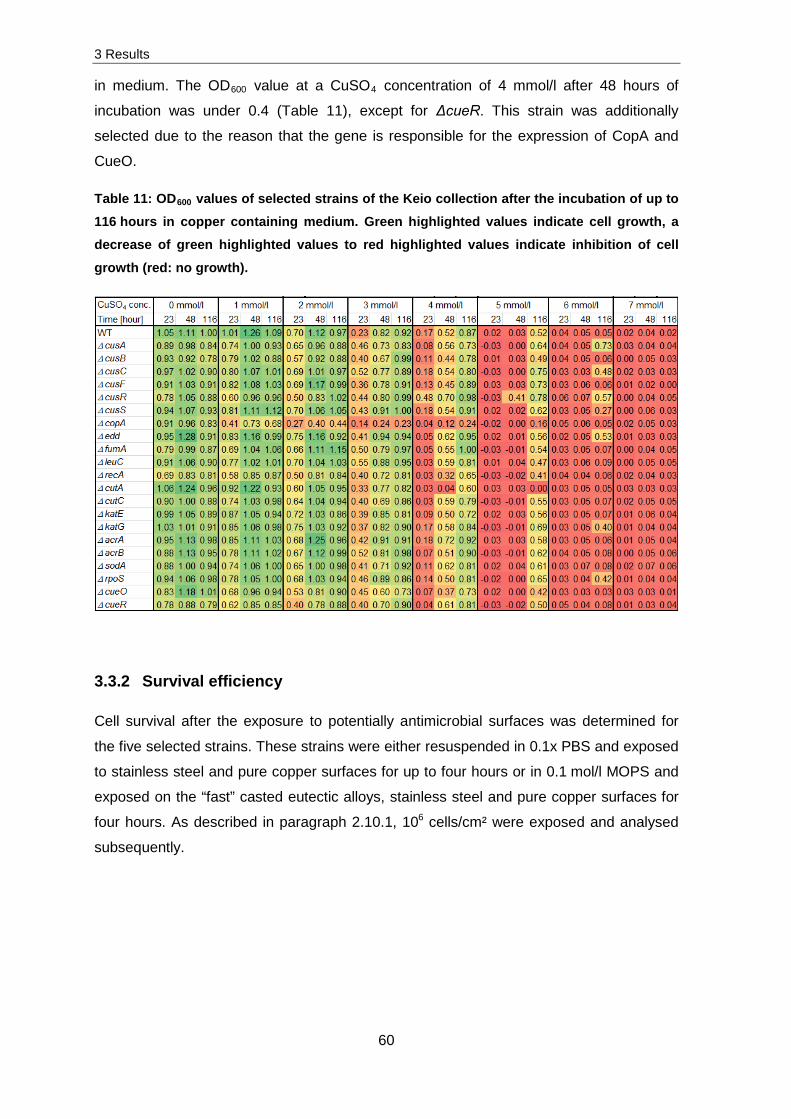
Minimal inhibitory concentration (MIC) of CuSO4
The following experiments were conducted with E. coli K12 and S. cohnii. Both strains
exhibit similar growth conditions but differ in their cell wall and membrane structure. To
identify the copper concentration which was needed to inhibit cell growth, the MIC of
CuSO4 in medium was determined for concentrations ranging between 0.1 mmol/l to
10 mmol/l. The obtained CuSO4 MIC for E. coli K12 was 5 mmol/l and for S. cohnii
7 mmol/l.
Further experiments, so called contact killing experiments, were conducted on
antimicrobial surfaces. To determine the antimicrobial effect on all cells, the prevention of
shielding effects and a direct contact of cells with the surface were of major concern. This
was achieved for cells lying in a monolayer. Therefore, investigations to obtain optimal cell
concentrations for a monolayer of cells were conducted with SEM analysis.
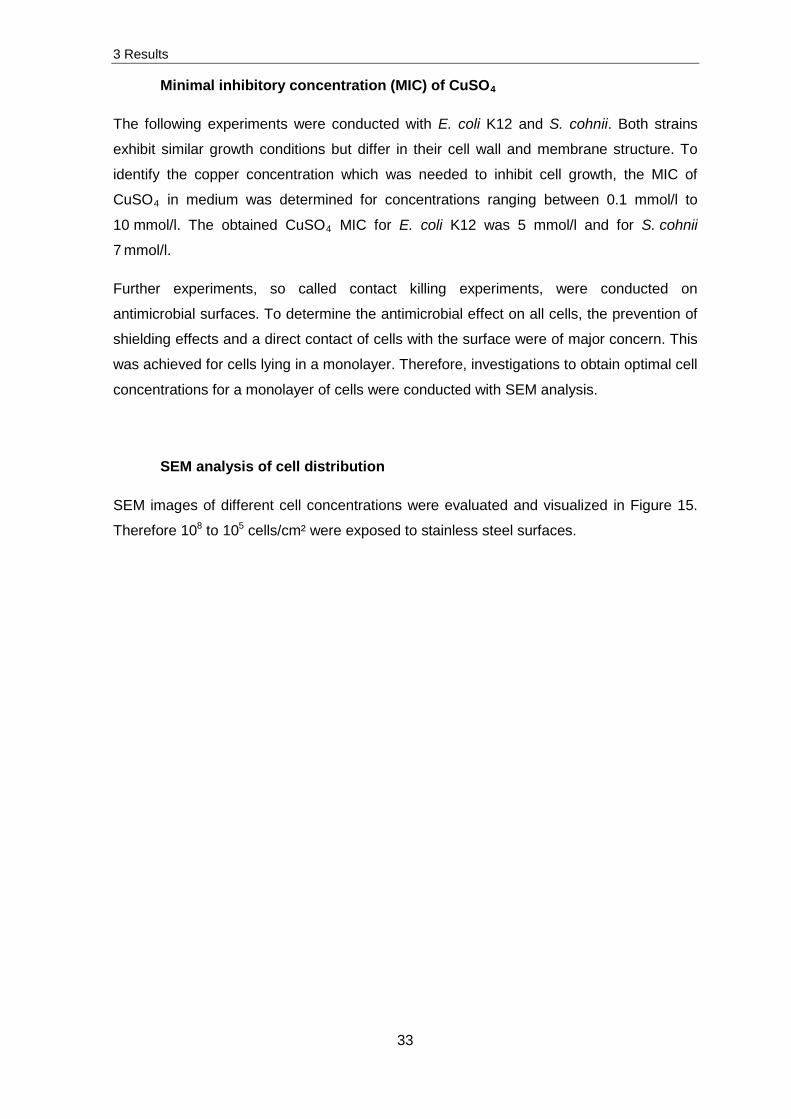
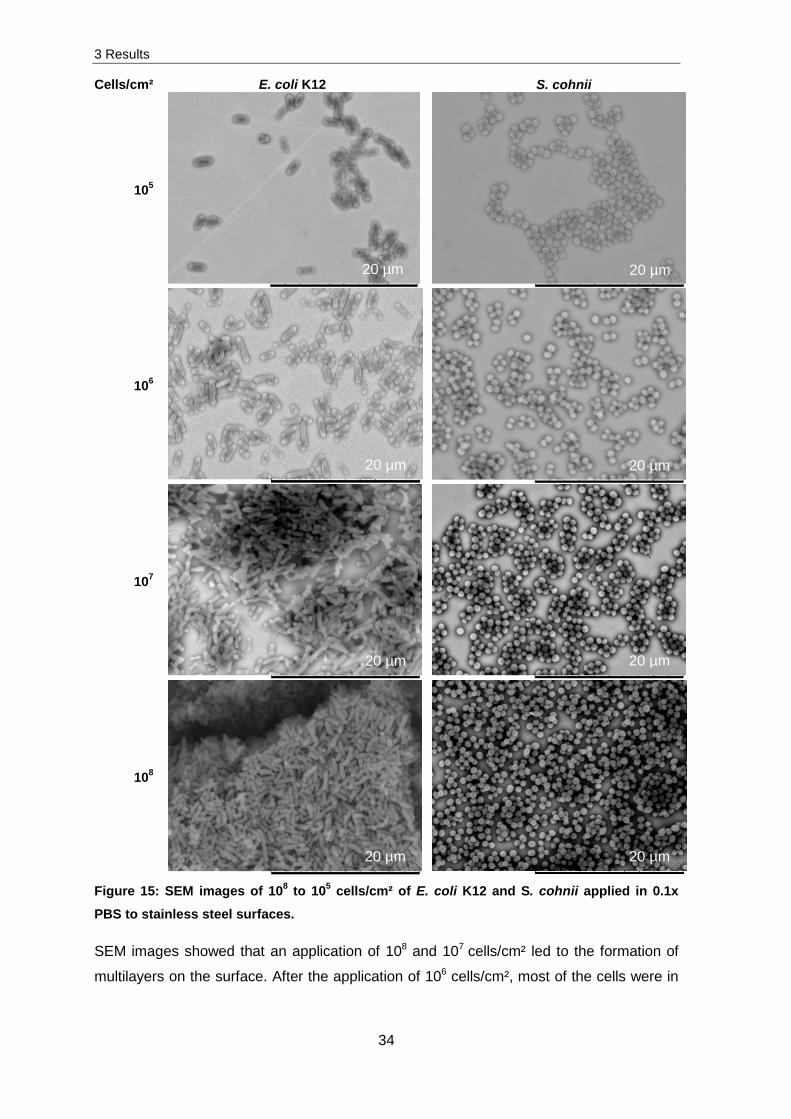
SEM analysis of cell distribution
SEM images of different cell concentrations were evaluated and visualized in Figure 15.
Therefore 108 to 105 cells/cm² were exposed to stainless steel surfaces.
3 Results
34
Cells/cm² E. coli K12 S. cohnii
105
106
107
108
Figure 15: SEM images of 108 to 105 cells/cm² of E. coli K12 and S. cohnii applied in 0.1x
PBS to stainless steel surfaces.
SEM images showed that an application of 108 and 107 cells/cm² led to the formation of
multilayers on the surface. After the application of 106 cells/cm², most of the cells were in
20 µm 20 µm
20 µm 20 µm
20 µm 20 µm
20 µm 20 µm
3 Results
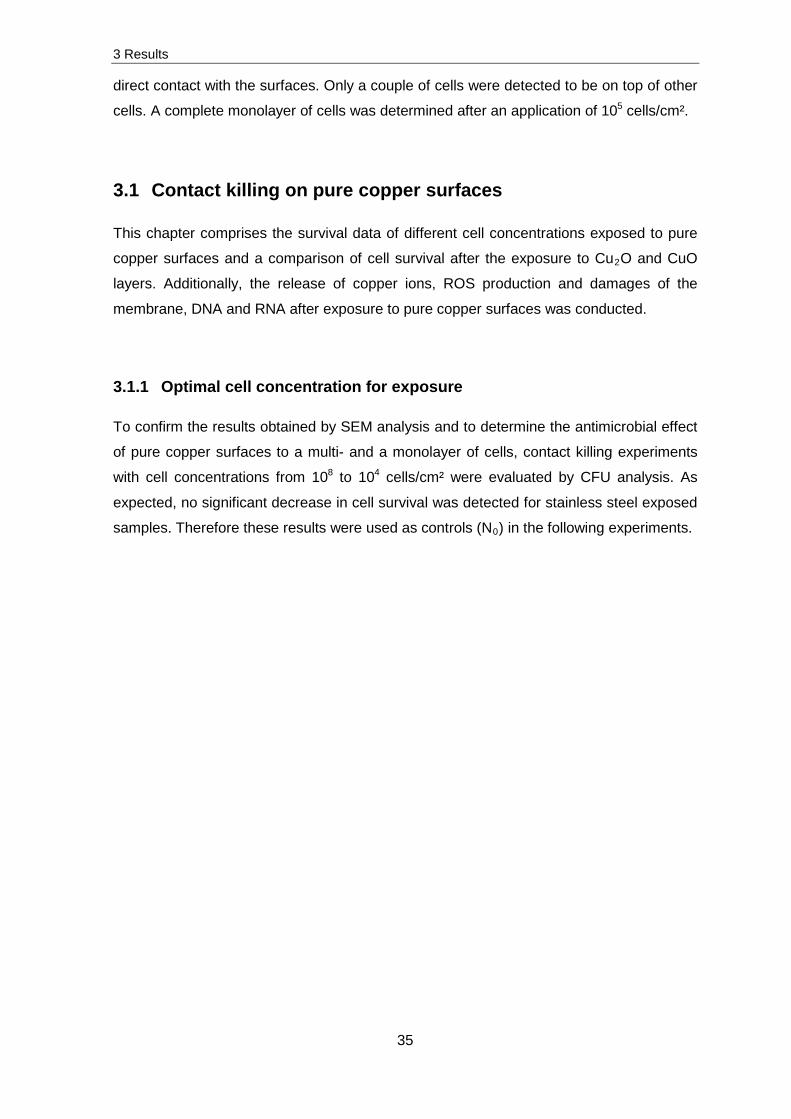
35
direct contact with the surfaces. Only a couple of cells were detected to be on top of other
cells. A complete monolayer of cells was determined after an application of 105 cells/cm².
3.1 Contact killing on pure copper surfaces
This chapter comprises the survival data of different cell concentrations exposed to pure
copper surfaces and a comparison of cell survival after the exposure to Cu2O and CuO
layers. Additionally, the release of copper ions, ROS production and damages of the
membrane, DNA and RNA after exposure to pure copper surfaces was conducted.
3.1.1 Optimal cell concentration for exposure
To confirm the results obtained by SEM analysis and to determine the antimicrobial effect
of pure copper surfaces to a multi- and a monolayer of cells, contact killing experiments
with cell concentrations from 108 to 104 cells/cm² were evaluated by CFU analysis. As
expected, no significant decrease in cell survival was detected for stainless steel exposed
samples. Therefore these results were used as controls (N0) in the following experiments.
3 Results
36
10-5
10-4
10-3
10-2
10-1
100
101a b c d e
0 2 4
Surv
ival [
N/N
0]
10-5
10-4
10-3
10-2
10-1
100
101
0 2 4Time [hour]0 2 4 0 2 4 0 2 4
a b c d e
A
B
* **
*
*
§
*
**
**
*
*
§
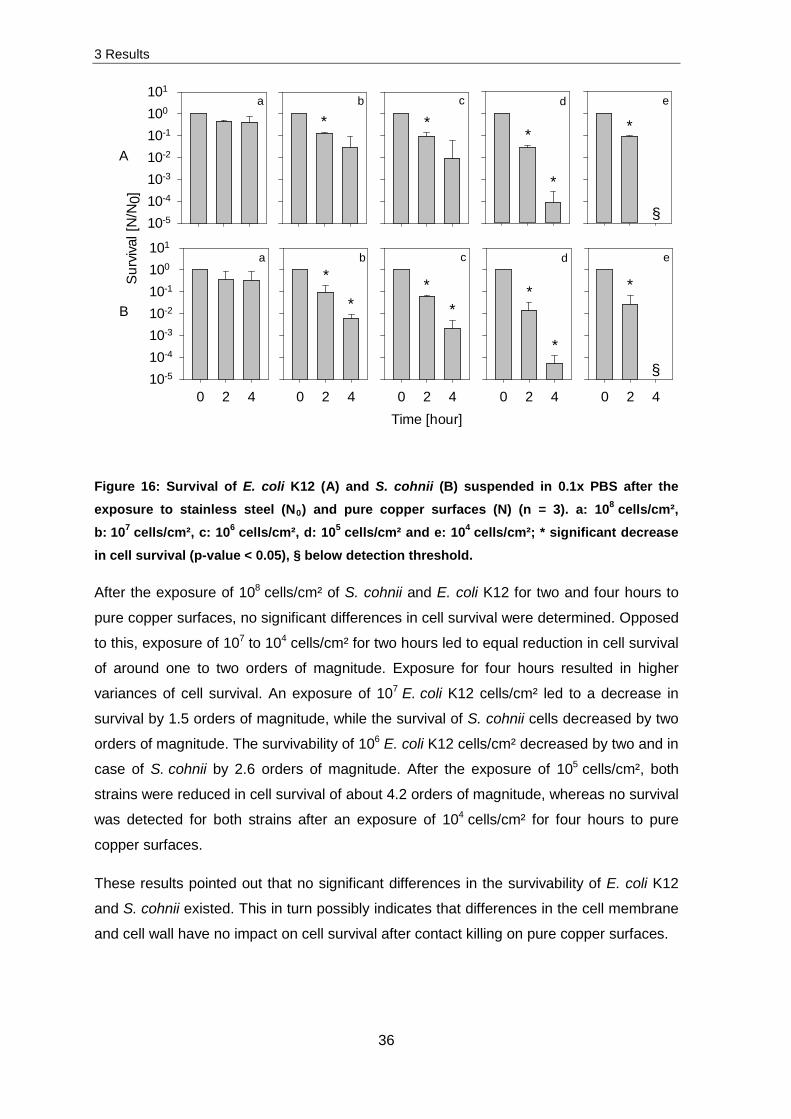
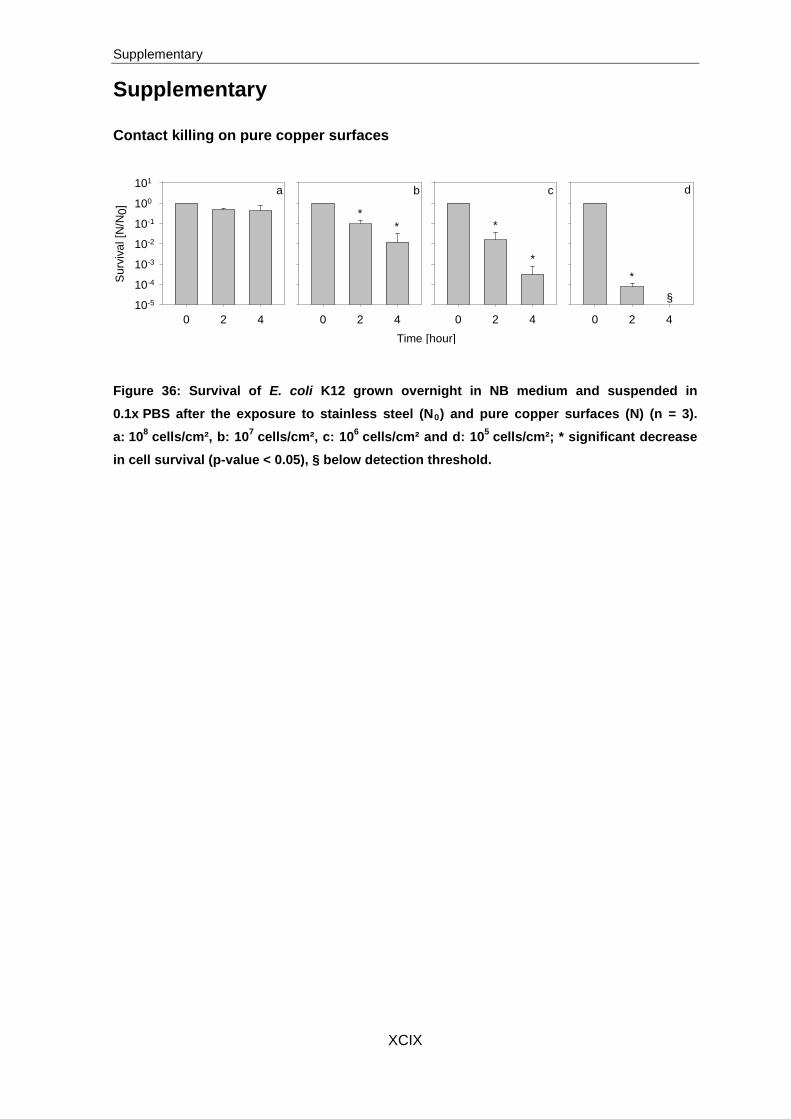
Figure 16: Survival of E. coli K12 (A) and S. cohnii (B) suspended in 0.1x PBS after the exposure to stainless steel (N0) and pure copper surfaces (N) (n = 3). a: 108 cells/cm², b: 107 cells/cm², c: 106 cells/cm², d: 105 cells/cm² and e: 104 cells/cm²; * significant decrease in cell survival (p-value < 0.05), § below detection threshold.
After the exposure of 108 cells/cm² of S. cohnii and E. coli K12 for two and four hours to
pure copper surfaces, no significant differences in cell survival were determined. Opposed
to this, exposure of 107 to 104 cells/cm² for two hours led to equal reduction in cell survival
of around one to two orders of magnitude. Exposure for four hours resulted in higher
variances of cell survival. An exposure of 107 E. coli K12 cells/cm² led to a decrease in
survival by 1.5 orders of magnitude, while the survival of S. cohnii cells decreased by two
orders of magnitude. The survivability of 106 E. coli K12 cells/cm² decreased by two and in
case of S. cohnii by 2.6 orders of magnitude. After the exposure of 105 cells/cm², both
strains were reduced in cell survival of about 4.2 orders of magnitude, whereas no survival
was detected for both strains after an exposure of 104 cells/cm² for four hours to pure
copper surfaces.
These results pointed out that no significant differences in the survivability of E. coli K12
and S. cohnii existed. This in turn possibly indicates that differences in the cell membrane
and cell wall have no impact on cell survival after contact killing on pure copper surfaces.
3 Results
37
3.1.2 Influence of different copper ions
From pure copper surfaces Cu+ and Cu2+ can be dissolved whereby both ions possess
different contact killing effects on cells. To determine which copper ion has the most toxic
effect, 106 cells/cm² of E. coli K12 and S. cohnii were exposed to copper oxide layers
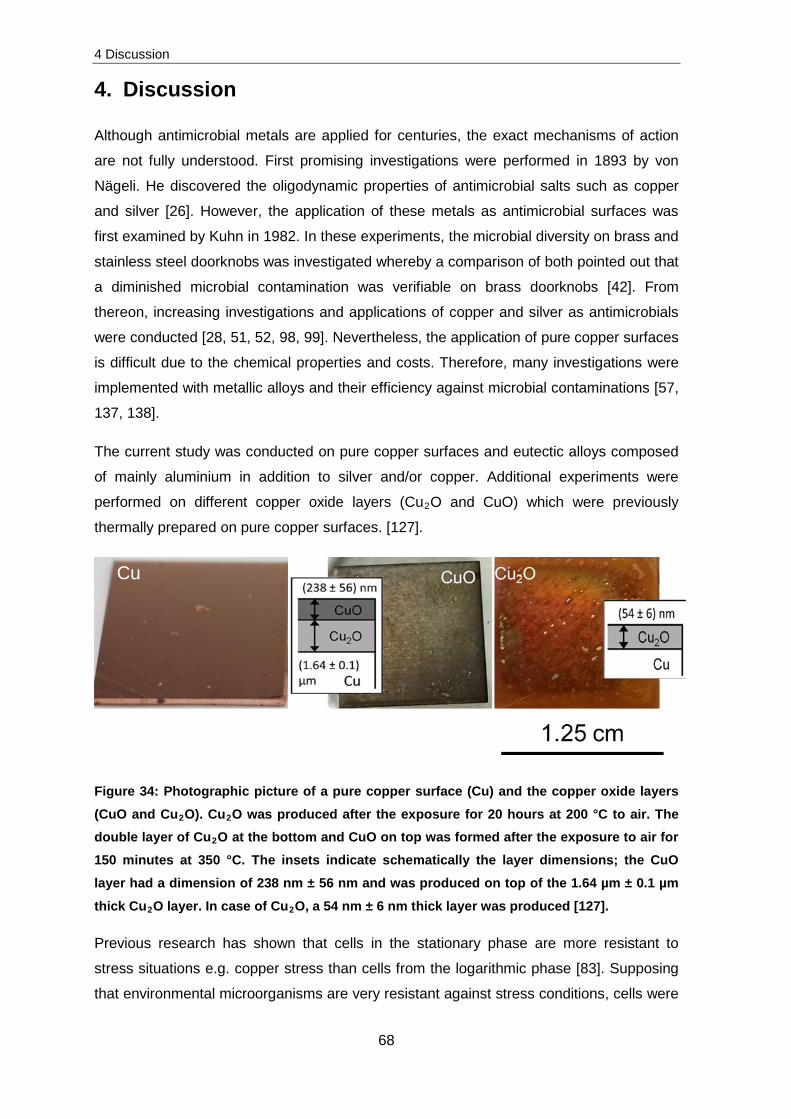
(CuO and Cu2O – see Figure 34) which were thermally prepared on pure copper surfaces.
A
B
CuO
10-6
10-5
10-4
10-3
10-2
10-1
100
101Cu2O Cu
0 2 4
Surv
ival
[N/N
0]
10-6
10-5
10-4
10-3
10-2
10-1
100
101
Time [hour]
0 2 4 0 2 4
*
**
*
*
*
* **
*
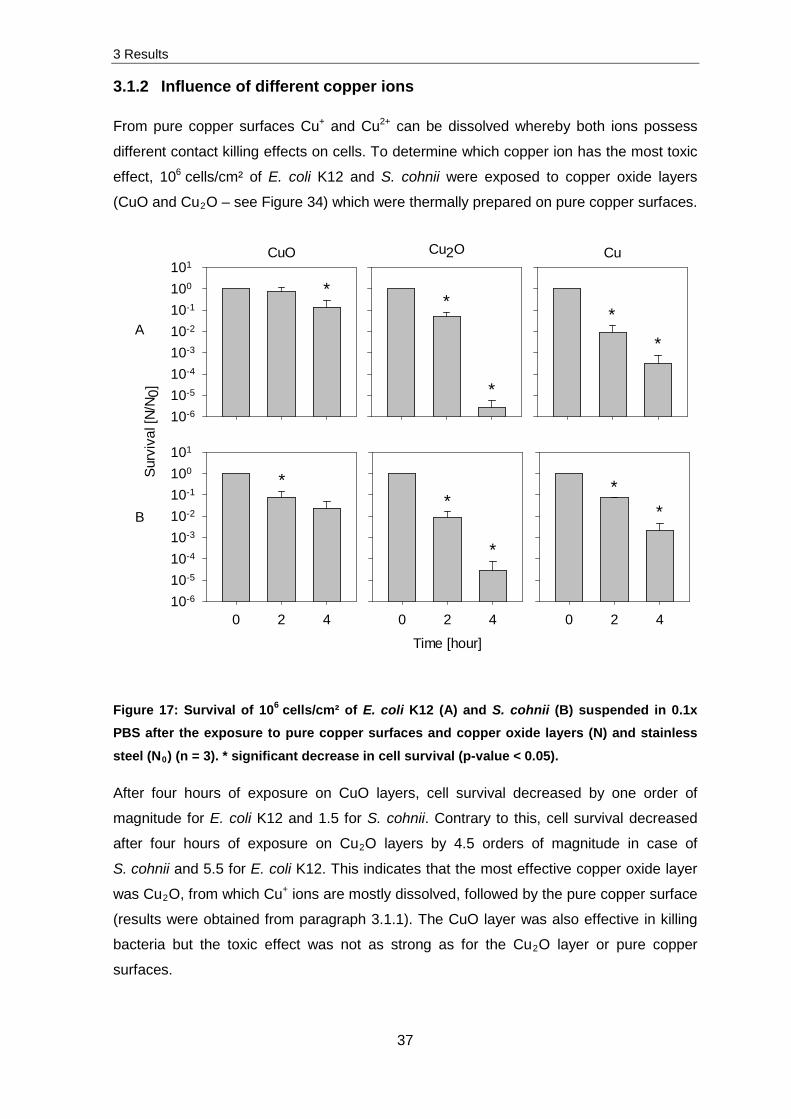
Figure 17: Survival of 106 cells/cm² of E. coli K12 (A) and S. cohnii (B) suspended in 0.1x PBS after the exposure to pure copper surfaces and copper oxide layers (N) and stainless
After four hours of exposure on CuO layers, cell survival decreased by one order of
magnitude for E. coli K12 and 1.5 for S. cohnii. Contrary to this, cell survival decreased
after four hours of exposure on Cu2O layers by 4.5 orders of magnitude in case of
S. cohnii and 5.5 for E. coli K12. This indicates that the most effective copper oxide layer
was Cu2O, from which Cu+ ions are mostly dissolved, followed by the pure copper surface
(results were obtained from paragraph 3.1.1). The CuO layer was also effective in killing
bacteria but the toxic effect was not as strong as for the Cu2O layer or pure copper
surfaces.
3 Results
38
3.1.3 Damaging effects of copper ions on different cellular components
Several experiments related to ROS production, membrane integrity, DNA and RNA
fragmentation were implemented to identify damaging effects caused by copper ions.
Production of reactive oxygen species (ROS)
Intracellular ROS production was monitored by using CellROX green followed by
subsequent flow cytometry. An exposure of 107 E. coli K12 cells/cm² to stainless steel and
pure copper surfaces and analysis of ROS production did not result in significant changes
in ROS production. Therefore the following experiments were conducted with 105 E. coli
K12 cells/cm² exposed to stainless steel and pure copper surfaces. Subsequently, cells
were stained and intracellular ROS production measured.
Figure 18 presents the obtained results for an unstained control in comparison to four
hours stainless steel and pure copper exposed samples. The grey peak presents the
unstained control and by reference to this peak a region of interest was set. Every cell
which was obtained in this region exhibited green fluorescence whereby less than 5 % of
the unstained cells were determined in this region. The four hours on stainless steel
exposed sample (orange peak) displays that a few cells were determined to exhibit green
fluorescence. Thereby, a much higher detection of green fluorescence was obtained for
four hours copper exposed sample (green peak).
3 Results
39
Exposure [hour]
ROS production [%]
Control 0 11
Steel 1 16 4 15
Copper 1 59 2 62 4 58
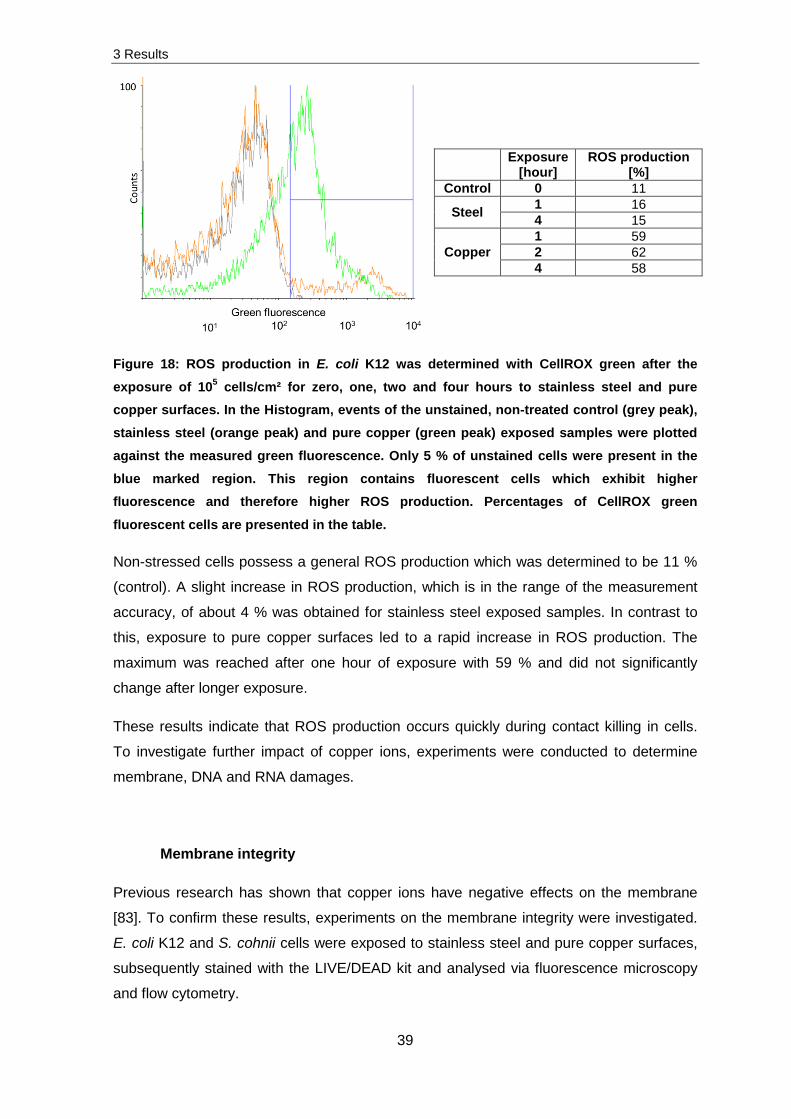
Figure 18: ROS production in E. coli K12 was determined with CellROX green after the exposure of 105 cells/cm² for zero, one, two and four hours to stainless steel and pure copper surfaces. In the Histogram, events of the unstained, non-treated control (grey peak), stainless steel (orange peak) and pure copper (green peak) exposed samples were plotted against the measured green fluorescence. Only 5 % of unstained cells were present in the blue marked region. This region contains fluorescent cells which exhibit higher fluorescence and therefore higher ROS production. Percentages of CellROX green
fluorescent cells are presented in the table.
Non-stressed cells possess a general ROS production which was determined to be 11 %
(control). A slight increase in ROS production, which is in the range of the measurement
accuracy, of about 4 % was obtained for stainless steel exposed samples. In contrast to
this, exposure to pure copper surfaces led to a rapid increase in ROS production. The
maximum was reached after one hour of exposure with 59 % and did not significantly
change after longer exposure.
These results indicate that ROS production occurs quickly during contact killing in cells.
To investigate further impact of copper ions, experiments were conducted to determine
membrane, DNA and RNA damages.
Membrane integrity
Previous research has shown that copper ions have negative effects on the membrane
[83]. To confirm these results, experiments on the membrane integrity were investigated.
E. coli K12 and S. cohnii cells were exposed to stainless steel and pure copper surfaces,
subsequently stained with the LIVE/DEAD kit and analysed via fluorescence microscopy
and flow cytometry.
3 Results
40
For the visualization of membrane damage, the LIVE/DEAD kit contains two different
staining dyes. The green dye (Syto9) stains all cells whereas the red dye (propidium
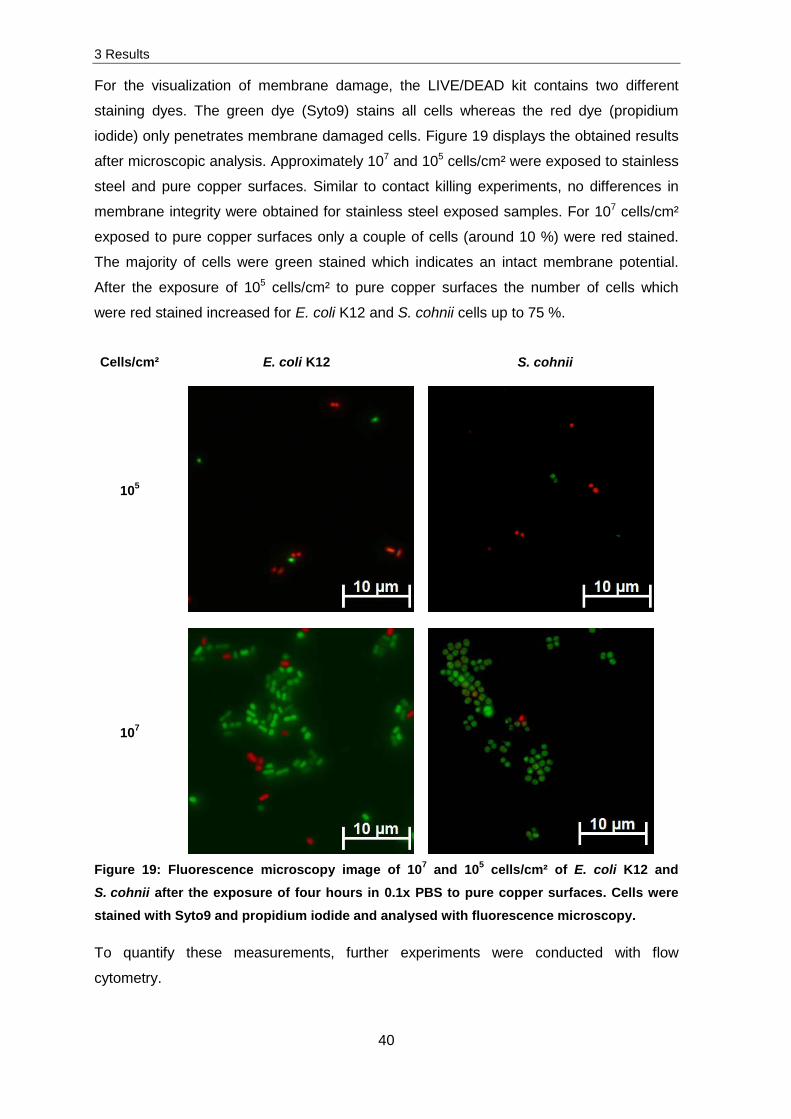
iodide) only penetrates membrane damaged cells. Figure 19 displays the obtained results
after microscopic analysis. Approximately 107 and 105 cells/cm² were exposed to stainless
steel and pure copper surfaces. Similar to contact killing experiments, no differences in
membrane integrity were obtained for stainless steel exposed samples. For 107 cells/cm²
exposed to pure copper surfaces only a couple of cells (around 10 %) were red stained.
The majority of cells were green stained which indicates an intact membrane potential.
After the exposure of 105 cells/cm² to pure copper surfaces the number of cells which
were red stained increased for E. coli K12 and S. cohnii cells up to 75 %.
Cells/cm² E. coli K12 S. cohnii
105
107
Figure 19: Fluorescence microscopy image of 107 and 105 cells/cm² of E. coli K12 and S. cohnii after the exposure of four hours in 0.1x PBS to pure copper surfaces. Cells were stained with Syto9 and propidium iodide and analysed with fluorescence microscopy.
To quantify these measurements, further experiments were conducted with flow
cytometry.
3 Results
41
Similar to the ROS experiments, an exposure and analysis of 107 E. coli K12 cells/cm² did
not result in significant changes of the membrane integrity. Therefore investigations were
performed with 105 cells/cm² exposed to stainless steel and pure copper surfaces. The
samples were subsequently LIVE/DEAD stained and analysed with flow cytometry as
previously described in paragraph 2.10.3.
After the classification of the regions of interest, the surface exposed samples were
measured and the obtained results listed in Table 2. Here, only green and the sum of red
and orange fluorescent cells are listed and named as injured. The reason for this is
explained by the results obtained in Figure 11. After the control measurements, it became
obvious that a double staining of maximally (one hour treated with 30 % H2O2) stressed
cells led to orange fluorescent cells. This was attributed to the existence of both dyes in
cells which possess membrane damage. The regions of interest were modified depending
on each single experiment; therefore the results vary by a few percent.
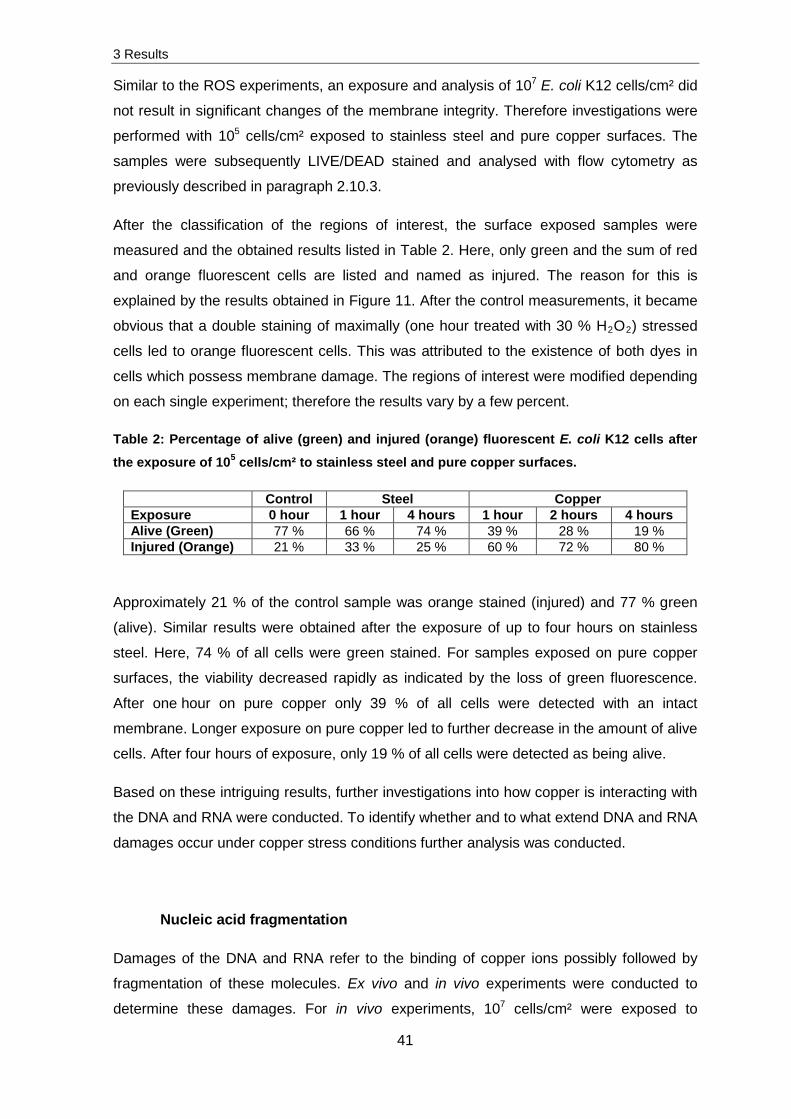
Table 2: Percentage of alive (green) and injured (orange) fluorescent E. coli K12 cells after
the exposure of 105 cells/cm² to stainless steel and pure copper surfaces.
Approximately 21 % of the control sample was orange stained (injured) and 77 % green
(alive). Similar results were obtained after the exposure of up to four hours on stainless
steel. Here, 74 % of all cells were green stained. For samples exposed on pure copper
surfaces, the viability decreased rapidly as indicated by the loss of green fluorescence.
After one hour on pure copper only 39 % of all cells were detected with an intact
membrane. Longer exposure on pure copper led to further decrease in the amount of alive
cells. After four hours of exposure, only 19 % of all cells were detected as being alive.
Based on these intriguing results, further investigations into how copper is interacting with
the DNA and RNA were conducted. To identify whether and to what extend DNA and RNA
damages occur under copper stress conditions further analysis was conducted.
Nucleic acid fragmentation
Damages of the DNA and RNA refer to the binding of copper ions possibly followed by
fragmentation of these molecules. Ex vivo and in vivo experiments were conducted to
determine these damages. For in vivo experiments, 107 cells/cm² were exposed to
3 Results
42
stainless steel and pure copper surfaces and subsequently genomic DNA and total RNA
were isolated. The final amount of exposed, isolated DNA was 1800 ng and in case of
RNA 5000 ng was exposed. For ex vivo analysis, the genomic DNA and total RNA were
isolated and 15 µl DNA (540 ng) and RNA (2500 ng) solution was exposed to 0.12 cm².
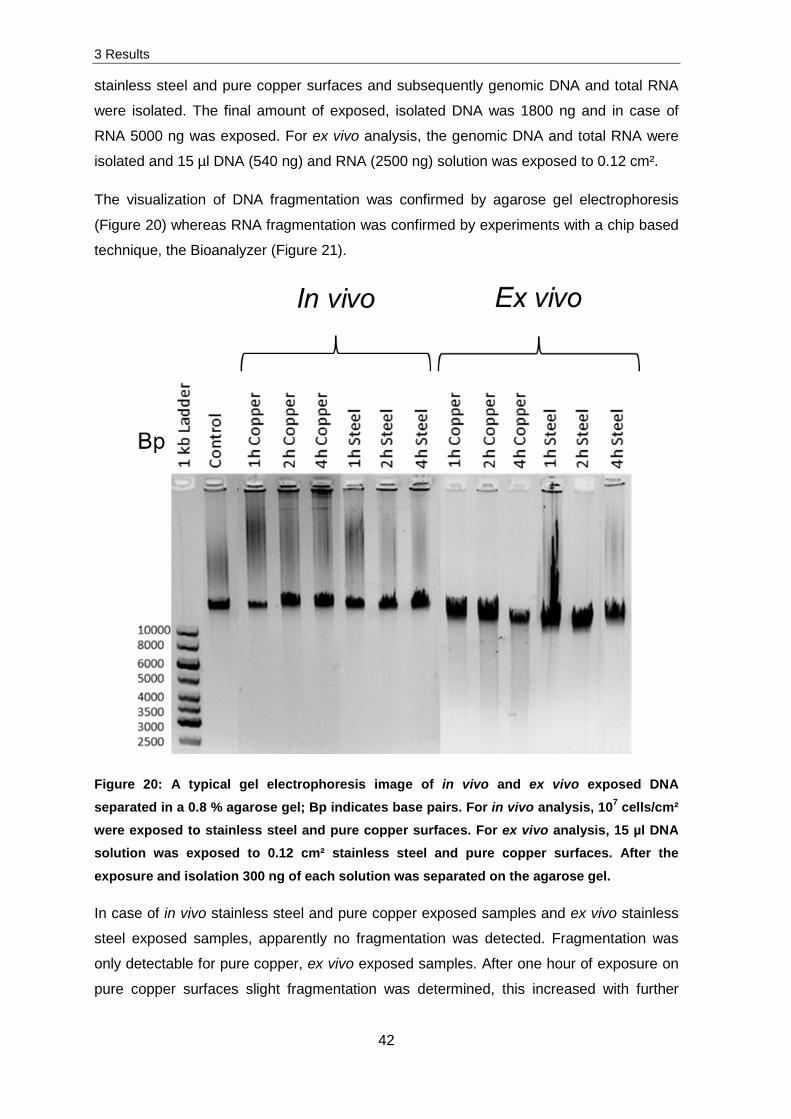
The visualization of DNA fragmentation was confirmed by agarose gel electrophoresis
(Figure 20) whereas RNA fragmentation was confirmed by experiments with a chip based
technique, the Bioanalyzer (Figure 21).
Figure 20: A typical gel electrophoresis image of in vivo and ex vivo exposed DNA separated in a 0.8 % agarose gel; Bp indicates base pairs. For in vivo analysis, 107 cells/cm² were exposed to stainless steel and pure copper surfaces. For ex vivo analysis, 15 µl DNA solution was exposed to 0.12 cm² stainless steel and pure copper surfaces. After the
exposure and isolation 300 ng of each solution was separated on the agarose gel.
In case of in vivo stainless steel and pure copper exposed samples and ex vivo stainless
steel exposed samples, apparently no fragmentation was detected. Fragmentation was
only detectable for pure copper, ex vivo exposed samples. After one hour of exposure on
pure copper surfaces slight fragmentation was determined, this increased with further
3 Results
43
exposure times. Following these experiments, in vivo and ex vivo exposure of RNA on
stainless steel and pure copper surfaces were conducted.
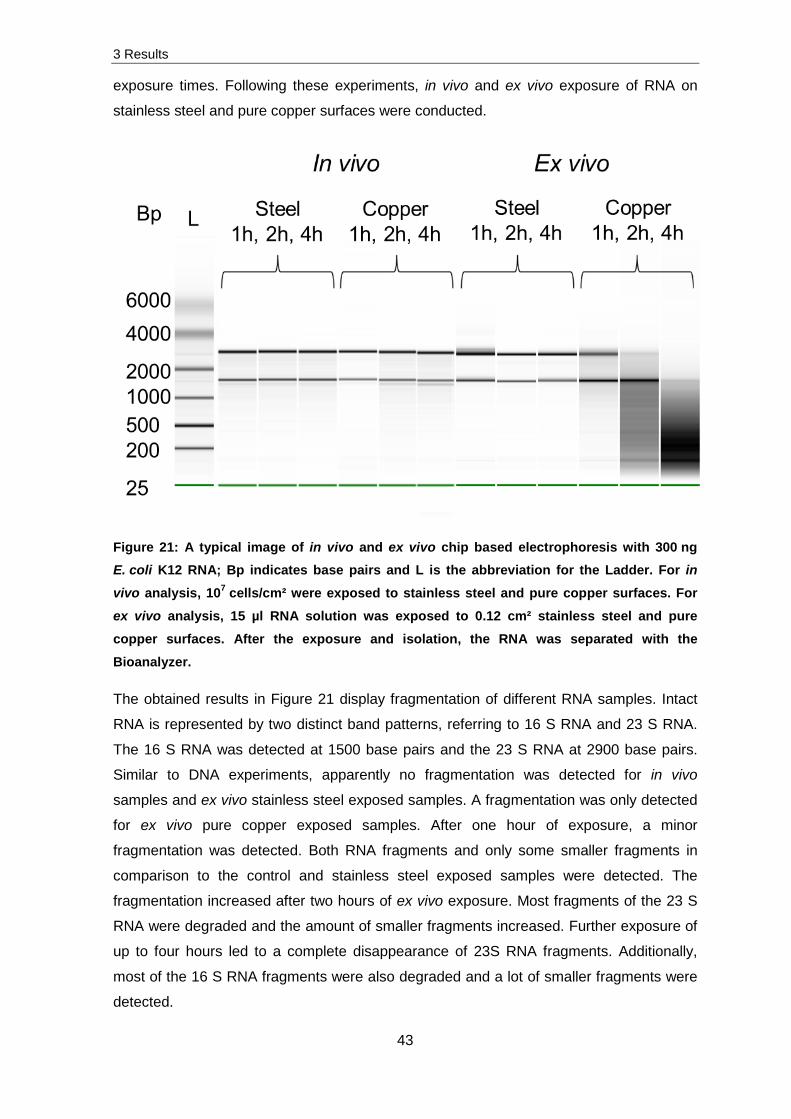
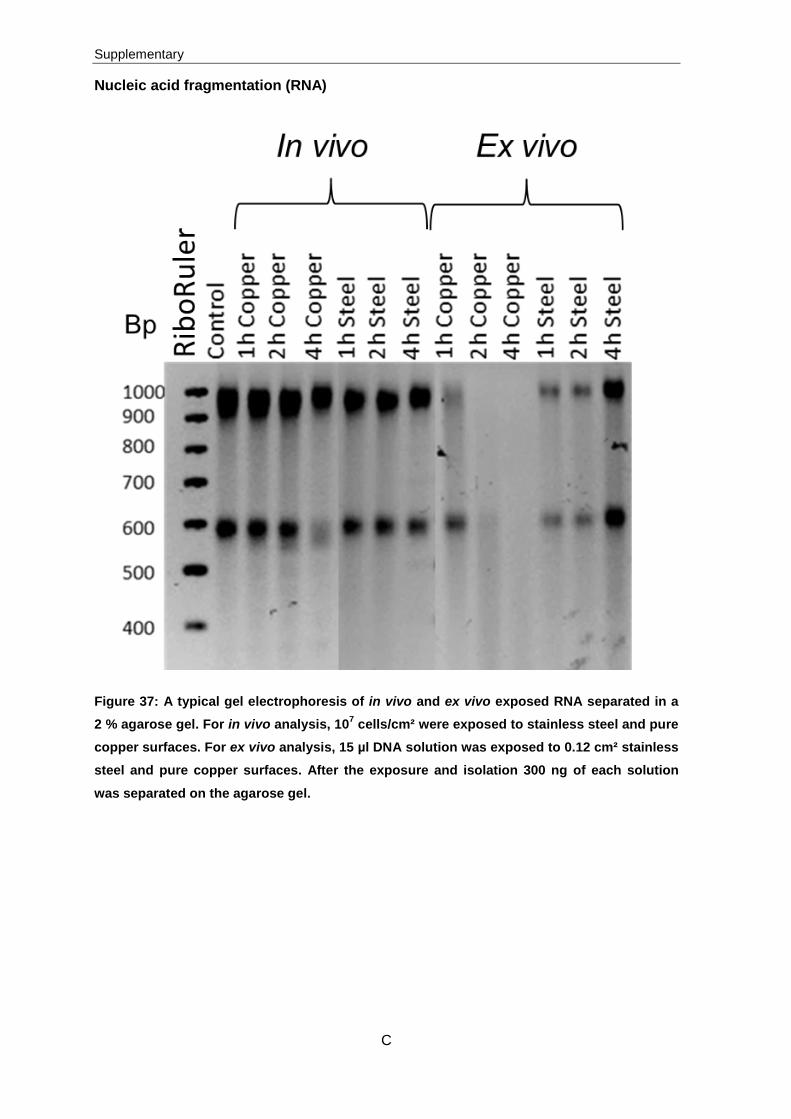
Figure 21: A typical image of in vivo and ex vivo chip based electrophoresis with 300 ng E. coli K12 RNA; Bp indicates base pairs and L is the abbreviation for the Ladder. For in vivo analysis, 107 cells/cm² were exposed to stainless steel and pure copper surfaces. For ex vivo analysis, 15 µl RNA solution was exposed to 0.12 cm² stainless steel and pure copper surfaces. After the exposure and isolation, the RNA was separated with the Bioanalyzer.
The obtained results in Figure 21 display fragmentation of different RNA samples. Intact
RNA is represented by two distinct band patterns, referring to 16 S RNA and 23 S RNA.
The 16 S RNA was detected at 1500 base pairs and the 23 S RNA at 2900 base pairs.
Similar to DNA experiments, apparently no fragmentation was detected for in vivo
samples and ex vivo stainless steel exposed samples. A fragmentation was only detected
for ex vivo pure copper exposed samples. After one hour of exposure, a minor
fragmentation was detected. Both RNA fragments and only some smaller fragments in
comparison to the control and stainless steel exposed samples were detected. The
fragmentation increased after two hours of ex vivo exposure. Most fragments of the 23 S
RNA were degraded and the amount of smaller fragments increased. Further exposure of
up to four hours led to a complete disappearance of 23S RNA fragments. Additionally,
most of the 16 S RNA fragments were also degraded and a lot of smaller fragments were
detected.
3 Results
44
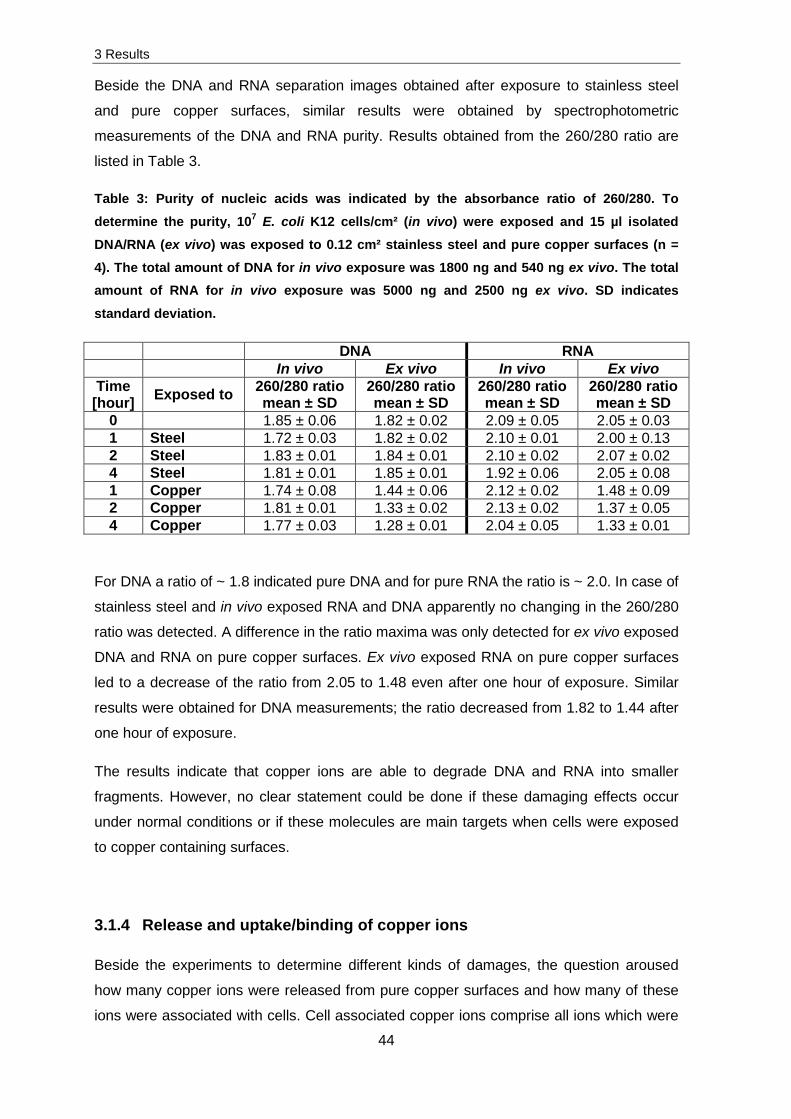
Beside the DNA and RNA separation images obtained after exposure to stainless steel
and pure copper surfaces, similar results were obtained by spectrophotometric
measurements of the DNA and RNA purity. Results obtained from the 260/280 ratio are
listed in Table 3.
Table 3: Purity of nucleic acids was indicated by the absorbance ratio of 260/280. To determine the purity, 107 E. coli K12 cells/cm² (in vivo) were exposed and 15 µl isolated DNA/RNA (ex vivo) was exposed to 0.12 cm² stainless steel and pure copper surfaces (n = 4). The total amount of DNA for in vivo exposure was 1800 ng and 540 ng ex vivo. The total amount of RNA for in vivo exposure was 5000 ng and 2500 ng ex vivo. SD indicates
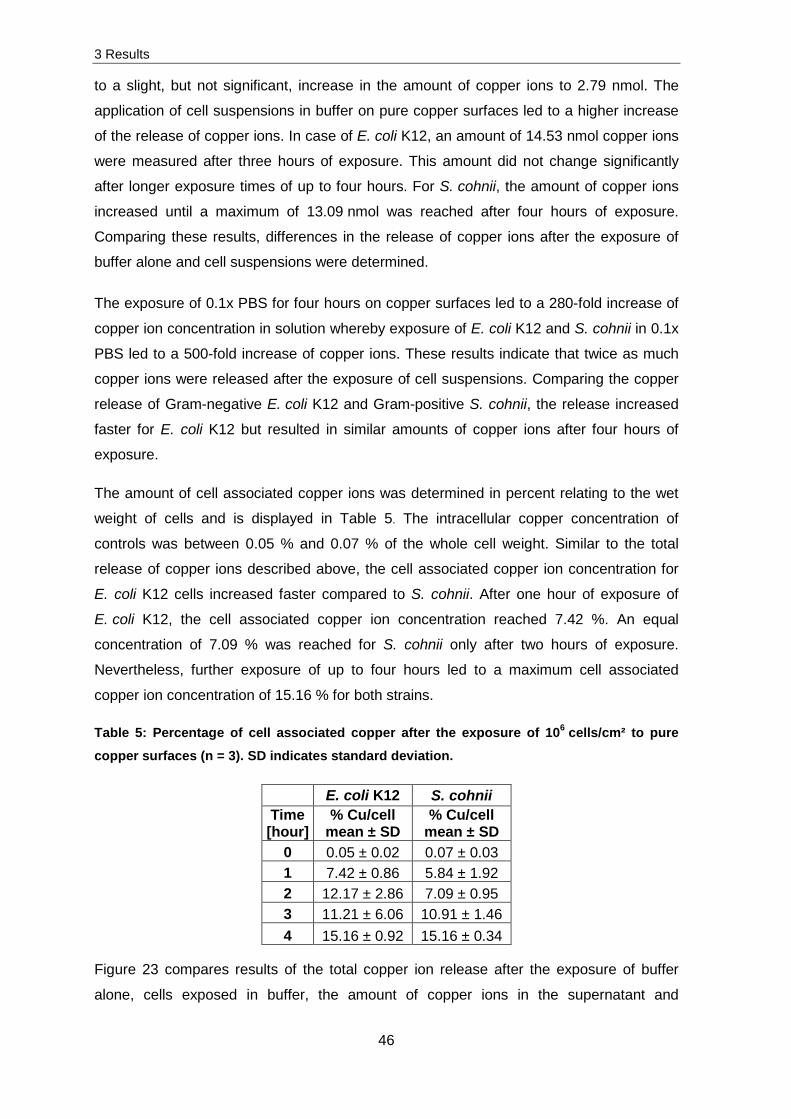
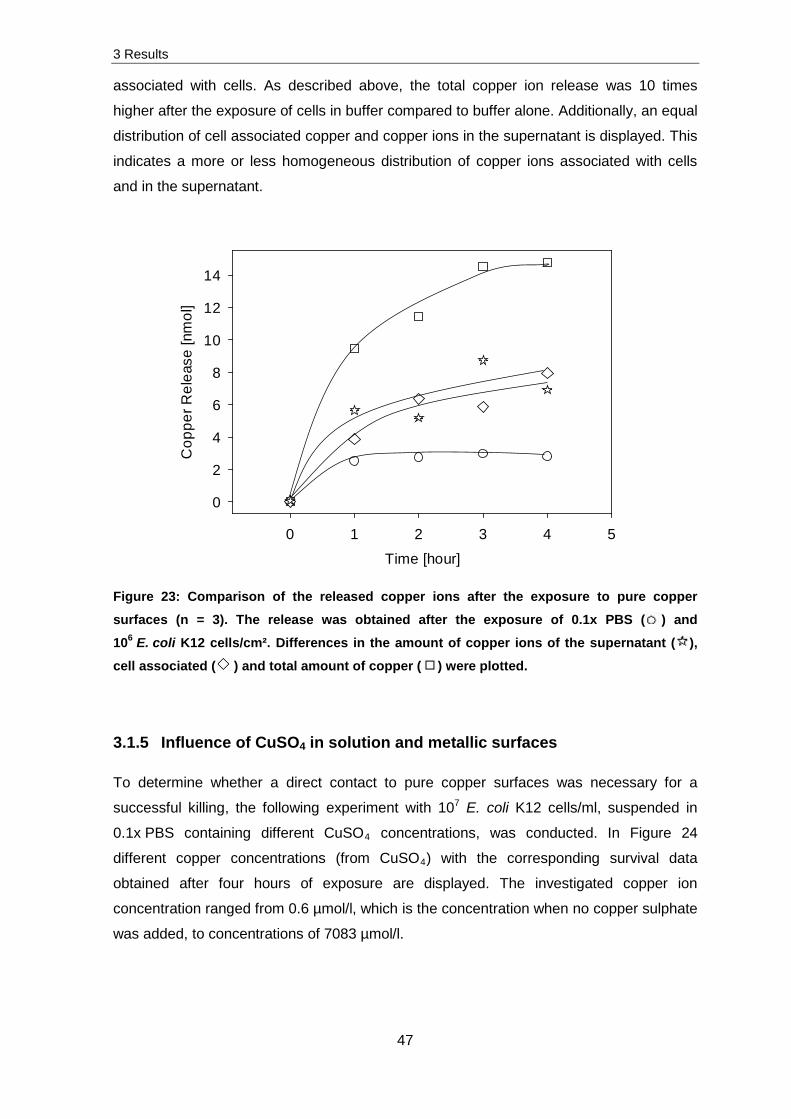
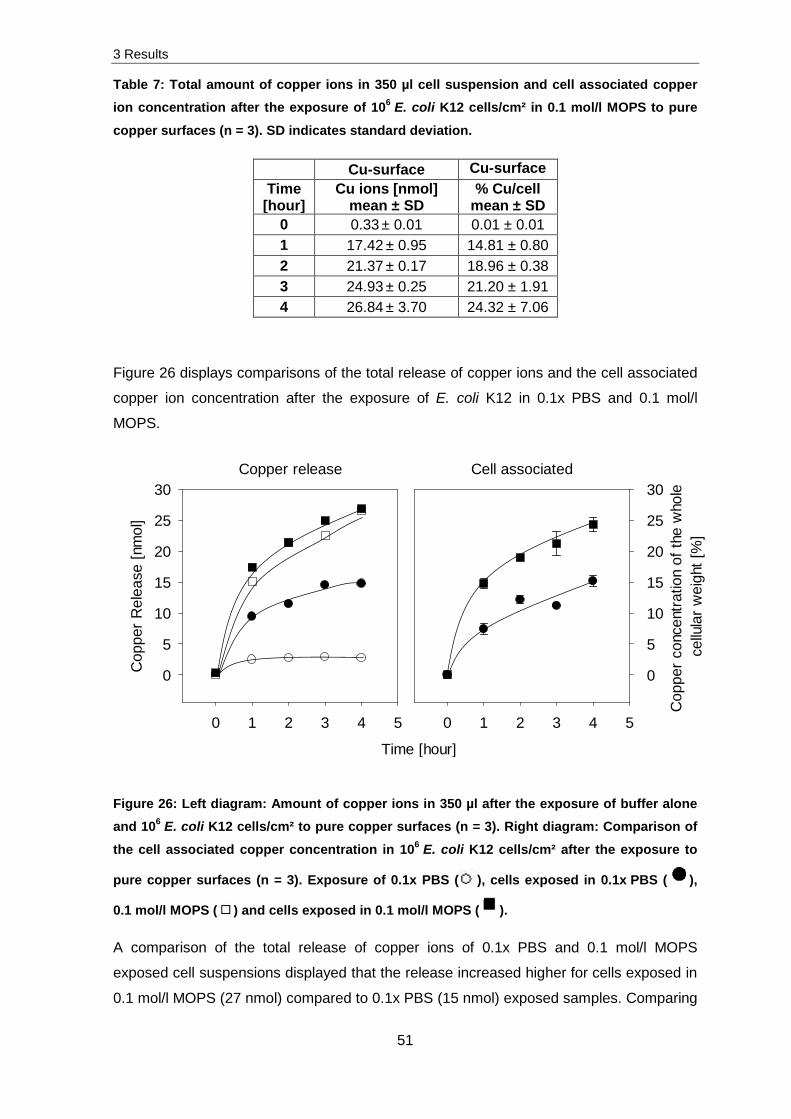
Figure 23 compares results of the total copper ion release after the exposure of buffer
alone, cells exposed in buffer, the amount of copper ions in the supernatant and
3 Results
47
associated with cells. As described above, the total copper ion release was 10 times
higher after the exposure of cells in buffer compared to buffer alone. Additionally, an equal
distribution of cell associated copper and copper ions in the supernatant is displayed. This
indicates a more or less homogeneous distribution of copper ions associated with cells
and in the supernatant.
Time [hour]
0 1 2 3 4 5
Cop
per R
elea
se [n
mol
]
0
2
4
6
8
10
12
14
Figure 23: Comparison of the released copper ions after the exposure to pure copper
surfaces (n = 3). The release was obtained after the exposure of 0.1x PBS ( ) and
106 E. coli K12 cells/cm². Differences in the amount of copper ions of the supernatant ( ),
cell associated ( ) and total amount of copper ( ) were plotted.
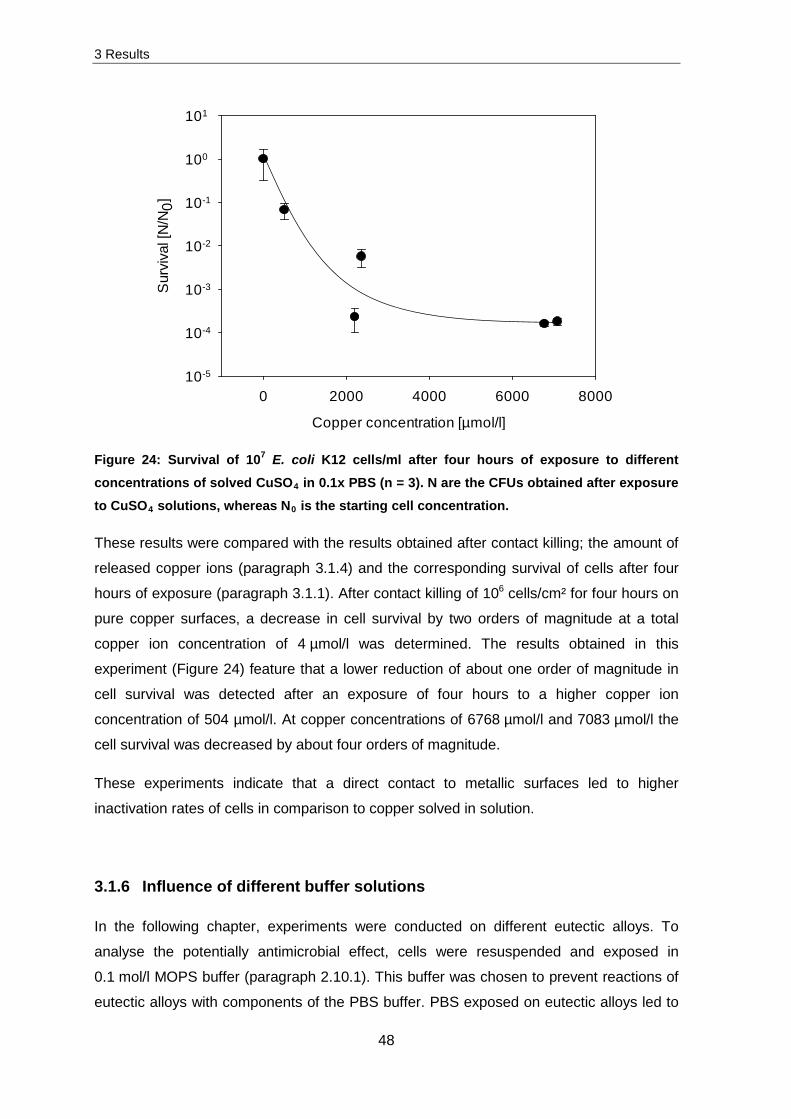
3.1.5 Influence of CuSO4 in solution and metallic surfaces
To determine whether a direct contact to pure copper surfaces was necessary for a
successful killing, the following experiment with 107 E. coli K12 cells/ml, suspended in
0.1x PBS containing different CuSO4 concentrations, was conducted. In Figure 24
different copper concentrations (from CuSO4) with the corresponding survival data
obtained after four hours of exposure are displayed. The investigated copper ion
concentration ranged from 0.6 µmol/l, which is the concentration when no copper sulphate
was added, to concentrations of 7083 µmol/l.
3 Results
48
Copper concentration [µmol/l]
0 2000 4000 6000 8000
Sur
viva
l [N
/N0]
10-5
10-4
10-3
10-2
10-1
100
101
Figure 24: Survival of 107 E. coli K12 cells/ml after four hours of exposure to different concentrations of solved CuSO4 in 0.1x PBS (n = 3). N are the CFUs obtained after exposure to CuSO4 solutions, whereas N0 is the starting cell concentration.
These results were compared with the results obtained after contact killing; the amount of
released copper ions (paragraph 3.1.4) and the corresponding survival of cells after four
hours of exposure (paragraph 3.1.1). After contact killing of 106 cells/cm² for four hours on
pure copper surfaces, a decrease in cell survival by two orders of magnitude at a total
copper ion concentration of 4 µmol/l was determined. The results obtained in this
experiment (Figure 24) feature that a lower reduction of about one order of magnitude in
cell survival was detected after an exposure of four hours to a higher copper ion
concentration of 504 µmol/l. At copper concentrations of 6768 µmol/l and 7083 µmol/l the
cell survival was decreased by about four orders of magnitude.
These experiments indicate that a direct contact to metallic surfaces led to higher
inactivation rates of cells in comparison to copper solved in solution.
3.1.6 Influence of different buffer solutions
In the following chapter, experiments were conducted on different eutectic alloys. To
analyse the potentially antimicrobial effect, cells were resuspended and exposed in
0.1 mol/l MOPS buffer (paragraph 2.10.1). This buffer was chosen to prevent reactions of
eutectic alloys with components of the PBS buffer. PBS exposed on eutectic alloys led to
3 Results
49
a quick reaction whereby an insoluble salt and a gas were produced. Analysis of the salt
with SEM followed by an EDX measurement led to the following distribution of elements.
Table 6: Distribution of measured elements from the insoluble salt.
Chemical Element Al P O Na Cl K Mean ± SD
Distribution [%] 16.12 ± 1.39
7.19 ± 1.79
68.43 ± 2.33
5.64 ± 1.20
1.21 ± 0.30
1.43 ± 0.45
The majority of elements was represented by oxygen with 68.43 %, followed by aluminium
(1.21 %). The distribution of these elements could indicate which element was dissolved
and which salt could have been formed.
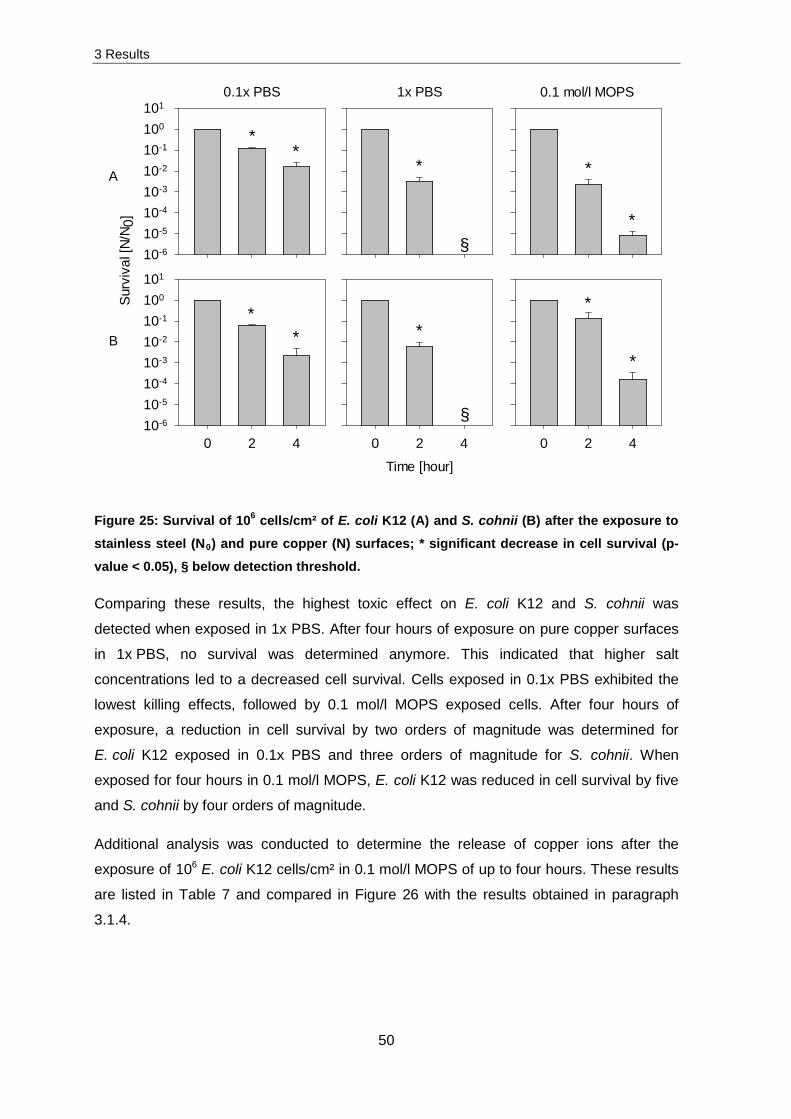
To ensure the comparability of the previously obtained results in 0.1x PBS and the
following results in 0.1 mol/l MOPS, additional contact killing analysis on pure copper
surfaces with cells resuspended in 0.1x PBS and 0.1 mol/l MOPS was conducted. Further
on, cells were exposed in 1x PBS to determine the effect of different salt concentrations
on antimicrobial pure copper surfaces. The obtained results after the exposure of
106 cells/cm² of E. coli K12 and S. cohnii to stainless steel (N0) and pure copper (N)
surfaces are displayed in Figure 25.
3 Results
50
0.1x PBS
Surv
ival
[N/N
0]
10-6
10-5
10-4
10-3
10-2
10-1
100
1011x PBS
§
0.1 mol/l MOPS
A
B
0 2 410-6
10-5
10-4
10-3
10-2
10-1
100
101
Time [hour]
0 2 4 0 2 4
**
*
§
*
*
*
*
**
*
Figure 25: Survival of 106 cells/cm² of E. coli K12 (A) and S. cohnii (B) after the exposure to stainless steel (N0) and pure copper (N) surfaces; * significant decrease in cell survival (p-value < 0.05), § below detection threshold.
Comparing these results, the highest toxic effect on E. coli K12 and S. cohnii was
detected when exposed in 1x PBS. After four hours of exposure on pure copper surfaces
in 1x PBS, no survival was determined anymore. This indicated that higher salt
concentrations led to a decreased cell survival. Cells exposed in 0.1x PBS exhibited the
lowest killing effects, followed by 0.1 mol/l MOPS exposed cells. After four hours of
exposure, a reduction in cell survival by two orders of magnitude was determined for
E. coli K12 exposed in 0.1x PBS and three orders of magnitude for S. cohnii. When
exposed for four hours in 0.1 mol/l MOPS, E. coli K12 was reduced in cell survival by five
and S. cohnii by four orders of magnitude.
Additional analysis was conducted to determine the release of copper ions after the
exposure of 106 E. coli K12 cells/cm² in 0.1 mol/l MOPS of up to four hours. These results
are listed in Table 7 and compared in Figure 26 with the results obtained in paragraph
3.1.4.
3 Results
51
Table 7: Total amount of copper ions in 350 µl cell suspension and cell associated copper ion concentration after the exposure of 106 E. coli K12 cells/cm² in 0.1 mol/l MOPS to pure
copper surfaces (n = 3). SD indicates standard deviation.
Figure 26 displays comparisons of the total release of copper ions and the cell associated
copper ion concentration after the exposure of E. coli K12 in 0.1x PBS and 0.1 mol/l
MOPS.
Copper release
0 1 2 3 4 5
Cop
per R
elea
se [n
mol
]
0
5
10
15
20
25
30Cell associated
Time [hour]
0 1 2 3 4 5
Cop
per c
once
ntra
tion
of th
e w
hole
ce
llula
r wei
ght [
%]
0
5
10
15
20
25
30
Figure 26: Left diagram: Amount of copper ions in 350 µl after the exposure of buffer alone and 106 E. coli K12 cells/cm² to pure copper surfaces (n = 3). Right diagram: Comparison of the cell associated copper concentration in 106 E. coli K12 cells/cm² after the exposure to
pure copper surfaces (n = 3). Exposure of 0.1x PBS ( ), cells exposed in 0.1x PBS ( ),
0.1 mol/l MOPS ( ) and cells exposed in 0.1 mol/l MOPS ( ).
A comparison of the total release of copper ions of 0.1x PBS and 0.1 mol/l MOPS
exposed cell suspensions displayed that the release increased higher for cells exposed in
the exposure of 0.1x PBS alone and cells suspended in 0.1x PBS, the release of copper
ions was 10 times higher for exposed cells. In contrast to this, no significant difference in
the release of copper ions was detected after the exposure of 0.1 mol/l MOPS buffer
alone and cells suspended in 0.1 mol/l MOPS buffer. Additionally, the final cell associated
copper concentration was compared. In case of 0.1 mol/l MOPS exposed samples,
24.3 % and for 0.1x PBS exposed samples 15.2 % of the whole cellular weight was
composed of cell associated copper ions.
These results are comparable to the contact killing experiments described above. An
exposure of cells in 0.1 mol/l MOPS resulted in less cell survival and additionally a higher
release and cell associated copper ion concentration. Therefore, the following
experiments were conducted with cells exposed in 0.1 mol/l MOPS on eutectic alloys,
stainless steel and pure copper surfaces.
Summary for pure copper exposed samples
Summarizing this chapter, the results indicate that pure copper surfaces possess similar
antimicrobial effects on both Gram-positive and Gram-negative strains, respectively.
Furthermore, Cu+ and Cu2+ ions are released from pure copper surfaces while the most
toxic effect was obtained by Cu+. Considering damaging effects, ROS production and
membrane damage was determined after the exposure of 105 cells/cm² but not at cell
concentrations of 107 cells/cm². These concentrations confirmed results obtained by SEM
analysis to possess a monolayer of cells.
Further experiments indicated that copper ions were released from pure copper surfaces
whereas the amount of released copper ions was 10 times higher when cells were
exposed compared to buffer alone. Additionally, the effect of different buffer solutions was
determined by reference to cell survival and the release of copper ions. These results
revealed a higher decrease in cell survival and release of ions in case of 0.1 mol/l MOPS
exposed samples compared to 0.1x PBS exposed samples.
3 Results
53
3.2 Contact killing on eutectic alloys
3.2.1 Survival efficiency
After the exposure of 105 and 106 cells/cm², the antimicrobial effect of the “fast” casted
eutectic alloys (paragraph 2.4) and additionally stainless steel and pure copper surfaces
was examined. Therefore, the survival and metabolic activity (paragraph 3.2.2) was
determined. Figure 27 presents the obtained survival data after contact killing experiments
were performed.
A
B
Steel
CFU
[N/N
0]
100101102103104105106107 Al Al-Cu Al-Ag Al-Ag-Cu Cu
**
0 1 4 6100101102103104105106107108
0 1 4 6Time [hour]
0 1 4 6 0 1 4 6 0 1 4 6 0 1 4 6
§
§ §
*
*
****
Figure 27: Contact killing of 105 (A) and 106 (B) E. coli K12 cells/cm² in 0.1 mol/l MOPS (n = 3). CFU obtained after the exposure to stainless steel, Al, Al-Cu, Al-Ag, Al-Ag-Cu and pure copper surfaces (N) were divided by the obtained CFU before exposure (N0); * significant
The exposure of 106 E. coli K12 cells/cm² on eutectic alloys did not result in significant
differences in cell survival. The only reduction in cell survival was determined for pure
copper exposed samples. After four hours of exposure a decrease by 5.5 orders of
magnitude and a complete reduction after six hours was detected. The investigation of
105 E. coli K12 cells/cm² led to higher decrease in cell survival. After four and six hours of
exposure to pure copper surfaces, no survival of cells was examined. Additionally, an
exposure of six hours on Al-Ag and Al-Ag-Cu surfaces led to a decrease in cell survival by
one order of magnitude. The investigated materials seem to possess only slight or no
antimicrobial effect. Therefore, further experiments were conducted to determine the
3 Results
54
metabolic effect of the exposed samples. A decrease in the metabolic activity could
indicate possible and even slight antimicrobial effects.
3.2.2 Influence on metabolic activity
The obtained survival data were supported by measurements of the metabolic activity.
Exposed samples were incubated in medium (stained with Alamar Blue) and analysed
spectrophotometrically. Cells with an active metabolism produce NADH and FADH which
reduces Alamar Blue (resazurin) to the pink resofurin (paragraph 2.10.2). This shift can be
displayed photographically (Figure 28) or monitored at 570 nm and 600 nm (Figure 29 and
Table 8).
Incubation [hour] cells
/ cm²
Exposure [hour]
4 6 16
A B C D E F A B C D E F A B C D E F
105
1
4
6
106
1
4
6
Figure 28: The metabolic activity of 105 and 106 E. coli K12 cells/cm² is displayed by photographic images. Cells were exposed for one, four and six hours and subsequently incubated for up to 16 hours in medium which contained Alamar Blue. After four, six and 16 hours images were taken. Exposure on: A: Al; B: stainless steel; C: Al-Cu; D: Al-Ag;
E: Al-Ag-Cu; F: pure copper.
3 Results
55
The obtained relative OD600 results for E. coli K12 are presented in Figure 29.
Figure 29: The metabolic activity was determined by measuring the decrease of the absorption at OD600. Approximately, 105 (a) and 106 (b) E. coli K12 cells/cm² in 0.1 mol/l MOPS were exposed to Al: Black, stainless steel:Dk Red, Al-Cu: Dk Green, Al-Ag: Blue, Al-
Ag-Cu: Pink and pure copper: Red.
3 Results
56
Table 8 summarizes the time when 50 % of resazurin was reduced to resofurin.
Table 8: Halftime of the reduction of resazurin to resofurin after the exposure of 105 and 106 E. coli K12 cells/cm² to different surfaces. Cells were exposed for one, four and six hours
and subsequently incubated for up to 16 hours in medium containing Alamar Blue.
Exposure [hour] Material
105 cells/cm² Reduction50
[hour]
106 cells/cm² Reduction50
[hour]
1
St
3.8 1.9 Al Al-Cu Al-Ag Al-Ag-Cu Cu 6.5 4.5
4
St 4 2 Al
Al-Cu Al-Ag 7.8 2.2 Al-Ag-Cu 6 Cu - -
6
St 4 2 Al
Al-Cu Al-Ag 9 3.5 Al-Ag-Cu 7.8 3 Cu - -
Samples were exposed on potentially antimicrobial materials for one, four and six hours
and incubated for 16 hours in medium stained with Alamar Blue to determine the
metabolic activity. In case of stainless steel (control), Al (control) and Al-Cu exposed
samples no inhibition of the metabolic activity was examined. The blue dye was reduced
by 50 % after 3.8 hours of incubation when 105 cells/cm² were exposed and after
1.9 hours when 106 cells/cm² were exposed. This indicated that higher cell concentrations
possess higher metabolic activity.
Exposure of 106 cells/cm² for one, four and six hours to Al-Ag and Al-Ag-Cu alloys did not
result in significant decreases of the metabolic activity, compared to control samples.
Whereby, a decrease in cell concentration of 105 cells/cm² exposed for four and six hours
to Al-Ag and Al-Ag-Cu alloys led to a reduced metabolic activity. After the exposure for
four hours to Al-Ag-Cu, the blue dye was reduced by 50 % within six hours and within 7.8
hours after the exposure of six hours to Al-Ag-Cu. In case of four hours Al-Ag exposed
samples, the blue dye was reduced by 50 % after 7.8 hours of incubation and within nine
hours after the exposure of six hours to Al-Ag. These results indicate that Al-Ag and Al-
Ag-Cu alloys possess slight antimicrobial activities which were not significant by
comparison of the survival of cells.
3 Results
57
Exposure on pure copper surfaces led to the highest reduction in cell metabolism. After
one hour of exposure of 105 cells/cm², 50 % of the blue dye was reduced after 6.5 hours
and for 106 cells/cm² after 4.5 hours of incubation. Equal to the results obtained by the
survival measurements, no reduction and therefore no metabolism was determined for
samples which were exposed for four and six hours to pure copper surfaces.
3.2.3 Release of aluminium, copper and silver ions
As previously determined, the antimicrobial effect of the chosen eutectic alloys was
negligible. To ascertain if this effect is caused by the release of ions from the materials,
concentrations of free aluminium, copper and silver ions were determined. Therefore cell
suspensions were exposed for several time points on materials with a subsequent ICP-
MS analysis. The obtained results were summarized in Table 9 and Table 10.
Table 9 presents the obtained data of aluminium release.
Table 9: Total amount of aluminium ions in 350 µl suspension (106 E. coli K12 cells/cm² in 0.1 mol/l MOPS) after the exposure to Al, Al-Cu, Al-Ag and Al-Ag-Cu surfaces. SD indicates
Comparing all materials, the aluminium release increased significantly after four hours of
exposure. This increase was four-fold in case of Al-Cu alloys, five-fold for Al and Al-Ag-Cu
alloys and eight-fold for Al-Ag alloys.
3 Results
58
Equal results were received for the determination of the released copper and silver ions
(Table 10).
Table 10: Total amount of copper and silver ions in 350 µl suspension (106 E. coli K12 cells/cm² in 0.1 mol/l MOPS) after the exposure to Al-Ag and Al-Ag-Cu surfaces. SD
At a concentration of 5 mmol/l CuSO4, cell growth of the wildtype was not inhibited,
whereas this concentration was sufficient to prevent cell growth of E. coli ΔcopA, ΔcueO,
ΔcueR, ΔcutA, and ΔrecA. Further on, in another experiment cells were grown in 1.6 ml
medium (with and without CuSO4) and the OD determined after 23, 48 and 116 hours.
Similar to the results of Figure 30, the five selected strains were highly sensitive to CuSO4
3 Results
60
in medium. The OD600 value at a CuSO4 concentration of 4 mmol/l after 48 hours of
incubation was under 0.4 (Table 11), except for ΔcueR. This strain was additionally
selected due to the reason that the gene is responsible for the expression of CopA and
CueO.
Table 11: OD600 values of selected strains of the Keio collection after the incubation of up to 116 hours in copper containing medium. Green highlighted values indicate cell growth, a decrease of green highlighted values to red highlighted values indicate inhibition of cell
growth (red: no growth).
3.3.2 Survival efficiency
Cell survival after the exposure to potentially antimicrobial surfaces was determined for
the five selected strains. These strains were either resuspended in 0.1x PBS and exposed
to stainless steel and pure copper surfaces for up to four hours or in 0.1 mol/l MOPS and
exposed on the “fast” casted eutectic alloys, stainless steel and pure copper surfaces for
four hours. As described in paragraph 2.10.1, 106 cells/cm² were exposed and analysed
subsequently.
3 Results
61
Contact killing experiments in 0.1x PBS
The obtained results after exposure to stainless steel and pure copper surfaces are
presented in Figure 31.
0 2 4
Sur
viva
l [N
/N0]
10-5
10-4
10-3
10-2
10-1
100
101
0 2 4 0 2 4 0 2 4Time [hour]
0 2 4 0 2 4
a b c d e f
*
* *
Figure 31: Survival of 106 cells/cm² of selected strains from the Keio collection exposed in 0.1x PBS to stainless steel (N0) and pure copper (N) surfaces (n = 3). a: Wildtype, b: ΔcutA, c: ΔcueR, d: ΔcueO, e: ΔcopA and f: ΔrecA, * significant differences in cell survival in
comparison to the wildtype (p-value < 0.05).
By comparing the obtained results of the Keio wildtype to the contact killing results of
E. coli K12 in paragraph 3.1.1, equal results were obtained after four hours of exposure.
Both strains exhibited a decrease in cell survival by two orders of magnitude. The Keio
wildtype, ΔcopA and ΔrecA strains were the most resistant strains. Their cell survival
decreased by two orders of magnitude after four hours of exposure. The most sensitive
strains were ΔcueO and ΔcueR with a decrease in cell survival by 4.2 orders of magnitude
after four hours of exposure. Cell survival of the ΔcutA strain decreased by 2.8 orders of
magnitude and was therefore more sensitive than the wildtype but also more resistant
compared to strains of ΔcueO and ΔcueR. Summarizing all obtained results a decreasing
order of cell survival can be established. The most resistant strains were the Keio
wildtype, ΔcopA and ΔrecA > ΔcutA > ΔcueR = ΔcueO.
Contact killing experiments in 0.1 mol/l MOPS
Figure 32 displays survival of the selected strains from the Keio collection after contact
killing on potentially antimicrobial materials. As previously described in paragraph 3.1.6,
different release of ions was determined after the exposure of cells in 0.1x PBS or
0.1 mol/l MOPS buffer. Therefore, differences in cell survival were assumed between
Figure 31 and Figure 32.
3 Results
62
Steel
10-510-410-310-210-1100101
Al Al-Cu Al-Ag Al-Ag-Cu Cu
§
10-510-410-310-210-1100101
§
Surv
ival
[N/N
0]
10-510-410-310-210-1100101
§
10-510-410-310-210-1100101
§
10-510-410-310-210-1100101
§§
0 2 410-510-410-310-210-1100101
0 2 4Time[hour]
0 2 4 0 2 4 0 2 4 0 2 4
§§§
A
B
C
D
E
F
*
**
**
*
**
Figure 32: Survival of 106 cells/cm² of selected strains from the Keio collection exposed in 0.1 mol/l MOPS to stainless steel, pure copper (Cu) and eutectic alloys (Al, Al-Cu, Al-Ag and Al-Ag-Cu) (N) (n = 3). N0: amount of the starting cell concentration. A: wildtype strain; B: ΔcutA, C: ΔcueR, D: ΔcopA, E: ΔcueO and F: ΔrecA; * significant decrease in cell survival
in comparison to the wildtype (p-value < 0.05), § below detection threshold.
A comparison of all surfaces and selected strains indicated that no reduction in cell
survival was detected when cells were applied to Al-Cu alloys, stainless steel and Al
surfaces. Most of the tested strains also showed no reduction in cell survival when
exposed to Al-Ag alloys, except ΔcopA and ΔrecA. In both cases a reduction in cell
survival by one order of magnitude was measured after two hours of exposure. The cell
3 Results
63
survival decreased further after four hours of exposure to Al-Ag alloys for ΔcopA by two
and for ΔrecA by three orders of magnitude.
The most efficient materials were Al-Ag-Cu alloys and pure copper surfaces. After two
hours of exposure to Al-Ag-Cu the survival was decreased by one order of magnitude for
the wildtype strain and ΔcutA. The ΔcueO strain was decreased by 1.5, ΔcueR by two and
ΔrecA and ΔcopA by three orders of magnitude. After four hours of exposure, the survival
was further decreased by two (wildtype and ΔcutA), 3.5 (ΔcueR) and four orders of
magnitude (ΔcopA). In case of ΔcueO the amount of survival was the same as obtained
after 2 hours of exposure and no survival was determined after four hours of exposure in
case of ΔrecA.
The highest reduction in cell survival was determined for cells exposed to pure copper
surfaces. The exposure for two hours decreased the survival of the wildtype and ΔcopA
by three, ΔcutA by four and ΔcueR by 4.5 orders of magnitude. In case of ΔrecA and
ΔcueO, no cells were detected after two hours of exposure. Longer exposure of up to four
hours on pure copper surfaces led to a total decrease in cell survival for all tested strains.
In comparison to the obtained results of E. coli K12 exposed in 0.1x PBS or 0.1 mol/l
MOPS (paragraph 3.1.6), the reduction of cell survival was higher for the E. coli Keio
wildtype strain suspended in 0.1 mol/l MOPS. After two hours on pure copper surfaces the
survival of E. coli K12 and E. coli Keio wildtype cells exposed in 0.1x PBS was reduced by
one and after four hours by two orders of magnitude. For 0.1 mol/l MOPS exposed E. coli
K12 the survival was reduced by three after two hours and five orders of magnitude after
four hours of exposure. In case of 0.1 mol/l MOPS exposure of the E. coli Keio wildtype a
reduction in cell survival by three orders of magnitude was detected after the exposure of
two hours. After the exposure of four hours on pure copper surfaces no cell survival was
detected.
Summarizing all these results two decreasing orders depending on cell survival can be
established. An exposure in 0.1 mol/l MOPS on pure copper surfaces led to the following
order, starting with the most resistant strain: Keio wildtype = ΔcopA > ΔcutA > ΔcueR >
ΔcueO, ΔrecA. The highest resistance after the exposure to silver containing alloys was
obtained for the Keio wildtype = ΔcueO = ΔcutA > ΔcueR > ΔcopA > ΔrecA.
3 Results
64
3.3.3 Release and uptake/binding of copper ions
Differences in the release of copper ions after the exposure of E. coli K12 and ΔcopA
were determined by additional ICP-MS measurements. Therefore 0.1x PBS alone and
106 ΔcopA cells/cm², resuspended in 0.1x PBS, were exposed to pure copper surfaces.
The obtained results were compared in Table 12 and Table 13 to the previously obtained
E. coli K12 results (paragraph 3.1.4).
Table 12 presents the copper release after the exposure of E. coli K12 and ΔcopA to pure
copper surfaces. The results for zero hours exposed cell suspension display the amount
of copper ions which were present in cells under non-stressed conditions.
Table 12: Total amount of copper ions in 350 µl suspension (106 cells/cm²) after exposure to
pure copper surfaces (n = 3). SD indicates standard deviation.
Similar to the results obtained for the total amount of copper ions, the increase of cell
associated copper ions was higher for E. coli K12. After three hours of exposure the cell
associated copper concentration of ΔcopA (7.99 %) was similar to the 7.42 % obtained for
E. coli K12 after one hour of exposure. The final cell associated concentration of E. coli
K12 was determined as 15.16 % and for ΔcopA as 19.52 %. Comparing the variance of
error for both four hour exposed samples, no significant differences in the cell associated
copper ion concentration could be determined. The obtained results indicated that no
significant differences between E. coli K12 and ΔcopA in relation to the release of copper
ions from the surfaces and the cell associated copper ion concentration was measurable.
Summary of the molecular processes
Summarizing the obtained contact killing results, three decreasing orders of cell survival
can be established. After the exposure in 0.1x PBS on pure copper surfaces, ΔcueO and
ΔcueR were identified as the most sensitive strains, whereas ΔcopA and ΔrecA exhibited
the highest resistances. When exposed in 0.1 mol/l MOPS on pure copper surfaces, the
ΔrecA was even more sensitive than ΔcueO and ΔcueR. In contrast to this, ΔcueO was
the most resistant strain and ΔcopA and ΔrecA were the most sensitive strains when
exposed to silver containing eutectic alloys.
Additionally, ICP-MS measurements were conducted to determine differences in the
release and cell associated copper ion concentration after exposure of ΔcopA and E. coli
K12. No significant differences of the copper ion release and the cell associated copper
ion concentration was determined. Whereas in both experiments, a delay of copper
release and cell associated copper was detected for ΔcopA exposed samples.
3 Results
66
3.4 Impact of an alternative casting
Additionally to the “fast” casted eutectic alloys, “slow” casted Al-Ag-Cu alloys were
examined. For these contact killing experiments, 106 cells/cm² of E. coli K12 and S. cohnii
were suspended in 0.1x PBS and exposed to Al-Ag-Cu and pure copper surfaces.
Al-Ag-Cu - "slow" "fast" castedCu
Sur
viva
l [N
/N0]
10-5
10-4
10-3
10-2
10-1
100
101
A
B
0 2 40 2 4Time [hour]
0 2 40 2 410-5
10-4
10-3
10-2
10-1
100
101
*
*
0 2 4
**
*
*
*
*
*
*
Figure 33: Survival of 106 cells/cm² of E. coli K12 (A) and S. cohnii (B) suspended in 0.1x PBS after the exposure to antimicrobial (N) and stainless steel (N0) surfaces (n = 3),
* significant decrease in cell survival (p-value < 0.05).
In case of S. cohnii a reduction in cell survival by three orders of magnitude was
determined after the exposure of four hours to “slow” casted Al-Ag-Cu alloys and pure
copper surfaces. By comparison, exposure of E. coli K12 for four hours to “slow” casted
Al-Ag-Cu alloys led to a reduction in cell survival by 2.5 orders of magnitude and 3.5 after
the exposure to pure copper surfaces. Contrary to these decreases in cell survival, only
slight influences of both strains were determined after the exposure to “fast” casted Al-Ag-
Cu alloys. Thereby, the effects on cell survival were negligible in comparison to both other
tested materials.
3 Results
67
These results indicate antimicrobial effects of the “slow” casted eutectic composite
material (Al-Ag-Cu) and revealed further potentially deeply interesting experiments
concerning antimicrobial studies on eutectic alloys.
3.5 Summary
Summarizing all these results, no significant differences were obtained for Gram-positive
and Gram-negative strains. Both displayed membrane damages and a similar decrease in
cell survival after contact killing on pure copper surfaces. Further experiments
demonstrated damaging effects of the DNA and RNA and an increase in ROS production.
Additional analysis conducted on different copper oxide surfaces pointed out that the most
toxic copper ion is Cu+.
Compared to 0.1x PBS exposed samples, less cell survival and a coincident higher
release of copper ions was obtained for 0.1 mol/l MOPS exposed samples. Further
analysis on “fast” casted eutectic alloys showed that only a slight decrease in cell survival
and release of antimicrobial metals was detected. In contrast to this, a higher decrease in
cell survival was detected for “slow” casted alloys.
The investigation of knockout mutant strains displayed ΔcueO und ΔcueR as the most
sensitive strains when exposed to pure copper surfaces. As opposed to this, ΔcopA and
ΔrecA were highly resistant when exposed in 0.1x PBS to pure copper surfaces. Beside
this, ΔcopA and ΔrecA were the most sensitive strains when exposed to silver containing
eutectic alloys. Contrary to the exposure on pure copper surfaces, ΔcueO exhibited the
highest resistance after the exposure to silver containing eutectic alloys.
4 Discussion
68
4. Discussion
Although antimicrobial metals are applied for centuries, the exact mechanisms of action
are not fully understood. First promising investigations were performed in 1893 by von
Nägeli. He discovered the oligodynamic properties of antimicrobial salts such as copper
and silver [26]. However, the application of these metals as antimicrobial surfaces was
first examined by Kuhn in 1982. In these experiments, the microbial diversity on brass and
stainless steel doorknobs was investigated whereby a comparison of both pointed out that
a diminished microbial contamination was verifiable on brass doorknobs [42]. From
thereon, increasing investigations and applications of copper and silver as antimicrobials
were conducted [28, 51, 52, 98, 99]. Nevertheless, the application of pure copper surfaces
is difficult due to the chemical properties and costs. Therefore, many investigations were
implemented with metallic alloys and their efficiency against microbial contaminations [57,
137, 138].
The current study was conducted on pure copper surfaces and eutectic alloys composed
of mainly aluminium in addition to silver and/or copper. Additional experiments were
performed on different copper oxide layers (Cu2O and CuO) which were previously
thermally prepared on pure copper surfaces. [127].
Figure 34: Photographic picture of a pure copper surface (Cu) and the copper oxide layers (CuO and Cu2O). Cu2O was produced after the exposure for 20 hours at 200 °C to air. The double layer of Cu2O at the bottom and CuO on top was formed after the exposure to air for 150 minutes at 350 °C. The insets indicate schematically the layer dimensions; the CuO layer had a dimension of 238 nm ± 56 nm and was produced on top of the 1.64 µm ± 0.1 µm
thick Cu2O layer. In case of Cu2O, a 54 nm ± 6 nm thick layer was produced [127].
Previous research has shown that cells in the stationary phase are more resistant to
stress situations e.g. copper stress than cells from the logarithmic phase [83]. Supposing
that environmental microorganisms are very resistant against stress conditions, cells were
Cu
4 Discussion
69
routinely grown under optimal conditions until stationary phase was reached. With this
experimental setup it can be ensured that conclusions can be drawn between laboratory
experiments and microorganisms from the environment which might adhere to
antimicrobial surfaces.
Initially to contact killing experiments, desiccation tolerance of several environmental
isolates and human associated microorganisms was examined. On account of these
measurements, the most interesting strains were to be determined and selected for further
investigations. The presented results in this work were the well-known model organism
Deinococcus radiodurans R1, Escherichia coli K12 and Staphylococcus cohnii. Less
efficient strains related to cell survival under desiccation conditions and spore forming
strains were excluded. Additionally, experiments with D. radiodurans R1 were not
considered further due to its tetrad character; this complicated the determination of
antimicrobial effects on single cells. The exclusion of spore forming cells is caused by the
fact that spores were more resistant than vegetative cells. In experiments of Galeano et
al., they were not affected by antimicrobial silver- and zinc-coating, contrary to vegetative
cells [139]. Another important reason for the exclusion was caused by the discovery of
Kearns and Losick in 2005, that B. subtilis cells grew heterogeneously [140]. Therefore a
reliable distinction of both cell forms was not trivial. By means of the obtained desiccation
results, further investigations were performed with the Gram-negative E. coli K12 and
Gram-positive S. cohnii [141, 142]. Both strains are human associated and were selected
due to their high desiccation tolerance, similar growth behaviour and differences in the
composition of the cell wall and membrane. Nevertheless, slight differences in their
survival efficiency after the exposure to CuSO4 in medium were observed. The obtained
MIC results of CuSO4 for E. coli K12 (5 mmol/l) showed comparable results to the data
obtained by Tetaz and Luke (1983) (4 mmol/l) [143], whereby S. cohnii was slightly more
resistant (7 mmol/l) than E. coli K12.
In comparison to CuSO4 from which Cu2+ ions are solved in solution, the main
experiments were conducted on pure copper surfaces. From pure copper surfaces both
forms of copper ions Cu+ and Cu2+ are dissolved. To determine different contact killing
effects caused by Cu+ and Cu2+, investigations were conducted on copper oxide layers
(Cu2O and CuO) [127].
A comparison of the obtained results after the exposure of E. coli K12 and S. cohnii on
copper oxide layers with the obtained results after exposure on pure copper surfaces
demonstrated that the most efficient surface layer was composed of Cu+ followed by the
pure copper surface which was able to release both forms of copper ions (paragraph
3.1.2). CuO layers were also efficient in contact killing of E. coli K12 and S. cohnii strains
4 Discussion
70
but less efficient than the Cu2O layer or pure copper surface. These results are supported
by experiments with Enterococcus hirae previously described by Mathews et al. (2015)
[41]. A possible explanation for the higher toxic effect of Cu+ is that, in comparison to Cu2+,
Cu+ penetrates intact cytoplasmic membranes. Once inside the cytoplasm, it leads to
severe damages of DNA, RNA and proteins [86, 89]. Additionally, it reacts in a Fenton-like
reaction and produces reactive oxygen species (ROS) [23, 74, 144]. ROS lead to further
damages of the cell membrane, proteins, DNA and RNA. Similar to Cu+, Cu2+ can also
lead to lipid peroxidation, DNA and RNA degradation and protein dysfunction [79, 86-89]
whereby Cu2+ is not available in the cytoplasm if the cytoplasmic membrane is intact. To
cause damages in the cytoplasm, Cu2+ needs to be taken up by cells either actively via
e.g. the Zn(II)-uptake system ZupT [145] or through lesions in the membrane. Additionally,
Cu2+ can be transformed to Cu+ by reducing mechanisms in the periplasm e.g.
enterobactin which can act as a Cu2+ reductant [94]. Further investigations were
conducted on pure copper surfaces due to the fact that thermally oxidized copper surfaces
are not applicable in hospitals or else.
First contact killing experiments with E. coli K12 were conducted with cells grown
overnight in NB medium. According to the DSMZ, NB is the optimal medium for E. coli
K12. However, the nutrient composition of NB is much lower in comparison to TSY
medium for S. cohnii. To ensure similar nutrient and therefore similar growth conditions,
LB medium was used. It was already used by Macomber et al. (2007) [144] and contains
an equal amount of nutrients compared to TSY medium. E. coli K12 cells grown overnight
in LB medium showed higher copper tolerance in comparison to NB grown E. coli K12
cells (data presented in the supplements: Figure 36). Thereby the copper tolerance
obtained for E. coli K12 cells grown in LB medium was comparable with S. cohnii cells
grown in TSY medium. Both strains showed equal survivability after contact killing
experiments [146]. For a better comparison of both strains and to minimize influences of
different nutrient concentrations of the medium, further analysis with E. coli K12 was
conducted with cells grown overnight in LB medium.
Additionally to the choice of medium, different buffers were examined. In many research
publications 0.1 mol/l Tris HCl was used to investigate contact killing efficiencies of
antimicrobial surfaces or alloys [41, 127, 147]. However, as previously shown by Hans et
al. [127], 0.1 mol/l Tris HCl release more copper ions from pure copper surfaces than
PBS. Higher release of copper ions means higher corrosion of the surface and a followed
destabilization. To minimize these effects, cells of the current study were exposed in PBS
to determine antimicrobial effects. Contact killing experiments with cells exposed in
1x PBS and 0.1x PBS showed that less cell survival was obtained for cells exposed in
4 Discussion
71
1x PBS. This is caused by the higher salt concentration of 1x PBS which led to an
increased corrosion of surfaces. As a consequence more ions are available in
suspension, followed by an increased killing effect [110]. Therefore further experiments on
pure copper surfaces were conducted in 0.1x PBS to minimize corrosion of the surfaces.
Additionally, to counteract the issue of increased corrosion on eutectic alloys, 0.1 mol/l
MOPS was used for contact killing experiments. MOPS is a so called “Good buffer” and
does neither play a role in cell metabolism nor is it toxic [148]. It was chosen because of
the reactive features of eutectic alloys with PBS. PBS consists of three different
components (Na2HPO4, KH2PO4 and NaCl) whereby the dissolved ions react under gas-
forming conditions and the production of an insoluble salt after exposure to eutectic alloys.
SEM-EDX measurements pointed out that the salt consisted of three major elements
(aluminium, phosphorus and oxygen) and inferior concentrations of sodium, chlorine and
potassium. Due to this distribution it could be assumed that aluminium reacted with PBS
to insoluble aluminium salts, certainly AlPO4 and/or Al(OH)3. Thereby possibly H2 was
additionally formed. This reaction did not take place when MOPS was exposed to eutectic
alloys.
For a better comparability of both buffers, experiments on pure copper surfaces with
E. coli K12 and S. cohnii cells exposed in either 0.1x PBS or 0.1 mol/l MOPS were
investigated. The comparison of results showed that the survival of cells exposed in
0.1 mol/l MOPS decreased much higher in comparison to 0.1x PBS exposed cells. To
determine the reason for the different toxic effects the total release and cell associated
copper ion concentration after the exposure to pure copper surfaces in 0.1x PBS and
0.1 mol/l MOPS was determined. Thereby the results pointed out that a higher release of
copper ions and a higher cell associated copper ion concentration was detected for
0.1 mol/l MOPS exposed samples. Taken into account what Montigny and Champeil
postulated in 2007, a possible reason for the higher release of copper ions could be that
MOPS is able to chelate copper ions [149]. This decreases the concentration of free
copper ions in suspension which in turn can lead to a further release of copper ions from
the surface. By reference to Montigny and Champeil the higher release of copper ions can
be explained. However, the higher cell associated copper ion concentration cannot be
explained by this assumption but possibly by researches of Mash and Chin (2003). They
postulated that no binding of copper would be formed with MOPS buffer even if MOPS is
a chelating agent [150]. The results of both studies can only explain one of both measured
results; therefore further investigations need to be conducted.
4 Discussion
72
4.1 Survival after contact killing
Further on, contact killing experiments were conducted. Therefore, the application of cells
in a monolayer was of major concern. A monolayer ensures that every cell gets in direct
contact to the surface and obtains equal stress conditions. The results obtained by SEM
analysis revealed that a multilayer of cells was formed for cell concentrations of 108 and
107 cells/cm² (Figure 15). Concerning the outer and inner regions of the multilayer, it is
estimated that the majority of cells is located between the outer layer and adhered cells
with a supplemental lower copper ion concentration. Therefore, these cells were protected
against the toxic effect of free copper ions. Additionally, cells which were directly exposed
to antimicrobial surfaces protect upper cells from toxic effects of the surface through
shielding. These shielding effects could explain the high survivability of cells at high cell
concentrations, even after four hours of exposure. The optimal cell concentration was
determined to be ranged between 105 and 106 cells/cm². At a cell concentration of
106 cells/cm² only a few cells were detected to lie on top of other cells whereas a complete
monolayer was obtained after the exposure of 105 cells/cm² (Figure 15). Significant
decreases in cell survival were detected at a cell concentration of 105 cells/cm². At this
concentration, all cells were in direct contact to the antimicrobial surface and therefore no
shielding effects existed. Additionally, at cell concentrations of 105 cells/cm² or higher,
most of the cells were in direct contact to other cells and therefore able to interact and
communicate. In general, communication of bacteria is caused by quorum sensing which
includes e.g. conjugation, motility or antibiotic production. For bacterial survival, it is of
major importance to interact with their environment, for example when they are exposed
to antimicrobial surfaces [151, 152]. At lower cell concentrations, a monolayer was
exposed where every cell was in direct contact to the surface. Furthermore, an interaction
of cells was no longer possible which could led to a higher reduction in cell survival.
The similar survivability of E. coli K12 and S. cohnii after exposure to antimicrobial
surfaces could indicate that the influence of differences in the composition of the cell wall
and membrane is negligible. Based on these results, contact killing experiments were
conducted either with 105 or 106 cells/cm² when experiments were conducted with cells in
a monolayer or 107 cells/cm² if the difference to a multilayer of cells was investigated.
In addition to contact killing experiments on pure copper surfaces, the contact killing effect
was investigated on eutectic alloys. They were partitioned into “slow” and “fast” casted
alloys whereby the majority of experiments, including the molecular analysis experiments,
were conducted on “fast” casted alloys.
4 Discussion
73
Initial experiments were conducted to determine the effect of pure aluminium. Due to the
fact that no antimicrobial effect was observed for samples exposed to Al, the effect of
copper and silver in combination with aluminium was examined. Therefore two alloys were
casted; both contained aluminium and additionally either silver or copper. Synergistic
effects of copper and silver were examined with an alloy which contained all three
elements. All alloys were casted as eutectic mixtures to guarantee a consistent
distribution of metals. In case of Al-Cu alloys the material was composed of two crystals;
Al and Al2Cu. Al-Ag was composed of Al and Ag2Al and Al-Ag-Cu of Al, Al2Cu and Ag2Al
crystals. The structure of Al-Ag-Cu alloys were analysed by Dennstedt and Ratke in 2012.
They could show that different solidification rates led to different constellations of the
crystal structure. Thereby a quicker solidification led to a decrease in ordering from brick-
like to irregular structures (Figure 35) [153].
Figure 35: SEM images of the brick like structure (left panel) after slow solidification and irregular structure (right panel) after fast solidification of Al-Ag-Cu alloys. Dark: Al, grey: Al2Cu, white: Ag2Al. [153].
The crystal structure of both “fast” and “slow” eutectic alloys in the current work was
obtained after quick solidification. All casts were poured at room temperature and cooled
down in cool water. This ensured a very quick but not controlled cool down which induced
a higher chaotic structure of crystals. Due to the higher chaotic structure every cell was in
direct contact to antimicrobial metals.
The “slow” casted alloy was composed of Al-Ag-Cu. After four hours of exposure a
decrease in cell survival which was similar to the survival after the exposure to pure
copper surfaces was obtained. Possible reasons why the “slow” batch of alloys behaved
different to the “fast” batch of alloys was ascribed to the different casting procedures. In
general, the composition was equal but contrary to the “fast” batch of alloys which were
molten, mixed and casted in a mould of 15 mm, the “slow” casted Al-Ag-Cu alloy was
4 Discussion
74
produced in two melting processes. The first melting was casted in a quadratic form of 16
cm *16 cm length with a height of approximately one – two cm. Afterwards, smaller pieces
of this cast were molten and mixed again followed by a cast in a 12 mm mould. The
casting in the quadratic form and the smaller mould diameter led to a quicker cool down of
the material which led to a more irregular structure with a higher distribution of smaller
crystals (Figure 35). The higher irregular structure of the “slow” batch of alloys led to a
higher antimicrobial effect. This experiment indicated that the processing and solidification
rate is highly important to obtain antimicrobial effects of the alloy. Therefore the protocol
and thickness of the material need to be optimized. Possibly, the casting of thin materials
is better suited in comparison to huge blocks which were eroded into smaller pieces
afterwards. Such a thin surface will solidify quicker and could be applicable for the
exchanging of plastic light switches or other surface areas for example in hospitals.
The survivability of Gram-positive and Gram-negative strains after the exposure on “fast”
casted eutectic alloys was not diminished when exposed to Al and stainless steel, which
both were used as controls, and Al-Cu alloys. In case of Al-Ag and Al-Ag-Cu exposed
samples a slight reduction in cell survival was determined, whereas higher reduction was
obtained after the exposure to pure copper surfaces. For a more precise investigation of
the possible antimicrobial effect, the metabolic activity of 105 and 106 exposed E. coli K12
cells/cm² was examined. Therefore, the reduction of resazurin (blue) to resofurin (red) was
analysed spectrophotometrically [129, 130]. Similar to the obtained results after contact
killing, no inhibition of the metabolic activity was determined for Al, stainless steel and Al-
Cu exposed samples. However, a diminished but not inactive metabolism was detected
for 105 cells/cm² exposed to Al-Ag and Al-Ag-Cu alloys. Thereby the negative effect on the
metabolic activity was higher for Al-Ag alloys. Possible reasons for the less antimicrobial
effects could be caused by the alloy composition. In case of eutectic Al-Cu alloys only
17.5 mol% (33.3 weight%) copper was present. This concentration was much lower
compared to pure copper surfaces (99.9 weight%). Therefore it was expected that the
antimicrobial effect was lower, but unfortunately the copper concentration seems to be too
low to exhibit antimicrobial effects. In case of Al-Ag alloys, the silver concentration was
34.3 mol% (67.6 weight%) and of Al-Ag-Cu alloys 18.1 mol% (42.2 weight%) with
additional 12.8 mol% (17.6 weight%) copper. In sum, around 30 mol% (~ 60 weight%) of
both materials was composed of antimicrobial metals. Comparing the antimicrobial metal
concentration of Al-Ag and Al-Ag-Cu alloys, a slightly higher percentage was present in
Al-Ag alloys. This could cause these small differences in the metabolic activity. On the
basis of the EPA registered copper alloys, the Copper Development Association (CDA)
concluded that most of them are composed of about 60 weight% copper [154]. Taken into
account that silver atoms are much heavier than copper atoms, it can be assumed that the
4 Discussion
75
metal concentration used in this study could be too low to possess antimicrobial efficiency.
Therefore, in further analysis the concentration of antimicrobial metals could be increased
or the casting optimized.
An increase of copper and/or silver results in the loss of the eutectic composition. This in
turn leads to an irregular distribution and regions of crystallised antimicrobial metals which
were not composed of aluminium. This in turn can lead to separated regions which
possibly possess higher antimicrobial effects on the survival of microorganisms. Contrary
to this, copper or silver crystals which were not associated with aluminium could lead to a
higher corrosion and therefore a loss in stability of the surfaces. In case of silver, this
effect is possibly negligible due to the fact that silver is not as reactive as copper and
slower oxidized. These facts indicate that the optimization of the casting protocols is more
feasible than changing the metal composition.
4.2 Damaging effects after contact killing
Additionally to the determination of cell survival, damaging effects to cellular
compartments caused by copper ions were investigated for E. coli K12 exposed to pure
copper surfaces. When exposed in a multilayer of cells, no increase in ROS production or
membrane damage was obtained. Contrary to the non-existent decrease in cell survival
after two hours of exposure, experiments of cells exposed in a monolayer indicated ROS
production and membrane damage already after one hour of exposure. This led to the
following conclusions. On the one hand, ROS production and membrane damage
occurred directly after contact to antimicrobial surfaces, but on the other hand the impact
of these effects needed some time to develop to cause cell death. One explanation for this
could be that free copper ions were bound to the cell membrane or sequestered via
complexation or chelation by ligands as previously shown by Borkow and Gabbay (2005)
and Lemire et al. (2013) [71, 93]. Thereby, intracellular free copper ions were held at a
minimum and further toxic effects prevented. Another possible explanation for the delayed
cell death could be caused by the fact that cells were grown overnight in a medium with a
high nutrient composition and exposed in buffer solution. Therefore they possess slight
residual energy (personal communication: Prof. Dr. Reinhard Wirth, Regensburg
University, Germany) which could be used to repair damages caused by copper ions at
the beginning of the experiment. Further exposure of up to four hours without energy led
to a rapid decrease in cell survival, possibly caused by the constantly high ROS
concentration, decreased membrane integrity and higher concentration of free copper
ions. Additionally, after longer exposure to free copper ions, the buffering capacity of
4 Discussion
76
sequestration molecules could be depleted. Thereby no further buffering of copper ions
was possible.
Further on, the effect of copper ions to in vivo and ex vivo exposed DNA and RNA was
examined to clarify if damages occurred. Copper has two binding sites in the DNA helix.
One is present every four nucleotides; the other is an intercalating site which is present in
every base pair [90]. Both could lead to mutation, disordering of the helical structure, DNA
strand breakage and crosslinking [33, 35, 72, 89-92]. For in vivo experiments, no changes
in the DNA and RNA integrity were detected even after four hours of exposure. This could
be explained by the fact that DNA and RNA are present in the cytoplasm and therefore
shielding effects occur through the cell wall and membrane. Secondly, copper ions can be
sequestered extra- and intracellularly through siderophores like enterocholin or
enterobactin [94]. Last but not least, until now it is unclear whether copper ions appear
primarily in the periplasm instead of in the cytoplasm [144]. If they were primarily present
in the periplasm, where no DNA or RNA is located, then the diminished fragmentation of
in vivo exposed DNA and RNA could be explained by this. On the contrary, the ex vivo
experiments indicated that a decrease in the DNA and RNA integrity was detected as
early as after one hour of exposure. Thereby, RNA seems to be quicker fragmented
compared to DNA. This can be attributed to the fact that the measured RNA was
composed of smaller fragments (2900 nt) in comparison to genomic DNA (>10000 nt)
which could make the detection of fragmentation easier.
The results of the current study indicate that membrane damage and ROS production are
major effects caused by contact killing on pure copper surfaces. Comparing these results
with the published data of Espirito Santo et al. (2011) similar conclusions were drawn.
Contrary to this, Warnes et al. (2011, 2012) postulated that DNA damage is the primary
effect of contact killing [83-85]. The contradicting results of different researchers require
further mechanistic analysis of the contact killing effect.
Experiments on pure copper surfaces and eutectic alloys were conducted with selected
strains of the Keio collection. The Keio Collection comprises of single-gene knockout
mutant strains of the E. coli K12 derivate BW25113. Each mutant was constructed
through exchange of single genes by a kanamycin cassette [111]. By reference to this
library the importance of single genes in molecular pathways can be examined. In
previous experiments of e.g. Outten et al. (2000, 2001) or Rensing et al. (1999), several
E. coli mutant strains with deletions in single genes were examined in the presence of
CuSO4 in solution [112, 114, 155]. The experiments conducted in the current work were
performed on pure copper surfaces and different potentially antimicrobial alloys containing
4 Discussion
77
aluminium, silver and/or copper. After growing in medium which contained CuSO4
concentrations of 4 or 5 mmol/l, the most important genes were determined and these
knockout mutant strains selected for further analysis. All selected strains had either a
direct link to copper and/or silver transport mechanisms e.g. Cu+-translocating P-type
ATPase (CopA) [156] or a general function in the microorganisms e.g. Fumarase A,
participates in the TCA cycle (FumA) [119].
The following deleted genes in E. coli mutant strains have a direct link to copper and silver
164 Delmar, JA, Su, CC, and Yu, EW, Bacterial multidrug efflux transporters. Annu Rev Biophys.
2014. 43: 93-117.
165 Stoyanov, JV, Magnani, D, and Solioz, M, Measurement of cytoplasmic copper, silver, and
gold with a lux biosensor shows copper and silver, but not gold, efflux by the CopA ATPase of
Escherichia coli. FEBS Lett. 2003. 546: 391-4.
166 Franke, S, Grass, G, and Nies, DH. The product of the ybdE gene of the Escherichia coli
chromosome is involved in detoxification of silver ions. Microbiology. 2001. 147: 965-72.
167 Birch, L, and Bachofen, R, Complexing agents from microorganisms. Experientia. 1990. 46:
827-34.
Acknowledgements
97
7. Acknowledgements
At this point I would like to thank all the people who made this thesis possible.
First of all, I would like to express my sincere gratitude to Prof. Dr. Reinhard Wirth, who
made this work possible and who guided me during my PhD time. Furthermore I would
like to thank my second and third corrector, PD Dr. Christine.Hellweg and Prof. Dr.
Reinhard Rachel for all their support and willingness to value my thesis.
Additional thanks goes to Dr. Günther Reitz and PD Dr. Christine Hellweg, who gave me
the opportunity to carry out my thesis at the German Aerospace Center in the Radiation
Biology Department and in particular to Dr. Petra Rettberg. I am very grateful that I could
write my thesis in this Department and got the possibility to present my work at
conferences and attended summer schools in order to establish a scientific network.
Special thanks goes to Dr. Ralf Möller who originated the great cooperation with Prof. Dr.
Frank Mücklich (Saarland University) and Prof. Dr. Lorenz Radtke (DLR, Cologne) and for
his support during the final stage of the writing process. These cooperations gave me the
opportunity to broaden my horizon in the field of material sciences and made my research
possible. With this I would also like to thank Prof. Dr. Frank Mücklich and Prof Dr. Lorenz
Radtke for the great support and cooperation. Further on, thank you Dr. Michael Hans
(formerly Saarland University) and Anne Dennstedt (formerly DLR, Cologne) for the great
and enjoyable support and reliable production of materials. Additionally, I would like to
thank Dr. Christina Hein (Saarland University) for the rapid processing of my ICP-MS
measurements. I would like to thank all of you for your kindness and friendly discussions
and additionally patience when a microbiologist wanted to know more about eutectic
compositions or asked other questions related to the chemistry of materials.
Further on, I would like to thank Dr. Stefan Leuko, Dr. Elke Rabbow, Dr. Kristina Beblo-
Vranesevic, Dr. Ralf Möller and Dr. Petra Rettberg for the possibility to critically discuss all
my questions. Particularly, I would like to thank Dr. Stefan Leuko for correcting my thesis
from the very beginning, for all his patience and good comments.
For all the expedient discussions and helpful advices during my thesis, I would like to
thank my mentor Dr. Harald Huber (Regensburg University) and for his technical support
corresponding to my experiments, I would like to thank Prof. Dr. Reinhard Rachel
(Regensburg University). Additionally, I would like to thank Prof. Dr. Uwe Deppenmeier for
mentoring me during my PhD.
Acknowledgements
98
Finally, I would like to acknowledge the SpaceLife graduate program (Helmholtz Space
Life Sciences Research School) for funding the thesis and providing insights into a diverse
field of space-related topics. As part of SpaceLife I am furthermore grateful to Claudia
Schmitz, PD Dr. Christine Hellweg, Dr. Luis Spitta, and Anna-Maria Trautmann for their
workshop organization and great support.
The "Regensburg International Graduate School of Life Sciences" (RIGeL) from the
University of Regensburg is also acknowledged.
In addition I would like to thank all my colleagues at the German Aerospace Center in
Cologne who provided a wonderful working atmosphere. Thank you very much for the
nice time we had in the laboratories and in the office and the expedient discussions.
Especially I would like to thank Andre Parpart, Simon Barczyk, Britta Rowehl and Thomas
Urlings for their technical support and Dagmar Koschnitzki, Felix Fuchs, Bernd
Henschenmacher, Dr. Corinna Panitz, Maria Bohmeier and Andrea Schröder for the nice
talks, comments and appreciations during my thesis.
Last but not least, I would like to thank Andre and my family, especially my mother. She
always supported me and gave me the opportunity to find my own way.
Supplementary
XCIX
Supplementary
Contact killing on pure copper surfaces
0 2 4
Sur
viva
l [N
/N0]
10-5
10-4
10-3
10-2
10-1
100
101
Time [hour]0 2 4 0 2 4 0 2 4
§
a b c d
**
***
Figure 36: Survival of E. coli K12 grown overnight in NB medium and suspended in 0.1x PBS after the exposure to stainless steel (N0) and pure copper surfaces (N) (n = 3). a: 108 cells/cm², b: 107 cells/cm², c: 106 cells/cm² and d: 105 cells/cm²; * significant decrease in cell survival (p-value < 0.05), § below detection threshold.
Supplementary
C
Nucleic acid fragmentation (RNA)
Figure 37: A typical gel electrophoresis of in vivo and ex vivo exposed RNA separated in a 2 % agarose gel. For in vivo analysis, 107 cells/cm² were exposed to stainless steel and pure copper surfaces. For ex vivo analysis, 15 µl DNA solution was exposed to 0.12 cm² stainless steel and pure copper surfaces. After the exposure and isolation 300 ng of each solution
was separated on the agarose gel.
Supplementary
CI
SEM images of eutectic alloys
Al
Al-Ag
Al-Cu
Al-Ag-Cu
Figure 38: Surface structure of “fast” casted alloys after sanding received with the SEM-EDX.
30 µm
30 µm 30 µm
30 µm
Supplementary
CII
Contact killing of S. cohnii on potentially antimicrobial surfaces
Steel
100101102103104105106107
Al Al-Cu Al-Ag Al-Ag-Cu Cu
*
*****
0 1 4 6100101102103104105106107108
0 1 4 6Time [hour]
0 1 4 6 0 1 4 6 0 1 4 6 0 1 4 6
A
B *
**
CFU
[N/N
0]
Figure 39: Contact killing of 105 (A) and 106 (B) S. cohnii cells/cm² in 0.1 mol/l MOPS (n = 3). CFU obtained after the exposure to stainless steel, Al, Al-Cu, Al-Ag, Al-Ag-Cu and pure copper surfaces (N) were divided by the obtained CFU before exposure (N0); * significant
decrease in cell survival (p-value < 0.05).
Supplementary
CIII
Keios – most important genes to survive copper stress
E. coli K-12
10-2
10-1
100E. coli Keio Wildtype E. coli cusA
E. coli cusB
OD
600 10-2
10-1
100E. coli cusC E. coli cusF
E. coli cusR
10-2
10-1
100E. coli cusS E. coli edd
E. coli cueR
0 5 10 15 20 25 30 3510-2
10-1
100E. coli cueO
Time [hour]
0 5 10 15 20 25 30 35
E. coli copA
0 5 10 15 20 25 30 35
Figure 40: Growth curves of selected Keio strains in LB medium containing 0 mmol/l ( ),
4 mmol/l ( ) and 5 mmol/l ( ) CuSO4 (n = 3).
Supplementary
CIV
E. coli fumA
10-2
10-1
100E. coli leuC E. coli recA
E. coli katE
OD
600 10-2
10-1
100E. coli katG
E. coli cutA
10-2
10-1
100E. coli cutC
E. coli acrA
0 5 10 15 20 25 30 3510-2
10-1
100E. coli acrB
Time [hour]
0 5 10 15 20 25 30 35
E. coli rpoS
0 5 10 15 20 25 30 35
Figure 41: Growth curves of selected Keio strains in LB medium containing 0 mmol/l ( ),
Table 15: Percentage of cell associated copper after the exposure of 106 E. coli K12 cells/cm² to Al-Cu and Al-Ag-Cu alloys (n = 3). SD indicated standard deviation, ND: not