LBST.de 23 November 2016 Ludwig-Bölkow-Systemtechnik GmbH VDI-Fachtagung «Innovative Antriebe» ∙ Dresden ∙ 23. November 2016 Erneuerbare Energien im Verkehr 2050 Ergebnisse und Gedankenfutter aus fünf explorativen 100%-Szenarien für die Forschungsvereinigung Verbrennungskraftmaschinen e.V. (FVV) Patrick R. Schmidt ∙ Werner Weindorf ∙ Werner Zittel LBST ∙ Ludwig-Bölkow-Systemtechnik GmbH ∙ Munich ∙ Germany 2016-11-23 ∙ WEB
Transcript
LBSTde 23 November 2016 Ludwig-Boumllkow-Systemtechnik GmbH
ludwig boumllkow
systemtechnik
VDI-Fachtagung laquoInnovative Antrieberaquo ∙ Dresden ∙ 23 November 2016
Erneuerbare Energien im Verkehr 2050 Ergebnisse und Gedankenfutter aus fuumlnf explorativen 100-Szenarien fuumlr die Forschungsvereinigung Verbrennungskraftmaschinen eV (FVV)
Patrick R Schmidt ∙ Werner Weindorf ∙ Werner Zittel
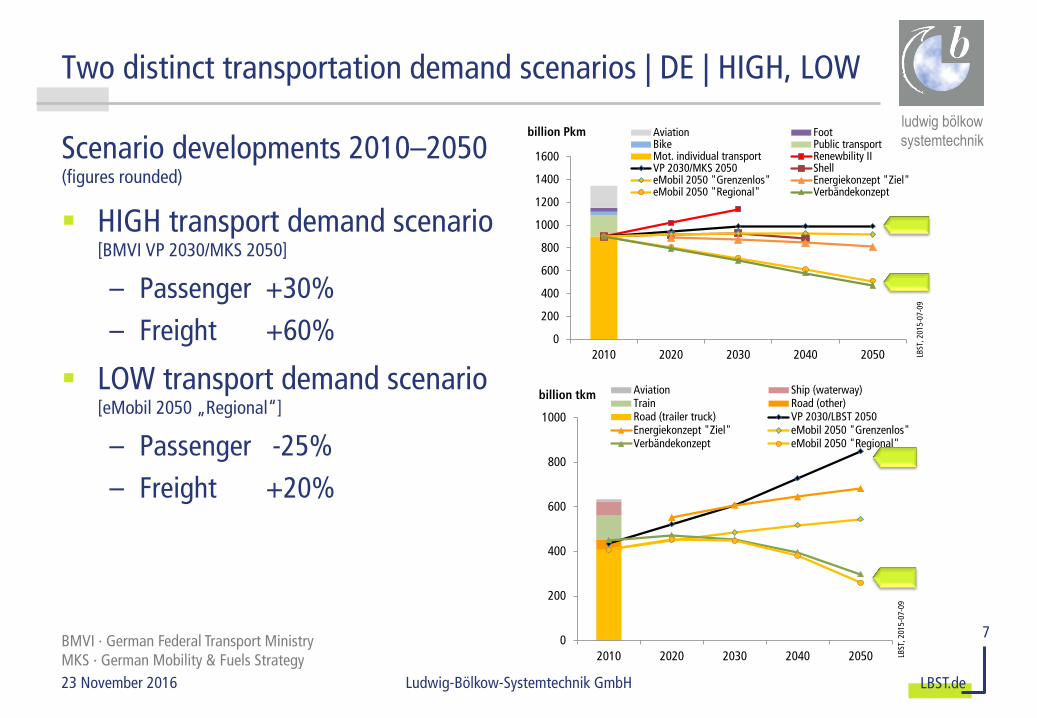
BMVI ∙ German Federal Transport Ministry MKS ∙ German Mobility amp Fuels Strategy
LBSTde 23 November 2016 Ludwig-Boumllkow-Systemtechnik GmbH
ludwig boumllkow
systemtechnik
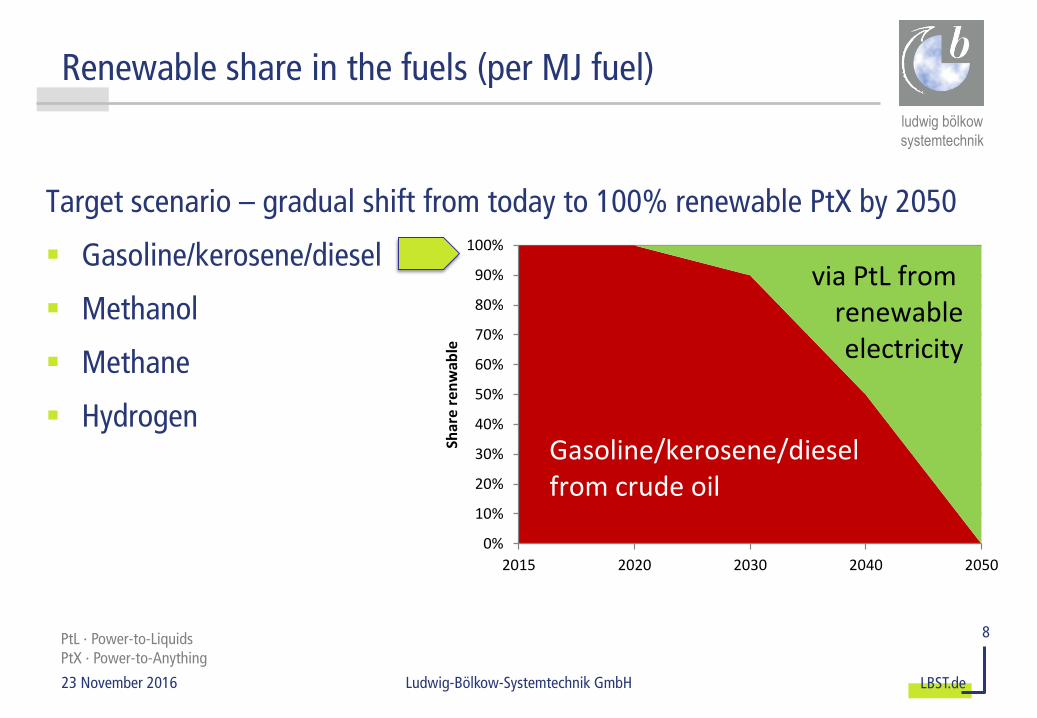
Target scenario ndash gradual shift from today to 100 renewable PtX by 2050
Gasolinekerosenediesel
Methanol
Methane
Hydrogen
0
10
20
30
40
50
60
70
80
90
100
2015 2020 2030 2040 2050
Shar
e r
en
wab
leGasolinekerosenedieselfrom crude oil
via PtL from renewableelectricity
Renewable share in the fuels (per MJ fuel)
8 PtL ∙ Power-to-Liquids PtX ∙ Power-to-Anything
LBSTde 23 November 2016 Ludwig-Boumllkow-Systemtechnik GmbH
ludwig boumllkow
systemtechnik
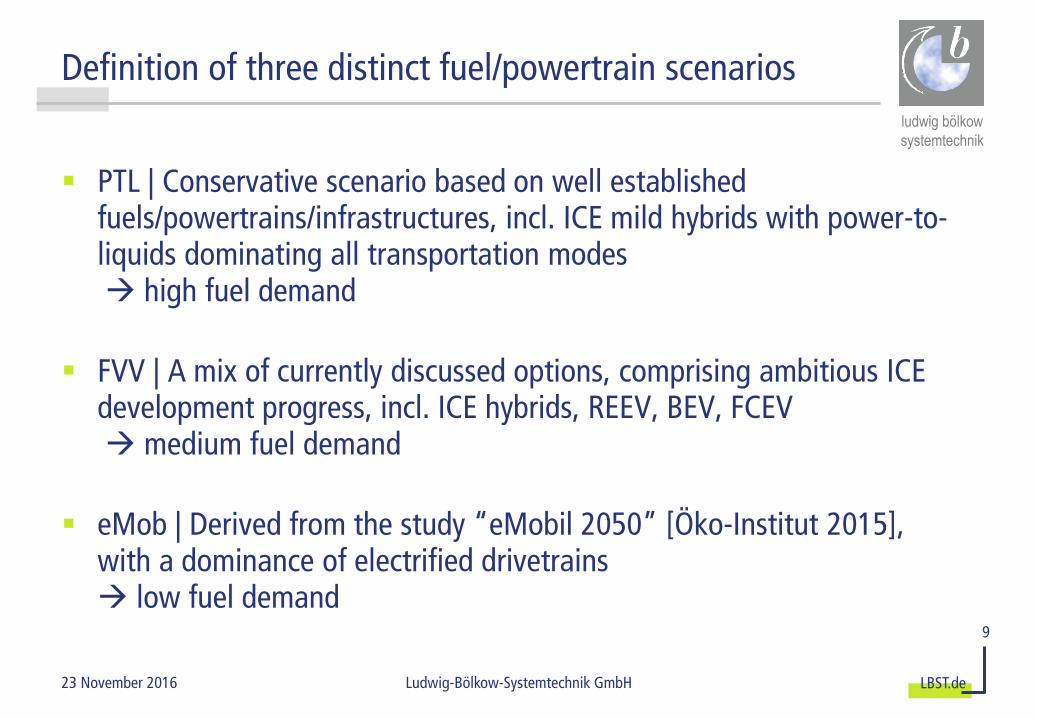
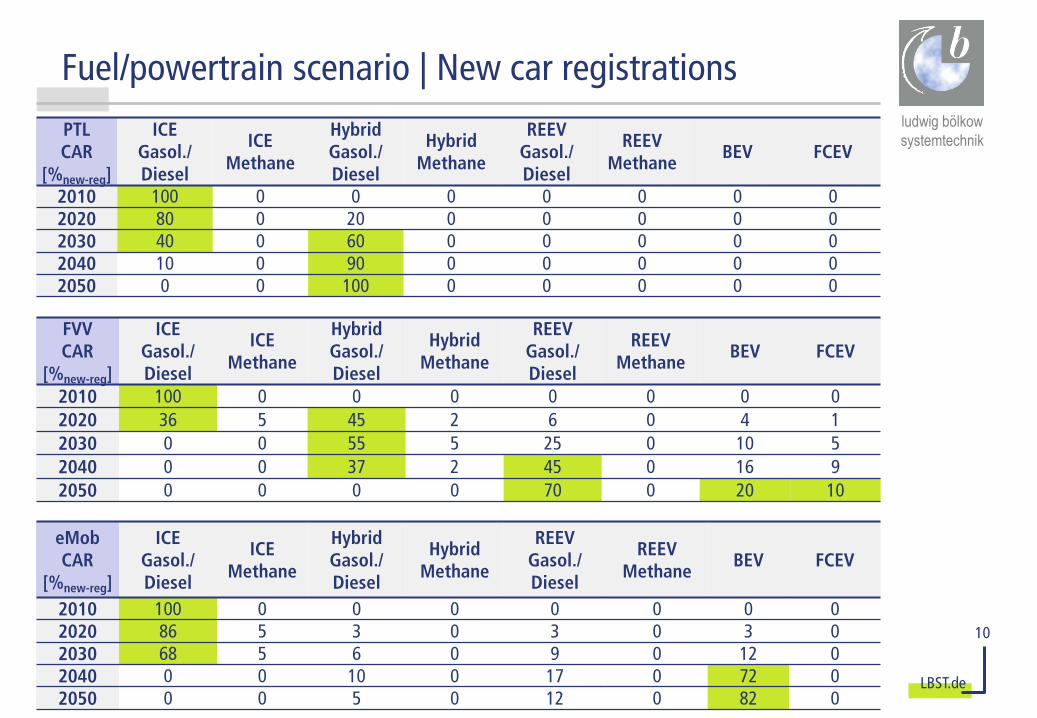
Definition of three distinct fuelpowertrain scenarios
PTL | Conservative scenario based on well established fuelspowertrainsinfrastructures incl ICE mild hybrids with power-to-liquids dominating all transportation modes high fuel demand
FVV | A mix of currently discussed options comprising ambitious ICE development progress incl ICE hybrids REEV BEV FCEV medium fuel demand
eMob | Derived from the study ldquoeMobil 2050rdquo [Oumlko-Institut 2015] with a dominance of electrified drivetrains low fuel demand
9
BEV ∙ Battery-electric vehicle eMob ∙ Electric mobility FCEV ∙ Fuel cell-electric vehicle FVV ∙ Research association PHEV ∙ Plug-in hybrid vehicle PTL ∙ Power-to-liquids REEV ∙ Range-extender vehicle
LBSTde 23 November 2016 Ludwig-Boumllkow-Systemtechnik GmbH
LBSTde 23 November 2016 Ludwig-Boumllkow-Systemtechnik GmbH
ludwig boumllkow
systemtechnik
System integration of fluctating renewable power generation
20
LBSTde 23 November 2016 Ludwig-Boumllkow-Systemtechnik GmbH
ludwig boumllkow
systemtechnik
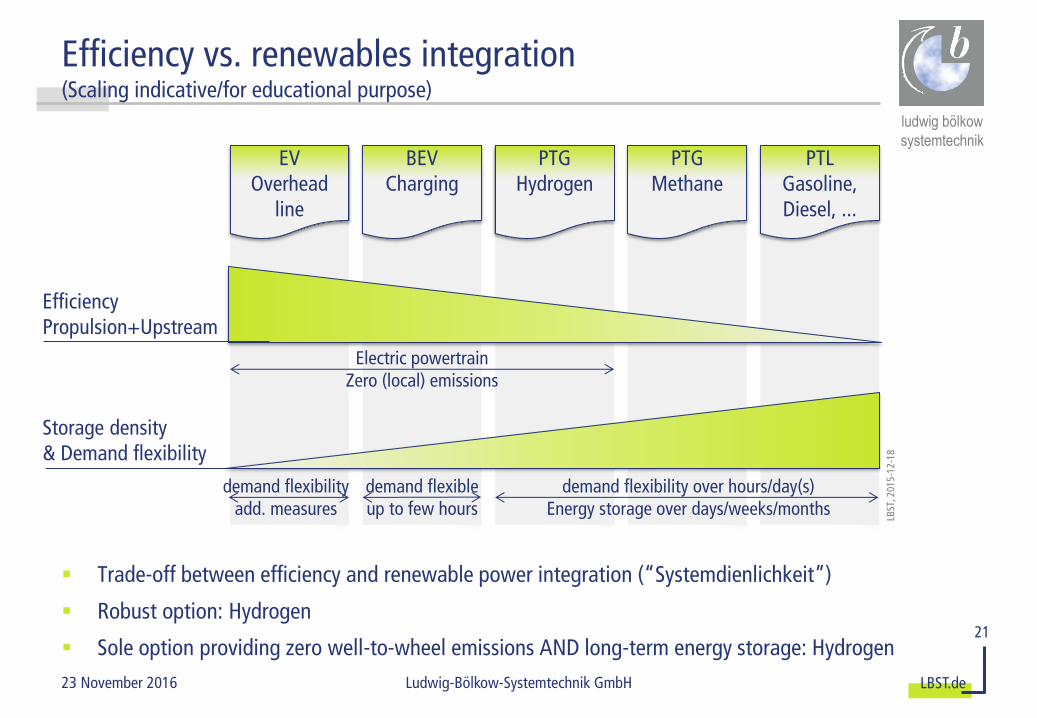
Efficiency vs renewables integration (Scaling indicativefor educational purpose)
Trade-off between efficiency and renewable power integration (ldquoSystemdienlichkeitrdquo)
Robust option Hydrogen
Sole option providing zero well-to-wheel emissions AND long-term energy storage Hydrogen
BEV battery-electric vehicle EV electric vehicle DSM demand-side management PTG power-to-gas PTL power-to-liquids
Electric powertrain Zero (local) emissions
demand flexible up to few hours
demand flexibility over hoursday(s) Energy storage over daysweeksmonths
demand flexibility add measures
LBST
201
5-12
-18
EV Overhead
line
BEV Charging
PTG Hydrogen
PTG Methane
PTL Gasoline Diesel
Efficiency Propulsion+Upstream
Storage density amp Demand flexibility
21
LBSTde 23 November 2016 Ludwig-Boumllkow-Systemtechnik GmbH
ludwig boumllkow
systemtechnik
Agenda
1 Motivation and approach
2 Scenarios
3 Results
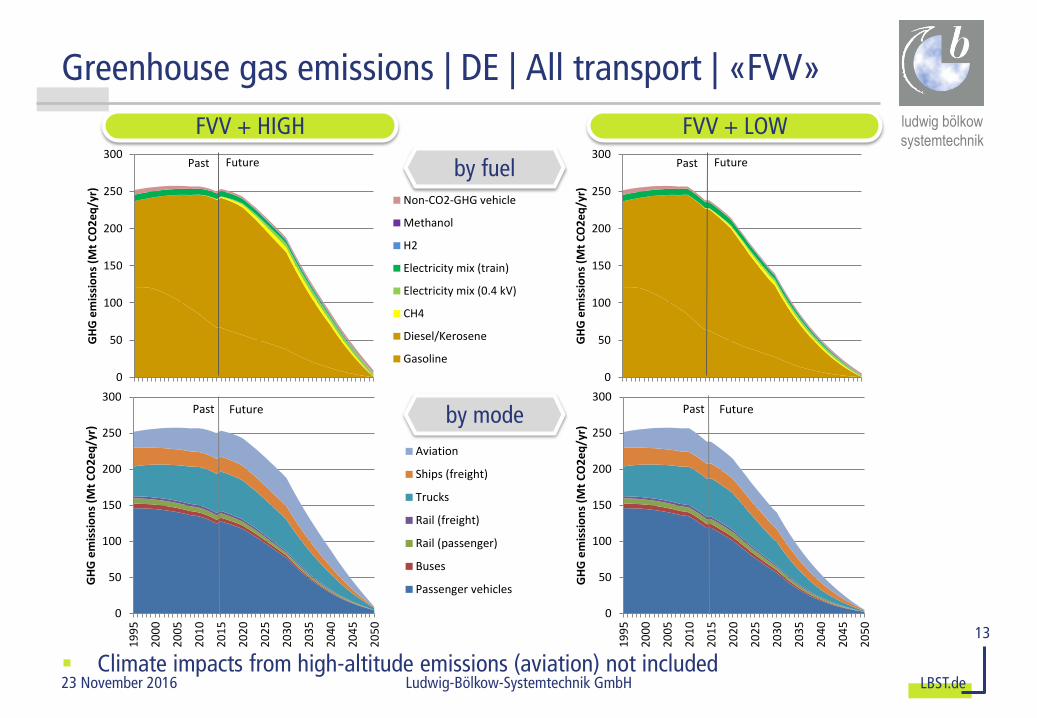
Greenhouse gas emissions
Energy demand
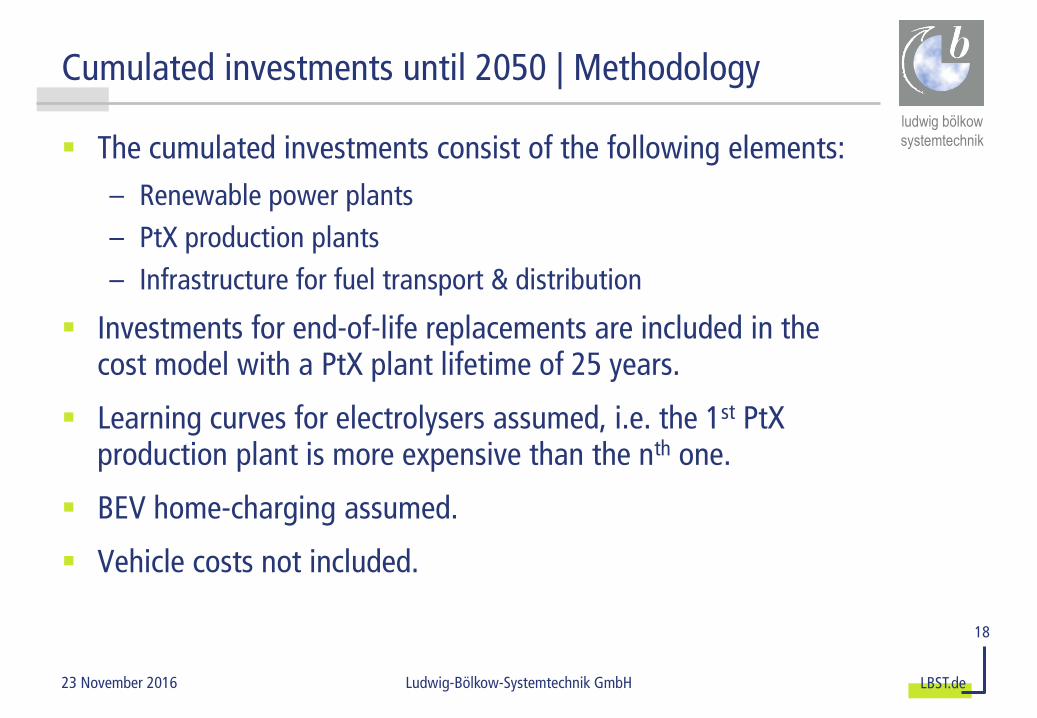
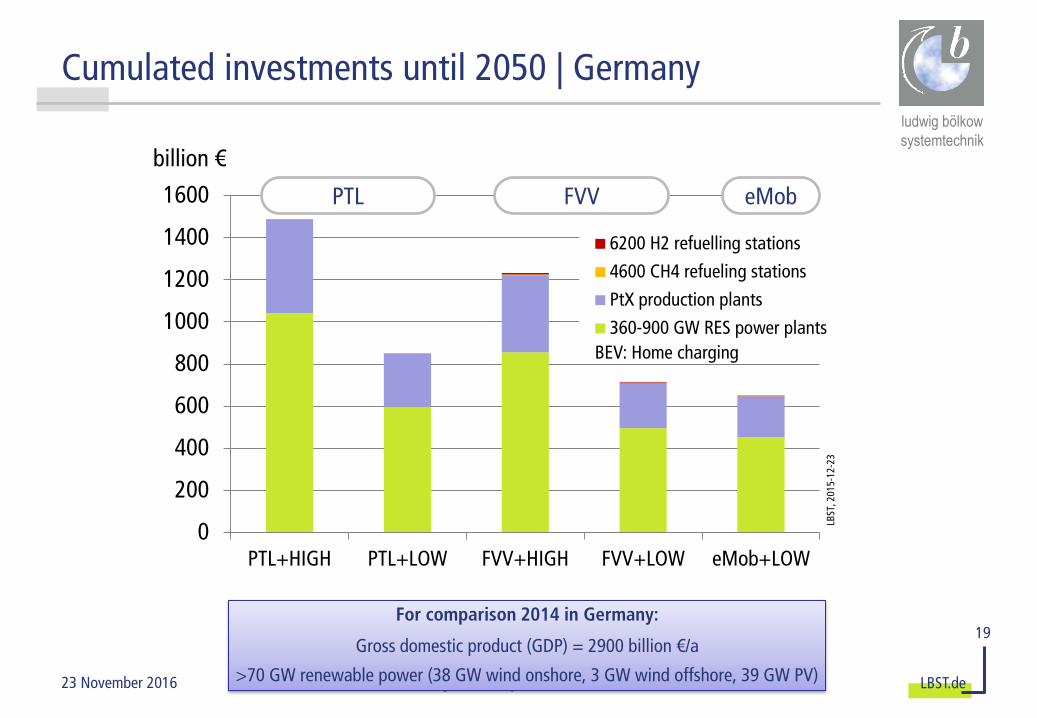
Cumulated investments
4 Conclusions
22
LBSTde 23 November 2016 Ludwig-Boumllkow-Systemtechnik GmbH
ludwig boumllkow
systemtechnik
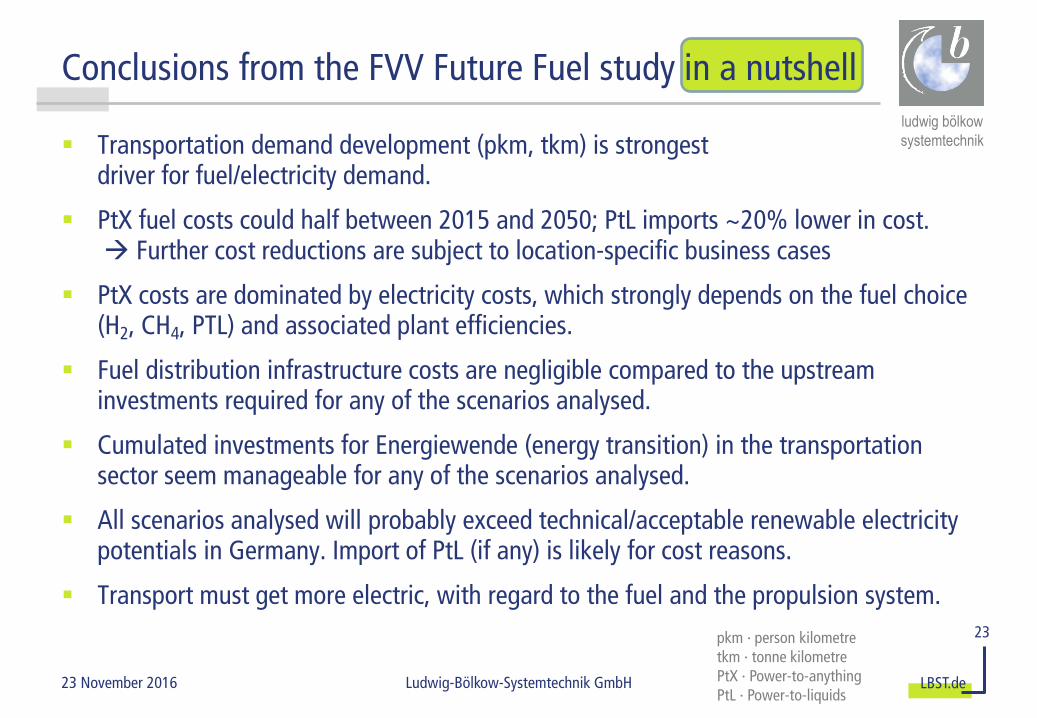
Conclusions from the FVV Future Fuel study in a nutshell
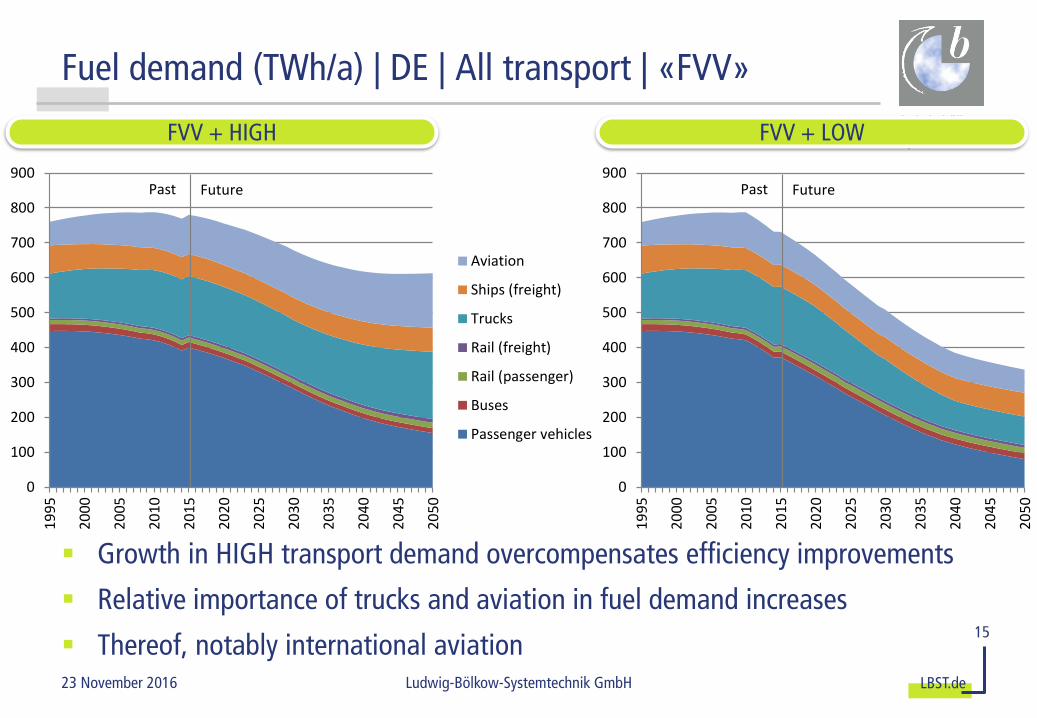
Transportation demand development (pkm tkm) is strongest driver for fuelelectricity demand
PtX fuel costs could half between 2015 and 2050 PtL imports ~20 lower in cost Further cost reductions are subject to location-specific business cases
PtX costs are dominated by electricity costs which strongly depends on the fuel choice (H2 CH4 PTL) and associated plant efficiencies
Fuel distribution infrastructure costs are negligible compared to the upstream investments required for any of the scenarios analysed
Cumulated investments for Energiewende (energy transition) in the transportation sector seem manageable for any of the scenarios analysed
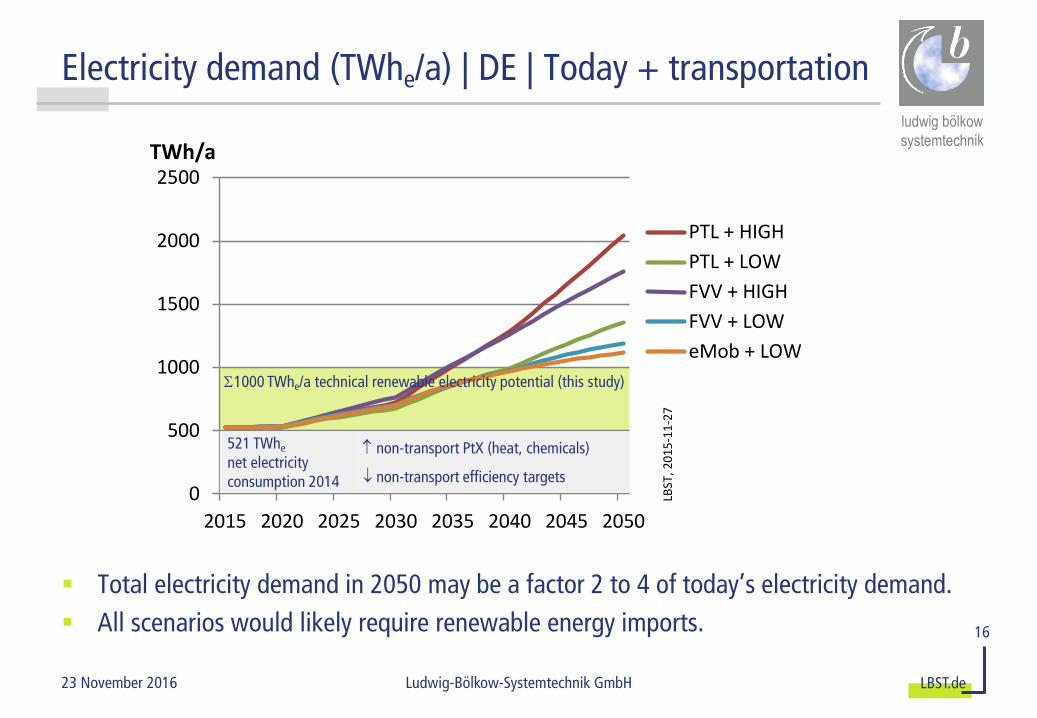
All scenarios analysed will probably exceed technicalacceptable renewable electricity potentials in Germany Import of PtL (if any) is likely for cost reasons
Transport must get more electric with regard to the fuel and the propulsion system
23 pkm ∙ person kilometre tkm ∙ tonne kilometre PtX ∙ Power-to-anything PtL ∙ Power-to-liquids
LBSTde 23 November 2016 Ludwig-Boumllkow-Systemtechnik GmbH
ludwig boumllkow
systemtechnik
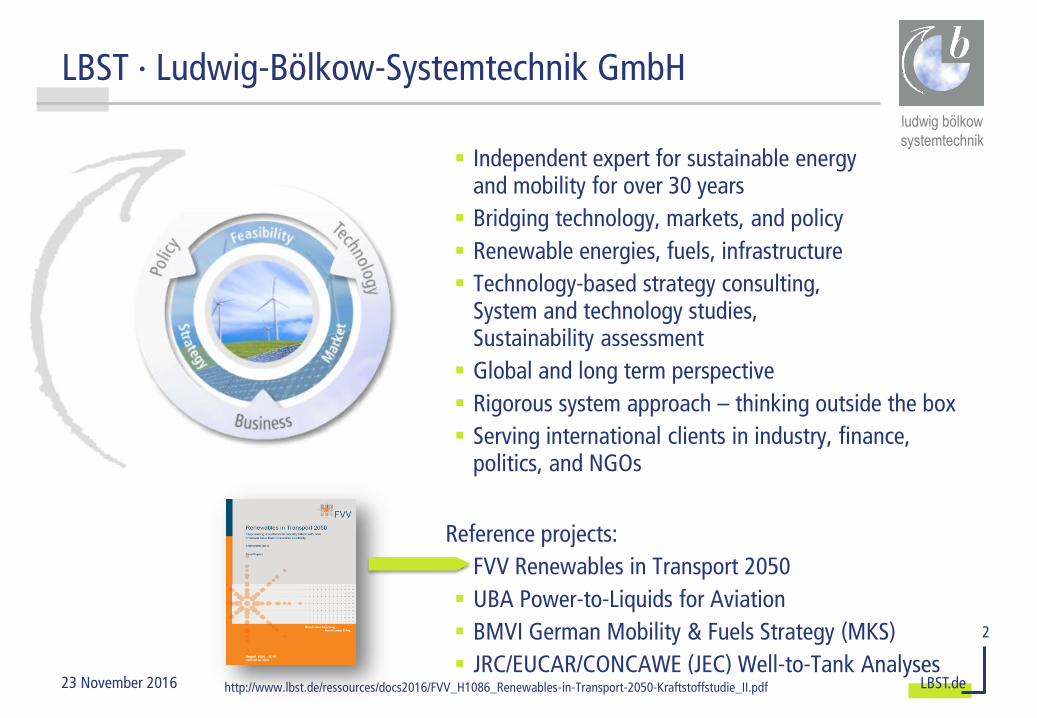
Literature
P Schmidt W Zittel W Weindorf T Raksha (LBST)
Renewables in Transport 2050 ndash Empowering a sustainable mobility future with zero emission fuels from renewable electricity ndash Europe and Germany
Research Association for Combustion Engines eV (ed)
This study was financed by the FVV and supported by members of the FVV Working Group laquoFuture Fuelsraquo
LBSTde 23 November 2016 Ludwig-Boumllkow-Systemtechnik GmbH
ludwig boumllkow
systemtechnik
ANNEX
26
LBSTde 23 November 2016 Ludwig-Boumllkow-Systemtechnik GmbH
ludwig boumllkow
systemtechnik
Technical renewable power generation potentials
27
LBSTde 23 November 2016 Ludwig-Boumllkow-Systemtechnik GmbH
ludwig boumllkow
systemtechnik
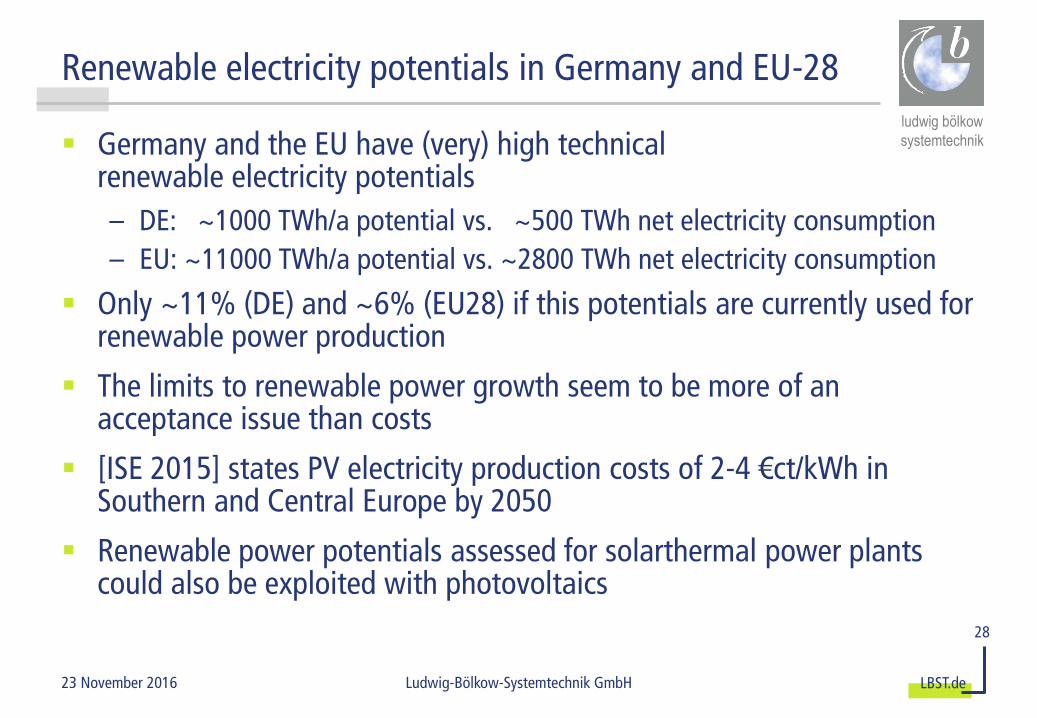
Renewable electricity potentials in Germany and EU-28
Germany and the EU have (very) high technical renewable electricity potentials
ndash DE ~1000 TWha potential vs ~500 TWh net electricity consumption
ndash EU ~11000 TWha potential vs ~2800 TWh net electricity consumption
Only ~11 (DE) and ~6 (EU28) if this potentials are currently used for renewable power production
The limits to renewable power growth seem to be more of an acceptance issue than costs
[ISE 2015] states PV electricity production costs of 2-4 euroctkWh in Southern and Central Europe by 2050
Renewable power potentials assessed for solarthermal power plants could also be exploited with photovoltaics
28
LBSTde 23 November 2016 Ludwig-Boumllkow-Systemtechnik GmbH
ludwig boumllkow
systemtechnik
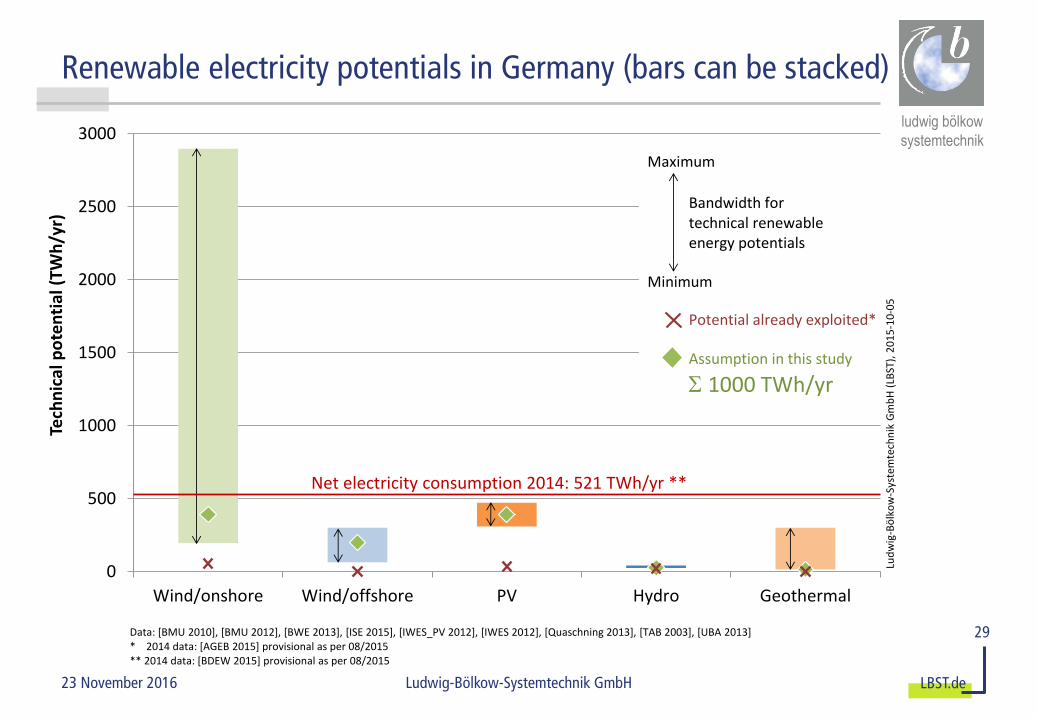
Renewable electricity potentials in Germany (bars can be stacked)
29
0
500
1000
1500
2000
2500
3000
Windonshore Windoffshore PV Hydro Geothermal
Tech
nic
al p
ote
nti
al (
TWh
yr)
Net electricity consumption 2014 521 TWhyr
Lud
wig
-Bouml
lko
w-S
yste
mte
chn
ik G
mb
H (
LBST
) 2
01
5-1
0-0
5
Maximum
Minimum
Bandwidth for technical renewableenergy potentials
Assumption in this study
1000 TWhyr
Potential already exploited
Data [BMU 2010] [BMU 2012] [BWE 2013] [ISE 2015] [IWES_PV 2012] [IWES 2012] [Quaschning 2013] [TAB 2003] [UBA 2013] 2014 data [AGEB 2015] provisional as per 082015 2014 data [BDEW 2015] provisional as per 082015
LBSTde 23 November 2016 Ludwig-Boumllkow-Systemtechnik GmbH
ludwig boumllkow
systemtechnik
CO2 avoidance costs
30
LBSTde 23 November 2016 Ludwig-Boumllkow-Systemtechnik GmbH
BMVI ∙ German Federal Transport Ministry MKS ∙ German Mobility amp Fuels Strategy
LBSTde 23 November 2016 Ludwig-Boumllkow-Systemtechnik GmbH
ludwig boumllkow
systemtechnik
Target scenario ndash gradual shift from today to 100 renewable PtX by 2050
Gasolinekerosenediesel
Methanol
Methane
Hydrogen
0
10
20
30
40
50
60
70
80
90
100
2015 2020 2030 2040 2050
Shar
e r
en
wab
leGasolinekerosenedieselfrom crude oil
via PtL from renewableelectricity
Renewable share in the fuels (per MJ fuel)
8 PtL ∙ Power-to-Liquids PtX ∙ Power-to-Anything
LBSTde 23 November 2016 Ludwig-Boumllkow-Systemtechnik GmbH
ludwig boumllkow
systemtechnik
Definition of three distinct fuelpowertrain scenarios
PTL | Conservative scenario based on well established fuelspowertrainsinfrastructures incl ICE mild hybrids with power-to-liquids dominating all transportation modes high fuel demand
FVV | A mix of currently discussed options comprising ambitious ICE development progress incl ICE hybrids REEV BEV FCEV medium fuel demand
eMob | Derived from the study ldquoeMobil 2050rdquo [Oumlko-Institut 2015] with a dominance of electrified drivetrains low fuel demand
9
BEV ∙ Battery-electric vehicle eMob ∙ Electric mobility FCEV ∙ Fuel cell-electric vehicle FVV ∙ Research association PHEV ∙ Plug-in hybrid vehicle PTL ∙ Power-to-liquids REEV ∙ Range-extender vehicle
LBSTde 23 November 2016 Ludwig-Boumllkow-Systemtechnik GmbH
LBSTde 23 November 2016 Ludwig-Boumllkow-Systemtechnik GmbH
ludwig boumllkow
systemtechnik
System integration of fluctating renewable power generation
20
LBSTde 23 November 2016 Ludwig-Boumllkow-Systemtechnik GmbH
ludwig boumllkow
systemtechnik
Efficiency vs renewables integration (Scaling indicativefor educational purpose)
Trade-off between efficiency and renewable power integration (ldquoSystemdienlichkeitrdquo)
Robust option Hydrogen
Sole option providing zero well-to-wheel emissions AND long-term energy storage Hydrogen
BEV battery-electric vehicle EV electric vehicle DSM demand-side management PTG power-to-gas PTL power-to-liquids
Electric powertrain Zero (local) emissions
demand flexible up to few hours
demand flexibility over hoursday(s) Energy storage over daysweeksmonths
demand flexibility add measures
LBST
201
5-12
-18
EV Overhead
line
BEV Charging
PTG Hydrogen
PTG Methane
PTL Gasoline Diesel
Efficiency Propulsion+Upstream
Storage density amp Demand flexibility
21
LBSTde 23 November 2016 Ludwig-Boumllkow-Systemtechnik GmbH
ludwig boumllkow
systemtechnik
Agenda
1 Motivation and approach
2 Scenarios
3 Results
Greenhouse gas emissions
Energy demand
Cumulated investments
4 Conclusions
22
LBSTde 23 November 2016 Ludwig-Boumllkow-Systemtechnik GmbH
ludwig boumllkow
systemtechnik
Conclusions from the FVV Future Fuel study in a nutshell
Transportation demand development (pkm tkm) is strongest driver for fuelelectricity demand
PtX fuel costs could half between 2015 and 2050 PtL imports ~20 lower in cost Further cost reductions are subject to location-specific business cases
PtX costs are dominated by electricity costs which strongly depends on the fuel choice (H2 CH4 PTL) and associated plant efficiencies
Fuel distribution infrastructure costs are negligible compared to the upstream investments required for any of the scenarios analysed
Cumulated investments for Energiewende (energy transition) in the transportation sector seem manageable for any of the scenarios analysed
All scenarios analysed will probably exceed technicalacceptable renewable electricity potentials in Germany Import of PtL (if any) is likely for cost reasons
Transport must get more electric with regard to the fuel and the propulsion system
23 pkm ∙ person kilometre tkm ∙ tonne kilometre PtX ∙ Power-to-anything PtL ∙ Power-to-liquids
LBSTde 23 November 2016 Ludwig-Boumllkow-Systemtechnik GmbH
ludwig boumllkow
systemtechnik
Literature
P Schmidt W Zittel W Weindorf T Raksha (LBST)
Renewables in Transport 2050 ndash Empowering a sustainable mobility future with zero emission fuels from renewable electricity ndash Europe and Germany
Research Association for Combustion Engines eV (ed)
This study was financed by the FVV and supported by members of the FVV Working Group laquoFuture Fuelsraquo
LBSTde 23 November 2016 Ludwig-Boumllkow-Systemtechnik GmbH
ludwig boumllkow
systemtechnik
ANNEX
26
LBSTde 23 November 2016 Ludwig-Boumllkow-Systemtechnik GmbH
ludwig boumllkow
systemtechnik
Technical renewable power generation potentials
27
LBSTde 23 November 2016 Ludwig-Boumllkow-Systemtechnik GmbH
ludwig boumllkow
systemtechnik
Renewable electricity potentials in Germany and EU-28
Germany and the EU have (very) high technical renewable electricity potentials
ndash DE ~1000 TWha potential vs ~500 TWh net electricity consumption
ndash EU ~11000 TWha potential vs ~2800 TWh net electricity consumption
Only ~11 (DE) and ~6 (EU28) if this potentials are currently used for renewable power production
The limits to renewable power growth seem to be more of an acceptance issue than costs
[ISE 2015] states PV electricity production costs of 2-4 euroctkWh in Southern and Central Europe by 2050
Renewable power potentials assessed for solarthermal power plants could also be exploited with photovoltaics
28
LBSTde 23 November 2016 Ludwig-Boumllkow-Systemtechnik GmbH
ludwig boumllkow
systemtechnik
Renewable electricity potentials in Germany (bars can be stacked)
29
0
500
1000
1500
2000
2500
3000
Windonshore Windoffshore PV Hydro Geothermal
Tech
nic
al p
ote
nti
al (
TWh
yr)
Net electricity consumption 2014 521 TWhyr
Lud
wig
-Bouml
lko
w-S
yste
mte
chn
ik G
mb
H (
LBST
) 2
01
5-1
0-0
5
Maximum
Minimum
Bandwidth for technical renewableenergy potentials
Assumption in this study
1000 TWhyr
Potential already exploited
Data [BMU 2010] [BMU 2012] [BWE 2013] [ISE 2015] [IWES_PV 2012] [IWES 2012] [Quaschning 2013] [TAB 2003] [UBA 2013] 2014 data [AGEB 2015] provisional as per 082015 2014 data [BDEW 2015] provisional as per 082015
LBSTde 23 November 2016 Ludwig-Boumllkow-Systemtechnik GmbH
ludwig boumllkow
systemtechnik
CO2 avoidance costs
30
LBSTde 23 November 2016 Ludwig-Boumllkow-Systemtechnik GmbH
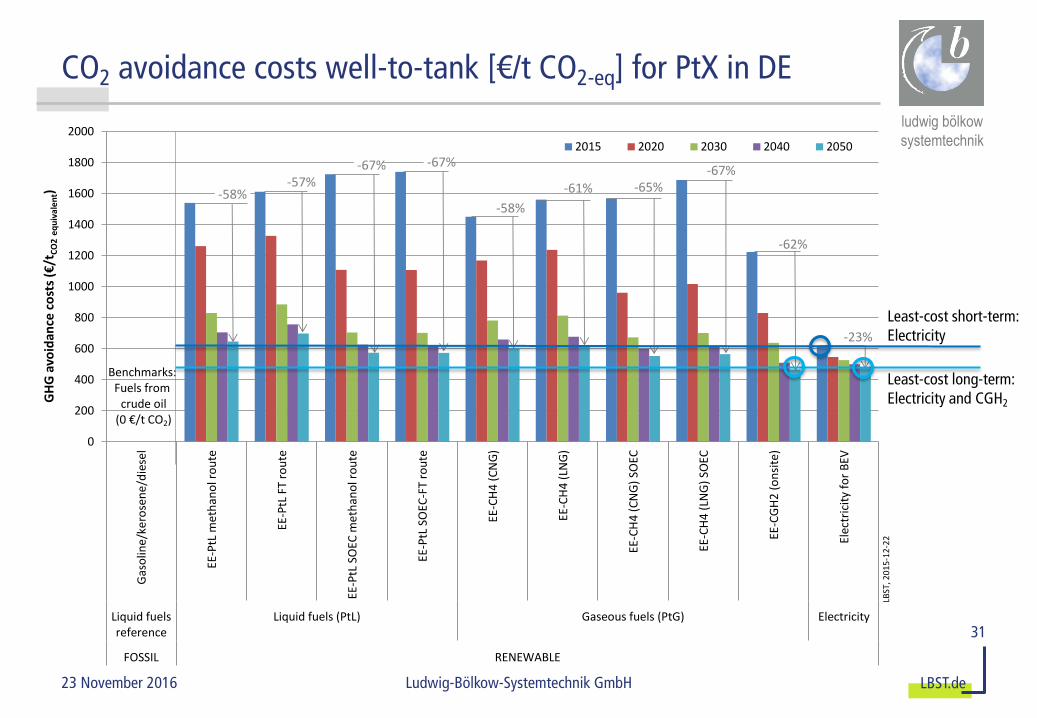
CO2 avoidance costs well-to-tank [eurot CO2-eq] for PtX in DE
31
Least-cost short-term Electricity
Least-cost long-term Electricity and CGH2
LBSTde 23 November 2016 Ludwig-Boumllkow-Systemtechnik GmbH
ludwig boumllkow
systemtechnik
Target scenario ndash gradual shift from today to 100 renewable PtX by 2050
Gasolinekerosenediesel
Methanol
Methane
Hydrogen
0
10
20
30
40
50
60
70
80
90
100
2015 2020 2030 2040 2050
Shar
e r
en
wab
leGasolinekerosenedieselfrom crude oil
via PtL from renewableelectricity
Renewable share in the fuels (per MJ fuel)
8 PtL ∙ Power-to-Liquids PtX ∙ Power-to-Anything
LBSTde 23 November 2016 Ludwig-Boumllkow-Systemtechnik GmbH
ludwig boumllkow
systemtechnik
Definition of three distinct fuelpowertrain scenarios
PTL | Conservative scenario based on well established fuelspowertrainsinfrastructures incl ICE mild hybrids with power-to-liquids dominating all transportation modes high fuel demand
FVV | A mix of currently discussed options comprising ambitious ICE development progress incl ICE hybrids REEV BEV FCEV medium fuel demand
eMob | Derived from the study ldquoeMobil 2050rdquo [Oumlko-Institut 2015] with a dominance of electrified drivetrains low fuel demand
9
BEV ∙ Battery-electric vehicle eMob ∙ Electric mobility FCEV ∙ Fuel cell-electric vehicle FVV ∙ Research association PHEV ∙ Plug-in hybrid vehicle PTL ∙ Power-to-liquids REEV ∙ Range-extender vehicle
LBSTde 23 November 2016 Ludwig-Boumllkow-Systemtechnik GmbH
LBSTde 23 November 2016 Ludwig-Boumllkow-Systemtechnik GmbH
ludwig boumllkow
systemtechnik
System integration of fluctating renewable power generation
20
LBSTde 23 November 2016 Ludwig-Boumllkow-Systemtechnik GmbH
ludwig boumllkow
systemtechnik
Efficiency vs renewables integration (Scaling indicativefor educational purpose)
Trade-off between efficiency and renewable power integration (ldquoSystemdienlichkeitrdquo)
Robust option Hydrogen
Sole option providing zero well-to-wheel emissions AND long-term energy storage Hydrogen
BEV battery-electric vehicle EV electric vehicle DSM demand-side management PTG power-to-gas PTL power-to-liquids
Electric powertrain Zero (local) emissions
demand flexible up to few hours
demand flexibility over hoursday(s) Energy storage over daysweeksmonths
demand flexibility add measures
LBST
201
5-12
-18
EV Overhead
line
BEV Charging
PTG Hydrogen
PTG Methane
PTL Gasoline Diesel
Efficiency Propulsion+Upstream
Storage density amp Demand flexibility
21
LBSTde 23 November 2016 Ludwig-Boumllkow-Systemtechnik GmbH
ludwig boumllkow
systemtechnik
Agenda
1 Motivation and approach
2 Scenarios
3 Results
Greenhouse gas emissions
Energy demand
Cumulated investments
4 Conclusions
22
LBSTde 23 November 2016 Ludwig-Boumllkow-Systemtechnik GmbH
ludwig boumllkow
systemtechnik
Conclusions from the FVV Future Fuel study in a nutshell
Transportation demand development (pkm tkm) is strongest driver for fuelelectricity demand
PtX fuel costs could half between 2015 and 2050 PtL imports ~20 lower in cost Further cost reductions are subject to location-specific business cases
PtX costs are dominated by electricity costs which strongly depends on the fuel choice (H2 CH4 PTL) and associated plant efficiencies
Fuel distribution infrastructure costs are negligible compared to the upstream investments required for any of the scenarios analysed
Cumulated investments for Energiewende (energy transition) in the transportation sector seem manageable for any of the scenarios analysed
All scenarios analysed will probably exceed technicalacceptable renewable electricity potentials in Germany Import of PtL (if any) is likely for cost reasons
Transport must get more electric with regard to the fuel and the propulsion system
23 pkm ∙ person kilometre tkm ∙ tonne kilometre PtX ∙ Power-to-anything PtL ∙ Power-to-liquids
LBSTde 23 November 2016 Ludwig-Boumllkow-Systemtechnik GmbH
ludwig boumllkow
systemtechnik
Literature
P Schmidt W Zittel W Weindorf T Raksha (LBST)
Renewables in Transport 2050 ndash Empowering a sustainable mobility future with zero emission fuels from renewable electricity ndash Europe and Germany
Research Association for Combustion Engines eV (ed)
This study was financed by the FVV and supported by members of the FVV Working Group laquoFuture Fuelsraquo
LBSTde 23 November 2016 Ludwig-Boumllkow-Systemtechnik GmbH
ludwig boumllkow
systemtechnik
ANNEX
26
LBSTde 23 November 2016 Ludwig-Boumllkow-Systemtechnik GmbH
ludwig boumllkow
systemtechnik
Technical renewable power generation potentials
27
LBSTde 23 November 2016 Ludwig-Boumllkow-Systemtechnik GmbH
ludwig boumllkow
systemtechnik
Renewable electricity potentials in Germany and EU-28
Germany and the EU have (very) high technical renewable electricity potentials
ndash DE ~1000 TWha potential vs ~500 TWh net electricity consumption
ndash EU ~11000 TWha potential vs ~2800 TWh net electricity consumption
Only ~11 (DE) and ~6 (EU28) if this potentials are currently used for renewable power production
The limits to renewable power growth seem to be more of an acceptance issue than costs
[ISE 2015] states PV electricity production costs of 2-4 euroctkWh in Southern and Central Europe by 2050
Renewable power potentials assessed for solarthermal power plants could also be exploited with photovoltaics
28
LBSTde 23 November 2016 Ludwig-Boumllkow-Systemtechnik GmbH
ludwig boumllkow
systemtechnik
Renewable electricity potentials in Germany (bars can be stacked)
29
0
500
1000
1500
2000
2500
3000
Windonshore Windoffshore PV Hydro Geothermal
Tech
nic
al p
ote
nti
al (
TWh
yr)
Net electricity consumption 2014 521 TWhyr
Lud
wig
-Bouml
lko
w-S
yste
mte
chn
ik G
mb
H (
LBST
) 2
01
5-1
0-0
5
Maximum
Minimum
Bandwidth for technical renewableenergy potentials
Assumption in this study
1000 TWhyr
Potential already exploited
Data [BMU 2010] [BMU 2012] [BWE 2013] [ISE 2015] [IWES_PV 2012] [IWES 2012] [Quaschning 2013] [TAB 2003] [UBA 2013] 2014 data [AGEB 2015] provisional as per 082015 2014 data [BDEW 2015] provisional as per 082015
LBSTde 23 November 2016 Ludwig-Boumllkow-Systemtechnik GmbH
ludwig boumllkow
systemtechnik
CO2 avoidance costs
30
LBSTde 23 November 2016 Ludwig-Boumllkow-Systemtechnik GmbH
CO2 avoidance costs well-to-tank [eurot CO2-eq] for PtX in DE
31
Least-cost short-term Electricity
Least-cost long-term Electricity and CGH2
LBSTde 23 November 2016 Ludwig-Boumllkow-Systemtechnik GmbH
ludwig boumllkow
systemtechnik
Definition of three distinct fuelpowertrain scenarios
PTL | Conservative scenario based on well established fuelspowertrainsinfrastructures incl ICE mild hybrids with power-to-liquids dominating all transportation modes high fuel demand
FVV | A mix of currently discussed options comprising ambitious ICE development progress incl ICE hybrids REEV BEV FCEV medium fuel demand
eMob | Derived from the study ldquoeMobil 2050rdquo [Oumlko-Institut 2015] with a dominance of electrified drivetrains low fuel demand
9
BEV ∙ Battery-electric vehicle eMob ∙ Electric mobility FCEV ∙ Fuel cell-electric vehicle FVV ∙ Research association PHEV ∙ Plug-in hybrid vehicle PTL ∙ Power-to-liquids REEV ∙ Range-extender vehicle
LBSTde 23 November 2016 Ludwig-Boumllkow-Systemtechnik GmbH
LBSTde 23 November 2016 Ludwig-Boumllkow-Systemtechnik GmbH
ludwig boumllkow
systemtechnik
System integration of fluctating renewable power generation
20
LBSTde 23 November 2016 Ludwig-Boumllkow-Systemtechnik GmbH
ludwig boumllkow
systemtechnik
Efficiency vs renewables integration (Scaling indicativefor educational purpose)
Trade-off between efficiency and renewable power integration (ldquoSystemdienlichkeitrdquo)
Robust option Hydrogen
Sole option providing zero well-to-wheel emissions AND long-term energy storage Hydrogen
BEV battery-electric vehicle EV electric vehicle DSM demand-side management PTG power-to-gas PTL power-to-liquids
Electric powertrain Zero (local) emissions
demand flexible up to few hours
demand flexibility over hoursday(s) Energy storage over daysweeksmonths
demand flexibility add measures
LBST
201
5-12
-18
EV Overhead
line
BEV Charging
PTG Hydrogen
PTG Methane
PTL Gasoline Diesel
Efficiency Propulsion+Upstream
Storage density amp Demand flexibility
21
LBSTde 23 November 2016 Ludwig-Boumllkow-Systemtechnik GmbH
ludwig boumllkow
systemtechnik
Agenda
1 Motivation and approach
2 Scenarios
3 Results
Greenhouse gas emissions
Energy demand
Cumulated investments
4 Conclusions
22
LBSTde 23 November 2016 Ludwig-Boumllkow-Systemtechnik GmbH
ludwig boumllkow
systemtechnik
Conclusions from the FVV Future Fuel study in a nutshell
Transportation demand development (pkm tkm) is strongest driver for fuelelectricity demand
PtX fuel costs could half between 2015 and 2050 PtL imports ~20 lower in cost Further cost reductions are subject to location-specific business cases
PtX costs are dominated by electricity costs which strongly depends on the fuel choice (H2 CH4 PTL) and associated plant efficiencies
Fuel distribution infrastructure costs are negligible compared to the upstream investments required for any of the scenarios analysed
Cumulated investments for Energiewende (energy transition) in the transportation sector seem manageable for any of the scenarios analysed
All scenarios analysed will probably exceed technicalacceptable renewable electricity potentials in Germany Import of PtL (if any) is likely for cost reasons
Transport must get more electric with regard to the fuel and the propulsion system
23 pkm ∙ person kilometre tkm ∙ tonne kilometre PtX ∙ Power-to-anything PtL ∙ Power-to-liquids
LBSTde 23 November 2016 Ludwig-Boumllkow-Systemtechnik GmbH
ludwig boumllkow
systemtechnik
Literature
P Schmidt W Zittel W Weindorf T Raksha (LBST)
Renewables in Transport 2050 ndash Empowering a sustainable mobility future with zero emission fuels from renewable electricity ndash Europe and Germany
Research Association for Combustion Engines eV (ed)
This study was financed by the FVV and supported by members of the FVV Working Group laquoFuture Fuelsraquo
LBSTde 23 November 2016 Ludwig-Boumllkow-Systemtechnik GmbH
ludwig boumllkow
systemtechnik
ANNEX
26
LBSTde 23 November 2016 Ludwig-Boumllkow-Systemtechnik GmbH
ludwig boumllkow
systemtechnik
Technical renewable power generation potentials
27
LBSTde 23 November 2016 Ludwig-Boumllkow-Systemtechnik GmbH
ludwig boumllkow
systemtechnik
Renewable electricity potentials in Germany and EU-28
Germany and the EU have (very) high technical renewable electricity potentials
ndash DE ~1000 TWha potential vs ~500 TWh net electricity consumption
ndash EU ~11000 TWha potential vs ~2800 TWh net electricity consumption
Only ~11 (DE) and ~6 (EU28) if this potentials are currently used for renewable power production
The limits to renewable power growth seem to be more of an acceptance issue than costs
[ISE 2015] states PV electricity production costs of 2-4 euroctkWh in Southern and Central Europe by 2050
Renewable power potentials assessed for solarthermal power plants could also be exploited with photovoltaics
28
LBSTde 23 November 2016 Ludwig-Boumllkow-Systemtechnik GmbH
ludwig boumllkow
systemtechnik
Renewable electricity potentials in Germany (bars can be stacked)
29
0
500
1000
1500
2000
2500
3000
Windonshore Windoffshore PV Hydro Geothermal
Tech
nic
al p
ote
nti
al (
TWh
yr)
Net electricity consumption 2014 521 TWhyr
Lud
wig
-Bouml
lko
w-S
yste
mte
chn
ik G
mb
H (
LBST
) 2
01
5-1
0-0
5
Maximum
Minimum
Bandwidth for technical renewableenergy potentials
Assumption in this study
1000 TWhyr
Potential already exploited
Data [BMU 2010] [BMU 2012] [BWE 2013] [ISE 2015] [IWES_PV 2012] [IWES 2012] [Quaschning 2013] [TAB 2003] [UBA 2013] 2014 data [AGEB 2015] provisional as per 082015 2014 data [BDEW 2015] provisional as per 082015
LBSTde 23 November 2016 Ludwig-Boumllkow-Systemtechnik GmbH
ludwig boumllkow
systemtechnik
CO2 avoidance costs
30
LBSTde 23 November 2016 Ludwig-Boumllkow-Systemtechnik GmbH
LBSTde 23 November 2016 Ludwig-Boumllkow-Systemtechnik GmbH
ludwig boumllkow
systemtechnik
System integration of fluctating renewable power generation
20
LBSTde 23 November 2016 Ludwig-Boumllkow-Systemtechnik GmbH
ludwig boumllkow
systemtechnik
Efficiency vs renewables integration (Scaling indicativefor educational purpose)
Trade-off between efficiency and renewable power integration (ldquoSystemdienlichkeitrdquo)
Robust option Hydrogen
Sole option providing zero well-to-wheel emissions AND long-term energy storage Hydrogen
BEV battery-electric vehicle EV electric vehicle DSM demand-side management PTG power-to-gas PTL power-to-liquids
Electric powertrain Zero (local) emissions
demand flexible up to few hours
demand flexibility over hoursday(s) Energy storage over daysweeksmonths
demand flexibility add measures
LBST
201
5-12
-18
EV Overhead
line
BEV Charging
PTG Hydrogen
PTG Methane
PTL Gasoline Diesel
Efficiency Propulsion+Upstream
Storage density amp Demand flexibility
21
LBSTde 23 November 2016 Ludwig-Boumllkow-Systemtechnik GmbH
ludwig boumllkow
systemtechnik
Agenda
1 Motivation and approach
2 Scenarios
3 Results
Greenhouse gas emissions
Energy demand
Cumulated investments
4 Conclusions
22
LBSTde 23 November 2016 Ludwig-Boumllkow-Systemtechnik GmbH
ludwig boumllkow
systemtechnik
Conclusions from the FVV Future Fuel study in a nutshell
Transportation demand development (pkm tkm) is strongest driver for fuelelectricity demand
PtX fuel costs could half between 2015 and 2050 PtL imports ~20 lower in cost Further cost reductions are subject to location-specific business cases
PtX costs are dominated by electricity costs which strongly depends on the fuel choice (H2 CH4 PTL) and associated plant efficiencies
Fuel distribution infrastructure costs are negligible compared to the upstream investments required for any of the scenarios analysed
Cumulated investments for Energiewende (energy transition) in the transportation sector seem manageable for any of the scenarios analysed
All scenarios analysed will probably exceed technicalacceptable renewable electricity potentials in Germany Import of PtL (if any) is likely for cost reasons
Transport must get more electric with regard to the fuel and the propulsion system
23 pkm ∙ person kilometre tkm ∙ tonne kilometre PtX ∙ Power-to-anything PtL ∙ Power-to-liquids
LBSTde 23 November 2016 Ludwig-Boumllkow-Systemtechnik GmbH
ludwig boumllkow
systemtechnik
Literature
P Schmidt W Zittel W Weindorf T Raksha (LBST)
Renewables in Transport 2050 ndash Empowering a sustainable mobility future with zero emission fuels from renewable electricity ndash Europe and Germany
Research Association for Combustion Engines eV (ed)
This study was financed by the FVV and supported by members of the FVV Working Group laquoFuture Fuelsraquo
LBSTde 23 November 2016 Ludwig-Boumllkow-Systemtechnik GmbH
ludwig boumllkow
systemtechnik
ANNEX
26
LBSTde 23 November 2016 Ludwig-Boumllkow-Systemtechnik GmbH
ludwig boumllkow
systemtechnik
Technical renewable power generation potentials
27
LBSTde 23 November 2016 Ludwig-Boumllkow-Systemtechnik GmbH
ludwig boumllkow
systemtechnik
Renewable electricity potentials in Germany and EU-28
Germany and the EU have (very) high technical renewable electricity potentials
ndash DE ~1000 TWha potential vs ~500 TWh net electricity consumption
ndash EU ~11000 TWha potential vs ~2800 TWh net electricity consumption
Only ~11 (DE) and ~6 (EU28) if this potentials are currently used for renewable power production
The limits to renewable power growth seem to be more of an acceptance issue than costs
[ISE 2015] states PV electricity production costs of 2-4 euroctkWh in Southern and Central Europe by 2050
Renewable power potentials assessed for solarthermal power plants could also be exploited with photovoltaics
28
LBSTde 23 November 2016 Ludwig-Boumllkow-Systemtechnik GmbH
ludwig boumllkow
systemtechnik
Renewable electricity potentials in Germany (bars can be stacked)
29
0
500
1000
1500
2000
2500
3000
Windonshore Windoffshore PV Hydro Geothermal
Tech
nic
al p
ote
nti
al (
TWh
yr)
Net electricity consumption 2014 521 TWhyr
Lud
wig
-Bouml
lko
w-S
yste
mte
chn
ik G
mb
H (
LBST
) 2
01
5-1
0-0
5
Maximum
Minimum
Bandwidth for technical renewableenergy potentials
Assumption in this study
1000 TWhyr
Potential already exploited
Data [BMU 2010] [BMU 2012] [BWE 2013] [ISE 2015] [IWES_PV 2012] [IWES 2012] [Quaschning 2013] [TAB 2003] [UBA 2013] 2014 data [AGEB 2015] provisional as per 082015 2014 data [BDEW 2015] provisional as per 082015
LBSTde 23 November 2016 Ludwig-Boumllkow-Systemtechnik GmbH
ludwig boumllkow
systemtechnik
CO2 avoidance costs
30
LBSTde 23 November 2016 Ludwig-Boumllkow-Systemtechnik GmbH
CO2 avoidance costs well-to-tank [eurot CO2-eq] for PtX in DE
31
Least-cost short-term Electricity
Least-cost long-term Electricity and CGH2
LBSTde 23 November 2016 Ludwig-Boumllkow-Systemtechnik GmbH
ludwig boumllkow
systemtechnik
Literature
P Schmidt W Zittel W Weindorf T Raksha (LBST)
Renewables in Transport 2050 ndash Empowering a sustainable mobility future with zero emission fuels from renewable electricity ndash Europe and Germany
Research Association for Combustion Engines eV (ed)
This study was financed by the FVV and supported by members of the FVV Working Group laquoFuture Fuelsraquo
LBSTde 23 November 2016 Ludwig-Boumllkow-Systemtechnik GmbH
ludwig boumllkow
systemtechnik
ANNEX
26
LBSTde 23 November 2016 Ludwig-Boumllkow-Systemtechnik GmbH
ludwig boumllkow
systemtechnik
Technical renewable power generation potentials
27
LBSTde 23 November 2016 Ludwig-Boumllkow-Systemtechnik GmbH
ludwig boumllkow
systemtechnik
Renewable electricity potentials in Germany and EU-28
Germany and the EU have (very) high technical renewable electricity potentials
ndash DE ~1000 TWha potential vs ~500 TWh net electricity consumption
ndash EU ~11000 TWha potential vs ~2800 TWh net electricity consumption
Only ~11 (DE) and ~6 (EU28) if this potentials are currently used for renewable power production
The limits to renewable power growth seem to be more of an acceptance issue than costs
[ISE 2015] states PV electricity production costs of 2-4 euroctkWh in Southern and Central Europe by 2050
Renewable power potentials assessed for solarthermal power plants could also be exploited with photovoltaics
28
LBSTde 23 November 2016 Ludwig-Boumllkow-Systemtechnik GmbH
ludwig boumllkow
systemtechnik
Renewable electricity potentials in Germany (bars can be stacked)
29
0
500
1000
1500
2000
2500
3000
Windonshore Windoffshore PV Hydro Geothermal
Tech
nic
al p
ote
nti
al (
TWh
yr)
Net electricity consumption 2014 521 TWhyr
Lud
wig
-Bouml
lko
w-S
yste
mte
chn
ik G
mb
H (
LBST
) 2
01
5-1
0-0
5
Maximum
Minimum
Bandwidth for technical renewableenergy potentials
Assumption in this study
1000 TWhyr
Potential already exploited
Data [BMU 2010] [BMU 2012] [BWE 2013] [ISE 2015] [IWES_PV 2012] [IWES 2012] [Quaschning 2013] [TAB 2003] [UBA 2013] 2014 data [AGEB 2015] provisional as per 082015 2014 data [BDEW 2015] provisional as per 082015
LBSTde 23 November 2016 Ludwig-Boumllkow-Systemtechnik GmbH
ludwig boumllkow
systemtechnik
CO2 avoidance costs
30
LBSTde 23 November 2016 Ludwig-Boumllkow-Systemtechnik GmbH
CO2 avoidance costs well-to-tank [eurot CO2-eq] for PtX in DE
31
Least-cost short-term Electricity
Least-cost long-term Electricity and CGH2
LBSTde 23 November 2016 Ludwig-Boumllkow-Systemtechnik GmbH
ludwig boumllkow
systemtechnik
Renewable electricity potentials in Germany (bars can be stacked)
29
0
500
1000
1500
2000
2500
3000
Windonshore Windoffshore PV Hydro Geothermal
Tech
nic
al p
ote
nti
al (
TWh
yr)
Net electricity consumption 2014 521 TWhyr
Lud
wig
-Bouml
lko
w-S
yste
mte
chn
ik G
mb
H (
LBST
) 2
01
5-1
0-0
5
Maximum
Minimum
Bandwidth for technical renewableenergy potentials
Assumption in this study
1000 TWhyr
Potential already exploited
Data [BMU 2010] [BMU 2012] [BWE 2013] [ISE 2015] [IWES_PV 2012] [IWES 2012] [Quaschning 2013] [TAB 2003] [UBA 2013] 2014 data [AGEB 2015] provisional as per 082015 2014 data [BDEW 2015] provisional as per 082015
LBSTde 23 November 2016 Ludwig-Boumllkow-Systemtechnik GmbH
ludwig boumllkow
systemtechnik
CO2 avoidance costs
30
LBSTde 23 November 2016 Ludwig-Boumllkow-Systemtechnik GmbH