112
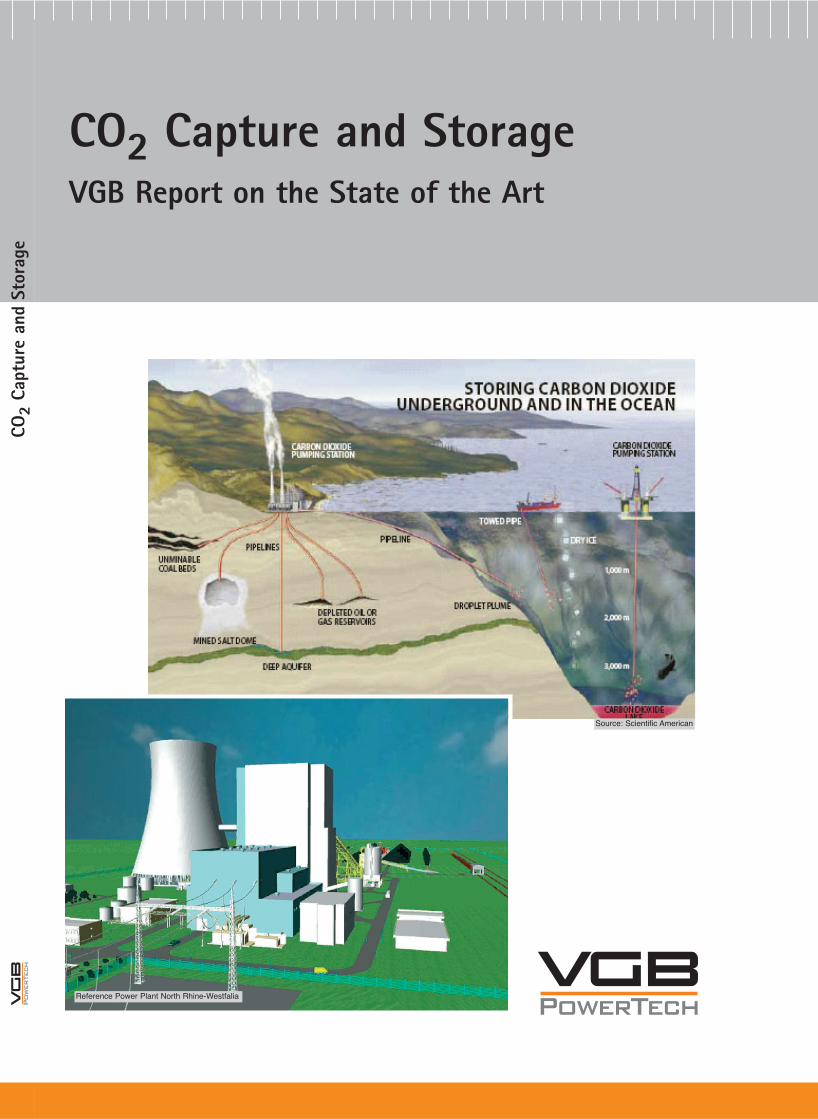
CO 2 Capture and Storage VGB Report on the State of the Art PowerTech CO 2 Capture and Storage PowerTech Source: Scientific American Reference Power Plant North Rhine-Westfalia
CO2 Capture and StorageVGB Report on the State of the Art
Klinkestraße 27 – 31 • D-45136 Essen
Internet: www.vgb.org
E-mail: [email protected]
Power
Tech
CO2
Capt
ure
and
Stor
age
PowerTechPowerTech
Source: Scientific American
Reference Power Plant North Rhine-Westfalia
CO2 Capture and Storage A VGB Report on the State of the Art
Published by VGB PowerTech e.V.
Obtainable from:
VGB PowerTech Service GmbH Verlag technisch-wissenschaftlicher Schriften
Postfach 10 39 32, D-45039 Essen Tel. +49-(0)201 8128-200 Fax +49-(0)201 8128-329
e-mail: [email protected]

2
�
� VGB PowerTech e.V. VGB PowerTech e.V. is a voluntary association of companies for which the operation of power stations and heating plants and the associated technology form an important basis of their corporate activity. The common aim of all the members – and therefore of VGB – is to promote and improve the operational safety and environmental compatibility and the availability and economic efficiency of both existing and new power plants. Approximately 420 utilities and industrial companies as well as institutions operating or manufacturing power and heating plants or dealing with related issues are members of VGB. Approximately 150 of VGB’s member companies are located in 29 countries worldwide. The majority are in Europe and represent more than 440,000 MW installed capacity of nuclear, fossil, hydro and other renewable power plants. VGB Homepage: http://www.vgb.org
3
According to the Kyoto Protocol of December 1997 the developed countries are obliged to reduce their greenhouse gas emissions by an average of 5.2 % below 1990 levels by 2008 / 2012. Among the measures to reach this goal the capture and storage of CO2 could be a useful future technology. For this reason capture and storage of CO2 have been studied for a number of years. This report provides an overview of the relevant state of the art at fossil fired power plants. It has been prepared by the VGB Working Panel “CO2 Capture and Storage”. The members of this group are: Duncan Clarke ESB Electricity Supply Board, Ireland Branko Debeljak Holding Slovenske Electrarne, Slovenia Vasco de Janeiro EURELECTRIC Gerold Göttlicher MVV Energie, Germany David Graham E.ON UK, United Kingdom Niels Kirkegaard Elsam Engineering, Denmark Michael Madsen Energi E2, Denmark Sauro Pasini ENEL, Italy Bennie Stortelder KEMA, The Netherlands Lars Strömberg Vattenfall, Sweden Wolfgang vom Berg VGB PowerTech Volker Hamacher VGB PowerTech With further valuable contributions from: Marie Anheden Vattenfall, Sweden Ole Biede Energi E2, Denmark Clas Ekström Vattenfall, Sweden Essen, 25. August 2004 The views and judgements expressed in this report reflect a consensus reached by the members of the Working Panel and do not necessarily reflect those of the companies to which the members belong. Whilst every care has been taken in compiling the information in this report, none of the members or organisations referred to above can be held responsible for any errors or omissions.
4
Table of Contents Page
0 LIST OF ABBREVIATIONS 9
1 INTRODUCTION 11
1.1 Scope 11 1.2 Global warming and CO2 11 1.3 Dependence of CO2 emission on fuel type and energy
conversion technology 13 1.4 Factors influencing power technology selection and fuel
choice 15 1.5 The EU greenhouse gas emissions trading scheme 16
2 TECHNICAL OPTIONS FOR CO2 CAPTURE 19
2.1 Background 19 2.2 Overview 19 2.3 Post combustion capture 21
2.3.1 Basic principle 21 2.3.2 Components and special considerations 23 2.3.3 Technology status and R&D needs 26
2.4 Pre-combustion carbon capture 29 2.4.1 Basic principle 29 2.4.2 Components and special considerations 30 2.4.3 Technology status and R&D needs 33
2.5 O2/CO2 recycle combustion (Oxyfuel combustion) 35 2.5.1 Basic principle 35 2.5.2 Boiler steam cycle 36 2.5.3 Circulating fluidized bed concepts 39 2.5.4 Gas turbine cycles with CO2 as the working fluid 40 2.5.5 Technology status and R&D needs 43
2.6 CO2 conditioning 44 2.7 Overview of other concepts 45
2.7.1 Chemical looping combustion 45 2.7.2 Fuel cells 49 2.7.3 Dry regenerative CO2 absorption 50 2.7.4 ZECA process 53
2.8 Industrial and academic bodies active in CO2 capture technology 54
2.9 Efficiencies and costs for CO2 capture 56 2.10 Conclusions 59 2.11 References 61
5
3 COSTS ANALYSIS OF SELECTED CAPTURE OPTIONS 65
3.1 Introduction 65 3.2 Coal fired power plants 65 3.3 Natural gas fired power plants 68 3.4 Recalculated cases with CO2 emission avoidance costs 71 3.5 Results 73 3.6 Conclusions 81 3.7 References 81
4 CO2 STORAGE 83
4.1 Storage in geological formations 83 4.1.1 Aquifers 83 4.1.2 Oil and natural gas fields 85 4.1.3 Coal seams 87
4.2 CO2 storage in the sea 88 4.3 Storing CO2 as carbonate 89 4.4 Legality of CO2 storage 89
4.4.1 Introduction 89 4.4.2 Under-ground storage 90 4.4.3 Ocean storage 90
4.5 Concluding remarks 91 4.6 References 95
5 TRANSPORTATION SYSTEMS FOR CO2 – APPLICATION TO CARBON CAPTURE AND STORAGE 98
5.1 General 98 5.2 Transportation systems 98
5.2.1 Existing CO2 transportation systems 99 5.2.2 Intermediate storage 99 5.2.3 Safety issues 100
5.3 Transportation costs 100 5.4 Summary 105 5.5 References 106
6 OVERALL CONCLUSIONS 108
6
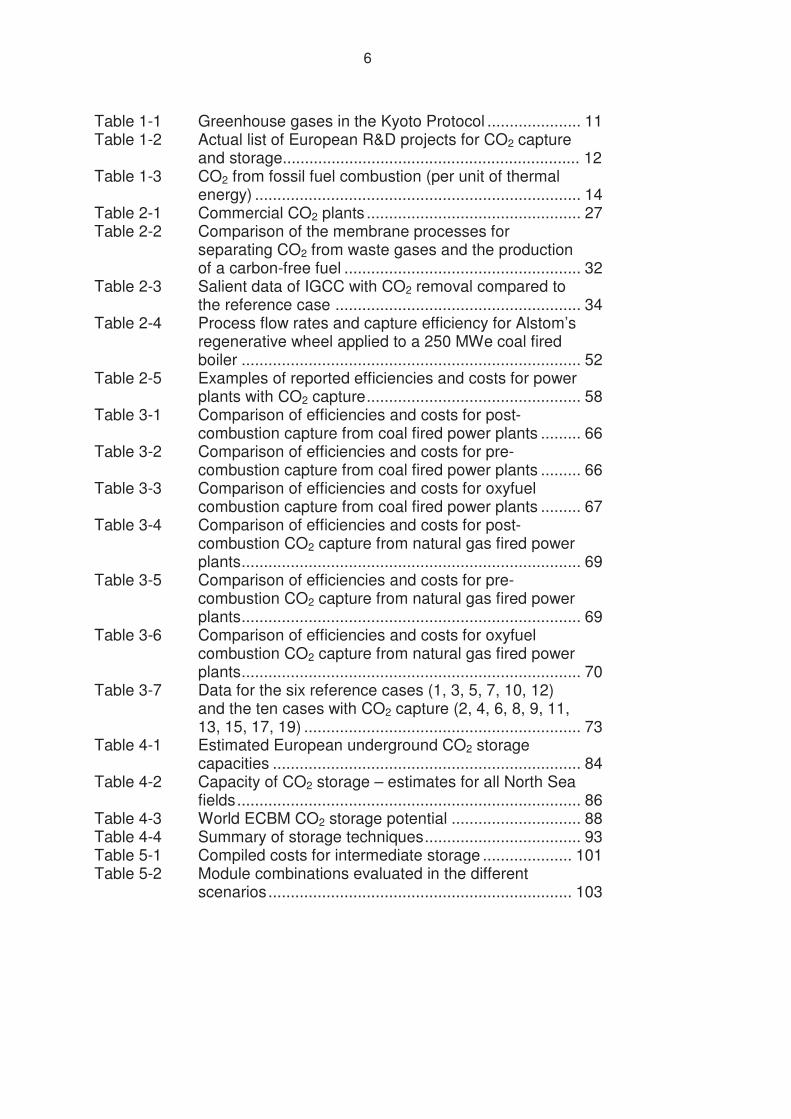
Table 1-1 Greenhouse gases in the Kyoto Protocol ..................... 11 Table 1-2 Actual list of European R&D projects for CO2 capture and storage................................................................... 12 Table 1-3 CO2 from fossil fuel combustion (per unit of thermal energy) ......................................................................... 14 Table 2-1 Commercial CO2 plants ................................................ 27 Table 2-2 Comparison of the membrane processes for
separating CO2 from waste gases and the production of a carbon-free fuel ..................................................... 32
Table 2-3 Salient data of IGCC with CO2 removal compared to the reference case ....................................................... 34
Table 2-4 Process flow rates and capture efficiency for Alstom’s regenerative wheel applied to a 250 MWe coal fired
boiler ............................................................................ 52 Table 2-5 Examples of reported efficiencies and costs for power plants with CO2 capture................................................ 58 Table 3-1 Comparison of efficiencies and costs for post-
combustion capture from coal fired power plants ......... 66 Table 3-2 Comparison of efficiencies and costs for pre-
combustion capture from coal fired power plants ......... 66 Table 3-3 Comparison of efficiencies and costs for oxyfuel combustion capture from coal fired power plants ......... 67 Table 3-4 Comparison of efficiencies and costs for post-
combustion CO2 capture from natural gas fired power plants............................................................................ 69 Table 3-5 Comparison of efficiencies and costs for pre-
combustion CO2 capture from natural gas fired power plants............................................................................ 69 Table 3-6 Comparison of efficiencies and costs for oxyfuel combustion CO2 capture from natural gas fired power plants............................................................................ 70 Table 3-7 Data for the six reference cases (1, 3, 5, 7, 10, 12)
and the ten cases with CO2 capture (2, 4, 6, 8, 9, 11, 13, 15, 17, 19) .............................................................. 73
Table 4-1 Estimated European underground CO2 storage capacities ..................................................................... 84 Table 4-2 Capacity of CO2 storage – estimates for all North Sea fields............................................................................. 86 Table 4-3 World ECBM CO2 storage potential ............................. 88 Table 4-4 Summary of storage techniques................................... 93 Table 5-1 Compiled costs for intermediate storage .................... 101 Table 5-2 Module combinations evaluated in the different
scenarios.................................................................... 103
7
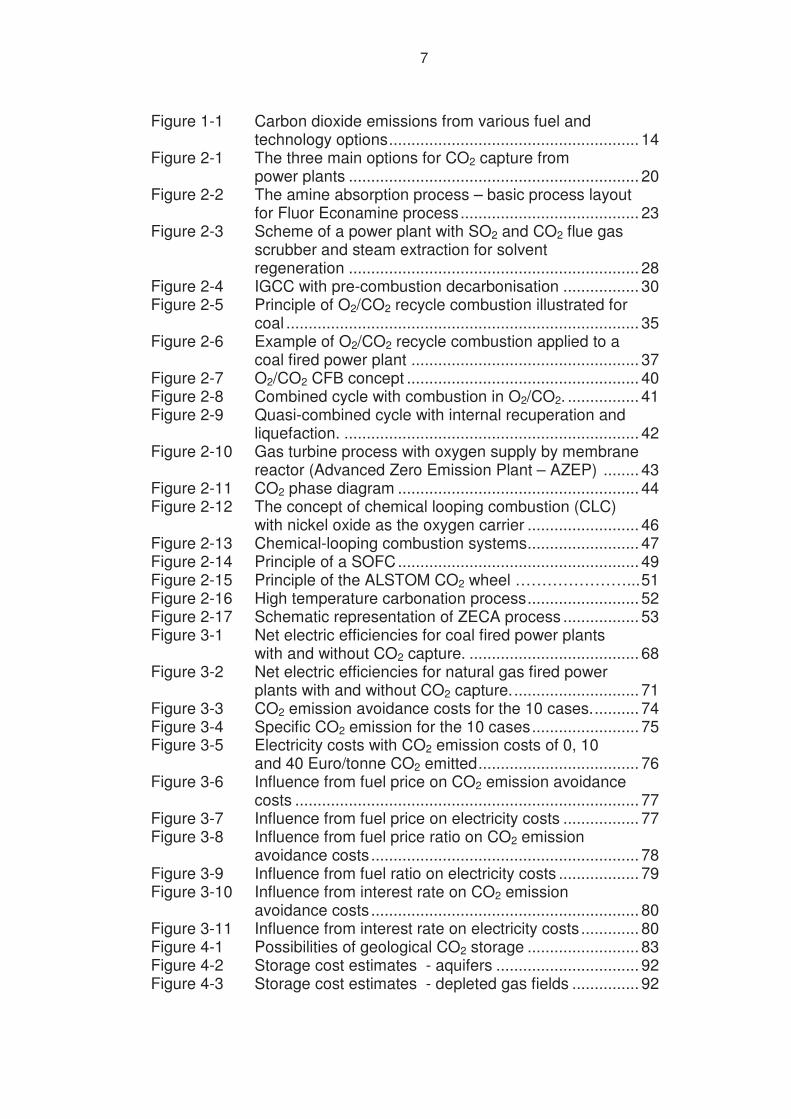
Figure 1-1 Carbon dioxide emissions from various fuel and technology options........................................................ 14 Figure 2-1 The three main options for CO2 capture from
power plants ................................................................. 20 Figure 2-2 The amine absorption process – basic process layout
for Fluor Econamine process........................................ 23 Figure 2-3 Scheme of a power plant with SO2 and CO2 flue gas scrubber and steam extraction for solvent
regeneration ................................................................. 28 Figure 2-4 IGCC with pre-combustion decarbonisation ................. 30 Figure 2-5 Principle of O2/CO2 recycle combustion illustrated for coal ............................................................................... 35 Figure 2-6 Example of O2/CO2 recycle combustion applied to a
coal fired power plant ................................................... 37 Figure 2-7 O2/CO2 CFB concept .................................................... 40 Figure 2-8 Combined cycle with combustion in O2/CO2. ................ 41 Figure 2-9 Quasi-combined cycle with internal recuperation and
liquefaction. .................................................................. 42 Figure 2-10 Gas turbine process with oxygen supply by membrane reactor (Advanced Zero Emission Plant – AZEP) ........ 43 Figure 2-11 CO2 phase diagram ...................................................... 44 Figure 2-12 The concept of chemical looping combustion (CLC)
with nickel oxide as the oxygen carrier ......................... 46 Figure 2-13 Chemical-looping combustion systems......................... 47 Figure 2-14 Principle of a SOFC...................................................... 49 Figure 2-15 Principle of the ALSTOM CO2 wheel …………………...51 Figure 2-16 High temperature carbonation process......................... 52 Figure 2-17 Schematic representation of ZECA process ................. 53 Figure 3-1 Net electric efficiencies for coal fired power plants
with and without CO2 capture. ...................................... 68 Figure 3-2 Net electric efficiencies for natural gas fired power
plants with and without CO2 capture............................. 71 Figure 3-3 CO2 emission avoidance costs for the 10 cases........... 74 Figure 3-4 Specific CO2 emission for the 10 cases........................ 75 Figure 3-5 Electricity costs with CO2 emission costs of 0, 10
and 40 Euro/tonne CO2 emitted.................................... 76 Figure 3-6 Influence from fuel price on CO2 emission avoidance costs ............................................................................. 77 Figure 3-7 Influence from fuel price on electricity costs ................. 77 Figure 3-8 Influence from fuel price ratio on CO2 emission avoidance costs ............................................................ 78 Figure 3-9 Influence from fuel ratio on electricity costs .................. 79 Figure 3-10 Influence from interest rate on CO2 emission avoidance costs ............................................................ 80 Figure 3-11 Influence from interest rate on electricity costs ............. 80 Figure 4-1 Possibilities of geological CO2 storage ......................... 83 Figure 4-2 Storage cost estimates - aquifers ................................ 92 Figure 4-3 Storage cost estimates - depleted gas fields ............... 92

8
Figure 5-1 Cost and capacity for transportation alternatives at 250 km transport distance. ......................................... 101
Figure 5-2 Development of large scale CO2 transportation infrastructure. ............................................................. 102
Figure 5-3 Accumulated costs for different transportation scenarios.................................................................... 102
9
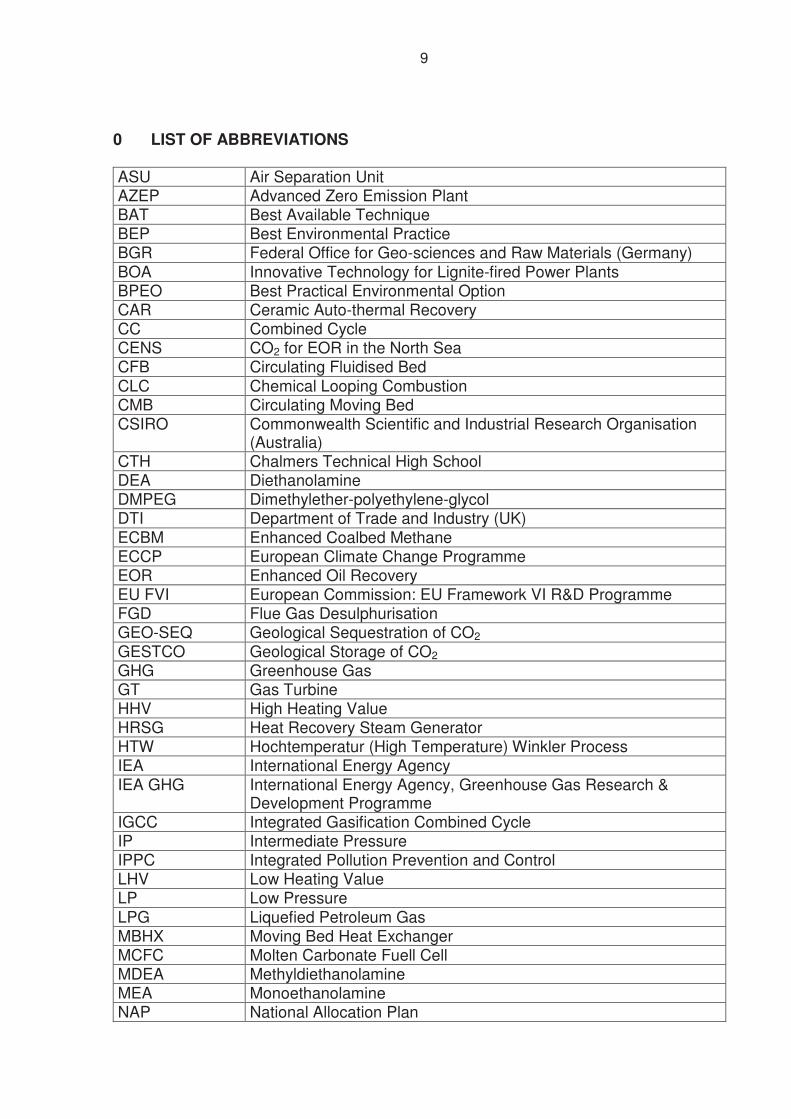
0 LIST OF ABBREVIATIONS
ASU Air Separation Unit AZEP Advanced Zero Emission Plant BAT Best Available Technique BEP Best Environmental Practice BGR Federal Office for Geo-sciences and Raw Materials (Germany) BOA Innovative Technology for Lignite-fired Power Plants BPEO Best Practical Environmental Option CAR Ceramic Auto-thermal Recovery CC Combined Cycle CENS CO2 for EOR in the North Sea CFB Circulating Fluidised Bed CLC Chemical Looping Combustion CMB Circulating Moving Bed CSIRO Commonwealth Scientific and Industrial Research Organisation
(Australia) CTH Chalmers Technical High School DEA Diethanolamine DMPEG Dimethylether-polyethylene-glycol DTI Department of Trade and Industry (UK) ECBM Enhanced Coalbed Methane ECCP European Climate Change Programme EOR Enhanced Oil Recovery EU FVI European Commission: EU Framework VI R&D Programme FGD Flue Gas Desulphurisation GEO-SEQ Geological Sequestration of CO2
GESTCO Geological Storage of CO2 GHG Greenhouse Gas GT Gas Turbine HHV High Heating Value HRSG Heat Recovery Steam Generator HTW Hochtemperatur (High Temperature) Winkler Process IEA International Energy Agency IEA GHG International Energy Agency, Greenhouse Gas Research &
Development Programme IGCC Integrated Gasification Combined Cycle IP Intermediate Pressure IPPC Integrated Pollution Prevention and Control LHV Low Heating Value LP Low Pressure LPG Liquefied Petroleum Gas MBHX Moving Bed Heat Exchanger MCFC Molten Carbonate Fuell Cell MDEA Methyldiethanolamine MEA Monoethanolamine NAP National Allocation Plan

10
NG Natural Gas NGCC Natural Gas Fired Combined Cycle NMP N-methyl-2-pyrrolidon O&M Operation and Maintenance OSPAR Convention on the Protection of the North Sea and North East
Atlantic PAFC Phosphoric Acid Fuel Cell PC Pulverized Coal
PEM Polymer Electrolyte Membrane PF Pulverized Fuel R&D Research and Development RITE Research Institute of Innovative Technology for the Earth (Japan) SACS Sleipner Aquifer for CO2 Storage SINTEF Foundation for Scientific and Industrial Research at the Norwegian
University of Science and Technology SOFC Solid Oxide Fuel Cell TNO The Netherlands Organisation for Applied Scientific Research UNFCCC United Nations Framework Convention on Climate Change US DOE US Department of Energy ZECA Zero Emission Coal Alliance
11
1 INTRODUCTION 1.1 Scope This review firstly considers carbon capture technologies (Chapter 2) since these are judged to be the most costly and least well developed components of the carbon removal process. Chapter 3 then considers the cost implications of applying the more advanced of these technologies to various plant types and firing configurations. The following chapters then consider transport and storage issues (Chapters 4 and 5), including legal and economic aspects, prior to a consideration of the overall conclusions related to the various technology/fuel choices. The remainder of this introductory chapter considers the driving forces for a low carbon economy, including the development of a European wide CO2 trading scheme, and the place of CO2 capture and storage within the basket of measures adopted by the EU, particularly in relation to the continuing use of coal for power generation. 1.2 Global warming and CO2 The driving force behind international efforts to tackle global environmental issues such as climate change has been the United Nations, mainly the United Nations Framework Convention on Climate Change (UNFCCC). The 1992 ‘Earth Summit’ in Brazil produced the Framework Convention on the Atmosphere (Climate Treaty) which came into force on 21/3/1994. This led to the Kyoto Protocol of December 1997 which has yet to be ratified by either the U.S. or the Russian Federation. The Protocol specifies legally binding cuts in emissions of six greenhouse gases: carbon dioxide, methane, nitrous oxide, hydrofluorocarbons, perfluorocarbons and sulphur hexafluoride. Between 2008-2012 developed countries will reduce their emissions by an average of 5.2 % below 1990 levels. Different targets have been set for individual countries or regions – e.g. 8 % for the European Union. The Protocol also permits emissions trading between countries as a means of meeting targets. Gas Qualifying Sources Lifetime
(years) Global Warming Potential (relative to CO2)
% GHG1)
1990
Carbon dioxide (CO2)
Fossil fuel burning, Cement
Variable, ~100
1 81.2
Methane (CH4)
Rice, livestock, biomass decay & combustion, fossil fuel production
12.2 + 3 21 13.7
Nitrous oxide (N2O)
Fertilizers, fossil fuel combustion, agriculture
120 310 4.0
Hydrofluorocarbons (HFCs)
Industry, refrigerants 1.5-264 140-11,700
0.56
Perfluorocarbons (PFCs)
Industry, aluminium, electronic industries, fire fighting, solvents
2,600-50,000
Average 6,770
0.29
Sulphur hexafluoride (SF6)
Electronic industries insulation
3,200 23,900 0.30
1) Contribution to the greenhouse warming effect Source: Grubb (1999) (100 year time horizon for Global Warming Potential) Table 1-1 Greenhouse gases in the Kyoto Protocol
12
The first three of the greenhouse gases are important from a fossil fuel/ combustion standpoint and it can be seen, from Table 1-1, that CO2 is the most important of these, accounting for about 80 % of the enhanced global warming effect, even though it has the lowest Global Warming Potential and a relatively short life-time in the atmosphere. Despite the lack of ratification of the Kyoto Protocol, and some uncertainty in the impacts of enhanced global warming, the EU is therefore maintaining the position that CO2 emissions should be reduced in line with the ‘Precautionary Principle’. Measures to reduce CO2 include: improved energy efficiency, financial incentives for renewable energy sources and CO2 trading (described briefly in this report). Research efforts within the EU have focused or focus on clean coal technologies, including efficiency improvements associated with advanced super-critical coal fired plant. More recently, the focus is shifting towards carbon capture and storage technologies, in recognition of a) the need for development effort and b) the potential importance of these technologies in meeting long term commitments to reduce CO2. However, there is obviously a need to also maintain research effort in more conventional areas that can produce short-term, incremental, improvements in energy efficiency. A selection of R&D projects relevant to CO2 capture and storage is given in Table 1-2. Project Objective Status
Capture
GRACE
Grangemouth Advanced CO2 Capture Project
Development of membranes and looping combustion to achieve a step change in the capture cost
finished in 2003
AZEP
Advanced Zero Emission Power Plant
Development of a gas turbine based cycle to lower pre-combustion capture costs in power plants
launched in 2001
to be finished in 2004
ENCAP
Enhanced Capture of CO2
� Process and power systems � Pre-combustion decarbonisation technologies � OxyFuel boiler technologies � Chemical looping combustion � High-temperature oxygen generation for power cycles � Novel pre-combustion capture concepts
launched in 2004
to be finished in 2008
Storage
SACS 2
Sleipner Aquifer CO2 Storage (2) – Demonstration in the Sleipner Field
Investigation of CO2 injection in the Utsira aquifer under the North Sea; CO2 bubble monitoring, prediction of long-term CO2 behaviour
finished in 2002
GESTCO
Geological Storage of CO2 from Fossil Fuel Combustion
A study involving many EU geological societies to estimate geol. storage potential in Europe
finished in 2003
13
NASCENT
Natural Analogues to the Storage of CO2 in the Geological Environment
A study of naturally occurring CO2 reservoirs to understand long term stability
finished in 2003
ICBM
Development of Advanced Reservoir Characterisation and Simulation Tools for Improved Coalbed Methane Recovery
Investigation of the basic scientific phenomena of CO2 injection and retention in coal
launched in 2000
to be finished in 2004
RECOPOL
Reduction of CO2 Emission by means of CO2 Storage in Coal Seams in the Silesian Coal Basin of Poland
A demonstration project for the use of CO2 for ECBM in a Polish coal field
launched in 2001
to be finished in 2004
CO2STORE
On-Land and Long Term Saline Aquifer CO2-Storage
Investigation of properties of a number of new storage reservoirs in DK, D, N, and the UK, and continuation of the investigation of CO2 injection in the Utsira aquifer under the North Sea
launched in 2003
to be finished in 2006
CO2SINK
In-situ R&D Laboratory for Geological Storage of CO2
� Practical test of geological storage � Real case risk assessment � Monitoring techniques (calibration / novel ones) � Practical experience with regulatory procedures
launched in 2004
to be finished in 2008
Capture and Storage
CASTOR
CO2, from Capture to Storage
� Cost reduction of CO2 post-combustion capture � Pilot testing for capture � Improving performance, safety and acceptance of the geological storage concept � Detailed studies of future storage sites
launched in 2004
to be finished in 2007
Table 1-2 European R&D projects related to CO2 capture and storage
1.3 Dependence of CO2 emission on fuel type and energy conversion
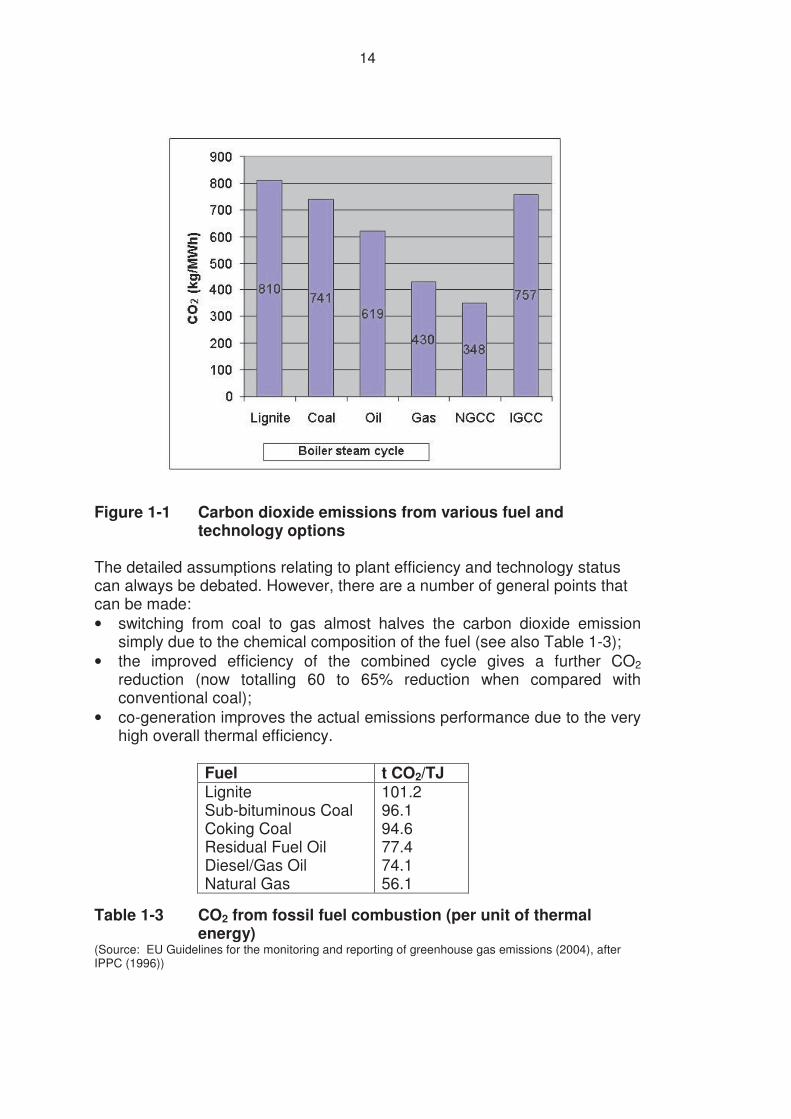
technology A difficulty in comparing emissions from systems employing differing technologies and fuel types is that any emission reduction level (up to practically 100 % removal) level can be achieved with a sufficiently high level of expenditure. The question is whether or not this is a reasonable measure when balancing the benefit to the environment against a greatly increased cost and risk. For illustration, Klein (1999a) provides a comparison of the emissions performance of conventional cycles (steam raising boilers) and advanced combined cycles based on gas turbine technology. A similar approach, shown in Figure 1-1, has been used to compare CO2 emissions from coal, oil and gas fired boiler systems with those from a natural gas fired combined cycle (NGCC) plant and an integrated gasification combined cycle (IGCC) plant. The assumed efficiencies are: lignite 45 %, coal 46 %, oil 45 %, gas 47 %, NGCC 58 %, IGCC 45 %.
14
Figure 1-1 Carbon dioxide emissions from various fuel and
technology options The detailed assumptions relating to plant efficiency and technology status can always be debated. However, there are a number of general points that can be made: • switching from coal to gas almost halves the carbon dioxide emission
simply due to the chemical composition of the fuel (see also Table 1-3); • the improved efficiency of the combined cycle gives a further CO2
reduction (now totalling 60 to 65% reduction when compared with conventional coal);
• co-generation improves the actual emissions performance due to the very high overall thermal efficiency.
Fuel t CO2/TJ Lignite Sub-bituminous Coal Coking Coal Residual Fuel Oil Diesel/Gas Oil Natural Gas
101.2 96.1 94.6 77.4 74.1 56.1
Table 1-3 CO2 from fossil fuel combustion (per unit of thermal energy)
(Source: EU Guidelines for the monitoring and reporting of greenhouse gas emissions (2004), after IPPC (1996))
15
1.4 Factors influencing power technology selection and fuel choice The IEA has identified the following factors influencing power plant selection: Financing. Capital cost; financial arrangements; fuel costs; income (power purchase agreements); O&M costs; load factor and availability (influenced by technology status and risk). Fuel selection. Availability (90% of coal production is used in country of origin) and security of supply price (future uncertainty in coal/gas prices but coal is more stable due to abundance of supply; transportation and storage). Environment. Emissions to land, water and the atmosphere; local environmental concerns (noise/visibility/amenity value and planning consents); linkage with environmental legislation; inter-relationship with local-regional air quality/acid deposition and environmental impact assessments. Influencing factors. The above, inter-related, factors may be profoundly influenced by the regime governing the power generation industry: state owned monopoly vs. free market; energy policy (fuel mix-plant type-district heating requirement-location); legislative regime � clean-up technologies (cost), time-scales ….; economy – local production required which may limit the technology employed. It is evident that, when suitably priced natural gas is available, it is the first choice from an environmental perspective since, in addition to achieving the lowest release rates of CO2, emissions of SO2 and particulate are negligibly small and NOx emissions are also reduced when compared with oil and coal firing. Combined Cycle Gas Turbine plant also offers reduced build times, lowest capital cost and flexibility of operation. This explains the ‘dash for gas’ in parts of Europe and the U.S. However, there are a number of factors that will ensure the continuing use of coal within the energy mix: Security of supply. Coal reserves are much larger than oil and gas reserves (230 years compared with about 60 years at current consumption levels) and many countries within the EU are currently heavily dependant on coal for electricity production since the fuel is locally available. The anticipated new build in Europe is 550 GWe by 2030, and these plants will be operating through the period of declining oil and gas supplies. In addition, gas supplies will be from fewer sources with greater vulnerability of supply. Quite apart from availability and cost concerns, it is unlikely that renewable energy technology will be deployed at a suitable scale to meet either CO2 reduction targets or increased electricity demand. Nor does it seem likely that nuclear capacity will be greatly expanded across this time period, for socio-political reasons in addition to concerns regarding nuclear waste processing.
16
Fuel pricing. Natural gas prices have traditionally shown greater volatility than coal prices and this has a major impact on the viability of power generation schemes. Technology development. The thrust of clean coal technology research is towards ever lower emissions and increased efficiency at an acceptable cost and with a high availability. However, it may prove difficult to deploy novel generating technologies when the power industry has shown an aversion to risk and the possibility of compromising availability. Fuel switching (to natural gas) is unsustainable in the longer term and increasing the efficiency of coal fired plant alone may be insufficient to achieve CO2 reduction targets against a back drop of increased demand. The development of CO2 capture and storage is therefore being considered as a medium term option for achieving a low carbon economy, particularly when taking into account financial incentives offered by a carbon emission trading scheme. 1.5 The EU greenhouse gas emissions trading scheme Greenhouse gases are good candidates for international emissions trading since climate change is a global problem. Also, emissions of the main greenhouse gases are easy to measure and control, e.g., CO2 is directly related to the quantity of fuel burnt, although this is not the case for carbon sinks and agriculture in general. As of 1 January 2005, companies from sectors covered by EU Directive 2003/87/EC must limit their greenhouse gas emissions to allocated levels in the two periods from 2005-2007 and 2008-2012. The Directive establishes a scheme for greenhouse gas emission allowance trading within the Community. The Directive can also be adopted by the European Economic Area countries and Switzerland, bringing the coverage to a potential 28 countries. The EU scheme will be the first multi-national emissions trading scheme in the world and is considered a forerunner of the international emissions trading scheme under the Kyoto Protocol. The sectors covered by the scheme comprise: energy (e.g. combustion installations with a rated thermal input exceeding 20 MW); minerals (e.g. cement, lime, glass and ceramics); metals (e.g. iron and steel) and pulp and paper. Around 10,000 installations will be covered representing about half of the EU’s total greenhouse gas emissions. The rationale behind emissions trading is that it will allow each Member State to regulate the level of their country’s emissions by setting an overall cap, while giving companies the flexibility to trade their own emissions ‘allowances’ within the cap. Each company will need to have a permit and be able to monitor and report its CO2 emissions (based on fuel consumption in most cases). Companies will have a ceiling for their allowances, but will be able to exceed the cap providing they buy an allowance for each excess
17
tonne or pay the penalty, i.e. 40�/tCO2 in the period 2005 – 2007 and 100�/tCO2 from 2008 to 2012. Similarly, companies which are within their limit can sell or ‘bank’ their surplus allowances. Thus, the overall level of emissions remains within the cap so the benefit to the environment is still the same, but the reduction takes place where cost is lowest. Clearly, a company's strategy will largely depend on the price at which emission reductions are traded. The emissions trading scheme will have a profound effect on the European electricity industry by affecting production costs and future investment decisions. As a result of the scheme, fossil fuel power plants (i.e. coal, gas and oil) will have to internalise the cost of emitting greenhouse gas emissions, which will have an impact on electricity prices. A key consequence of the emissions trading scheme is that CO2 emissions will have a price. This price will provide a signal to sectors covered by the Directive on which CO2 abatement measures they should implement. It is expected that the emissions trading market will start off with modest prices, but, overtime, as scarcity of allowances will increase, CO2 prices will rise. This probable market development will influence investment behaviour. In parallel, the cost of CO2 capture, transport and storage technologies will drop and, in the medium to long-term, these will eventually become a competitive option for electricity companies to reduce greenhouse gas emissions. Some of the main elements of the emissions trading scheme comprise the following:
� Method of allocating allowances: For the period 2005-2007 Member States shall allocate at least 95 % of the allowances free of charge and in the period 2008-2012 at least 90 % of the allowances free of charge.
� Quantity of allowances allocated: Member States must show that they
are on a path to meeting their Kyoto Protocol obligations (2008-2012) when proposing the quantity of allowances to be allocated to companies in the first phase (2005-2007). Member States must prepare their National Allocation Plans (NAP) setting out the allowances that each sector and installation will be issued.
� Temporary exclusion of certain installations: Member States may
apply to the Commission for installations to be temporarily excluded until 31 December 2007. However, it should be ensured that there will be no distortion of the market.
� Credits from the Kyoto Protocol project mechanisms (Joint
Implementation and the Clean Development Mechanism): the Directive states that linking project-based mechanisms and the emissions trading scheme is desirable and important to achieve emissions reductions in a cost-effective way. The Directive also
18
provides for the scheme to be linked to compatible trading schemes in other countries that have ratified the Kyoto protocol.
� Future extension of the scheme to other sectors and gases: The
Commission will assess the coverage of the scheme with a view to the possible inclusion of other sectors, for example, the chemical, aluminium and transport sectors, and other greenhouse gases.
Furthermore, the Commission Decision from 29 January 2004 that establishes guidelines for the monitoring and reporting of greenhouse gas emissions pursuant to the emissions trading Directive, states that the Commission is stimulating research into the capture and storage of CO2. This research will be important for the development and adoption of guidelines on the monitoring and reporting of CO2 capture and storage. Such guidelines will take into account the methodologies developed under the UNFCCC and Member States interested in the development of such guidelines were invited to submit their research findings to the Commission. Subject to the approval of the Commission, the capture and storage of CO2 may be subtracted from the calculated level of emissions from installations covered by the emissions trading scheme in accordance with the future guidelines.
19
2 TECHNICAL OPTIONS FOR CO2 CAPTURE 2.1 Background In the chain needed to eliminate CO2 emissions from fossil fuelled plants - capture, transport and storage - transport is already reasonably well established, while capture and storage require demonstration. Capture has been identified as the most costly part of the chain and has the least well established technology. However, development is progressing rapidly and large-scale demonstration plants will probably appear within the decade. The capture process should take the gaseous CO2 from the combustion process and produce a reasonably clean liquid CO2 stream, although the final purity required for transport and storage is not yet established. A dense form of the captured CO2 is needed for rational transport scenarios - possibly as a supercritical or cooled liquid. Of course, the fuel choice places different demands on the capture process in relation to differing carbon content and contaminants. Further, solid fuels cannot be processed directly but have to either be combusted or gasified prior to carbon removal. The commercial choice between coal and gas will be a trade off between price and availability compared with ease of reforming and direct use. Note also that CO2 capture from coal fired processes obviously results in a greater CO2 reduction than when applied to gas firing (since the carbon to hydrogen ratio of coal is higher than for gas). The calculated capture cost varies widely depending on the literature source and there are commercial interests at work when “scientific” reports are published. The basis for comparison should be very stringent and the data treated carefully. Here, an attempt is made to define and utilize consistent data. However, it must be borne in mind that everything is based on early studies, i.e., practical experience from small scale or industrial applications in which the CO2 removal is a secondary consideration. 2.2 Overview There are three main technology options for CO2 capture from power plants:
- post-combustion capture - pre-combustion capture - technologies where the nitrogen is excluded from the combustion
process (more commonly known as oxy-fuel combustion or O2/CO2 recycle combustion but also covering approaches like chemical looping).
Figure 2-1 illustrates the basic principle of these three capture technologies.
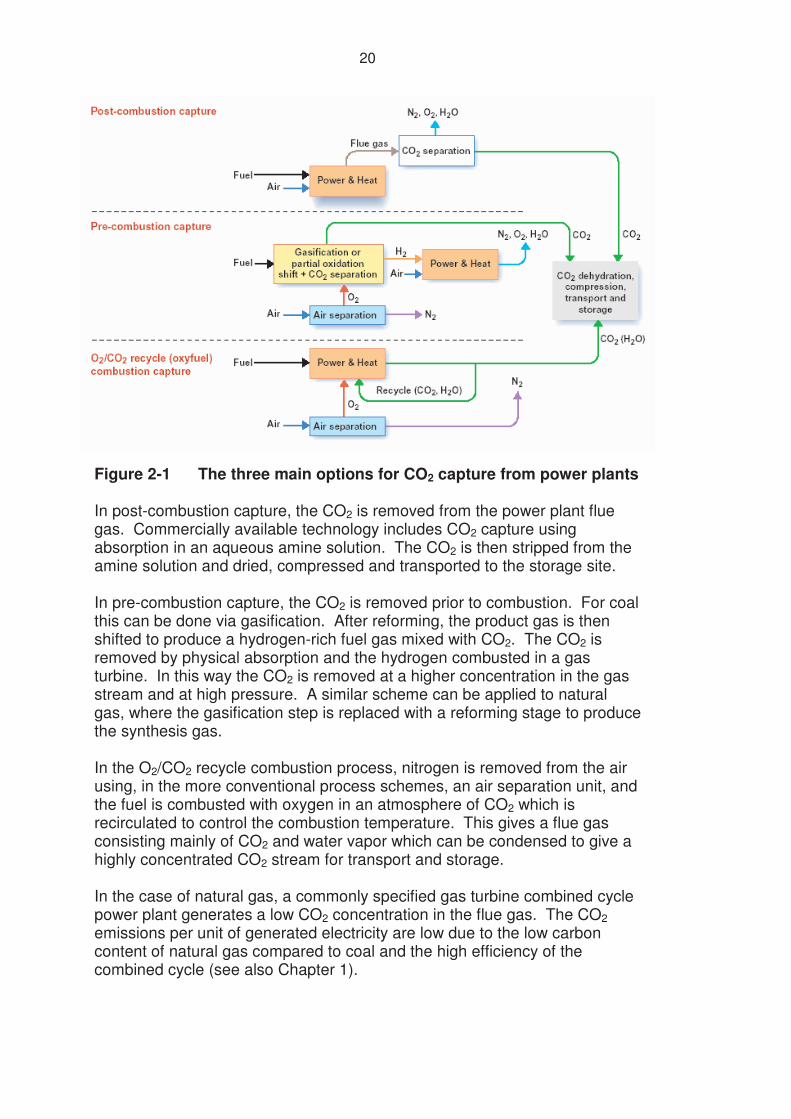
20
Figure 2-1 The three main options for CO2 capture from power plants In post-combustion capture, the CO2 is removed from the power plant flue gas. Commercially available technology includes CO2 capture using absorption in an aqueous amine solution. The CO2 is then stripped from the amine solution and dried, compressed and transported to the storage site. In pre-combustion capture, the CO2 is removed prior to combustion. For coal this can be done via gasification. After reforming, the product gas is then shifted to produce a hydrogen-rich fuel gas mixed with CO2. The CO2 is removed by physical absorption and the hydrogen combusted in a gas turbine. In this way the CO2 is removed at a higher concentration in the gas stream and at high pressure. A similar scheme can be applied to natural gas, where the gasification step is replaced with a reforming stage to produce the synthesis gas. In the O2/CO2 recycle combustion process, nitrogen is removed from the air using, in the more conventional process schemes, an air separation unit, and the fuel is combusted with oxygen in an atmosphere of CO2 which is recirculated to control the combustion temperature. This gives a flue gas consisting mainly of CO2 and water vapor which can be condensed to give a highly concentrated CO2 stream for transport and storage. In the case of natural gas, a commonly specified gas turbine combined cycle power plant generates a low CO2 concentration in the flue gas. The CO2 emissions per unit of generated electricity are low due to the low carbon content of natural gas compared to coal and the high efficiency of the combined cycle (see also Chapter 1).
21
It is possible to apply all these technologies using commercially available equipment with some modification and development. However, a significant equipment scale-up is required in most cases. The near future solutions based on these methods result in an efficiency penalty of 8 to 13 percentage points for coal fired processes or 9-12 % points for gas fired processes. Of this, about 3 to 4 % points when coal firing or 2 % to 3 % points when gas firing are a result of compression of CO2 to the desired storage pressure (about 100 bar) and the remainder is related to the capture process. Cost penalty is in the range of 10-50 EUR/MWh. However, this figure varies considerably between different studies. All of the technical options described above have the potential for performance and efficiency improvements. Primarily, in relation to the generating efficiency but also in the reduction of the additional investment and O&M costs. The need for technological development of the different capture options will be further described in the following chapters. The technical risks introduced when employing these new technologies, and subsequent concerns relating to plant reliability and availability, are especially important and are considered in parallel. CO2 capture technology should preferably be included at the design-stage of a new power plant in order to effectively optimize the overall plant efficiency and performance but it could also be added to existing power plants as a retrofit option. The post combustion concept is the primary option for retrofits but it has also been suggested that a) pre-combustion capture technology could be retrofitted to natural gas fired combined cycles and b) the O2/CO2 recycle concept could be applied to existing coal fired plants. Existing IGCC-plants could also be retrofitted with pre-combustion capture technology. 2.3 Post combustion capture 2.3.1 Basic principle Following the combustion process, CO2 can be separated from the other combustion species found in the flue gas. Technologies based on separation principles such as absorption (chemical and physical), adsorption, cryogenics and membranes have been proposed. Selection of the preferred capture technology depends on the flue gas properties - temperature, pressure, concentration and volume flow rate which is very high from power plants and is emitted at a pressure close to atmospheric. The CO2 concentration varies from typically around 5 vol% (dry) for a natural gas combined cycle plant to about 15 % by volume (dry) for a pulverized coal fired power plant. Physical solvents commonly in commercial use include cold methanol polyethylene glycol, propylene carbonate calcium oxide, sodium hydroxide and potassium hydroxide. These solvents are better suited for applications at a higher pressure than that of power plant flue gases. Some materials with high surface areas, such as zeolites and activated carbon, can be used
22
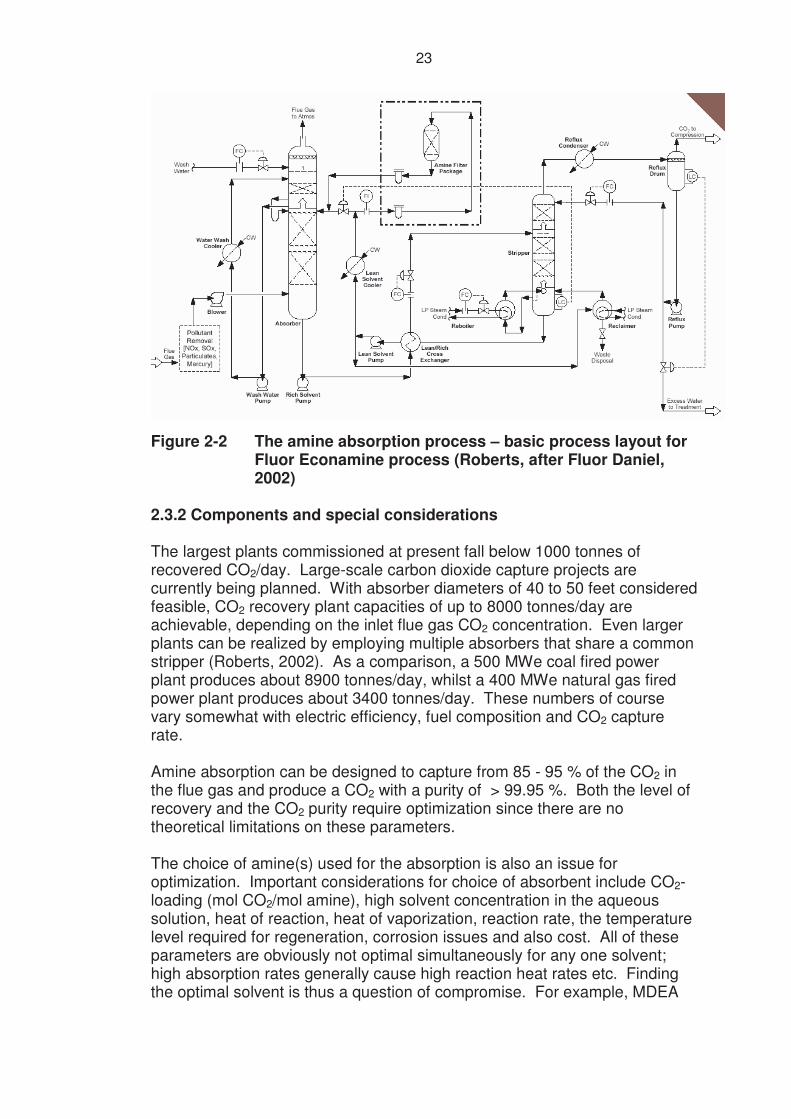
to adsorb CO2 from a flue gas. The adsorbent is regenerated by either an increase in temperature (temperature swing adsorption) or by lowering the pressure (pressure swing adsorption). However, adsorption methods are not yet applicable for large-scale operation, their capacity and CO2 selectivity are low and the energy required for regeneration is high. Cryogenic separation of CO2 requires a high concentration of CO2 in the flue gas to be economical. Gas separation membranes are thin films that selectively transport gases through the membrane based on interaction with the membrane and the difference in partial pressure of the gases across the membrane. However, this is a rather new technology and it has not yet been optimized for large scale applications (see also Section 2.7). Bearing this in mind, chemical absorption, using a reactive liquid solvent, is the technology which presently seems to be most feasible for CO2 capture from power plants. The only commercially available absorbents active enough for recovery of dilute CO2 from atmospheric pressure are aqueous solutions of alkanolamines such as monoethanolamine (MEA), diethanolamine (DEA), methyldiethanolamine (MDEA) and the newly developed sterically hindered amines. Therefore, the following text will only cover post combustion CO2 capture using amine solutions. A continuous scrubbing system is used to separate the CO2 from the flue gas stream by chemical absorption. As illustrated in Figure 2-2, the system consists of two main elements - an absorber in which the CO2 is removed and a regenerator (stripper) in which the CO2 is released in a concentrated form and the solvent is recovered. Prior to the CO2 removal, the flue gas is typically cooled to about 50°C and then treated to reduce particulates, that cause operational problems, and other impurities (SOx, NOx, HCl, Hg …), which would otherwise cause costly loss of the solvent. The amine solvent absorbs the CO2 (together with traces of SOx and NOx) by chemical reaction to form a loosely bound compound. A key feature of the amine system is the large amount of heat required to regenerate the solvent. The temperature level for regeneration is normally around 120°C. This heat is typically drawn from the steam cycle and reduces the net efficiency of the power plant significantly. As for all other technologies producing CO2 electrical energy is also needed to compress the captured CO2 for transportation to the storage site.
23
Figure 2-2 The amine absorption process – basic process layout for Fluor Econamine process (Roberts, after Fluor Daniel, 2002)
2.3.2 Components and special considerations The largest plants commissioned at present fall below 1000 tonnes of recovered CO2/day. Large-scale carbon dioxide capture projects are currently being planned. With absorber diameters of 40 to 50 feet considered feasible, CO2 recovery plant capacities of up to 8000 tonnes/day are achievable, depending on the inlet flue gas CO2 concentration. Even larger plants can be realized by employing multiple absorbers that share a common stripper (Roberts, 2002). As a comparison, a 500 MWe coal fired power plant produces about 8900 tonnes/day, whilst a 400 MWe natural gas fired power plant produces about 3400 tonnes/day. These numbers of course vary somewhat with electric efficiency, fuel composition and CO2 capture rate. Amine absorption can be designed to capture from 85 - 95 % of the CO2 in the flue gas and produce a CO2 with a purity of > 99.95 %. Both the level of recovery and the CO2 purity require optimization since there are no theoretical limitations on these parameters. The choice of amine(s) used for the absorption is also an issue for optimization. Important considerations for choice of absorbent include CO2-loading (mol CO2/mol amine), high solvent concentration in the aqueous solution, heat of reaction, heat of vaporization, reaction rate, the temperature level required for regeneration, corrosion issues and also cost. All of these parameters are obviously not optimal simultaneously for any one solvent; high absorption rates generally cause high reaction heat rates etc. Finding the optimal solvent is thus a question of compromise. For example, MDEA
24
would offer energy savings compared to MEA but the reaction rate is lower and the absorption column would have to be much taller. Aqueous solutions of amines are used to avoid excessive plant corrosion. However, the water is a diluent that places additional demands on the process sizing and energy requirements. These factors need to be considered alongside the associated economics. Increasing the amine concentration by means of corrosion inhibitors and advanced amine formulations is therefore a high priority for the manufacturers. Kansai Electric Power Company and Mitsubishi Heavy Industries have been developing sterically hindered amines, the most well known are called KS-1 and KS-2. These amines have the advantage of a lower circulation rate due to a higher CO2 loading differential, a lower regeneration temperature and a lower heat of reaction. They are also non-corrosive to carbon steel at 130°C in the presence of oxygen. A first commercial plant using KS-1 for Petronas Fertiliser Kedah Sbn Bhd’s fertilizer plant in Malaysia has been in operation since 1999 (Mimura et al., 2001). Chemical absorption can be complemented with gas absorption membranes that act as contacting devices between the gas flow and the liquid flow. The gas and the amine solution are thereby not brought into direct contact and elements in the flue gas that deteriorate the amine solution, such as oxygen, are not transferred to the amine solution to the same extent. The problem of evaporation into the cleaned flue gas is reduced. The column pressure drop is also reduced, when compared with conventional packing, and the efficiency reduction can therefore be smaller. The equipment can also be made more compact, due to the increased gas-liquid contact area, which is of particular importance in off-shore applications. The membrane technology was developed by Aker Kvaerner and used in gas separation applications within the oil and gas industry (Herzog and Falk-Pedersen, 2001). Scale-up to sizes required to capture CO2 from large power plants is considered to be a difficult issue. As mentioned earlier, the CO2 concentration is the most important parameter that controls the absorption process. By applying supplementary firing before the HRSG the efficiency of the steam cycle increases and the CO2 concentration also increases. This has a positive effect on the overall plant efficiency. Design issues relevant to CO2 recovery processes using amine solutions are discussed below. Most information is taken from Chapel et al. (2001) and is related to the Fluor Econamine process. The absorption technology is described relatively detailed including many reported considerations to avoid potential problems and minimize costs. In section 2.3.3 reference is made to two commercial CO2 absorption plants operated on coal flue gas in US. Here no major problems are reported.
25
Regeneration energy Absorption processes that are active at low partial pressures are those with higher reaction energies that require the most energy for regeneration. The design challenges are to a) minimize regeneration energy by selecting a solvent or mixture of solvents with a low reaction energy and b) to use low value heat source to provide this energy. MEA-based absorbent solutions generally require regeneration energies of 3 - 4 GJ/tonne CO2. Goals for ongoing development in the CASTOR project is to reach 2 GJ/tonne. (Note: Cost calculations in Chapter 3 are based on 5 GJ/tonne CO2 according to IEA report). Steam with a pressure of about 3 - 4.5 bar is used to regenerate the solvent in the reboiler and steam at 4 - 6 bar is used in the reclaimer. The steam for the reboiler has to be extracted from the steam turbine and thereby reduces the mass flow through the turbine and the power output of the turbine by up to 20%. Uninhibited MEA is generally limited by corrosion problems to about 15-20 % by weight concentration. The low concentration raises the reboiler duty substantially. By applying inhibitors the concentration can be increased to about 25-30 % by weight, thus lowering the heat demand. Flue gas temperature Hot flue gases can cause solvent degradation and decrease absorber efficiency. For MEA based solvents the inlet flue gas must have a temperature of max. 50°C. Oxygen Presence of oxygen in the flue gas can increase corrosion and solvent degradation in the absorption system. Uninhibited alkanolamines such as MEA and DEA can be oxidized to give carboxylic acids and heat-stable amine salts. A solution to this problem is to apply an inhibitor to both passivate the metal and inhibit amine degradation. An alternative approach would be to remove all of the oxygen by applying a near stoichiometric combustion and a catalytic reactor. SOx SOx reacts irreversibly with MEA based solvents to produce non-reclaimable corrosive salts. For MEA-based processes it is estimated that it is less expensive to install a SOx scrubber than accept the solvent loss at flue gas SOx levels exceeding 10 ppm(v). This is especially a problem for high sulphur fuels like coal but a less problem for natural gas. The acceptable SOx content in the flue gas and the investment in additional de-SOx plant is an optimisation issue in relation to the price of the absorbent. SO3 presents additional problems in that it not only causes solvent loss through formation of heat stable salts but it also forms corrosive sulphuric acid aerosol in wet scrubbers. A special mist eliminator or a wet electrostatic precipitator and also flue gas cooling should be used to increase the SO3 removal in the scrubbing system.
26
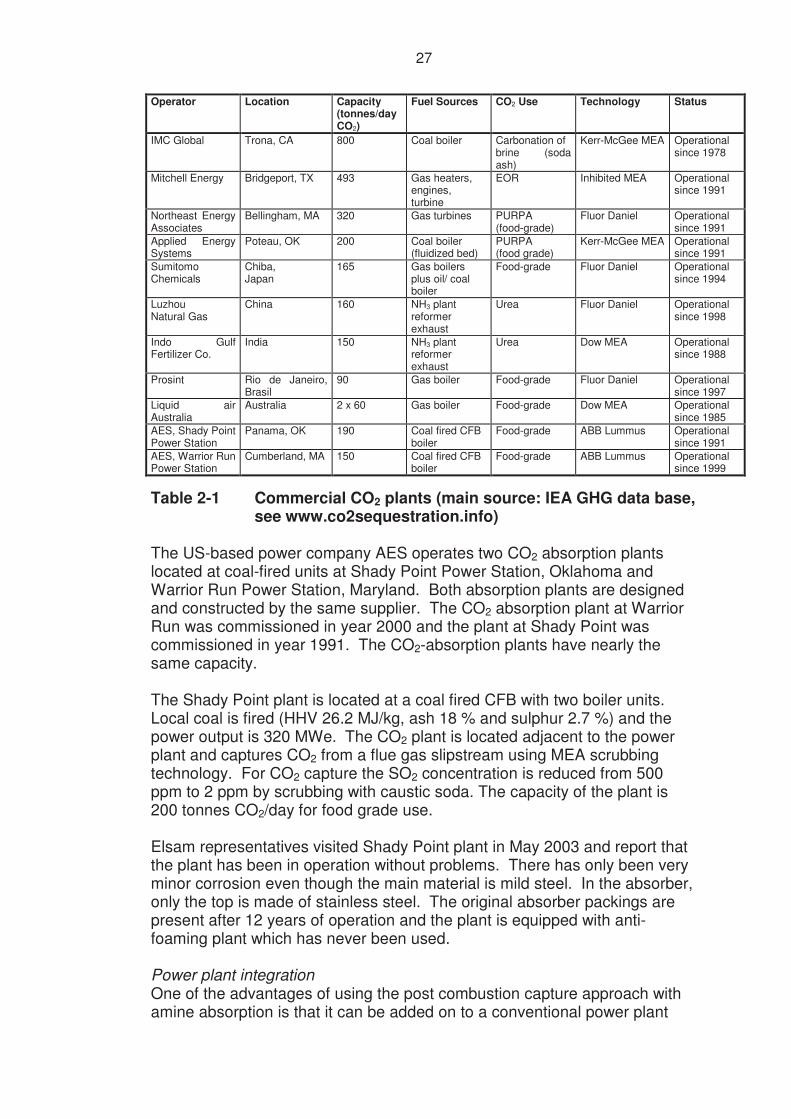
NOx Nitrogen oxides have led to corrosion problems and amine degradation in some absorption plants. The main problem is NO2 (including N2O4 etc.), which reacts to form nitric acid in the amine solvent and ultimately heat stable salts. An NO2-level of < 20 ppm(v) is recommended. Since modern plants are below this critical concentration, the limit on NO2 should be of minor concern. Fly ash Fly ash in the absorption solvent may cause foaming in the absorber and stripper, scaling and plugging of equipment, erosion, corrosion and increased solvent loss through chemical degradation and physical association with the waste sludge. Soot When amine capture is applied to heavy oil fired plant, soot presents a special problem in the absorber. The soot stabilises an amine mist above the CO2 absorption zone that is not captured in the water wash zone. In this instance, a special mist eliminator has to be employed to prevent the micron sized MEA mist particles leaving the absorber with the CO2-lean flue gas. Waste products Degradation of the amine solution as described above creates a waste product that has to be dealt with, possibly by incineration. The quantity of waste is somewhat uncertain but it is anticipated to be of the order of several tens to hundreds of tonnes per year for a full-scale plant. 2.3.3 Technology status and R&D needs MEA based absorption systems were developed over 60 years ago to provide a general non-selective solvent process to remove acid gas impurities, e.g. H2S and CO2, from natural gas streams. The process was then adapted to treat flue gas streams for CO2 capture for subsequent use in the carbonation of brine, dry ice formation, urea production and the carbonation of drinks. It has also been used for production of CO2 for enhanced oil recovery (EOR) operations (Chapter 4). Table 2-1 gives a summary of a selection of CO2 plants that are in commercial operation. These plants are typically much smaller than an electric utility scale, however, according to the manufacturers it is considered to be technically feasible to build an absorption plant to separate CO2 from a power plant flue gas stream. Commercial CO2-absorption plants are available to a size at least fitting a 400 MWe coal fired power plant from 2-3 potential suppliers world wide.
27
Operator Location Capacity (tonnes/day CO2)
Fuel Sources CO2 Use Technology Status
IMC Global Trona, CA 800 Coal boiler Carbonation of brine (soda ash)
Kerr-McGee MEA Operational since 1978
Mitchell Energy Bridgeport, TX 493 Gas heaters, engines, turbine
EOR Inhibited MEA Operational since 1991
Northeast Energy Associates
Bellingham, MA 320 Gas turbines PURPA (food-grade)
Fluor Daniel Operational since 1991
Applied Energy Systems
Poteau, OK 200 Coal boiler (fluidized bed)
PURPA (food grade)
Kerr-McGee MEA Operational since 1991
Sumitomo Chemicals
Chiba, Japan
165 Gas boilers plus oil/ coal boiler
Food-grade Fluor Daniel Operational since 1994
Luzhou Natural Gas
China 160 NH3 plant reformer exhaust
Urea Fluor Daniel Operational since 1998
Indo Gulf Fertilizer Co.
India 150 NH3 plant reformer exhaust
Urea Dow MEA Operational since 1988
Prosint Rio de Janeiro, Brasil
90 Gas boiler Food-grade Fluor Daniel Operational since 1997
Liquid air Australia
Australia 2 x 60 Gas boiler Food-grade Dow MEA Operational since 1985
AES, Shady Point Power Station
Panama, OK 190 Coal fired CFB boiler
Food-grade ABB Lummus Operational since 1991
AES, Warrior Run Power Station
Cumberland, MA 150 Coal fired CFB boiler
Food-grade ABB Lummus Operational since 1999
Table 2-1 Commercial CO2 plants (main source: IEA GHG data base, see www.co2sequestration.info)
The US-based power company AES operates two CO2 absorption plants located at coal-fired units at Shady Point Power Station, Oklahoma and Warrior Run Power Station, Maryland. Both absorption plants are designed and constructed by the same supplier. The CO2 absorption plant at Warrior Run was commissioned in year 2000 and the plant at Shady Point was commissioned in year 1991. The CO2-absorption plants have nearly the same capacity. The Shady Point plant is located at a coal fired CFB with two boiler units. Local coal is fired (HHV 26.2 MJ/kg, ash 18 % and sulphur 2.7 %) and the power output is 320 MWe. The CO2 plant is located adjacent to the power plant and captures CO2 from a flue gas slipstream using MEA scrubbing technology. For CO2 capture the SO2 concentration is reduced from 500 ppm to 2 ppm by scrubbing with caustic soda. The capacity of the plant is 200 tonnes CO2/day for food grade use. Elsam representatives visited Shady Point plant in May 2003 and report that the plant has been in operation without problems. There has only been very minor corrosion even though the main material is mild steel. In the absorber, only the top is made of stainless steel. The original absorber packings are present after 12 years of operation and the plant is equipped with anti-foaming plant which has never been used. Power plant integration One of the advantages of using the post combustion capture approach with amine absorption is that it can be added on to a conventional power plant
28
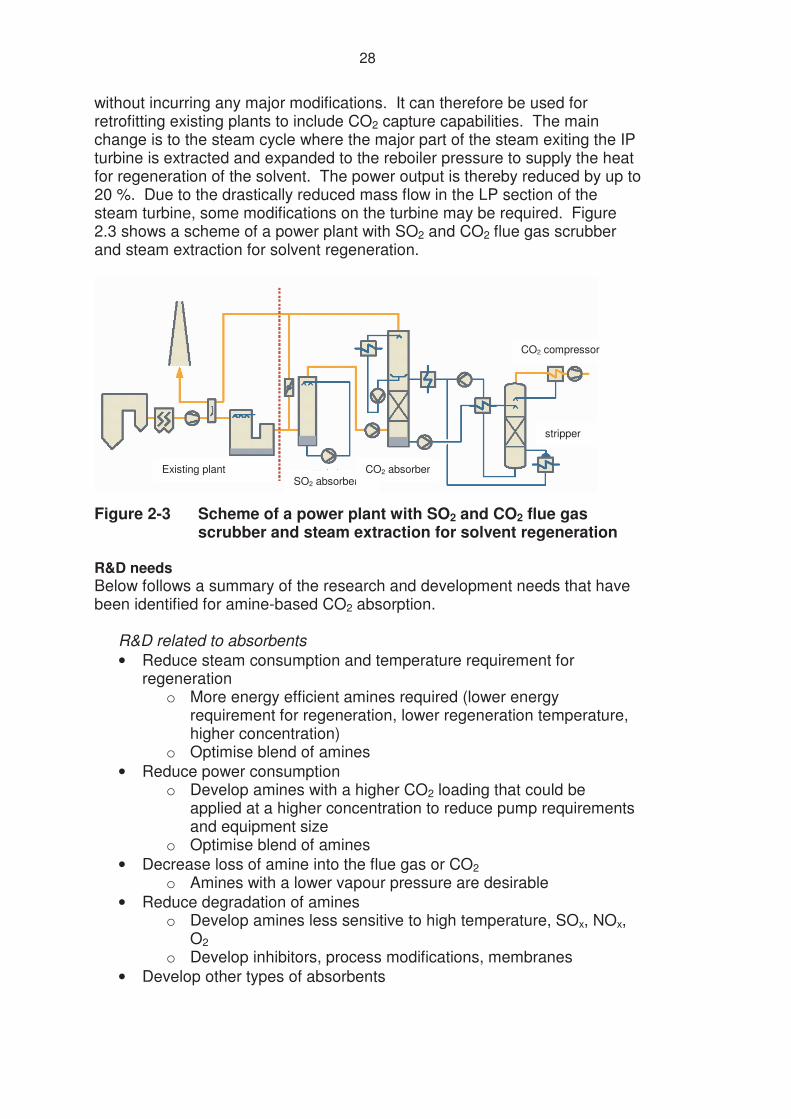
without incurring any major modifications. It can therefore be used for retrofitting existing plants to include CO2 capture capabilities. The main change is to the steam cycle where the major part of the steam exiting the IP turbine is extracted and expanded to the reboiler pressure to supply the heat for regeneration of the solvent. The power output is thereby reduced by up to 20 %. Due to the drastically reduced mass flow in the LP section of the steam turbine, some modifications on the turbine may be required. Figure 2.3 shows a scheme of a power plant with SO2 and CO2 flue gas scrubber and steam extraction for solvent regeneration.
Figure 2-3 Scheme of a power plant with SO2 and CO2 flue gas scrubber and steam extraction for solvent regeneration
R&D needs Below follows a summary of the research and development needs that have been identified for amine-based CO2 absorption.
R&D related to absorbents • Reduce steam consumption and temperature requirement for
regeneration o More energy efficient amines required (lower energy
requirement for regeneration, lower regeneration temperature, higher concentration)
o Optimise blend of amines • Reduce power consumption
o Develop amines with a higher CO2 loading that could be applied at a higher concentration to reduce pump requirements and equipment size
o Optimise blend of amines • Decrease loss of amine into the flue gas or CO2
o Amines with a lower vapour pressure are desirable • Reduce degradation of amines
o Develop amines less sensitive to high temperature, SOx, NOx, O2
o Develop inhibitors, process modifications, membranes • Develop other types of absorbents
Existing plant SO2 absorber
CO2 absorber
CO2 compressor
stripper
29
Other areas for development • Integration possibilities with power plant should be investigated
o Integration between reboiler and reclaimer and IP steam extraction
o Use of heat from CO2 compression intercooling for feedwater preheating
o Find integration possibilities for use of heat from flue gas cooler, lean amine solution cooler, reflux condenser and CO2 dryer (e.g. district heating, feed water preheating etc.)
• Reduced flue gas blower requirement o More efficient packing to reduce absorber pressure drop
• Process optimisation for large scale plant o Process modifications, e.g. split flow solvent process (lean and
semi-lean solution) o Improve simulation tools used for optimisation to better predict
performance o Investigate possibilities for cost reductions due to economy of
scale • Demonstration of long-term operational availability and reliability on a
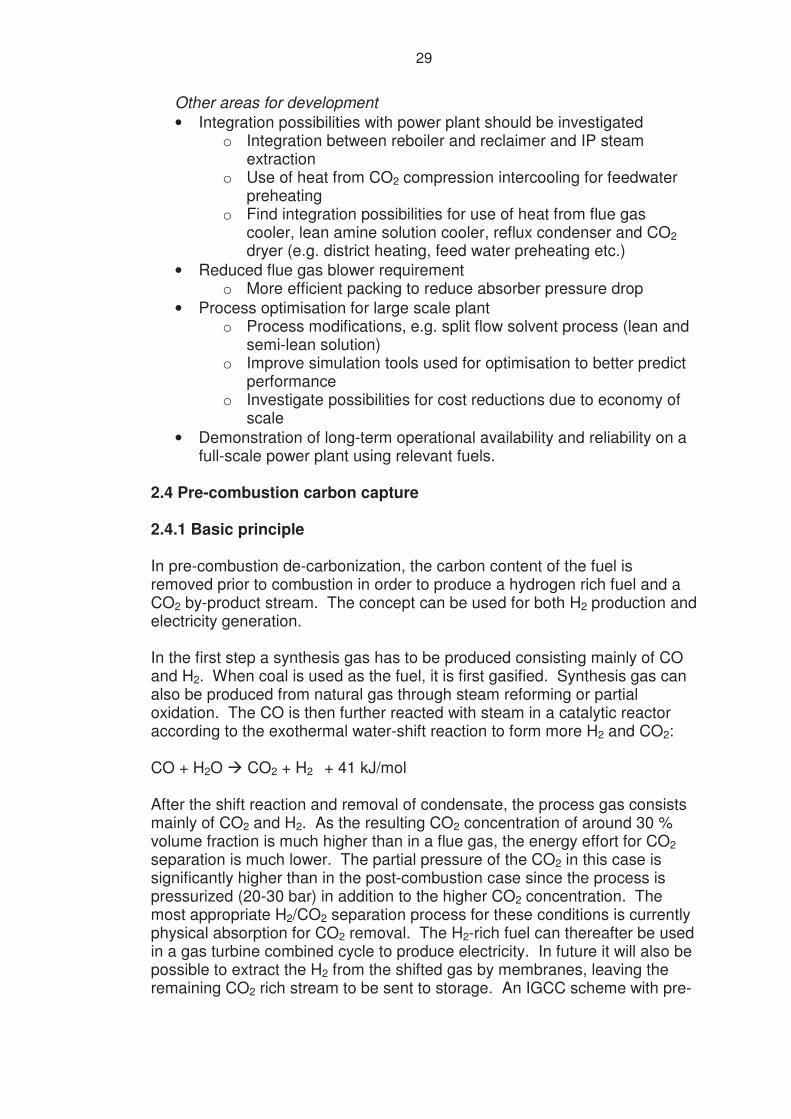
full-scale power plant using relevant fuels. 2.4 Pre-combustion carbon capture 2.4.1 Basic principle In pre-combustion de-carbonization, the carbon content of the fuel is removed prior to combustion in order to produce a hydrogen rich fuel and a CO2 by-product stream. The concept can be used for both H2 production and electricity generation. In the first step a synthesis gas has to be produced consisting mainly of CO and H2. When coal is used as the fuel, it is first gasified. Synthesis gas can also be produced from natural gas through steam reforming or partial oxidation. The CO is then further reacted with steam in a catalytic reactor according to the exothermal water-shift reaction to form more H2 and CO2: CO + H2O � CO2 + H2 + 41 kJ/mol After the shift reaction and removal of condensate, the process gas consists mainly of CO2 and H2. As the resulting CO2 concentration of around 30 % volume fraction is much higher than in a flue gas, the energy effort for CO2 separation is much lower. The partial pressure of the CO2 in this case is significantly higher than in the post-combustion case since the process is pressurized (20-30 bar) in addition to the higher CO2 concentration. The most appropriate H2/CO2 separation process for these conditions is currently physical absorption for CO2 removal. The H2-rich fuel can thereafter be used in a gas turbine combined cycle to produce electricity. In future it will also be possible to extract the H2 from the shifted gas by membranes, leaving the remaining CO2 rich stream to be sent to storage. An IGCC scheme with pre-
30
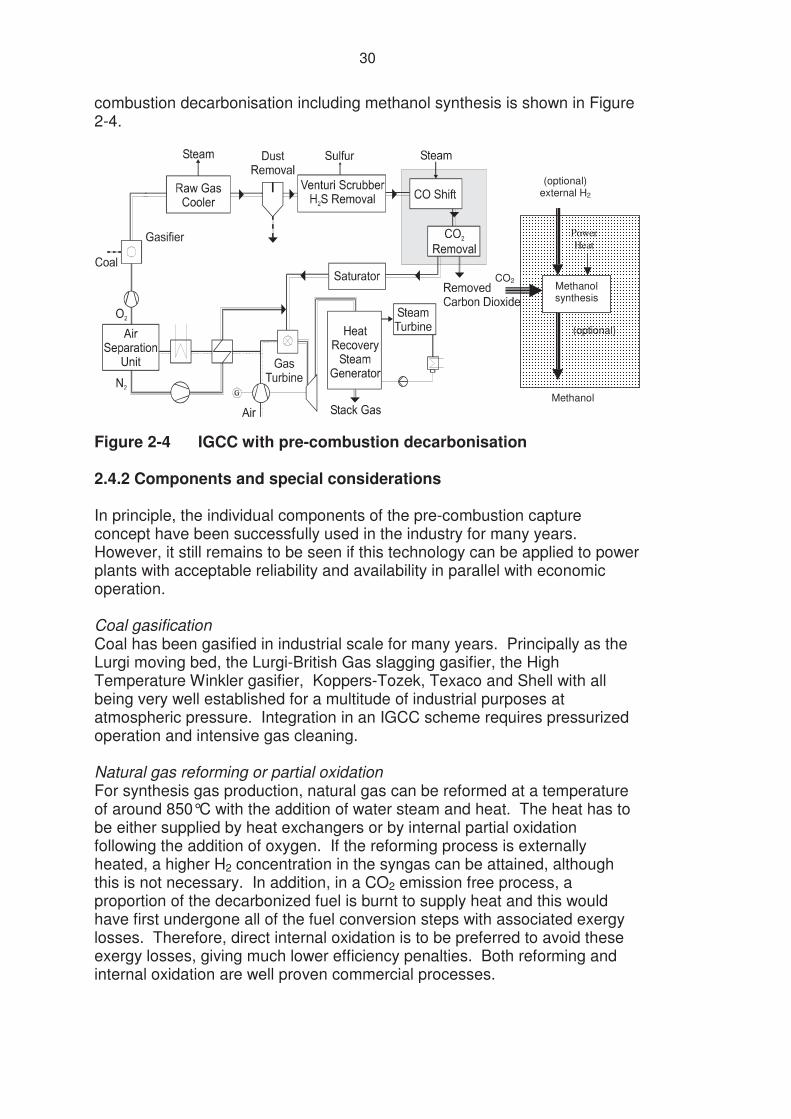
combustion decarbonisation including methanol synthesis is shown in Figure 2-4.
Methanolsynthesis
CO2
(optional)
(optional)external H2
PowerHeat
Methanol
�
Figure 2-4 IGCC with pre-combustion decarbonisation�
�
2.4.2 Components and special considerations In principle, the individual components of the pre-combustion capture concept have been successfully used in the industry for many years. However, it still remains to be seen if this technology can be applied to power plants with acceptable reliability and availability in parallel with economic operation. Coal gasification Coal has been gasified in industrial scale for many years. Principally as the Lurgi moving bed, the Lurgi-British Gas slagging gasifier, the High Temperature Winkler gasifier, Koppers-Tozek, Texaco and Shell with all being very well established for a multitude of industrial purposes at atmospheric pressure. Integration in an IGCC scheme requires pressurized operation and intensive gas cleaning. Natural gas reforming or partial oxidation For synthesis gas production, natural gas can be reformed at a temperature of around 850°C with the addition of water steam and heat. The heat has to be either supplied by heat exchangers or by internal partial oxidation following the addition of oxygen. If the reforming process is externally heated, a higher H2 concentration in the syngas can be attained, although this is not necessary. In addition, in a CO2 emission free process, a proportion of the decarbonized fuel is burnt to supply heat and this would have first undergone all of the fuel conversion steps with associated exergy losses. Therefore, direct internal oxidation is to be preferred to avoid these exergy losses, giving much lower efficiency penalties. Both reforming and internal oxidation are well proven commercial processes.
31
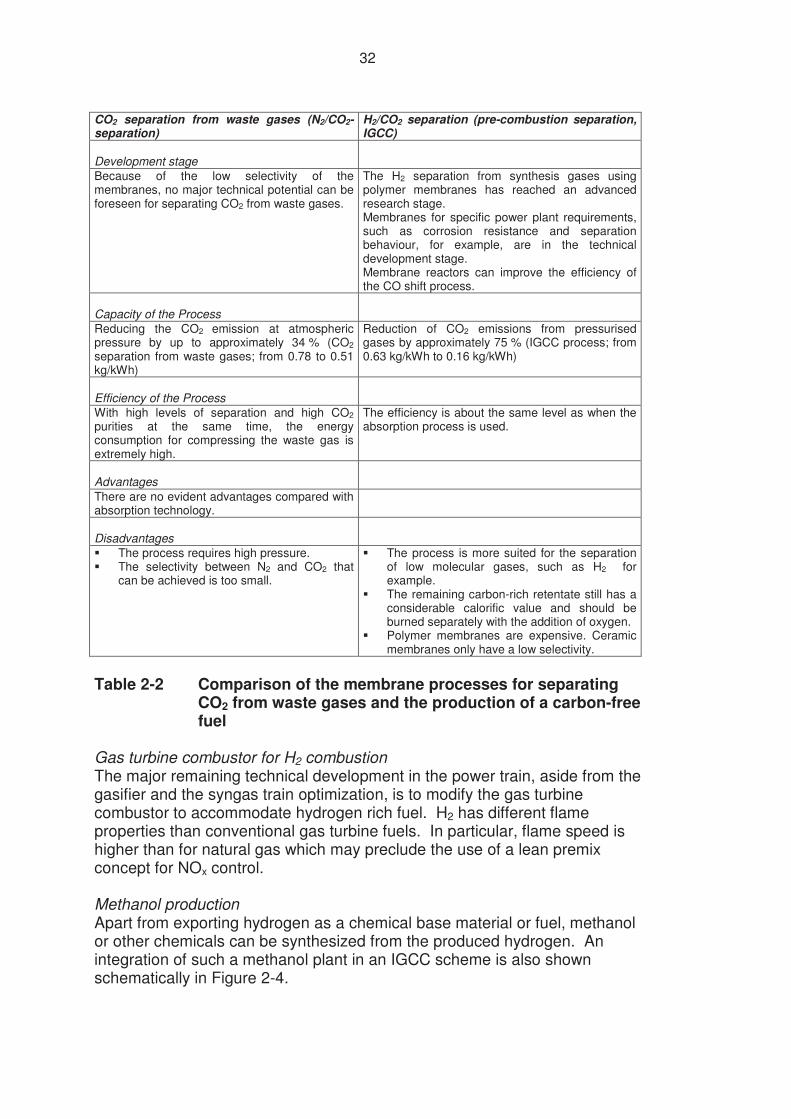
CO Shift (Water gas reaction) The homogeneous water gas shift reaction (CO shift) is used in the chemical industries to adjust the hydrogen content of synthesis gases at reaction temperatures between 180°C and 500°C in catalytic reactors. By using a two stage catalytic CO shift reactor, a high CO conversion rate can be attained with the addition of steam. Since this is an exothermic reaction, the fuel energy content is reduced and gives rise to an efficiency loss, although this can be mitigated using an energy recovery scheme to preheat the steam. A further development would be to use ceramic membrane reactors in which the CO shift reaction can be combined with H2 extraction, thereby reducing the additional steam requirement to give a high CO conversion rate. This development would also reduce the efficiency losses due to the CO shift. Physical CO2 absorption Physical absorption is used for CO2 separation for pressurised gases, e.g. for synthesis gases and natural gas. The process operates at temperatures of < 60°C and pressures up to 160 bar. Methanol, n-methyl-2 pyrrolidon (NMP), dimethyl-ether-polyethylene-glycol (DMPEG) and propylene-carbonate are used as absorbents. For regeneration, the solvent is expanded to low pressure at which the CO2 is released. Main internal consumption has to be spent for solvent circulation and eventually refrigeration. The process allows high levels of separation with high CO2 purities. In the case of IGCC with CO shift, the CO2 separation with physical absorption only makes a small contribution to the additional energy consumption. CO2 separation by physical absorption is an industrial method for certain chemical processes. The removal of CO2 simultaneously reduces the volume flow through the turbine and thus causes a power reduction. H2-separation membranes An efficient separation process demands high membrane selectivity, a reasonable size of the membrane surface and also compression of the total gas flow. The highest selectivities can be achieved by separating the smallest molecules such as hydrogen. Therefore membrane separation is best suited to separating hydrogen from the gas mixture and retaining CO2. Polymer membranes are generally appropriate for a high mass permeability of H2 if the gas temperature is below 100°C. At higher temperatures, ceramic membranes can be used, although these have the problem of low selectivity. Apart from the quality of the membrane, which depends on permeability and selectivity, other process parameters, in particular the pressure, determine the gas separation efficiency. Membranes for specific power plant requirements, such as corrosion resistance and separation behaviour, are still in the technical development stage. A comparison of the membrane processes for separating CO2 from waste gases and the production of carbon-free fuel is shown in Table 2-2.
32
CO2 separation from waste gases (N2/CO2-separation)
H2/CO2 separation (pre-combustion separation, IGCC)
Development stage
Because of the low selectivity of the membranes, no major technical potential can be foreseen for separating CO2 from waste gases.
The H2 separation from synthesis gases using polymer membranes has reached an advanced research stage. Membranes for specific power plant requirements, such as corrosion resistance and separation behaviour, for example, are in the technical development stage. Membrane reactors can improve the efficiency of the CO shift process.
Capacity of the Process
Reducing the CO2 emission at atmospheric pressure by up to approximately 34 % (CO2 separation from waste gases; from 0.78 to 0.51 kg/kWh)
Reduction of CO2 emissions from pressurised gases by approximately 75 % (IGCC process; from 0.63 kg/kWh to 0.16 kg/kWh)
Efficiency of the Process
With high levels of separation and high CO2 purities at the same time, the energy consumption for compressing the waste gas is extremely high.
The efficiency is about the same level as when the absorption process is used.
Advantages
There are no evident advantages compared with absorption technology.
Disadvantages
� The process requires high pressure. � The selectivity between N2 and CO2 that
can be achieved is too small.
� The process is more suited for the separation of low molecular gases, such as H2 for example.
� The remaining carbon-rich retentate still has a considerable calorific value and should be burned separately with the addition of oxygen.
� Polymer membranes are expensive. Ceramic membranes only have a low selectivity.
Table 2-2 Comparison of the membrane processes for separating
CO2 from waste gases and the production of a carbon-free fuel
Gas turbine combustor for H2 combustion The major remaining technical development in the power train, aside from the gasifier and the syngas train optimization, is to modify the gas turbine combustor to accommodate hydrogen rich fuel. H2 has different flame properties than conventional gas turbine fuels. In particular, flame speed is higher than for natural gas which may preclude the use of a lean premix concept for NOx control. Methanol production Apart from exporting hydrogen as a chemical base material or fuel, methanol or other chemicals can be synthesized from the produced hydrogen. An integration of such a methanol plant in an IGCC scheme is also shown schematically in Figure 2-4.
33
IGCC development Since the IGCC concept was only feasible when highly efficient and economic combined cycles had emerged, its development does not have a long history. For example, in Europe, there have been only few IGCC demonstration projects to date (e.g., 170 MWe Kellermann IGCC, Lünen, Germany 1969-1977; 250 MWe Buggenum IGCC, NL since 1993, efficiency 43 %; 300 MWe Puertollano IGCC, Spain 1997, efficiency 45 %; 500 MWe ISAB SpA refinery IGCC, Italy 1997). U.S. IGCC plants with state-of-the-art technology are called 'Second-Generation'-IGCC (93 MWe Cool Water is considered as 'First-Generation' in 1986 at an efficiency of 31 %). The intention is to demonstrate 40 - 45 % (HHV) for green-field plants and 36 - 40 % (HHV) for retrofit plants before 2000. In the long-term, R&D programs funded by the US-DOE are aimed at developing the 'Third-Generation'-IGCC, due to be commercially available before 2010. Tracking of the developments from the Buggenum IGCC towards the Puertollano IGCC shows that there is rapid progress with each new IGCC plant. Studies even predict efficiencies of up to 51.7 %, with current gas turbine technology, at a competitive investment (European Commission, 1998; Baumann (“IGCC...”), 1998). However, with limited operational experience, IGCC systems have not yet demonstrated sufficient availability which has impeded a commercial break through. The reasons for the failure are manifold. The process complexity and the efforts to achieve high efficiency have led to a very integrated and complicated design. This has resulted in poor availability and high cost. The trade-off between efficiency and complexity of design is a little different between the European units and the American ones but neither has promised a successful commercial continuation due, in large part, to the small number of projects which has led to limited operating experience and little opportunity to develop operational improvements. Whilst there is still a large learning curve to be tackled in relation to gasifier slagging, raw gas heat recovery and gas turbine combustion, there is still a large development potential for this young technology if a higher availability could be proven in further demonstration projects. 2.4.3 Technology status and R&D needs For over 50 years, H2 has been produced using gasification or reforming and the water-shift reaction for production of chemicals and fertilisers. For power generation IGCC power plants are considered to be clean and efficient options for utilising coal. However, although demonstrated at a commercial scale, they have not had their commercial break through, for reasons described above. Confidence has yet to be gained from technology development and capital costs are greater than for other currently available options.
34
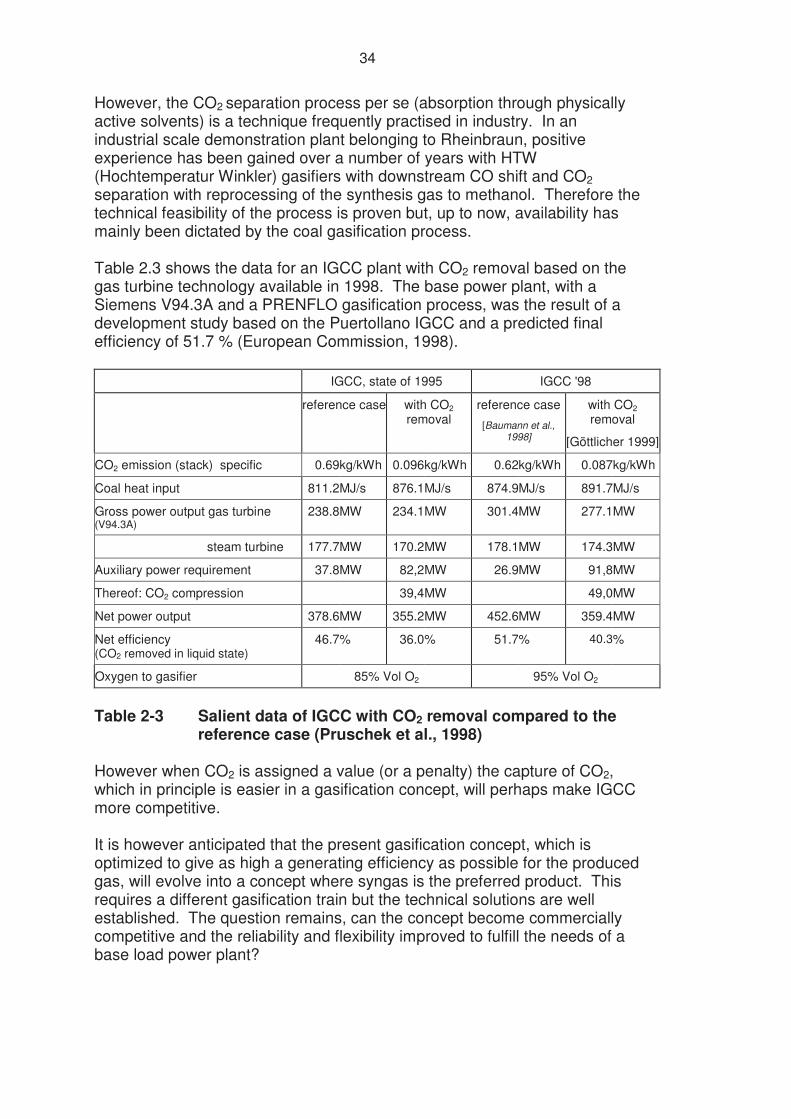
However, the CO2 separation process per se (absorption through physically active solvents) is a technique frequently practised in industry. In an industrial scale demonstration plant belonging to Rheinbraun, positive experience has been gained over a number of years with HTW (Hochtemperatur Winkler) gasifiers with downstream CO shift and CO2 separation with reprocessing of the synthesis gas to methanol. Therefore the technical feasibility of the process is proven but, up to now, availability has mainly been dictated by the coal gasification process. Table 2.3 shows the data for an IGCC plant with CO2 removal based on the gas turbine technology available in 1998. The base power plant, with a Siemens V94.3A and a PRENFLO gasification process, was the result of a development study based on the Puertollano IGCC and a predicted final efficiency of 51.7 % (European Commission, 1998). IGCC, state of 1995 IGCC '98
reference case with CO2 removal
reference case
[Baumann et al., 1998]
with CO2 removal
[Göttlicher 1999]
CO2 emission (stack) specific 0.69kg/kWh 0.096 kg/kWh 0.62kg/kWh 0.087kg/kWh
Coal heat input 811.2 MJ/s 876.1 MJ/s 874.9MJ/s 891.7MJ/s
Gross power output gas turbine (V94.3A)
238.8 MW 234.1 MW 301.4MW 277.1MW
steam turbine 177.7 MW 170.2 MW 178.1MW 174.3MW
Auxiliary power requirement 37.8 MW 82,2 MW 26.9MW 91,8MW
Thereof: CO2 compression 39,4 MW 49,0MW
Net power output 378.6 MW 355.2 MW 452.6MW 359.4MW
Net efficiency (CO2 removed in liquid state)
46.7% 36.0 % 51.7% 40.3%
Oxygen to gasifier 85% Vol O2 95% Vol O2
Table 2-3 Salient data of IGCC with CO2 removal compared to the
reference case (Pruschek et al., 1998) However when CO2 is assigned a value (or a penalty) the capture of CO2, which in principle is easier in a gasification concept, will perhaps make IGCC more competitive. It is however anticipated that the present gasification concept, which is optimized to give as high a generating efficiency as possible for the produced gas, will evolve into a concept where syngas is the preferred product. This requires a different gasification train but the technical solutions are well established. The question remains, can the concept become commercially competitive and the reliability and flexibility improved to fulfill the needs of a base load power plant?
35
R&D needs
• Improved availability of gasifier island • Catalyst for shift reaction • Integration of air separation unit • Novel methods for air separation (high temperature ceramic
membranes) • Improved solvents for physical absorption • Novel methods for CO2/H2 separation (membrane, both ceramic and
polymer) • Gas turbine modified for combustion of H2-rich fuel (including
prevention of NOx-formation)
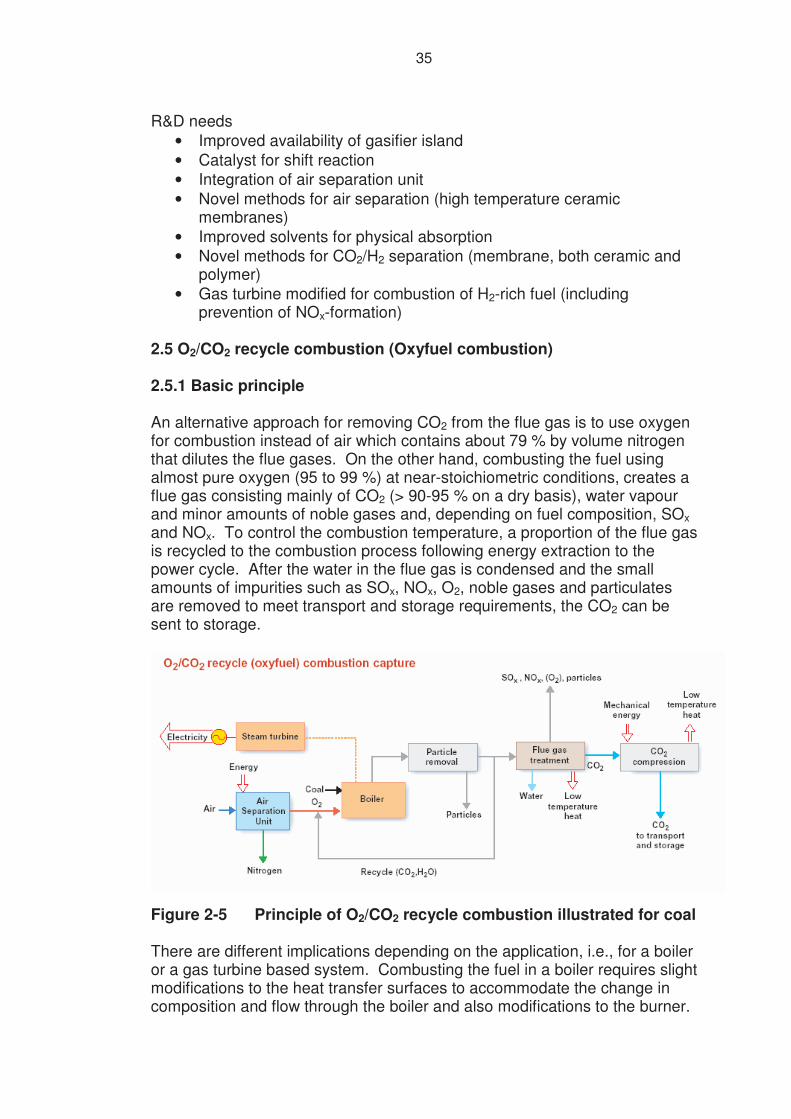
2.5 O2/CO2 recycle combustion (Oxyfuel combustion) 2.5.1 Basic principle An alternative approach for removing CO2 from the flue gas is to use oxygen for combustion instead of air which contains about 79 % by volume nitrogen that dilutes the flue gases. On the other hand, combusting the fuel using almost pure oxygen (95 to 99 %) at near-stoichiometric conditions, creates a flue gas consisting mainly of CO2 (> 90-95 % on a dry basis), water vapour and minor amounts of noble gases and, depending on fuel composition, SOx and NOx. To control the combustion temperature, a proportion of the flue gas is recycled to the combustion process following energy extraction to the power cycle. After the water in the flue gas is condensed and the small amounts of impurities such as SOx, NOx, O2, noble gases and particulates are removed to meet transport and storage requirements, the CO2 can be sent to storage.
Figure 2-5 Principle of O2/CO2 recycle combustion illustrated for coal There are different implications depending on the application, i.e., for a boiler or a gas turbine based system. Combusting the fuel in a boiler requires slight modifications to the heat transfer surfaces to accommodate the change in composition and flow through the boiler and also modifications to the burner.
36
The gas turbine based combined cycle requires modifications to the compressor, turbine, combustor, gas turbine cooling system and the heat recovery system as a result of the change of the properties of the gas passing through the turbine. For boiler applications, the O2/CO2 recycle technology is, from a technical standpoint, feasible as either a retrofit option for existing plants or for new plants. However, for the gas turbine based combined cycle, it is only possible to apply O2/CO2 recycle combustion to specially adapted new plants. Air separation at the scale required for a full-scale power plant application can be performed using existing commercially available cryogenic technology. However, producing the oxygen with this technology results in a high energy penalty. Other air separation technologies, suitable for large-scale application, and with a high energy efficiency, are therefore of great interest and are the focus of considerable development effort. 2.5.2 Boiler steam cycle In this case, all of the major components are available, at least in principle. Oxy-fuel firing has been used within the metal and glass manufacturing industries for some time, to achieve high temperatures, minimize energy losses and reduce emissions, but it has so far not been applied to full scale conventional steam boilers. Theoretical studies have concentrated on the retrofit option, however, there are advantages in applying this to new, modern ultra-supercritical boilers since their increased efficiency reduces the oxygen demand per unit of generated electricity and therefore the cost end efficiency penalty of O2/CO2 recycle combustion.
37
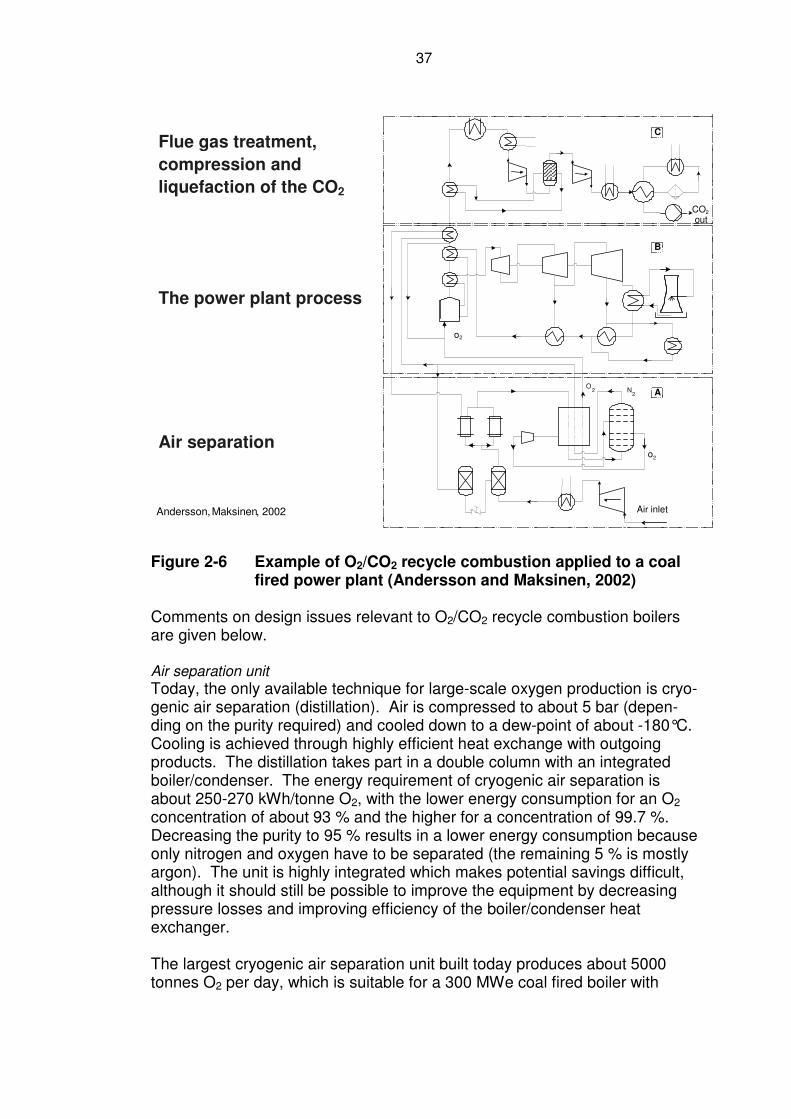
Figure 2-6 Example of O2/CO2 recycle combustion applied to a coal
fired power plant (Andersson and Maksinen, 2002) Comments on design issues relevant to O2/CO2 recycle combustion boilers are given below. Air separation unit Today, the only available technique for large-scale oxygen production is cryo-genic air separation (distillation). Air is compressed to about 5 bar (depen-ding on the purity required) and cooled down to a dew-point of about -180°C. Cooling is achieved through highly efficient heat exchange with outgoing products. The distillation takes part in a double column with an integrated boiler/condenser. The energy requirement of cryogenic air separation is about 250-270 kWh/tonne O2, with the lower energy consumption for an O2 concentration of about 93 % and the higher for a concentration of 99.7 %. Decreasing the purity to 95 % results in a lower energy consumption because only nitrogen and oxygen have to be separated (the remaining 5 % is mostly argon). The unit is highly integrated which makes potential savings difficult, although it should still be possible to improve the equipment by decreasing pressure losses and improving efficiency of the boiler/condenser heat exchanger. The largest cryogenic air separation unit built today produces about 5000 tonnes O2 per day, which is suitable for a 300 MWe coal fired boiler with
o 2
N 2
o 2
O 2
Air inlet
CO 2 out
A
B
C
The power plant process
Air separation
Flue gas treatment, compression and liquefaction of the CO2
Andersson, Maksinen , 2002
38
O2/CO2 recycle combustion. Multiple units are needed to supply a large coal fired power plant boiler with oxygen. Boiler Heat transfer areas Combusting the fuel with almost pure oxygen, combined with CO2 recirculation, produces gases of different physical and thermal properties which can cause significant differences in the heat transfer processes in the steam generator unit. When performing the heat transfer analysis, a model that accounts for three modes of heat transfer in the upper furnace and convective pass of the unit (direct radiation, non-luminous radiation and convection) has to be used. The presence of higher concentration of CO2, H2O and SO2 increases the non-luminous radiation. The choice of recycle rate also affects the heat transfer by controlling the flame temperature and volume flow through the furnace. In general, the retrofit studies performed have shown an increase in heat transfer rates but they are not deemed to require any major modifications. In the design of a new boiler, the desired heat transfer rates can already be accommodated in the design phase. The boiler efficiency is also increased due to a lower flue gas loss. Flue gas recirculation and heat recovery The O2/CO2 recycle combustion boiler has to be fitted with flue gas recirculation and a booster fan to overcome the additional pressure drop in the heat exchangers and ducts. Additional heat exchangers are also required to recover the heat in the flue gas for pre-heating oxygen and feedwater and to condense the steam in the flue gas. Boiler air in-leakage It is important to ensure that the boiler air in-leakage is as low as possible since the air dilutes the CO2/H2O mixture in the boiler and thereby makes separation of CO2 more difficult. This is a major obstacle when it comes to retrofitting O2/CO2 recycle combustion operation to existing boilers, which could have air in-leakage rates of 8-16 %. New boilers will not encounter this problem and can easily be designed with this in mind from the beginning. Without air in-leakage, the only gas component, in addition to those created by the combustion process, is argon. This is easily bled off during the condensation of the CO2 following compression although the extra non-condensable gases increase the compressor duty. However, studies reveal that the extra energy requirement is counterbalanced by the reduced energy needed for air separation. An oxygen purity of 95 % with no nitrogen left in the gas (the balance is argon) seems most favourable, according to investigations by Andersson and Maksinen, 2002. Fouling and slagging There are indications from experimental work on the oxy-fuel combustion of coal that fouling may be increased and, for some coals, the slagging propensity (Final report JOU2-CT92-0062, 1995). Further investigation is needed.
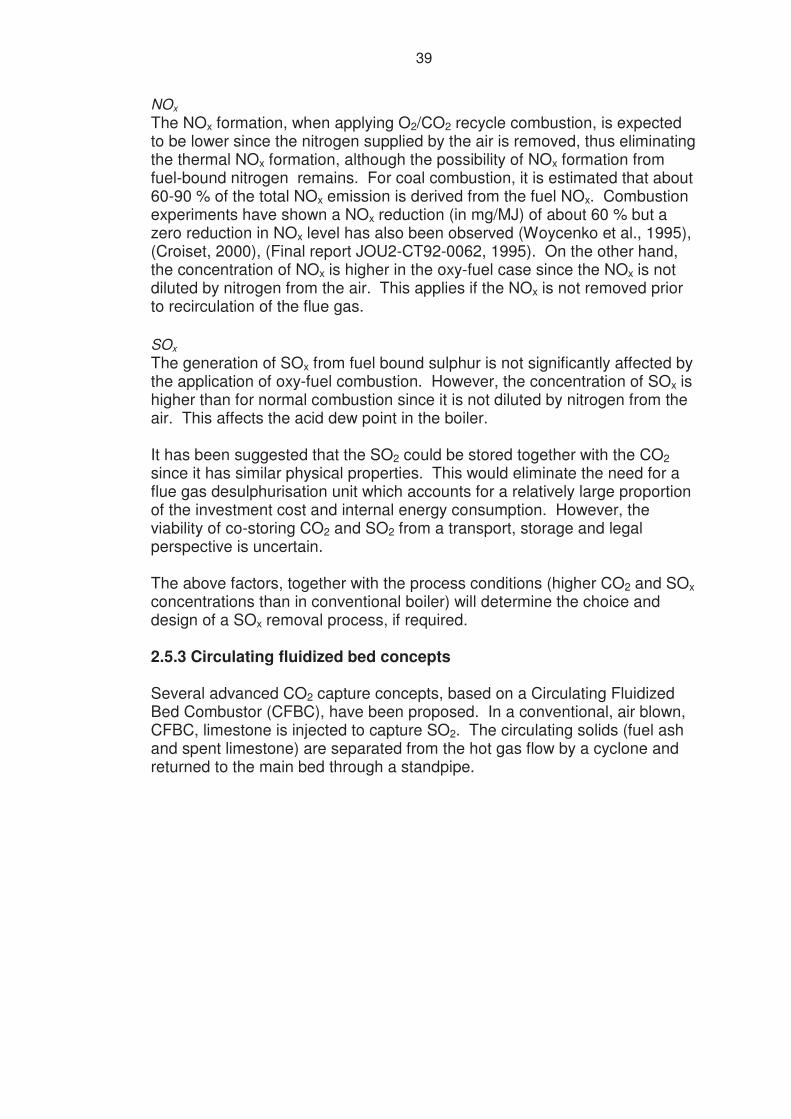
39
NOx The NOx formation, when applying O2/CO2 recycle combustion, is expected to be lower since the nitrogen supplied by the air is removed, thus eliminating the thermal NOx formation, although the possibility of NOx formation from fuel-bound nitrogen remains. For coal combustion, it is estimated that about 60-90 % of the total NOx emission is derived from the fuel NOx. Combustion experiments have shown a NOx reduction (in mg/MJ) of about 60 % but a zero reduction in NOx level has also been observed (Woycenko et al., 1995), (Croiset, 2000), (Final report JOU2-CT92-0062, 1995). On the other hand, the concentration of NOx is higher in the oxy-fuel case since the NOx is not diluted by nitrogen from the air. This applies if the NOx is not removed prior to recirculation of the flue gas. SOx The generation of SOx from fuel bound sulphur is not significantly affected by the application of oxy-fuel combustion. However, the concentration of SOx is higher than for normal combustion since it is not diluted by nitrogen from the air. This affects the acid dew point in the boiler. It has been suggested that the SO2 could be stored together with the CO2 since it has similar physical properties. This would eliminate the need for a flue gas desulphurisation unit which accounts for a relatively large proportion of the investment cost and internal energy consumption. However, the viability of co-storing CO2 and SO2 from a transport, storage and legal perspective is uncertain. The above factors, together with the process conditions (higher CO2 and SOx concentrations than in conventional boiler) will determine the choice and design of a SOx removal process, if required. 2.5.3 Circulating fluidized bed concepts Several advanced CO2 capture concepts, based on a Circulating Fluidized Bed Combustor (CFBC), have been proposed. In a conventional, air blown, CFBC, limestone is injected to capture SO2. The circulating solids (fuel ash and spent limestone) are separated from the hot gas flow by a cyclone and returned to the main bed through a standpipe.
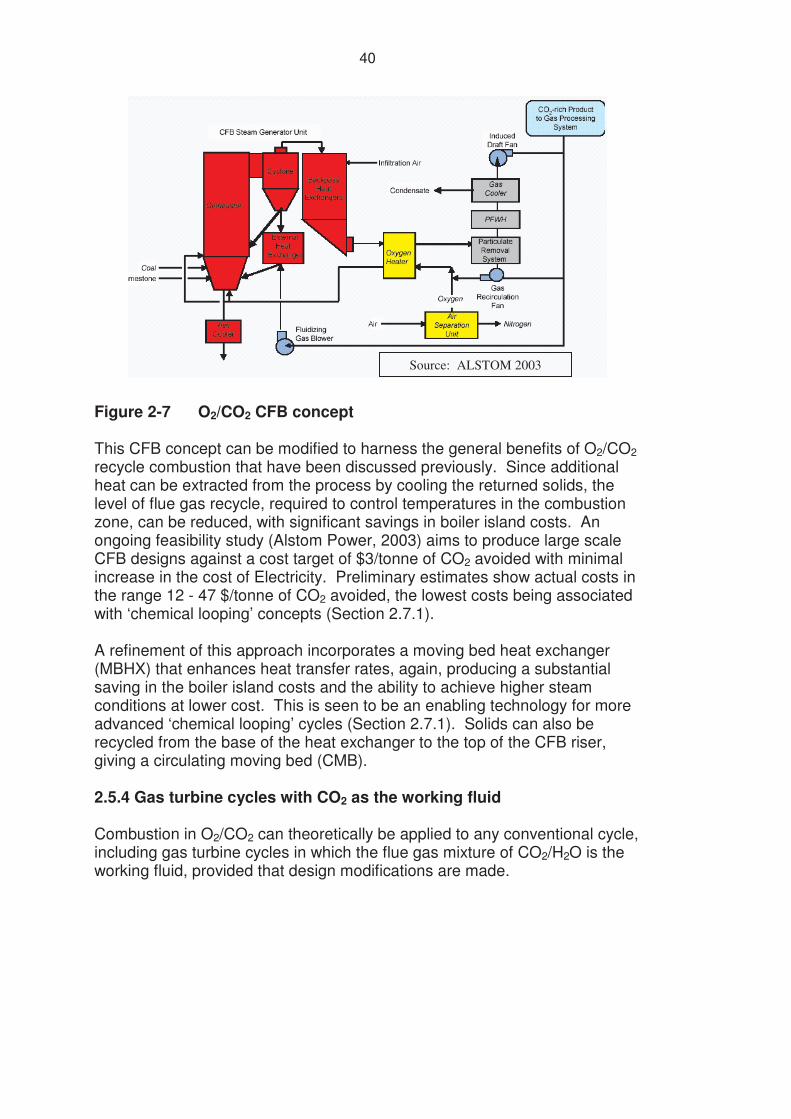
40
Figure 2-7 O2/CO2 CFB concept This CFB concept can be modified to harness the general benefits of O2/CO2 recycle combustion that have been discussed previously. Since additional heat can be extracted from the process by cooling the returned solids, the level of flue gas recycle, required to control temperatures in the combustion zone, can be reduced, with significant savings in boiler island costs. An ongoing feasibility study (Alstom Power, 2003) aims to produce large scale CFB designs against a cost target of $3/tonne of CO2 avoided with minimal increase in the cost of Electricity. Preliminary estimates show actual costs in the range 12 - 47 $/tonne of CO2 avoided, the lowest costs being associated with ‘chemical looping’ concepts (Section 2.7.1). A refinement of this approach incorporates a moving bed heat exchanger (MBHX) that enhances heat transfer rates, again, producing a substantial saving in the boiler island costs and the ability to achieve higher steam conditions at lower cost. This is seen to be an enabling technology for more advanced ‘chemical looping’ cycles (Section 2.7.1). Solids can also be recycled from the base of the heat exchanger to the top of the CFB riser, giving a circulating moving bed (CMB). 2.5.4 Gas turbine cycles with CO2 as the working fluid Combustion in O2/CO2 can theoretically be applied to any conventional cycle, including gas turbine cycles in which the flue gas mixture of CO2/H2O is the working fluid, provided that design modifications are made.
Source: ALSTOM 2003
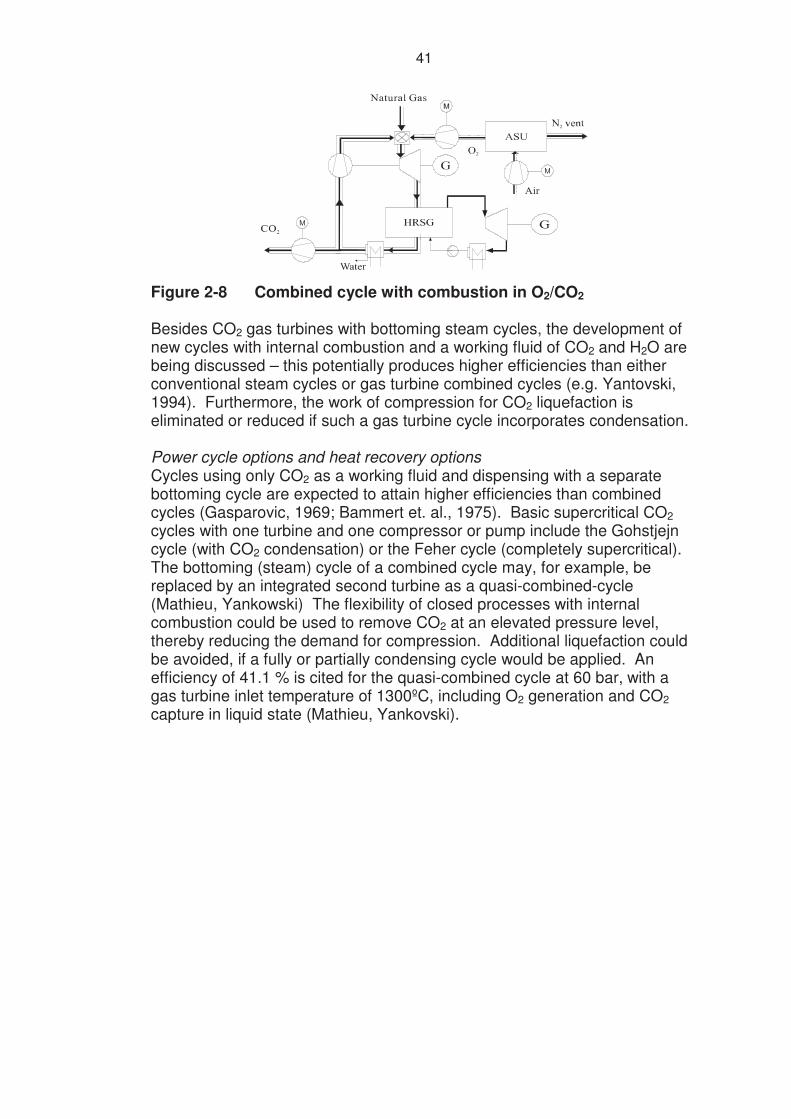
41
Figure 2-8 Combined cycle with combustion in O2/CO2 Besides CO2 gas turbines with bottoming steam cycles, the development of new cycles with internal combustion and a working fluid of CO2 and H2O are being discussed – this potentially produces higher efficiencies than either conventional steam cycles or gas turbine combined cycles (e.g. Yantovski, 1994). Furthermore, the work of compression for CO2 liquefaction is eliminated or reduced if such a gas turbine cycle incorporates condensation. Power cycle options and heat recovery options Cycles using only CO2 as a working fluid and dispensing with a separate bottoming cycle are expected to attain higher efficiencies than combined cycles (Gasparovic, 1969; Bammert et. al., 1975). Basic supercritical CO2 cycles with one turbine and one compressor or pump include the Gohstjejn cycle (with CO2 condensation) or the Feher cycle (completely supercritical). The bottoming (steam) cycle of a combined cycle may, for example, be replaced by an integrated second turbine as a quasi-combined-cycle (Mathieu, Yankowski) The flexibility of closed processes with internal combustion could be used to remove CO2 at an elevated pressure level, thereby reducing the demand for compression. Additional liquefaction could be avoided, if a fully or partially condensing cycle would be applied. An efficiency of 41.1 % is cited for the quasi-combined cycle at 60 bar, with a gas turbine inlet temperature of 1300ºC, including O2 generation and CO2 capture in liquid state (Mathieu, Yankovski).
42
Figure 2-9 Quasi-combined cycle with internal recuperation and
liquefaction (Mathieu, Yankovski) Working fluid properties at high pressure and temperature and impurity levels In comparison of CO2 to air, the most significant differences of their physical properties are found in density, heat capacity, the isentropic exponent and the speed of sound. Due to the higher density of CO2, the mass flow in a CO2 turbine is changed. The higher mass flow increases the load on the blades also due to the increased pressure drop. Compressor and turbine When CO2 is used as a working fluid, generally a higher pressure ratio than with air should be applied. While gas turbines with air as a working fluid are currently operated at an optimum pressure ratio of about 16, with the working fluid CO2 the optimum pressure of a simple cycle GT will be about 30 to 40. In an IGCC the optimum pressure ratio for highest efficiency the pressure ratio would even raise to much higher values. Compared to the gas/steam turbine combined cycle using CO2 as a gas turbine working fluid, a gas turbine in which compression proceeds close to the critical point (e.g. Gohstjejn cycle, MATIANT' cycle) can obtain a roughly equally high efficiency and comparable specific work at lower pressure ratios. Direct oxygen supply with membranes Developments of oxygen production with membranes ( high temperature Perowskit membranes) are outlined which will allow a new cycle with CO2 turbine at clearly lower energy demand and costs for oxygen supply (Figure 2-10) (Griffin, Winkler).
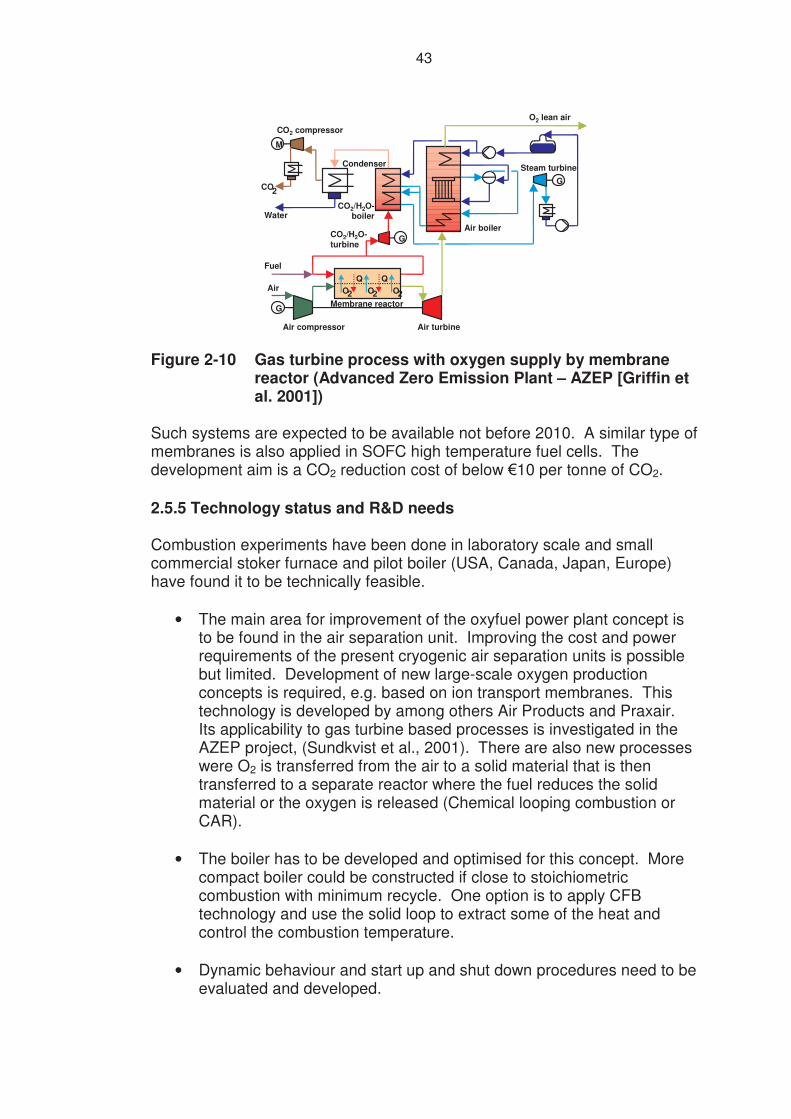
43
Air
G
Fuel
G
Air compressor Air turbine
Membrane reactor
CO2/H2O-turbine
Steam turbine
Air boiler
Condenser
O2
Water
M
CO2
CO2 compressor
QO2
QO2
G
CO2/H2O-boiler
O2 lean air
Figure 2-10 Gas turbine process with oxygen supply by membrane
reactor (Advanced Zero Emission Plant – AZEP [Griffin et al. 2001])
Such systems are expected to be available not before 2010. A similar type of membranes is also applied in SOFC high temperature fuel cells. The development aim is a CO2 reduction cost of below �10 per tonne of CO2. 2.5.5 Technology status and R&D needs Combustion experiments have been done in laboratory scale and small commercial stoker furnace and pilot boiler (USA, Canada, Japan, Europe) have found it to be technically feasible.
• The main area for improvement of the oxyfuel power plant concept is to be found in the air separation unit. Improving the cost and power requirements of the present cryogenic air separation units is possible but limited. Development of new large-scale oxygen production concepts is required, e.g. based on ion transport membranes. This technology is developed by among others Air Products and Praxair. Its applicability to gas turbine based processes is investigated in the AZEP project, (Sundkvist et al., 2001). There are also new processes were O2 is transferred from the air to a solid material that is then transferred to a separate reactor where the fuel reduces the solid material or the oxygen is released (Chemical looping combustion or CAR).
• The boiler has to be developed and optimised for this concept. More
compact boiler could be constructed if close to stoichiometric combustion with minimum recycle. One option is to apply CFB technology and use the solid loop to extract some of the heat and control the combustion temperature.
• Dynamic behaviour and start up and shut down procedures need to be
evaluated and developed.
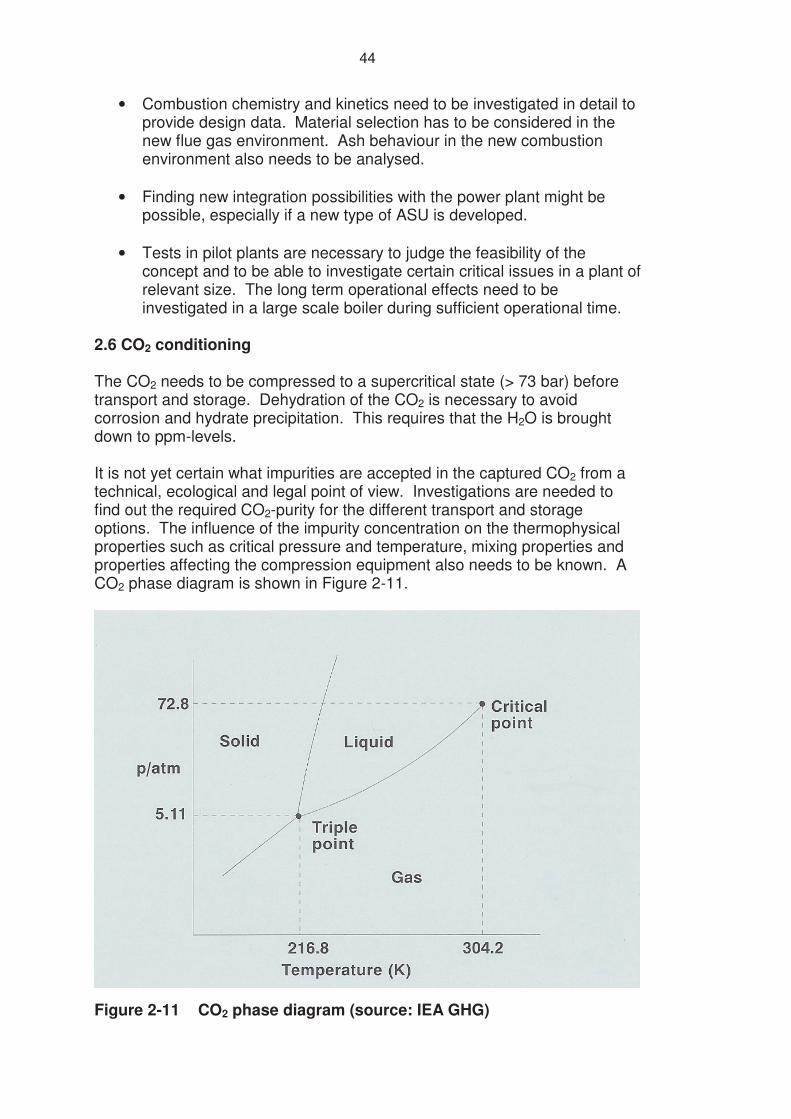
44
• Combustion chemistry and kinetics need to be investigated in detail to provide design data. Material selection has to be considered in the new flue gas environment. Ash behaviour in the new combustion environment also needs to be analysed.
• Finding new integration possibilities with the power plant might be
possible, especially if a new type of ASU is developed.
• Tests in pilot plants are necessary to judge the feasibility of the concept and to be able to investigate certain critical issues in a plant of relevant size. The long term operational effects need to be investigated in a large scale boiler during sufficient operational time.
2.6 CO2 conditioning The CO2 needs to be compressed to a supercritical state (> 73 bar) before transport and storage. Dehydration of the CO2 is necessary to avoid corrosion and hydrate precipitation. This requires that the H2O is brought down to ppm-levels. It is not yet certain what impurities are accepted in the captured CO2 from a technical, ecological and legal point of view. Investigations are needed to find out the required CO2-purity for the different transport and storage options. The influence of the impurity concentration on the thermophysical properties such as critical pressure and temperature, mixing properties and properties affecting the compression equipment also needs to be known. A CO2 phase diagram is shown in Figure 2-11.
Figure 2-11 CO2 phase diagram (source: IEA GHG)
45
Flue gas cleaning equipment that can be used to meet the required CO2 specification finally needs to be identified. The flue gas purity requirements have to be determined both for the flue gas recycled to the boiler and the CO2 to be compressed, transported and stored. 2.7 Overview of other concepts In this chapter, an overview is given of some of the new concepts that have been suggested to enhance power plant efficiency and decrease the cost of CO2 capture. These concepts are less well developed than those described previously and there is less reliance on conventional power plant components/process engineering equipment. The concepts selected for further description are: chemical looping combustion; fuel cells; regenerative adsorption and, finally, the ZECA process, which combines several of the novel technologies for capture and storage into one process. Other novel concepts, not described in detail here, include: biological CO2 fixation with algae (the flue gas is fed to a pond containing fast growing algae which assimilate the CO2) and formation of CO2 hydrates (an ice like material). More information about these can be found in, for instance, McKee, 2002 and Klara and Srivastava, 2002. 2.7.1 Chemical looping combustion Basic principle Chemical looping combustion (CLC) is an indirect combustion method. The fuel is not directly reacted with air but instead reacted with a solid oxygen carrier that transfers oxygen from the air to the fuel and then transports the chemical energy released by the fuel. CLC is divided into two reactions that take place in separate reactors as shown in Figure 2-12 which also details the chemical formulas that describe the process. One reactor is a reduction unit (fuel reactor) in which the oxygen carrier, a metal oxide MyOx, oxidises the fuel and the released energy is stored in the reduced metal oxide, MyOx-1 (as shown in Figure 2-12 with nickel oxide as an example). The reduced metal oxide is then transported into the second reactor (termed the oxidation unit or air reactor) in which the reduced metal oxide is re-oxidised by air (Equation 2) and the energy stored in the reduced metal oxide is released in the reactor. The metal oxide is then again transferred to the fuel reactor and the cycle repeated. The overall reaction in the two reactors is equal to the combustion of fuel with oxygen instead of with air (Equation 3). Depending on the oxygen carrier, reaction (1) is often endothermic while reaction (2) is exothermic. The combined net heat of reaction is the same as that of the fuel combusting directly with air. A full conversion between MyOx and MyOx-1 in reactors (1) and (2) may not be necessary because the conversion rates of the oxygen carrier in the reactors may be more important for this type of CLC process.
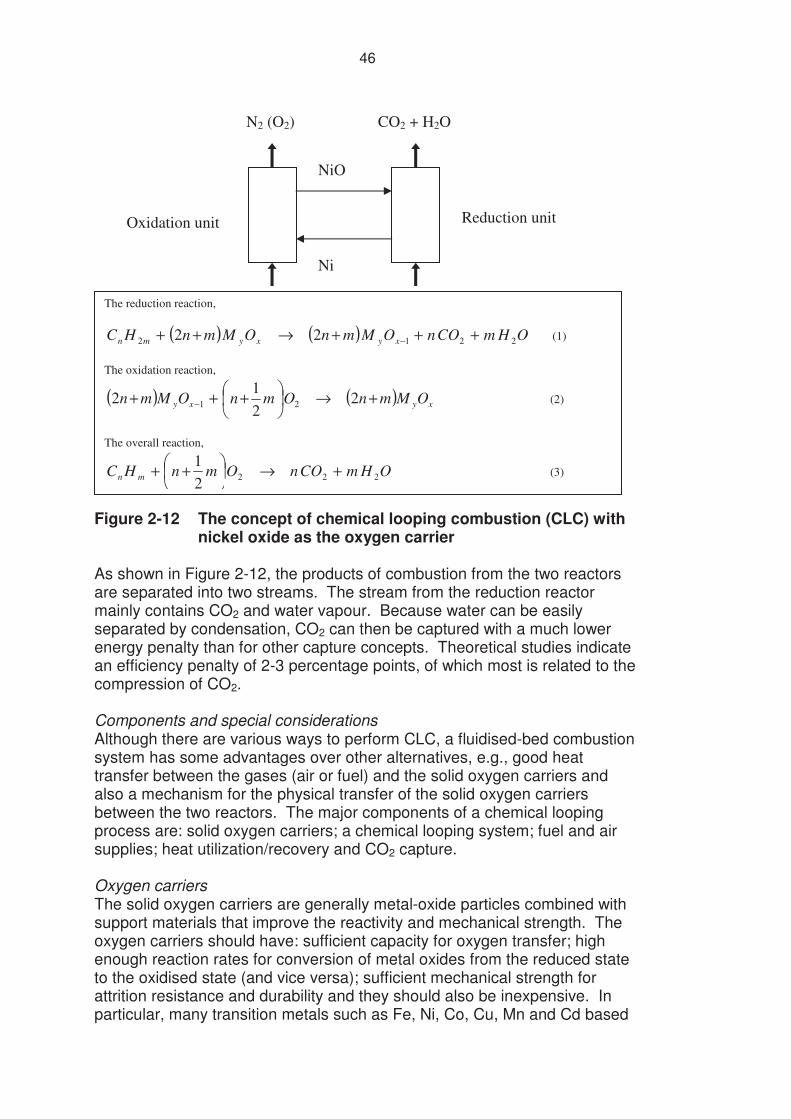
46
Figure 2-12 The concept of chemical looping combustion (CLC) with nickel oxide as the oxygen carrier As shown in Figure 2-12, the products of combustion from the two reactors are separated into two streams. The stream from the reduction reactor mainly contains CO2 and water vapour. Because water can be easily separated by condensation, CO2 can then be captured with a much lower energy penalty than for other capture concepts. Theoretical studies indicate an efficiency penalty of 2-3 percentage points, of which most is related to the compression of CO2. Components and special considerations Although there are various ways to perform CLC, a fluidised-bed combustion system has some advantages over other alternatives, e.g., good heat transfer between the gases (air or fuel) and the solid oxygen carriers and also a mechanism for the physical transfer of the solid oxygen carriers between the two reactors. The major components of a chemical looping process are: solid oxygen carriers; a chemical looping system; fuel and air supplies; heat utilization/recovery and CO2 capture. Oxygen carriers The solid oxygen carriers are generally metal-oxide particles combined with support materials that improve the reactivity and mechanical strength. The oxygen carriers should have: sufficient capacity for oxygen transfer; high enough reaction rates for conversion of metal oxides from the reduced state to the oxidised state (and vice versa); sufficient mechanical strength for attrition resistance and durability and they should also be inexpensive. In particular, many transition metals such as Fe, Ni, Co, Cu, Mn and Cd based
Oxidation unit Reduction unit
NiO
Ni
Air Fuel
N2 (O2) CO2 + H2O
The reduction reaction,
( ) ( ) OHmCOnOMmnOMmnHC xyxymn 2212 22 +++→++ − (1)
The oxidation reaction,
( ) ( ) xyxy OMmnOmnOMmn +→��
���
� +++ − 221
2 21 (2)
The overall reaction,
OHmCOnOmnHC mn 22221 +→�
�
���
� ++ (3)
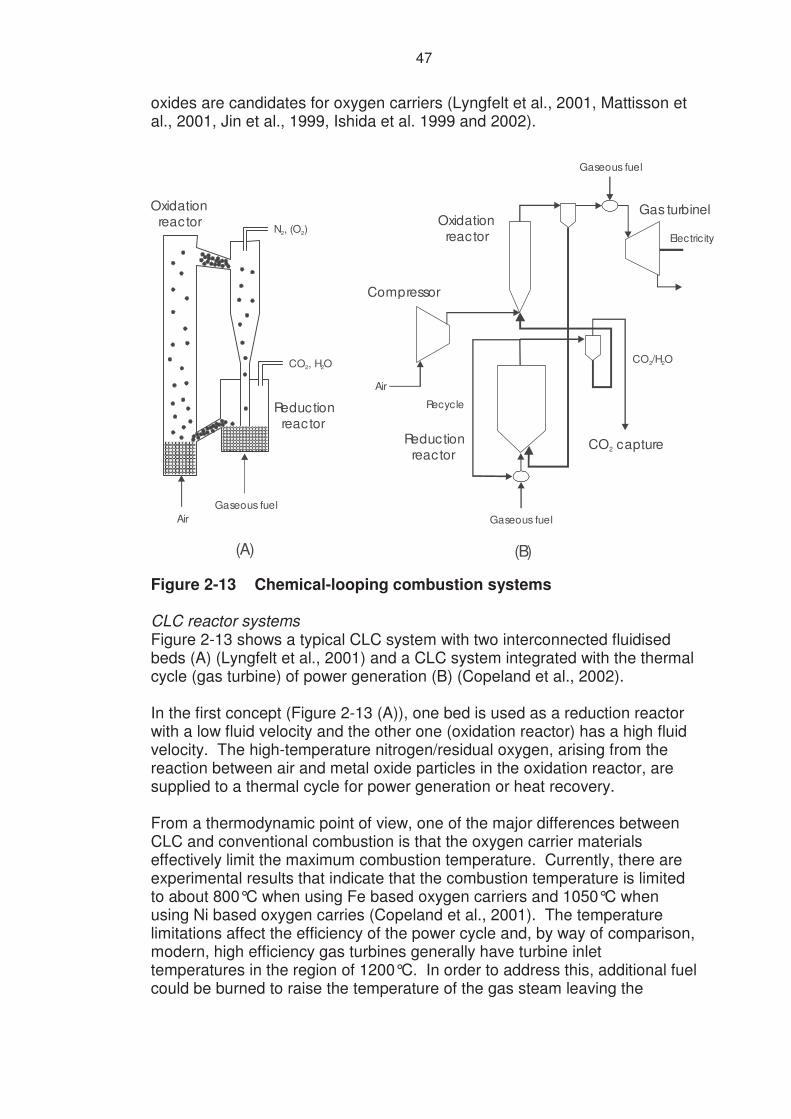
47
oxides are candidates for oxygen carriers (Lyngfelt et al., 2001, Mattisson et al., 2001, Jin et al., 1999, Ishida et al. 1999 and 2002).
Figure 2-13 Chemical-looping combustion systems CLC reactor systems Figure 2-13 shows a typical CLC system with two interconnected fluidised beds (A) (Lyngfelt et al., 2001) and a CLC system integrated with the thermal cycle (gas turbine) of power generation (B) (Copeland et al., 2002). In the first concept (Figure 2-13 (A)), one bed is used as a reduction reactor with a low fluid velocity and the other one (oxidation reactor) has a high fluid velocity. The high-temperature nitrogen/residual oxygen, arising from the reaction between air and metal oxide particles in the oxidation reactor, are supplied to a thermal cycle for power generation or heat recovery. From a thermodynamic point of view, one of the major differences between CLC and conventional combustion is that the oxygen carrier materials effectively limit the maximum combustion temperature. Currently, there are experimental results that indicate that the combustion temperature is limited to about 800°C when using Fe based oxygen carriers and 1050°C when using Ni based oxygen carries (Copeland et al., 2001). The temperature limitations affect the efficiency of the power cycle and, by way of comparison, modern, high efficiency gas turbines generally have turbine inlet temperatures in the region of 1200°C. In order to address this, additional fuel could be burned to raise the temperature of the gas steam leaving the
Air
Compressor
Oxidation reactor
Reduction reactor
Gaseous fuel
CO /H O2 2
Gas turbinel
CO capture2
Gaseous fuel
Recycle
(A) (B)
Air
Reduction reactor
Oxidation reactor
Gaseous fuel
N , (O )2 2
CO , HO2 2
Electricity
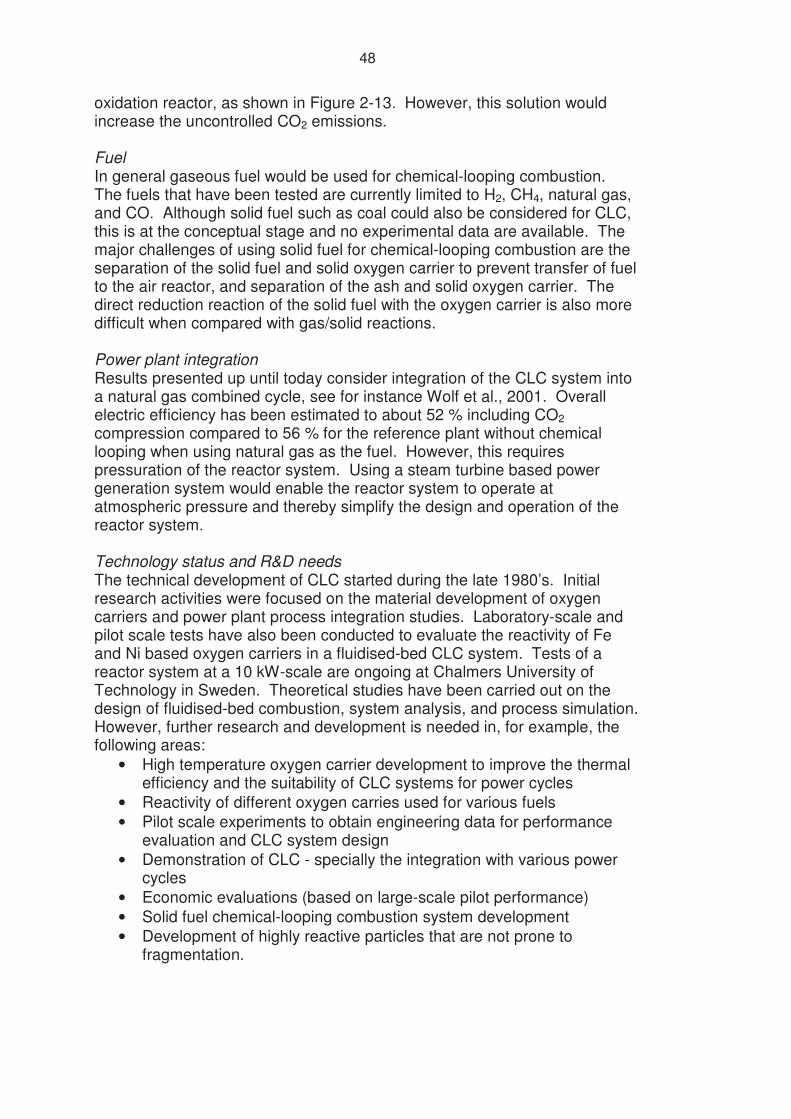
48
oxidation reactor, as shown in Figure 2-13. However, this solution would increase the uncontrolled CO2 emissions. Fuel In general gaseous fuel would be used for chemical-looping combustion. The fuels that have been tested are currently limited to H2, CH4, natural gas, and CO. Although solid fuel such as coal could also be considered for CLC, this is at the conceptual stage and no experimental data are available. The major challenges of using solid fuel for chemical-looping combustion are the separation of the solid fuel and solid oxygen carrier to prevent transfer of fuel to the air reactor, and separation of the ash and solid oxygen carrier. The direct reduction reaction of the solid fuel with the oxygen carrier is also more difficult when compared with gas/solid reactions. Power plant integration Results presented up until today consider integration of the CLC system into a natural gas combined cycle, see for instance Wolf et al., 2001. Overall electric efficiency has been estimated to about 52 % including CO2 compression compared to 56 % for the reference plant without chemical looping when using natural gas as the fuel. However, this requires pressuration of the reactor system. Using a steam turbine based power generation system would enable the reactor system to operate at atmospheric pressure and thereby simplify the design and operation of the reactor system. Technology status and R&D needs The technical development of CLC started during the late 1980’s. Initial research activities were focused on the material development of oxygen carriers and power plant process integration studies. Laboratory-scale and pilot scale tests have also been conducted to evaluate the reactivity of Fe and Ni based oxygen carriers in a fluidised-bed CLC system. Tests of a reactor system at a 10 kW-scale are ongoing at Chalmers University of Technology in Sweden. Theoretical studies have been carried out on the design of fluidised-bed combustion, system analysis, and process simulation. However, further research and development is needed in, for example, the following areas:
• High temperature oxygen carrier development to improve the thermal efficiency and the suitability of CLC systems for power cycles
• Reactivity of different oxygen carries used for various fuels • Pilot scale experiments to obtain engineering data for performance
evaluation and CLC system design • Demonstration of CLC - specially the integration with various power
cycles • Economic evaluations (based on large-scale pilot performance) • Solid fuel chemical-looping combustion system development • Development of highly reactive particles that are not prone to
fragmentation.
49
2.7.2 Fuel cells Fuel cells take advantage of the fact that, during oxidation, the fuel and its oxides remain separated from the oxidant. In high temperature fuel cells, oxygen is transported from the air side (cathode) to the fuel side (anode) as shown in Figure 2-14. The exhaust of the fuel side (anode exhaust) therefore contains only unconverted fuel, moisture and CO2 and is not diluted by air. However, since not all of the fuel is converted in the fuel cell stack, CO2 must either be separated from the residual fuel or the residual fuel must be consumed.
Figure 2-14 Principle of a SOFC New developments utilize the basic separation effect of the fuel cell and add an additional membrane reaction process to the exhaust gas stream in which the residual fuel is either oxidised (by oxygen permeating to the fuel side) or hydrogen is extracted. Applicable fuel cells Low temperature fuel cells - the polymer electrolyte membrane (PEM) fuel cells and phosphoric acid fuel cells (PAFCs) - are insensitive to CO2 but sensitive to CO and could only be operated with reformed fuel following almost complete CO conversion. In any case, all other contaminants would need to be removed to trace level concentrations. Therefore, for successful CO2 removal, fuel gas would have to be converted by first reforming, accompanied by a CO shift, prior to CO2 removal upstream of the fuel cell. The additional effort for CO2 removal would then only be the gas separation step. High temperature fuel cells (the Molten Carbonate Fuel Cell, MCFC, or the Solid Oxide Fuel Cell, SOFC) can partially convert a cleaned synthesis gas or natural gas directly. Both types of fuel cells have been proposed for use downstream of a coal gasification process fitted with intensive gas cleaning. The waste heat of high temperature fuel cells can be utilized in a bottoming steam cycle. In future, a topping gas turbine can also be envisaged.
50
2.7.3 Dry regenerative CO2 absorption A different approach for CO2 capture presently being explored employs dry regenerable sorbents. The CO2 is chemically adsorbed by the sorbent and is then subsequently released in a second step to produce a concentrated stream of CO2 at which point the sorbent is regenerated and recycled. Sorbents such as sodium carbonate, calcium oxide and lithium silicates have been investigated by a number of research organisations, (Kato et al., 2001, Abanades et al., 2002). Solid supports impregnated with amines have also been suggested, (Contarini et al., 2002). The sorbents can be used both in a pre combustion approach, by absorbing the CO2 from a shifted fuel gas, and in a post-combustion approach to remove the CO2 from the flue gas. For carbonate based sorbents, the reaction is favoured at low absorption temperatures (50-60°C) and is then regenerated by raising the temperature to about 150°C. Temperatures of about 30-100°C are used to regenerate amine impregnated solids. Reactor systems that have been suggested for this type of process include fixed bed reactors, moving bed reactors and fluidised bed reactors. A Ljungström-like wheel construction has also been proposed by ALSTOM Power KK in Japan, using the sorbent based on Li4SiO4 developed by Toshiba, (Shimoura, 2003). The sorbent is loaded on a rotating wheel which is then placed in the flue gas path. As the wheel enters the regeneration side it is flushed with a heated CO2 stream so that the absorbed CO2 is released (Figure 2-15).
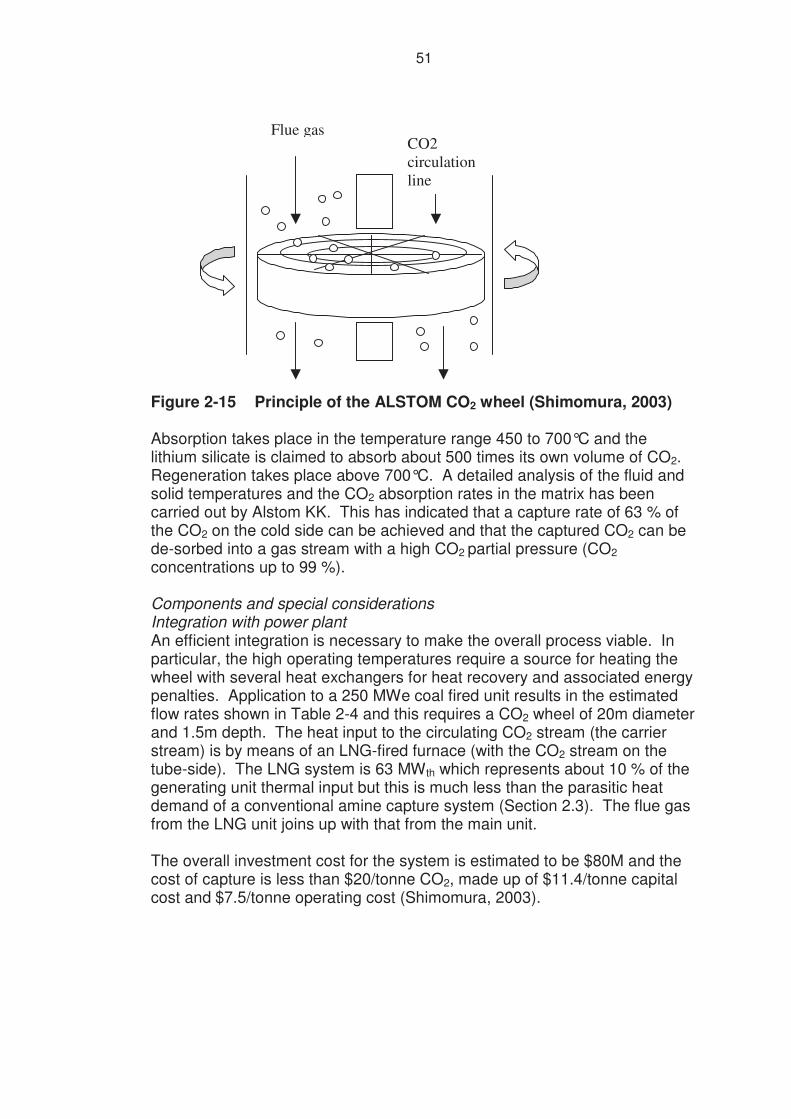
51
Figure 2-15 Principle of the ALSTOM CO2 wheel (Shimomura, 2003) Absorption takes place in the temperature range 450 to 700°C and the lithium silicate is claimed to absorb about 500 times its own volume of CO2. Regeneration takes place above 700°C. A detailed analysis of the fluid and solid temperatures and the CO2 absorption rates in the matrix has been carried out by Alstom KK. This has indicated that a capture rate of 63 % of the CO2 on the cold side can be achieved and that the captured CO2 can be de-sorbed into a gas stream with a high CO2 partial pressure (CO2 concentrations up to 99 %). Components and special considerations Integration with power plant An efficient integration is necessary to make the overall process viable. In particular, the high operating temperatures require a source for heating the wheel with several heat exchangers for heat recovery and associated energy penalties. Application to a 250 MWe coal fired unit results in the estimated flow rates shown in Table 2-4 and this requires a CO2 wheel of 20m diameter and 1.5m depth. The heat input to the circulating CO2 stream (the carrier stream) is by means of an LNG-fired furnace (with the CO2 stream on the tube-side). The LNG system is 63 MWth which represents about 10 % of the generating unit thermal input but this is much less than the parasitic heat demand of a conventional amine capture system (Section 2.3). The flue gas from the LNG unit joins up with that from the main unit. The overall investment cost for the system is estimated to be $80M and the cost of capture is less than $20/tonne CO2, made up of $11.4/tonne capital cost and $7.5/tonne operating cost (Shimomura, 2003).
Flue gas CO2 circulation line
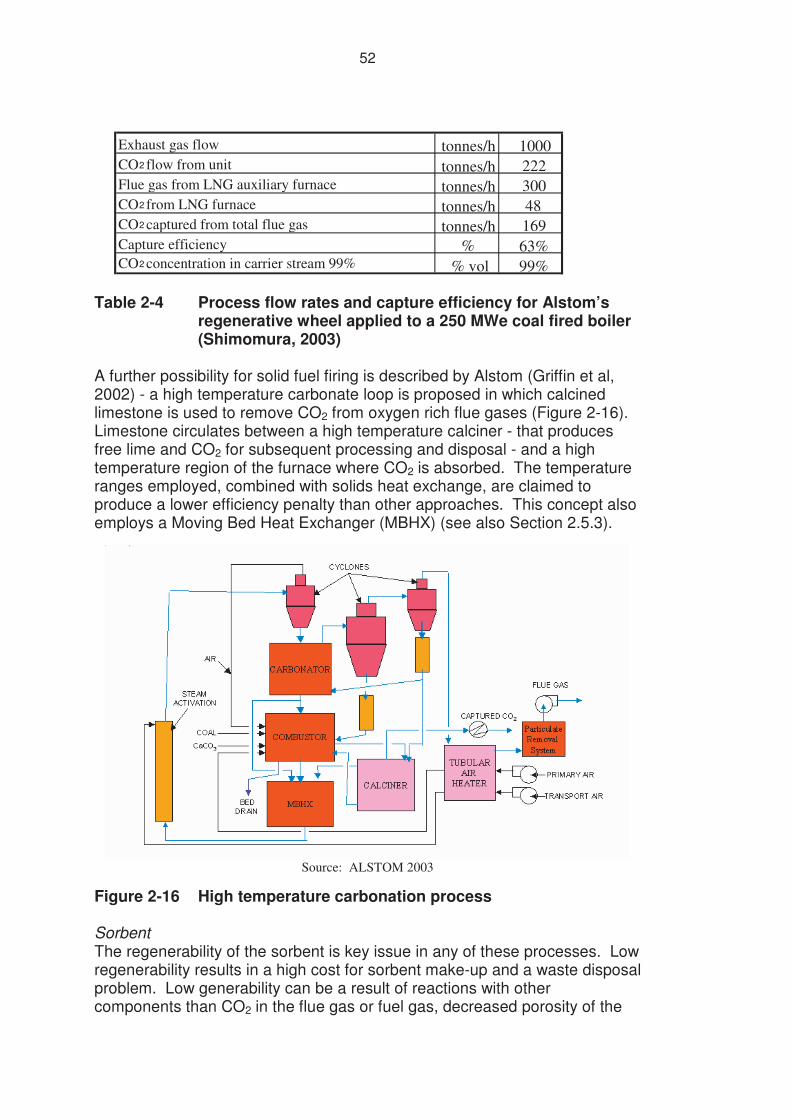
52
Table 2-4 Process flow rates and capture efficiency for Alstom’s
regenerative wheel applied to a 250 MWe coal fired boiler (Shimomura, 2003)
A further possibility for solid fuel firing is described by Alstom (Griffin et al, 2002) - a high temperature carbonate loop is proposed in which calcined limestone is used to remove CO2 from oxygen rich flue gases (Figure 2-16). Limestone circulates between a high temperature calciner - that produces free lime and CO2 for subsequent processing and disposal - and a high temperature region of the furnace where CO2 is absorbed. The temperature ranges employed, combined with solids heat exchange, are claimed to produce a lower efficiency penalty than other approaches. This concept also employs a Moving Bed Heat Exchanger (MBHX) (see also Section 2.5.3).
Source: ALSTOM 2003
Figure 2-16 High temperature carbonation process Sorbent The regenerability of the sorbent is key issue in any of these processes. Low regenerability results in a high cost for sorbent make-up and a waste disposal problem. Low generability can be a result of reactions with other components than CO2 in the flue gas or fuel gas, decreased porosity of the
Exhaust gas flow tonnes/h 1000 CO 2 flow from unit tonnes/h 222 Flue gas from LNG auxiliary furnace tonnes/h 300 CO 2 from LNG furnace tonnes/h 48 CO 2 captured from total flue gas tonnes/h 169 Capture efficiency % 63% CO 2 concentration in carrier stream 99% % vol 99%
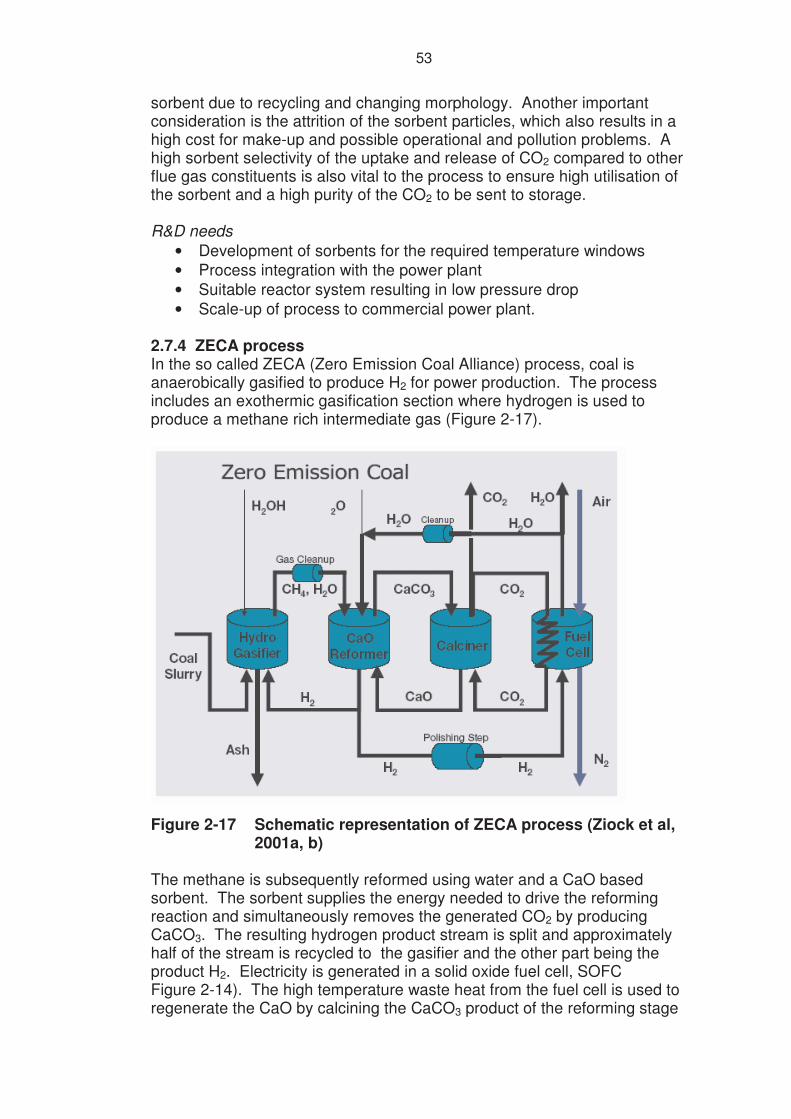
53
sorbent due to recycling and changing morphology. Another important consideration is the attrition of the sorbent particles, which also results in a high cost for make-up and possible operational and pollution problems. A high sorbent selectivity of the uptake and release of CO2 compared to other flue gas constituents is also vital to the process to ensure high utilisation of the sorbent and a high purity of the CO2 to be sent to storage. R&D needs
• Development of sorbents for the required temperature windows • Process integration with the power plant • Suitable reactor system resulting in low pressure drop • Scale-up of process to commercial power plant.
2.7.4 ZECA process In the so called ZECA (Zero Emission Coal Alliance) process, coal is anaerobically gasified to produce H2 for power production. The process includes an exothermic gasification section where hydrogen is used to produce a methane rich intermediate gas (Figure 2-17).
Figure 2-17 Schematic representation of ZECA process (Ziock et al, 2001a, b)
The methane is subsequently reformed using water and a CaO based sorbent. The sorbent supplies the energy needed to drive the reforming reaction and simultaneously removes the generated CO2 by producing CaCO3. The resulting hydrogen product stream is split and approximately half of the stream is recycled to the gasifier and the other part being the product H2. Electricity is generated in a solid oxide fuel cell, SOFC Figure 2-14). The high temperature waste heat from the fuel cell is used to regenerate the CaO by calcining the CaCO3 product of the reforming stage
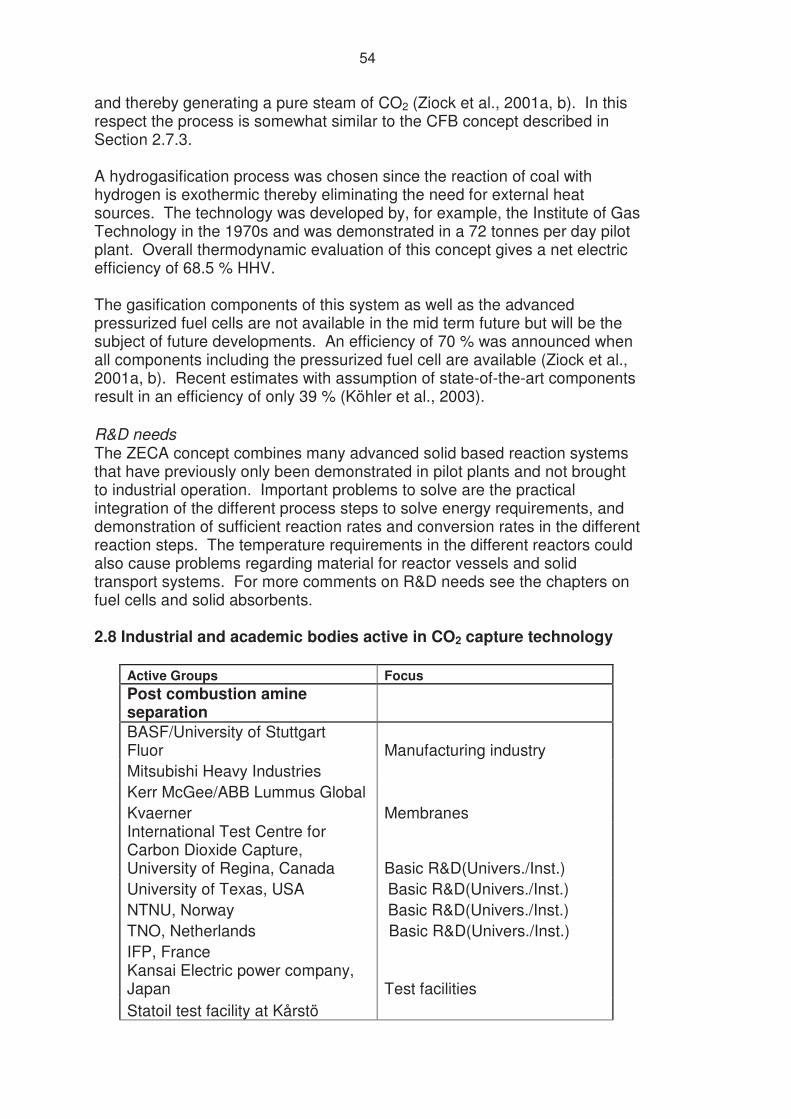
54
and thereby generating a pure steam of CO2 (Ziock et al., 2001a, b). In this respect the process is somewhat similar to the CFB concept described in Section 2.7.3. A hydrogasification process was chosen since the reaction of coal with hydrogen is exothermic thereby eliminating the need for external heat sources. The technology was developed by, for example, the Institute of Gas Technology in the 1970s and was demonstrated in a 72 tonnes per day pilot plant. Overall thermodynamic evaluation of this concept gives a net electric efficiency of 68.5 % HHV. The gasification components of this system as well as the advanced pressurized fuel cells are not available in the mid term future but will be the subject of future developments. An efficiency of 70 % was announced when all components including the pressurized fuel cell are available (Ziock et al., 2001a, b). Recent estimates with assumption of state-of-the-art components result in an efficiency of only 39 % (Köhler et al., 2003). R&D needs The ZECA concept combines many advanced solid based reaction systems that have previously only been demonstrated in pilot plants and not brought to industrial operation. Important problems to solve are the practical integration of the different process steps to solve energy requirements, and demonstration of sufficient reaction rates and conversion rates in the different reaction steps. The temperature requirements in the different reactors could also cause problems regarding material for reactor vessels and solid transport systems. For more comments on R&D needs see the chapters on fuel cells and solid absorbents. 2.8 Industrial and academic bodies active in CO2 capture technology Active Groups Focus
Post combustion amine separation
BASF/University of Stuttgart Fluor Manufacturing industry
Mitsubishi Heavy Industries
Kerr McGee/ABB Lummus Global
Kvaerner Membranes
International Test Centre for Carbon Dioxide Capture, University of Regina, Canada Basic R&D(Univers./Inst.)
University of Texas, USA Basic R&D(Univers./Inst.)
NTNU, Norway Basic R&D(Univers./Inst.)
TNO, Netherlands Basic R&D(Univers./Inst.)
IFP, France
Kansai Electric power company, Japan Test facilities
Statoil test facility at Kårstö
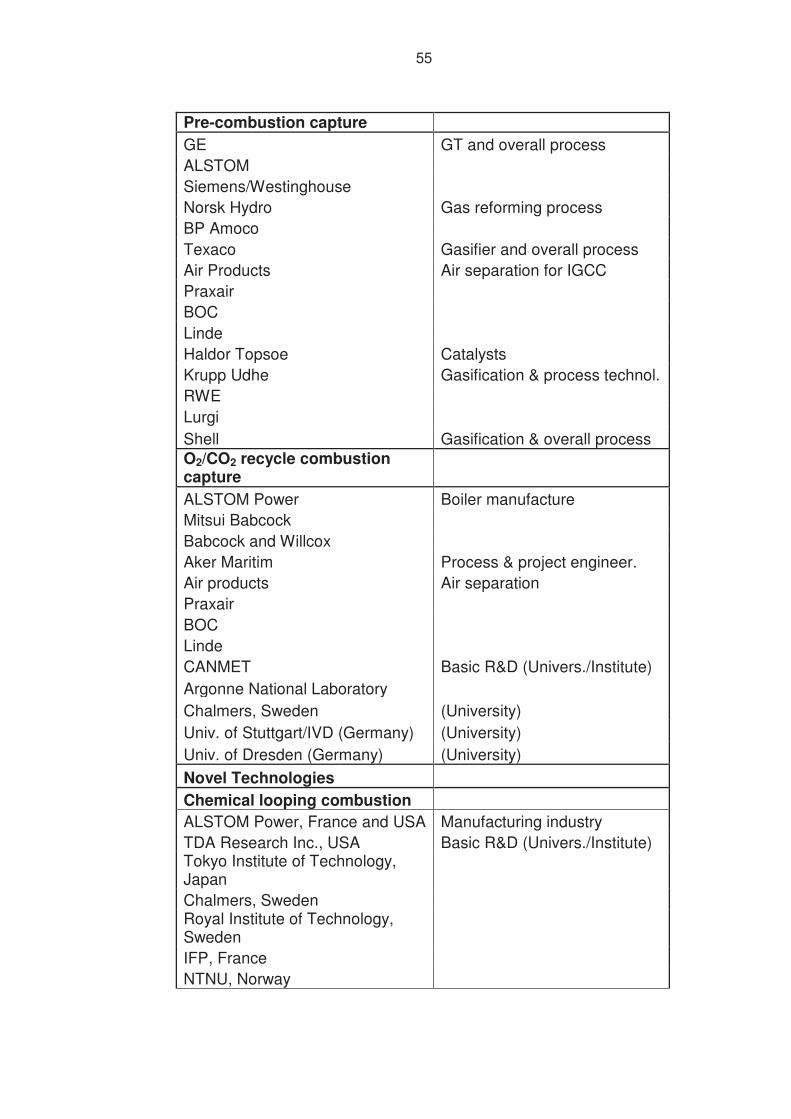
55
Pre-combustion capture
GE GT and overall process
ALSTOM
Siemens/Westinghouse
Norsk Hydro Gas reforming process
BP Amoco
Texaco Gasifier and overall process
Air Products Air separation for IGCC
Praxair
BOC
Linde
Haldor Topsoe Catalysts
Krupp Udhe Gasification & process technol.
RWE
Lurgi
Shell Gasification & overall process
O2/CO2 recycle combustion capture
ALSTOM Power Boiler manufacture
Mitsui Babcock
Babcock and Willcox
Aker Maritim Process & project engineer.
Air products Air separation
Praxair
BOC
Linde
CANMET Basic R&D (Univers./Institute)
Argonne National Laboratory
Chalmers, Sweden (University)
Univ. of Stuttgart/IVD (Germany) (University)
Univ. of Dresden (Germany) (University)
Novel Technologies
Chemical looping combustion
ALSTOM Power, France and USA Manufacturing industry
TDA Research Inc., USA Basic R&D (Univers./Institute)
Tokyo Institute of Technology, Japan
Chalmers, Sweden
Royal Institute of Technology, Sweden
IFP, France
NTNU, Norway
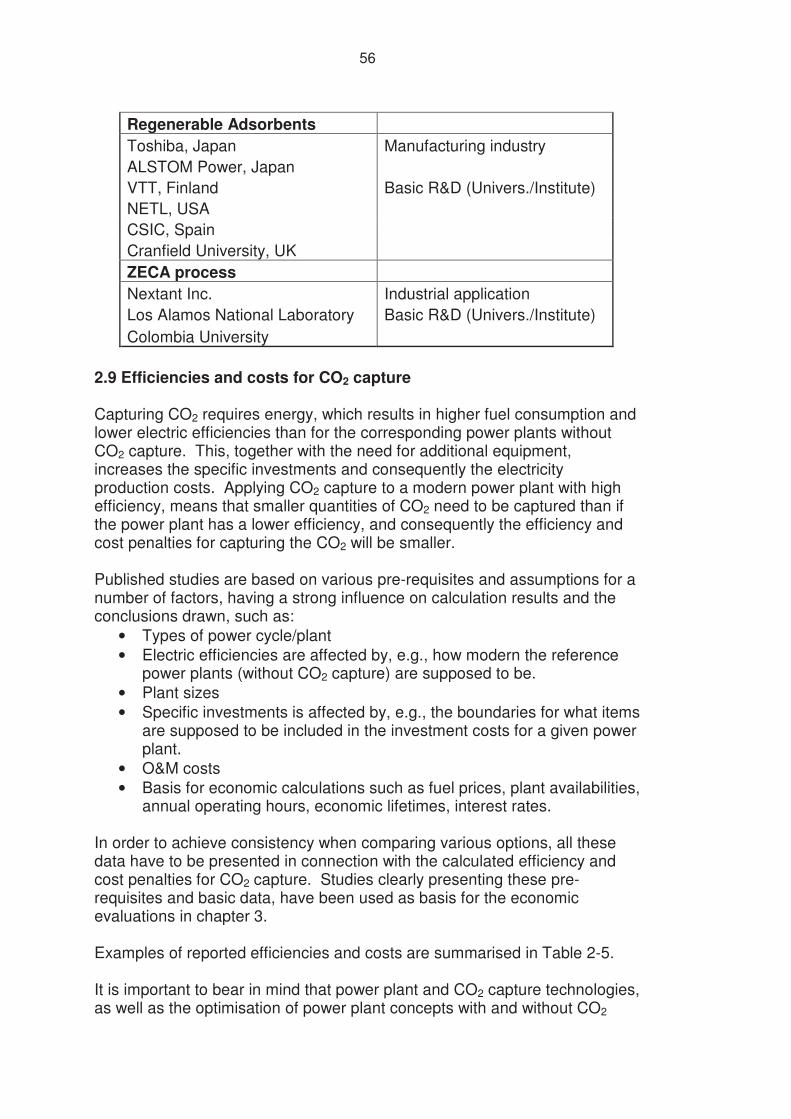
56
Regenerable Adsorbents
Toshiba, Japan Manufacturing industry
ALSTOM Power, Japan
VTT, Finland Basic R&D (Univers./Institute)
NETL, USA
CSIC, Spain
Cranfield University, UK
ZECA process
Nextant Inc. Industrial application
Los Alamos National Laboratory Basic R&D (Univers./Institute)
Colombia University
2.9 Efficiencies and costs for CO2 capture Capturing CO2 requires energy, which results in higher fuel consumption and lower electric efficiencies than for the corresponding power plants without CO2 capture. This, together with the need for additional equipment, increases the specific investments and consequently the electricity production costs. Applying CO2 capture to a modern power plant with high efficiency, means that smaller quantities of CO2 need to be captured than if the power plant has a lower efficiency, and consequently the efficiency and cost penalties for capturing the CO2 will be smaller. Published studies are based on various pre-requisites and assumptions for a number of factors, having a strong influence on calculation results and the conclusions drawn, such as:
• Types of power cycle/plant • Electric efficiencies are affected by, e.g., how modern the reference
power plants (without CO2 capture) are supposed to be. • Plant sizes • Specific investments is affected by, e.g., the boundaries for what items
are supposed to be included in the investment costs for a given power plant.
• O&M costs • Basis for economic calculations such as fuel prices, plant availabilities,
annual operating hours, economic lifetimes, interest rates. In order to achieve consistency when comparing various options, all these data have to be presented in connection with the calculated efficiency and cost penalties for CO2 capture. Studies clearly presenting these pre-requisites and basic data, have been used as basis for the economic evaluations in chapter 3. Examples of reported efficiencies and costs are summarised in Table 2-5. It is important to bear in mind that power plant and CO2 capture technologies, as well as the optimisation of power plant concepts with and without CO2

57
capture, are developing continuously. Supercritical PF, IGCC and NGCC are all moving towards higher electric efficiencies and lower specific investment. As an example, a currently available coal fired plant costs less than 1000 EUR/kWel,, and has an electrical efficiency of 48 %. This, in turn, means that smaller amounts of CO2 will have to be captured, than if capture technologies are applied to power plants that are already built and in operation. Together with more developed and optimised capture technologies, this means that efficiency and cost penalties for CO2 capture will be lower for future plants. At present, the only comprehensive engineering study in which this has been evaluated, has been performed for coal fired IGCCs with pre-combustion capture based on state of the art 2003 and a projection towards a future technology level year 2020 (IEAGHG, 2003). IEAGHG are now working on similar engineering studies for post-combustion capture and O2/CO2 recycle combustion. When such projections exist for the major technology options, it will be more relevant to evaluate potential efficiencies and investment costs based on application in such future plants, than based on application in today´s plants.

Cap
ture
met
hod
Fuel
P
ower
pla
nt t
ype
Sou
rce
Pla
nt s
ize,
MW
el
Net
ele
ctri
c ef
ficie
ncy,
%
Ele
ctri
city
cos
t, E
UR
/kW
h
(Spe
cific
inve
stm
ent,
EU
R/k
Wel
)
CO
2 em
issi
on
avoi
danc
e co
st,
EU
R/to
nne
CO
21
Ori
gina
l W
ith C
O2
Cap
ture
O
rigi
nal
With
CO
2 C
aptu
re
Ori
gina
l W
ith C
O2
Cap
ture
Coa
l S
uper
criti
cal P
F IE
AG
HG
200
02 50
0 36
2 46
33
3.
7
(102
0)
6.4
(186
0)
47
NG
CC
, F-t
urbi
ne
IEA
GH
G 2
0002
790
663
56
47
2.2
(410
)
3.2
(790
)
32
Pos
t com
bust
ion
capt
ure
Che
mic
al a
bsor
ptio
n M
EA
Nat
ural
gas
S
INT
EF
200
23 40
0 33
8 58
49
2.
2
(625
)
3.8
(151
5)
52
IGC
C, F
-tur
bine
IE
AG
HG
200
02 40
8 38
2 46
38
4.
8
(147
0)
6.9
(220
0)
37
IGC
C, F
-tur
bine
IE
AG
HG
200
32 77
6 67
6 43
34
4.
8
(137
0)
6.3
(186
0)
24
Coa
l
IGC
C, H
-turb
ine
Tim
efra
me
2020
IEA
GH
G 2
0032
879
776
49
43
4.0
(113
0)
4.5
(125
0)
9
NG
CC
, F-t
urbi
ne
IEA
GH
G 2
0002
790
820
56
48
2.2
(410
)
3.4
(910
)
39
Pre
com
bust
ion
capt
ure
Phy
sica
l abs
orpt
ion
Nat
ural
gas
S
INT
EF
200
23 40
0 39
2 58
46
2.
2
(625
)
3.7
(143
0)
48
Coa
l
(Lig
nite
)
Sup
ercr
itica
l PF
And
erss
on,
Mak
sine
n, 2
002
865
697
43
34
(127
0)
(157
0)
(No
S-r
emov
al)
O
2/C
O2
recy
cle
(oxy
fuel
) co
mbu
stio
n
Nat
ural
gas
N
GC
C
SIN
TE
F 2
0023
400
400
58
48
2.2
(625
)
3.5
(144
0)
36
Tabl
e 2-
5 E
xam
ples
of r
epor
ted
effic
ienc
ies
and
cost
s fo
r po
wer
pla
nts
with
CO
2 ca
ptur
e
1 A
void
ed C
O2-
emis
sion
s =
(CO
2 pe
r MW
h, o
rigin
al) –
(CO
2 pe
r MW
h, w
ith C
O2
capt
ure)
2 C
osts
in U
SD
., co
nver
ted
acco
rdin
g to
1E
UR
= 1
US
D
3 Cos
ts in
NO
K, c
onve
rted
acco
rdin
g to
1 E
UR
= 8
NO
K
58
59
2.10 Conclusions
Numerous concepts for CO2 capture from power processes have been proposed. These concepts are in various stages of development and are therefore associated with a range of time frames for possible commercial application in power plants. Many of these concepts also require a considerable research and development effort prior to commercialization. Three major approaches have been identified, based mainly on existing technologies and with the best prospects in relation to remaining development effort. These options can be demonstrated at the large scale within the near future, say, within ten years, and can be adopted for both coal and natural gas fired power plants:
- Post-combustion capture. The CO2 is separated from the power plant flue gas. Chemical absorption in MEA (monoethanolamine) is mainly considered. This is widely used in other industrial applications at a smaller scale than that required for large power plants. This technique can be used either as a retrofit or a new plant option.
- Pre-combustion capture. The carbon, which will later form CO2, is captured prior to combustion of the fuel. The fuel is converted to a hydrogen rich gas, from which the CO2 is removed by physical absorption prior to combustion of the remaining hydrogen in a gas turbine (which will require some development of existing gas turbines). The original fuel can be either natural gas (reformed) or coal (gasified). The IGCC concept has been demonstrated for coal at full scale but is not considered to be commercially proven. All of the other required process steps are in established use within the chemical industry.
- O2/CO2 recycle (oxyfuel) combustion. The fuel is combusted in an atmosphere of oxygen and recycled CO2, instead of air. This results in a flue gas consisting mainly of CO2 and water vapour. Cleaning of the flue gases – removing the conventional pollutants and condensing the water vapor – produces an almost pure CO2 stream. Combustion in oxygen is a wide spread technology in the steel and glass manufacturing industry. Cryogenic air separation for production of oxygen is also commercially well established in numerous applications, although at a somewhat smaller scale than required for the largest power plants. Steam boilers would require slight modification whereas natural gas fired gas turbines and their heat recovery systems would have to be redesigned for combustion with oxygen and recycled CO2.
In addition to this a number of novel, emerging processes have been discussed. Some of these are very futuristic but others could be classed as second-generation technologies, i.e., the basic principles are well understood but a considerable development effort is needed for scale up and commercialization. Examples are Chemical Looping Combustion (solid oxidant), some membrane technologies and, perhaps, the AZEP process.
60
To capture CO2 always requires energy which results in a higher fuel consumption and consequently a lower electric efficiency than the baseline case without CO2 capture. This, together with the need for additional equipment, increases the specific investment. The combination of these two factors increases the electricity generation costs. Numerous studies of the three capture principles above have been made with regard to calculating the cost of electricity and the corresponding avoidance cost of CO2. Applying CO2 capture to a modern, high efficiency power plant reduces the quantities of CO2 needing to be captured when compared with low efficiency plant. Consequently, the efficiency and cost penalties for capturing CO2 will be smaller for the high efficiency plant. On the other hand, coal, which produces higher amounts of CO2 , will give a lower cost per tonne of CO2 avoided if other costs are equal. Since a substantial part of the cost stems from the energy consumption in the capture process, capture cost is also dependant upon the fuel cost. A cheaper fuel gives a lower capture cost. In addition, a lower energy loss gives a lower specific investment cost. This is simply due to the fact that the same plant, with the same absolute construction costs, will have fewer kWh of electricity production to defray the costs if energy consumption is higher. These points cause confusion when comparing different technology options. Basically there are two factors governing the cost relationships:
- The efficiency of fuel to electricity conversion - The extra investment needed to capture the CO2.
Based on these two factors, the generating costs and thus the capture and avoidance costs can be calculated for a given plant. This process has been followed in Chapter 3 where comparisons are made and discussed. Whilst this is an area of ongoing development, Chapter 3 gives a basic calculation method that can be adopted for the analysis of any new capture process as and when baseline data become available. Another factor that often clouds the debate is whether or not the cost and performance data are based on - technology already built and in operation, - a plant which can be bought today (and ready for production in, say, five
years time), - or if data are given for an advanced technology plant, with assumed
performance characteristics, that might be developed at some future point. This is not always clear and, since the technology is new, development is rapid. Integration possibilities and scale-up aspects need to be further examined for most of the concepts, in order to identify optimal process configurations, the most promising technology choices and in order to increase the accuracy of cost estimations. The plant components used in the analysis are often components used in existing systems for other purposes. Again, since the
61
technology is new, a substantial development of existing technology can also be expected. In conclusion this chapter describes the most promising near term technology solutions but also considers “second generation” technologies. Current knowledge concerning investment costs, increases in operational costs and reductions in generating efficiency are also considered. This information is used later (Chapter 3) to determine CO2 avoidance costs and generating costs for electricity production. 2.11 References Abanades, C., Oaky, J., Alvarez, D., Hämäläinen: ”Novel Combustion Cycles Incorporating Capture of CO2 with CaO”, 6. IEA Greenhouse Gas Technology Conference, Kyoto, 2002. ALSTOM Power: “Greenhouse Gas Emissions Control by Oxygen Firing in Circulating Fluidized Bed Boilers. Phase I A Preliminary Systems Evaluation”, Final Report Volume 1, 2003. Andersson, K., Maksinen, P.: "Process Evaluation of CO2 Free Combustion in an O2/CO2 Power Plant", Master of Science thesis T2002-258, Department of Energy Conversion, Chalmers University of Technology, Göteborg, 2002. Angelino, G.: "Carbon Dioxide Condensation Cycle for Power Production", Combustion 40 (Sept. 1968), No. 3, pp. 31-40 or ASME 68-GT-23 (1969). Bammert, K., Mukherjee, S. K.: "Gasturbinenanlagen für Kernkraftwerke mit CO2 als Arbeitsmittel", VDI Fortschrittberichte Reihe 6, Nr. 40. VDI Verlag, Düsseldorf, 1975. Baumann, H-R., Ullrich, N., Haupt, G., Zimmermann, G., Pruschek, R., Oeljeklaus, G.: “IGCC – A Progressive and Profitable Power Plant Technology“, Power-Generation Europe ´98, Milan, 1998. Baumann, H.-R. ,Ullrich, N., Haupt, G., Zimmermann, G., Pruschek, R., Oeljeklaus, G.: “Development of the Cost-effective IGCC Power Plant”, PowerGen Europe, 1998. Bolland, O., et.al.: ”Gaskraftverk med CO2-håndtagning. Studie av alternative teknologier”, SINTEF Energiforskning AS, Report nr. TR A5693, Trondheim, Norway, 2002. ISBN Nr: 82-594-2358-8 (In Norwegian). Chapel, D., Ernest, J., Mariz, C.: ”Recovery of CO2 from Flue Gases”, First National Conference on Carbon Sequestration, Washington, DC, May 14-17, 2001. Contarini, S., Barbini, M., Del Piero, G., Gambarotta, G., Mazzamurro, G., Riocci, M., Zappelli, P.:”Solid Sorbents for the Reversible Capture of Carbon Dioxide”, 6. IEA Greenhouse Gas Technology Conference, Kyoto, 2002.
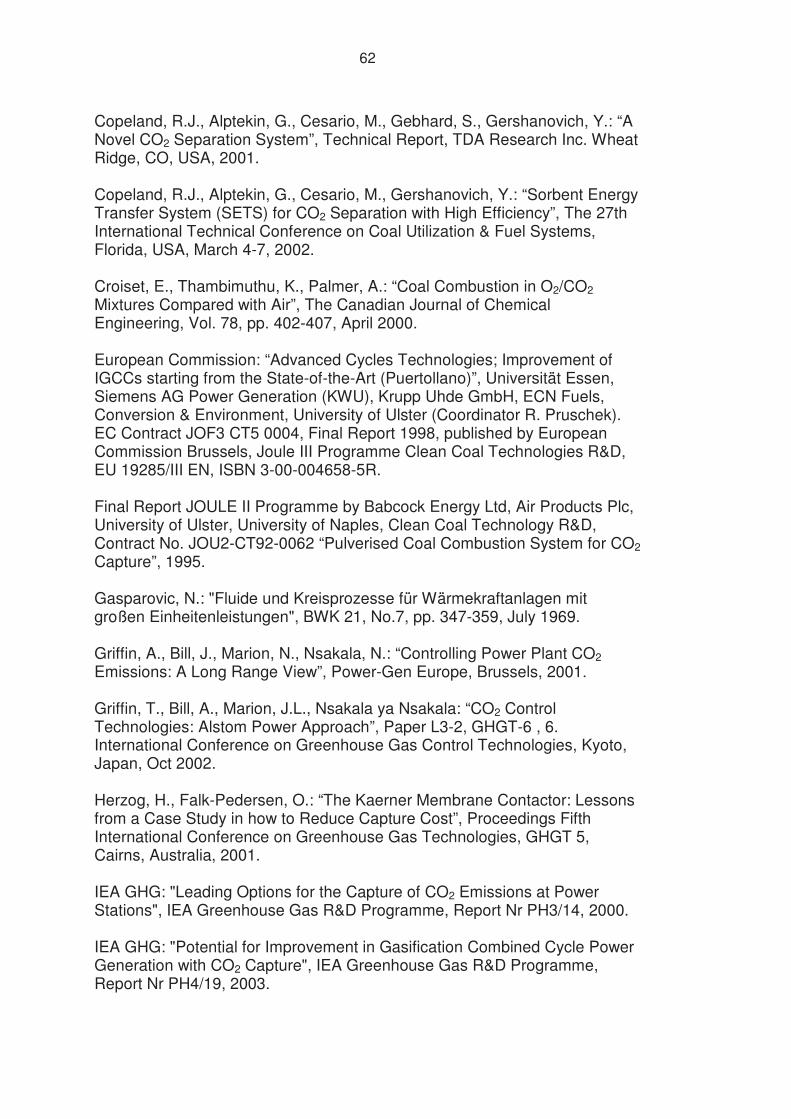
62
Copeland, R.J., Alptekin, G., Cesario, M., Gebhard, S., Gershanovich, Y.: “A Novel CO2 Separation System”, Technical Report, TDA Research Inc. Wheat Ridge, CO, USA, 2001. Copeland, R.J., Alptekin, G., Cesario, M., Gershanovich, Y.: “Sorbent Energy Transfer System (SETS) for CO2 Separation with High Efficiency”, The 27th International Technical Conference on Coal Utilization & Fuel Systems, Florida, USA, March 4-7, 2002. Croiset, E., Thambimuthu, K., Palmer, A.: “Coal Combustion in O2/CO2 Mixtures Compared with Air”, The Canadian Journal of Chemical Engineering, Vol. 78, pp. 402-407, April 2000. European Commission: “Advanced Cycles Technologies; Improvement of IGCCs starting from the State-of-the-Art (Puertollano)”, Universität Essen, Siemens AG Power Generation (KWU), Krupp Uhde GmbH, ECN Fuels, Conversion & Environment, University of Ulster (Coordinator R. Pruschek). EC Contract JOF3 CT5 0004, Final Report 1998, published by European Commission Brussels, Joule III Programme Clean Coal Technologies R&D, EU 19285/III EN, ISBN 3-00-004658-5R. Final Report JOULE II Programme by Babcock Energy Ltd, Air Products Plc, University of Ulster, University of Naples, Clean Coal Technology R&D, Contract No. JOU2-CT92-0062 “Pulverised Coal Combustion System for CO2 Capture”, 1995. Gasparovic, N.: "Fluide und Kreisprozesse für Wärmekraftanlagen mit großen Einheitenleistungen", BWK 21, No.7, pp. 347-359, July 1969. Griffin, A., Bill, J., Marion, N., Nsakala, N.: “Controlling Power Plant CO2 Emissions: A Long Range View”, Power-Gen Europe, Brussels, 2001. Griffin, T., Bill, A., Marion, J.L., Nsakala ya Nsakala: “CO2 Control Technologies: Alstom Power Approach”, Paper L3-2, GHGT-6 , 6. International Conference on Greenhouse Gas Control Technologies, Kyoto, Japan, Oct 2002. Herzog, H., Falk-Pedersen, O.: “The Kaerner Membrane Contactor: Lessons from a Case Study in how to Reduce Capture Cost”, Proceedings Fifth International Conference on Greenhouse Gas Technologies, GHGT 5, Cairns, Australia, 2001. IEA GHG: "Leading Options for the Capture of CO2 Emissions at Power Stations", IEA Greenhouse Gas R&D Programme, Report Nr PH3/14, 2000. IEA GHG: "Potential for Improvement in Gasification Combined Cycle Power Generation with CO2 Capture", IEA Greenhouse Gas R&D Programme, Report Nr PH4/19, 2003.
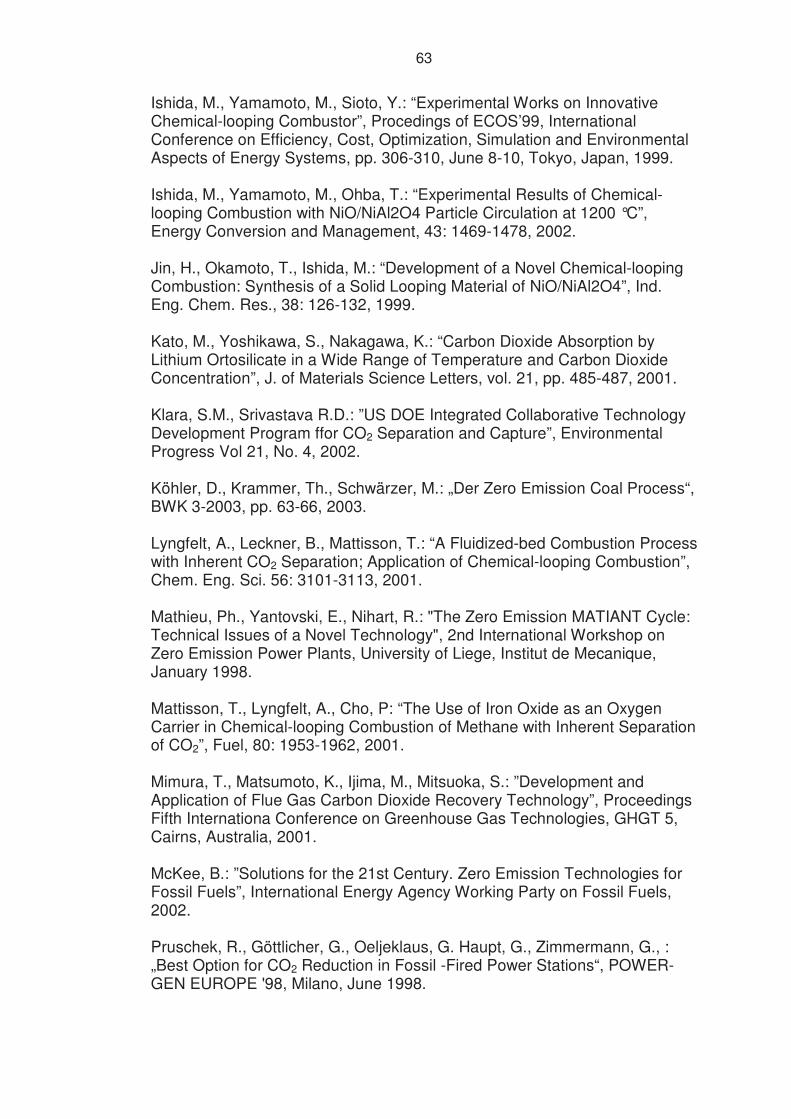
63
Ishida, M., Yamamoto, M., Sioto, Y.: “Experimental Works on Innovative Chemical-looping Combustor”, Procedings of ECOS’99, International Conference on Efficiency, Cost, Optimization, Simulation and Environmental Aspects of Energy Systems, pp. 306-310, June 8-10, Tokyo, Japan, 1999. Ishida, M., Yamamoto, M., Ohba, T.: “Experimental Results of Chemical-looping Combustion with NiO/NiAl2O4 Particle Circulation at 1200 °C”, Energy Conversion and Management, 43: 1469-1478, 2002. Jin, H., Okamoto, T., Ishida, M.: “Development of a Novel Chemical-looping Combustion: Synthesis of a Solid Looping Material of NiO/NiAl2O4”, Ind. Eng. Chem. Res., 38: 126-132, 1999. Kato, M., Yoshikawa, S., Nakagawa, K.: “Carbon Dioxide Absorption by Lithium Ortosilicate in a Wide Range of Temperature and Carbon Dioxide Concentration”, J. of Materials Science Letters, vol. 21, pp. 485-487, 2001. Klara, S.M., Srivastava R.D.: ”US DOE Integrated Collaborative Technology Development Program ffor CO2 Separation and Capture”, Environmental Progress Vol 21, No. 4, 2002. Köhler, D., Krammer, Th., Schwärzer, M.: „Der Zero Emission Coal Process“, BWK 3-2003, pp. 63-66, 2003. Lyngfelt, A., Leckner, B., Mattisson, T.: “A Fluidized-bed Combustion Process with Inherent CO2 Separation; Application of Chemical-looping Combustion”, Chem. Eng. Sci. 56: 3101-3113, 2001. Mathieu, Ph., Yantovski, E., Nihart, R.: "The Zero Emission MATIANT Cycle: Technical Issues of a Novel Technology", 2nd International Workshop on Zero Emission Power Plants, University of Liege, Institut de Mecanique, January 1998. Mattisson, T., Lyngfelt, A., Cho, P: “The Use of Iron Oxide as an Oxygen Carrier in Chemical-looping Combustion of Methane with Inherent Separation of CO2”, Fuel, 80: 1953-1962, 2001. Mimura, T., Matsumoto, K., Ijima, M., Mitsuoka, S.: ”Development and Application of Flue Gas Carbon Dioxide Recovery Technology”, Proceedings Fifth Internationa Conference on Greenhouse Gas Technologies, GHGT 5, Cairns, Australia, 2001. McKee, B.: ”Solutions for the 21st Century. Zero Emission Technologies for Fossil Fuels”, International Energy Agency Working Party on Fossil Fuels, 2002. Pruschek, R., Göttlicher, G., Oeljeklaus, G. Haupt, G., Zimmermann, G., : „Best Option for CO2 Reduction in Fossil -Fired Power Stations“, POWER-GEN EUROPE '98, Milano, June 1998.
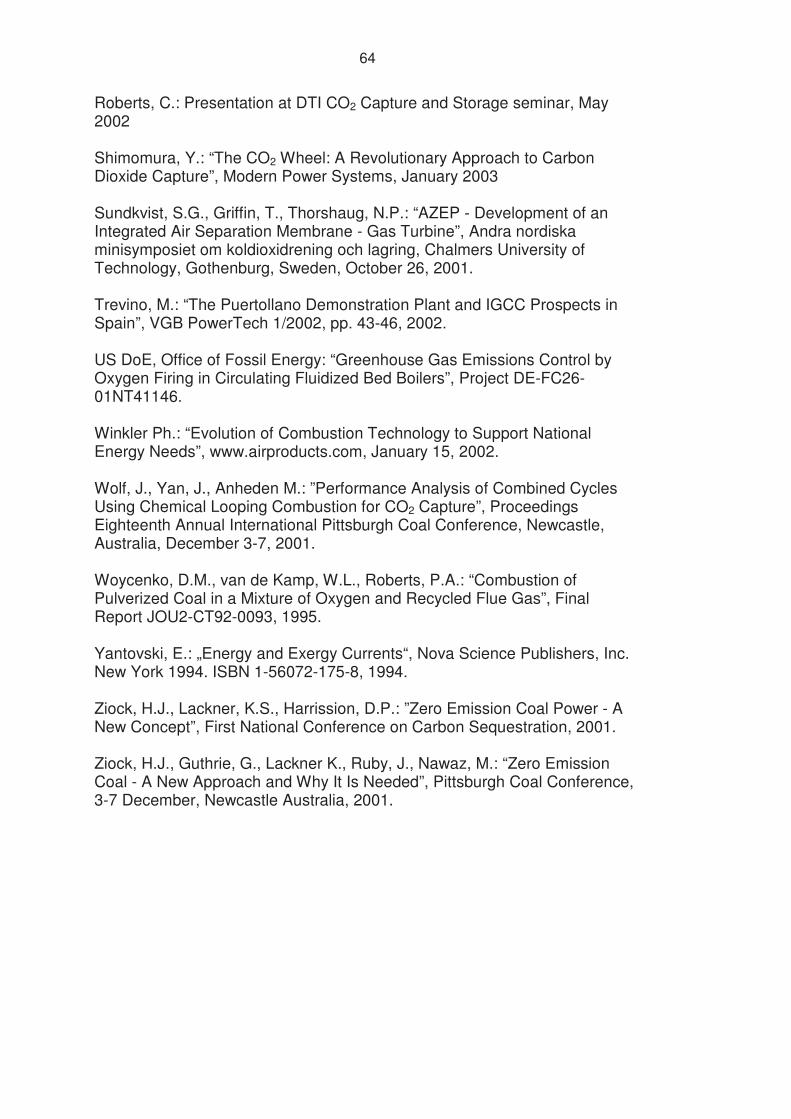
64
Roberts, C.: Presentation at DTI CO2 Capture and Storage seminar, May 2002 Shimomura, Y.: “The CO2 Wheel: A Revolutionary Approach to Carbon Dioxide Capture”, Modern Power Systems, January 2003 Sundkvist, S.G., Griffin, T., Thorshaug, N.P.: “AZEP - Development of an Integrated Air Separation Membrane - Gas Turbine”, Andra nordiska minisymposiet om koldioxidrening och lagring, Chalmers University of Technology, Gothenburg, Sweden, October 26, 2001. Trevino, M.: “The Puertollano Demonstration Plant and IGCC Prospects in Spain”, VGB PowerTech 1/2002, pp. 43-46, 2002. US DoE, Office of Fossil Energy: “Greenhouse Gas Emissions Control by Oxygen Firing in Circulating Fluidized Bed Boilers”, Project DE-FC26-01NT41146. Winkler Ph.: “Evolution of Combustion Technology to Support National Energy Needs”, www.airproducts.com, January 15, 2002. Wolf, J., Yan, J., Anheden M.: ”Performance Analysis of Combined Cycles Using Chemical Looping Combustion for CO2 Capture”, Proceedings Eighteenth Annual International Pittsburgh Coal Conference, Newcastle, Australia, December 3-7, 2001. Woycenko, D.M., van de Kamp, W.L., Roberts, P.A.: “Combustion of Pulverized Coal in a Mixture of Oxygen and Recycled Flue Gas”, Final Report JOU2-CT92-0093, 1995. Yantovski, E.: „Energy and Exergy Currents“, Nova Science Publishers, Inc. New York 1994. ISBN 1-56072-175-8, 1994. Ziock, H.J., Lackner, K.S., Harrission, D.P.: ”Zero Emission Coal Power - A New Concept”, First National Conference on Carbon Sequestration, 2001. Ziock, H.J., Guthrie, G., Lackner K., Ruby, J., Nawaz, M.: “Zero Emission Coal - A New Approach and Why It Is Needed”, Pittsburgh Coal Conference, 3-7 December, Newcastle Australia, 2001.
65
3 COSTS ANALYSIS OF SELECTED CAPTURE OPTIONS 3.1 Introduction Various sources have reported costs for the different techniques proposed for reducing CO2 emissions. As these costs are based on calculations using different assumptions about fuel costs, interest rates etc. it is impossible to meaningfully compare the results. In the following sections, an attempt has been made to compare the costs of the different CO2 capture techniques by taking the basic data from the various sources describing the technologies and applying a consistent set of assumptions when recalculating the overall costs. This method clearly introduces a number of miscalculation risks and care should therefore be taken in applying the results. For the sake of a clear comparison of capture technologies the costs of CO2 transport and CO2 storage are not included in the following calculations. The CO2 capture process is generally by far the most expensive step compared to transport and storage. Firstly, an overview of the cases considered and the applied CO2 emission removal techniques is given alongside the process efficiencies which are divided into coal-fired and natural gas-fired cases (sections 3.2 and 3.3). A comparison of the recalculated costs is then given in section 3.4. 3.2 Coal fired power plants Table 3-1 to 3-3 show efficiencies, investment and cost data for the main capture concepts that may be implemented in the near future when con-structing new coal-fired power plants, assuming use of existing technology. The post-combustion concept is illustrated assuming a supercritical plant fired with pulverised hard coal (PF) as its base case and the resulting efficiencies and cost data when it is fitted with a post combustion absorption system with MEA (monoethanol amine) (IEA GHG, 2000). Supercritical PF is commercially well established for power production at the commercial scale. Efficiencies and cost data correspond to the state of the art. For CO2 absorp-tion with MEA, efficiencies and cost data are calculated and estimated based on its wide use in other industrial applications, albeit at a much smaller scale. However, it is worth noting that the IEA GHG report (PH3/14) is based on an energy requirement of 5 GJ/tonne of CO2, but development of new solvents and improvement of the process has decreased the specific energy consumption considerably. The state-of the art absorption process has a specific energy consuption of 3.2 GJ/tonne CO2 (Roberts, 2002), which means that the operation costs will be much lower than the number used in the IEA-GHG report. Further in the IEA-GHG report the water/steam cycle used as base for the calculation of the decrease in power export is based on
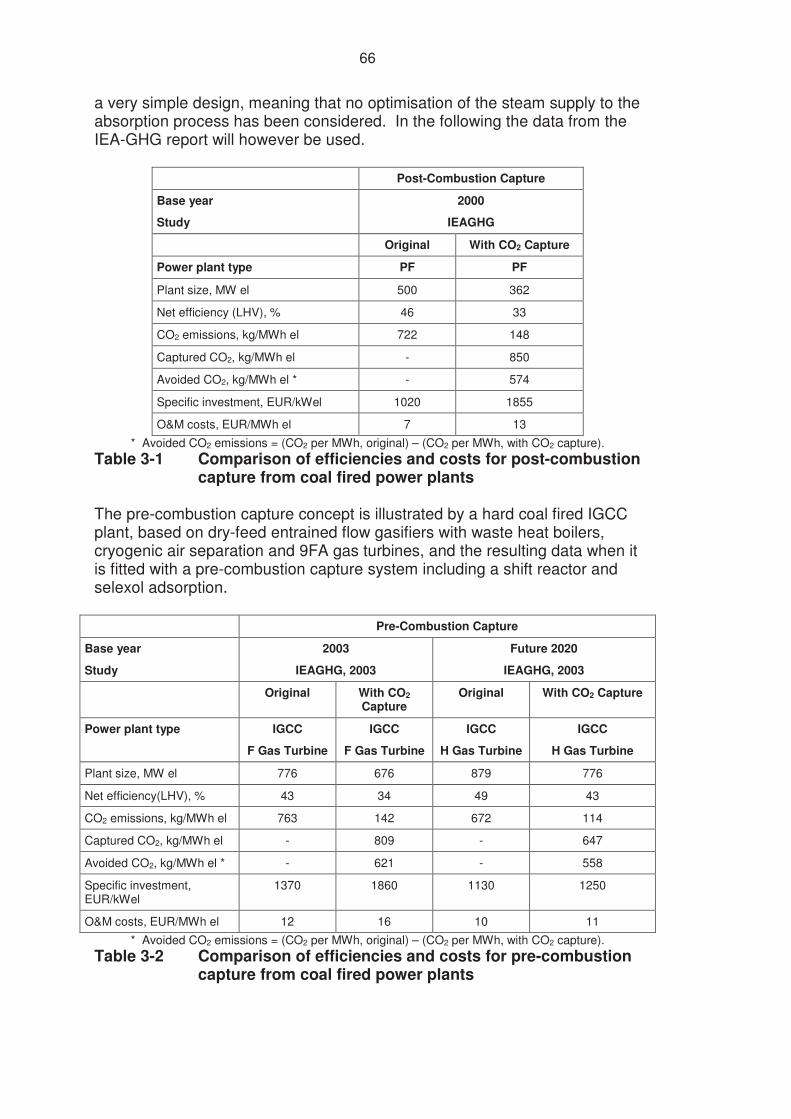
66
a very simple design, meaning that no optimisation of the steam supply to the absorption process has been considered. In the following the data from the IEA-GHG report will however be used.
Post-Combustion Capture
Base year
Study
2000
IEAGHG
Original With CO2 Capture
Power plant type PF PF
Plant size, MW el 500 362
Net efficiency (LHV), % 46 33
CO2 emissions, kg/MWh el 722 148
Captured CO2, kg/MWh el - 850
Avoided CO2, kg/MWh el * - 574
Specific investment, EUR/kWel 1020 1855
O&M costs, EUR/MWh el 7 13 * Avoided CO2 emissions = (CO2 per MWh, original) – (CO2 per MWh, with CO2 capture).
Table 3-1 Comparison of efficiencies and costs for post-combustion capture from coal fired power plants
The pre-combustion capture concept is illustrated by a hard coal fired IGCC plant, based on dry-feed entrained flow gasifiers with waste heat boilers, cryogenic air separation and 9FA gas turbines, and the resulting data when it is fitted with a pre-combustion capture system including a shift reactor and selexol adsorption.
Pre-Combustion Capture
Base year
Study
2003
IEAGHG, 2003
Future 2020
IEAGHG, 2003
Original With CO2 Capture
Original With CO2 Capture
Power plant type IGCC
F Gas Turbine
IGCC
F Gas Turbine
IGCC
H Gas Turbine
IGCC
H Gas Turbine
Plant size, MW el 776 676 879 776
Net efficiency(LHV), % 43 34 49 43
CO2 emissions, kg/MWh el 763 142 672 114
Captured CO2, kg/MWh el - 809 - 647
Avoided CO2, kg/MWh el * - 621 - 558
Specific investment, EUR/kWel
1370 1860 1130 1250
O&M costs, EUR/MWh el 12 16 10 11 * Avoided CO2 emissions = (CO2 per MWh, original) – (CO2 per MWh, with CO2 capture).
Table 3-2 Comparison of efficiencies and costs for pre-combustion capture from coal fired power plants
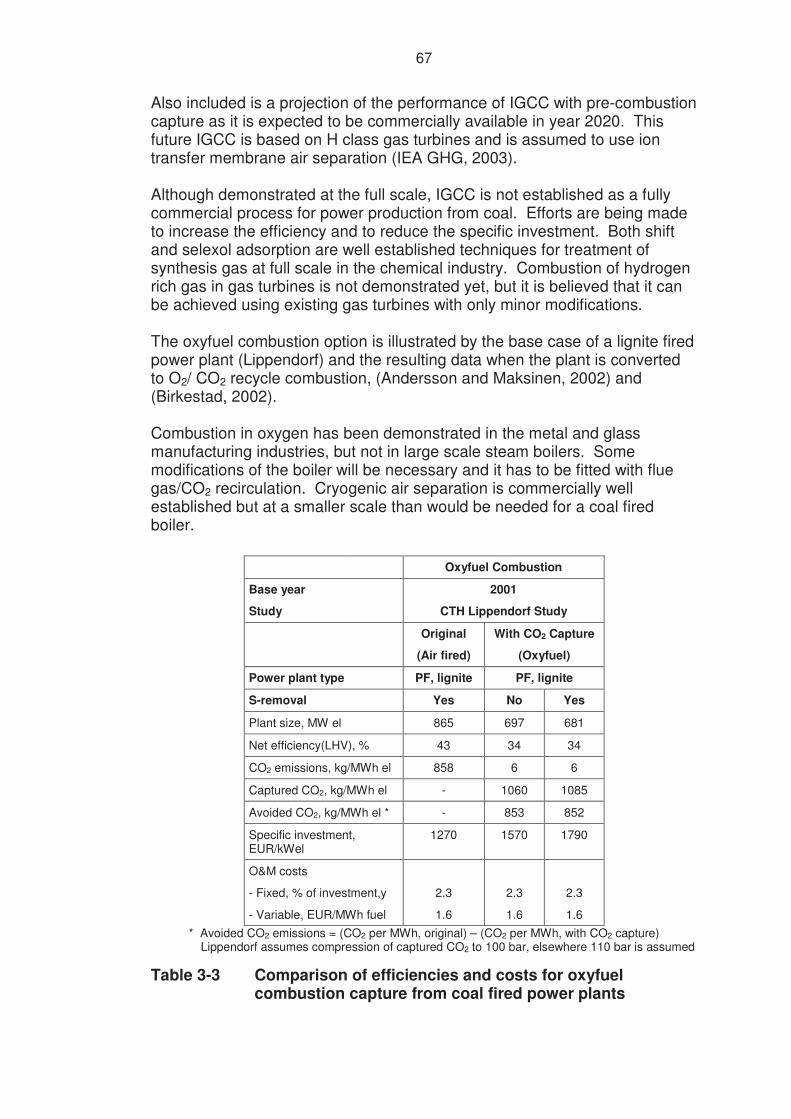
67
Also included is a projection of the performance of IGCC with pre-combustion capture as it is expected to be commercially available in year 2020. This future IGCC is based on H class gas turbines and is assumed to use ion transfer membrane air separation (IEA GHG, 2003). Although demonstrated at the full scale, IGCC is not established as a fully commercial process for power production from coal. Efforts are being made to increase the efficiency and to reduce the specific investment. Both shift and selexol adsorption are well established techniques for treatment of synthesis gas at full scale in the chemical industry. Combustion of hydrogen rich gas in gas turbines is not demonstrated yet, but it is believed that it can be achieved using existing gas turbines with only minor modifications. The oxyfuel combustion option is illustrated by the base case of a lignite fired power plant (Lippendorf) and the resulting data when the plant is converted to O2/ CO2 recycle combustion, (Andersson and Maksinen, 2002) and (Birkestad, 2002). Combustion in oxygen has been demonstrated in the metal and glass manufacturing industries, but not in large scale steam boilers. Some modifications of the boiler will be necessary and it has to be fitted with flue gas/CO2 recirculation. Cryogenic air separation is commercially well established but at a smaller scale than would be needed for a coal fired boiler.
Oxyfuel Combustion
Base year
Study
2001
CTH Lippendorf Study
Original
(Air fired)
With CO2 Capture
(Oxyfuel)
Power plant type PF, lignite PF, lignite
S-removal Yes No Yes
Plant size, MW el 865 697 681
Net efficiency(LHV), % 43 34 34
CO2 emissions, kg/MWh el 858 6 6
Captured CO2, kg/MWh el - 1060 1085
Avoided CO2, kg/MWh el * - 853 852
Specific investment, EUR/kWel
1270 1570 1790
O&M costs
- Fixed, % of investment,y
- Variable, EUR/MWh fuel
2.3
1.6
2.3
1.6
2.3
1.6 * Avoided CO2 emissions = (CO2 per MWh, original) – (CO2 per MWh, with CO2 capture)
Lippendorf assumes compression of captured CO2 to 100 bar, elsewhere 110 bar is assumed
Table 3-3 Comparison of efficiencies and costs for oxyfuel combustion capture from coal fired power plants
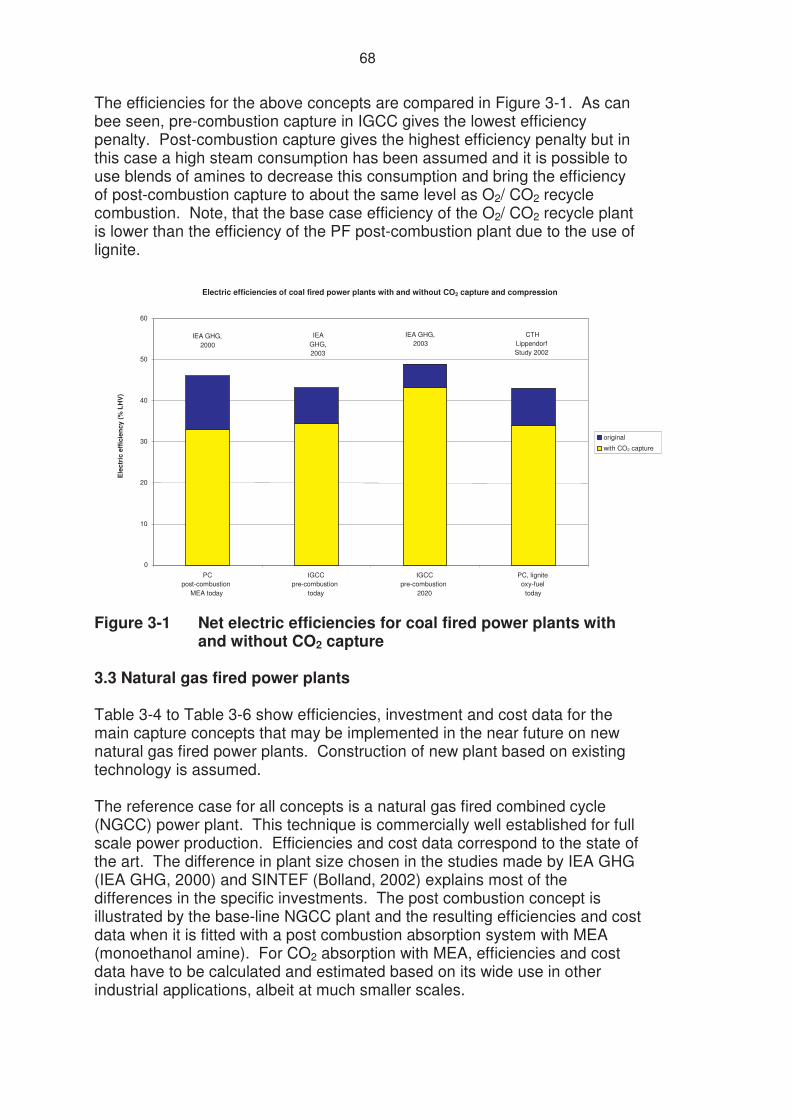
68
The efficiencies for the above concepts are compared in Figure 3-1. As can bee seen, pre-combustion capture in IGCC gives the lowest efficiency penalty. Post-combustion capture gives the highest efficiency penalty but in this case a high steam consumption has been assumed and it is possible to use blends of amines to decrease this consumption and bring the efficiency of post-combustion capture to about the same level as O2/ CO2 recycle combustion. Note, that the base case efficiency of the O2/ CO2 recycle plant is lower than the efficiency of the PF post-combustion plant due to the use of lignite.
Figure 3-1 Net electric efficiencies for coal fired power plants with and without CO2 capture
3.3 Natural gas fired power plants Table 3-4 to Table 3-6 show efficiencies, investment and cost data for the main capture concepts that may be implemented in the near future on new natural gas fired power plants. Construction of new plant based on existing technology is assumed. The reference case for all concepts is a natural gas fired combined cycle (NGCC) power plant. This technique is commercially well established for full scale power production. Efficiencies and cost data correspond to the state of the art. The difference in plant size chosen in the studies made by IEA GHG (IEA GHG, 2000) and SINTEF (Bolland, 2002) explains most of the differences in the specific investments. The post combustion concept is illustrated by the base-line NGCC plant and the resulting efficiencies and cost data when it is fitted with a post combustion absorption system with MEA (monoethanol amine). For CO2 absorption with MEA, efficiencies and cost data have to be calculated and estimated based on its wide use in other industrial applications, albeit at much smaller scales.
Electric efficiencies of coal fired power plants with and without CO2 capture and compression
0
10
20
30
40
50
60
PC post-combustion
MEA today IGCC
pre-combustion today
IGCC pre-combustion
2020 PC, lignite oxy-fuel
today
Ele
ctri
c ef
ficie
ncy
(% L
HV
)
original with CO2 capture
IEA GHG, 2000
IEA GHG, 2003 IEA
GHG, 2003
CTH Lippendorf Study 2002
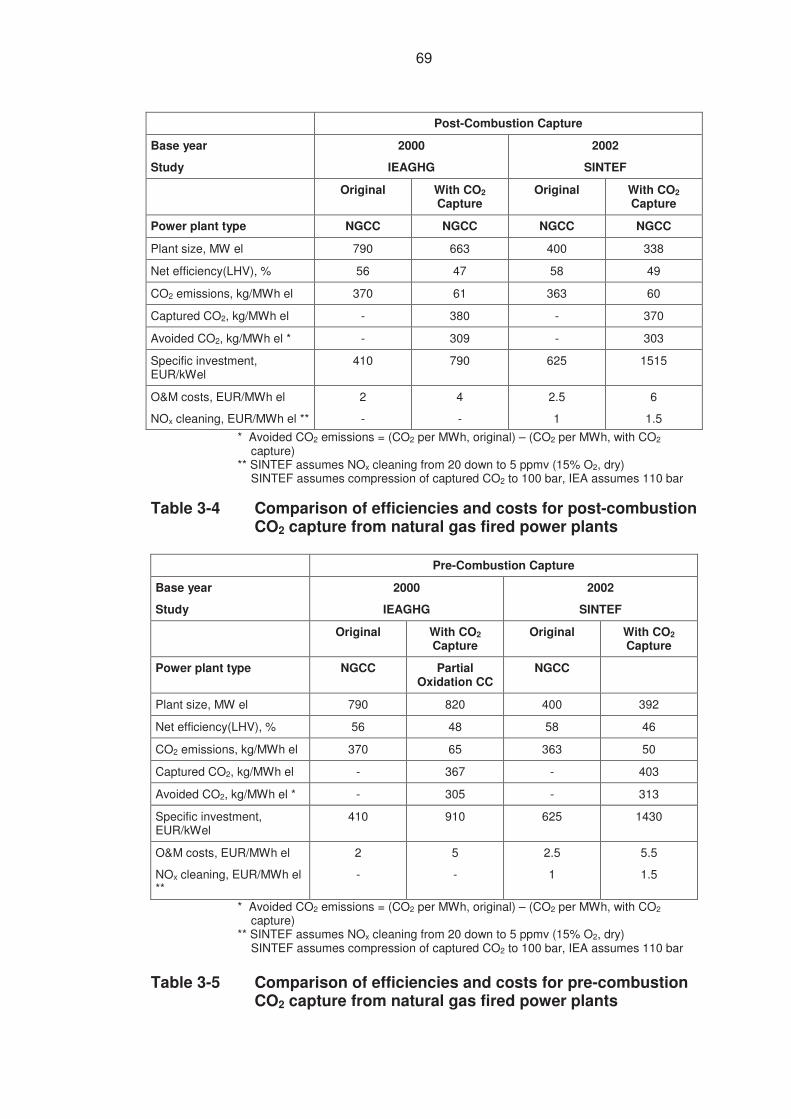
69
Post-Combustion Capture
Base year
Study
2000
IEAGHG
2002
SINTEF
Original With CO2 Capture
Original With CO2 Capture
Power plant type NGCC NGCC NGCC NGCC
Plant size, MW el 790 663 400 338
Net efficiency(LHV), % 56 47 58 49
CO2 emissions, kg/MWh el 370 61 363 60
Captured CO2, kg/MWh el - 380 - 370
Avoided CO2, kg/MWh el * - 309 - 303
Specific investment, EUR/kWel
410 790 625 1515
O&M costs, EUR/MWh el
NOx cleaning, EUR/MWh el **
2
-
4
-
2.5
1
6
1.5 * Avoided CO2 emissions = (CO2 per MWh, original) – (CO2 per MWh, with CO2
capture) ** SINTEF assumes NOx cleaning from 20 down to 5 ppmv (15% O2, dry)
SINTEF assumes compression of captured CO2 to 100 bar, IEA assumes 110 bar Table 3-4 Comparison of efficiencies and costs for post-combustion
CO2 capture from natural gas fired power plants Pre-Combustion Capture
Base year
Study
2000
IEAGHG
2002
SINTEF
Original With CO2 Capture
Original With CO2 Capture
Power plant type NGCC Partial Oxidation CC
NGCC
Plant size, MW el 790 820 400 392
Net efficiency(LHV), % 56 48 58 46
CO2 emissions, kg/MWh el 370 65 363 50
Captured CO2, kg/MWh el - 367 - 403
Avoided CO2, kg/MWh el * - 305 - 313
Specific investment, EUR/kWel
410 910 625 1430
O&M costs, EUR/MWh el
NOx cleaning, EUR/MWh el **
2
-
5
-
2.5
1
5.5
1.5
* Avoided CO2 emissions = (CO2 per MWh, original) – (CO2 per MWh, with CO2 capture) ** SINTEF assumes NOx cleaning from 20 down to 5 ppmv (15% O2, dry)
SINTEF assumes compression of captured CO2 to 100 bar, IEA assumes 110 bar Table 3-5 Comparison of efficiencies and costs for pre-combustion
CO2 capture from natural gas fired power plants
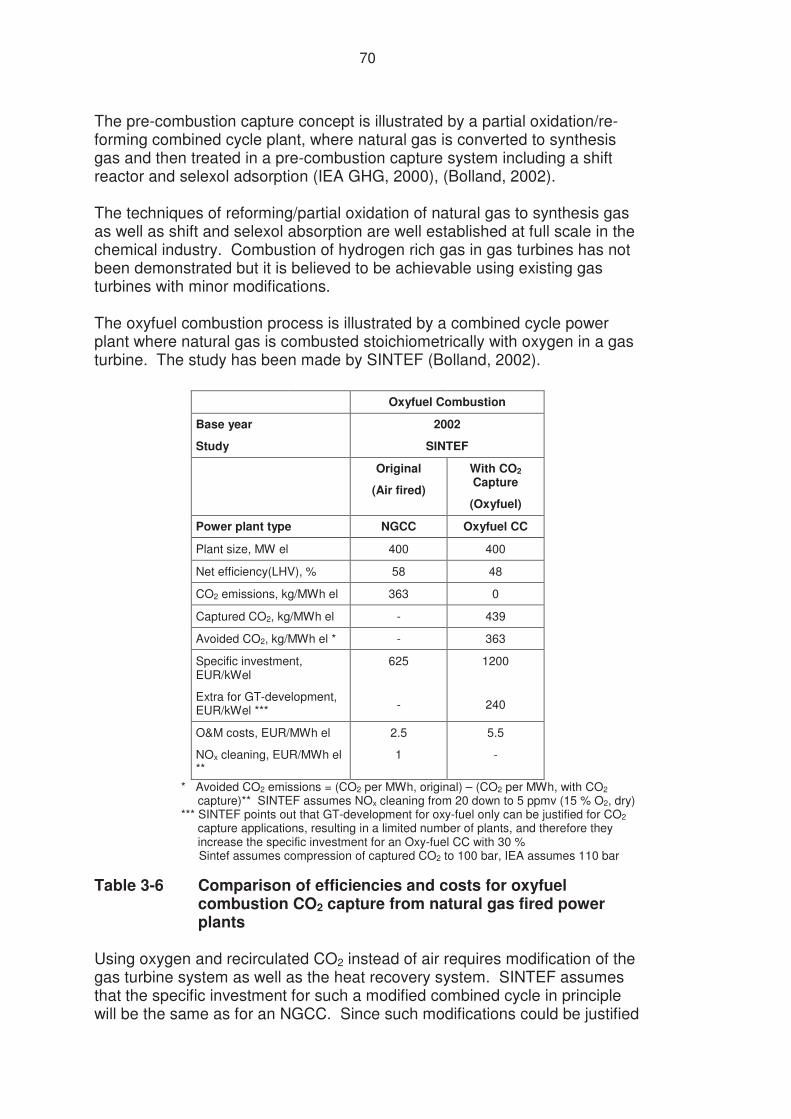
70
The pre-combustion capture concept is illustrated by a partial oxidation/re-forming combined cycle plant, where natural gas is converted to synthesis gas and then treated in a pre-combustion capture system including a shift reactor and selexol adsorption (IEA GHG, 2000), (Bolland, 2002). The techniques of reforming/partial oxidation of natural gas to synthesis gas as well as shift and selexol absorption are well established at full scale in the chemical industry. Combustion of hydrogen rich gas in gas turbines has not been demonstrated but it is believed to be achievable using existing gas turbines with minor modifications. The oxyfuel combustion process is illustrated by a combined cycle power plant where natural gas is combusted stoichiometrically with oxygen in a gas turbine. The study has been made by SINTEF (Bolland, 2002).
Oxyfuel Combustion
Base year
Study
2002
SINTEF
Original
(Air fired)
With CO2 Capture
(Oxyfuel)
Power plant type NGCC Oxyfuel CC
Plant size, MW el 400 400
Net efficiency(LHV), % 58 48
CO2 emissions, kg/MWh el 363 0
Captured CO2, kg/MWh el - 439
Avoided CO2, kg/MWh el * - 363
Specific investment, EUR/kWel
Extra for GT-development, EUR/kWel ***
625
-
1200
240
O&M costs, EUR/MWh el
NOx cleaning, EUR/MWh el **
2.5
1
5.5
-
* Avoided CO2 emissions = (CO2 per MWh, original) – (CO2 per MWh, with CO2 capture)** SINTEF assumes NOx cleaning from 20 down to 5 ppmv (15 % O2, dry) *** SINTEF points out that GT-development for oxy-fuel only can be justified for CO2 capture applications, resulting in a limited number of plants, and therefore they increase the specific investment for an Oxy-fuel CC with 30 %
Sintef assumes compression of captured CO2 to 100 bar, IEA assumes 110 bar Table 3-6 Comparison of efficiencies and costs for oxyfuel
combustion CO2 capture from natural gas fired power plants
Using oxygen and recirculated CO2 instead of air requires modification of the gas turbine system as well as the heat recovery system. SINTEF assumes that the specific investment for such a modified combined cycle in principle will be the same as for an NGCC. Since such modifications could be justified
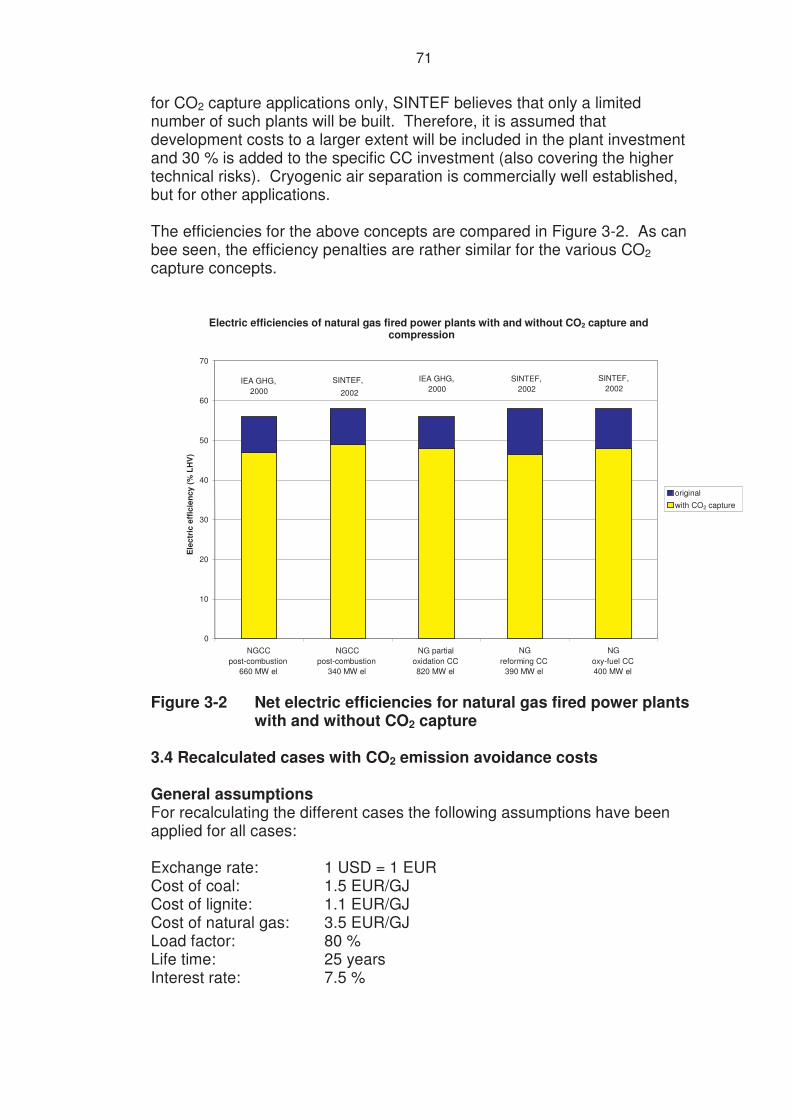
71
for CO2 capture applications only, SINTEF believes that only a limited number of such plants will be built. Therefore, it is assumed that development costs to a larger extent will be included in the plant investment and 30 % is added to the specific CC investment (also covering the higher technical risks). Cryogenic air separation is commercially well established, but for other applications. The efficiencies for the above concepts are compared in Figure 3-2. As can bee seen, the efficiency penalties are rather similar for the various CO2 capture concepts.
Figure 3-2 Net electric efficiencies for natural gas fired power plants
with and without CO2 capture 3.4 Recalculated cases with CO2 emission avoidance costs General assumptions For recalculating the different cases the following assumptions have been applied for all cases: Exchange rate: 1 USD = 1 EUR Cost of coal: 1.5 EUR/GJ Cost of lignite: 1.1 EUR/GJ Cost of natural gas: 3.5 EUR/GJ Load factor: 80 % Life time: 25 years Interest rate: 7.5 %
Electric efficiencies of natural gas fired power plants with and without CO2 capture and compression
0
10
20
30
40
50
60
70
NGCC post-combustion
660 MW el NGCC
post-combustion 340 MW el
NG partial oxidation CC 820 MW el
NG reforming CC
390 MW el NG
oxy-fuel CC 400 MW el
original with CO2 capture
IEA GHG, 2000
IEA GHG, 2000 SINTEF,
2002 SINTEF,
2002 SINTEF,
2002
Ele
ctri
c ef
ficie
ncy
(% L
HV
)
72
A sensitivity analysis has been made for the relevant parameters, e.g. fuel price and interest rate. Cases Cases from four studies have been used: - IEA GreenHouse Gas 2000 - IEA GreenHouse Gas 2003 - CTH Lippendorf (Andersson and Maksinen, 2002) and (Birkestad, 2002) - SINTEF (Bolland, 2002) The studies include six reference cases without CO2 capture and ten cases with CO2 capture. (Due to the overview in Table 3-7 reference cases 10 and 12 are shown more times). The six reference cases are: Case 1: Pulverised-coal firing (IEA GHG 2000) Case 3: IGCC with a type F gas turbine (IEA GHG 2003) Case 5: Future IGCC (2020) with a type H gas turbine (IEA GHG 2003) Case 7: Pulverised-lignite firing with S-removal (CTH Lippendorf) Case 10, 14: NGCC (IEA GHG 2000) Case 12, 16 18: NGCC with NOx cleaning (SINTEF) The ten cases with CO2 capture are: Case 2: Post combustion capture for case 1 Case 4: Pre-combustion capture for case 3 Case 6: Pre-combustion capture for case 5 Case 8: Oxyfuel combustion without S-removal for case 7 Case 9: Oxyfuel combustion with S-removal for case 7 Case 11: Post-combustion capture for case 10 (12) Case 13: Post-combustion capture for case 12 (16, 18) Case 15: Pre-combustion capture for case 10 (14) Case 17: Pre-combustion capture for case 12 (16, 18) Case 19: Oxyfuel combustion for case 12 (16, 18). Data for the cases are given in Table 3-7.
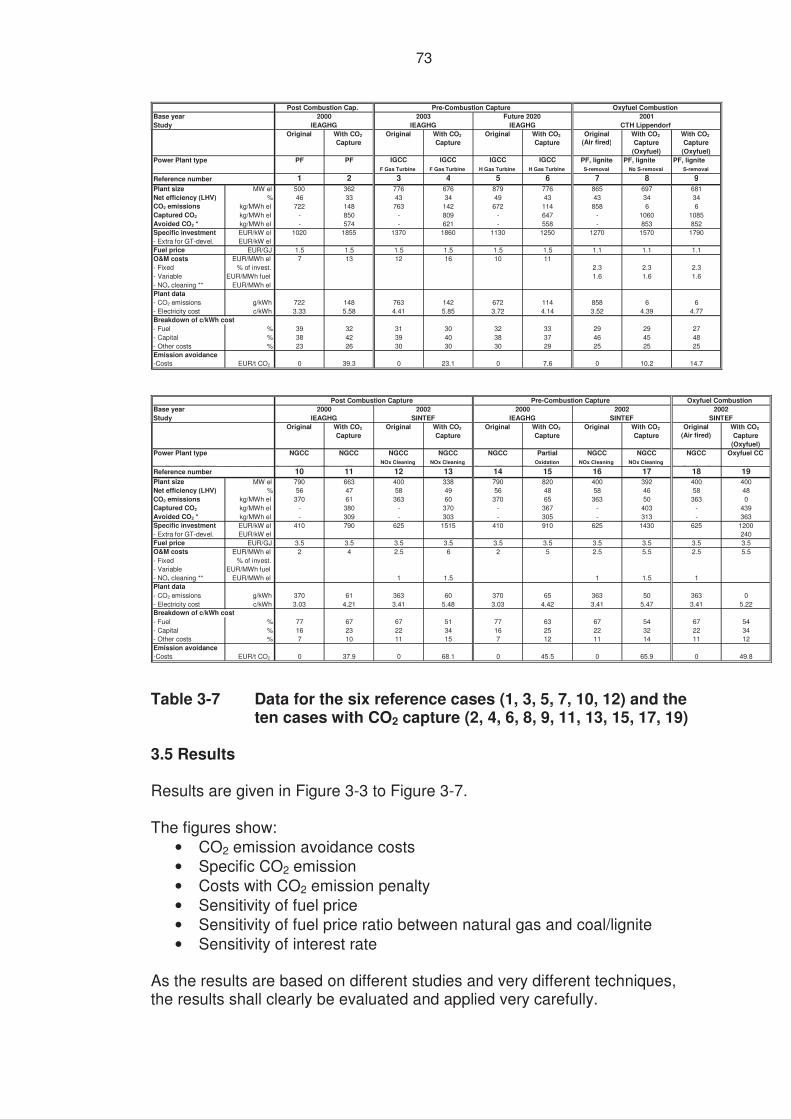
73
Table 3-7 Data for the six reference cases (1, 3, 5, 7, 10, 12) and the
ten cases with CO2 capture (2, 4, 6, 8, 9, 11, 13, 15, 17, 19) 3.5 Results Results are given in Figure 3-3 to Figure 3-7. The figures show:
• CO2 emission avoidance costs • Specific CO2 emission • Costs with CO2 emission penalty • Sensitivity of fuel price • Sensitivity of fuel price ratio between natural gas and coal/lignite • Sensitivity of interest rate
As the results are based on different studies and very different techniques, the results shall clearly be evaluated and applied very carefully.
Base year Study
Original With CO2 Original With CO2 Original With CO2 Original With CO2 With CO2 Capture Capture Capture (Air fired) Capture Capture
(Oxyfuel) (Oxyfuel) Power Plant type PF PF IGCC IGCC IGCC IGCC PF, lignite PF, lignite PF, lignite
F Gas Turbine F Gas Turbine H Gas Turbine H Gas Turbine S-removal No S-removal S-removal Reference number 1 2 3 4 5 6 7 8 9 Plant size MW el 500 362 776 676 879 776 865 697 681 Net efficiency (LHV) % 46 33 43 34 49 43 43 34 34 CO2 emissions kg/MWh el 722 148 763 142 672 114 858 6 6 Captured CO2 kg/MWh el - 850 - 809 - 647 - 1060 1085 Avoided CO2 * kg/MWh el - 574 - 621 - 558 - 853 852 Specific investment EUR/kW el 1020 1855 1370 1860 1130 1250 1270 1570 1790 - Extra for GT-devel. EUR/kW el Fuel price EUR/GJ 1.5 1.5 1.5 1.5 1.5 1.5 1.1 1.1 1.1 O&M costs EUR/MWh el 7 13 12 16 10 11 - Fixed % of invest. 2.3 2.3 2.3 - Variable EUR/MWh fuel 1.6 1.6 1.6 - NOx cleaning ** EUR/MWh el Plant data - CO2 emissions g/kWh 722 148 763 142 672 114 858 6 6 - Electricity cost c/kWh 3.33 5.58 4.41 5.85 3.72 4.14 3.52 4.39 4.77 Breakdown of c/kWh cost - Fuel % 39 32 31 30 32 33 29 29 27 - Capital % 38 42 39 40 38 37 46 45 48 - Other costs % 23 26 30 30 30 29 25 25 25 Emission avoidance -Costs EUR/t CO2 0 39.3 0 23.1 0 7.6 0 10.2 14.7
Base year Study
Original With CO2 Original With CO2 Original With CO2 Original With CO2 Original With CO2 Capture Capture Capture Capture (Air fired) Capture
(Oxyfuel) Power Plant type NGCC NGCC NGCC NGCC NGCC Partial NGCC NGCC NGCC Oxyfuel CC
NOx Cleaning NOx Cleaning Oxidation NOx Cleaning NOx Cleaning Reference number 10 11 12 13 14 15 16 17 18 19 Plant size MW el 790 663 400 338 790 820 400 392 400 400 Net efficiency (LHV) % 56 47 58 49 56 48 58 46 58 48 CO2 emissions kg/MWh el 370 61 363 60 370 65 363 50 363 0 Captured CO2 kg/MWh el - 380 - 370 - 367 - 403 - 439 Avoided CO2 * kg/MWh el - 309 - 303 - 305 - 313 - 363 Specific investment EUR/kW el 410 790 625 1515 410 910 625 1430 625 1200 - Extra for GT-devel. EUR/kW el 240 Fuel price EUR/GJ 3.5 3.5 3.5 3.5 3.5 3.5 3.5 3.5 3.5 3.5 O&M costs EUR/MWh el 2 4 2.5 6 2 5 2.5 5.5 2.5 5.5 - Fixed % of invest. - Variable EUR/MWh fuel - NOx cleaning ** EUR/MWh el 1 1.5 1 1.5 1 Plant data - CO2 emissions g/kWh 370 61 363 60 370 65 363 50 363 0 - Electricity cost c/kWh 3.03 4.21 3.41 5.48 3.03 4.42 3.41 5.47 3.41 5.22 Breakdown of c/kWh cost - Fuel % 77 67 67 51 77 63 67 54 67 54 - Capital % 16 23 22 34 16 25 22 32 22 34 - Other costs % 7 10 11 15 7 12 11 14 11 12 Emission avoidance -Costs EUR/t CO2 0 37.9 0 68.1 0 45.5 0 65.9 0 49.8
SINTEF Oxyfuel Combustion
IEAGHG Post Combustion Capture Pre-Combustion Capture
2000 2002 IEAGHG SINTEF
Oxyfuel Combustion CTH Lippendorf 2001
2000 2002 2002 SINTEF
Post Combustion Cap. Pre-Combustion Capture 2000
IEAGHG Future 2020 IEAGHG 2003
IEAGHG
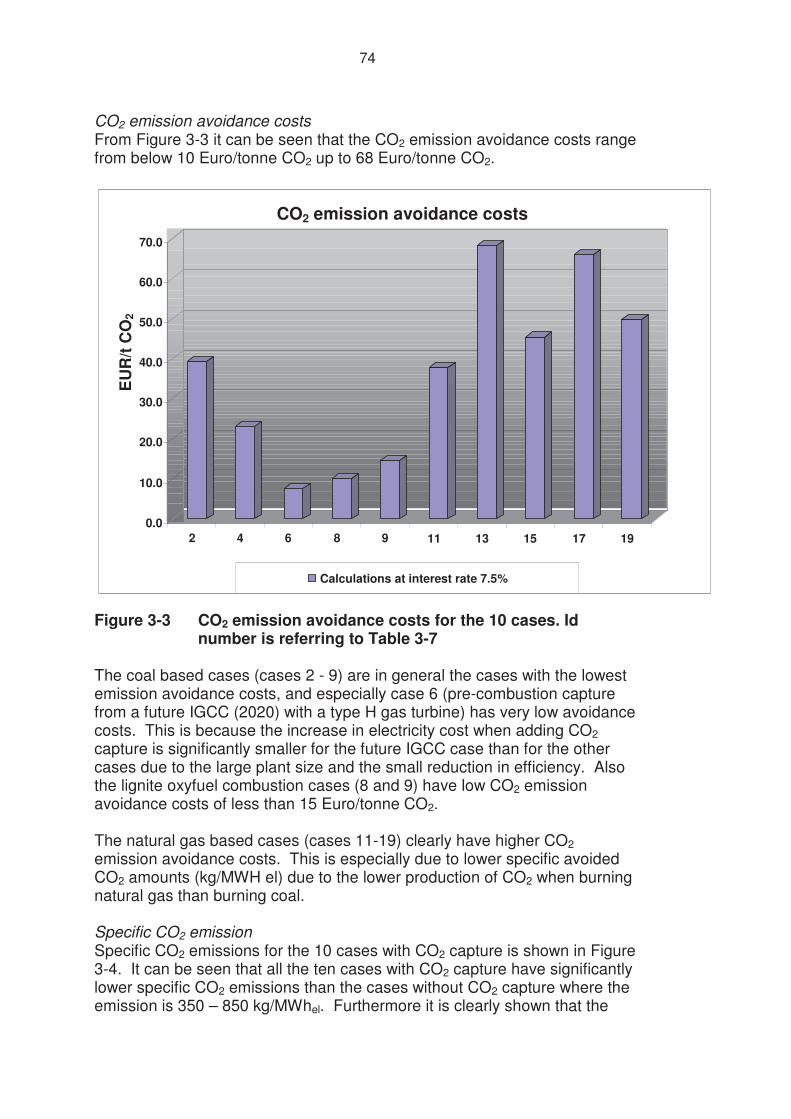
74
CO2 emission avoidance costs From Figure 3-3 it can be seen that the CO2 emission avoidance costs range from below 10 Euro/tonne CO2 up to 68 Euro/tonne CO2.
Figure 3-3 CO2 emission avoidance costs for the 10 cases. Id number is referring to Table 3-7
The coal based cases (cases 2 - 9) are in general the cases with the lowest emission avoidance costs, and especially case 6 (pre-combustion capture from a future IGCC (2020) with a type H gas turbine) has very low avoidance costs. This is because the increase in electricity cost when adding CO2 capture is significantly smaller for the future IGCC case than for the other cases due to the large plant size and the small reduction in efficiency. Also the lignite oxyfuel combustion cases (8 and 9) have low CO2 emission avoidance costs of less than 15 Euro/tonne CO2. The natural gas based cases (cases 11-19) clearly have higher CO2 emission avoidance costs. This is especially due to lower specific avoided CO2 amounts (kg/MWH el) due to the lower production of CO2 when burning natural gas than burning coal. Specific CO2 emission Specific CO2 emissions for the 10 cases with CO2 capture is shown in Figure 3-4. It can be seen that all the ten cases with CO2 capture have significantly lower specific CO2 emissions than the cases without CO2 capture where the emission is 350 – 850 kg/MWhel. Furthermore it is clearly shown that the
0.0
10.0
20.0
30.0
40.0
50.0
60.0
70.0
EU
R/t
CO
2
2 4 6 8 9 11 13 15 17 19
CO2 emission avoidance costs
Calculations at interest rate 7.5%
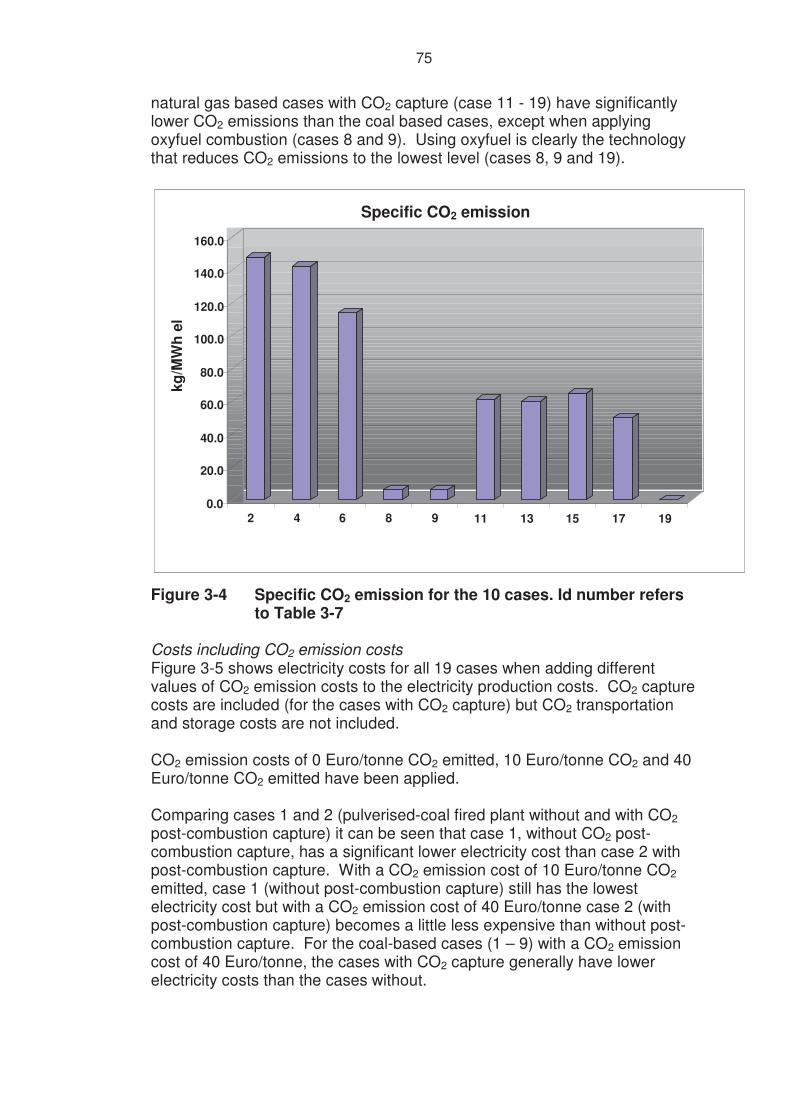
75
natural gas based cases with CO2 capture (case 11 - 19) have significantly lower CO2 emissions than the coal based cases, except when applying oxyfuel combustion (cases 8 and 9). Using oxyfuel is clearly the technology that reduces CO2 emissions to the lowest level (cases 8, 9 and 19).
Figure 3-4 Specific CO2 emission for the 10 cases. Id number refers to Table 3-7
Costs including CO2 emission costs Figure 3-5 shows electricity costs for all 19 cases when adding different values of CO2 emission costs to the electricity production costs. CO2 capture costs are included (for the cases with CO2 capture) but CO2 transportation and storage costs are not included. CO2 emission costs of 0 Euro/tonne CO2 emitted, 10 Euro/tonne CO2 and 40 Euro/tonne CO2 emitted have been applied. Comparing cases 1 and 2 (pulverised-coal fired plant without and with CO2 post-combustion capture) it can be seen that case 1, without CO2 post-combustion capture, has a significant lower electricity cost than case 2 with post-combustion capture. With a CO2 emission cost of 10 Euro/tonne CO2 emitted, case 1 (without post-combustion capture) still has the lowest electricity cost but with a CO2 emission cost of 40 Euro/tonne case 2 (with post-combustion capture) becomes a little less expensive than without post-combustion capture. For the coal-based cases (1 – 9) with a CO2 emission cost of 40 Euro/tonne, the cases with CO2 capture generally have lower electricity costs than the cases without.
0.0
20.0
40.0
60.0
80.0
100.0
120.0
140.0
160.0
kg/M
Wh
el
2 4 6 8 9 11 13 15 17 19
Specific CO2 emission
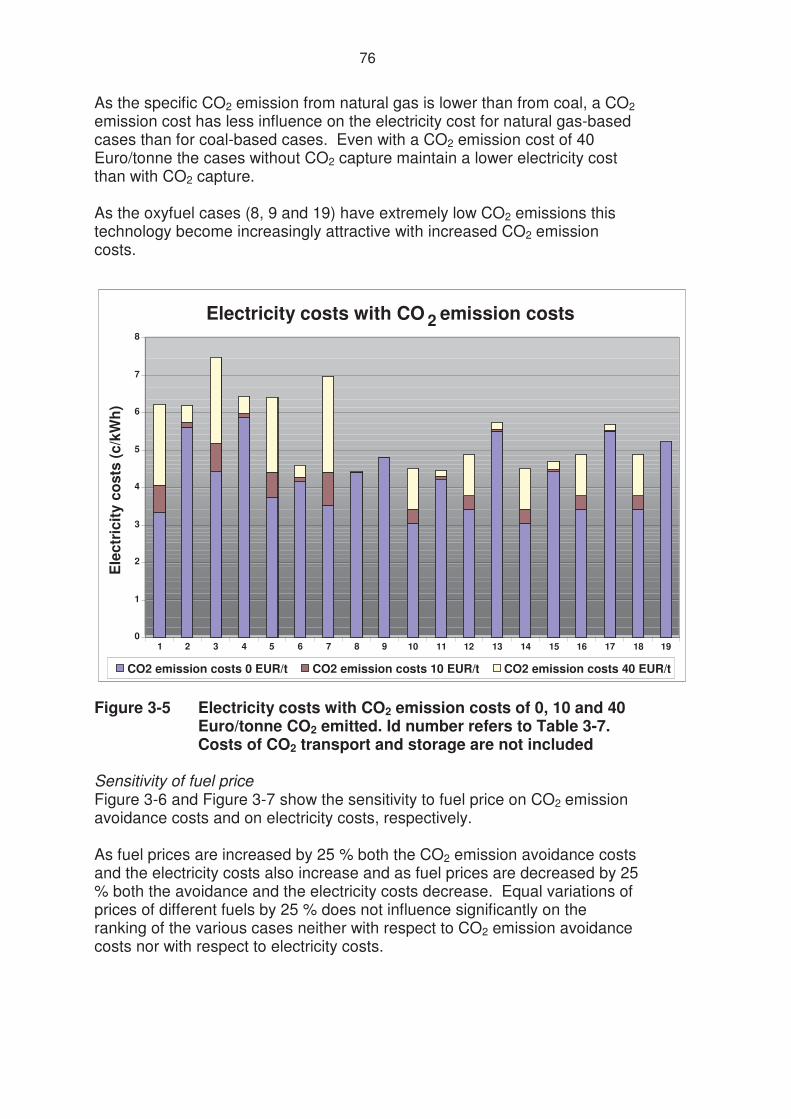
76
As the specific CO2 emission from natural gas is lower than from coal, a CO2 emission cost has less influence on the electricity cost for natural gas-based cases than for coal-based cases. Even with a CO2 emission cost of 40 Euro/tonne the cases without CO2 capture maintain a lower electricity cost than with CO2 capture. As the oxyfuel cases (8, 9 and 19) have extremely low CO2 emissions this technology become increasingly attractive with increased CO2 emission costs.
Figure 3-5 Electricity costs with CO2 emission costs of 0, 10 and 40 Euro/tonne CO2 emitted. Id number refers to Table 3-7. Costs of CO2 transport and storage are not included
Sensitivity of fuel price Figure 3-6 and Figure 3-7 show the sensitivity to fuel price on CO2 emission avoidance costs and on electricity costs, respectively. As fuel prices are increased by 25 % both the CO2 emission avoidance costs and the electricity costs also increase and as fuel prices are decreased by 25 % both the avoidance and the electricity costs decrease. Equal variations of prices of different fuels by 25 % does not influence significantly on the ranking of the various cases neither with respect to CO2 emission avoidance costs nor with respect to electricity costs.
0
1
2
3
4
5
6
7
8
Ele
ctri
city
cos
ts (c
/kW
h)
1 2 3 4 5 6 7 8 9 10 11 12 13 14 15 16 17 18 19
Electricity costs with CO 2 emission costs
CO2 emission costs 0 EUR/t CO2 emission costs 10 EUR/t CO2 emission costs 40 EUR/t
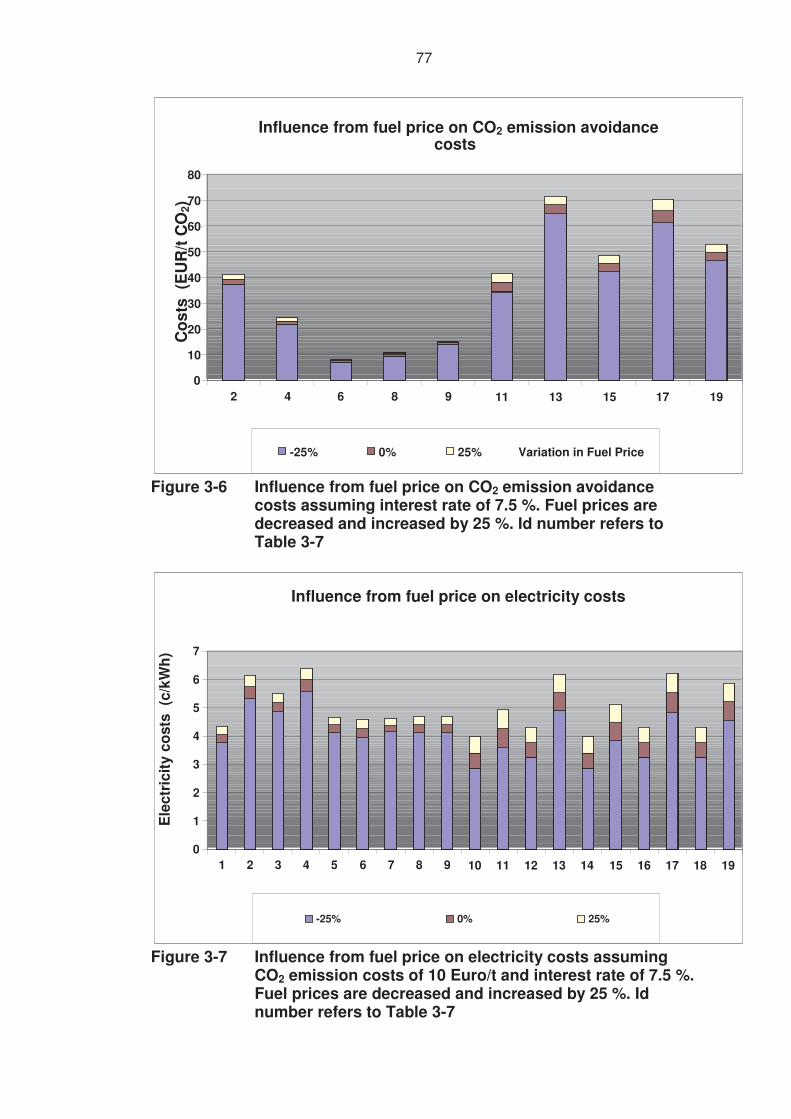
77
Figure 3-6 Influence from fuel price on CO2 emission avoidance costs assuming interest rate of 7.5 %. Fuel prices are decreased and increased by 25 %. Id number refers to Table 3-7
Figure 3-7 Influence from fuel price on electricity costs assuming
CO2 emission costs of 10 Euro/t and interest rate of 7.5 %. Fuel prices are decreased and increased by 25 %. Id number refers to Table 3-7
0
10
20
30
40
50
60
70
80 C
osts
(E
UR
/t C
O2)
2 4 6 8 9 11 13 15 17 19
Influence from fuel price on CO2 emission avoidance costs
-25% 0% 25% Variation in Fuel Price
0
1
2
3
4
5
6
7
Ele
ctri
city
cos
ts (
c/kW
h)
1 2 3 4 5 6 7 8 9 10 11 12 13 14 15 16 17 18 19
Influence from fuel price on electricity costs
-25% 0% 25%
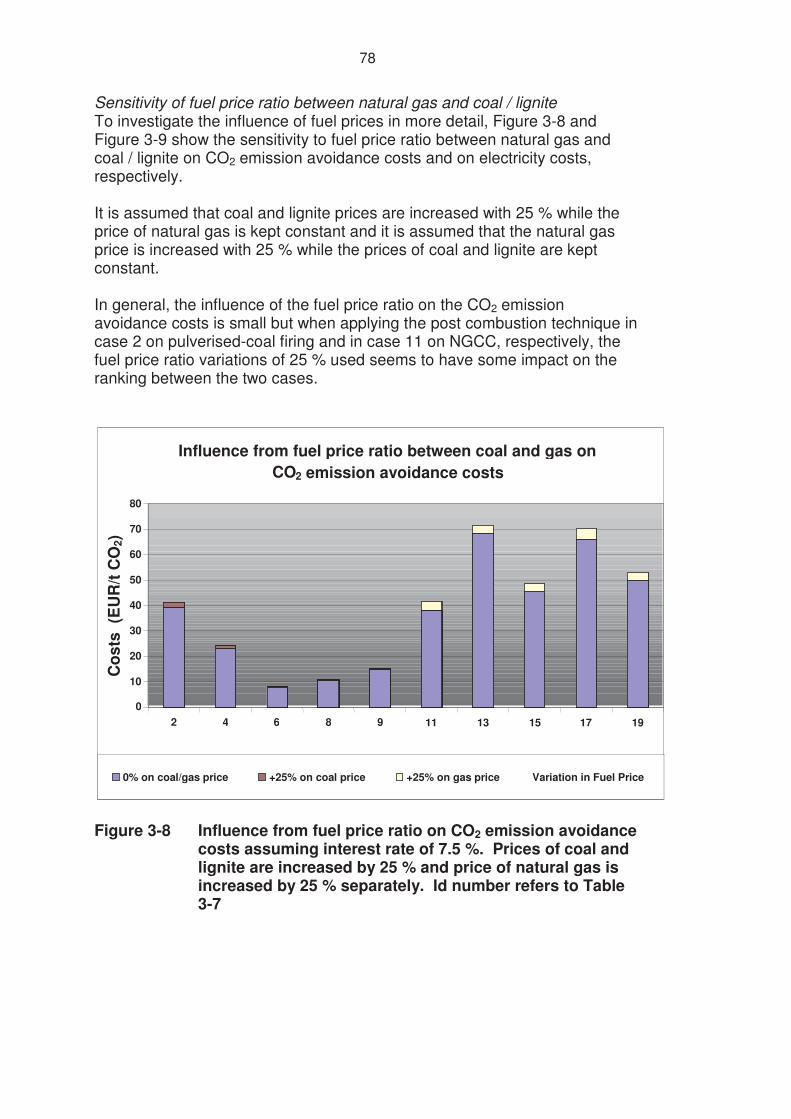
78
Sensitivity of fuel price ratio between natural gas and coal / lignite To investigate the influence of fuel prices in more detail, Figure 3-8 and Figure 3-9 show the sensitivity to fuel price ratio between natural gas and coal / lignite on CO2 emission avoidance costs and on electricity costs, respectively. It is assumed that coal and lignite prices are increased with 25 % while the price of natural gas is kept constant and it is assumed that the natural gas price is increased with 25 % while the prices of coal and lignite are kept constant. In general, the influence of the fuel price ratio on the CO2 emission avoidance costs is small but when applying the post combustion technique in case 2 on pulverised-coal firing and in case 11 on NGCC, respectively, the fuel price ratio variations of 25 % used seems to have some impact on the ranking between the two cases.
Figure 3-8 Influence from fuel price ratio on CO2 emission avoidance
costs assuming interest rate of 7.5 %. Prices of coal and lignite are increased by 25 % and price of natural gas is increased by 25 % separately. Id number refers to Table 3-7
0
10
20
30
40
50
60
70
80
Cos
ts (
EU
R/t
CO
2)
2 4 6 8 9 11 13 15 17 19
Influence from fuel price ratio between coal and gas on CO 2 emission avoidance costs
0% on coal/gas price +25% on coal price +25% on gas price Variation in Fuel Price
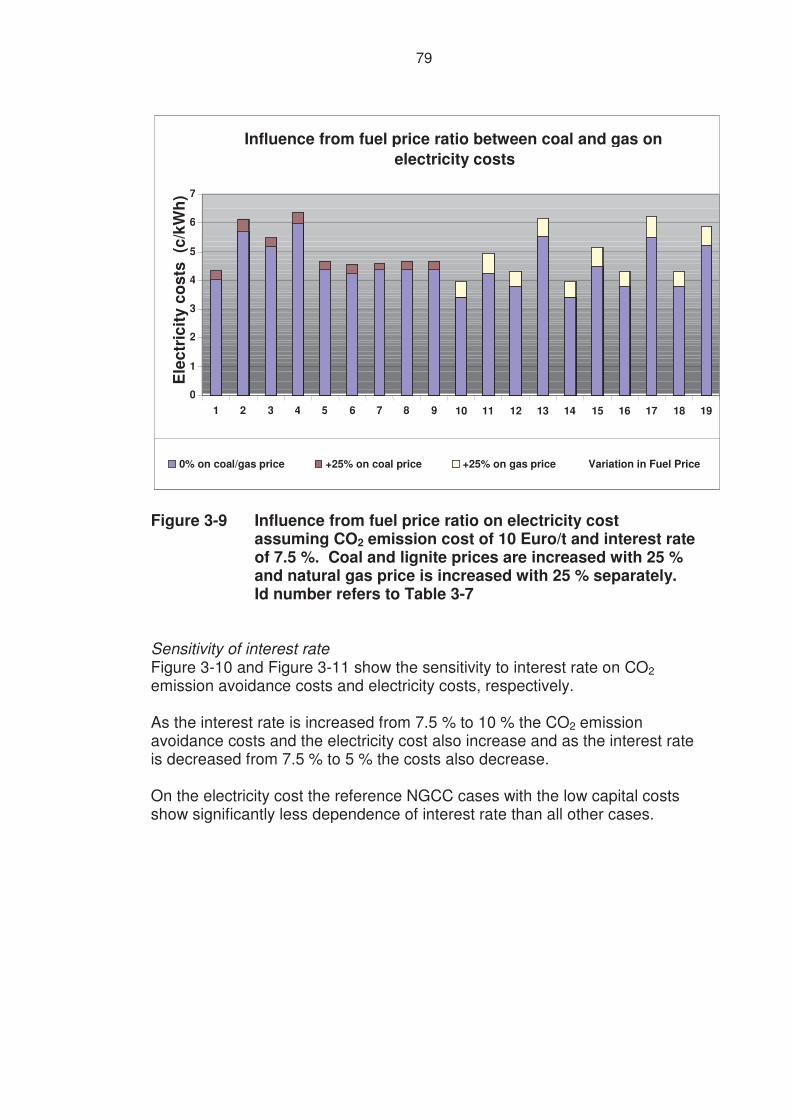
79
Figure 3-9 Influence from fuel price ratio on electricity cost
assuming CO2 emission cost of 10 Euro/t and interest rate of 7.5 %. Coal and lignite prices are increased with 25 % and natural gas price is increased with 25 % separately. Id number refers to Table 3-7
Sensitivity of interest rate Figure 3-10 and Figure 3-11 show the sensitivity to interest rate on CO2 emission avoidance costs and electricity costs, respectively. As the interest rate is increased from 7.5 % to 10 % the CO2 emission avoidance costs and the electricity cost also increase and as the interest rate is decreased from 7.5 % to 5 % the costs also decrease. On the electricity cost the reference NGCC cases with the low capital costs show significantly less dependence of interest rate than all other cases.
0
1
2
3
4
5
6
7 E
lect
rici
ty c
osts
(c/
kWh)
1 2 3 4 5 6 7 8 9 10 11 12 13 14 15 16 17 18 19
Influence from fuel price ratio between coal and gas on electricity costs
0% on coal/gas price +25% on coal price +25% on gas price Variation in Fuel Price
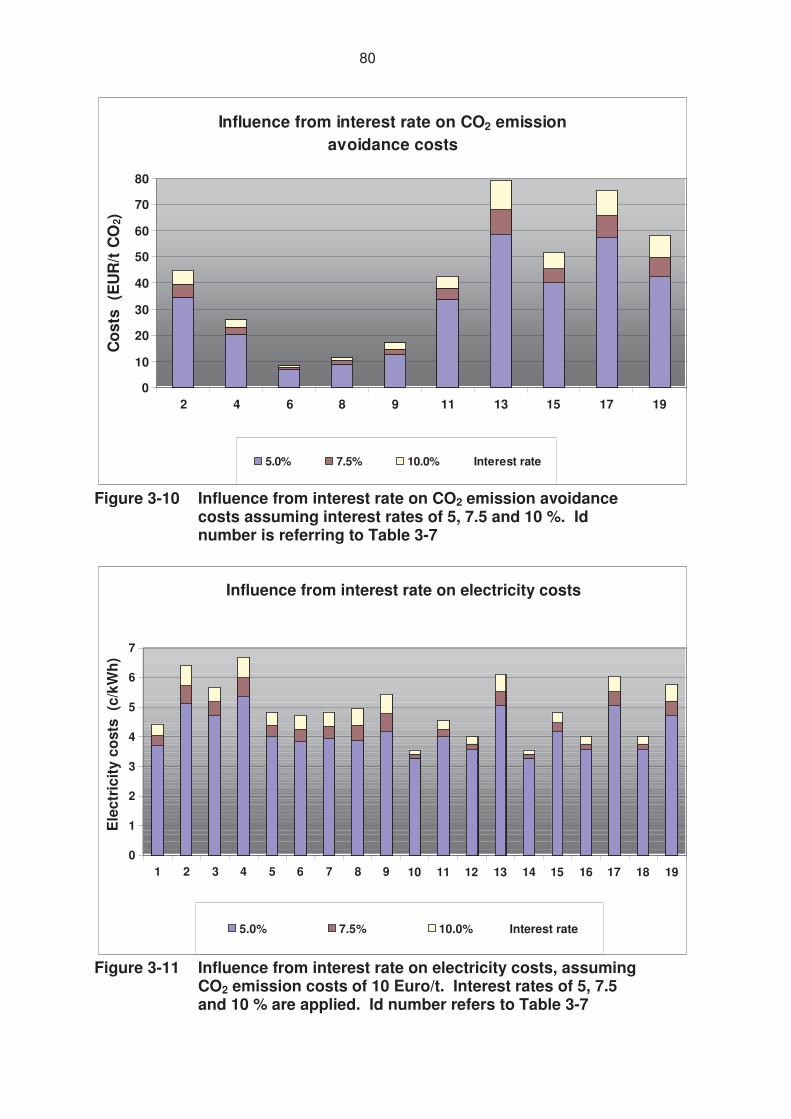
80
0
10
20
30
40
50
60
70
80
Cos
ts (
EU
R/t
CO
2)
2 4 6 8 9 11 13 15 17 19
Influence from interest rate on CO2 emission avoidance costs
5.0% 7.5% 10.0% Interest rate
Figure 3-10 Influence from interest rate on CO2 emission avoidance
costs assuming interest rates of 5, 7.5 and 10 %. Id number is referring to Table 3-7
Figure 3-11 Influence from interest rate on electricity costs, assuming
CO2 emission costs of 10 Euro/t. Interest rates of 5, 7.5 and 10 % are applied. Id number refers to Table 3-7
0
1
2
3
4
5
6
7
Ele
ctri
city
cos
ts (
c/kW
h)
1 2 3 4 5 6 7 8 9 10 11 12 13 14 15 16 17 18 19
Influence from interest rate on electricity costs
5.0% 7.5% 10.0% Interest rate
81
3.6 Conclusions Various literature sources have reported costs for different techniques for reducing CO2 emissions. As these costs are based on calculations using different assumptions regarding fuel costs, interest rates etc. it is impossible to meaningfully compare the costs of the different techniques. An attempt has therefore been made to compare the costs of the different techniques by applying consistent assumptions and then recalculating the overall costs. Costs of CO2 transportation and storage are, however, excluded. As the results are based on different studies and very different techniques, great care should therefore be taken when evaluating and applying the results. The results show that, in general, the CO2 emission avoidance costs are lowest for coal-fired plants showing that CO2 capture primarily should be installed on coal fired power plants. The electricity costs will increase from 30 – 45 /MWh without CO2 capture to 40 – 60 /MWh with CO2 capture exclusive CO2 emission costs and costs for transportation and storage. By introducing CO2 emission costs of up to 40 �/tonne CO2 emitted, the cases without CO2 capture have higher electricity costs than the cases with capture for the coal-based cases. For the natural gas-based cases the break-even point for with and without CO2 capture is at a higher CO2 emission cost. As the CO2 emission costs increase, the oxyfuel technology becomes increasingly attractive. In these calculations variations in fuel prices and interest rates only slightly influence the results. 3.7 References Andersson, K., Maksinen, P.: "Process evaluation of CO2 free combustion in an O2/CO2 power plant", Master of Science thesis T2002-258, Department of Energy Conversion, Chalmers University of Technology, Göteborg, 2002. Birkestad, H.: "Separation and Compression of CO2 in an O2/CO2-fired Power Plant", Master of Science thesis T2002-262, Department of Energy Conversion, Chalmers University of Technology, Göteborg, 2002. Bolland, O., et.al.: ”Gaskraftverk med CO2-håndtagning. Studie av alternative teknologier”, SINTEF Energiforskning AS, Report nr. TR A5693, Trondheim, Norway, 2002. ISBN Nr: 82-594-2358-8 (In Norwegian). IEA GHG: "Leading Options for the Capture of CO2 Emissions at Power Stations", IEA Greenhouse Gas R&D Programme, Report Nr PH3/14, 2000.
¡
¡

82
IEA GHG: "Potential for Improvement in Gasification Combined Cycle Power Generation with CO2 Capture", IEA Greenhouse Gas R&D Programme, Report Nr PH4/19, 2003. Roberts, C.: “Presentation at DTI CO2 Capture and Storage Seminar” 2002.
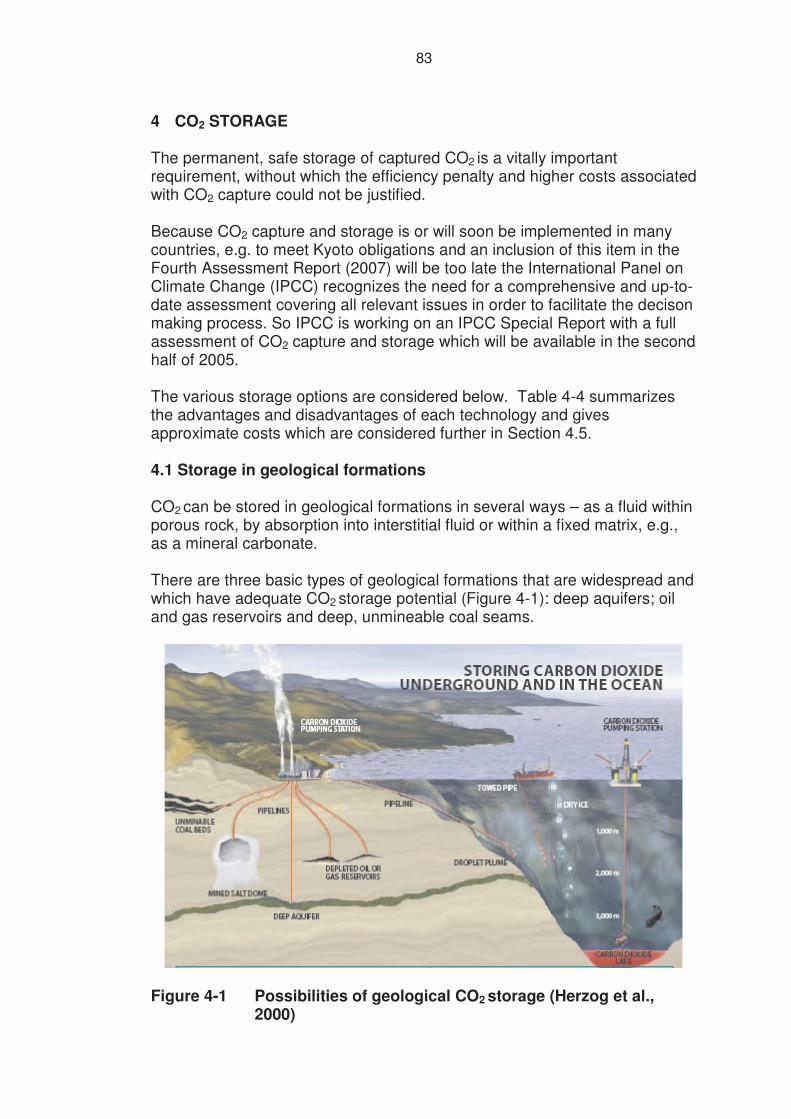
83
4 CO2 STORAGE The permanent, safe storage of captured CO2 is a vitally important requirement, without which the efficiency penalty and higher costs associated with CO2 capture could not be justified. Because CO2 capture and storage is or will soon be implemented in many countries, e.g. to meet Kyoto obligations and an inclusion of this item in the Fourth Assessment Report (2007) will be too late the International Panel on Climate Change (IPCC) recognizes the need for a comprehensive and up-to-date assessment covering all relevant issues in order to facilitate the decison making process. So IPCC is working on an IPCC Special Report with a full assessment of CO2 capture and storage which will be available in the second half of 2005. The various storage options are considered below. Table 4-4 summarizes the advantages and disadvantages of each technology and gives approximate costs which are considered further in Section 4.5. 4.1 Storage in geological formations CO2 can be stored in geological formations in several ways – as a fluid within porous rock, by absorption into interstitial fluid or within a fixed matrix, e.g., as a mineral carbonate. There are three basic types of geological formations that are widespread and which have adequate CO2 storage potential (Figure 4-1): deep aquifers; oil and gas reservoirs and deep, unmineable coal seams.
Figure 4-1 Possibilities of geological CO2 storage (Herzog et al., 2000)
84
The estimated European CO2 storage capacity in some of these formations is given in Table 4-1.
Storage location Onshore Gt CO2
Offshore Gt CO2
Aquifers* 57 716 Oil fields 0.2 5.9 Gas fields 12.5 14.4
*Figures for conventional fluid traps alone are 10.7Gt onshore and 19.5Gt offshore
Table 4-1 Estimated European underground CO2 storage capacities (Source: IEA Greenhouse Gas R&D Programme Task 1. Joule-II The Underground Disposal of Carbon Dioxide. Project Summary 001 combined with 005. March 1996)
4.1.1 Aquifers Process Description As indicated by Table 4-1, the European storage capacity of deep aquifers is high. Aquifers are strata of porous rock – often sandstone – that usually contain salt water and through which liquids or gases can flow, depending on the permeability. An impermeable overlying (cap) rock is normally positioned above the aquifer. The CO2 is introduced into the aquifer via a bore-hole resulting in partial dissolution of the CO2 in the salt water and partial displacement of the water by the fluid. There may also be reactions with the surrounding rock over longer periods. If the rock is a silicate, retention of the CO2 in the aquifer could be enhanced since a proportion of the gas could be bound up as a solid carbonate following prior reactions with the silicates, thus offering a permanent means of storage. Development Status - Research Needs Statoil’s natural gas field Sleipner Vest is currently the only place in the world where large volumes of carbon dioxide are injected for underground storage. The CO2 content of the raw natural gas is reduced from ~ 9 % by volume, to < 2.5 % by amine absorption. The captured CO2 is discharged via a bore-hole, located 3km from the drilling platform, into the Utsira sandstone formation (~ 250m thick and ~1000m below the seabed). About 1 million tonnes of CO2 have been pumped into the aquifer annually since the end of 1996. In addition, Exxon and Pertamina (Indonesia) are reportedly intending to inject CO2 from a natural gas field in Natuna into an aquifer (carbonate formation) 1000m below the South China Sea. Approximately 100 million tonnes of CO2/year will be stored. A number of research areas are envisaged: developing criteria for storage site selection; estimating CO2 leakage rates; monitoring CO2 retention or migration; ensuring long-term stability of stored CO2; improving knowledge of CO2 solubility in salt water and mineral structures; estimating the potential for causing seismic problems; improving public acceptance; saving costs. Current projects (see Table 1-2) include the SACS programme (Sleipner
85
Aquifer for CO2 Storage Monitoring and Research Project) and the EU Research Project, GESTCO (Geological Storage of CO2), where the possibility of storing CO2 in a number of selected geological scenarios is being investigated in various parts of Europe. Estimates of the worldwide CO2 storage capacity of aquifers differ by orders of magnitude. However, there appears to be a consensus that the storage capacity is a few thousand Gt CO2 at the most, the estimate for Europe being 773 Gt CO2. This value is reduced if we only consider aquifers which are covered by an impermeable overlying rock. 4.1.2 Oil and natural gas fields Process Description Storage of CO2 in partially depleted oil or gas fields can be economically attractive. CO2, injected into these fields through bore-holes, drives out residual oil and natural gas, thus extending the economic life of these fields. Two mechanisms are responsible for enhancing oil production - the rise in pressure and a reduction in oil viscosity caused by CO2 absorption in the oil. Storage in oil fields appears to be better than in natural gas fields, because the latter are often already more than 80 % exhausted, whereas the degree of exhaustion of oil fields is generally much lower. Oil fields Development Status - Research Needs Improving oil production by CO2 injection (EOR = Enhanced Oil Recovery) has been practiced for many years. EOR is operated at more than 70 fields throughout the world, using approximately 80 % of the commercially available CO2 – produced mainly from natural sources. From the first CO2 injection project in 1958 in the USA, to tle large miscible floods ongoing in the Permian Basin, Texas, USA, this process has proven to be both profitable and an efficient mechanism for hydrocarbon recovery. As oil and gas assets continue to mature with significant reserves left in the ground, the future of CO2 flooding looks promising. Research needs are identical to those of CO2 storage in aquifers, described above. A large scale research project for the storage of CO2 with EOR is taking place at Weyburn, Canada. This oil field (operated by PanCanadian Resources Ltd.), which has been in production since 1954, is connected to a coal gasification plant in Beulah, USA, via a 330 km pipeline. The CO2
produced there (96 % pure) is compressed to supercritical pressure and injected into the oil field. The CO2 injection - 2500 t CO2/day – started at the end of September 2000. It is expected that EOR will produce an additional volume of approximately 21 Million m³ of oil, i.e., approximately 15 % of the original capacity. In parallel, a 4 year research project was launched in Weyburn, sponsored by the International Energy Agency (IEA), to examine the geochemical and geophysical aspects relating to long-term storage and monitoring of the injected CO2 and the ultimate storage capacity of the field.
86
Other current projects engaged in meeting these needs include: a Micro-Field Experiment (US DOE) in which CO2 is introduced into the West Pearl Queen Oil Field near the town of Hobbs, New Mexico (study of CO2 migration/retention and modelling); injecting waste gas into the Liaohe oilfield in North-East China - Huafu Electrical Appliance Co Ltd. - (suitability of waste gas for EOR and CO2 storage potential); the GEO-SEQ Project (US DOE & partners) with the aim of reducing the costs and risks of geological CO2 storage and shortening the lead-time to implementation; the GESTCO Project (see Section 4.1.1). Process Capacity Estimates of the global CO2 storage capacity in oil reservoirs vary from 147 to 697 Gt CO2 , with an estimate for Europe of 6.2 Gt CO2. The lower figures relate to reservoirs already investigated, whereas the higher values are based on estimates of reservoirs not yet investigated. Table 4-12 shows the capacity estimated under the North Sea – about 5.8 Gt CO2.
Estimated CO2 storage capacity Gt
Depleted oil fields
Depleted gas fields
North Sea Denmark 0.1 0.4 Netherlands 0.0 0.8 Norway 3.1 7.2 UK 2.6 4.9 Total 5.8 13.3
Table 4-2 Capacity of CO2 storage – Estimates for all North Sea
fields (DTI, 2002) Results from EOR operations in the US suggest that the average volume occupied by the injected CO2 represents about 30 % of the volume originally occupied by the oil. Some of the CO2 is dissolved in residual oil and water – an aspect considered within the Weyburn project. Gas fields Development Status - Research Needs In general terms, natural gas fields are shut down when the gas pressure drops below an economically viable level (approximately 30 bar). CO2
injection increases the pressure to an acceptable level (below the original pressure, in order to retain leak-tightness). Since most gas reservoirs are more than 80 % exhausted, enhanced production is limited. However, there should be sufficient profit from additional natural gas sales to offset the CO2 storage costs. The concept has not been fully developed, mainly due to fears that the quality of the gas would be diminished by mixing with the
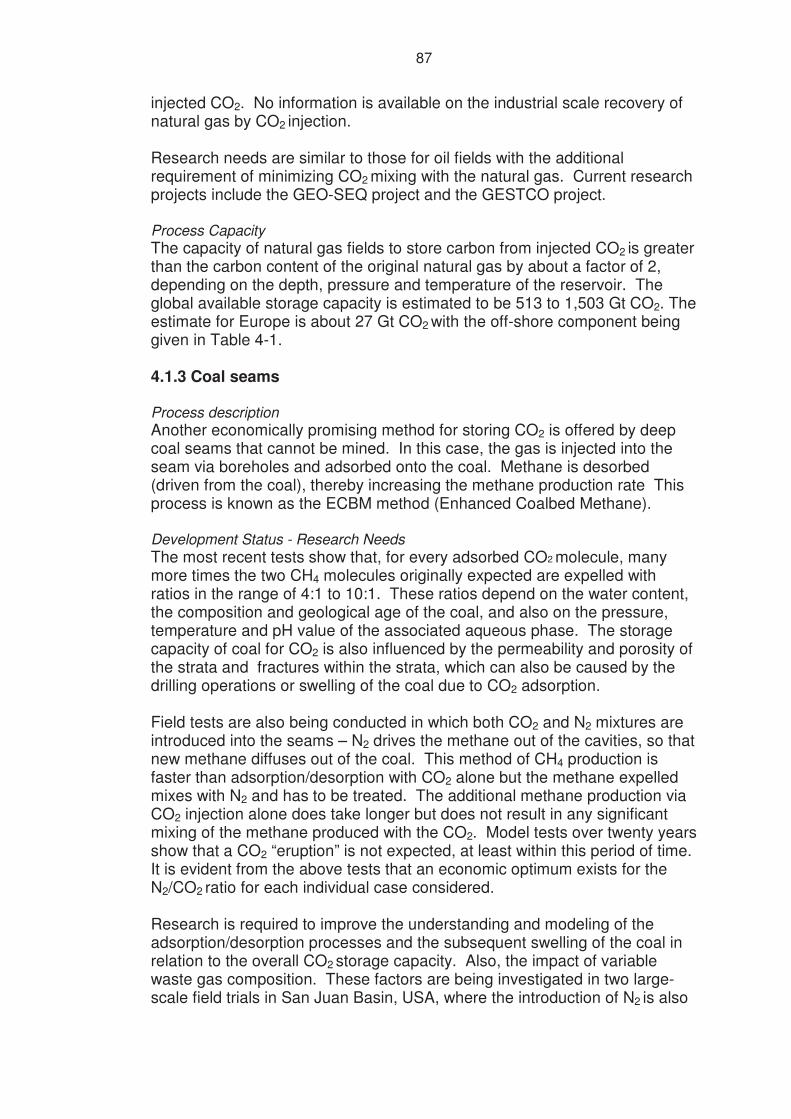
87
injected CO2. No information is available on the industrial scale recovery of natural gas by CO2 injection. Research needs are similar to those for oil fields with the additional requirement of minimizing CO2 mixing with the natural gas. Current research projects include the GEO-SEQ project and the GESTCO project. Process Capacity The capacity of natural gas fields to store carbon from injected CO2 is greater than the carbon content of the original natural gas by about a factor of 2, depending on the depth, pressure and temperature of the reservoir. The global available storage capacity is estimated to be 513 to 1,503 Gt CO2. The estimate for Europe is about 27 Gt CO2 with the off-shore component being given in Table 4-1. 4.1.3 Coal seams Process description Another economically promising method for storing CO2 is offered by deep coal seams that cannot be mined. In this case, the gas is injected into the seam via boreholes and adsorbed onto the coal. Methane is desorbed (driven from the coal), thereby increasing the methane production rate This process is known as the ECBM method (Enhanced Coalbed Methane). Development Status - Research Needs The most recent tests show that, for every adsorbed CO2 molecule, many more times the two CH4 molecules originally expected are expelled with ratios in the range of 4:1 to 10:1. These ratios depend on the water content, the composition and geological age of the coal, and also on the pressure, temperature and pH value of the associated aqueous phase. The storage capacity of coal for CO2 is also influenced by the permeability and porosity of the strata and fractures within the strata, which can also be caused by the drilling operations or swelling of the coal due to CO2 adsorption. Field tests are also being conducted in which both CO2 and N2 mixtures are introduced into the seams – N2 drives the methane out of the cavities, so that new methane diffuses out of the coal. This method of CH4 production is faster than adsorption/desorption with CO2 alone but the methane expelled mixes with N2 and has to be treated. The additional methane production via CO2 injection alone does take longer but does not result in any significant mixing of the methane produced with the CO2. Model tests over twenty years show that a CO2 “eruption” is not expected, at least within this period of time. It is evident from the above tests that an economic optimum exists for the N2/CO2 ratio for each individual case considered. Research is required to improve the understanding and modeling of the adsorption/desorption processes and the subsequent swelling of the coal in relation to the overall CO2 storage capacity. Also, the impact of variable waste gas composition. These factors are being investigated in two large-scale field trials in San Juan Basin, USA, where the introduction of N2 is also
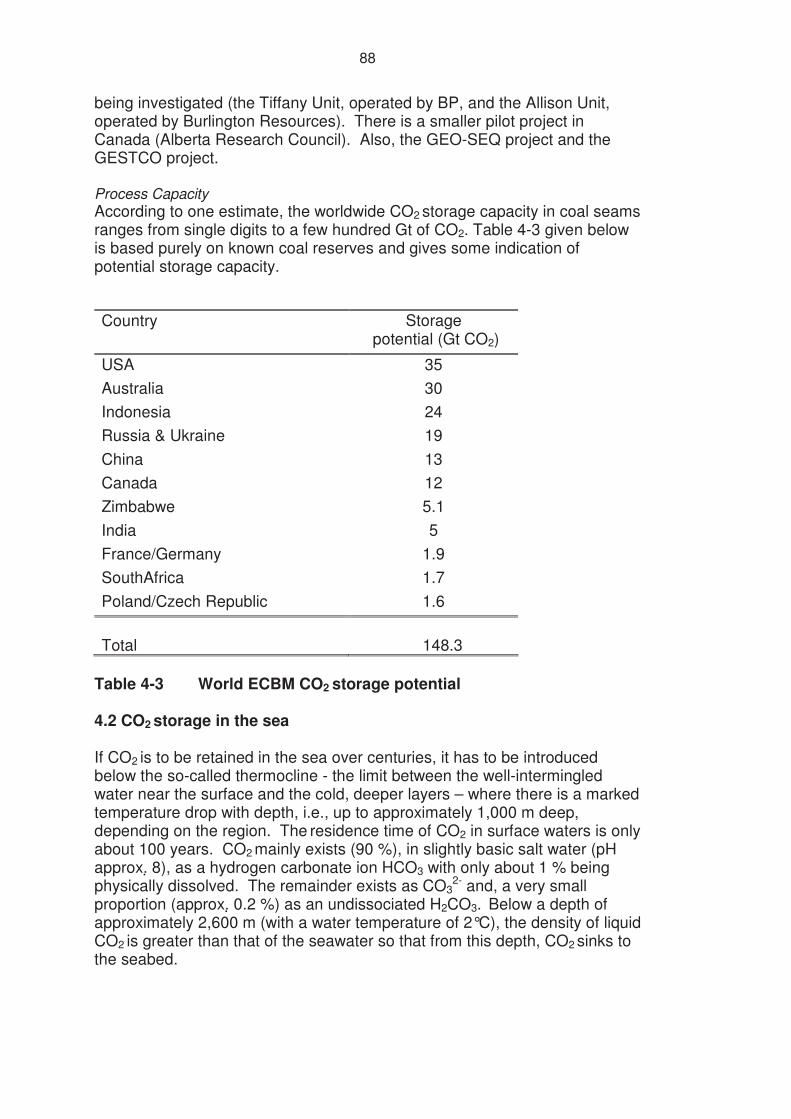
88
being investigated (the Tiffany Unit, operated by BP, and the Allison Unit, operated by Burlington Resources). There is a smaller pilot project in Canada (Alberta Research Council). Also, the GEO-SEQ project and the GESTCO project. Process Capacity According to one estimate, the worldwide CO2 storage capacity in coal seams ranges from single digits to a few hundred Gt of CO2. Table 4-3 given below is based purely on known coal reserves and gives some indication of potential storage capacity.
Country Storage potential (Gt CO2)
USA 35 Australia 30 Indonesia 24 Russia & Ukraine 19 China 13 Canada 12 Zimbabwe 5.1 India 5 France/Germany 1.9 SouthAfrica 1.7 Poland/Czech Republic 1.6
Total
148.3
Table 4-3 World ECBM CO2 storage potential 4.2 CO2 storage in the sea If CO2 is to be retained in the sea over centuries, it has to be introduced below the so-called thermocline - the limit between the well-intermingled water near the surface and the cold, deeper layers – where there is a marked temperature drop with depth, i.e., up to approximately 1,000 m deep, depending on the region. The residence time of CO2 in surface waters is only about 100 years. CO2 mainly exists (90 %), in slightly basic salt water (pH approx. �8), as a hydrogen carbonate ion HCO3 with only about 1 % being physically dissolved. The remainder exists as CO3
2- and, a very small proportion (approx. �0.2 %) as an undissociated H2CO3. Below a depth of approximately 2,600 m (with a water temperature of 2°C), the density of liquid CO2 is greater than that of the seawater so that from this depth, CO2 sinks to the seabed.
89
This process is considered to be not allowed under current international conventions and the impact on the marine life cycle is not fully understood (Section 4.4). 4.3 Storing CO2 as carbonate Captured CO2 can be permanently retained as a carbonate of either magnesium or calcium - abundantly available world-wide in the form of silicates. The carbonation process is at an early stage of development and contains the following steps: mined material is ground and may require thermal pre-treatment in a CO2 atmosphere prior to carbonation with CO2 at 187 bar/155°C. Approximately 80 % of the serpentine (a Mg silicate) is converted to MgCO3 within half an hour under stoichiometric conditions. Dewatered carbonate and silicon oxide are stored in the mine. Sludge is treated in an aqueous solution of NaCl and NaHCO3. Magnesium silicates are preferred since the oxide content of the ore is much higher (35 % to 50 % c.f. 9 to 13 % for CaO deposits). The current process demands more than 40 % of the energy produced in the power plant. About 3.7 t of MgO or 4.7 t of CaO are needed to retain 1 tonne of carbon. A 1 GWe lignite-fired power plant such as BOA Niederaußem (Germany) would require 66,000 t of mineral per day and the disposal of 88,000 t of magnesium carbonate (4 to 5 times greater for CaO). The preferred magnesium silicates are olivine and the more abundant serpentine which contains chrysotile asbestos. The storage of CO2 in carbonates will be investigated further as part of the Zero Emission Coal Alliance (ZECA). 4.4 Legality of CO2 storage 4.4.1 Introduction The EU Directive on Integrated Pollution Prevention and Control (IPPC) of 1996 aims to prevent and, where that is not practicable, to reduce the emissions to air, water and land from industrial processes so as to achieve a high level of protection of the environment, taken as a whole. There is a requirement to use Best Available Techniques (BAT), which are defined in BAT reference documents for each industrial sector, and there is also a requirement to abide by other EU legislation that may apply. The Directive allows industry to propose solutions that minimise impact on the environment as a whole. In the power industry, the selection of a high thermal efficiency would prevent (minimise) CO2 emissions at source. The next priority would be recovery of CO2 as a by-product for subsequent re-use, for example, the production of food grade CO2 for the carbonation of soft drinks. This would displace existing CO2 use and satisfy the general requirements of EU policies directed at environmental protection and waste minimisation. When both prevention and recycling are maximised, the final option is to store recovered CO2 in
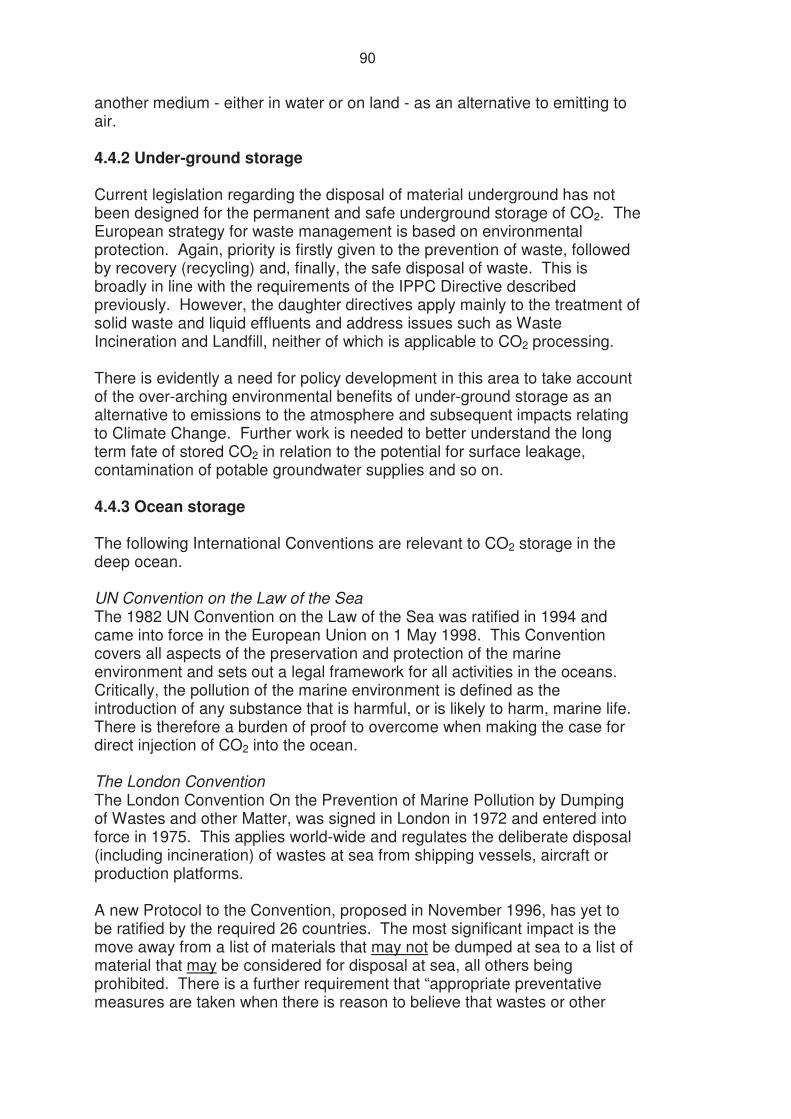
90
another medium - either in water or on land - as an alternative to emitting to air. 4.4.2 Under-ground storage Current legislation regarding the disposal of material underground has not been designed for the permanent and safe underground storage of CO2. The European strategy for waste management is based on environmental protection. Again, priority is firstly given to the prevention of waste, followed by recovery (recycling) and, finally, the safe disposal of waste. This is broadly in line with the requirements of the IPPC Directive described previously. However, the daughter directives apply mainly to the treatment of solid waste and liquid effluents and address issues such as Waste Incineration and Landfill, neither of which is applicable to CO2 processing. There is evidently a need for policy development in this area to take account of the over-arching environmental benefits of under-ground storage as an alternative to emissions to the atmosphere and subsequent impacts relating to Climate Change. Further work is needed to better understand the long term fate of stored CO2 in relation to the potential for surface leakage, contamination of potable groundwater supplies and so on. 4.4.3 Ocean storage The following International Conventions are relevant to CO2 storage in the deep ocean. UN Convention on the Law of the Sea The 1982 UN Convention on the Law of the Sea was ratified in 1994 and came into force in the European Union on 1 May 1998. This Convention covers all aspects of the preservation and protection of the marine environment and sets out a legal framework for all activities in the oceans. Critically, the pollution of the marine environment is defined as the introduction of any substance that is harmful, or is likely to harm, marine life. There is therefore a burden of proof to overcome when making the case for direct injection of CO2 into the ocean. The London Convention The London Convention On the Prevention of Marine Pollution by Dumping of Wastes and other Matter, was signed in London in 1972 and entered into force in 1975. This applies world-wide and regulates the deliberate disposal (including incineration) of wastes at sea from shipping vessels, aircraft or production platforms. A new Protocol to the Convention, proposed in November 1996, has yet to be ratified by the required 26 countries. The most significant impact is the move away from a list of materials that may not be dumped at sea to a list of material that may be considered for disposal at sea, all others being prohibited. There is a further requirement that “appropriate preventative measures are taken when there is reason to believe that wastes or other
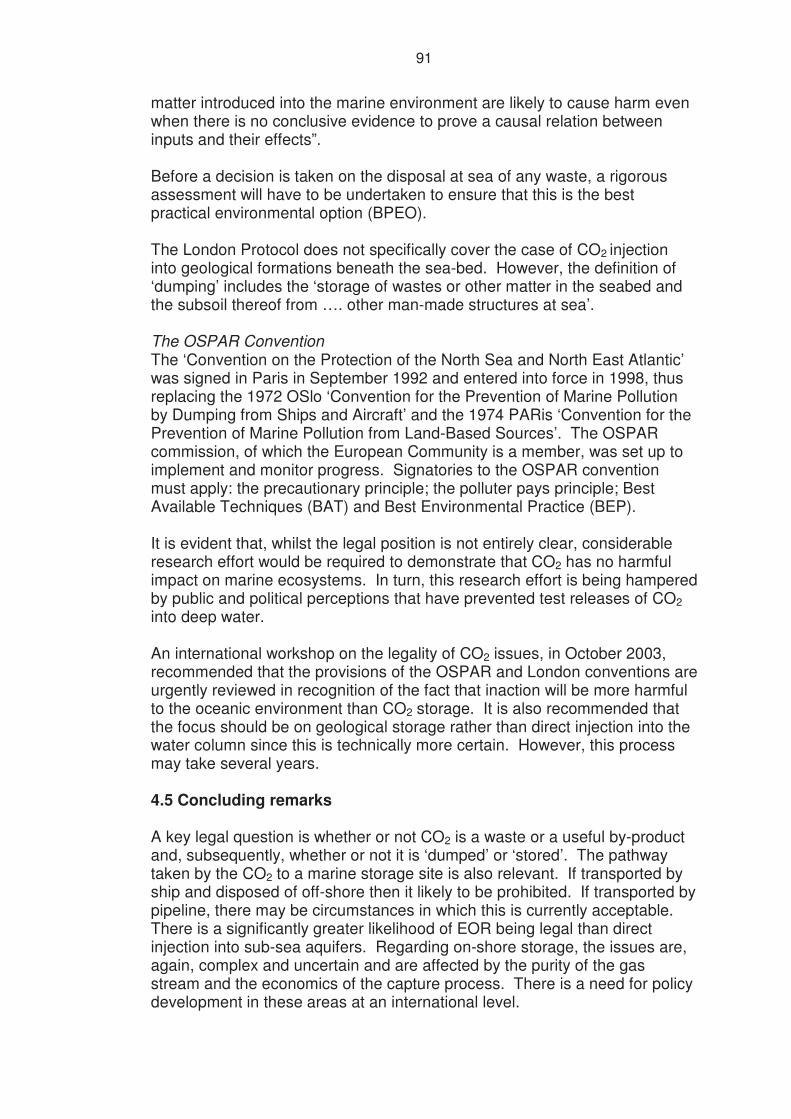
91
matter introduced into the marine environment are likely to cause harm even when there is no conclusive evidence to prove a causal relation between inputs and their effects”. Before a decision is taken on the disposal at sea of any waste, a rigorous assessment will have to be undertaken to ensure that this is the best practical environmental option (BPEO). The London Protocol does not specifically cover the case of CO2 injection into geological formations beneath the sea-bed. However, the definition of ‘dumping’ includes the ‘storage of wastes or other matter in the seabed and the subsoil thereof from …. other man-made structures at sea’. The OSPAR Convention The ‘Convention on the Protection of the North Sea and North East Atlantic’ was signed in Paris in September 1992 and entered into force in 1998, thus replacing the 1972 OSlo ‘Convention for the Prevention of Marine Pollution by Dumping from Ships and Aircraft’ and the 1974 PARis ‘Convention for the Prevention of Marine Pollution from Land-Based Sources’. The OSPAR commission, of which the European Community is a member, was set up to implement and monitor progress. Signatories to the OSPAR convention must apply: the precautionary principle; the polluter pays principle; Best Available Techniques (BAT) and Best Environmental Practice (BEP). It is evident that, whilst the legal position is not entirely clear, considerable research effort would be required to demonstrate that CO2 has no harmful impact on marine ecosystems. In turn, this research effort is being hampered by public and political perceptions that have prevented test releases of CO2 into deep water. An international workshop on the legality of CO2 issues, in October 2003, recommended that the provisions of the OSPAR and London conventions are urgently reviewed in recognition of the fact that inaction will be more harmful to the oceanic environment than CO2 storage. It is also recommended that the focus should be on geological storage rather than direct injection into the water column since this is technically more certain. However, this process may take several years. 4.5 Concluding remarks A key legal question is whether or not CO2 is a waste or a useful by-product and, subsequently, whether or not it is ‘dumped’ or ‘stored’. The pathway taken by the CO2 to a marine storage site is also relevant. If transported by ship and disposed of off-shore then it likely to be prohibited. If transported by pipeline, there may be circumstances in which this is currently acceptable. There is a significantly greater likelihood of EOR being legal than direct injection into sub-sea aquifers. Regarding on-shore storage, the issues are, again, complex and uncertain and are affected by the purity of the gas stream and the economics of the capture process. There is a need for policy development in these areas at an international level.
92
Table 4-4 summarizes the relative merits of the various storage technologies and the range of associated costs. On-shore storage within deep aquifers or caverns appears to be the most economic solution, with the greatest storage potential – far exceeding the total capacity required for the storage of CO2 arising from fossil fuels. The use of depleted gas fields is also attractive. Figure 4-2 and Figure 4-3 show how the storage costs vary with depth and location in these cases. However, the legal issues are not straightforward and it remains to be seen how public perception will develop within individual nations. Injection of CO2 into North Sea oil fields, for enhanced oil recovery, has major potential for early application. Although the costs are higher (Table 4-4), the legal issues are clearer and public perception is likely to be more positive provided that long term security of storage is demonstrated.
Source: GESTCO with analysis by Vattenfall Figure 4-2 Storage cost estimates - aquifers
Source: GESTCO with analysis by Vattenfall Figure 4-3 Storage cost estimates - depleted gas fields

Tabl
e 4-
4 S
umm
ary
of s
tora
ge te
chni
ques
Sto
rage
M
etho
d A
dvan
tage
s D
isad
vant
ages
P
artic
ipat
ing
bodi
es
Cos
t ran
ge
� /
tonn
e
4.1.
1 A
quife
rs
Hig
h av
aila
bilit
y w
orld
-wid
e - m
inim
ises
tran
spor
t N
o ad
ditio
nal i
ncom
e c.
f. E
OR
U
S D
oE, I
EA
GH
G, T
NO
, RIT
E,
BG
R
On-
shor
e 1
- 7
Gre
ates
t pot
entia
l cap
acity
U
ncer
tain
ty re
gard
ing
long
term
rese
rvoi
r sta
bilit
y du
e to
hig
her p
ress
ure/
dens
ity o
f inj
ecte
d C
O2
MIT
& m
any
othe
r uni
vers
ities
O
ff-sh
ore
6 - 1
3
Nat
ural
gas
sto
rage
exp
erie
nce
E
nviro
nmen
tal r
isks
- gr
ound
wat
er o
r sur
face
leak
age
Sta
toil
& o
ther
oil
& g
as
com
pani
es
4.1.
2 O
il fie
lds
Add
ition
al in
com
e fro
m E
OR
U
ncer
tain
ty re
gard
ing
long
term
rese
rvoi
r sta
bilit
y du
e
to h
ighe
r pre
ssur
e/de
nsity
of i
njec
ted
CO
2 U
S D
oE, I
EA
GH
G, T
NO
, RIT
E,
EU
FV
I N
orth
Sea
1
Oil
field
geo
logy
is w
ell k
now
n E
nviro
nmen
tal r
isks
- s
urfa
ce le
akag
e th
roug
h
bore
hole
s P
anC
anad
ian
Res
ourc
es L
td. &
ot
hers
V
alue
1
0 - 1
5
EO
R te
chno
logy
is w
ell e
stab
lishe
d O
il fie
lds
are
muc
h le
ss n
umer
ous
than
aqu
ifers
-
impl
icat
ions
for t
rans
porta
tion
dist
ance
Sho
rt-fa
ll 2
0
Acc
ess
to N
orth
Sea
oil
field
s - a
ppro
achi
ng fi
nal
prod
uctio
n - E
OR
ben
efits
4.1.
2 G
as fi
elds
A
dditi
onal
inco
me
from
ext
ra n
atur
al g
as
Ris
k of
con
tam
inat
ing
natu
ral g
as w
ith C
O2
US
DoE
, IE
A G
HG
, TN
O, R
ITE
O
n-sh
ore
2 - 5
Gas
sto
rage
wel
l pro
ven
(> 3
x1011
m3
unde
rgro
und)
W
orld
-wid
e, n
umbe
r of g
as fi
elds
is li
mite
d (s
igni
fican
t in
Eur
ope)
G
eolo
gica
l Sur
vey
Gro
ups
Off-
shor
e 9
- 11
Nat
ural
CO
2 fie
lds
avai
labl
e to
furth
er re
sear
ch
(e.g
., M
cElm
o D
ome
Fiel
d - C
olor
ado,
>28
3 M
m3 ,
98%
pur
ity)
Env
ironm
enta
l ris
ks -
sur
face
leak
age
thro
ugh
bo
reho
les
4.1.
3 C
oal s
eam
s A
dditi
onal
inco
me
from
ext
ra m
etha
ne
Env
ironm
enta
l ris
ks -
sur
face
leak
age
thro
ugh
bore
hole
s U
S D
oE, I
EA
GH
G, T
NO
, RIT
E,
CS
IRO
N
ot a
vaila
ble
Coa
l dep
osits
ofte
n lo
cal t
o so
urce
(pow
er p
lant
) P
ossi
ble
fract
ures
from
coa
l sw
ellin
g an
d dr
illin
g
oper
atio
ns
Bur
lingt
on R
esou
rces
& o
ther
s
CH
4 al
so in
crea
sed
by a
ssoc
iate
d N
2 in
flue
ga
ses
A
lber
ta R
esea
rch
coun
cil,
Can
ada
4,2
Oce
an
Hug
e st
orag
e ca
paci
ty
Unl
ikel
y to
be
lega
l und
er e
xist
ing
conv
entio
ns
N
ot a
vaila
ble
Rap
id d
eplo
ymen
t U
ncer
tain
ty re
gard
ing
impa
ct o
n m
arin
e lif
e
4,2
Car
bona
te
Sec
ure
long
term
rete
nion
La
rge
mas
s flo
w ra
teso
pf m
iner
al
Los
Ala
mos
Nat
iona
l Lab
orat
ory
15 -
20
Low
env
ironm
enta
l ris
k H
igh
ener
gy c
onsu
mpt
ion
ZEC
A
A
void
ance
of s
erpe
ntin
e w
ith c
hrys
olite
asb
esto
s
93

Not
es1
A s
tudy
of t
he N
orth
Sea
EO
R p
oten
tial h
as b
een
unde
rtake
n by
Kin
der M
orga
n (a
US
CO
2 pi
pelin
e op
erat
or )
and
Els
am (D
anis
h po
wer
com
pany
).
C
ost
estim
ates
for d
elive
ry o
f CO
2 to
the
wel
l-hea
d ar
e ab
out �
35/
tCO
2 , b
ut o
nly �10
to �
15
is li
kely
to b
e pa
id b
y th
e cu
stom
ers,
leav
ing
a sh
ortfa
ll of
abo
ut �
20/
t CO
2 .
T
his
wou
ld h
ave
to c
ome
eith
er fr
om d
irect
gov
ernm
ent
subs
idy,
pai
d fo
r out
of t
he e
xtra
reve
nue
from
the
reco
vere
d oi
l, or
, thr
ough
a ta
x on
CO
2
w
hich
cou
ld b
e re
cove
red
thro
ugh
a tra
ding
sch
eme
by th
e C
O2
prod
ucer
s.
Abb
revi
atio
nsE
OR
Enh
ance
d O
il R
ecov
ery
Par
tici
pati
ng
Bod
ies
US
DoE
U
S D
epar
tmen
t of E
nerg
yIE
A G
HG
Inte
rnat
iona
l Ene
regy
Age
ncy,
Gre
enho
use
Gas
Res
earc
h &
Dev
elop
men
t Pro
gram
me
TNO
RIT
ER
eaes
rch
Inst
itute
of o
f Inn
ovat
ive T
echn
olog
y fo
r th
e E
arth
, Jap
anB
GR
Fede
ral O
ffice
for G
eo-S
cien
ces
and
Raw
Mat
eria
ls, H
anov
erE
U F
VI
Eur
opea
n C
omm
issi
on:
EU
Fra
mew
ork
VI R
&D
Pro
gram
me
CS
IRO
Com
mon
wea
lth S
cien
tific
and
Indu
stria
l Res
earc
h O
rgan
isat
ion,
Aus
tralia
ZEC
AZe
ro E
mis
sion
Coa
l Alli
ance
94
95
4.6 References Adams, E., et al.: “International Experiment on CO2-Ocean Sequestration”, Proceedings of the 4th International Conference on Greenhouse Gas Control Technologies; 30.08. – 02.09.1998, Interlaken, Switzerland. ARI (Advanced Resources International): "Enhanced Coalbed Methane Recovery with CO2 Sequestration", Report No PH3/3, IEA Greenhouse Gas R&D Programme, 1998. Beecy, D. A., et al.: “A Perspective on the Potential Role of Geologic Options in a National Carbon Management Strategy”, First National Conference on Carbon Sequestration, Washington DC, May 15-17, 2001. Benson, S. M., Myer, L.: “The GEO-SEQ Project: First-Year Status Report”, First National Conference on Carbon Sequestration, Washington DC, May 15-17, 2001. Brewer, P. G., et al.: “Experiment on the Ocean Sequestration of Fossil Fuel CO2: pH-Measurements and Hydrate Formation”, Marine Chemistry 72 (2000) pp. 83-93. Brown, K., et al.: “Role of Enhanced Oil Recovery in Carbon Sequestration - The Weyburn Monitoring Project, a Case Study”, First National Conference on Carbon Sequestration, Washington DC, May 15-17, 2001. Freund, P., Reilly, N.: “Review into the Feasibility of CO2 Capture and Storage in the UK”, Situation Paper by the IEA Greenhouse Gas and the British Geological Survey http://www.dti.gov.uk/energy/coal/cct/co2capture.shtml Hanisch, C.: “The Pros and Cons of Carbon Dioxide Dumping”, Environmental Science & Technology 32(1), 20 A - 24 A, January 1, 1998. Hendriks, C. A., et al.: “Costs of Carbon Dioxide Removal by Underground Storage”, 5th International Conference on Greenhouse Gas Control Technologies (GHGT-5), Cairns, Australia, August 13-16, 2000. Herzog, H.: “Ocean Sequestration of CO2 – an Overview”, Proceedings of the 4th International Conference on Greenhouse Gas Control Technologies; 30.08. – 02.09.1998, Interlaken, Switzerland. Herzog, H., et al.: “Capturing Greenhouse Gases”, Scientific American, February 2000, pp. 72 – 79. Herzog, H.: “What Future for Carbon Capture and Sequestration?”, Environmental Science & Technology 35, (2001) Issue 7 , pp. 148 A - 153 A.
96
Herzog, H., et al.: “CO2 Capture, Reuse and Storage Technologies for Mitigating Global Climate Change”, Massachusetts Institute of Technology, January 1997. IEA GHG: IEA Greenhouse Gas R&D Programme Task 1, Joule II “The Underground Disposal of Carbon Dioxide”, Project Summary 001 combined with 005, March 1996. IEA GHG: “Abatement and Mitigation of Carbon Dioxide Emissions from Power Generation”, IEA Greenhouse Gas R&D Programme, 1998. IEA GHG: “Carbon Dioxide Disposal from Power Stations”, IEA Greenhouse Gas R&D Programme, 1994. IEA GHG: “CO2 Storage in Saline Aquifers”, IEA Greenhouse Gas R&D Programme, 2000. IEA GHG: „Ocean Storage of CO2”, IEA Greenhouse Gas R&D Programme, 1999. Lackner, K. S, et al.: “Carbon Dioxide Disposal in Solid Form”, Proceedings of the 21st International Conference on Coal Utilization and Fuel Systems, Clearwater, Florida; March 18-21, 1996. Lackner, K. S., Ziock, H.-J.: “The US Zero Emission Coal Alliance Technology”, VGB PowerTech 81 (2001), Issue. 12, pp. 57 - 61. Law, H. S., et al.: “Comparison of Numerical Simulators for Greenhouse Gas Storage in Coalbeds, Part I: Pure Carbon Dioxide Injection”, First National Conference on Carbon Sequestration, Washington DC, May 15-17, 2001. May, F., et al.: „Untertagespeicherung von CO2“, VGB PowerTech 82 (2002), Issue 8, pp. 45 – 50, (in German). Monterey Bay Aquarium Research Institute: “Researchers' Report On Possible Biological Effects Of Deep-Sea CO2 Sequestration”, Press Release 15.10.2001. Mourits, F.: “Advances in CO2 Capture and Storage and Zero Emission Technologies in Canada”, JCOAL Seminar on Global Environment, Tokyo, 22 January 2001. Ormerod, W. G., et al.: “Ocean Storage of CO2”, IEA Greenhouse Gas R&D Programme, February 1999. Pruess, K., et al.: “Numerical Modeling of Aquifer Disposal of CO2”, SPE/EPA/DOE Exploration and Production Environmental Conference, San Antonio, Texas, February 2001.
97
Reeves, S.: “Geologic Sequestration of CO2 in Deep, Unmineable Coalbeds: An Integrated Research and Commercial-Scale Field Demonstration Project”, First National Conference on Carbon Sequestration, Washington DC, May 15-17, 2001. Schroeder, K., et al.: “Sequestration of Carbon Dioxide in Coal Seams”, First National Conference on Carbon Sequestration, Washington DC, May 15-17, 2001. Smith, L. A., et al.: “Engineering and Economic Assessment of Carbon Dioxide Sequestration in Saline Formations”, First National Conference on Carbon Sequestration, Washington DC, May 15-17, 2001. Stanton, R., et al.: “Coal Bed Sequestration of Carbon Dioxide”, First National Conference on Carbon Sequestration, Washington DC, May 15-17, 2001. Stevens, S. H., et al.: “Sequestration of CO2 in Depleted Oil and Gas Fields: Global Capacity, Costs, and Barriers”, 5th International Conference on Greenhouse Gas Control Technologies (GHGT-5), Cairns, Australia, August 13-16, 2000. Tamburri, M. N., et al.: “A Field Study of the Effects of CO2 Ocean Disposal on Mobile Deep-Sea Animals”, Marine Chemistry 72 (2000) pp. 95-101. Torp, T. A./Statoil: "SACS - Saline Aquifer CO2 Storage”, Final Technical Report, 2000. US DOE: “Carbon Sequestration Research and Development”, Report # DOE/SC/FE-1, 1999. Westrich, H., et al.: “Sequestration of CO2 in a Depleted Oil Reservoir: An Overview”, First National Conference on Carbon Sequestration, Washington DC, May 15-17, 2001. Zhu, C., et al.: “An EOR Application at Liaohe Oil Field in China”, First National Conference on Carbon Sequestration, Washington DC, May 15-17, 2001. Ziock, H.-J., et al.: “The Need and Options Available for Permanent CO2 Disposal”, React. Eng. Pollut. Prev. 41 – 49 (2000).
98
5 TRANSPORTATION SYSTEMS FOR CO2 – APPLICATION TO
CARBON CAPTURE AND STORAGE 5.1 General Commercialization of carbon capture and storage from fossil fuelled power plants requires an infrastructure for transportation of captured carbon dioxide (CO2) from the sources of emission to the storage sites. This chapter discusses costs for a future transportation infrastructure with respect to capacity, distance, means of transportation, and storage location (on- and offshore). Some assumptions and basic calculation conditions used in this chapter are: - Depreciation time: 25 years - Interest rate: 5 % - Costs for initial compression of CO2 before transport: Not included in
transport cost calculation. Initial compression is here regarded as a part of the power plant process, and not a part of the transport. Though, occurring need for booster compression along the route is included. REMARK: The initial compression cost can be as large as the transport cost itself, and is sometimes included in transport calculations (Wildenborg).
Feasible transportation alternatives are shipping vessels, pipelines for offshore transportation and pipelines for onshore transportation. A future transportation infrastructure, compiled by these means of transportation, from a demonstration plant with a capacity of 200 MWe (1Mt/y of CO2) will have a transportation cost of 1 /tonne up to 6 /tonne of CO2 depending on storage location. Corresponding figure for a system of several large 1,000 MWe power plants (40 Mt/y up to 300 Mt/y of CO2) with storage offshore is 2
/tonne of CO2. It is here assumed that the planning and localization process for new power plants can be integrated with the planning of transportation infrastructure for CO2, in such a way that transportation distances can be kept reasonably short. Furthermore it is assumed that such CO2 operations will reach a mature status and cost level in Europe. During initial steps the CO2 transports can be more costly. 5.2 Transportation systems After the CO2 have been captured at the sources of emission, the CO2 would have to be transported to the storage sites. Such transportation will require a large-scale infrastructure, due to the large volumes. The volumes will in a minimum case be 1 to 2 Mt/y of CO2, an amount that corresponds to the emissions from a coal-fired power plant with a power production of 100 to 200 MWe. Corresponding amount for a 1,000 MWe coal-fired power plant would be 5 Mt/y of CO2.
¡¡
¡
99
5.2.1 Existing CO2 transportation systems At present, pipelines are the most commonly used means of transportation for such large quantities of CO2. Several million tonnes of CO2 are annually transported, mainly in the USA, over long distances onshore in high-pressure pipelines for use in the Enhanced Oil Recovery (EOR) industry (Gale and Davidson, 2002). Using CO2 in EOR projects has the advantage of adding a value to the CO2; e.g. oil producers in the USA are willing to pay between 9$/tonne to 18$/tonne of “end of pipe” delivered CO2 (Doctor et al., 2000). Pipelines for offshore transportation of CO2 have not been applied yet, but are technologically feasible (Skovholt, 1993) and a CO2 pipeline infrastructure offshore is investigated in the CO2 for EOR in the North Sea (CENS) project (Markussen et al., 2002). Other means of transportation that can be used are motor carriers, railway and shipping vessels. Experiences from these means of transportation are mainly found in the food and brewery industry, and the amounts transported are in the range of some 100,000 tonnes of CO2 annually. Experiences from the Liquefied Petroleum Gas (LPG) industry could also be used in the establishment of a large-scale infrastructure, this since the transportation conditions for LPG have many similarities with those for CO2 (Ormerod et al., 2002). The physical condition regarding pressure and temperature, which is suitable for transportation by road, rail or water, is the liquid state, and for transportation by pipelines the supercritical/dense phase (see Fig. 2-11: CO2 phase diagram). The other two conditions, i.e. the solid and gaseous phase, are not suitable, since they are in the solid form very energy consuming to produce (Haugen and Eide, 1996) and that in the gaseous phase has too low a density. For pipelines the supercritical/dense phase is preferable due to that this phase is relatively stable compared to the liquid state, which minimizes cavitations problems in components such as booster stations and pumps (Fox, 2002). The density for CO2 as liquid and as supercritical/dense phase approaches 1,000 kg/m3 in both cases. 5.2.2 Intermediate storage Pipeline has the advantage of providing a steady state flow, i.e. a continuous flow from the emission source to the final storage site. The other means of transportation must include appropriate intermediate storage facilities to handle the loading and reloading of CO2, e.g. at harbours. There are two main technologies for intermediate storage of LPG, either underground in rock shelters or in large steel tanks above ground. At present only the steel tank technology is used for CO2 but both technologies can be utilized. Existing rock shelters for LPG have storage capacities of up to around 500,000 m3 LPG (Söder, 2002), which should approximately correspond to 500,000 tonnes of CO2. Existing steel tanks for storage of CO2 have capacities up to 3,000 tonnes (JØrgensen, 2002).
100
Rock shelters within the LPG industry are constructed in two different ways, either as pressurized or as cooled shelters. If the shelters are intended for storage of CO2 these techniques must be combined to create favorable conditions with respect to pressure and temperature. The cost for building a rock shelter depends mainly on the rock quality. Poor rock quality increases the need for lining and reinforcement of the rock, which increases costs (Söder, 2002). 5.2.3 Safety issues CO2 is not toxic but can be fatal, due to asphyxiation, at concentrations exceeding around 10 % by volume (JØrgensen, 2002), levels that can be achieved at a discharge due to that CO2 is heavier than air and, hence, will tend to collect in depressions. Statistics from the EOR industry shows that the risks for pipeline leakage are lower than for natural gas or hazardous pipelines (Gale and Davidson,2002), but to minimize risks CO2 should be transported routed away from large centers of population. Another safety issue, which indirect affects the transportation, is the public opinion concerning storage of CO2. Onshore storage is believed to face difficulties with acceptance from the public, most likely as a Not In My Back Yard (NIMBY) problem, which means that the public and authorities might think that onshore disposal is legal and legitimate, but they do not want the facilities in their own area. The concept of offshore disposal is considered to be safer, on the basis of leakage, than onshore and could therefore more easily be implemented with the support of the public. However, onshore storage obviously enables storage near the emission source in some cases. As a comparison, offshore disposal requires a longer route and more complex and costly logistic infrastructure together with expensive disposal facilities. 5.3 Transportation costs The capacity (Mt/y) and transportation cost ( /tonne CO2) for each means of transportation are given in Figure 5-1, which summarizes the costs for the transportation alternatives using a fictive transportation distance of 250 km and a depreciation time of 25 years at 5 % interest rate (Odenberger and Svensson, 2003). As can be seen in Figure 5-1, shipping and pipelines are competitive means of transportation, while the other two means of transportation, i.e. railway and motor carriers, are too expensive and lack capacity. For smaller transport volumes though and for startup purposes both rail and road transport might be considered. Excluded in Figure 5-1 are the costs for intermediate storage. Such costs are shown in Table 5-1, which gives the costs for both steel tanks and rock shelters for two fictive cases (depreciation time 25 years at 5 % interest rate) (Odenberger and Svensson, 2003).
¡
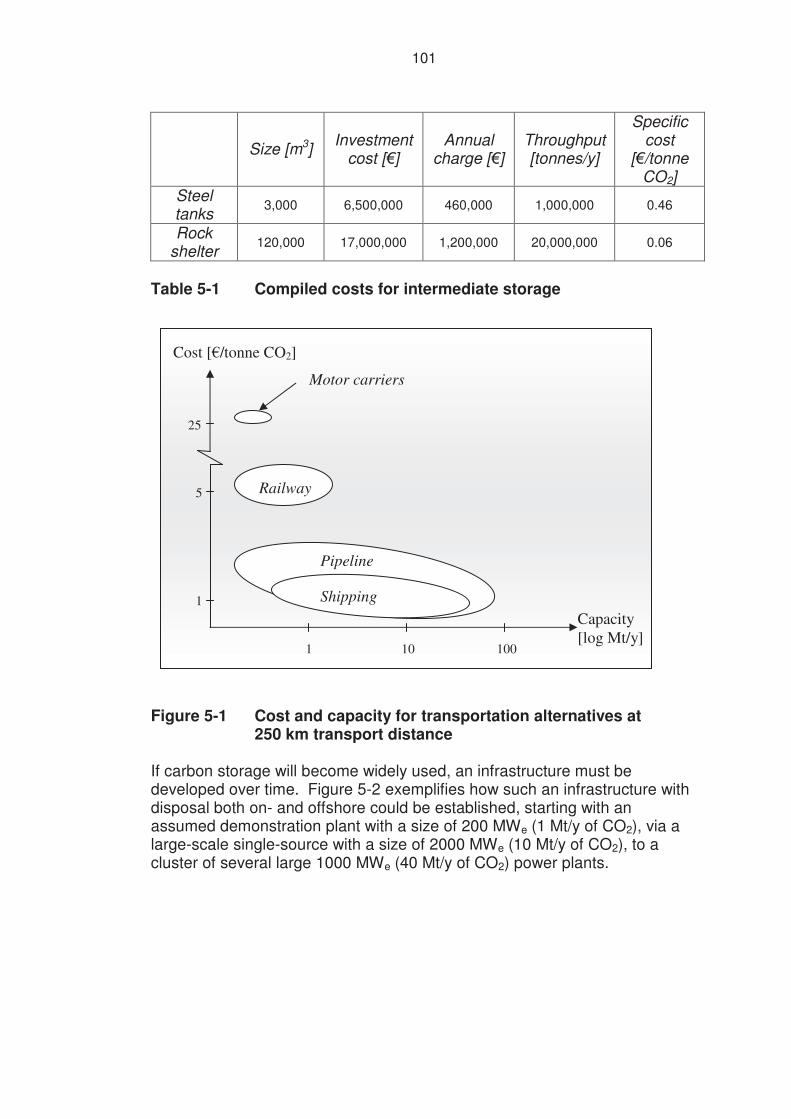
101
Size [m3] Investment cost [�]
Annual charge [�]
Throughput [tonnes/y]
Specific cost
[�/tonne CO2]
Steel tanks
3,000 6,500,000 460,000 1,000,000 0.46
Rock shelter
120,000 17,000,000 1,200,000 20,000,000 0.06
Table 5-1 Compiled costs for intermediate storage
Figure 5-1 Cost and capacity for transportation alternatives at 250 km transport distance If carbon storage will become widely used, an infrastructure must be developed over time. Figure 5-2 exemplifies how such an infrastructure with disposal both on- and offshore could be established, starting with an assumed demonstration plant with a size of 200 MWe (1 Mt/y of CO2), via a large-scale single-source with a size of 2000 MWe (10 Mt/y of CO2), to a cluster of several large 1000 MWe (40 Mt/y of CO2) power plants.
Railway
Pipeline
Cost [�/tonne CO2]
Capacity [log Mt/y]
Shipping
Motor carriers
1
5
25
1 10 100
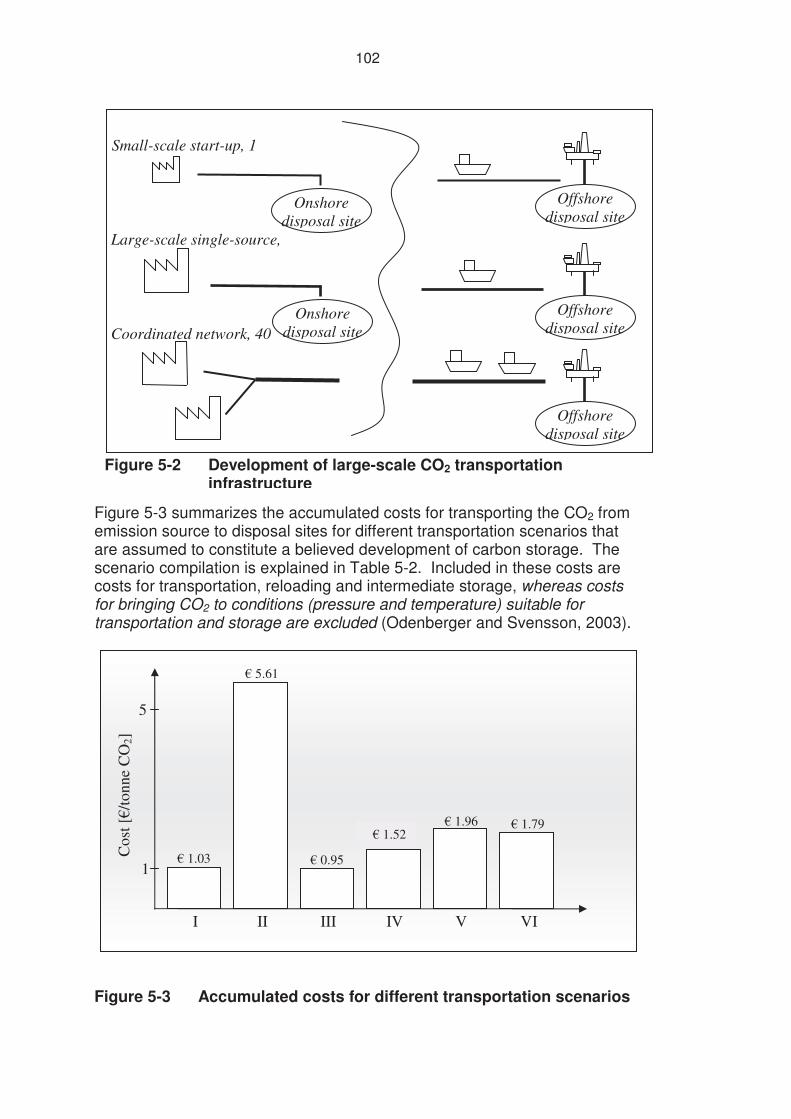
102
Figure 5-3 summarizes the accumulated costs for transporting the CO2 from emission source to disposal sites for different transportation scenarios that are assumed to constitute a believed development of carbon storage. The scenario compilation is explained in Table 5-2. Included in these costs are costs for transportation, reloading and intermediate storage, whereas costs for bringing CO2 to conditions (pressure and temperature) suitable for transportation and storage are excluded (Odenberger and Svensson, 2003).
Figure 5-3 Accumulated costs for different transportation scenarios
Cos
t [�
/tonn
e C
O2]
1
5
� 1.03
� 5.61
� 0.95
� 1.96 � 1.79
I II III IV V VI
Small-scale start-up, 1
Large-scale single-source,
Coordinated network, 40
Onshore disposal site
Onshore disposal site
Offshore disposal site
Offshore disposal site
Offshore disposal site
Figure 5-2 Development of large-scale CO2 transportation infrastructure
� 1.52
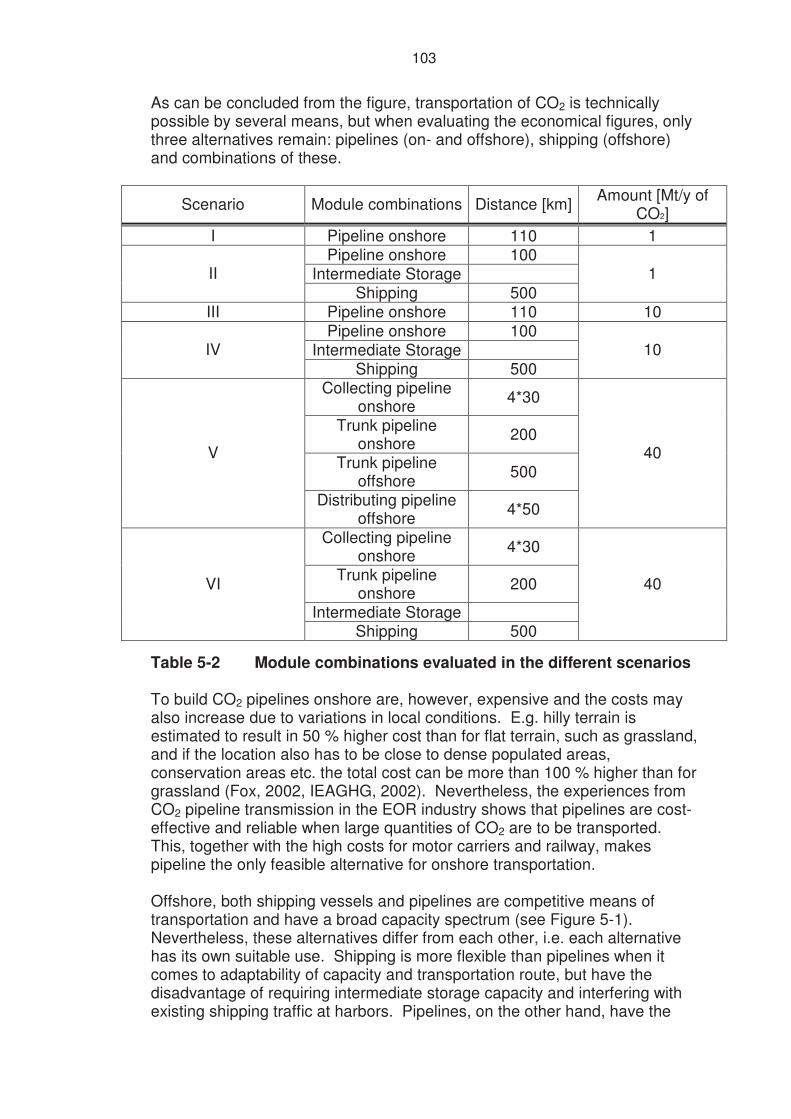
103
As can be concluded from the figure, transportation of CO2 is technically possible by several means, but when evaluating the economical figures, only three alternatives remain: pipelines (on- and offshore), shipping (offshore) and combinations of these.
Scenario Module combinations Distance [km] Amount [Mt/y of CO2]
I Pipeline onshore 110 1 Pipeline onshore 100
Intermediate Storage II Shipping 500
1
III Pipeline onshore 110 10 Pipeline onshore 100
Intermediate Storage IV Shipping 500
10
Collecting pipeline onshore 4*30
Trunk pipeline onshore 200
Trunk pipeline offshore 500
V
Distributing pipeline offshore 4*50
40
Collecting pipeline onshore 4*30
Trunk pipeline onshore 200
Intermediate Storage
VI
Shipping 500
40
Table 5-2 Module combinations evaluated in the different scenarios To build CO2 pipelines onshore are, however, expensive and the costs may also increase due to variations in local conditions. E.g. hilly terrain is estimated to result in 50 % higher cost than for flat terrain, such as grassland, and if the location also has to be close to dense populated areas, conservation areas etc. the total cost can be more than 100 % higher than for grassland (Fox, 2002, IEAGHG, 2002). Nevertheless, the experiences from CO2 pipeline transmission in the EOR industry shows that pipelines are cost-effective and reliable when large quantities of CO2 are to be transported. This, together with the high costs for motor carriers and railway, makes pipeline the only feasible alternative for onshore transportation. Offshore, both shipping vessels and pipelines are competitive means of transportation and have a broad capacity spectrum (see Figure 5-1). Nevertheless, these alternatives differ from each other, i.e. each alternative has its own suitable use. Shipping is more flexible than pipelines when it comes to adaptability of capacity and transportation route, but have the disadvantage of requiring intermediate storage capacity and interfering with existing shipping traffic at harbors. Pipelines, on the other hand, have the
104
advantage of being able to handle large quantities with less complex logistics due to the steady-state flow, which also eliminates the need for intermediate storage. Pipelines do, however, require the development of totally new infrastructures, which means great capital investments. This highly affects the cost per tonne of CO2, especially for long-distance small-scale pipelines. In summary, it seems that a future transportation system offshore will include both shipping and pipeline, this to obtain flexibility and good handling of large quantities of CO2. Expected development and future visions As expected, onshore disposal near the location of the power station is preferable (see Figure 5-3, bar I and III). A short distance also enables transportation from small power stations (~1 Mt/y of CO2) at a low specific cost. Relocation of power plants due to this new factor might be a future consequence. Supply of cooling water, fuel supply, access to the electric grid and transportation of CO2 might be the four factors governing localizations of future plants. Plants burning lignite might not be relocated though, as these power plants are situated near the fuel reserves and electricity consumers in order to minimize freight and transmission costs. It is however believed that the CO2 infrastructure is both less expensive and less complex compared to the solid-fuel and the electricity transmission infrastructure. This is because the CO2 can be transported at a steady-state flow in a pipeline, whereas solid-fuel transportation mostly is carried out by railway and electricity transmission suffers from losses (Davidson et al., 2001). From a European perspective, offshore disposal probably will be the first alternative in order to take advantage of early EOR opportunities at the oil fields in the North Sea and to reach acceptance – the latter believed to be easier offshore. The ongoing CENS project have estimated the EOR storage capacities in the North Sea to 680 Mt of CO2, and due to that the fields already have reached a mature state, the injection of CO2 would have to start soon (Markussen et al., 2002). The economy effects of scale are however, significant for CO2 transportation offshore (cf. bar II and IV, Figure 5-3). Hence, a small-scale start-up power plant will, due to the scale effects, have high specific costs per tonne. This makes a single-source, which is geographically located near a disposal site, a competitive alternative in a start-up of carbon capture and storage. Further, the economy of scale is advantageous for a system of several CO2 sources (power plants) if connected to a common transport network. When increasing size for pipelines and shipping, the capacity grows faster than the cost (cf. Figure 5-1). If thereto the infrastructure costs are shared by several power plants, the result is more cost-effective, (cf. scenario IV with scenarios V and VI in Figure 5-3 and Table 5-2). The scenarios V and VI show a situation where four power plants, each producing 10 Mt/y of CO2, are ideally located to connect to a common trunk pipeline onshore, followed by a trunk pipeline offshore or shipping offshore. The distance calculated corresponds
105
approximately to transport from a region in central Germany, south of Berlin, to a region in the North Sea close to the west coast of Denmark. Longer distances will increase the costs proportionally. Thus, for large power stations located far from disposal sites, a coordinated network is the only option left in order to create an economically defendable solution for transportation of CO2. A single network is, however, believed to have an upper capacity limit, although not because of technological limitations. The fossil-fuelled power industry within the European Union (EU) emits approximately 1,000 Mt/y of CO2 (Eurostat, 1999). If it is assumed to capture and store one third of this, i.e. about 300 Mt/y of CO2. This amount of CO2 cannot be collected from a single source or local area, but needs to be collected from power plants located all over the EU. Hence, a single large network with this capacity leads to long transportation distances to the main trunk lines. Even if such a large-scale network in a future perspective could be designed to be cost-effective, there are other factors, legal and geological, that are to be considered. It is not possible for a single disposal site to receive CO2 at this rate for a long period of time, except for the aquifers under the North Sea. Hence, a future large-scale vision for transportation of CO2 will probably consist of several coordinated networks, from suitable areas to different suitable disposal sites, with capacity and assembly similar to the coordinated network in Figure 5-2. These large-scale coordinated networks must in future be linked together in a similar way as the pipeline grids for transportation of natural gas have been built; this to improve flexibility and provide economies of scale. Studies in the natural gas pipeline industry have shown that there is much to gain by the establishment of trading markets for transportation capacities in pipelines (Raineri and Kuflik, 2003), which in the extension lower the costs and brings up the capacity. 5.4 Summary At present, CO2 transportation is performed on- and offshore by several means of transportation – motor carriers, railway, shipping and pipelines – and all these alternatives can, in principle, be applied in a future large-scale transportation system for CO2, recovered from the industry. Considering the very large scale of transportation in future and the economics, three main alternatives remain: shipping (offshore), pipeline (on- and offshore) and combinations of these. Offshore, ship and pipeline transportation show similar cost per tonne of CO2 transported, but each alternative has its own niche of application. Hence, a combination of pipelines and shipping will probably be the most cost-effective alternative for offshore transportation. Further, it is obvious that pipeline transportation is the only reasonable alternative for onshore transportation in a large scale. Of course disposal near the source location is the least expensive transportation alternative. This might be estimated at levels down to 1 /tonne of CO2, which might be applicable to transportation of CO2 for smaller power stations (200 MWe).
¡
106
The transportation costs to an offshore disposal site for such a demonstration plant are about 6 /tonne of CO2 utilizing shipping. For a fully developed large-scale infrastructure (40 Mt/y up to 300 Mt/y of CO2) with storage offshore, the transportation costs will be around 2 �/tonne of CO2. Hence, there is much to gain by establishing large-scale systems. The costs calculated can be regarded as reachable target levels. Initial steps can show higher typical costs. CO2 pipeline transportation systems and operation, compared to similar facilities for natural gas, adds other critical factors such as decompression temperature, problems when shifting operation condition, need for special elastomers in sealing materials etc., and are more difficult to design, build and operate. Long and successful American experience of CO2 for enhanced oil recovery exist, but the lack of European experiences from CO2 pipelines is a problem that cannot be neglected in future carbon capture and storage (CCS) projects. However, storage only may not be an option for a first demonstration project of this size. The most probable first way to enter such a system development for capture of CO2 is to utilize the possibilities opened by the need of CO2 for enhanced oil or gas recovery also in Europe. This is the probable starting step, for which the interest is increasing. However, it needs to be recognized that there are legal issues relating to storage of CO2 underground that have yet to be resolved (Section 4.4). The figures discussed can be compared with the economical target for cost-effective methods for carbon avoidance, set by the European Climate Change Programme (ECCP), of less than 20 �/tonne of CO2 (European Commission, 2001). 5.5 References Davidson, J., et al.: “Putting Carbon Back into the Ground”, Cheltenham: IEAGHG, 2001. Doctor, R.D., et al.: “Transporting Carbon Dioxide Recovered from Fossil-Energy Cycles”, Fifth International Conference on Greenhouse Gas Control Technologies, Cairns, August 13-16, 2000, 567-571. European Commission European Climate Change Programme, Long Report, June 2001, URL: http://europa.eu.int/comm/environment/climat/eccp_longreport_0106.pdf. Eurostat: “Towards Environmental Pressure Indicators for the EU”, Luxembourg: Office for Official Publications of the European Communities, 1999. Fox, C.: Kinder Morgan CO2 Company – Pipeline logistics, private communication, 2002.
¡
107
Gale, J., Davidson, J.: “Transmission of CO2 – Safety and Economic Considerations”, Sixth International Conference on Greenhouse Gas Control Technologies, Kyoto, September 1-4, 2002. Golomb, D.: “Transport Systems for Ocean Disposal of CO2 and their Environmental Effects”, Energy Conversion & Management, Vol. 38, 279-286, 1997. Haugen, H.A., Eide, L.I.: “CO2 Capture and Disposal”, Energy Conversion & Management, Vol. 37, 1061-1066, 1996. IEA GHG: “Pipeline Transmission of CO2 and Energy”, Woodhill engineering consults. Report number: PH 4/6, March 2002. Jørgensen, T.: Hydro Gas & Chemicals – CO2 handling, private communication, 2002. Markussen, P., et al.: “A CO2 – Infrastructure for EOR in the North Sea (CENS): Makroeconomic Implications...”, Sixth International Conference on Greenhouse Gas Control Technologies, Kyoto, September 1-4, 2002. Odenberger, M., Svensson, R.: “Transportation systems for CO2 – Application to Carbon Sequestration”, MSc Thesis, Chalmers University of Technology, Dept. of Energy Conversion, 2003, URL:http://www.entek.chalmers.se/~klon/msc/. Ormerod, W.G., et al.: “Ocean Storage of CO2”, Cheltenham: IEAGHG, 2002. Raineri, R.B., Kuflik, A.T.: “Secondary Market and Futures Market for the Provision of Gas Pipeline Transportation Capacity”, The Energy Journal, Vol. 24, No. 1, 23-47, 2003. Skovholt, O.: “CO2 Transportation System”, Energy Conversion & Management, Vol. 34, 1095-1103, 1993. Söder, P.: SwedPower AB – Rock shelter construction, private communication, 2002. Wildenborg, A.F.B., van der Meer, L.G.H., TNO-NITG: “The Use of Oil, Gas and Coal Fields as CO2 Sinks”, IPCC workshop on carbon dioxide capture and storage, 2002, http://www.nrcan.gc.ca/es/etb/cetc/combustion/co2network/pdfs/ipcc_geological_storage2.pdf.
108
6 OVERALL CONCLUSIONS Numerous concepts for CO2 capture from power processes have been proposed. These concepts are in various development stages, and have consequently various time frames for possible commercial application in power plants. Many of the concepts also have a considerable remaining research and development effort before they can be fully deployed. Three major concepts are identified: Post-combustion capture, pre-combustion capture and O2/CO2 recycle (oxyfuel) combustion. These are based mainly on existing technologies and require a relatively modest development effort prior to application on commercial plants. They can be demonstrated at a large scale within the near future (possibly within ten years) and can be adopted for both coal and natural gas fired power plants. The main development challenge is to decrease the energy demand from the capture process, which, currently, could reduce the power plants’ efficiency by up to 20 percent. A further challenge is to reduce the additional equipment costs for the capture process. A reduced efficiency increases the amount of fuel needed to produce 1 kWh of electricity which in turn, together with increased equipment costs, leads to a higher cost of electricity. To address these challenges, integration possibilities and scale-up aspects need to be further examined, in order to identify a) optimal process configurations, b) the most promising technology choices and c) to increase the accuracy of cost estimates. The plant components used in the analysis are often based on those used in different applications and, since the end technology is new, a substantial development of also existing technology is also required. It is also important that traditional power plant technology is continuously developed since a higher power plant efficiency reduces the quantity of CO2 that needs to be captured and therefore also reduces the efficiency and cost penalties related to CO2 capture. It should also be recognised that power plant and CO2 capture technologies, as well as the optimisation of power plant concepts, with and without CO2 capture, are developing continuously. The efficiencies and calculated costs presented in this report reflect the knowledge base of 2003. It is likely that the ongoing developments will result in higher efficiency and lower cost penalties for CO2 capture in studies that are already underway. CO2 is currently transported on-and off-shore by several means. In North America, for example, quantities of CO2 of the same order of those emitted from large power plants, are transported on-shore by means of pipelines. For large quantities, this represents the only economically feasible on-shore transport alternative. For CO2-transport off-shore, evaluations show that pipelines and/or ships will become the most cost-effective alternatives.
109
Of course, the specific transport costs (EUR/tonne CO2) increase with the transportation distance. On the other hand, the costs decrease as the quantity to be transported increases. Self-evidently, it is therefore important to aim for short transport distances - especially for the CO2 produced from small (e.g. 200 MWel) demonstration plants. Longer transport distances will only become economically viable for large power plants. Co-ordinated networks, collecting CO2 from several power plants within the same region, will reduce the specific costs further. Regarding CO2 storage, the use of deep geological formations is generally considered to be the only feasible option within foreseeable timeframes. The three basic types of geological formations that are widespread and are estimated to have adequate CO2 storage potentials are deep saline aquifers, oil and gas reservoirs and deep, unmineable, coal seams. Of these, deep aquifers are estimated to have the largest storage potential both within Europe and on a world-wide basis. However, the injection of CO2 into partially depleted oil fields using it for Enhanced Oil Recovery (EOR) can be economically attractive. Since additional oil, otherwise not recoverable, is produced, the economic life of these fields is extended. The fact that CO2 has been used for EOR in recent decades at several oil fields throughout the world and that CO2 has also been injected into the Utsira aquifer underneath the North Sea since 1996, proves both that EOR and storage in deep aquifers are technically feasible. The main issues to clarify by ongoing and continued R&D are the more accurate estimation of storage capacity and the assurance of sufficiently long retention times for the safe storage of CO2 with no harmful effects on human health or the environment when utilizing a given storage site. This includes: the development of criteria for storage site selection, characterisation of the overlying caprock, monitoring and modeling of CO2 retention or migration, improvement of the knowledge of geochemical reactions involving CO2 and salt water or mineral structures, safety assessments and risk analyses and public acceptance issues. Current legislation regarding the disposal of material underground has not been designed for the permanent and safe underground storage of CO2. There is evidently a need for policy development in this area to take account of the over-arching environmental benefits of under-ground storage as an alternative to emissions to the atmosphere and subsequent impacts relating to Climate Change. From a European perspective, it would be most attractive to take advantage of early EOR opportunities in the oil fields of the North Sea for the first CO2 storage applications. CO2 would then be assigned a commercial value, which to some extent would compensate for the higher costs of transporting CO2 off-shore. This will probably also be the easiest way to build confidence and attain public acceptance for underground CO2 storage. However, timing is critical and there needs to be a willingness on all sides if this is to be realized. When/if more CO2 is produced than can be utilised for EOR, storage in deep aquifers on-shore, much closer to power plants, will be a less

110
costly option, although public acceptance may then become more difficult to manage. The overall costs for CO2 capture, transportation and storage are dominated by the capture costs. For coal the capture costs are in the range of 15 – 40
/tonne CO2. Assuming costs for transport and storage from 5 – 20 �/tonne the overall costs are in the range of 20 – 60 /tonne CO2. From the statements on the development of the different techniques made above it becomes clear that CO2 capture from power plants and CO2 storage will not be state-of the art already tomorrow. This will still take a lot of time, maybe 10 to 15 years, if an estimation will be allowable at all.
¡
¡

CO2 Capture and StorageVGB Report on the State of the Art
Klinkestraße 27 – 31 • D-45136 Essen
Internet: www.vgb.org
E-mail: [email protected]
Power
Tech
CO2
Capt
ure
and
Stor
age
PowerTechPowerTech
Source: Scientific American
Reference Power Plant North Rhine-Westfalia


